Abstract
Thermography is being increasingly used in building inspection due to its capability to determine various defects, as this enables the development of improvement strategies for efficient energy consumption. In this paper, AI algorithms are combined, and new segmentation strategies are proposed to improve the accuracy of building insulation assessments. Paired visual and IR pictures taken from the same angle are used complementarily to feed different sequential neural networks employed to extract the characteristic segments of buildings. The optical images contain the information required to identify and separate objects, such as windows, doors, and walls. The IR pictures contain the information required for the insulation assessment. This enables an automated analysis of a large number of objects within the same assessment with respect to the proper viewing angle and resolution. Variations in measured temperatures for segmented regions are estimated by referring to their representations in the IR frames, which allows for general conclusions concerning insulation state to be drawn, and by using a trained neural network, heat losses are localized in the frames. The output levels of consecutive IR frames are compared to determine the effects on IR object representation due to different recording aspects.
1. Introduction
Increased development in the infrared technology field and the availability of quality equipment have facilitated the wide application of infrared inspections for detecting anomalies in mechanical and electrical systems, medical diagnostics, robotics, the construction sector, and many other areas. Thermography is a suitable technique for auditing energy conditions in building sectors in order to improve construction resistance and indoor quality. Early-stage defects in building insulation that are not visible and that are difficult to localize, such as heat losses, air leakage, and moisture, can be detected via infrared (IR) inspections. Based on the interpretation of IR pictures, consecutive measures, such as additional insulation or element replacement, can be taken to reduce energy consumption or to apply predictive control [1]. Novel development is directed towards the deployment of Phase Change Material (PCM) in building structures for controlling inside temperature variations, as the construction sector is one of the largest energy consumers [2].
In this research, a small unmanned vehicle system (sUVS) was used for an IR arial survey. This approach is effective when many buildings are analyzed. The advantage of this approach is the efficient collection of relevant data and the ability to provide recordings in places that are hard to reach. The aerial inspection was performed by utilizing a DJI Mavic 2 Enterprise Dual sUVS equipped with a visual camera and a FLIR longwave infrared camera with a spectral band from 8 to 14 μm.
IR pictures are colored based on the thermal radiation measured by sensitive sensors on IR devices and the selected temperature scale range. During the heating period, the inner wall side and the inner volume of a structure have a higher temperature, and the outer wall side and the surrounding area have a lower temperature. According to the law of thermodynamics, heat flows from areas with higher temperatures to areas with lower temperatures, and via connections between two different elements, there is energy flow until the temperature is equal. Heat flow is mostly transmitted through a structure’s wall by convection or conduction. This process depends on the material and thickness of the insulation, which acts as a resister against heat transfer. If the object is not isolated, there is a lower thermal resistance and an increased heat flow through the building. Due to temperature variations in materials during heat transfer, object surfaces are affected, and there are changes in materials that produce infrared radiation. All objects with a temperature higher than 0 K emit radiation energy.
A variety of recently developed methods employ IR technology techniques to inspect energy performance. In [3], the authors used thermal images and ANN to predict heat losses and to estimate energy conservation. Their concept was based on actual ambient temperatures and on calculating predictions for energy savings. In [4], a UAV and a thermal infrared camera were used to capture thermal conditions, and the authors applied a Laplacian of Gaussian detector to identify high-temperature regions and to deploy the air capturing of heating networks. The authors of [5] examined heat losses through windows using automatic ROI segmentation and the classification of elements into two categories, namely, those with uniform emissivity and those with different emissivities, and ROIs were considered anomalies if their temperatures were higher than outside temperatures. Calibration techniques that are outlined in standards for measurements were applied in [6], and in [7], an evaluation was carried out by considering the average building temperature compared to the ambient and minimal temperatures. The authors in [8] carried out mechanical system inspections using equipment called Mantra, which contains specific hardware and software components for examining industrial parts. In [9], the authors used their own equipment on a vehicle to collect building images, and they implemented supervised learning for classification using available data concerning object type and heating systems, etc. However, this method requires a thorough annotation of the discovered defects in a large number of images. In [10], the Bayesian method for identifying non-homogeneities in a medium was used with the objective to detect transient temperature differences. A non-destructive method was presented in [11] to evaluate building states and different approaches for IR inspections, with a review of different IR applications and the conditions required for measurements. In [12], the authors used field thermography to perform continuous condition measurements and a quantitative analysis of thermal bridges, and in [13], plaster plate insulation was explored by estimating heat losses and by calculating flux density on wall surfaces with determined emissivity values. In [14], data fusion was used in order to map temperature measurements to 3D models by employing light detection and a LIDAR system.
AI is a field that has developed remarkably in recent years, with AI being widely used for image processing and object detection and recognition. Deep neural networks can characterize images and localize specific forms, colors, and individual objects. These high-performance techniques can be applied to improve thermal image analyses by identifying objects since, in IR images, different elements commonly appear without strict borders and contrast variations. This research focuses on the application of neural networks for the automated detection of insulation defects within pictures by selecting building regions. Object detection and image segmentation allow for the recognition of objects that can be used to enable the automatic estimation of thermal building behavior. The proposed method can be applied in real time, combined with effective data collection that provides IR images of whole large objects and the possibility to inspect many different buildings at the same time and compare their thermal states. The aim of this research is to provide a faster IR assessment of many different objects using AI by gathering data from proper perspectives during a single survey to enable comparisons and initial object categorization. This should enable the development of renovation strategies for a large number of structures in one area if noticeable energy efficiency deficiencies are detected.
2. Materials and Methods
The measured energy on an IR device is the sum of the energy emitted by a particular object, the energy of the objects in the surrounding area, the energy reflected by the object, and the energy from the atmosphere, as shown in Equation (1). The radiated energy of the object is directly proportional to the emission ε and to the fourth power of the object temperature, according to the Stefan–Boltzmann Law. The energy that originates from the neighboring objects is the function of their temperature and the transmittance of the measuring object. The reflective energy depends on the reflected temperature and the reflectance of the observed object. The energy from the atmosphere depends on the atmosphere transmittance, which also causes a certain loss of radiation due to transmission, and the atmosphere temperature.
It can typically be assumed that the object transmissivity can be neglected and, thus, that the measured radiation corresponds to the sum of the radiation energy of the object and the reflection. As the measuring device is positioned at a relatively short distance from the object, it can be expected that the energy losses in the transmission path, due to the transmission from the observed object to the measuring device, and the influence of the atmosphere are small.
According to the law of the conservation of energy, there is a connection between the physical parameters of radiation, where the sum of the emittance, transmittance, and reflection equals one. During the survey, different objects constructed with different materials are inspected; however, as they are mainly made of brick and concrete, it is assumed that the emission of the whole spectrum is approximately 0.94, a value near to 1, and, thus, for the reflection and transmission, it is assumed that they have a negligible effect. For materials with high emissivity, variations show only minor changes in measurements [15]. This survey assumes dynamic positional changes for the measuring device when acquiring the surface temperatures of objects, and during the IR survey, it is not possible to measure the particular influence of reflection; therefore, it is assumed that the influence of the surrounding objects can be ignored. As the assessment is conducted under cloudy conditions, the influences of the absorbed solar energy and reflectance are considered moot [16].
IR imagery allows for the discovery of processes that occur on object surfaces that are otherwise not visible in a way where they can commonly be identified by detecting the contrast between affected elements. Unusual color representations might indicate unpredicted or unwanted thermal processes. Depending on the visual output of the process and the color scales chosen, various anomalies can be localized. The color scale choice might result in the expression of certain defects in more detail and in a more visible way. A so-called rainbow palette could be suitable for discovering moisture and condensation in structures. Different iron palettes are practical for discovering warmth bridges, air leakages, and heat losses. Commonly, detections include intensive color contrasts between windows and walls, with windows appearing in IR images in light colors in cold weather, which indicates heat losses and possible insulation deficiencies. By extracting windows and doors from IR frames, their characteristic color distributions can be compared with the colorized façades in order to determine the grade of temperature variations based on computer vision algorithms. The methodology is presented in Figure 1.
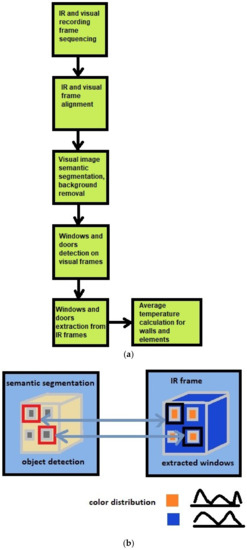
Figure 1.
(a) Algorithm principle for parallel optical and IR frame processing; (b) schema.
The assessment data on the energy efficiency of multiple objects were collected in February 2022. The equipment attributes are displayed in Table 1. As recommended for the IR survey, the temperature difference between the inside and the outside was at least 10 °C, with a low wind intensity. The obtained IR images of the examined objects contain valuable information about the envelope state and the characteristic temperatures of specific parts that can be examined to discover potential insulation deficiencies. The frames were initially processed with proprietary camera software in order to carry out color-to-temperature mapping according to the color scale. The inspected objects were mainly built with brick and concrete, which have high emissivity values.

Table 1.
IR device specification.
Deep neural networks that are trained for object detection allow for the classifying and localizing of objects by providing their coordinates in the image and their class label. Parallel visual and infrared recordings were synchronously sequenced into frames, and by pairing those frames, they were simultaneously processed with the aim to detect windows and doors, represented by specific colors according to their thermal characteristics, in the IR frames. The object detector RetinaNet was deployed for detecting the windows and doors. Its high performance is based on the ResNet backbone network, which extracts features, and the Feature Pyramid Network, which processes feature maps from different backbone layers. It contains a module that calculates class probabilities to perform classification and regression modules that generate bounding boxes [17]. Two datasets were used for the neural network training, Street Scene Window Detection, which contains images with annotated windows and is shown in [18], and the dataset that was annotated for window and door recognition obtained from the survey in [19]. Figure 2 and Figure 3 display the neural network training parameters for the two datasets. The used RetinaNet model is based on the resnet50 backbone network pretrained with the Coco dataset. The object detection model was obtained using pretrained implementation in Keras, with available imagenet weights in 50 Epochs for the SSWD dataset and in 20 Epochs for the custom dataset. The datasets include images, annotations of determined object classes, and image sets with noted images that are used for training and testing. The model was trained using GPU. ResNet or Residual Network employs residual connections and blocks. Inside the residual blocks’ convolution operations, batch-normalization and ReLU activations are performed, and the output of the residual block and the input are added as one residual connection [20]. By applying the trained model bounding boxes of objects, coordinates were obtained, and with the new algorithm, they were mapped to the object coordinates in the thermal images.
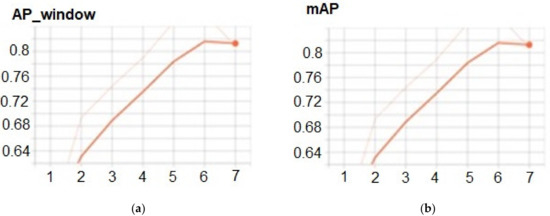
Figure 2.
Training parameters for SSWD dataset: (a) average precision for window detection; (b) mean average precision.
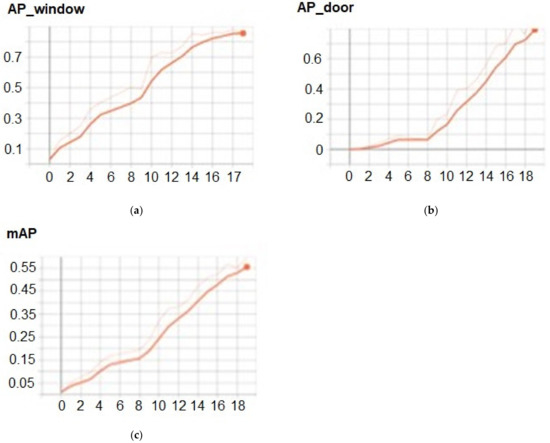
Figure 3.
Training parameters for custom dataset: (a) average precision for window detection; (b) average precision for door detection; (c) mean average precision.
In order to obtain accurate predictions for parallel visual and IR frame processing, it is required that they are aligned by reducing the size of the visual frames, as they have a higher resolution than IR frames. In [21], homograph matrix calculations for mapping objects on parallel images was proposed. Both datasets were applied to sets of frames, and the F1 score, precision, and recall were calculated. The model trained on the custom dataset provided excellent accuracy, and it was selected for window and door detection.
A deep neural network for semantic segmentation was applied to ensure the removal of the background so that the temperature estimations would focus on the object without impact from the surrounding area. When a frame is segmented, the background and other objects are classified in specific colors. In this way, the region in the frame that corresponds to the background can be determined, and by using parallel infrared frames, the examined object can be segregated by applying the mask that represents the background area. The visual and IR frames were processed using semantic segmentation by deploying the deeplabv3 model, which was trained on the Ade2K dataset. The deeplabv3 model is based on atrous convolution, which enables feature maps that rely on the insertion of breaks between filter weights to be extracted and allows for different resolutions of extracted features to be obtained. Image features are extracted and processed at different scales. An additional module enables the detection of pixel value similarities. Atrous Spatial Pyramid Pooling performs classification for each pixel, and at the output, the image is segmented in its original size. The Ade20k dataset contains scenes with annotated segments in images with 150 different categories, e.g., sky, road, building, car, and grass. Semantic segmentation was applied using an already trained model on the set of images in order to differentiate the observed object during the further frame processing [22].
The most common regions of an object with significant heat flow are windows and doors. For IR images with segregated windows and doors and for the façade without these parts, characteristic color distribution was computed using an algorithm developed to calculate pixels of specific colors for these regions. For each segmented image, the color distribution contained groups of different pixel values, and this can be expressed as follows:
where S is the segment in the observed frame, k is the number of pixel groups, and is the number of pixels of a specific pixel value . The colors that have the largest distributions in segmented images primarily determine surface temperatures. For color-to-temperature mapping for comparison purposes, the Euclidean distance to the scale colors was used:
where (, , ) is the color of the pixel with coordinates x and y, and (, , ) refers to the color from the palette with the corresponding temperature .
In order to localize thermal bridges that represent regions with intensive heat losses, the sliding window technique was deployed using a Convolutional Neural Network (CNN) that was trained to recognize brighter shades in IR frames. The input image is observed as an array of pixels, and each frame is divided into 28 × 28 resolution windows. As the background pixels on frames are colored black using the semantic segmentation, the developed algorithm that augments probable heat losses skips those regions. This methodology employs supervised learning, where incoming data for the model are small segments, and the output should categorize neighboring segments as potential heat losses.
3. Results
Figure 4 presents the results that were obtained by processing the visual frame using the trained RetinaNet object detector for window detection and by performing image segmentation for window and door extraction from IR frames.
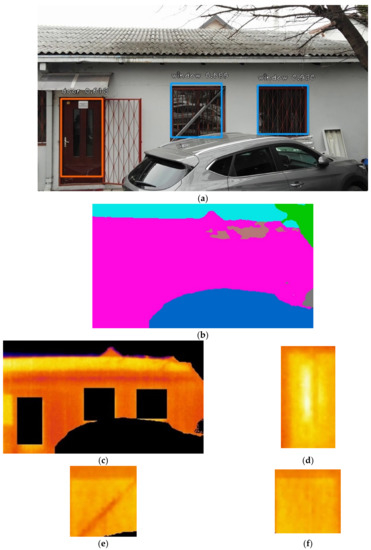
Figure 4.
Frame processing: (a) successfully detected windows and door on visual frame; (b) segmented visual image; (c) IR frame with segregated windows and door; (d–f) extracted door and window.
Table 2 lists the colors that mainly characterized the thermal attributes in the IR-segmented regions and the calculated pixels per color.
Table 2.
Color distribution of façade and windows in IR frame.
For the windows, the estimated middle temperature value is 18 °C, and for the façade, the estimated middle temperature value is 17 °C. There is only 1 degree difference, and it can be concluded that there is significant heat flow through both the façade and the windows. If it is assumed that the solar radiation effects and reflections were avoided, it can be surmised that the insulation is insufficient.
Figure 5 represents another inspected object. This frame was acquired from an angle that was optimally chosen and nearly perpendicular to the surface.
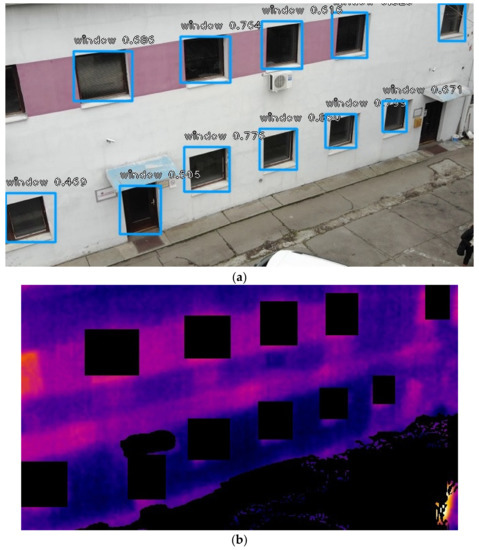
Figure 5.
(a) Successfully detected windows on the construction; (b) IR image with windows and background removed; (c–e) extracted window samples.
Table 3 presents the most characteristic colors of this frame that can be used for heat transfer comparisons.
Table 3.
Color distribution of segmented elements.
By calculating the temperatures, it is revealed that there are temperature variations of about 2 °C, and, as this frame indicates that there are colder temperatures on the façade, it can be concluded that there is no intensive heat flow on the façade, even though there are visible temperature discrepancies on the wall, which indicate possible thermal bridges. It can be assumed that heat losses through the windows are not high.
Figure 6 displays another large object with the background removed and windows detected. One person is present in the frame. However, this does not affect the examination, as the color with the highest percentage in the frame is referenced for the heat transfer comparison.
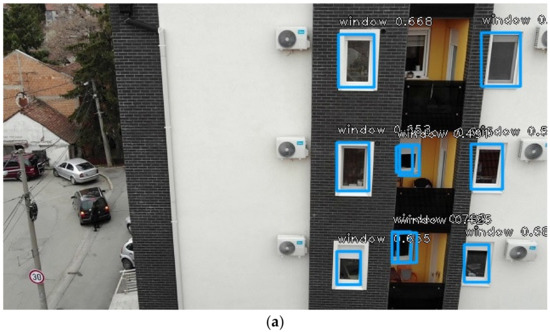
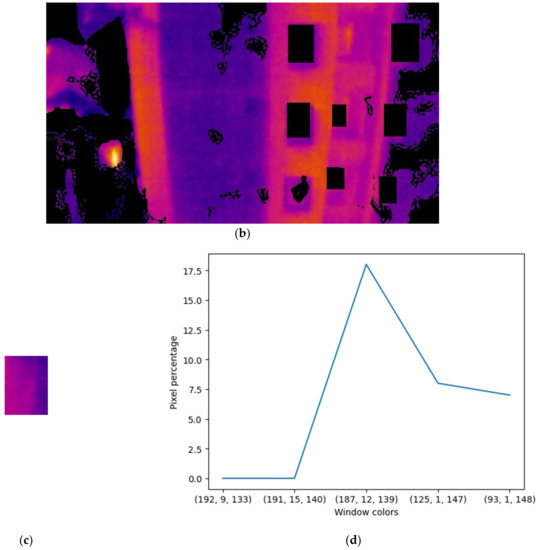
Figure 6.
(a) Optical image with detected windows; (b) extracted windows and partly removed background; (c) segregated window; (d) window color distribution.
The regions of the object are displayed in different colors, as they were built with different materials. The graph refers to the color distribution of the segmented window with RGB values and the corresponding pixel percentages for the colors. The color with the maximum pixel numbers is compared to the color that characterizes the whole façade in order to determine their similarity and, in this way, to detect potential heat losses. The obtained temperature variations are approximately 3 °C. The object representation in the IR frame indicates rather colder surfaces, and it can be assumed that there are no significant heat losses and that the object is properly isolated, confirming it as a newer structure.
For the selected palette, there are specific tones that indicate heat losses, and if the image is segmented into smaller parts by employing the CNN that was trained to recognize those regions, they can be located in IR pictures, similar to object detection. In this method, the image is divided into small segments, and these segments are processed by the trained CNN to detect potential heat losses and air leakage, as displayed in Figure 7.
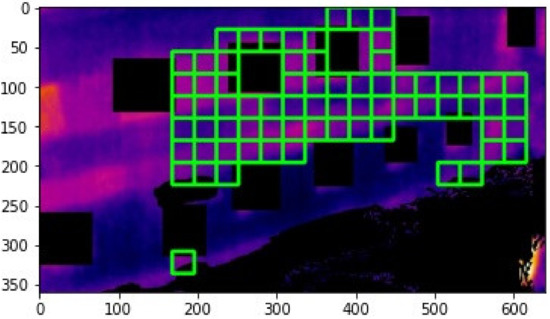
Figure 7.
Detected areas with possible insulation defects.
4. Discussion
The advantages of the proposed method are that recordings can be processed in real time with high-speed performance in detecting the insulation issues of different objects and that IR frames can be efficiently analyzed and compared.
IR images that are collected from unsuitable positions and from certain angles might display an inaccurate state due to complex factors, such as reflection, and surfaces might appear warmer or colder due to noise in the measurements. Some elements might only be partly visible, which would lead to inaccurate diagnostics and missing data, therefore restricting the appropriate classification of defects. However, carefully collected data from the survey provided this approach with a number of different suitable images that refer to the same object, which should contribute to the energy performance classification. The employment of high-performance and quality equipment positioned at a height above the object provides an IR presentation of objects with a clear contrast between different elements.
In order to compare the proposed methodology with other approaches that are based on AI, the following methods that employ image processing were tested on the collected frames: the Laplacian of Gaussian blob detection, Random Forest, K-Means, and region of interest (ROI) segmentation. The Laplacian of Gaussian method results in locating minima spots in the image that represent colder regions. This method was the slowest in comparison to the other methods, and it did not provide enough information for energy efficiency assessment. The K-Means is applied to infrared images in order to group pixels according to selected representative colors, which are called centroids. In this way, the explored IR image is segmented in a simplified way, and the contrast between different regions is emphasized. Thus, this method is also based on a visual description of the examined object, whereas the proposed method aims to provide computational results that should support the IR survey. This algorithm was however faster than the Laplacian of Gaussian method. The Random Forest and ROI segmentation algorithms showed better performances, but compared to them, the proposed method was the most efficient. Random Forest is based on simultaneously classifying input data based on predefined premises, and for this test on the images, it was implemented to classify specific colors. ROI segmentation was implemented in a similar way, with the aim to visually differentiate characteristic regions in images.
The proposed method allows for determined elements to be inspected and for different regions to be clearly distinguished, enabling individual examination and the localizing of areas with thermal bridges.
One of the challenges when inspecting different objects at the same time is the lack of ability to control the conditions in the surrounding area or the events taking place during the time of inspection, some examples of which are closed shutters, partially open windows, people in front of or behind doors or windows, or the presence of other objects partly blocking the view.
5. Future Work
Compared to other methods, in this investigation, data were acquired in real-time, and positional requirements, which include the recording angle and the distance from the object, were not completely predictable. As there are many other objects in residential surroundings, such as construction sites and electricity lines, the IR device must be navigated in a proper way during data collection so that no damage is caused. For this reason, the recordings were partly acquired from the perspective of certain angles corresponding to the surface.
Variations in the measured signals of the object surfaces due to different equipment angles during assessment were compared. By observing the subsequent frames of the same object in Figure 8, it is noticeable that the building is displayed in slightly different colors, suggesting that there are variations in measured surface temperatures. Future algorithms could improve detection by identifying frames with optimal building positions for the assessment and by identifying the frame that is taken perpendicular to the surface. As another effect of the recording angle, some windows were not perfectly segmented but instead had small façade parts on their borders, as the angle did not fit the objects’ positions in the frame. More advanced neural networks might improve segmentation to avoid errors in calculations for real-time implementation.
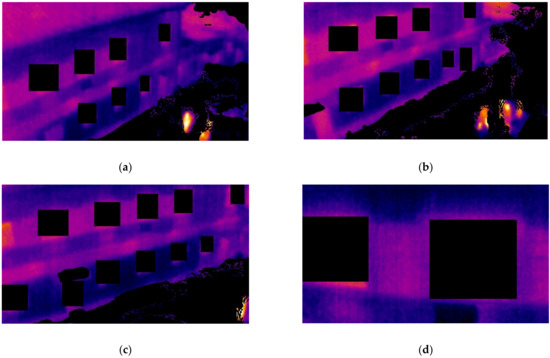
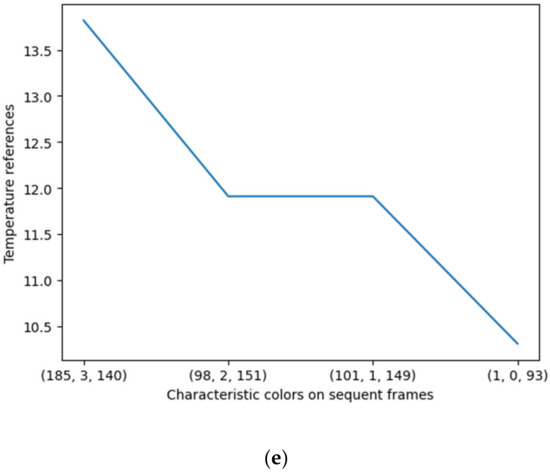
Figure 8.
(a–d) Subsequent IR frames; (e) characteristic color variations.
The advantage of neural networks for image processing could be applied in further studies to augment envelope properties and to classify materials, for instance, brick, concrete, metal, and wood, in order to modify calculations to include adapted emissivity, which might be particularly useful for older objects, where building documentation is unknown or cannot be accessed.
6. Conclusions
The proposed methodology enables efficient thermal diagnoses of different buildings in large residential areas. The equipment used provides quality imaging that can detect potential defects in thermal insulation by deploying neural networks for image processing and object detection. The focus of this research was the classification of the thermal characteristics of objects in IR recordings. The specific elements of buildings were differentiated using RetinaNet object detection. This method is based on representation comparisons of selected elements, such as doors, windows, and walls, for supporting energy efficiency assessments. In comparison to other methods that can detect the darkest and brightest regions in IR images, corresponding to the coldest and warmest building parts, respectively, this method allows for the inspection of regions of interest. As there are still uncertainties in measured IR radiation depending on environmental conditions, additional quantitative experiments should be carried out to obtain definitive conclusions concerning heat losses through structures. Due to the different thermal processes that might occur, it is difficult to provide an exact report concerning the insulation state of a building. Thermal processes, such as phase changes and mass transfer, which depend on temperature and pressure differences inside and outside, humidity, and structure properties, can cause problems, such as vapor condensation, air infiltration, and building degradation. In such cases, further detailed measurements are required [23,24]. This kind of inspection can be used to develop strategies for the renewal of older areas or for residential areas that require improved construction planning. The proposed method should enable outdoor inspections of the thermal processes of many objects, and the applied algorithms enable the detection of regions with intensive heat losses that might require detailed quantitative measurements and analyses. Further research could be oriented towards enhancing the analyses of roofs and other complex building elements.
Author Contributions
Conceptualization, M.T. and M.S.; methodology, I.W.; software, I.W.; validation, M.T. and M.S.; formal analysis, M.T.; investigation, M.S.; resources, I.W.; data curation, M.T. and M.S.; writing—original draft preparation, I.W.; writing—review and editing, M.T. and M.S.; visualization, I.W.; supervision, M.T. and M.S.; project administration, I.W.; funding acquisition, M.T. All authors have read and agreed to the published version of the manuscript.
Funding
This research was funded by the Science Fund of the Republic of Serbia, Grant #6524745, AI-DECIDE.
Data Availability Statement
Data are available in publicly accessible repositories “IR Survey”, 2022, https://github.com/milulitech/irsurvey (accessed on 28 October 2022), and “Window Detection in Street Scenes”, https://www.kaggle.com/datasets/rude009/window-detection-in-street-scenes (accessed on 27 April 2022).
Conflicts of Interest
The authors declare no conflict of interest. The funders had no role in the design of the study; in the collection, analyses, or interpretation of data; in the writing of the manuscript; or in the decision to publish the results.
References
- Tanasković, M.; Sturzenegger, D.; Smith, R.; Morari, M. Robust Adaptive Model Predictive Building Climate Control. IFAC 2017, 50, 1871–1876. [Google Scholar] [CrossRef]
- Shailendra, S.K.; Pushpendra, K.S.R. An experimental evaluation of thermal behavior of the building envelope using macroencapsulated PCM for energy savings. Renew. Energy 2020, 149, 1300–1313. [Google Scholar]
- Al-Habaibeh, A.; Sen, A.; Chilton, J. Evaluation tool for the thermal performance of retrofitted buildings using an integrated approach of deep learning artificial neural networks and infrared thermography. Energy Built Environ. 2021, 2, 345–365. [Google Scholar] [CrossRef]
- Sledz, A.; Unger, J.; Heipke, C. UAV-based thermal anomaly detection for distributed heating networks. ISPRS Int. Arch. Photogramm. Remote Sens. Spat. Inf. Sci. 2020, 43, 499–505. [Google Scholar] [CrossRef]
- Ollero, A.; Martinez-de Dios, J.R. Automatic Detection of Windows Thermal Heat Losses in Budlings Using UAVs. In Proceedings of the 2006 World Automation Congress, Budapest, Hungary, 24–26 July 2006. [Google Scholar]
- Barreira, E.; Almeida, R.M.S.F.; Simoes, M.L. Emissivity of Building Materials for Infrared Measurements. Sensors 2021, 21, 1961. [Google Scholar] [CrossRef] [PubMed]
- Preda, A.; Scurtu, I.C. Thermal image building inspection for heat loss diagnosis. J. Phys. Conf. Ser. 2019, 1297, 012004. [Google Scholar] [CrossRef]
- Ortega, M.; Ivorra, E.; Juan, A.; Venegas, P.; Martínez, J.; Alcañiz, M. MANTRA: An Effective System Based on Augmented Reality and Infrared Thermography for Industrial Maintenance. Appl. Sci. 2021, 11, 385. [Google Scholar] [CrossRef]
- Barahona, B.; Buck, R.; Okaya, O.; Schuetz, P. Detection of thermal anomalies on building façades using infrared thermography and supervised learning. J. Phys. Conf. Ser. 2021, 2042, 012013. [Google Scholar] [CrossRef]
- Fudym, O.; Orlande, H.R.B.; Bamford, M.; Batsale, J.C. Bayesian approach for thermal diffusivity mapping from infrared images with spatially random heat pulse heating. In Proceedings of the Journal of Physics: Conference Series, 6th International Conference on Inverse Problems in Engineering: Theory and Practice, Paris, France, 15–19 June 2008. [Google Scholar]
- Plesu, R.; Teodoriu, G.; Taranu, G. Infrared Thermography Applications for Building Investigation. Bull. Polytech. Inst. Jassy Constr. Archit. Sect. 2012, 58, 157–168. [Google Scholar]
- Bianchi, F.; Pisello, A.L.; Baldinelli, G.; Asdrubali, F. Infrared Thermography Assessment of Thermal Bridges in Building Envelope: Experimental Validation in a Test Room Setup. Sustainability 2014, 6, 7107–7120. [Google Scholar] [CrossRef]
- Candoré, J.C.; Bodnar, J.I.; Szeflinski, A.; Ibos, L.; Datcu, S.; Candau, Y.; Mattei, S.; Frichet, J.C. Helps with the thermal diagnosis of the building: Detection of defects of insulation by stimulated infra-red thermography. In Proceedings of the 9th International Conference on Quantitative InfraRed Thermography, Krakow, Poland, 2–5 July 2008. [Google Scholar]
- Wang, C.; Cho, Y.K. Non-Invasive 3D Thermal Modeling for Buildings. In Proceedings of the International Conference on Sustainable Design and Construction (ICSDC), Fort Worth, TX, USA, 7–9 November 2012. [Google Scholar]
- Usamentiaga, R.; Venegas, P.; Guerediaga, J.; Vega, L.; Molleda, J.; Bulnes, F.G. Infrared Thermography for Temperature Measurement and Non-Destructive Testing. Sensors 2014, 14, 12305–12348. [Google Scholar] [CrossRef] [PubMed]
- Duffie, J.A.; Beckman, W.A.; Blair, N. Solar Engineering of Thermal Processes, Photovoltaics and Wind, 5th ed.; John Wiley & Sons: Hoboken, NJ, USA, 2020. [Google Scholar]
- Walter, I. Modelled Neural Networks for Multiple Object Tracking. In Proceedings of the Sinteza, Belgrade, Serbia, 25 June 2021. [Google Scholar]
- Window Detection in Street Scenes. Available online: https://www.kaggle.com/datasets/rude009/window-detection-in-street-scenes (accessed on 27 April 2022).
- IR Survey. 2022. Available online: https://github.com/milulitech/irsurvey (accessed on 28 October 2022).
- Keras Retina Net. Available online: https://github.com/fizyr/keras-retinanet (accessed on 27 April 2022).
- Pavlović, M.S.; Milanović, P.D.; Stanković, M.S.; Perić, D.B.; Popadić, I.V.; Perić, M.V. Deep Learning Based SWIR Object Detection in Long-Range Surveillance Systems: An Automated Cross-Spectral Approach. Sensors 2022, 22, 2562. [Google Scholar] [CrossRef] [PubMed]
- Pixellib’s Official Documentation. Available online: https://pixellib.readthedocs.io (accessed on 1 May 2022).
- Poós, T.; Varju, E. Mass transfer coefficient for water evaporation by theoretical and empirical correlations. Int. J. Heat Mass Transf. 2020, 153, 119500. [Google Scholar] [CrossRef]
- Harbuck, S.; Harbuck, D. Residential Energy Auditing and Improvement; The Fairmont Press: Lilburn, GA, USA, 2014. [Google Scholar]


Disclaimer/Publisher’s Note: The statements, opinions and data contained in all publications are solely those of the individual author(s) and contributor(s) and not of MDPI and/or the editor(s). MDPI and/or the editor(s) disclaim responsibility for any injury to people or property resulting from any ideas, methods, instructions or products referred to in the content. |
© 2022 by the authors. Licensee MDPI, Basel, Switzerland. This article is an open access article distributed under the terms and conditions of the Creative Commons Attribution (CC BY) license (https://creativecommons.org/licenses/by/4.0/).