Article

Peak Stress Method-Based Fatigue Predictions for Steel Crane Girder Variable-Section Supports

1
Research Institute of Urbanization and Urban Safety, School of Civil and Resource Engineering, University of Science and Technology Beijing, Beijing 100083, China
2
Inspection and Certification Co., Ltd., MCC, Beijing 100088, China
3
Shenzhen Urban Public Safety and Technology Institute, Shenzhen 518000, China
*
Author to whom correspondence should be addressed.
Buildings 2023, 13(1), 108; https://doi.org/10.3390/buildings13010108
Submission received: 30 November 2022 / Revised: 26 December 2022 / Accepted: 28 December 2022 / Published: 31 December 2022
(This article belongs to the Special Issue Advances in Steel Structures: Testing, Modelling and Design)

Abstract

:
Engineering applications have shown that variable-section supports of steel crane girders are prone to fatigue fracture, and traditional fatigue prediction experience is not applicable to these types of supports due to the complex internal stresses caused by their unique geometries. In this paper, a new fatigue prediction approach was proposed for variable-section supports of steel crane girders based on the peak stress method; this approach can locate the fatigue initiation sites and predict the fatigue lives of variable-section supports under axial and bending loading. Then, some constant-amplitude fatigue test results were presented for typical variable-section supports of steel crane girders. A comparison was made between the experimental results and theoretical estimations using the peak stress method. The results indicated that the peak stress method is appropriate to estimate fatigue life up to crack initiation in variable-section supports of steel crane girders subjected to axial and bending loads.

1. Introduction

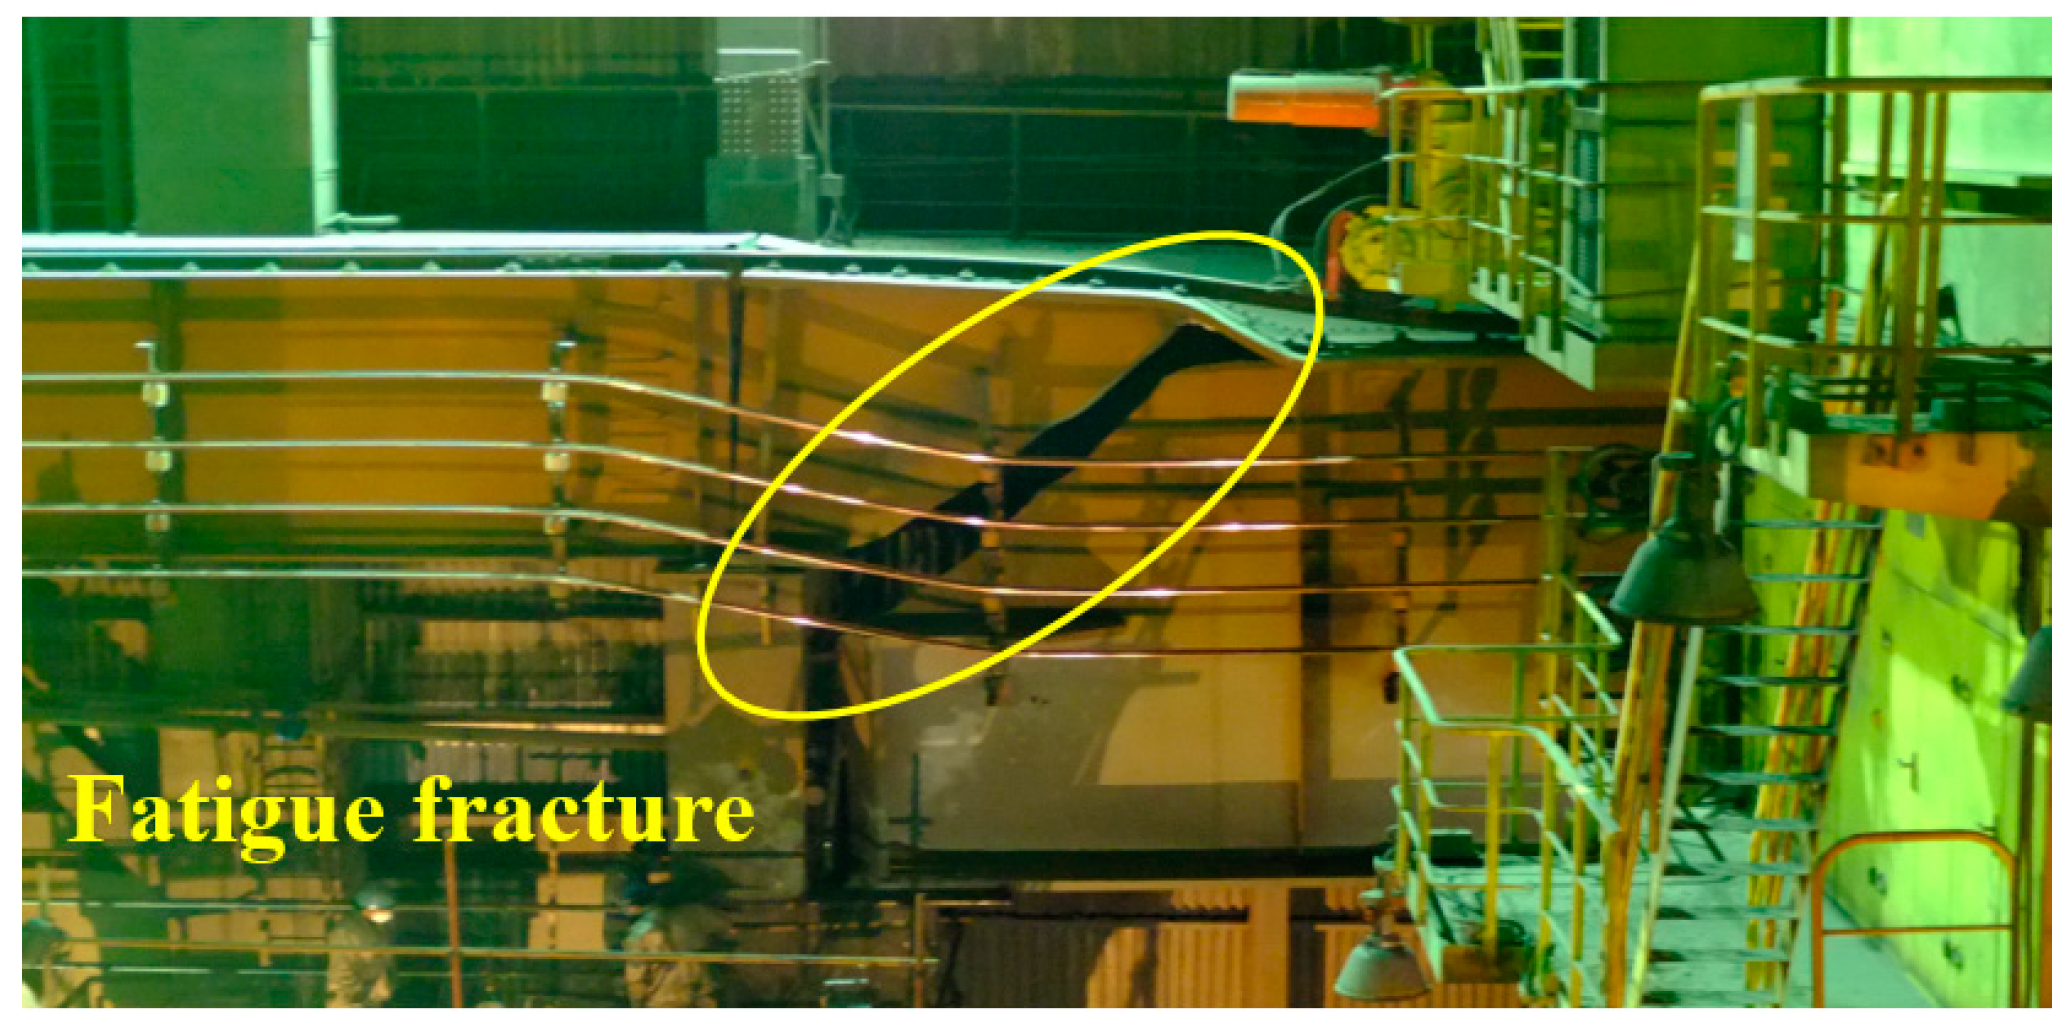
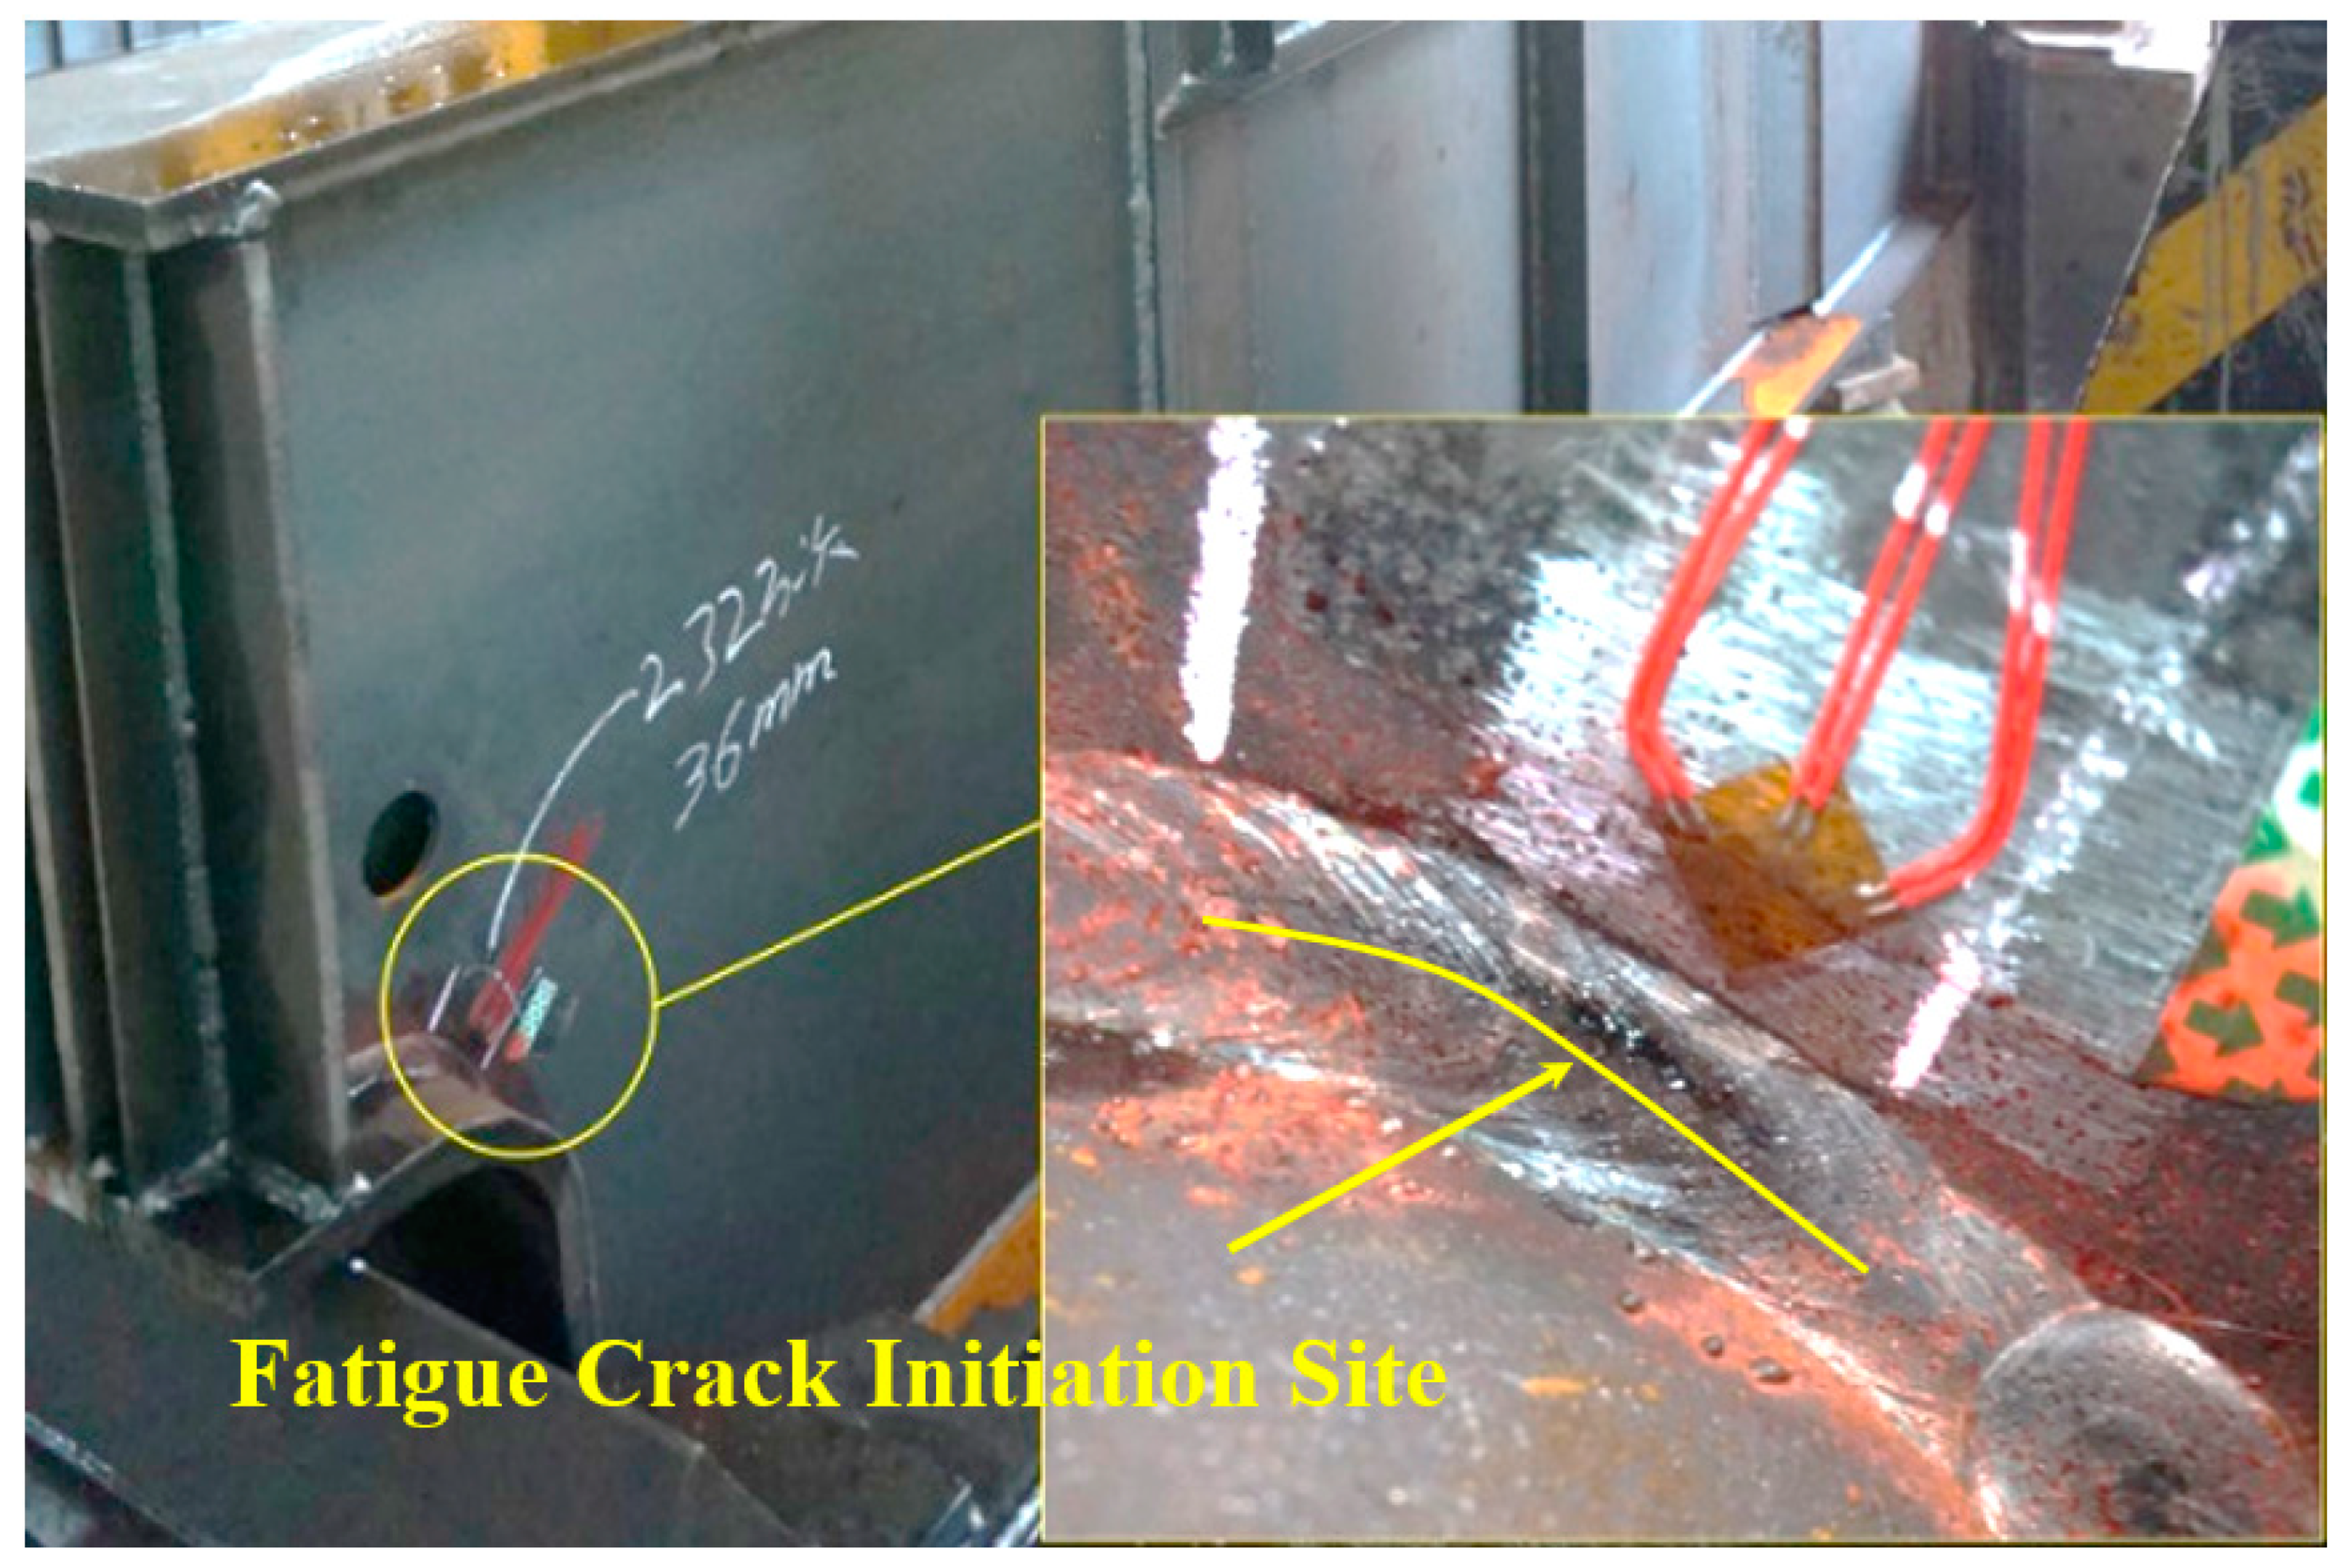
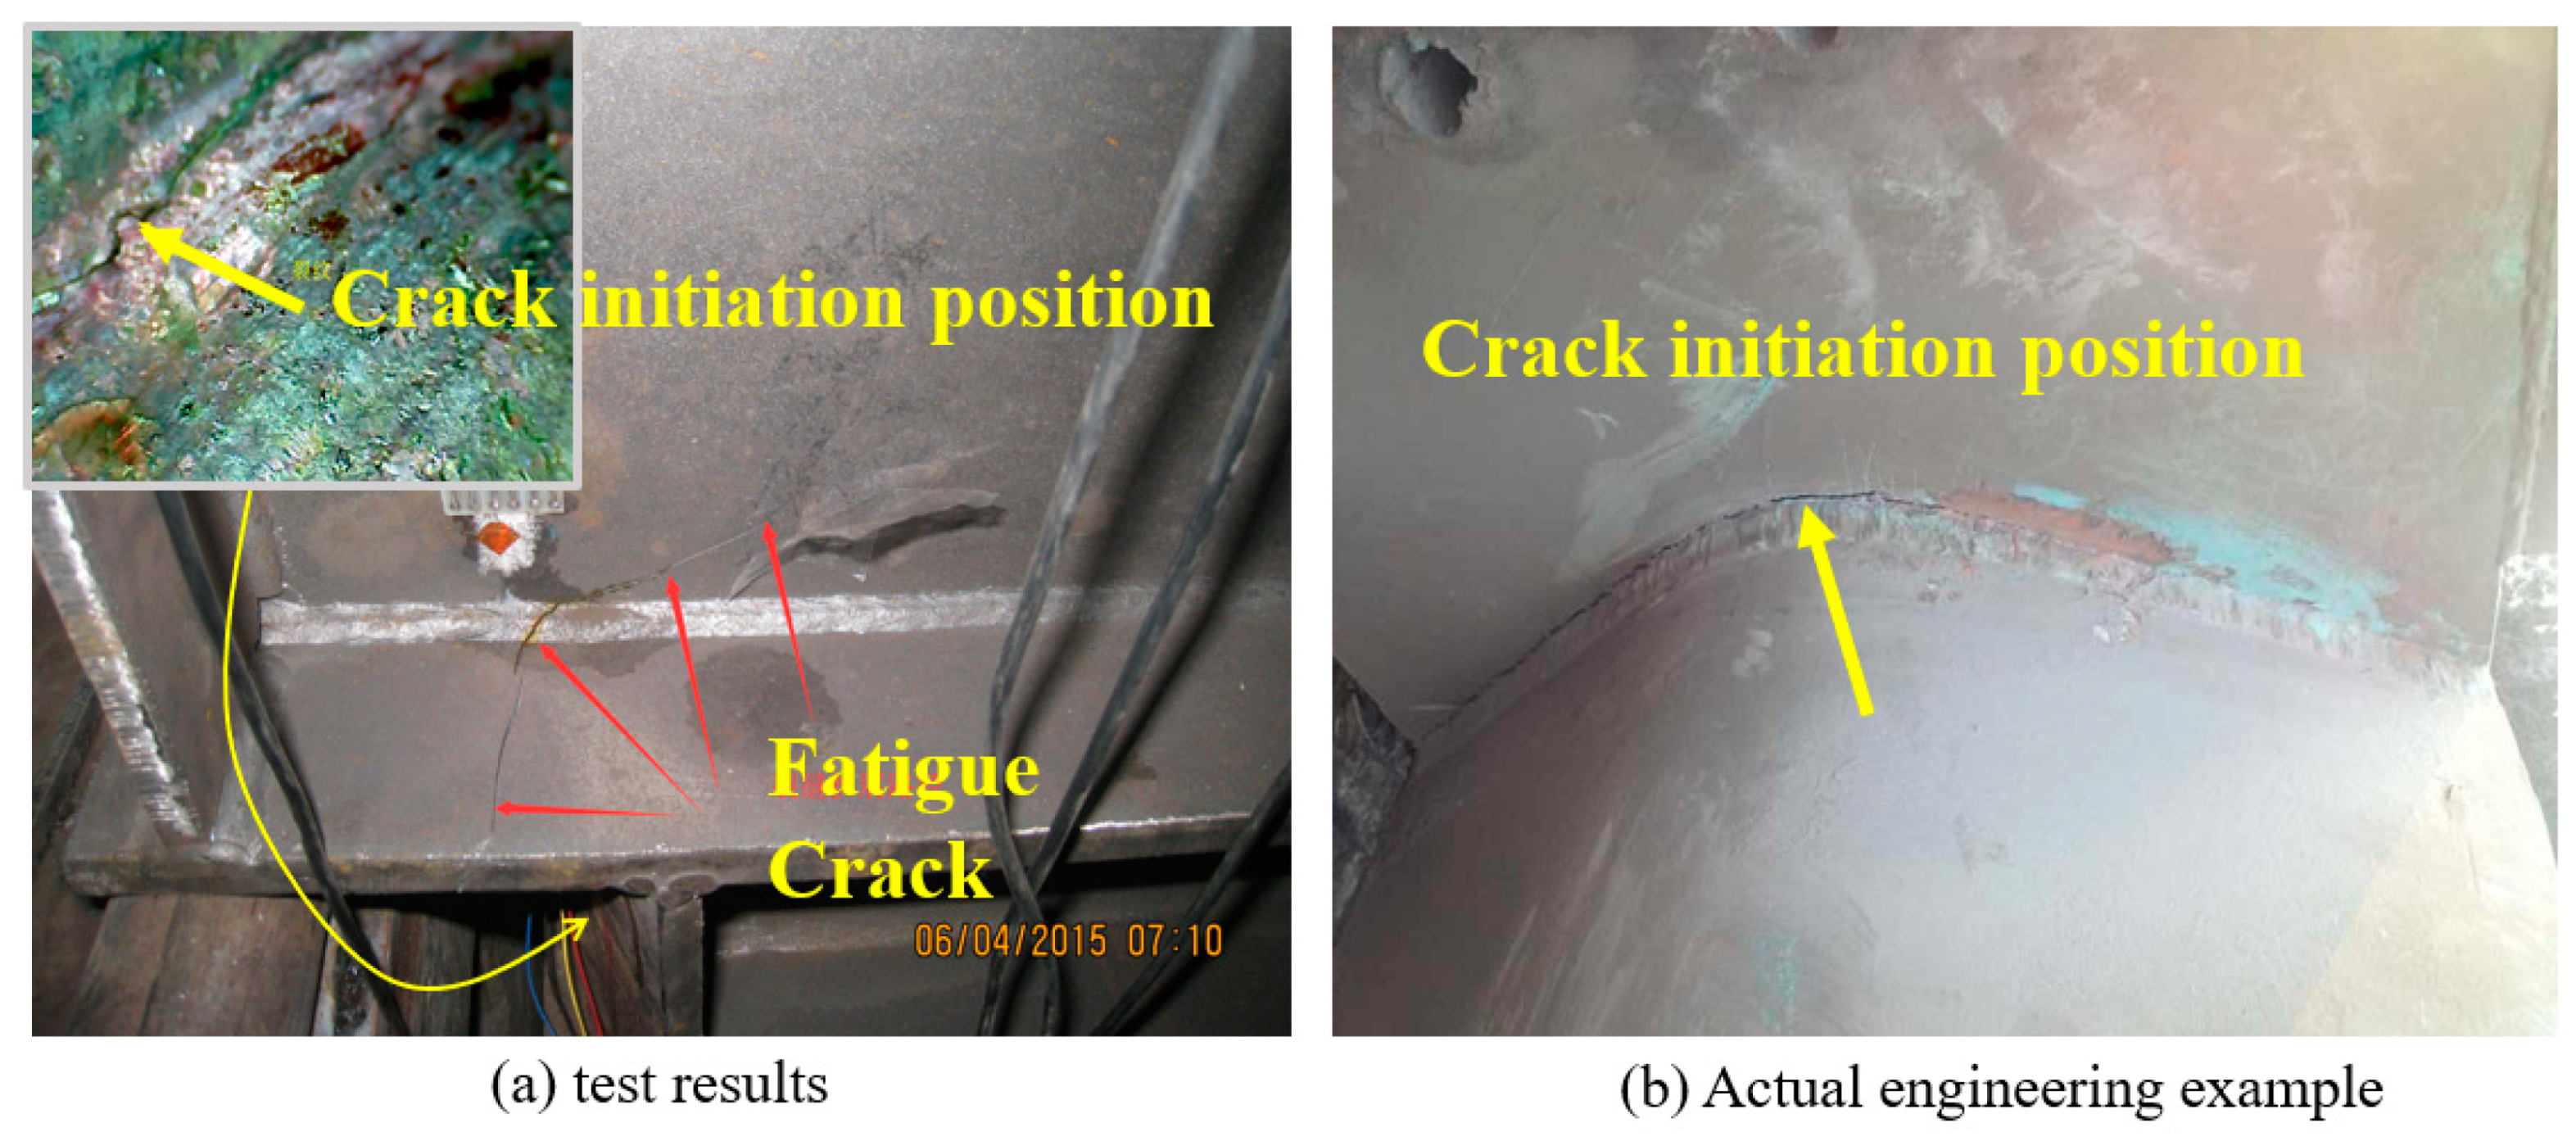
To reduce steel consumption, a large number of crane girders have variable-section supports. However, engineering applications have shown that the variable-section supports of steel crane girders are prone to fatigue fracture, especially when the girders are subjected to highly frequent crane loads. As service life increases, an increasing number of fatigue cracks form in the variable-section supports of steel crane girders. In China, such fatigue problems in variable-section supports are a major potential risk for safe operations. On 13 January 2014, a variable-section support of a steel crane girder in a metallurgical plant suddenly exhibited fatigue fracture, which caused the crane to drop the ladle, resulting in significant economic losses (Figure 1). The reasons this accident and similar phenomena occur are the lack of the appropriate S-N curves for the variable-section support and the fact that the frequency of use is much higher than the original design benchmark due to the large increase in production. The average service life of steel crane girders with variable-section supports is less than 20 years in metallurgical plants with heavy cranes. For long-term maintenance work in industrial buildings, Baosteel found that the establishment of a safety monitoring system that regularly checks whether cracks have formed in the variable-section supports could effectively avoid catastrophic accidents. Therefore, accurately predicting the fatigue crack initiation site and time to provide a scientific basis for a general monitoring system is an urgent engineering problem.
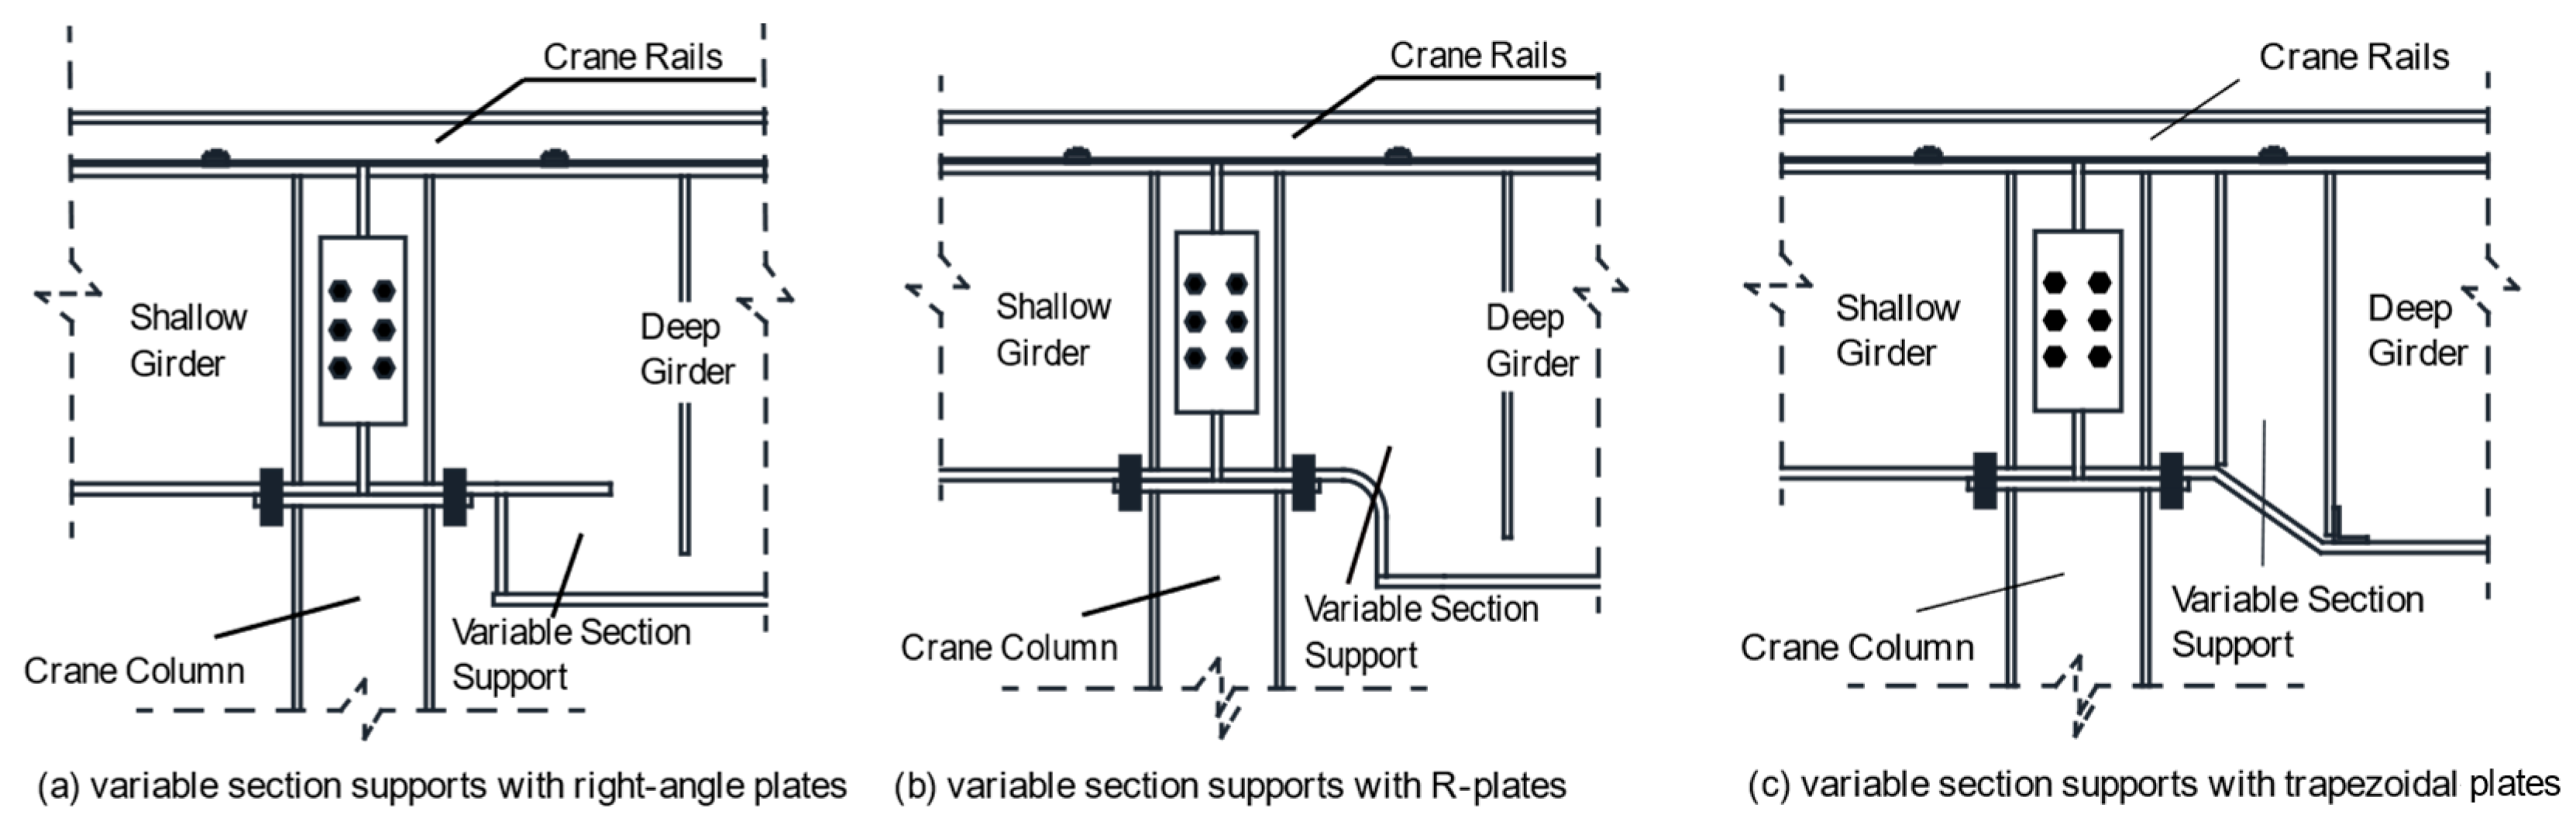
Variable-section supports can be divided into three categories according to the geometry of the support: variable-section supports with right-angle plates, variable-section supports with R-plates and variable-section supports with trapezoidal plates [1], as shown in Figure 2. A number of fatigue tests were performed on variable-section supports by the authors of this article, through which the fatigue crack initiation sites of variable-section supports with right-angle plates and R-plates were determined [2,3,4]. The fatigue lives of variable-section supports with trapezoidal plates for metallurgical plant operations were evaluated, and the fatigue life control point of this kind of variable-section support was defined by Caglayan [5]. To enhance the fatigue strength of the variable-section support, a variety of variable-section supports were designed by modifying the geometry of the variable-section support, such as variable-section supports with R-plates and three-web plates [6] and variable-section supports with right-angle curved end plates [2]. These geometric modifications change the structural detail classification and make the existing S-N curves not applicable. However, the traditional fatigue strength design methods recommended in current design codes [7,8,9], such as the nominal stress method and the hot-spot stress method, are based on existing S-N curves of corresponding structural detail classification and are not capable of effectively predicting the fatigue crack initiation site. Obviously, traditional fatigue prediction experience is not applicable. Therefore, scientifically evaluating the fatigue strength of variable-section supports and avoiding expensive fatigue tests for each kind of variable-section support is a major problem.
The peak stress method was initially established to calculate the notch stress intensity factor [10]. Meneghetti first noted that peak stress worked better than nominal and hot-spot stress for fatigue assessment of welded pipe joints under Mode I loading conditions [11]. Radaj established correlations between peak stress and the energy density of local mean strain and proposed a method for calculating the equivalent peak stress using two-dimensional planar elements [12]. To facilitate practical application, Meneghetti proposed a method for calculating the equivalent peak stress with a 3-D entity [13] and a new scatter band based on the range of the equivalent peak stress for the multiaxial fatigue design of welded joints made of structural steels [10,14], which were validated against experimental data taken from the available literature. However, these experimental data do not include any fatigue test results of steel crane girders. Therefore, additional study is needed to determine whether the peak stress method is suitable for the fatigue assessment of steel crane girders.
To verify that the peak stress method is suitable for the fatigue assessment of variable-section supports of steel crane girders, the conventional approach to the fatigue analysis and the peak stress method are briefly described. Then, fatigue tests were performed with four kinds of typical variable-section supports of steel crane girders, and the peak stress analysis was carried out to predict the location of the fatigue crack initiation site in these variable-section supports. Finally, the fatigue test results were compared with the calculation results based on the peak stress method to verify the applicability of the peak stress method in predicting the fatigue crack initiation site and time for variable-section supports.

2. Conventional Approach to Fatigue Analysis

Traditionally, the fatigue design of steel crane girders follows the recommendations of the Chinese standard GB50017-2017 [15], the American standard AISC 360-10 [16], and Eurocode 3 [8]. These three standards all recommend the nominal stress approach for the fatigue design of steel crane girders. Only Eurocode 3 included the hot-spot stress method as an alternative. Below is a brief summary of the relevant fatigue strength verification procedures.

2.1. GB50017-2017 [15]

The fatigue strength verification procedure in GB50017-2017 is mainly based on nominal stress values. During the service life of a structure, when the maximum stress amplitude is below the cut off limit or the equivalent stress amplitude is below the reference value for the fatigue strength at 2 million cycles, the fatigue strength of the structure meets the requirements. When the thickness of the connecting plate is greater than 25 mm, the allowable stress amplitude should be reduced. The reduction coefficient is calculated with the following formula:
γ t = ( 25 t ) 0.25
where γ t is the reduction coefficient, and t is the thickness of the connecting plate.
The equivalent stress amplitude of a variable amplitude normal stress is calculated with the following formula:
σ e = [ n i ( σ i ) β z + ( [ σ ] 5 × 10 6 ) 2 n j ( σ j ) β z + 2 2 × 10 6 ] 1 / β z
where ∆σe is the equivalent stress amplitude of the variable amplitude normal stress; [ σ ] 5 × 10 6 is the fatigue strength at 5 million cycles; n i and σ i are the frequency and the stress amplitude greater than [ σ ] 5 × 10 6 in the stress spectrum, respectively; n j and σ j are the frequency and the stress amplitude greater than the cut off limit and lower than [ σ ] 5 × 10 6 in the stress spectrum, respectively; and β z is the slope of the S-N curve, which corresponds to typical detail categories.
For steel crane girders, the fatigue strength verification could be performed according to the following criteria:
α f σ γ t [ σ ] 2 × 10 6
α f τ γ t [ τ ] 2 × 10 6
where [ σ ] 2 × 10 6 and [ τ ] 2 × 10 6 are the allowable normal stress and allowable shear stress at 2 million cycles, respectively; σ and τ are the maximum normal stress amplitude and maximum shear stress amplitude in the stress spectrum, respectively; and α f is the equivalent coefficient of the underload effect, which is dependent on the type of crane.
It is worth noting that the nominal stress method recommended in GB50017-2017 for fatigue strength verification is dependent on existing S-N curves, which correspond to typical detail categories; moreover, this method does not have the ability to predict the fatigue crack initiation site. There are no appropriate detail categories corresponding to variable-section supports in GB50017-2017.

2.2. AISC 360-10 [16]

The fatigue strength verification procedure in AISC 360-10 is similar to that in GB50017-2017. The major differences between these procedures are that the method in AISC 360-10 provides possible fatigue crack initiation sites and presents S-N curves corresponding to typical detail categories. However, there are no appropriate detail categories corresponding to variable-section supports in AISC 360-10.

2.3. Eurocode 3 [8]

The fatigue strength verification procedure in Eurocode 3 is similar to that recommended in GB50017-2017. However, the size effect caused by thickness or other dimensional effects must be taken into account in Eurocode 3, using a stress concentration factor to modify nominal stress. In the case of structural joints with intricate geometry, Eurocode 3 recommends using the hot-spot approach to overcome the challenges associated with defining nominal stresses. Unfortunately, the instructions regarding the proper application of this method lack sufficient detail.
Research results have shown that the stress concentrations in variable-section supports are relatively substantial. The stress in a variable section is complex due to the corresponding geometry, which makes it impossible to provide a stress concentration factor to modify nominal stress and prevents the application of the hot-spot approach.
The brief description of these three conventional approaches shows that these fatigue strength verification processes rely on the nominal stress approach, which does not provide a way for designers to cope with local stresses. Moreover, the nominal stress method can neither predict the fatigue crack initial site nor be applied to the fatigue assessment of variable-section supports, which are not limited by connection types.

3. Peak Stress Method

Numerous studies have demonstrated that fatigue cracks in welded structures result from weld toes or weld roots. Due to stress singularities in the weld toe and weld root, it is difficult to determine the true stress in the weld toe and weld root through calculations. Therefore, the nominal stress method, the hot-spot stress method, the notch stress method, the notch stress intensity factor method, and the strain energy density method were proposed to characterize the stress states in weld toes and roots. It is well known in the literature that, among the available methods, the strain energy density method provides the highest level of accuracy. However, the strain energy density method is also the most complex method in terms of the calculation process. Based on a large number of fatigue test data from welded structures and the strain energy density method, Meneghetti proposed the peak stress method for engineering applications and indicated that the accuracy of the peak stress method is similar to that of the strain energy density method [10].
An average strain energy density over the control volume, handling a general multiaxial fatigue loading condition (mixed Mode I + II + III loading), can be expressed as follows [17]:
W ¯ = c w 1 e 1 E [ K 1 R 0 1 λ 1 ] 2 + c w 2 e 2 E [ K 2 R 0 1 λ 2 ] 2 + c w 3 e 3 E [ K 3 R 0 1 λ 3 ] 2
where E is Young’s modulus; e 1 , e 2 , and e 3 are known parameters that depend on the notch opening angle and the Poisson’s ratio; and K 1 , K 2 , and K 3 are the ranges of the notch strength intensity factors (maximum value minus minimum value) relevant to Modes I, II, and III, respectively; the control radius R 0 is 0.28 mm; and λ 1 , λ 2 , and λ 3 are the stress singularity coefficients, which depend on the notch opening angle and loading conditions.
The relevant expressions of the notch stress intensity factor, the peak stress, and the element size are as follows [18,19,20]:
K F E 1 = K 1 σ θ θ , θ = 0 , p e a k × d 1 λ 1 1.38
K F E 2 = K 2 τ r θ , θ = 0 , p e a k × d 1 λ 2 3.38
K F E 3 = K 3 τ r z , θ = 0 , p e a k × d 1 λ 3 1.93
where K 1 , K 2 , and K 3 are the notch stress intensity factors tied to Modes I, II, and III for i = 1, 2, and 3, respectively;
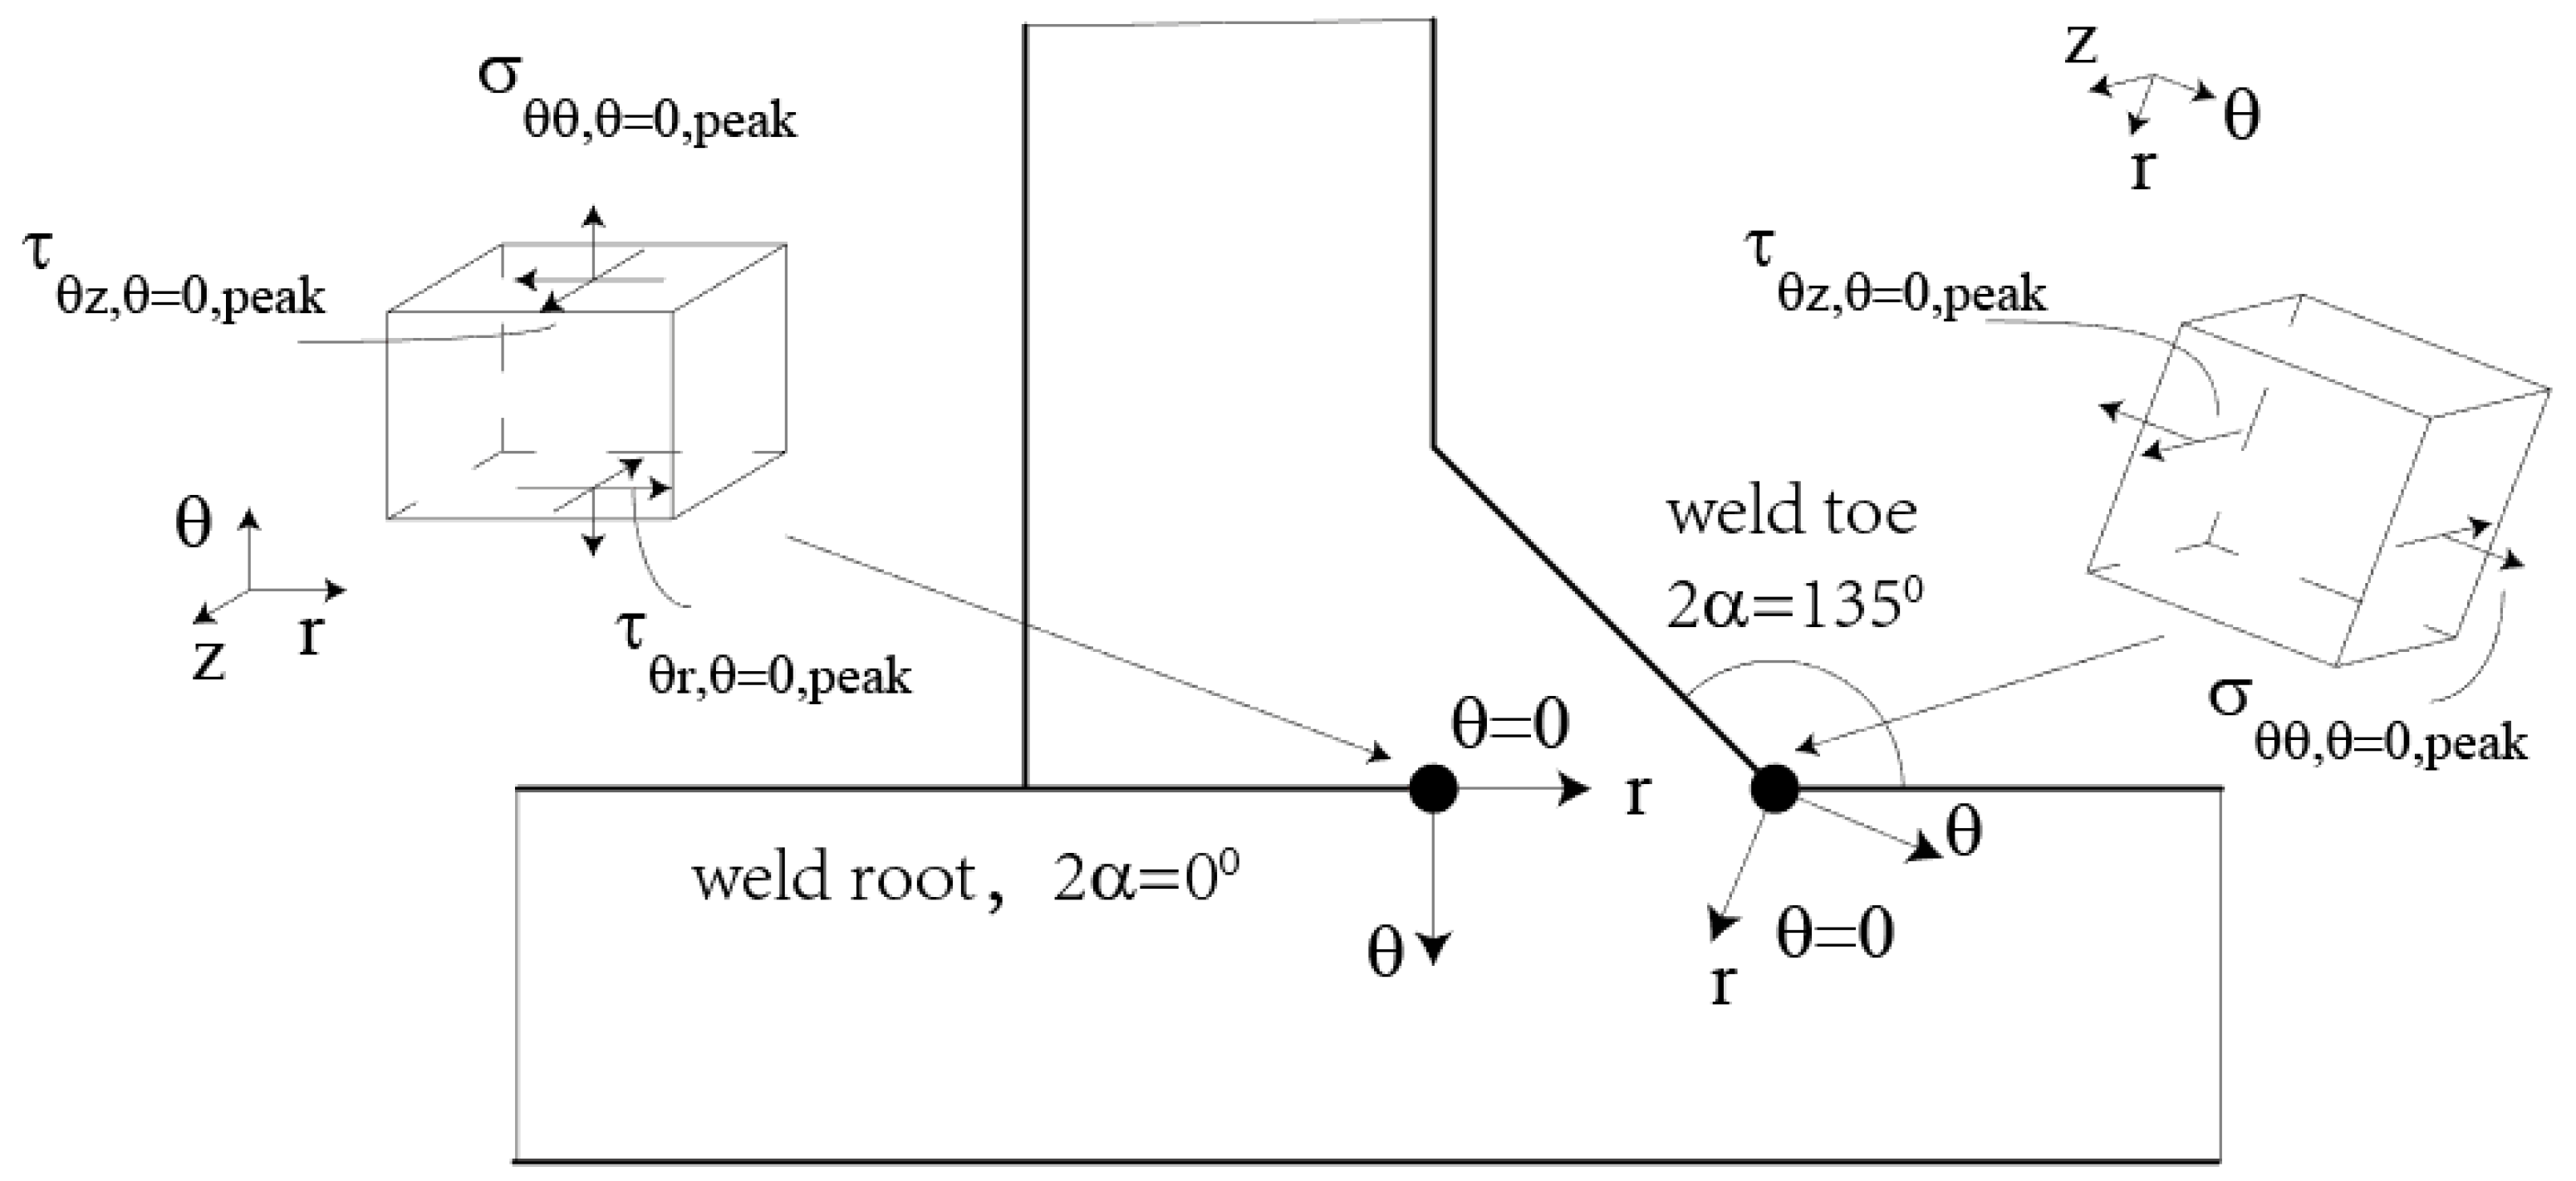
 σ θ θ , θ = 0 , p e a k , τ r θ , θ = 0 , p e a k , and τ r z , θ = 0 , p e a k are the peak stresses in local polar coordinates, as shown in Figure 3; and d is the ‘global element size’ parameter.
Substituting (6), (7), and (8) into (5) yields the following expression:
W ¯ = c w 1 e 1 E [ 1.38 σ θ θ , θ = 0 , p e a k ( d R 0 ) 1 λ 1 ] 2 + c w 2 e 2 E [ 3.38 τ r θ , θ = 0 , p e a k ( d R 0 ) 1 λ 2 ] 2 + c w 3 e 3 E [ 1.93 τ r z , θ = 0 , p e a k ( d R 0 ) 1 λ 3 ] 2
After extracting the common factor, the above formula can be expressed as follows:
W ¯ = 1 v 2 2 E σ e q , p e a k 2
σ e q , p e a k = C w 1 f w 1 2 σ 2 θ θ , θ = 0 , p e a k + C w 2 f w 2 2 τ 2 r θ , θ = 0 , p e a k + C w 3 f w 3 2 τ 2 θ z , θ = 0 , p e a k
f w i = K E F i 2 e i 1 v 2 ( d R 0 ) 1 λ i w h e r e   i = 1 , 2 , 3
where σ e q , p e a k is the equivalent peak stress. The fatigue assessment accuracy of the peak stress method and the strain energy density method are equal. Similar to the strain energy density method, the location of the maximum equivalent peak stress is the most likely fatigue crack initiation site.
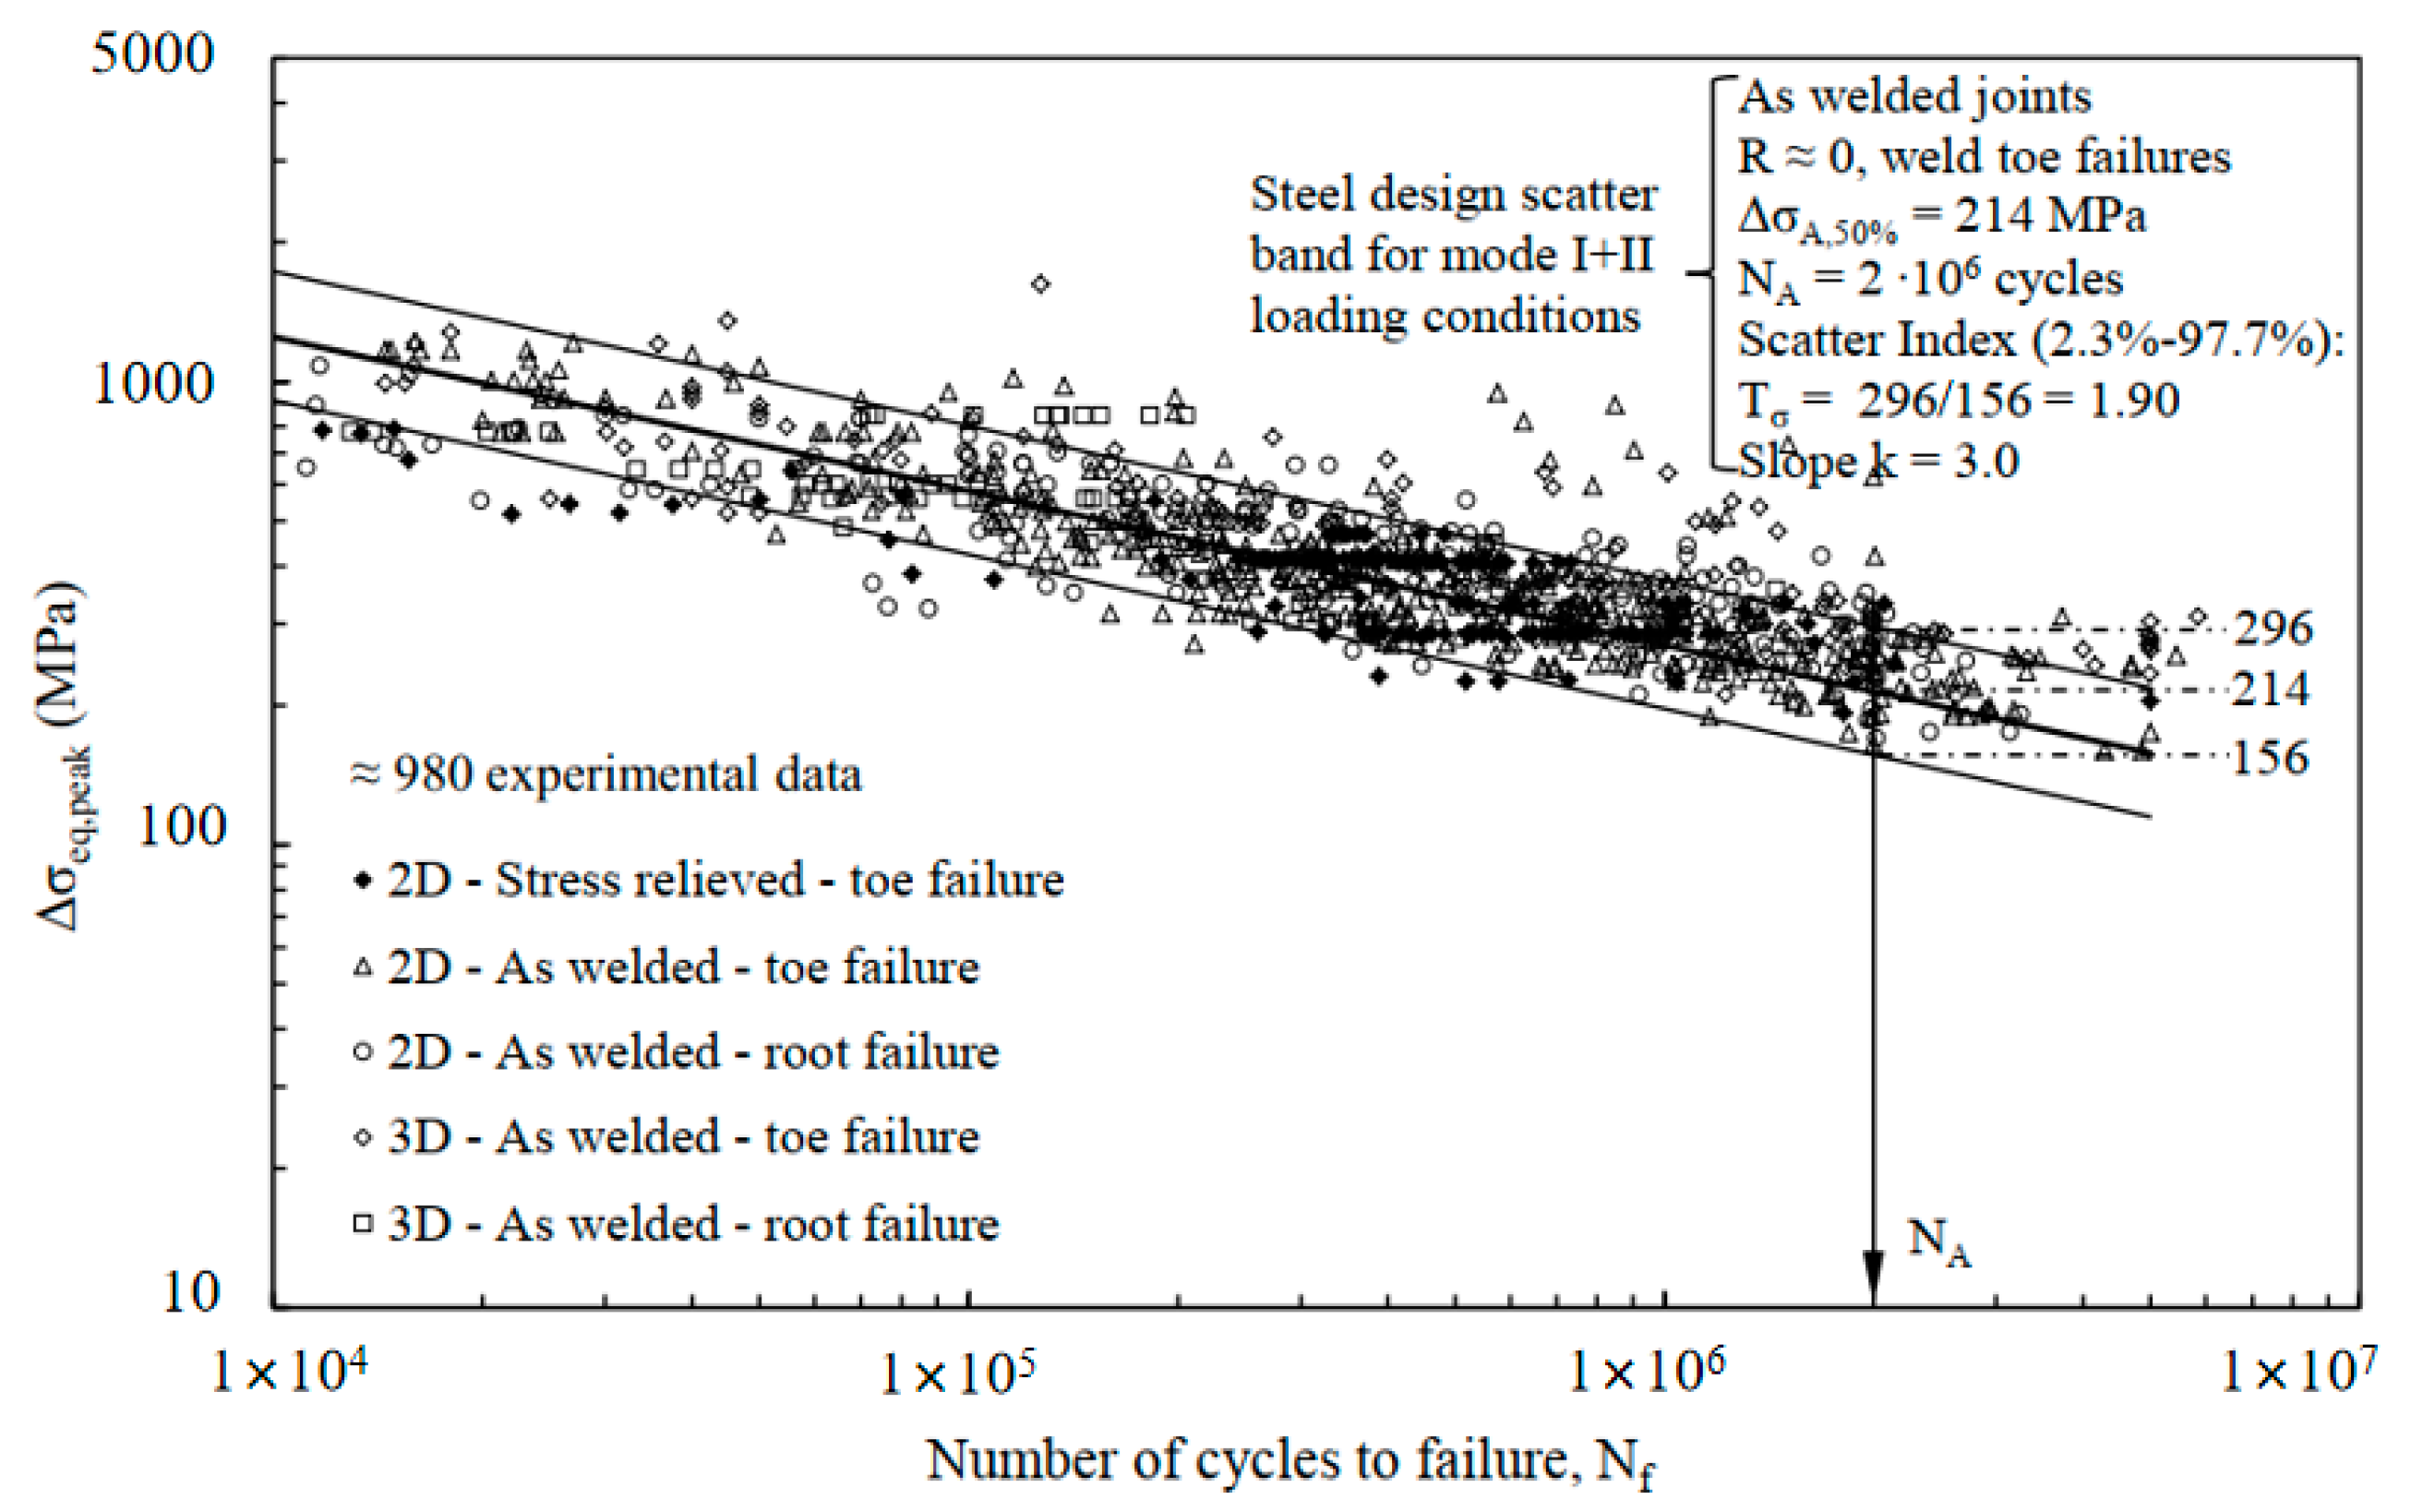
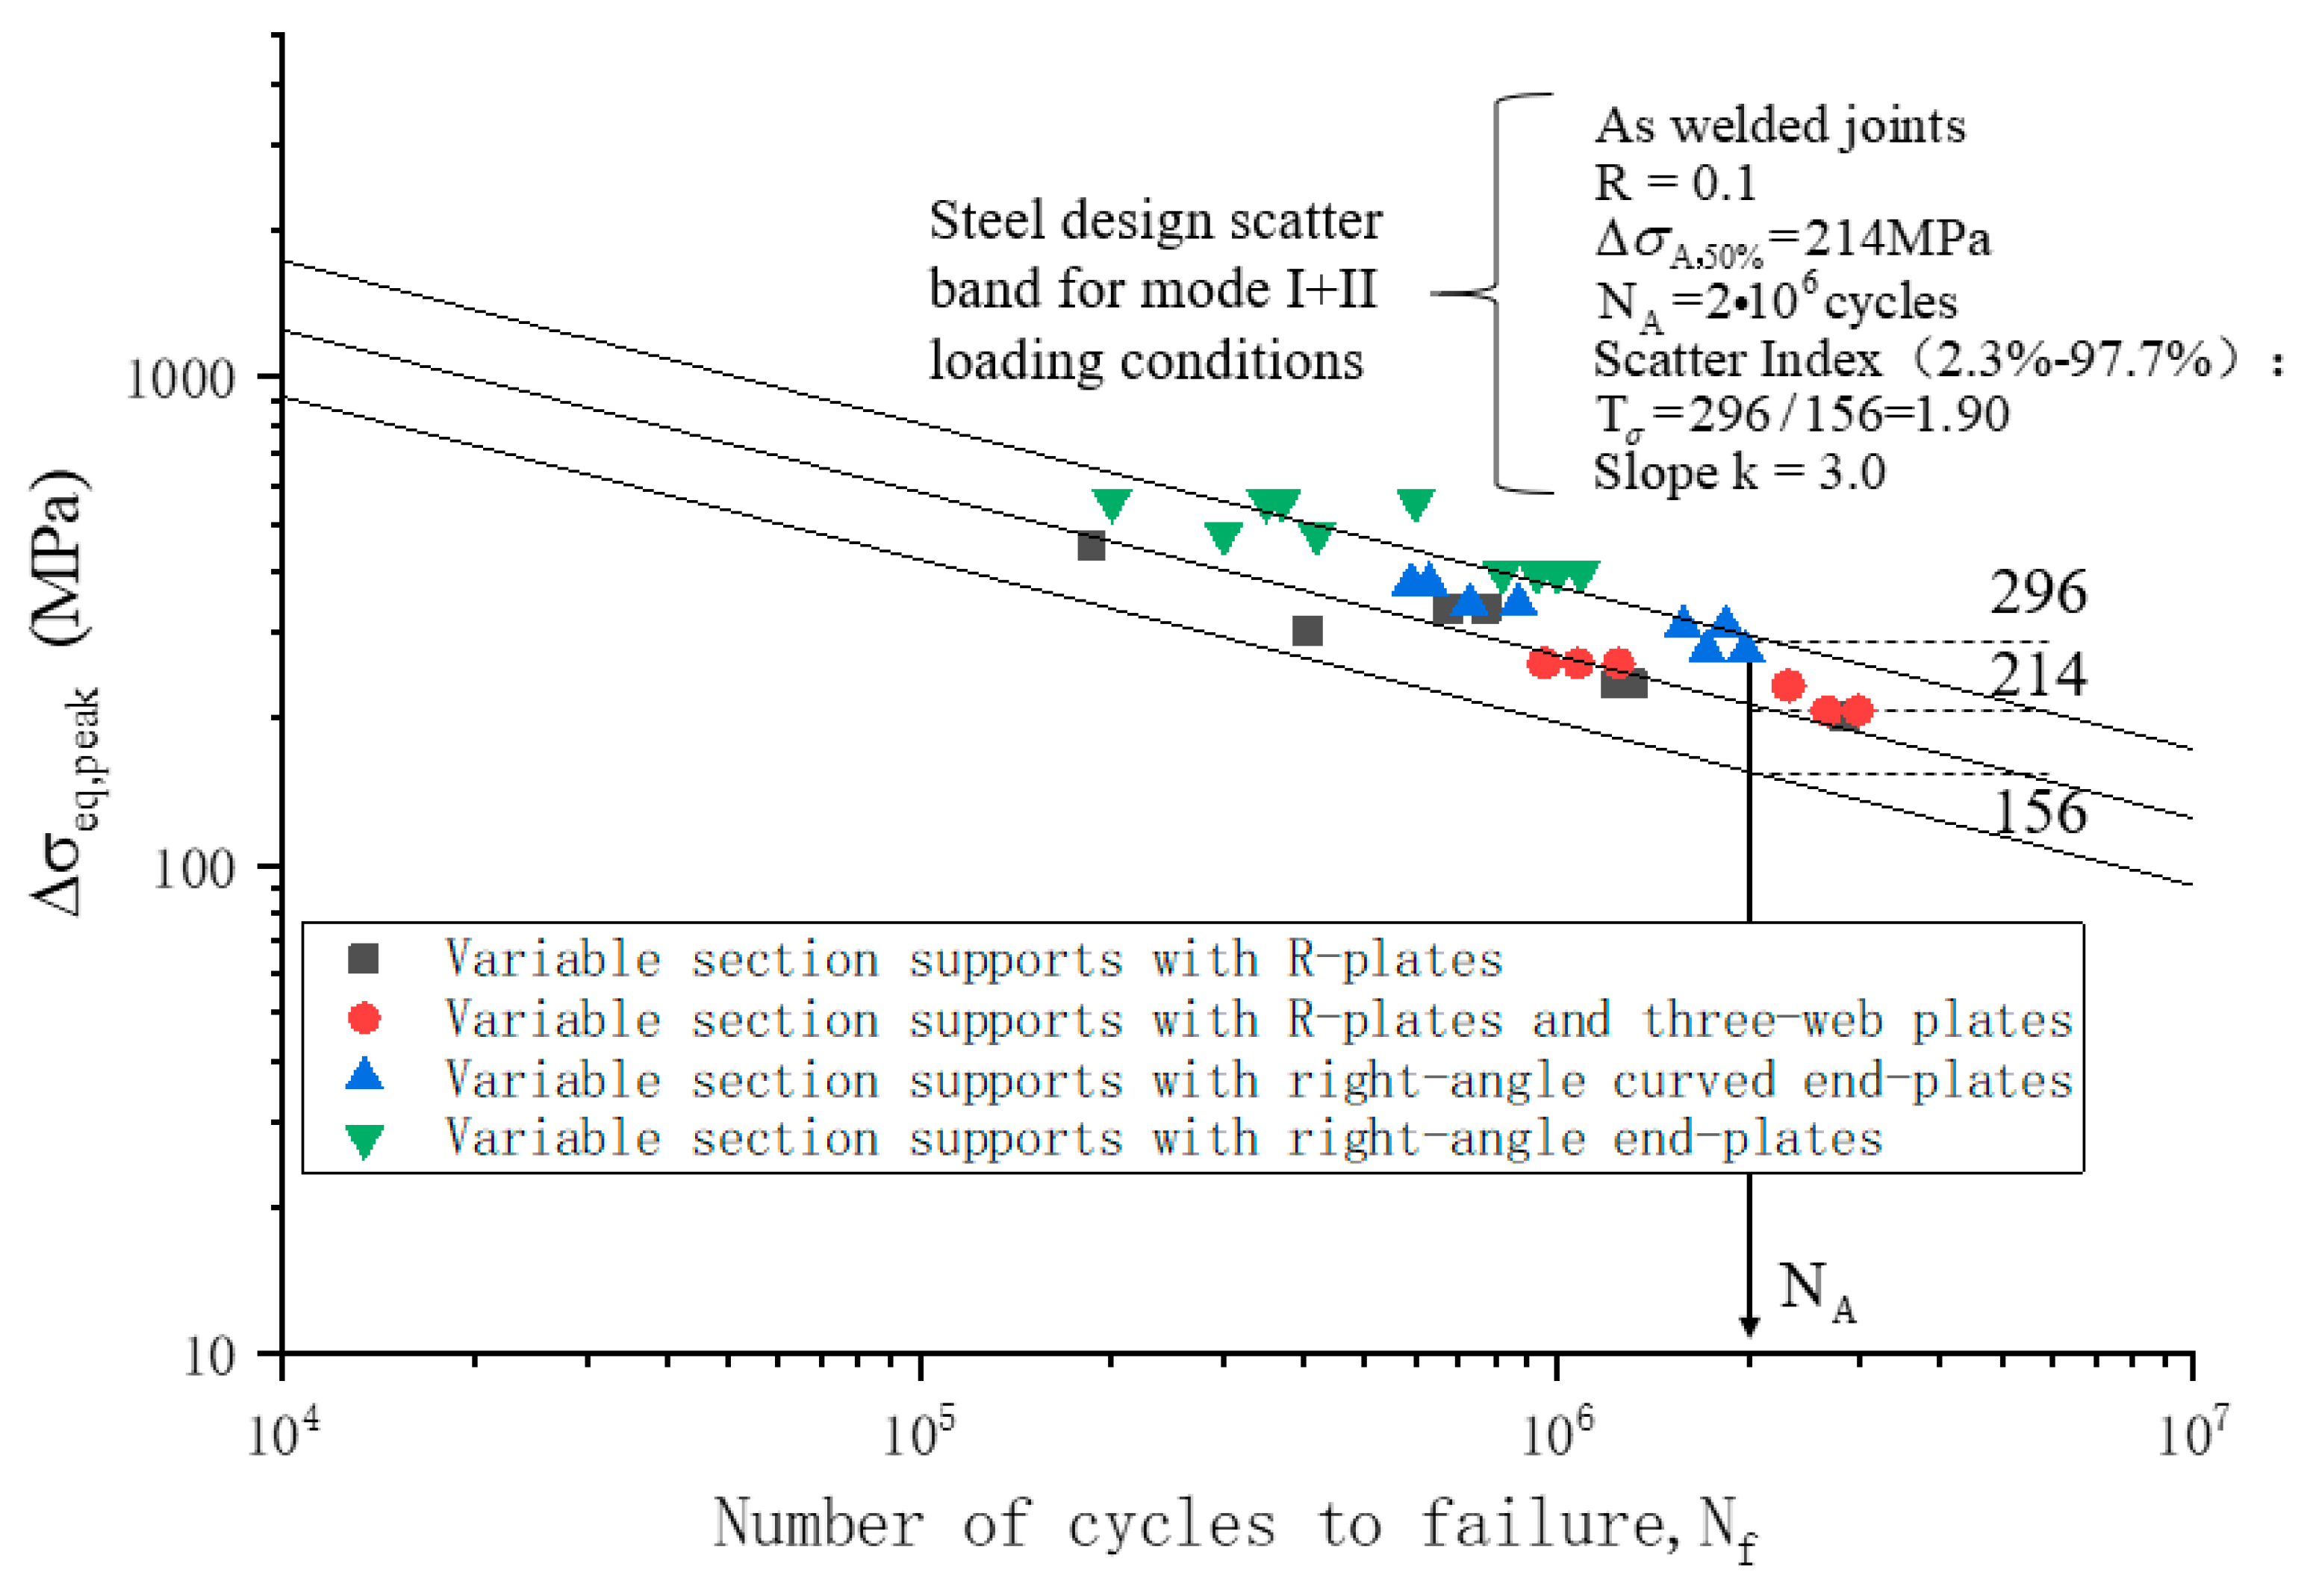
Figure 4 shows the results of a statistical analysis of 980 fatigue test data taken from Reference [10], through which a universal steel design scatter band for Mode I + II loading conditions was given. The mean value of the equivalent peak stress was 214 MPa at the steel design scatter band for 2 million cycles; the lower limit of the equivalent peak stress was 156 Mpa and the upper limit was 296 Mpa when the guaranteed rate of 97% was satisfied. A comparison between the predicted fatigue crack initiation site and the experimental fatigue results revealed good agreement between the experimental results and the estimations. These experimental data included 24 types of welded joints but no steel crane beams. Therefore, additional study is needed to determine whether the peak stress method is suitable for the fatigue assessment of steel crane girders.

4. Experimental Fatigue Test Results

To verify that the peak stress method is suitable for predicting the fatigue crack initiation sites in variable-section supports, this section performed fatigue tests with four types of typical variable-section supports of steel crane girders.

4.1. Variable-Section Supports with R-Plates and Three-Web Plates

In this section, fatigue tests were performed with variable-section supports with R-plates and three-web plates. The section dimensions and the crane wheel loads in practical engineering applications are shown in Figure 5. To reduce the stress level in the variable section, two lateral webs were added in the variable-section support. The length and depth of the section were 30 m and 3.9 m, respectively. The cope depth and length from the support were 2.0 m and 0.65 m, respectively, and the cope radius was 0.3 m. The girders were made of steel with a yield strength of approximately 345 Mpa.
According to Figure 5, each of these girders was supported by a crane with 16-wheel loads of 500 kN. The two ends of the crane beam were simply supported mainly withstanding the shear force, while the middle of the span was primarily subjected to the bending moment. With one outer wheel at the cope line and all the crane wheels on the girder, maximum stress would result at the coped end.
To facilitate loading, the prototype was first scaled to 1/5 to ensure geometric similarity. Secondly, appropriately adjusting the beam length, the position of the transverse stiffening rib and the loading position served to ensure sufficient stiffness of the test model and the similarity of the stress pattern between the R-plate and the web with the prototype. After a large amount of trial calculation, the test model with the size and loading position as shown in Figure 6 satisfied the similarity of the stress pattern with the prototype. The test model differed from the prototype In terms of maximum primary stress by 7.8 Mpa, approximately 3.5% of the maximum main stress of the prototype, as shown in Figure 7.
Tests were conducted on four scaled models (specimens) of crane runway girders with coped ends, which were scaled 1:5 to the prototypes. Each specimen had two coped ends and a length of 2.6 m as shown in Figure 6. While fabricating specimens, the central portion of the prototype was deliberately shortened. A length of 1.3 m for each coped end of the specimen was equivalent to a length of 6.5 m in the prototype. Finite element analysis previously demonstrated the need for a 4 m model to capture the localized stress concentration effect [4]. Scaled specimens were constructed of steel with a yield strength of about 345 mPa. The welds on the top flange plate, the bottom flange plate, and the medial web were penetration welds, whereas the other welds were fillet welds; the weld height was 0.5 times the thickness of the welded plate. The weld appearance quality grade of the penetration welds met the requirements of a first-class weld, and the fillet welds met the requirements of a third-class weld according to GB50205-2001 [21]. All production process requirements used herein were consistent with those used for the prototype. Therefore, the test findings for these specimens ought to represent the fatigue characteristics of each prototype.
The support for each test specimen was simply provided by a roller and rocker. A spreader beam was used to realize two-point loading. The loading points were located 664 mm from the end of the beam. A loading frequency of 4–5 Hz was used to conduct fatigue tests. For each specimen, the ratio of reaction force between minimum and maximum was 0.1. The loading and test results are shown in Table 1.
The test results in Figure 8 and Table 1 showed that the fatigue crack initiation sites in the variable-section supports with R-plates and three-web plates were at the weld root between the lateral web and the R-plate and were approximately 90.1 mm from the starting point. Thereafter, the crack penetrated through the fillet weld and then propagated along the weld on both sides of the crack initiation site. When the crack extended on both sides for a certain length, fatigue cracks appeared on the lateral web, and the fatigue cracks propagated obliquely upward. The fatigue crack growth process was essentially the same in the four specimens.

4.2. Variable-Section Supports with R-Plates

In this section, fatigue tests were performed with variable-section supports with R-plates. Similar to the fatigue tests performed in the previous section, the study developed and tested five scaled crane runway girders with coped ends. Sample sizes were all 1:5 to actual prototypes. All specimens had two coped ends and a length of 2.1 m, as shown in Figure 9. In order to create the specimens, the central portions of the prototypes were deliberately shortened. A 5.25 m coped end length in the prototype was equivalent to a 1.05 m coped end length for each specimen. Scale specimens were constructed from steel with a 345 MPa yield strength. The welds on the top flange plate, the bottom flange plate and the web were penetration welds. The weld height was 0.5 times the thickness of the welded plate.
The support for each test specimen was simply provided by a roller and rocker. A cyclic loading with loading frequency of 4–5 Hz was applied to the midspan for fatigue tests. For each specimen, the ratio of reaction force between minimum and maximum was 0.1. The loading and test results are shown in Table 2.
The test results in Figure 10 and Table 2 showed that the fatigue crack initiation sites in the variable-section supports with R-plates were at the weld toe on the web and were approximately 97.2 mm from the starting point. Thereafter, one end of the crack extended obliquely upward along the web, and the other end extended to the R-plate, as shown by the white lines in Figure 10. The fatigue crack growth process was essentially the same in the five specimens.

4.3. Variable-Section Supports with Right-Angle Curved End-Plates

In this section, fatigue tests were performed with variable-section supports with right-angle curved end plates. Similar to the fatigue tests in the previous section, the study created and tested eight scaled crane runway girders with right-angle curved end plates. Sample sizes were all 1:5 to actual prototypes. As shown in Figure 11, all specimens have two coped ends and a length of 2.1 m. The central portions of the prototypes were intentionally shortened for specimens. A 5.25 m coped end length in the prototype was equivalent to a 1.05 m coped end length for each specimen. Scale specimens were constructed from steel with a 345 MPa yield strength. The welds on the top flange plate, the bottom flange plate, and the web were penetration welds. The welds between the plug-in plates and the curved end plates were penetration welds. The other joint welds were all fillet welds. All weld heights were 0.5 times the thickness of the welded plate.
Every test specimen was simply supported by a roller and rocker system. A spreader beam was used to realize two-point loading. The loading points were 700 mm from the end of the beam. A loading frequency of 4–5 Hz was used to conduct fatigue tests. For each specimen, the ratio of reaction force between minimum and maximum was 0.1. The loading and test results are shown in Table 3.
The test results in Figure 12 and Table 3 showed that the fatigue crack initiation sites in the variable-section supports with right-angle curved end plates were at the weld toe on the plug-in plate and were approximately 98.7 mm from the starting point. Thereafter, the crack simultaneously extended along the thickness direction and along both sides of the web plate. Once the cracks extended to the web above the plug-in plate, the crack propagation speed increased quickly. When the plug-in plate was completely fractured, the steel crane beam lost bearing capacity. The fatigue crack growth process was essentially the same in the eight specimens.

4.4. Variable-Section Supports with Right-Angle End-Plates

In this section, fatigue tests were performed with variable-section supports with right-angle end plates. Similar to the fatigue tests in the previous section, six scaled specimens of crane runway girders with right-angle end plates were fabricated and tested. All specimens were scaled to the actual prototypes using a 1:4 ratio. Each specimen had two coped ends and was 2.5 m long, as shown in Figure 13. The central portions of the prototypes were intentionally shortened for specimens. A 5.0 m coped end length in the prototype was equivalent to a 1.25 m coped end length for each specimen. Scale specimens were constructed from steel with a 345 MPa yield strength. The welds on the top flange plate, the bottom flange plate, and the web were penetration welds. The welds between the plug-in plate and the end plate were penetration welds. The other joint welds were all fillet welds. All weld heights were 0.5 times the thickness of the welded plate.
Every test specimen was simply supported by a roller and rocker system. A spreader beam was used to realize two-point loading. The loading points were 547 mm from the end of the beam. A loading frequency of 4–5 Hz was used to conduct fatigue tests. For each specimen, the ratio of reaction force between minimum and maximum was 0.1. The loading and test results are shown in Table 4.
The test results in Figure 14 and Table 3 showed that the fatigue crack initiation sites in the variable-section supports with right-angle curved end plates were at the weld toe on the end plate and were approximately 90.4 mm from the starting point. The fatigue crack growth process was essentially the same in the six specimens.

5. Predicting the Fatigue Crack Initiation Site via the Peak Stress Method

In this section, the peak stress method was used to predict the fatigue crack initiation sites in the above variable-section supports, and the results were compared with the test results.
The peak stress method requires a high mesh quality near the weld toe and root. To facilitate analysis, the sub-model method was adopted. The master models and sub-models are shown in Figure 15, Figure 16, Figure 17 and Figure 18. Young’s modulus was 2.06 × 10 5 MPa, and Poisson’s ratio was 0.3. A fixed restraint was applied at the cross-section. The sub-models were cut from the master models. The node displacements calculated by the master models were applied to the boundaries of the sub-models, and the other boundary conditions were kept unchanged. The master models and sub-models all adopted eight-node elements. The element size of the master models was 20 mm, and the element size of the sub-models was 1 mm. It is worth noting that parameters f w 1 , f w 2 , and f w 3 in the equivalent peak stress Equation (11) are related to the finite element cell mesh size. When the mesh size was 1 mm and the groove angle 2 α was 135 degrees, f w 1 was 1.064 and f w 3 was 1.877. When the mesh size was 1 mm and the groove angle was 0 degrees, f w 2 was 5.522. Note that f w 2 was considered only when calculating the peak stress at the root of the fillet weld.
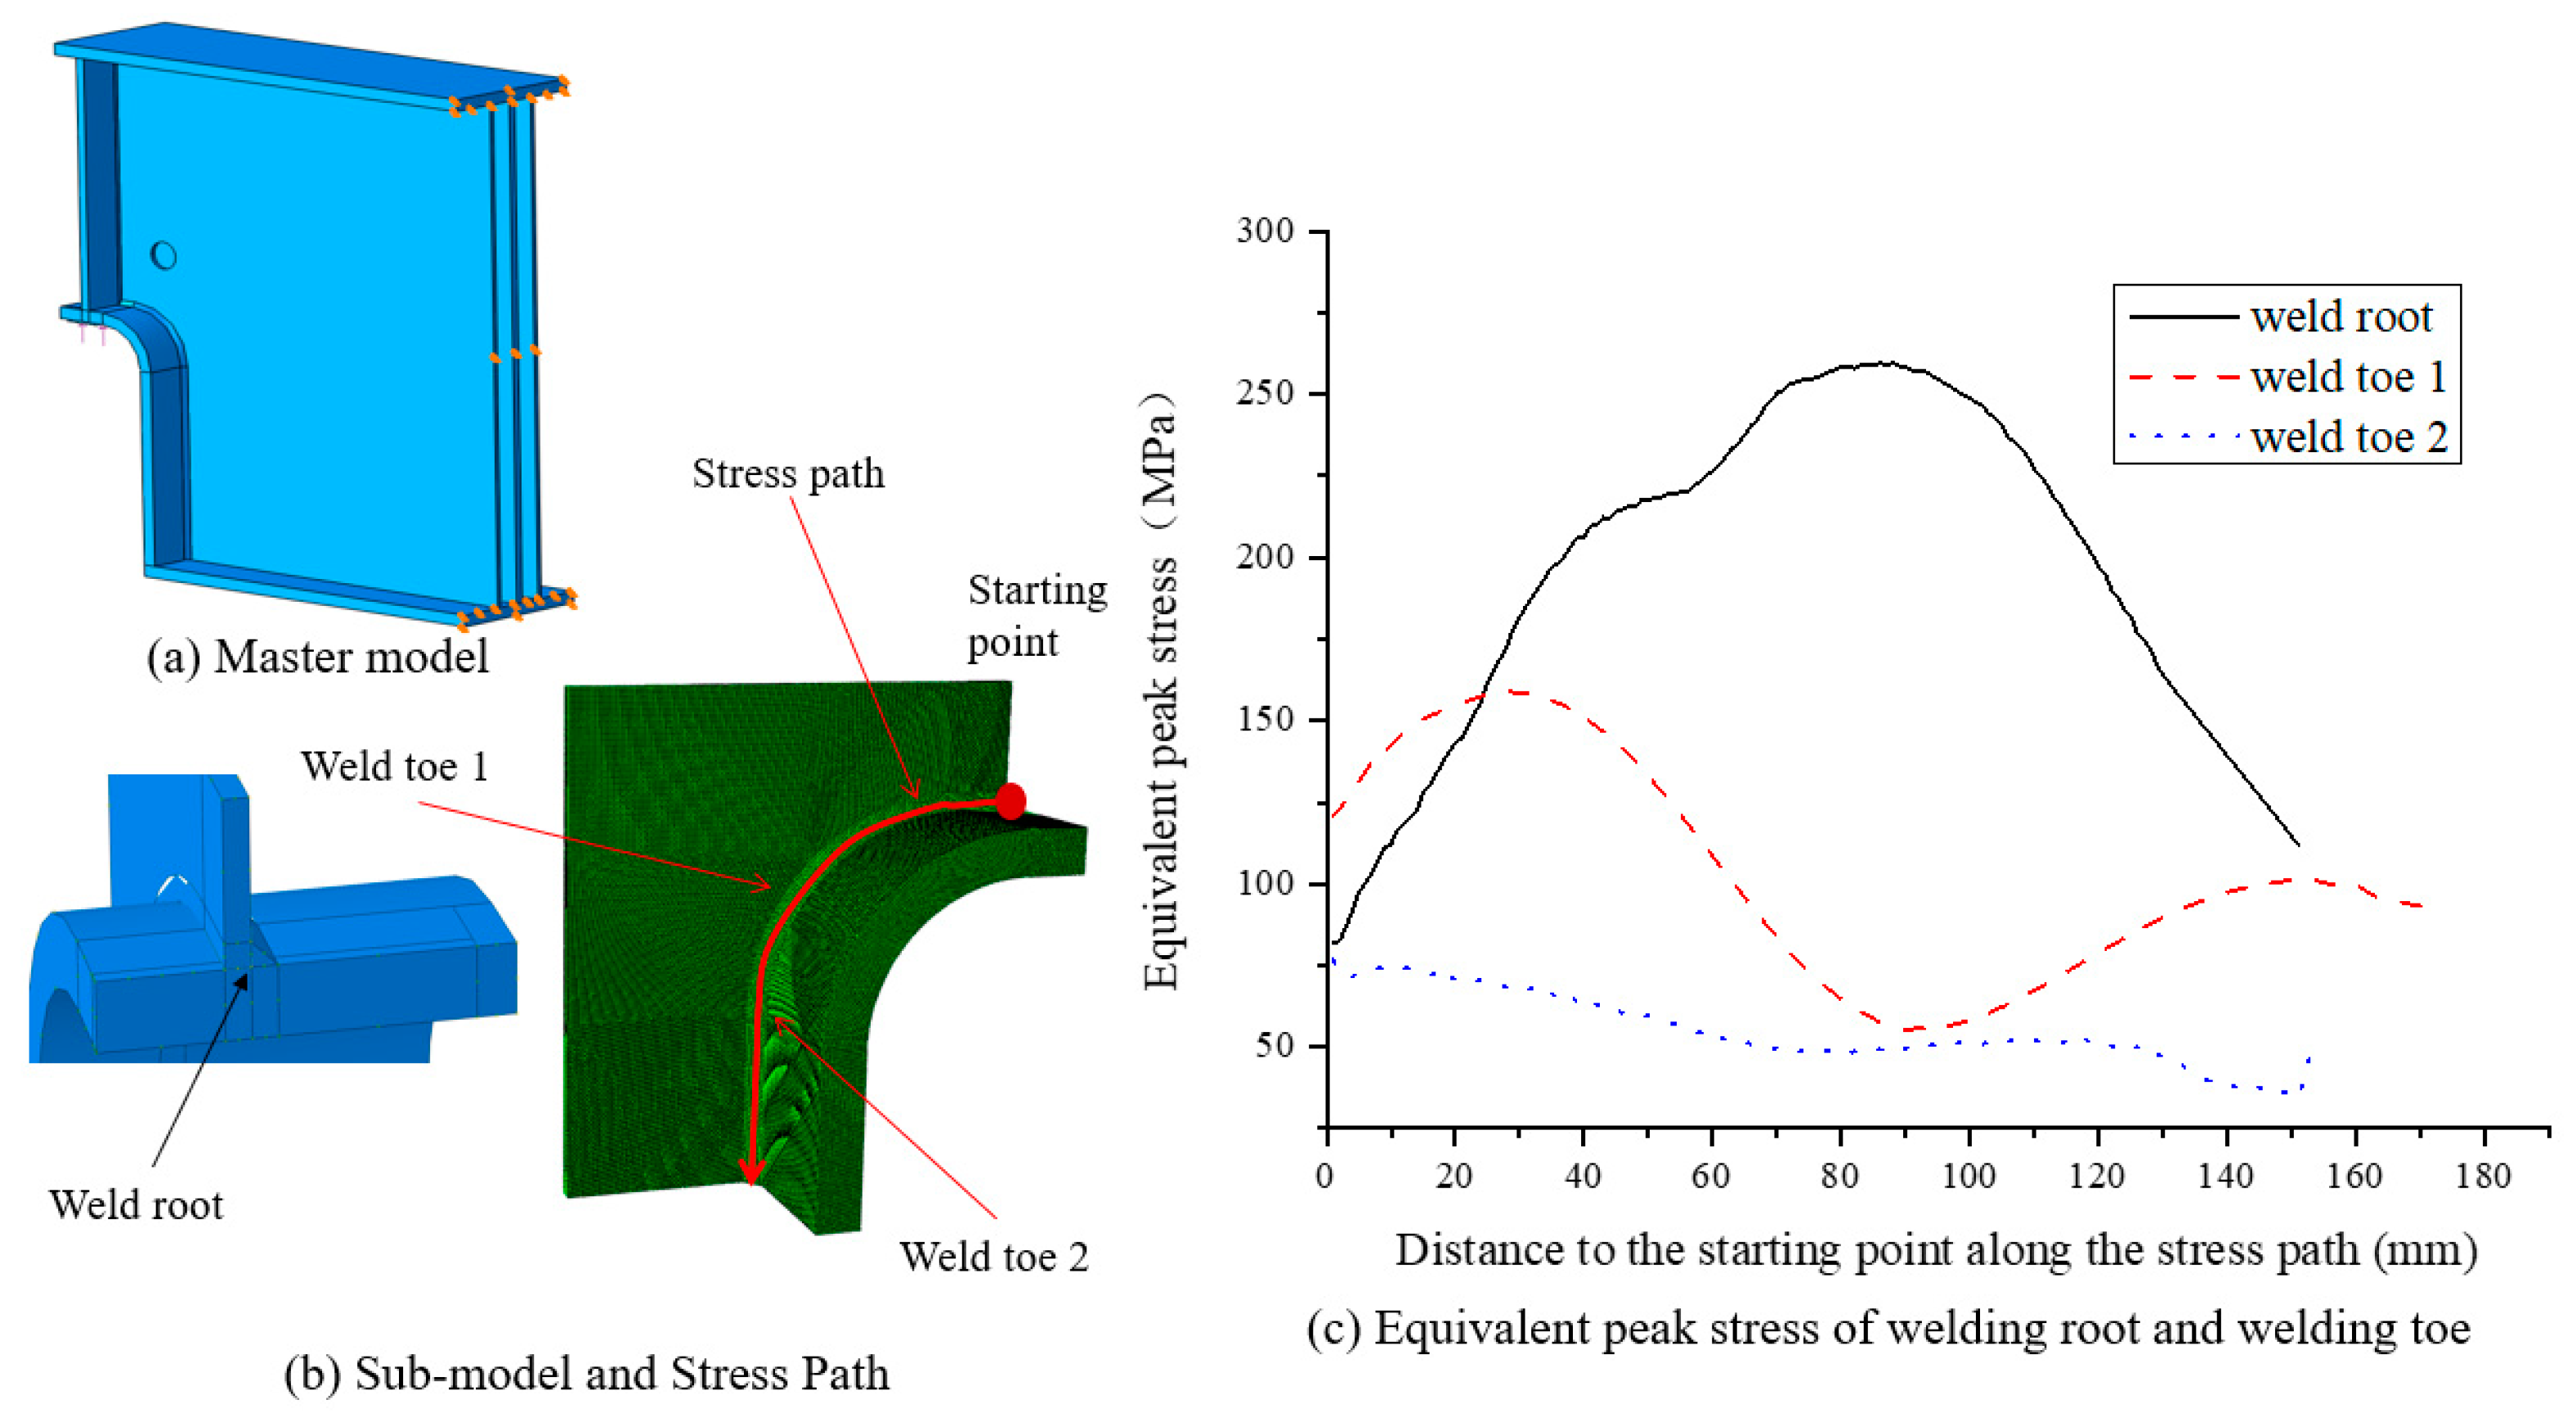
For the variable-section supports with R-plates and three-web plates, the applied vertical support reaction at the support was 250 kN. Surface contact, which transmits only compressive stresses, was set in the unwelded part of one side of the fillet weld between the lateral web and R-plate to simulate the gap at the root of the weld. The sub-model, the stress path of the weld toe and weld root, and the local cylindrical coordinate system are shown in Figure 15a. To facilitate the calculation of the equivalent peak stress, the normal vector of the element surface at the R-plate was oriented perpendicular to the direction vector of the stress path. The peak stress in the arc segment of the stress path was obtained by transforming the stress components in local cylindrical coordinates to local polar coordinates. The peak stress in the line segments of the stress path was obtained by transforming the stress components in a global cartesian coordinate system to local polar coordinates. The results are shown in Figure 15b.
The calculation results showed that there was a large stress concentration in the weld between the lateral web and R-plate. The variable-section supports with R-plates and three-web plates were subjected to Mode I + II loading conditions. A comparison of the equivalent peak stresses in the weld root, Weld Toe 1 and Weld Toe 2 showed that the stress concentrations in the weld root were obviously greater than those in the weld toes and that the stress concentrations in Weld toe 1 were greater than those in Weld Toe 2. The maximum equivalent peak stress in the weld root was 260 MPa, located 92.0 mm from the starting point along the stress path. Therefore, the fatigue crack initiation sites in the variable-section supports with R-plates and three-web plates were 92.0 mm from the starting point.
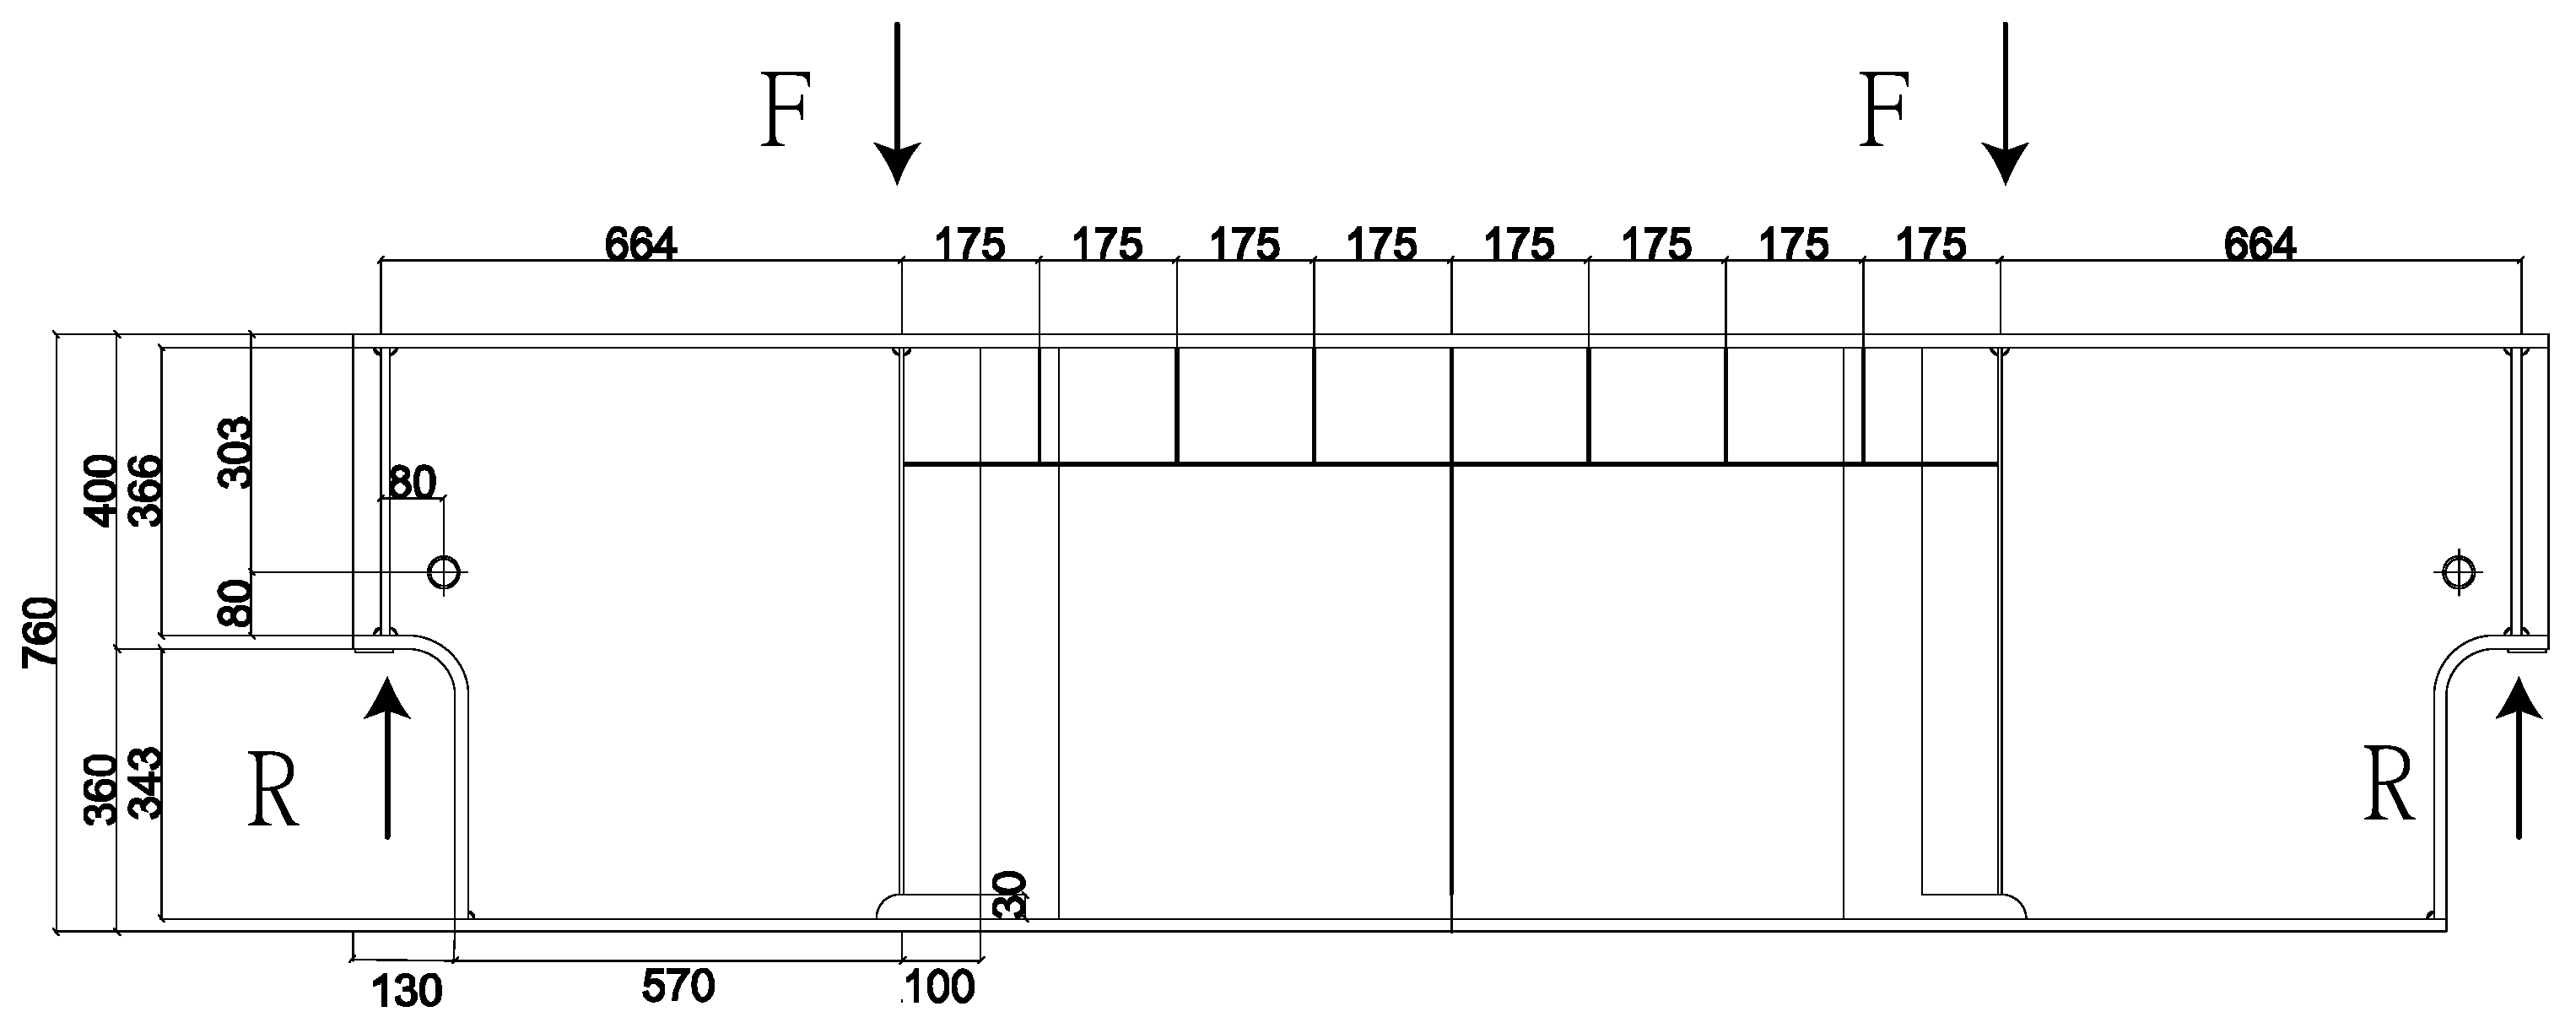
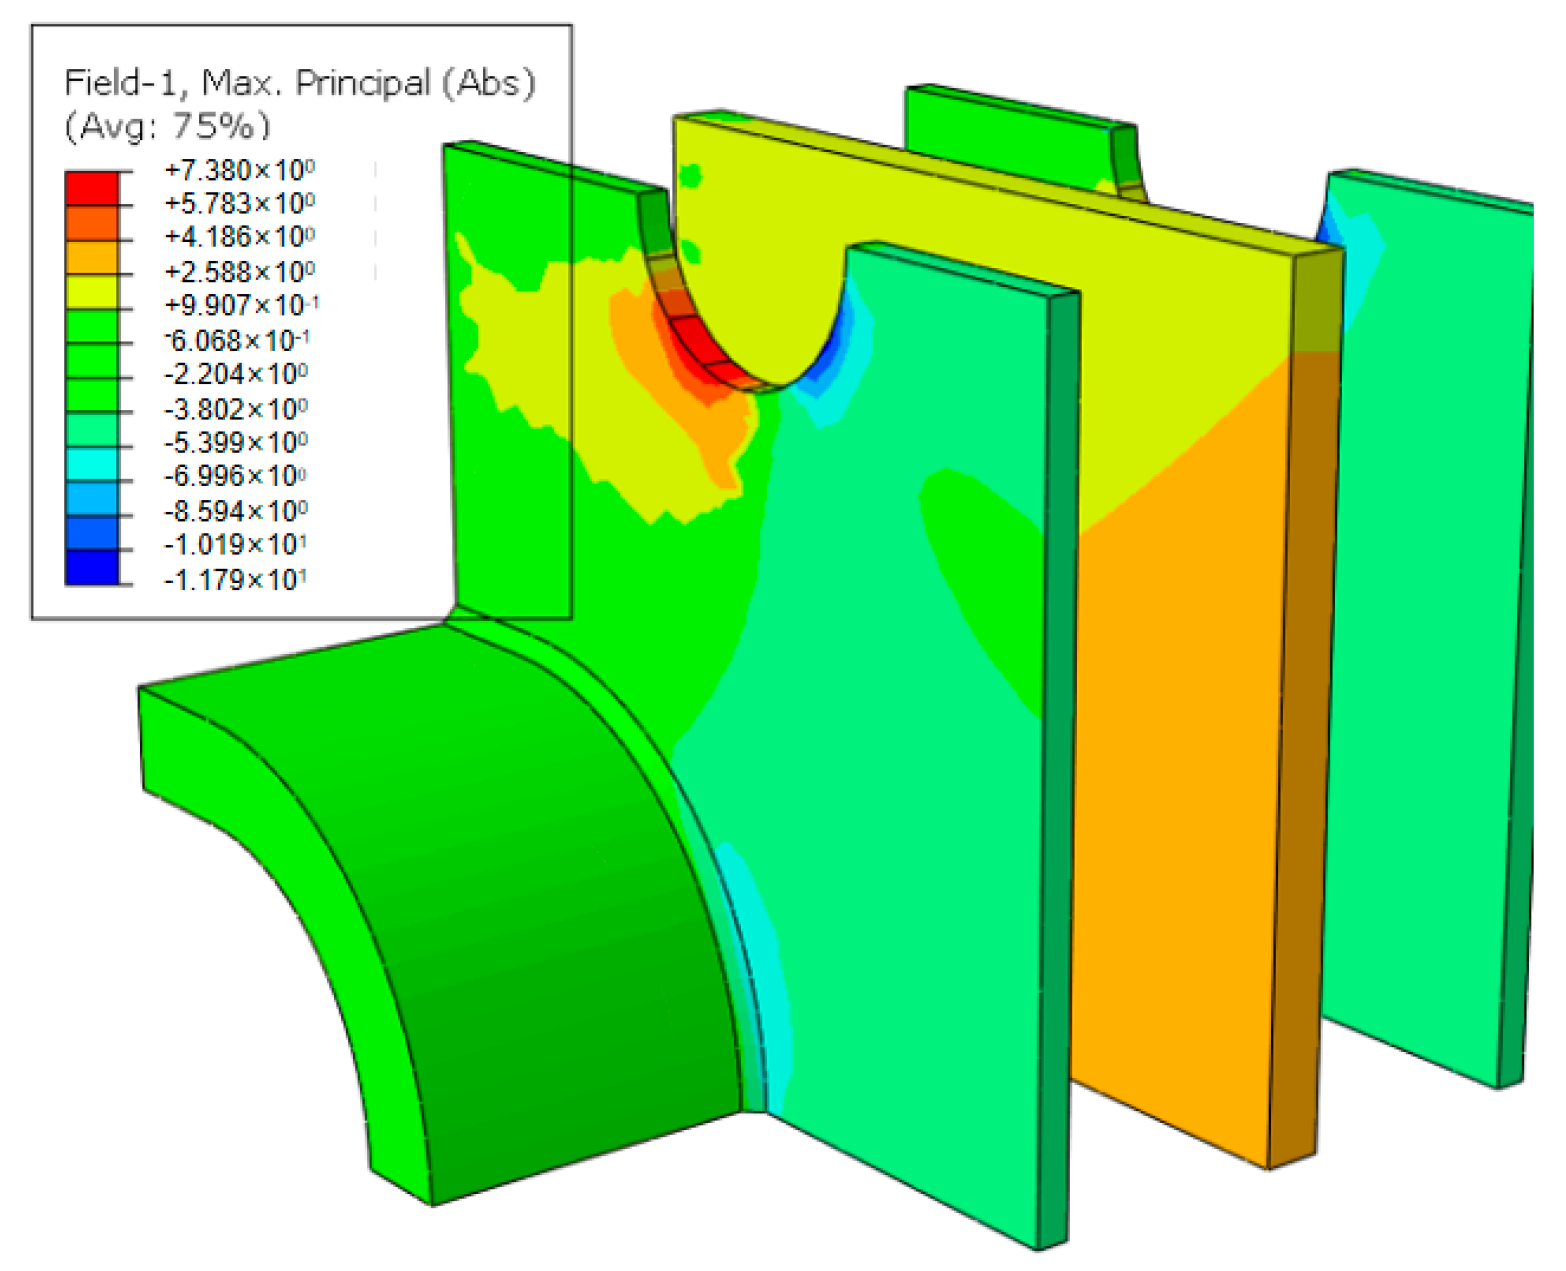
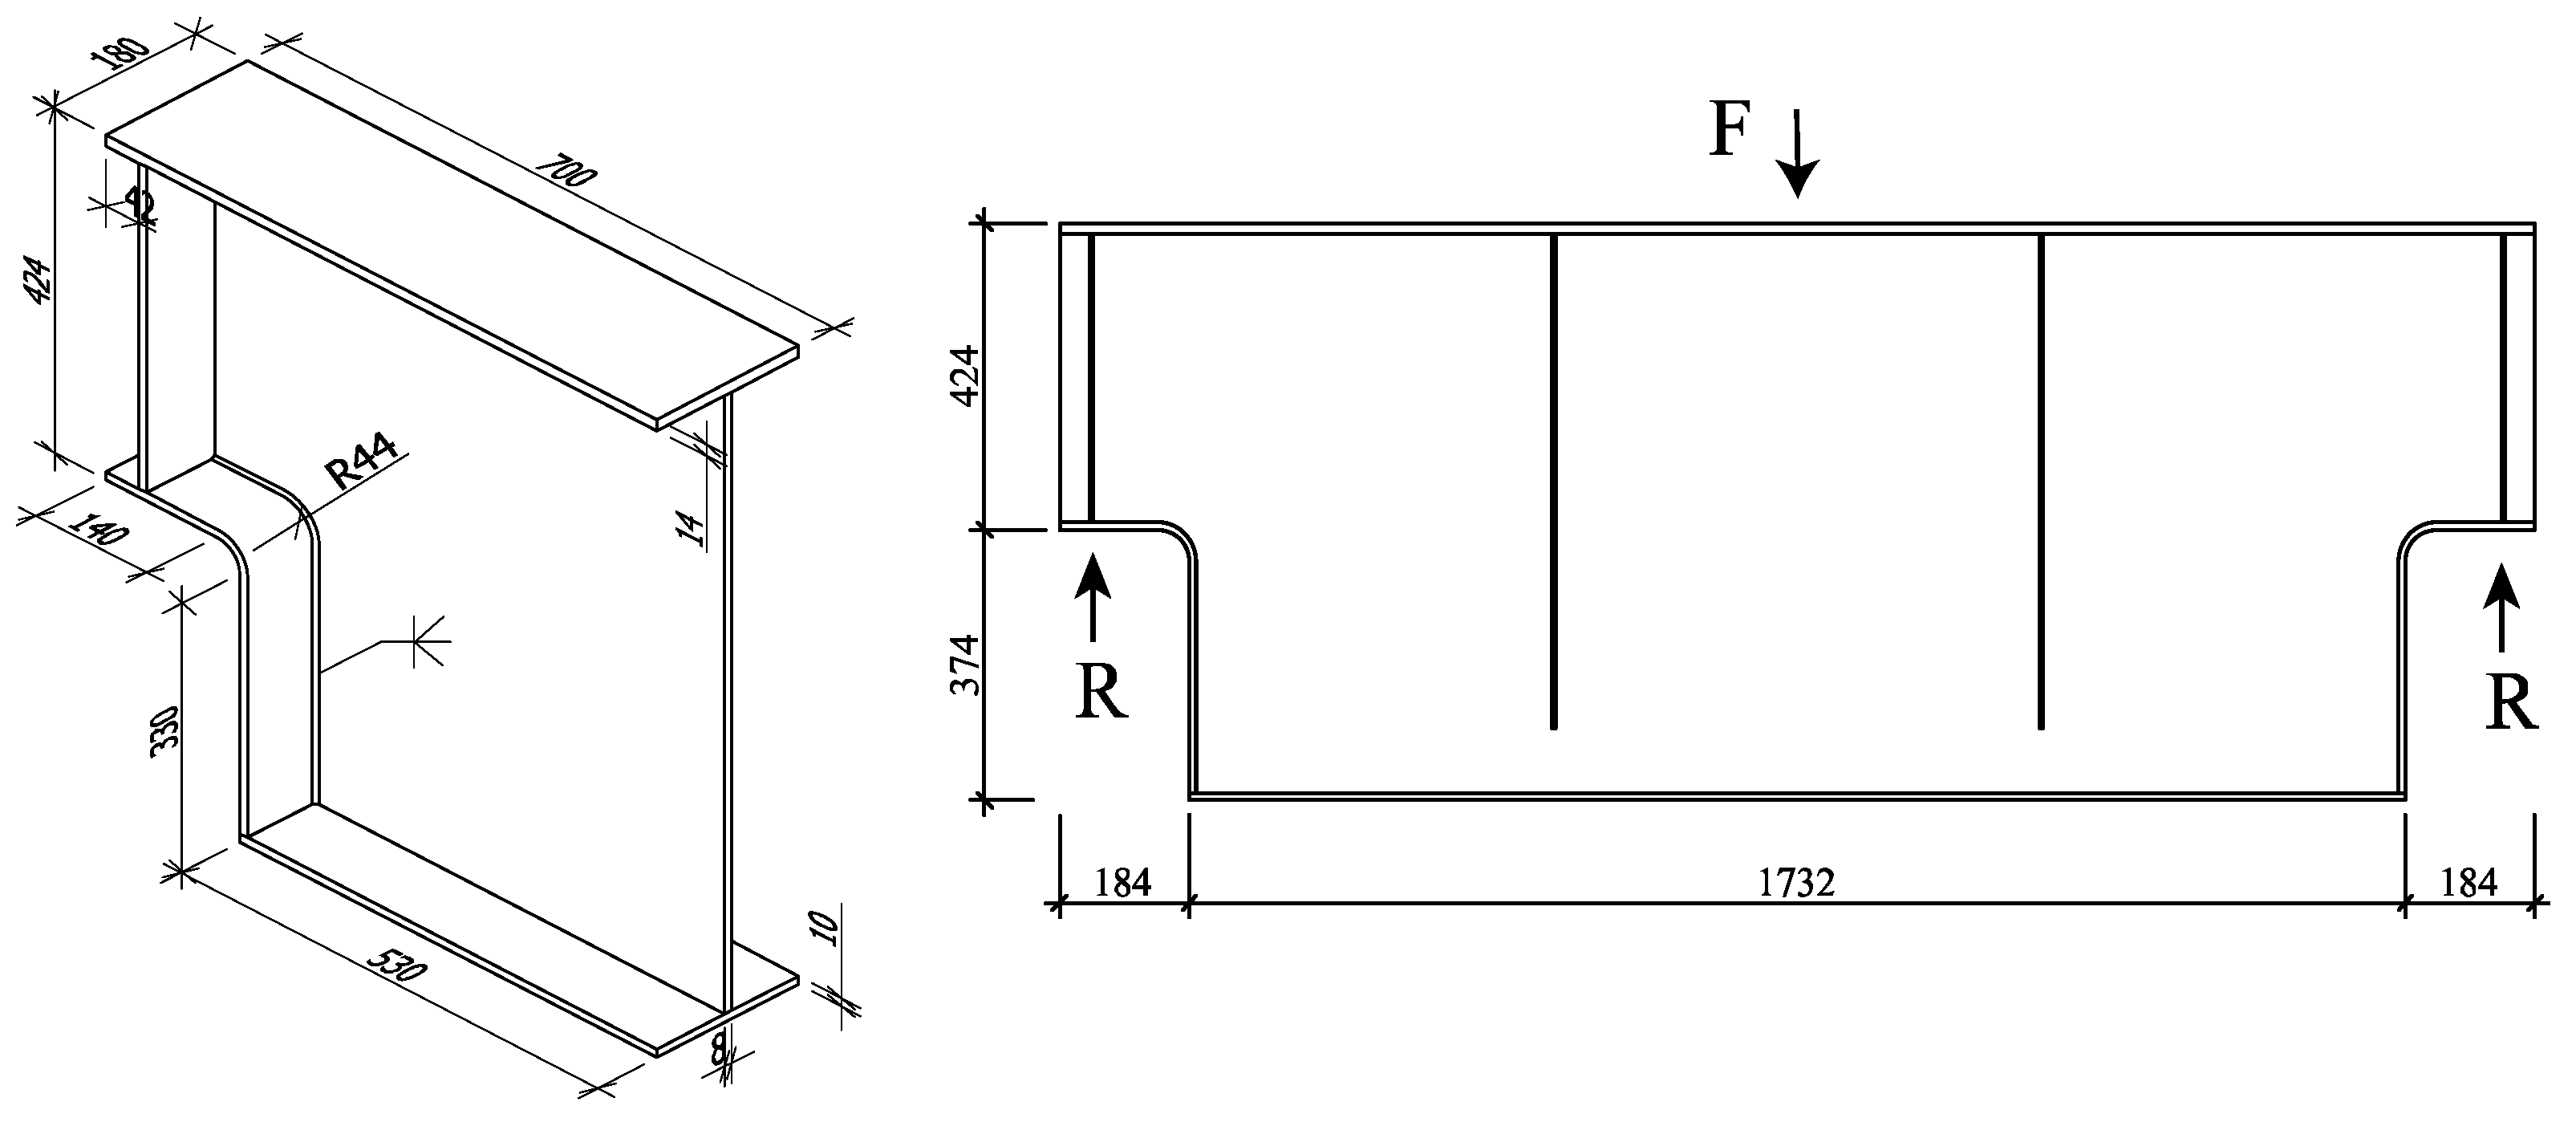
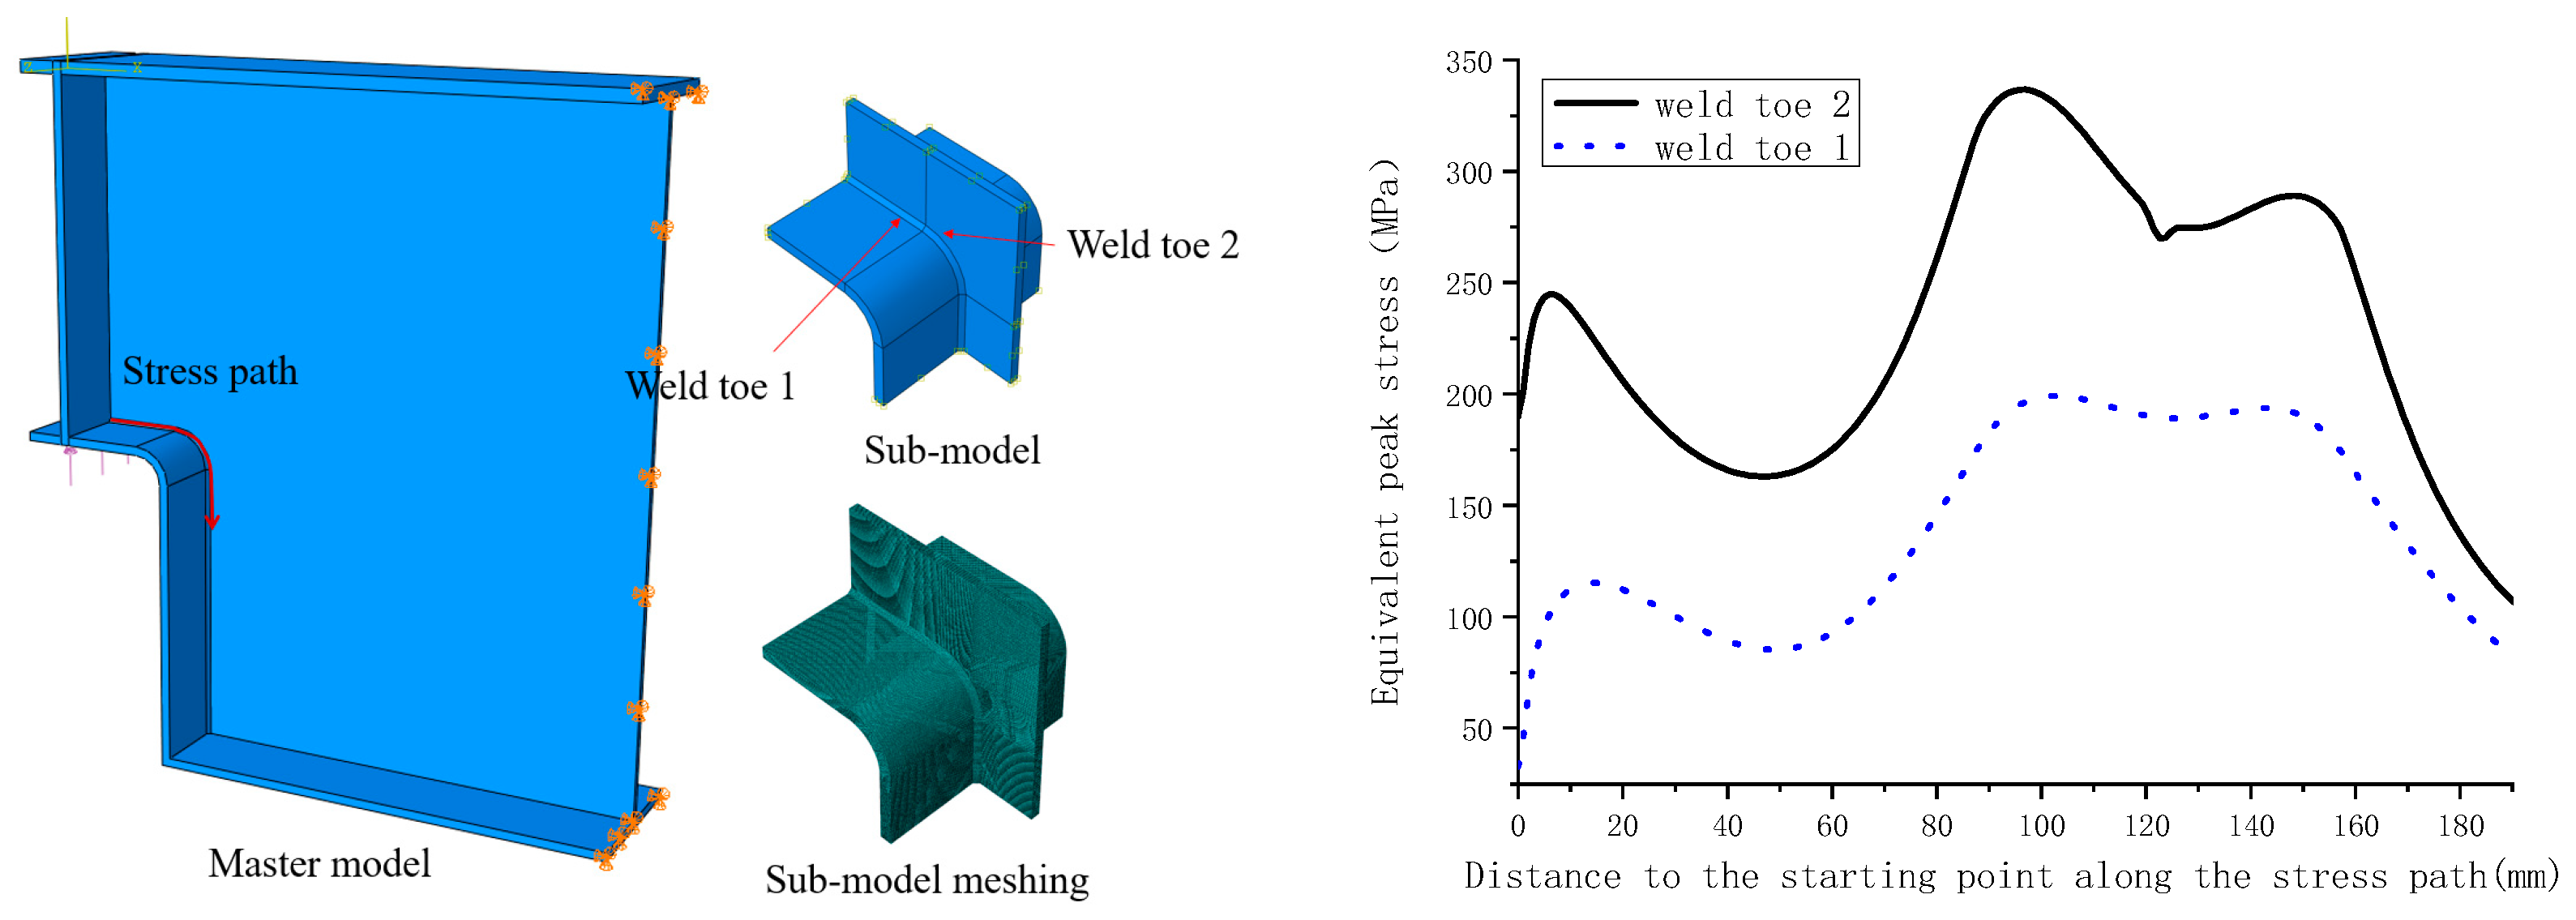
For the variable-section supports with R-plates, the applied vertical support reaction at the support was 245 kN. Using the same method as that described above, the equivalent peak stresses of the two weld toes of the weld between the web and the R-plate were calculated. The finite element analysis model, the stress path and the calculation results are shown in Figure 16. The calculation results showed that there were large stress concentrations in the weld between the web and R-plate. The variable-section supports with R-plates were subjected to Mode I + II loading conditions. A comparison of the equivalent peak stresses in Weld Toe 1 and Weld Toe 2 showed that the stress concentrations in Weld Toe 2 were obviously greater than those in Weld Toe 1. The maximum equivalent peak stress in Weld Toe 2 was 336 MPa, located 98.0 mm from the starting point along the stress path, i.e., the junction between the arc segment of the R-plate and the straight segment. Therefore, the fatigue crack initiation sites in the variable-section supports with R-plates were 98.0 mm from the starting point.
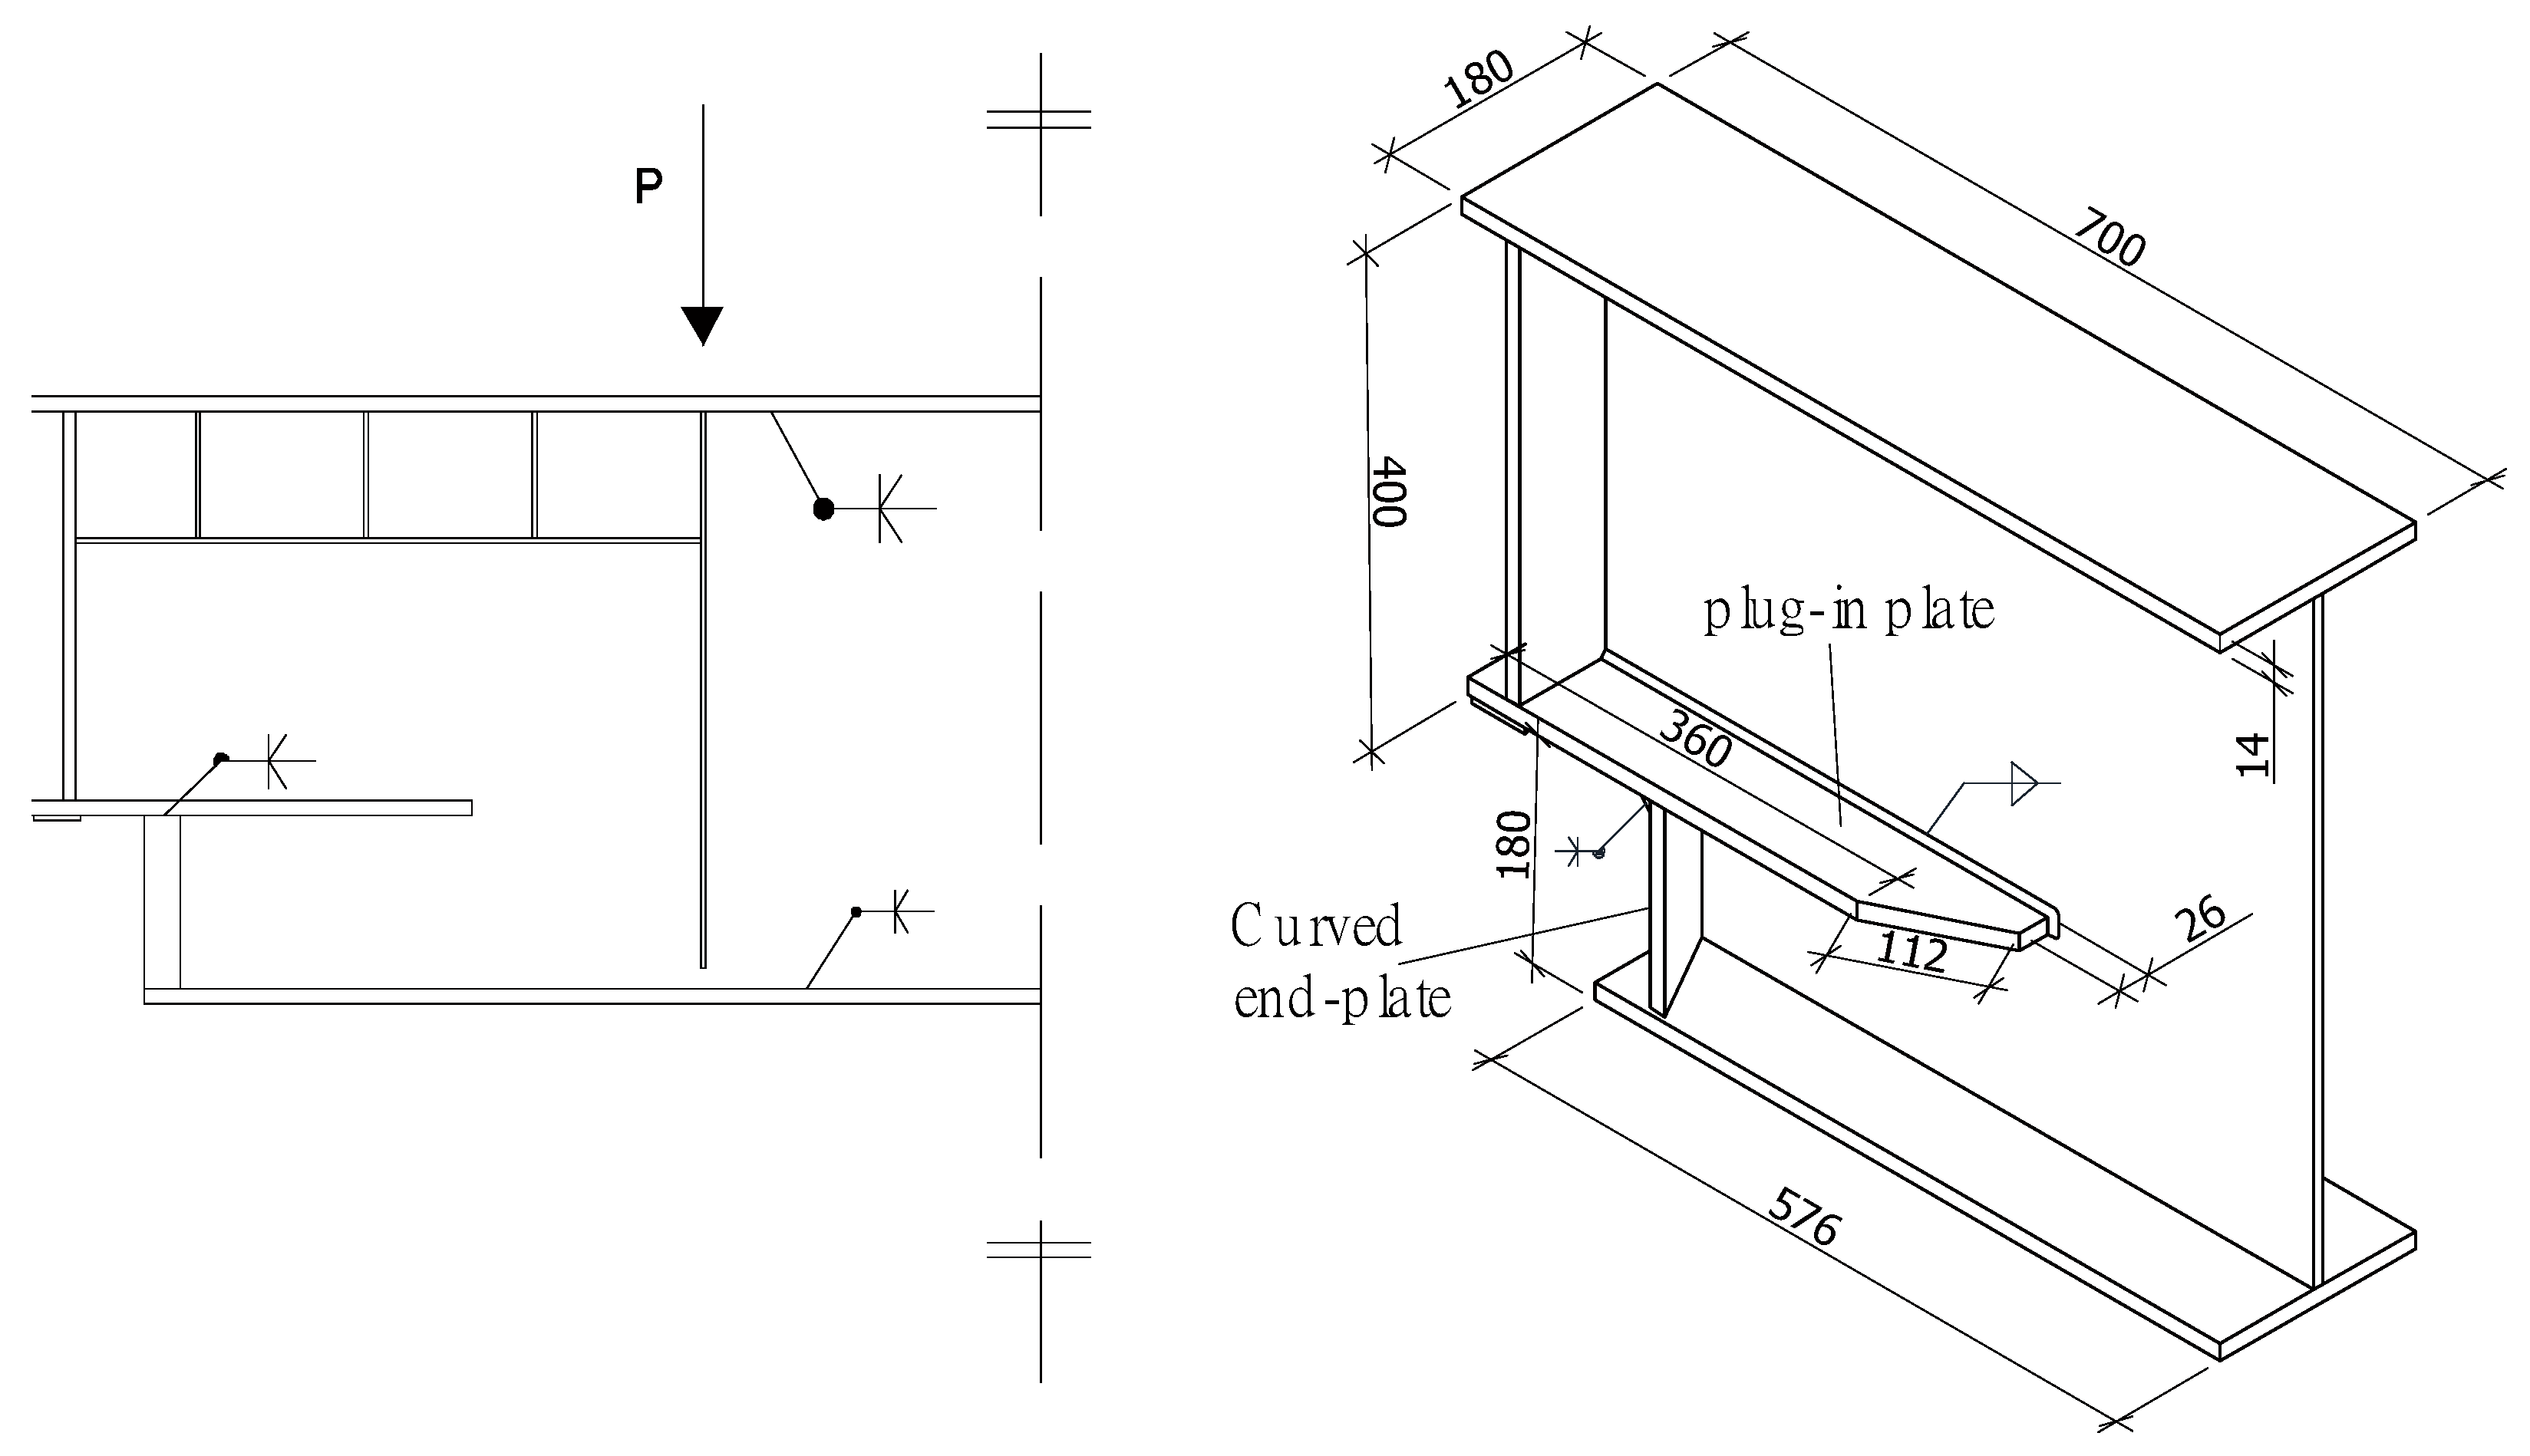
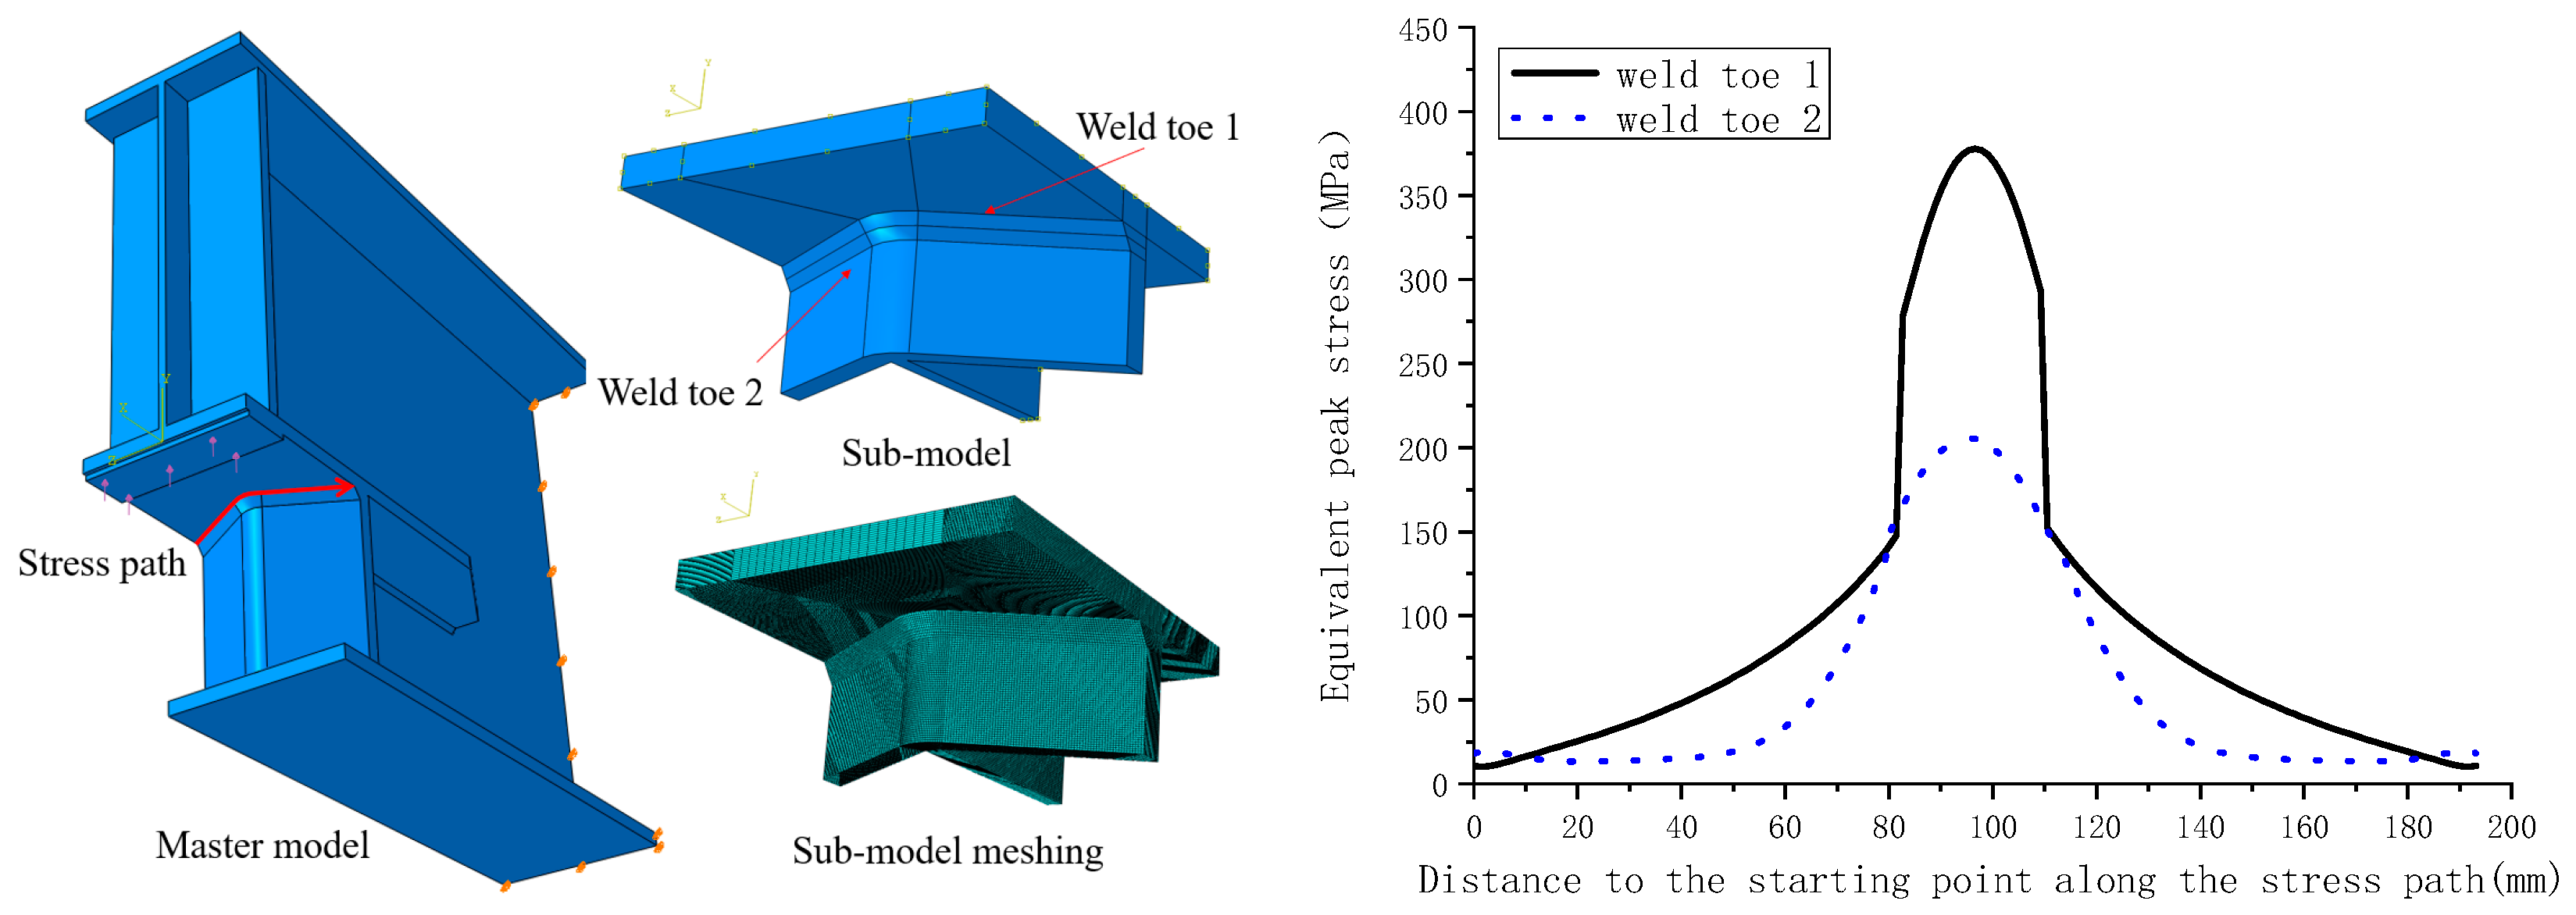
For the variable-section supports with right-angle curved end plates, the applied vertical support reaction at the support was 275 kN. Using the same method as that used for the other supports above, the equivalent peak stresses in the two weld toes of the weld between the curved end plate and the plug-in plate were calculated. The finite element analysis model, the stress path, and the calculation results are shown in Figure 17. The calculation results showed that there were large stress concentrations in the weld between the curved end plate and the plug-in plate. A comparison of the equivalent peak stresses in Weld Toe 1 and Weld Toe 2 showed that the stress concentrations in Weld Toe 1 were obviously greater than those in Weld Toe 2. The maximum equivalent peak stress of Weld Toe 1 was 378 MPa, located 100.0 mm from the starting point along the stress path. Therefore, the fatigue crack initiation sites in the variable-section supports with right-angle curved end plates were 100.0 mm from the starting point.
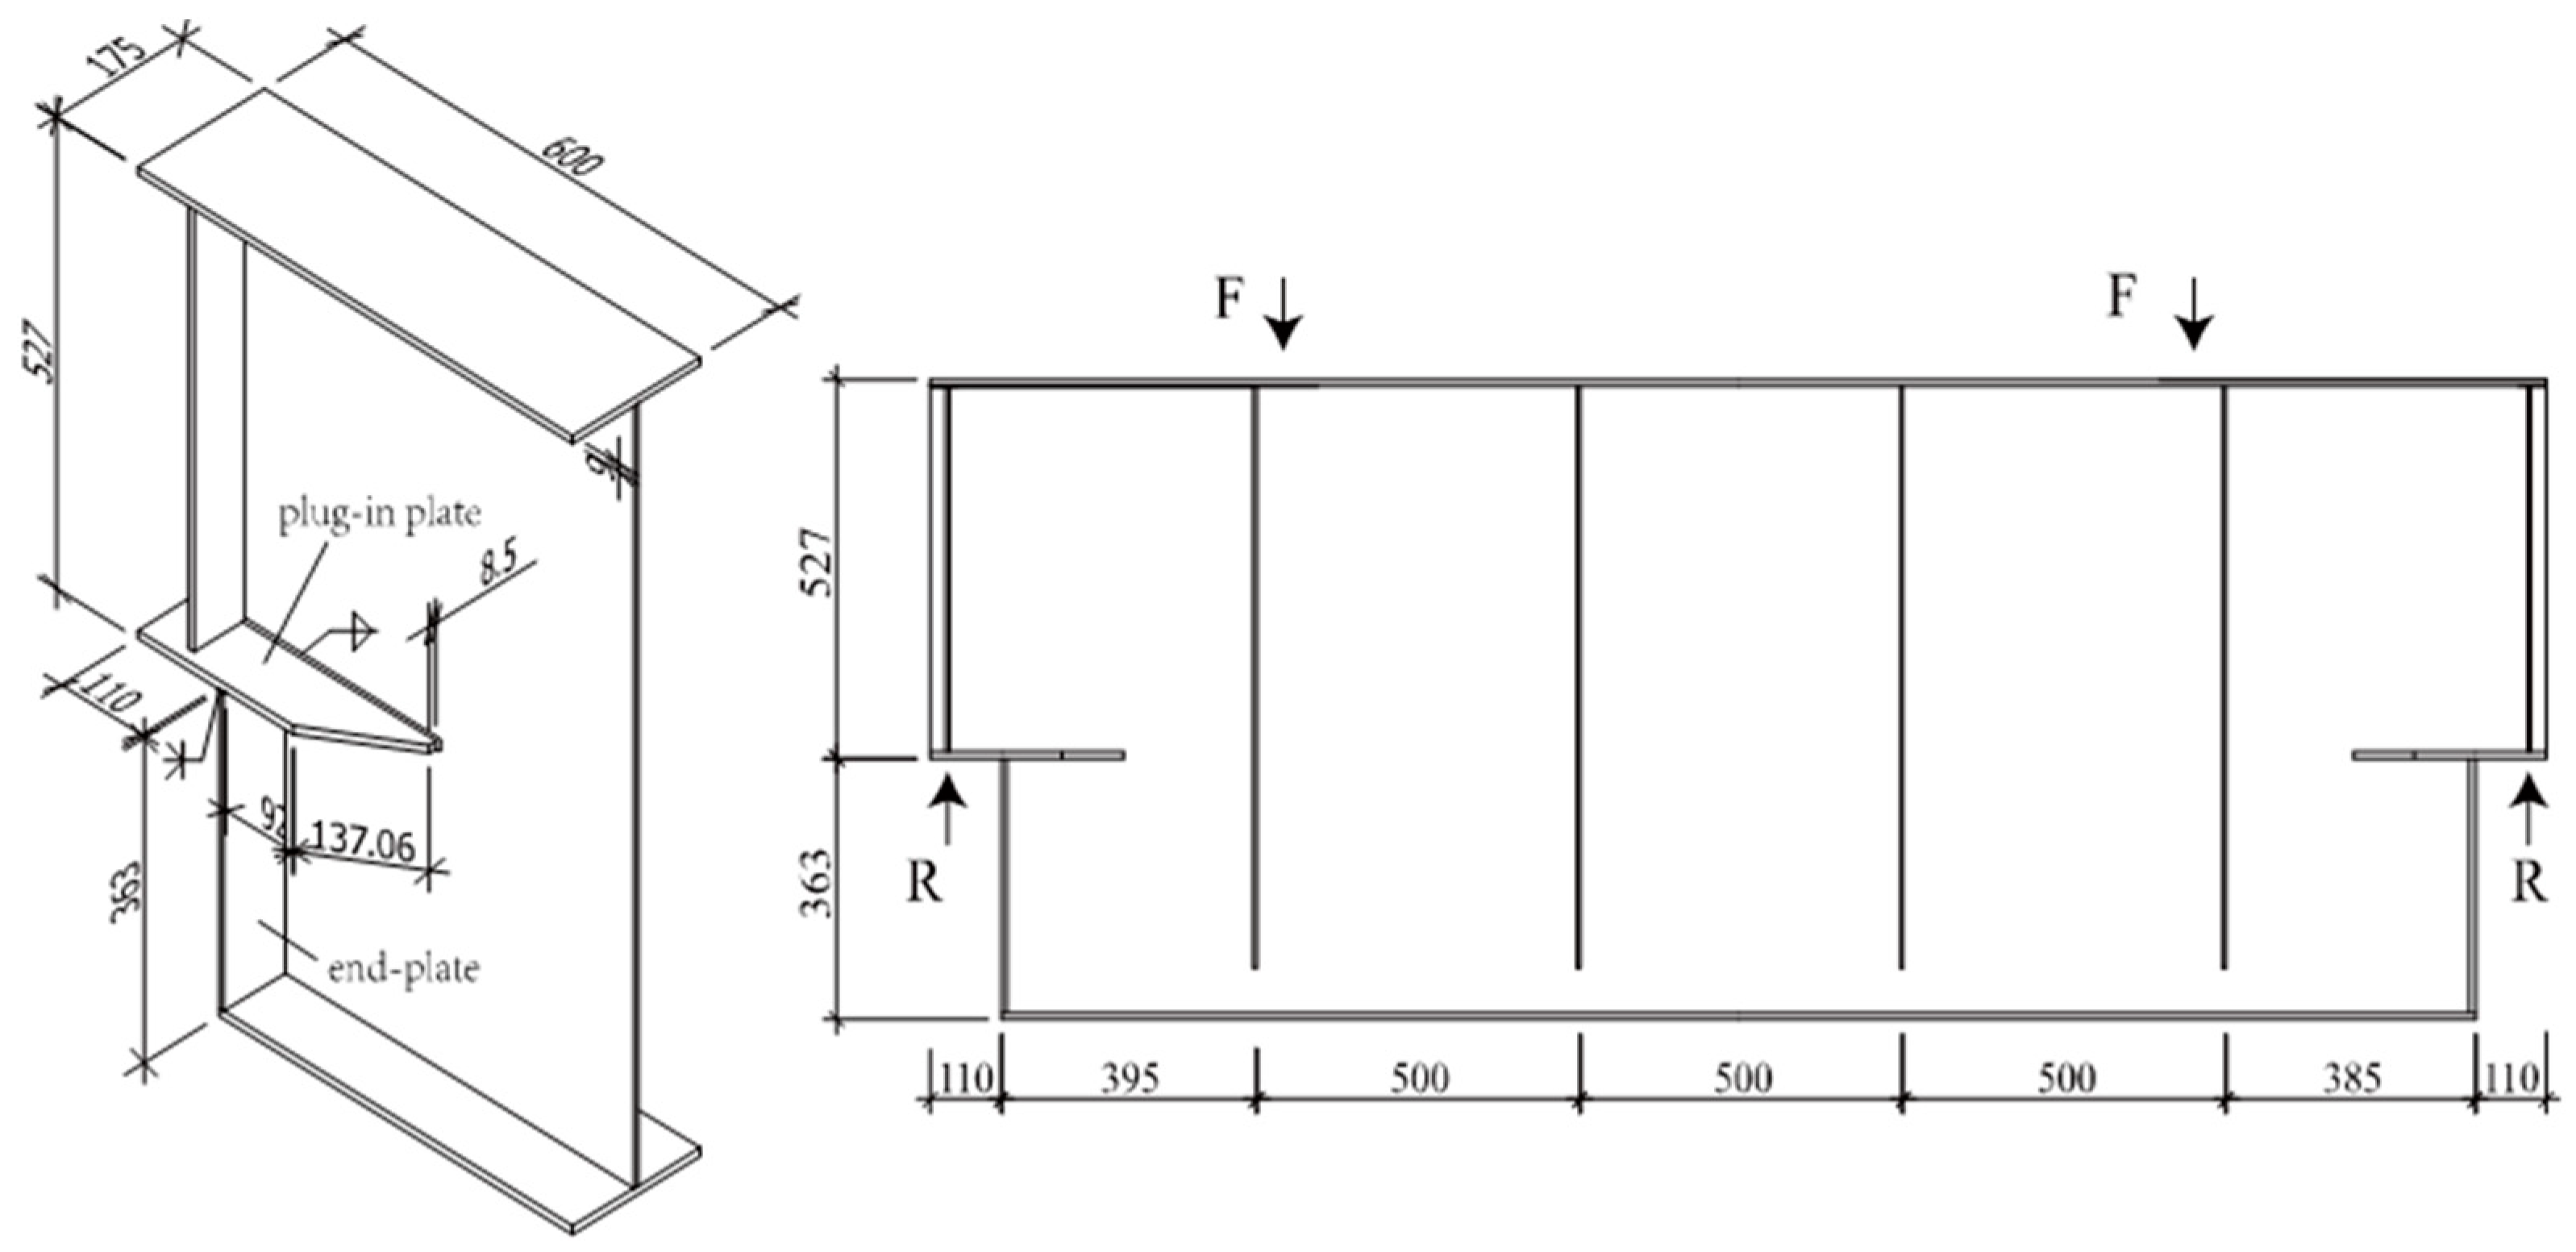
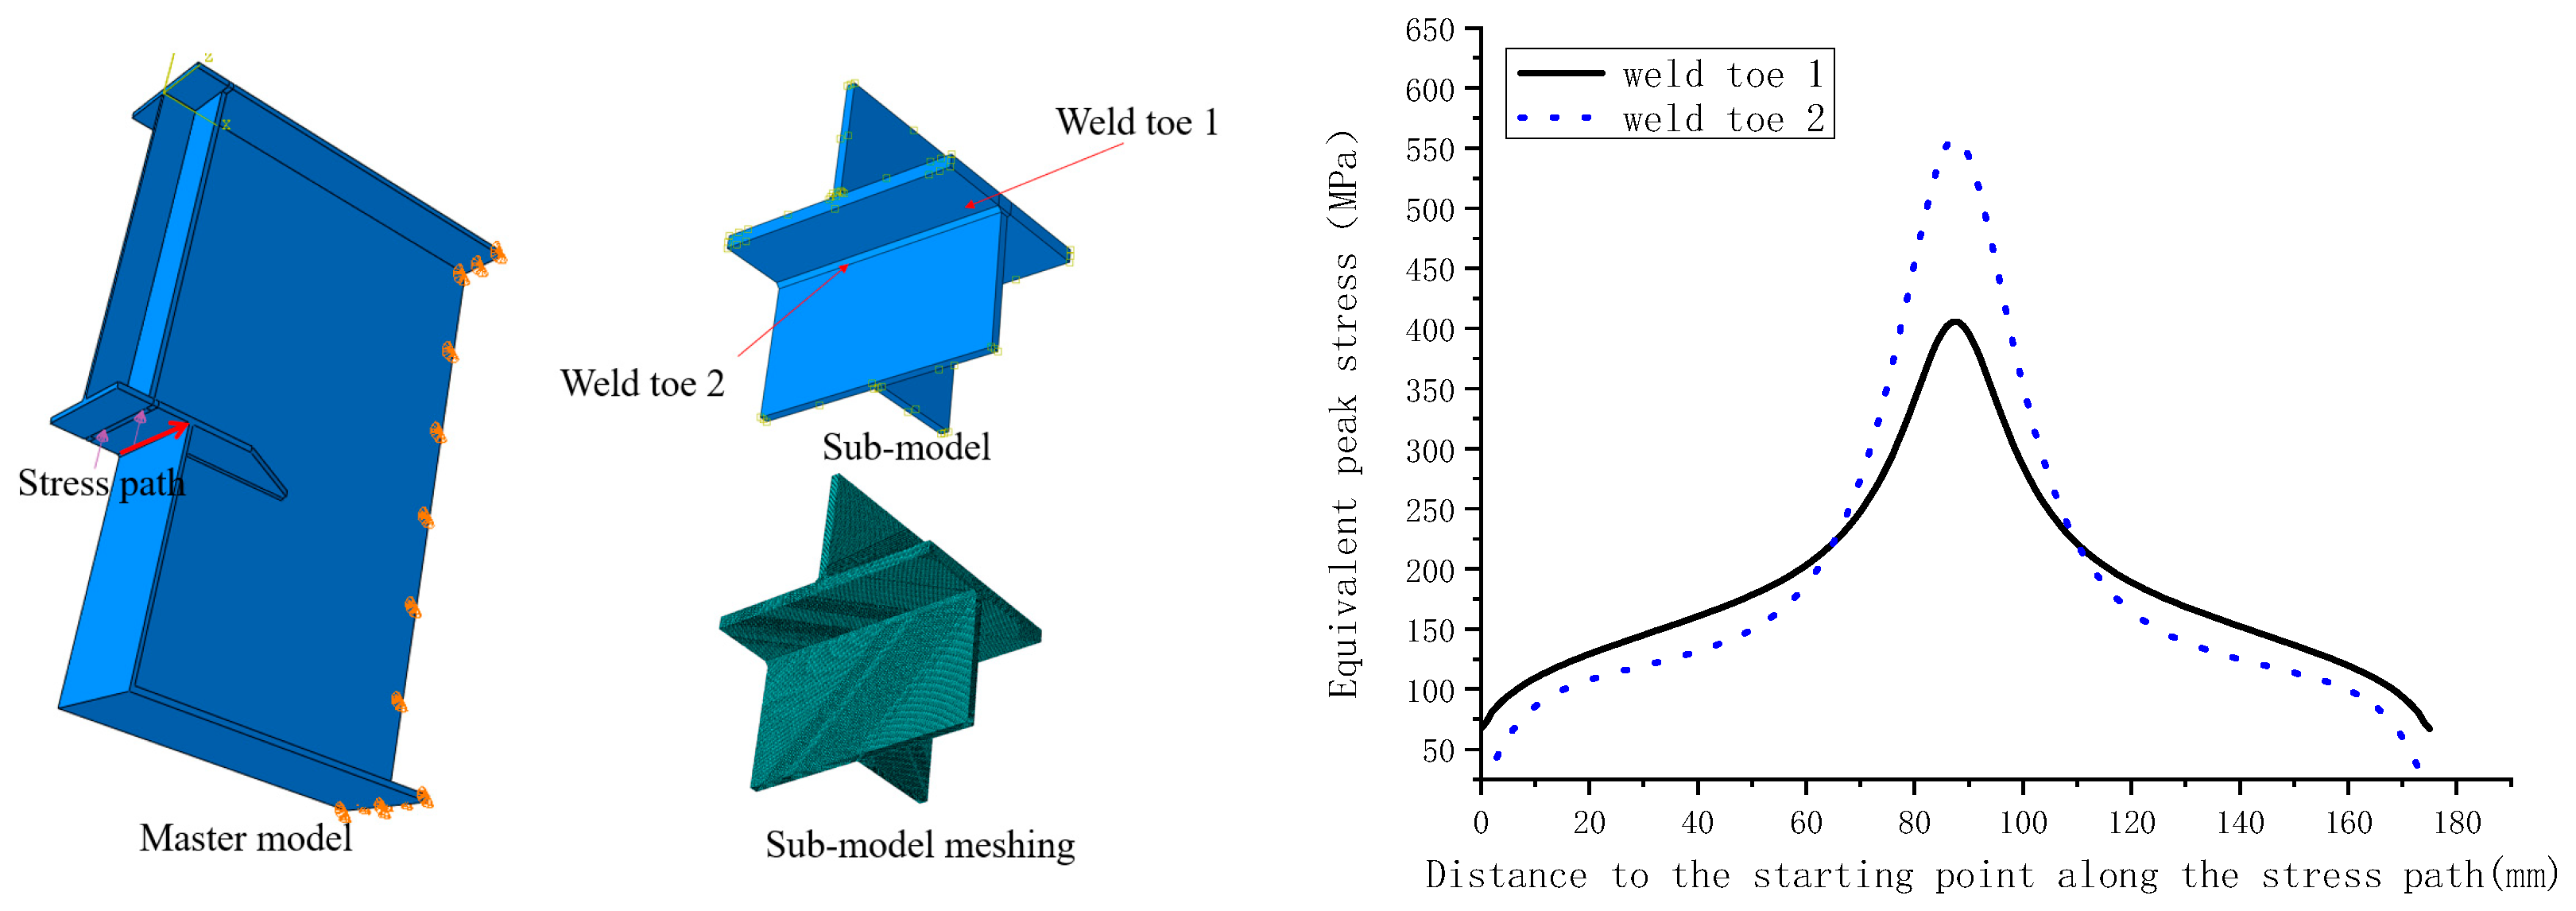
For the variable-section supports with right-angle end plates, the applied vertical support reaction at the support was 157.5 kN. Using the same method as that described above, the equivalent peak stresses in the two weld toes of the weld between the end plate and the plug-in plate were calculated. The finite element analysis model, the stress path, and the calculation results are shown in Figure 18. The calculation results showed that there were large stress concentrations in the weld between the end plate and the plug-in plate. A comparison of the equivalent peak stresses in Weld Toe 1 and Weld Toe 2 showed that the stress concentrations in Weld Toe 2 were obviously greater than those in Weld Toe 1. The maximum equivalent peak stress in Weld Toe 2 was 557 MPa, located 87.5 mm from the starting point along the stress path. Therefore, the fatigue crack initiation sites in the variable-section supports with right-angle end plates were 87.5 mm from the starting point.
All calculation results and test results are summarized in Table 1, Table 2, Table 3 and Table 4, which show that the crack initiation sites in the fatigue tests were consistent with those predicted by the peak stress method. Therefore, the peak stress method can effectively predict the fatigue crack initiation sites in variable-section supports subjected to Mode I + II loading conditions.

6. Comparison between Experimental Results and Design Fatigue Curves

The design curves in Figure 4 and the experimental results were in good agreement as shown in Figure 19. Most of the test results were within the scatter band, which was unaffected by the geometry of the variable-section supports, and all test data were above the lower limit of the design curve. Therefore, using this curve for fatigue life evaluation for different variable-section supports will yield relatively reliable results.

7. Results

Based on the peak stress method, the fatigue performance of crane runway girder variable-section supports was studied in this paper. By comparing and analyzing the test results and calculation results, the following conclusions are drawn.
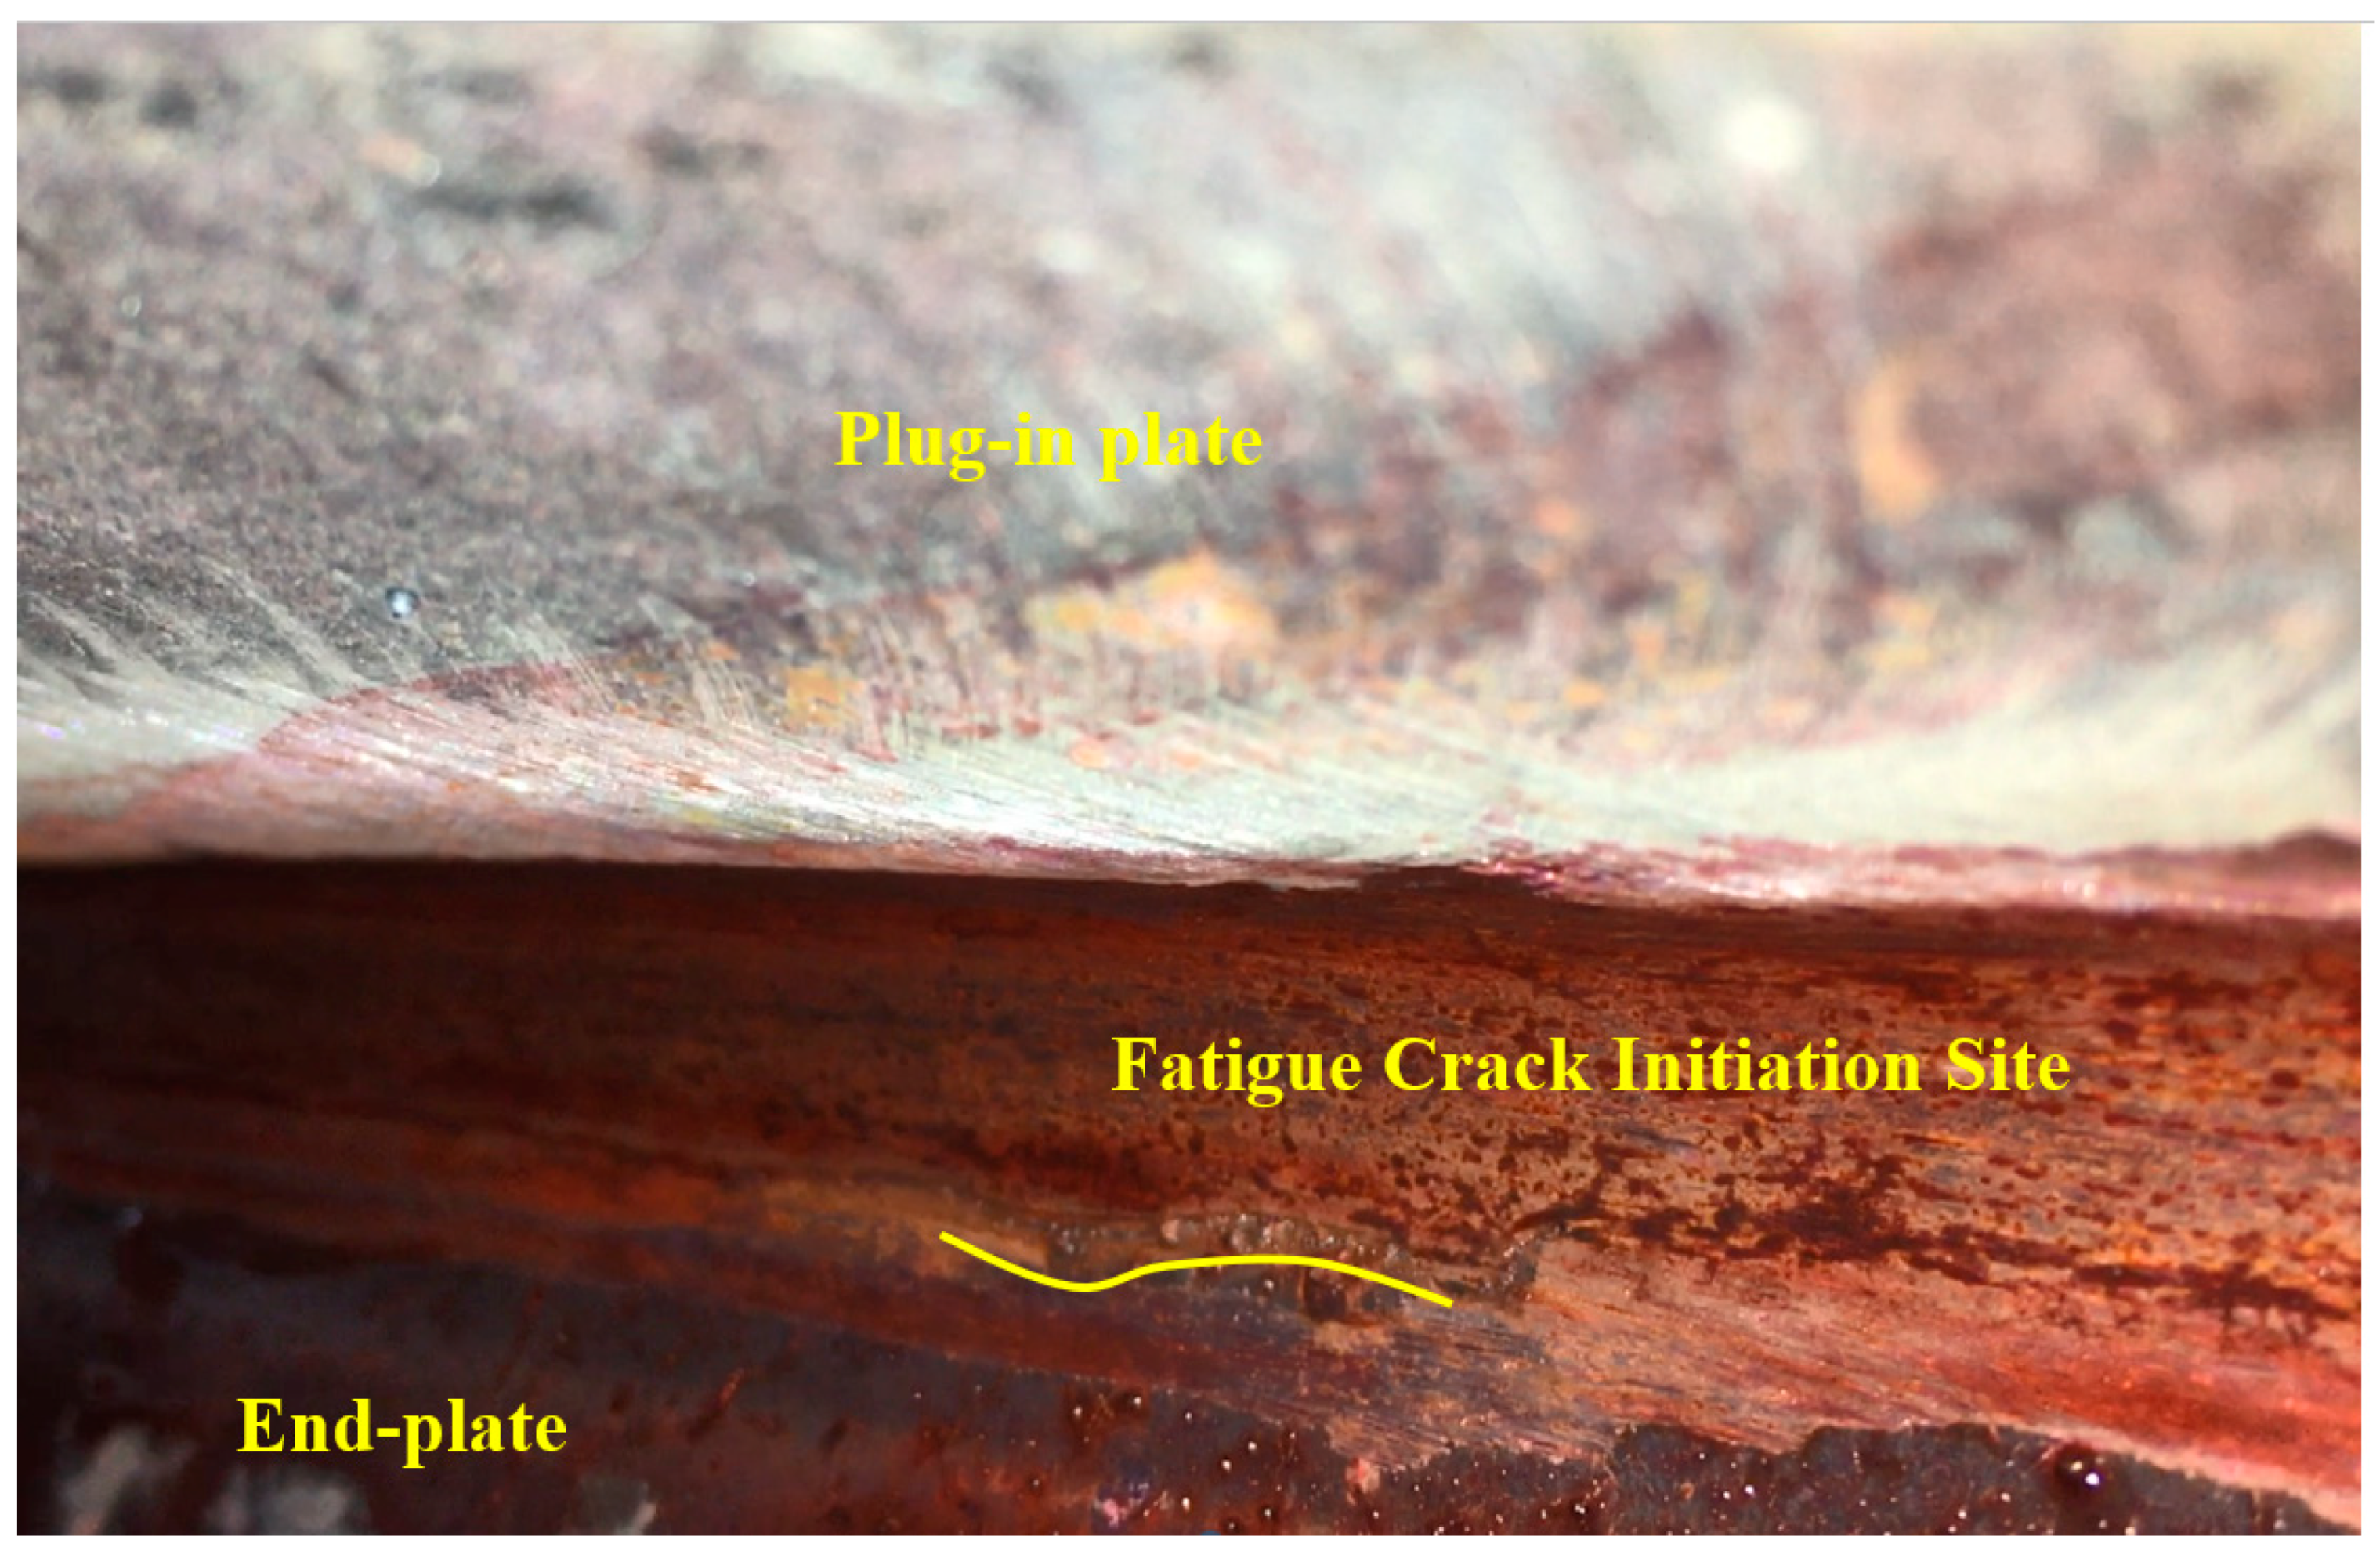
(1) The fatigue crack initiation sites in the variable-section supports with R-plates and three-web plates were in the weld root between the lateral web and the R-plate. The fatigue crack initiation sites in the variable-section supports with R-plates were located at the weld toe located on the web of the weld between the web and the R-plate. The fatigue crack initiation sites in the variable-section supports with right-angle curved end plates and the variable-section supports with right-angle end plates were located at the weld toe of the weld between the plug-in plate and the end plate.
(2) The peak stress method could effectively predict the fatigue crack initiation sites in the variable-section supports, and the S-N according to the peak stress method is suitable for various types of variable-section supports subjected to Mode I + II loading conditions.

Author Contributions

Funding acquisition, X.Z.; Formal analysis, X.Z.; Investigation, X.Z. and K.X.; Supervision, K.X.; Writing—original draft, N.J.; writing—review and editing, X.Z. and N.J. All authors have read and agreed to the published version of the manuscript.

Funding

The authors sincerely thank the financial support from the National Key R&D Program of China (2021YFF0501002). We are also grateful for the financial support of the National Natural Science Foundation of China (NO.52192664) and China Postdoctoral Science Foundation (Grant No. 2022M720416).

Data Availability Statement

Data is contained within the article.

Conflicts of Interest

The authors declare no conflict of interest.

References

  1. Zheng, T.; Lu, T. Fatigue performance comparative analysis for several steel crane beams with variable cross section. J. Chongqing Jianzhu Univ. 1996, 4, 79–86. [Google Scholar]
  2. Zhao, X.; Yun, H.; Chang, H.; Ji, Z. Fatigue strength of right-angle mutational steel crane beam with curved end plate. Ind. Constr. 2017, 47, 155–159. [Google Scholar]
  3. Zhao, X.; Xing, K.; Chang, H.; Yang, D. Research on the Fatigue strength of right-angle mutational steel crane beams. Ind. Constr. 2019, 49, 166–169. [Google Scholar]
  4. Tong, X.; Tuan, C.Y.; Yang, J.; Zhang, J.; Yue, Q. Fatigue Strength of End-Coped Crane Runway Girders. J. Struct. Eng. 2007, 133, 1783–1791. [Google Scholar] [CrossRef]
  5. Caglayan, O.; Ozakgul, K.; Tezer, O.; Uzgider, E. Fatigue life prediction of existing crane runway girders. J. Constr. Steel Res. 2010, 66, 1164–1173. [Google Scholar] [CrossRef]
  6. Yang, Q. Design and analysis of crane girder replacement for heavy steel structures plant. Steel Constr. 2018, 33, 62–65. [Google Scholar] [CrossRef]
  7. Hobbacher, A.F. Recommendations For Fatigue Design Of Welded Joints And Components. In International Institute of Welding Collection; Springer: Cham, Switzerland, 2016. [Google Scholar]
  8. Standardization, E.C.F. Eurocode 3: Design of Steel Structures—Part 1–9: Fatigue, in EN 1993-1-9. 2005. Available online: https://www.academia.edu/30074852/Eurocode_3_Design_of_steel_structures_Part_1_9_Fatigue_Incorporating_Corrigenda_Nos_1_and_2 (accessed on 29 November 2022).
  9. DIN 15018-1-1984; Cranes—Steel Structures, Verifications and Analyses, in Berlin. Germany. 1984. Available online: https://global.ihs.com/doc_detail.cfm?document_name=DIN%2015018%2D1&item_s_key=00027661 (accessed on 29 November 2022).
  10. Meneghetti, G.; Campagnolo, A. The Peak Stress Method to assess the fatigue strength of welded joints using linear elastic finite element analyses. Procedia Eng. 2018, 213, 392–402. [Google Scholar] [CrossRef]
  11. Meneghetti, G.; Atzori, B.; Manara, G. The Peak Stress Method applied to fatigue assessments of steel tubular welded joints subject to mode-I loading. Eng. Fract. Mech. 2010, 77, 2100–2114. [Google Scholar] [CrossRef]
  12. Radaj, D. State-of-the-art review on the local strain energy density concept and its relation to the J-integral and peak stress method. Fatigue Fract. Eng. Mater. Struct. 2015, 38, 2–28. [Google Scholar] [CrossRef]
  13. Meneghetti, G.; Guzzella, C. The peak stress method to estimate the mode I notch stress intensity factor in welded joints using three-dimensional finite element models. Eng. Fract. Mech. 2014, 115, 154–171. [Google Scholar] [CrossRef]
  14. Meneghetti, G.; Campagnolo, A.; Rigon, D. Multiaxial fatigue strength assessment of welded joints using the Peak Stress Method—Part II: Application to structural steel joints. Int. J. Fatigue 2017, 101, 343–362. [Google Scholar] [CrossRef]
  15. GB50017-2017; Standard for Design of Steel Structures. Beijing, China. 2017. Available online: https://www.chinesestandard.net/PDF.aspx/GB50017-2017 (accessed on 29 November 2022).
  16. ANSI/AISC 360-10; Specification for Structural Steel Buildings, in Chicago, American. 2010. Available online: https://www.aisc.org/globalassets/aisc/publications/standards/a360-16-spec-and-commentary.pdf (accessed on 29 November 2022).
  17. Lazzarin, P.; Livieri, P.; Berto, F.; Zappalorto, M. Local strain energy density and fatigue strength of welded joints under uniaxial and multiaxial loading. Eng. Fract. Mech. 2008, 75, 1875–1889. [Google Scholar] [CrossRef]
  18. Meneghetti, G.; Lazzarin, P. Significance of the elastic peak stress evaluated by FE analyses at the point of singularity of sharp V-notched components. Fatigue Fract. Eng. Mater. Struct. 2007, 30, 95–106. [Google Scholar] [CrossRef]
  19. Meneghetti, G. The use of peak stresses for fatigue strength assessments of welded lap joints and cover plates with toe and root failures. Eng. Fract. Mech. 2012, 89, 40–51. [Google Scholar] [CrossRef]
  20. Meneghetti, G. The peak stress method for fatigue strength assessment of tube-to-flange welded joints under torsion loading. Weld. World 2013, 57, 265–275. [Google Scholar] [CrossRef]
  21. GB50205-2001; Code for Acceptance of Construction Quality of Steel Structures, in Beijing, China. 2001. Available online: https://www.chinesestandard.net/PDF.aspx/GB50205-2001 (accessed on 29 November 2022).
Figure 1. Fatigue fracture of a variable-section support of a steel crane girder.
Buildings 13 00108 g001
Figure 2. Three variable-section supports.
Buildings 13 00108 g002
Figure 3. Definition of peak stresses assessed in weld toe and weld root.
Buildings 13 00108 g003
Figure 4. Steel design scatter band for Mode I + II loading conditions [10].
Buildings 13 00108 g004
Figure 5. Dimensions and the most unfavorable load conditions of the variable-section supports with R-plates and three-web plates.
Buildings 13 00108 g005
Figure 6. Dimensions of the variable-section support specimens with R-plates and three-web plates.
Buildings 13 00108 g006
Figure 7. Maximum primary stress difference around R-plate and web weld between prototype and scale model.
Buildings 13 00108 g007
Figure 8. Cracks originated at the weld root and penetrated through the weld.
Buildings 13 00108 g008
Figure 9. Dimensions of the variable-section support specimens with R-plates.
Buildings 13 00108 g009
Figure 10. Cracks originated at the weld toe on the web.
Buildings 13 00108 g010
Figure 11. Dimensions of the variable-section support specimens with right-angle curved end plates.
Buildings 13 00108 g011
Figure 12. Cracks originated at the weld toe on the plug-in plate.
Buildings 13 00108 g012
Figure 13. Dimensions of the variable-section supports with right-angle end plates.
Buildings 13 00108 g013
Figure 14. Cracks originated at the weld toe on the end plate.
Buildings 13 00108 g014
Figure 15. Peak stress analysis model and results for the variable-section supports with R-plates and three-web plates.
Buildings 13 00108 g015
Figure 16. Peak stress analysis model and results for the variable-section supports with R-plates.
Buildings 13 00108 g016
Figure 17. Peak stress analysis model and results for the variable-section supports with right-angle curved end plates.
Buildings 13 00108 g017
Figure 18. Peak stress analysis model and results for the variable-section supports with right-angle end plates.
Buildings 13 00108 g018
Figure 19. Comparison of fatigue strength derived from the proposed scatter band reported in Figure 3 and experimental results of variable-section supports. The scatter band is equal to the mean value ± two standard deviations.
Buildings 13 00108 g019
Table 1. Fatigue test results of the variable-section supports with R-plates and three-web plates.
Specimen DesignationMaximum Reaction Force (kN)Maximum Equivalent Peak Stress (MPa)Nominal Fatigue Life a (×10,000)Crack Initiation Site c (mm)
Fatigue TestPrediction
YH-50-1225309125 (108) b90 (94) b92
YH-50-222530996 (95) b89 (84) b92
YH-45-1202.5278230 (232) b88 (93) b92
YH-40-1180247265 (297) b92 (91) b92
a Nominal fatigue life refers to the number of cycles associated with a 20 mm crack size. b Values in parentheses represent the nominal fatigue life at the other coped end. c Values represent the actual distance from the starting point along the stress path.
Table 2. Fatigue test results of the variable-section supports with R-plates.
Specimen DesignationMaximum Reaction Force (kN)Maximum Equivalent Peak Stress (MPa)Nominal Fatigue Life a (×10,000)Crack Initiation Site c (mm)
Fatigue TestPrediction
L28-124533667.4 (77.3) b98 (97) b98
L28-2172236124 (131) b90 (95) b98
L28-422130340.5 (58.1) b97 (93) b98
L28-6147201282 (>228) b10298
L28-733045218.610598
a Nominal fatigue life refers to the number of cycles associated with a 20 mm crack size. b Values in parentheses represent the nominal fatigue life at the other coped end. c Values represent the actual distance from the starting point along the stress path.
Table 3. Fatigue test results of the variable-section supports with right-angle curved end plates.
Specimen DesignationMaximum Reaction Force (kN)Maximum Equivalent Peak Stress (MPa)Nominal Fatigue Life a (×10,000)Crack Initiation Site b (mm)
Fatigue TestPrediction
L-12002751729598
L-22002751989298
L-322530915810298
L-42253091849598
L-5250344739398
L-62503448711098
L-72753786310598
L-8275378599798
a Nominal fatigue life refers to the number of cycles associated with a 20 mm crack size. b Values represent the actual distance from the starting point along the stress path.
Table 4. Fatigue test results of the variable-section supports with right-angle end plates.
Specimen DesignationMaximum Reaction Force (kN)Maximum Equivalent Peak Stress (MPa)Nominal Fatigue Life a (×10,000)Crack Initiation Site c (mm)
Fatigue TestPrediction
ZL-112539882 (100) b88 (95) b87.5
ZL-212539893 (109) b85 (100) b87.5
ZL-315047742 (>42) b8687.5
ZL-415047730 (>30) b9187.5
ZL-517555720 (60) b9087.5
ZL-617555737 (35) b8887.5
a Nominal fatigue life refers to the number of cycles associated with a 20 mm crack size. b Values in parentheses represent the nominal fatigue life at the other coped end. c Values represent the actual distance from the starting point along the stress path.
Disclaimer/Publisher’s Note: The statements, opinions and data contained in all publications are solely those of the individual author(s) and contributor(s) and not of MDPI and/or the editor(s). MDPI and/or the editor(s) disclaim responsibility for any injury to people or property resulting from any ideas, methods, instructions or products referred to in the content.

