Article

Multizone Modeling of Airborne SARS-CoV-2 Quanta Transmission and Infection Mitigation Strategies in Office, Hotel, Retail, and School Buildings

by
Shujie Yan
1,
Liangzhu (Leon) Wang
1,*,
Michael J. Birnkrant
2,
Zhiqiang (John) Zhai
3,* and
Shelly L. Miller
4,*
1
Department of Building, Civil & Environmental Engineering, Concordia University, 1455 de Maisonneuve Blvd. West, Montreal, QC H3G 1M8, Canada
2
Carrier Corporation, 6304 Thompson Road, East Syracuse, NY 13057, USA
3
Department of Civil, Environmental and Architectural Engineering, University of Colorado Boulder, UCB 428, 1111 Engineering Dr., Boulder, CO 80309, USA
4
Department of Mechanical Engineering, University of Colorado Boulder, UCB 427, 1111 Engineering Dr., Boulder, CO 80309, USA
*
Authors to whom correspondence should be addressed.
Buildings 2023, 13(1), 102; https://doi.org/10.3390/buildings13010102
Submission received: 21 October 2022 / Revised: 22 November 2022 / Accepted: 23 December 2022 / Published: 31 December 2022
(This article belongs to the Topic Advanced Ventilation in and beyond the COVID-19 Pandemic)

Abstract

:
Airborne transmission of SARS-CoV-2 mostly occurs indoors, and effective mitigation strategies for specific building types are needed. Most guidance provided during the pandemic focused on general strategies that may not be applicable for all buildings. A systematic evaluation of infection risk mitigation strategies for different public and commercial buildings would facilitate their reopening process as well as post-pandemic operation. This study evaluates engineering mitigation strategies for five selected US Department of Energy prototype commercial buildings (i.e., Medium Office, Large Office, Small Hotel, Stand-Alone Retail, and Secondary School). The evaluation applied the multizone airflow and contaminant simulation software, CONTAM, with a newly developed CONTAM-quanta approach for infection risk assessment. The zone-to-zone quanta transmission and quanta fate were analyzed. The effectiveness of mechanical ventilation, and in-duct and in-room air treatment mitigation strategies were evaluated and compared. The efficacy of mitigation strategies was evaluated for full, 75%, 50% and 25% of design occupancy of these buildings under no-mask and mask-wearing conditions. Results suggested that for small spaces, in-duct air treatment would be insufficient for mitigating infection risks and additional in-room treatment devices would be needed. To avoid assessing mitigation strategies by simulating every building configuration, correlations of individual infection risk as a function of building mitigation parameters were developed upon extensive parametric studies.

1. Introduction

The COVID-19 pandemic has highlighted the importance of airborne respiratory infection control in indoor environments [1]. Insufficient ventilation and improper operations in crowded public buildings often lead to outbreaks and superspreading events, which raised significant concerns about occupants’ indoor exposure. Shutdowns were implemented for public shared places in many countries, and individuals around the world were forced to “stay at home”. Vaccines are more available, and many countries are under substantial socio-economic pressures, which leads to a return to pre-pandemic life and reopening more public spaces. Recently, many countries have passed the peak of the wave of the new SARS-CoV-2 variants [2], which promotes the easing of restrictions and the turning of policies to the long-term management of COVID-19. In the US, many states have lifted capacity restrictions on indoor activities, including for restaurants, schools, and offices [3]. Meanwhile, large indoor gatherings have begun to be permitted. Capacity limits in Canada have also been lifted in all indoor public settings [4]. Similar actions and policies were also implemented in England and European countries [5]. The reopening of public spaces while at the same time reducing risk of transmission poses challenges [6]. Engineering mitigation strategies could serve as an efficient way of reducing the airborne transmission of pathogens of viruses such as SARS-CoV-2, measles, tuberculosis, chickenpox, influenza, etc., in public spaces [7]. The virus-laden aerosols in the air could be diluted via outdoor air, trapped by filters, or disinfected by germicidal ultraviolet light (GUV). Attention should thus be paid to understand how much outdoor ventilation air is sufficient to control airborne disease transmission in different types of buildings, what air treatment options should be implemented, and how to control infection risks with adequate measures, especially in the current post-pandemic era.
Risk assessment is an effective way of identifying the effectiveness of ventilation strategies on controlling the infection risks. Since the outbreak of the COVID-19 pandemic, extensive efforts have been made to quantify the risk of SARS-CoV-2 transmission. The airborne quanta emission rate was evaluated for different conditions of viral load, respiratory, and activity levels [8], providing valuable input information of the classic Wells-Riley risk assessment models [9]. Indicators of infection risk were proposed to control the airborne transmission of disease indoors [10]. Dai and Zhao [11] evaluated the influence of air change rate on infection risks of a bus, classroom, aircraft cabin, and office. Shen et al. [12] investigated the effectiveness of different mitigation strategies in indoor areas such as long-term care facilities, schools, meat plants, buses, taxis, etc. Additionally, risks of SARS-CoV-2 infection were evaluated in classrooms under different speaking, class duration, and voice modulation scenarios [13]. A simulation study was conducted to compare the risk reduction effectiveness of long-range airborne exposure of SARS-CoV-2 between displacement and mixed-mode ventilation in a small office [14,15]. Based on the assumption that aerosols are uniformly distributed in the room, these studies considered the changes in ventilation rate, exposure time, quanta generation rate, and volume for different indoor environments; their evaluations, however, only focus on single-zone scenarios without considering buildings with multiple floors and rooms where zone-to-zone transmission could happen.
Mitigation strategies that have been proposed for buildings include ventilation, filtration, GUV, and personal protective equipment. Many studies have focused on health-care facilities [16] and/or single-zone building situations, whereas relevant investigations for multizone commercial buildings are limited [17,18,19,20]. ASHRAE and REHVA have issued their guidelines in the COVID-19 pandemic context [21,22]. General recommendations have been made for heating, ventilating, and air-conditioning (HVAC) operations, outdoor air settings, and filters [23]. However, these recommendations may not provide performance-based information to inform mitigation strategies in a specific building type. The most effective mitigation strategy may vary significantly for different types of buildings, configurations, occupancy schedules, HVAC systems, and operation settings. Multizone aerosol transmission patterns should be considered when proposing detailed mitigation strategies for a specific type of building and/or specific zones in a building, especially during the reopening stage of commercial buildings.
Multizone building simulations enable a deeper insight into aerosol transmission potential in real buildings, and the influence of different mitigation strategies could be considered systematically within a whole building context. In addition to considering the building leakage, multizone simulations would also enable the evaluation of average and transient contaminant concentrations during occupants’ exposure, and therefore help evaluate dynamic infection risks. Multizone evaluations of airflow and contaminant dispersion were proposed as early as the 1980s [24,25]. Based on the concept of an airflow network, a building is comprised of an assembly of interconnected flow elements in a comprehensive process of mass transport both inside and outside of a building and thus driving the dispersal of contaminants throughout the building. In 2004, this theory was used to analyze the virus-laden aerosol transmission between floors through door and window leakages of a SARS outbreak in Hong Kong [26]. Later in 2013, a multizone contaminant transport simulation was performed in a hospital building to evaluate existing air-cleaning strategies; the importance of the building leakage and actual building operations was highlighted [19].
The objective of this study was to investigate how engineering mitigation strategies, layered with wearing masks, impact potential long-range SARS-CoV-2 aerosol transmission risks in typical commercial buildings. The multizone airflow and contaminant simulation software, CONTAM, developed by the US National Institute of Standards and Technology, was used for the modeling and analysis [27,28,29]. Aerosol dispersion was simulated, and infection transmission risk was assessed for five prototype commercial buildings (Medium Office, Large Office, Stand Alone Retail, Small Hotel, and Secondary School). These building models were developed with detailed building plans, typical HVAC schedules, and reasonable maximum occupancy for each room [30]. This study applied a novel approach—CONTAM-quanta [31] to assess the multizone SARS-CoV-2 infection risks based on the Wells–Riley model [9,32] for estimating infection risks. A correlation was developed based on multiple CONTAM whole-building simulations of the DOE prototype buildings to better understand the fundamental factors governing the relation between the airborne transmission of SARS-CoV-2 risk and mitigation measures in multizone buildings.

2. Methodologies

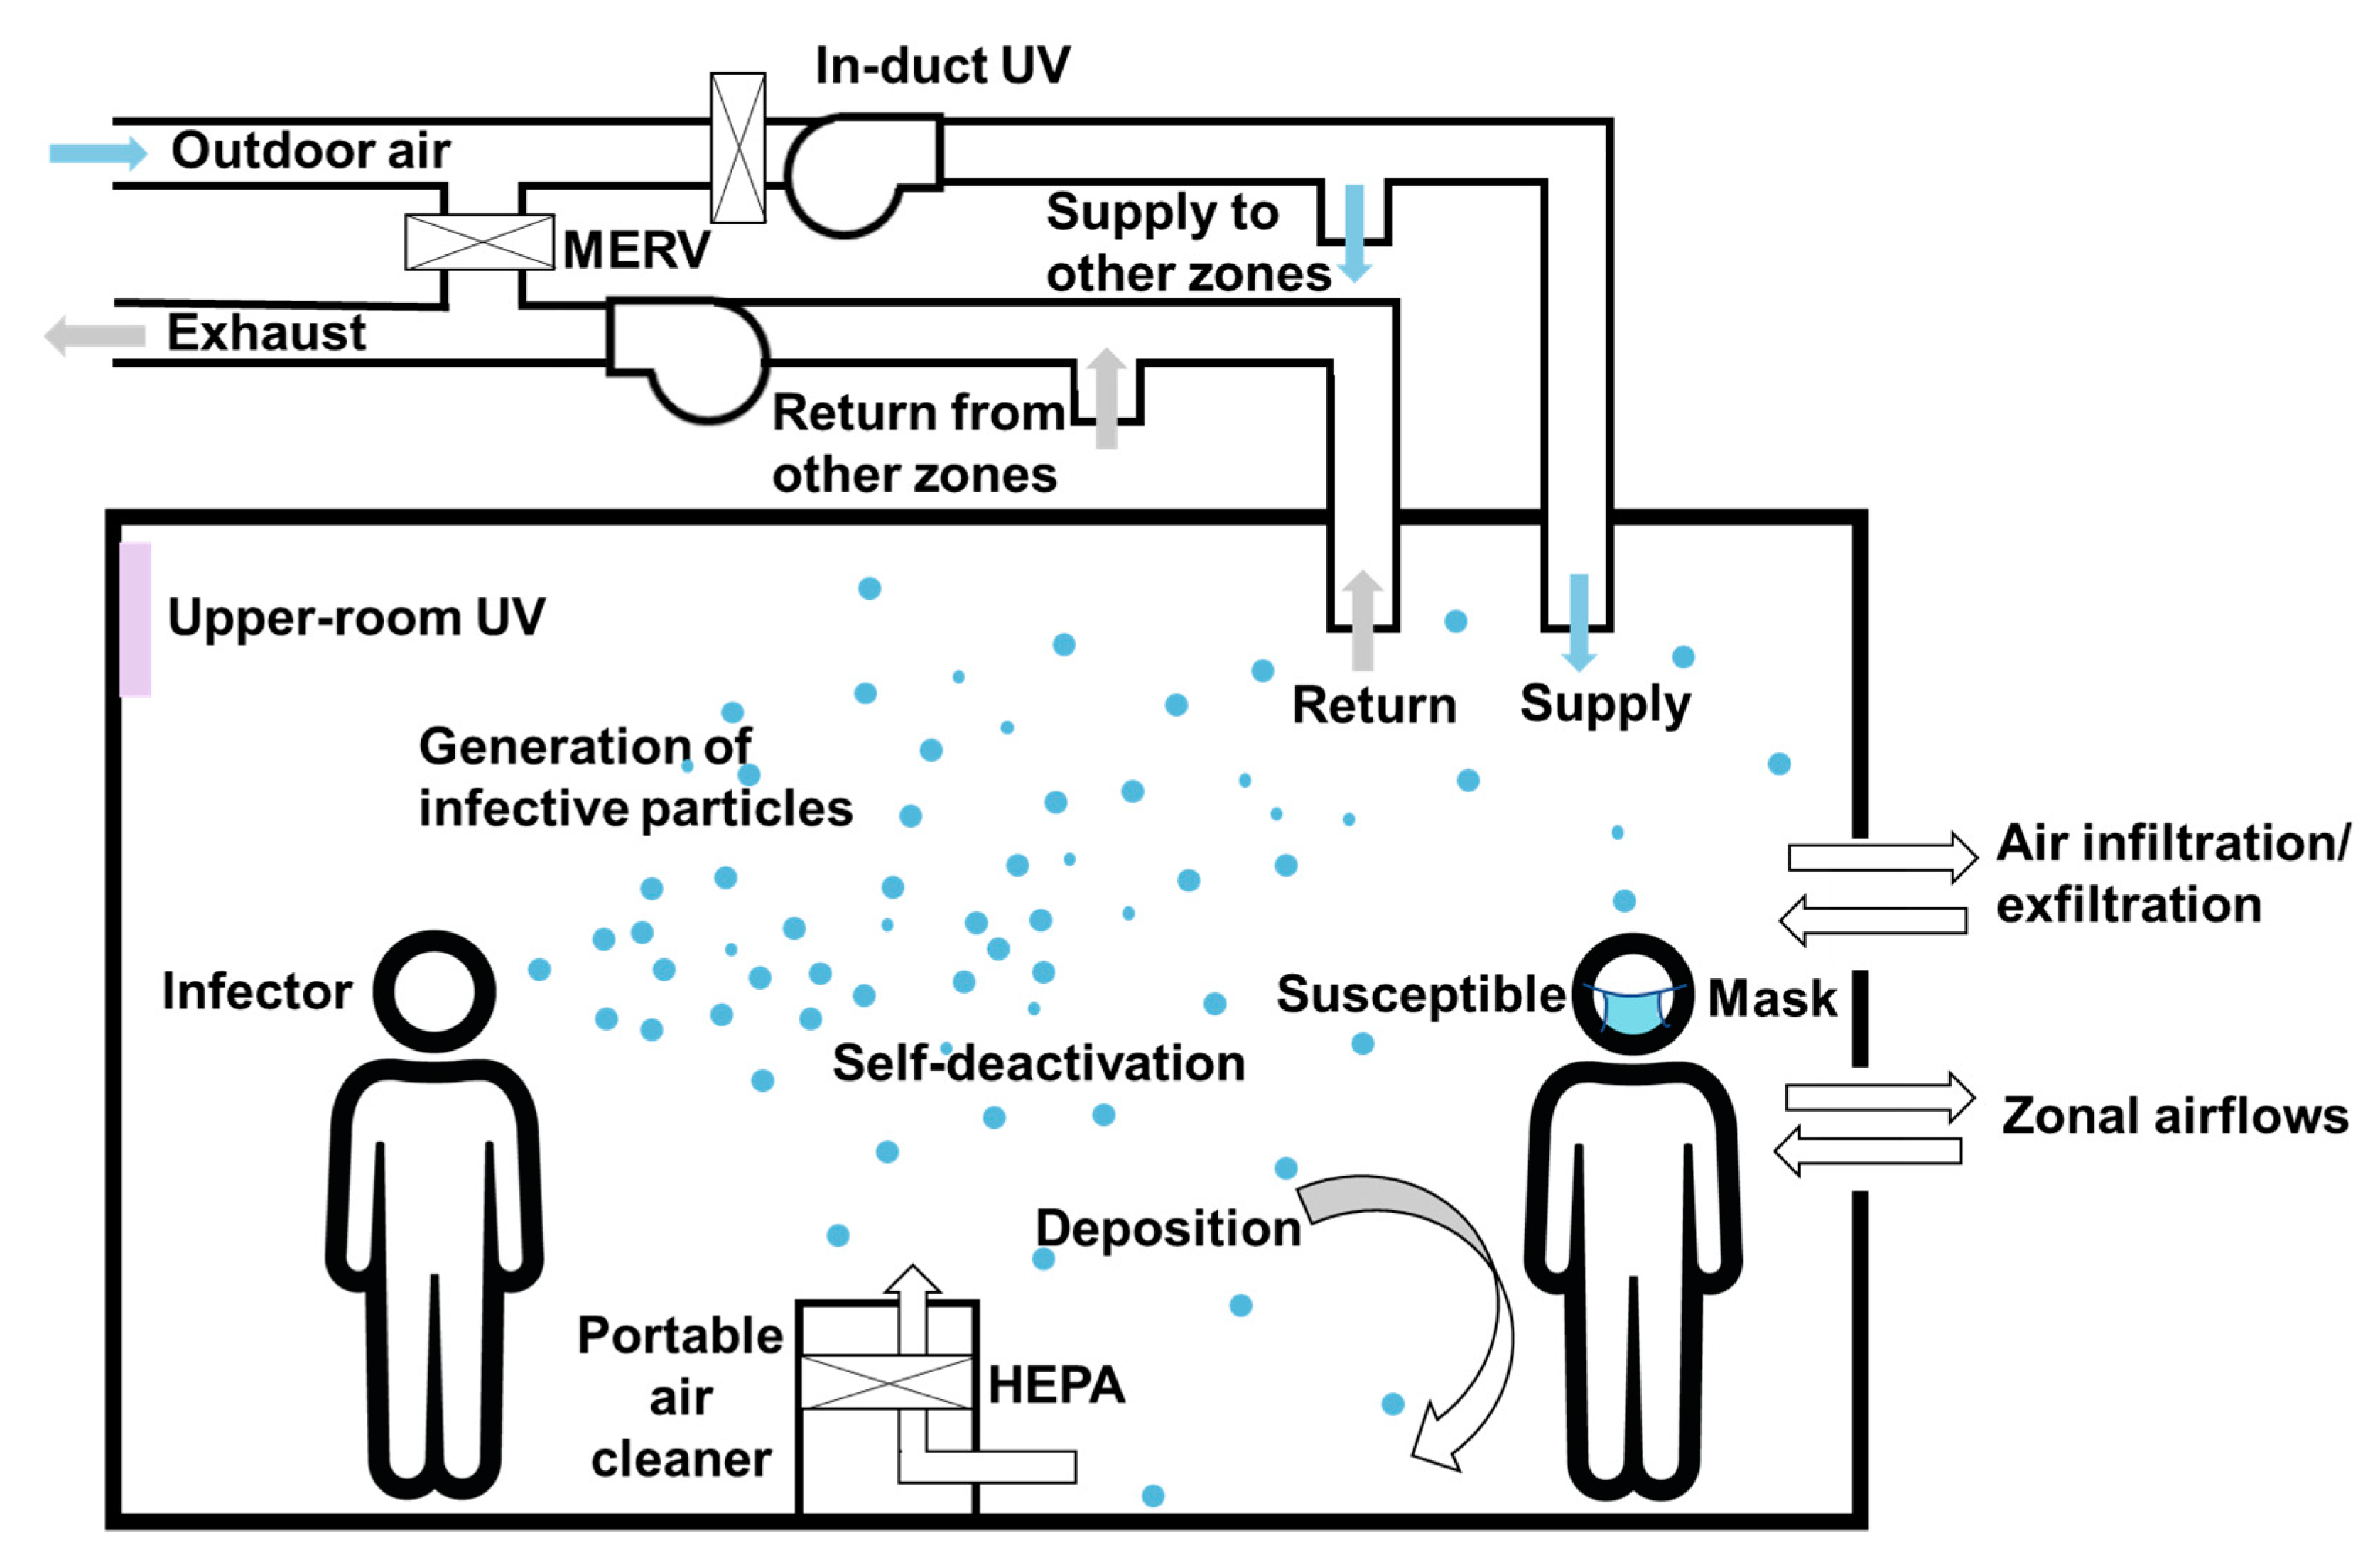
2.1. The CONTAM-Quanta Approach for Evaluating Infection Risks

In this study, the concentration of SARS-CoV-2 aerosol was modeled in the CONTAM program as “quanta”, where the “quanta” is defined as a contaminant species. This approach combines the CONTAM multizonal modeling program with the classic Wells-Riley model for infection risks predictions [32]. This modeling method is detailed in our previous study [31] using a large office scenario, and named the CONTAM-quanta approach. The concept of “quanta” and Wells–Riley model will be introduced later in this section. The quanta concentration in different zones can be calculated, evaluating the combined effects of quanta generation and removal within the zone. The acceptable infection risk was determined using the contagious potential defined as C/I, which is the ratio of new infection cases C to the number of infectors I. An outbreak within the building could happen when C/I exceeds unity [9]. Thus, to avoid the possibility of community spreading in a building when I = 1, C/I < 1; in our study we assume one infector, and thus we require C < 1. The corresponding acceptable infection risk level is therefore P = C/S < 1/S, where S is the number of susceptible people.
The CONTAM models used in this study adopted the occupancy and outdoor air ventilation requirements that are employed in the corresponding EnergyPlus models of five DOE commercial prototype buildings [30]. Details of the methodology used in this study have been described in detail in a previous paper [28]. Mitigation strategies in multizone spaces are illustrated in Figure 1. Briefly using CONTAM, the occupant infection risk is determined by integrating the quanta concentration that the occupants are exposed to during their exposure period, which is expressed as:
E = t 1 t 2 C i ( t ) dt
The material balance of the quanta concentration is presented in Equation (2):
V dC i dt = ( 1 M exh ) G ( t ) + ( 1 η MERV ) ( 1 η UVduct ) Q rec C rec ( t ) + j = 1 n Q inf ,   j C j ( t ) ( Q r + Q lx + η ac Q ac + Q UVr + k = 1 s Q dep ,   k + Q dec + j = 1 n Q exf ,   j ) C i ( t )
The infiltration via the air leakage in CONTAM was calculated based on weather conditions and system induced pressures, using a power-law relationship:
Q inf , j = C D A L 1000 2 ρ ( Δ P r ) 0.5 n Δ P j , i n
E is the occupant exposure to contaminant C i . In this application of CONTAM, C i is the quanta concentration (quanta/m3); t is the exposure time; C rec is in the quanta concentration in the recirculation air (quanta/m3); G is the quanta generation rate from the infector (quanta/h); M exh is the outward protection effectiveness for masks; Qrec, Qr, Qlx, Qac, QUVr, Qdep, Qdec, Qinf,j, and Qexf,j are volumetric flow rates (m3/s) for different airflow or contaminant removal processes (supply, return, local exhaust, air cleaner, in-room GUV, deposition, decay or deactivation of the virus infectivity, infiltration for zone j, and exfiltration for zone j); η MERV is the efficiency of the MERV filters; η UVduct is the efficiency of the in-duct GUV;   η ac is the efficiency of the air- cleaner filters; CD is the flow discharge coefficient; AL is the effective air leakage area; Δ Pr is the reference pressure difference [Pa]; Δ Pj,i is the pressure difference between zone j and zone i [Pa]; and n is the flow exponent. The outdoor quanta concentration was assumed to be zero. Finally, the CONTAM simulates transient conditions as E/ Δ t, and the Δ t is the output timestep as defined by users.
The concept of a quantum of infection was proposed in 1955 by Wells [32] to determine the number of infectious particles required to infect people, and later in 1978, Riley et al. [9] estimated infectious dose of airborne pathogens using the number of quanta, which would help evaluate the probability of infection (Equation (4)). This is known as the Wells–Riley equation and has been widely used to evaluate airborne infection risks of indoor spaces [11,33].
P = C S = 1 e n
P is the probability of infection (or infection risk), C is the number of infection cases, S is the number of susceptible people, and n is the number of quanta inhaled by susceptible people. The inhaled quanta “n” can be expressed as follows:
n = C avg B ( 1 M inh × F m ) D
C avg is the average quanta concentration (quanta/m3), B is the breathing rate of occupants (m3/s), Minh is the mask efficiency for inhalation, Fm is the fraction of occupants wearing masks, and D is the occupant exposure duration.
In this study, we assumed that only one infector caused the transmission, and the infector is removed from the pool of susceptible occupants. The engineering mitigation strategies recommended in this study were all based on this assumption. Only airborne transmissions occur in the evaluated scenarios and infectious particles randomly distributed in the room. At the start of the day, the initial quanta concentration is zero. The fates of airborne quanta include exiting the building (via HVAC ventilation and the air leakage), filtration (via filters such as MERV, HEPA, etc.), deposition, deactivation by natural decay or GUV, and remaining airborne.

2.2. Equivalent Air Change Rate

For each investigated strategy, the corresponding total equivalent air change rate (Qe) was calculated, which is a sum of the air change rates (units are 1/h) from outdoor air ventilation, recirculated ventilation air that passes through MERV filters, portable air cleaners, and inactivation by GUV lights, as well as quanta deposition and deactivation of the airborne virus. This can be expressed as:
Qe = QOA + QMERV + QPAC + QGUV + Qdeposition + Qdeactivation
where:
  • QOA = outdoor air ventilation rate in [m3/h] divided by the room volume [m3];
  • QMERV = recirculated ventilation airflow rate (m3/h) × MERV efficiency/Volume (m3);
  • QPAC = CADR(m3/h)/Volume (m3);
  • QGUVr = airflow rate passing by the in-duct GUV light (m3/h)/Volume (m3), or clean air delivery rate provided by the upper-room germicidal lamp system CADRUV(m3/h)/Volume (m3);
  • Qdeposition = Quanta deposition rate (1/h);
  • Qdeactivationdec = Viral deactivation rate (1/h).

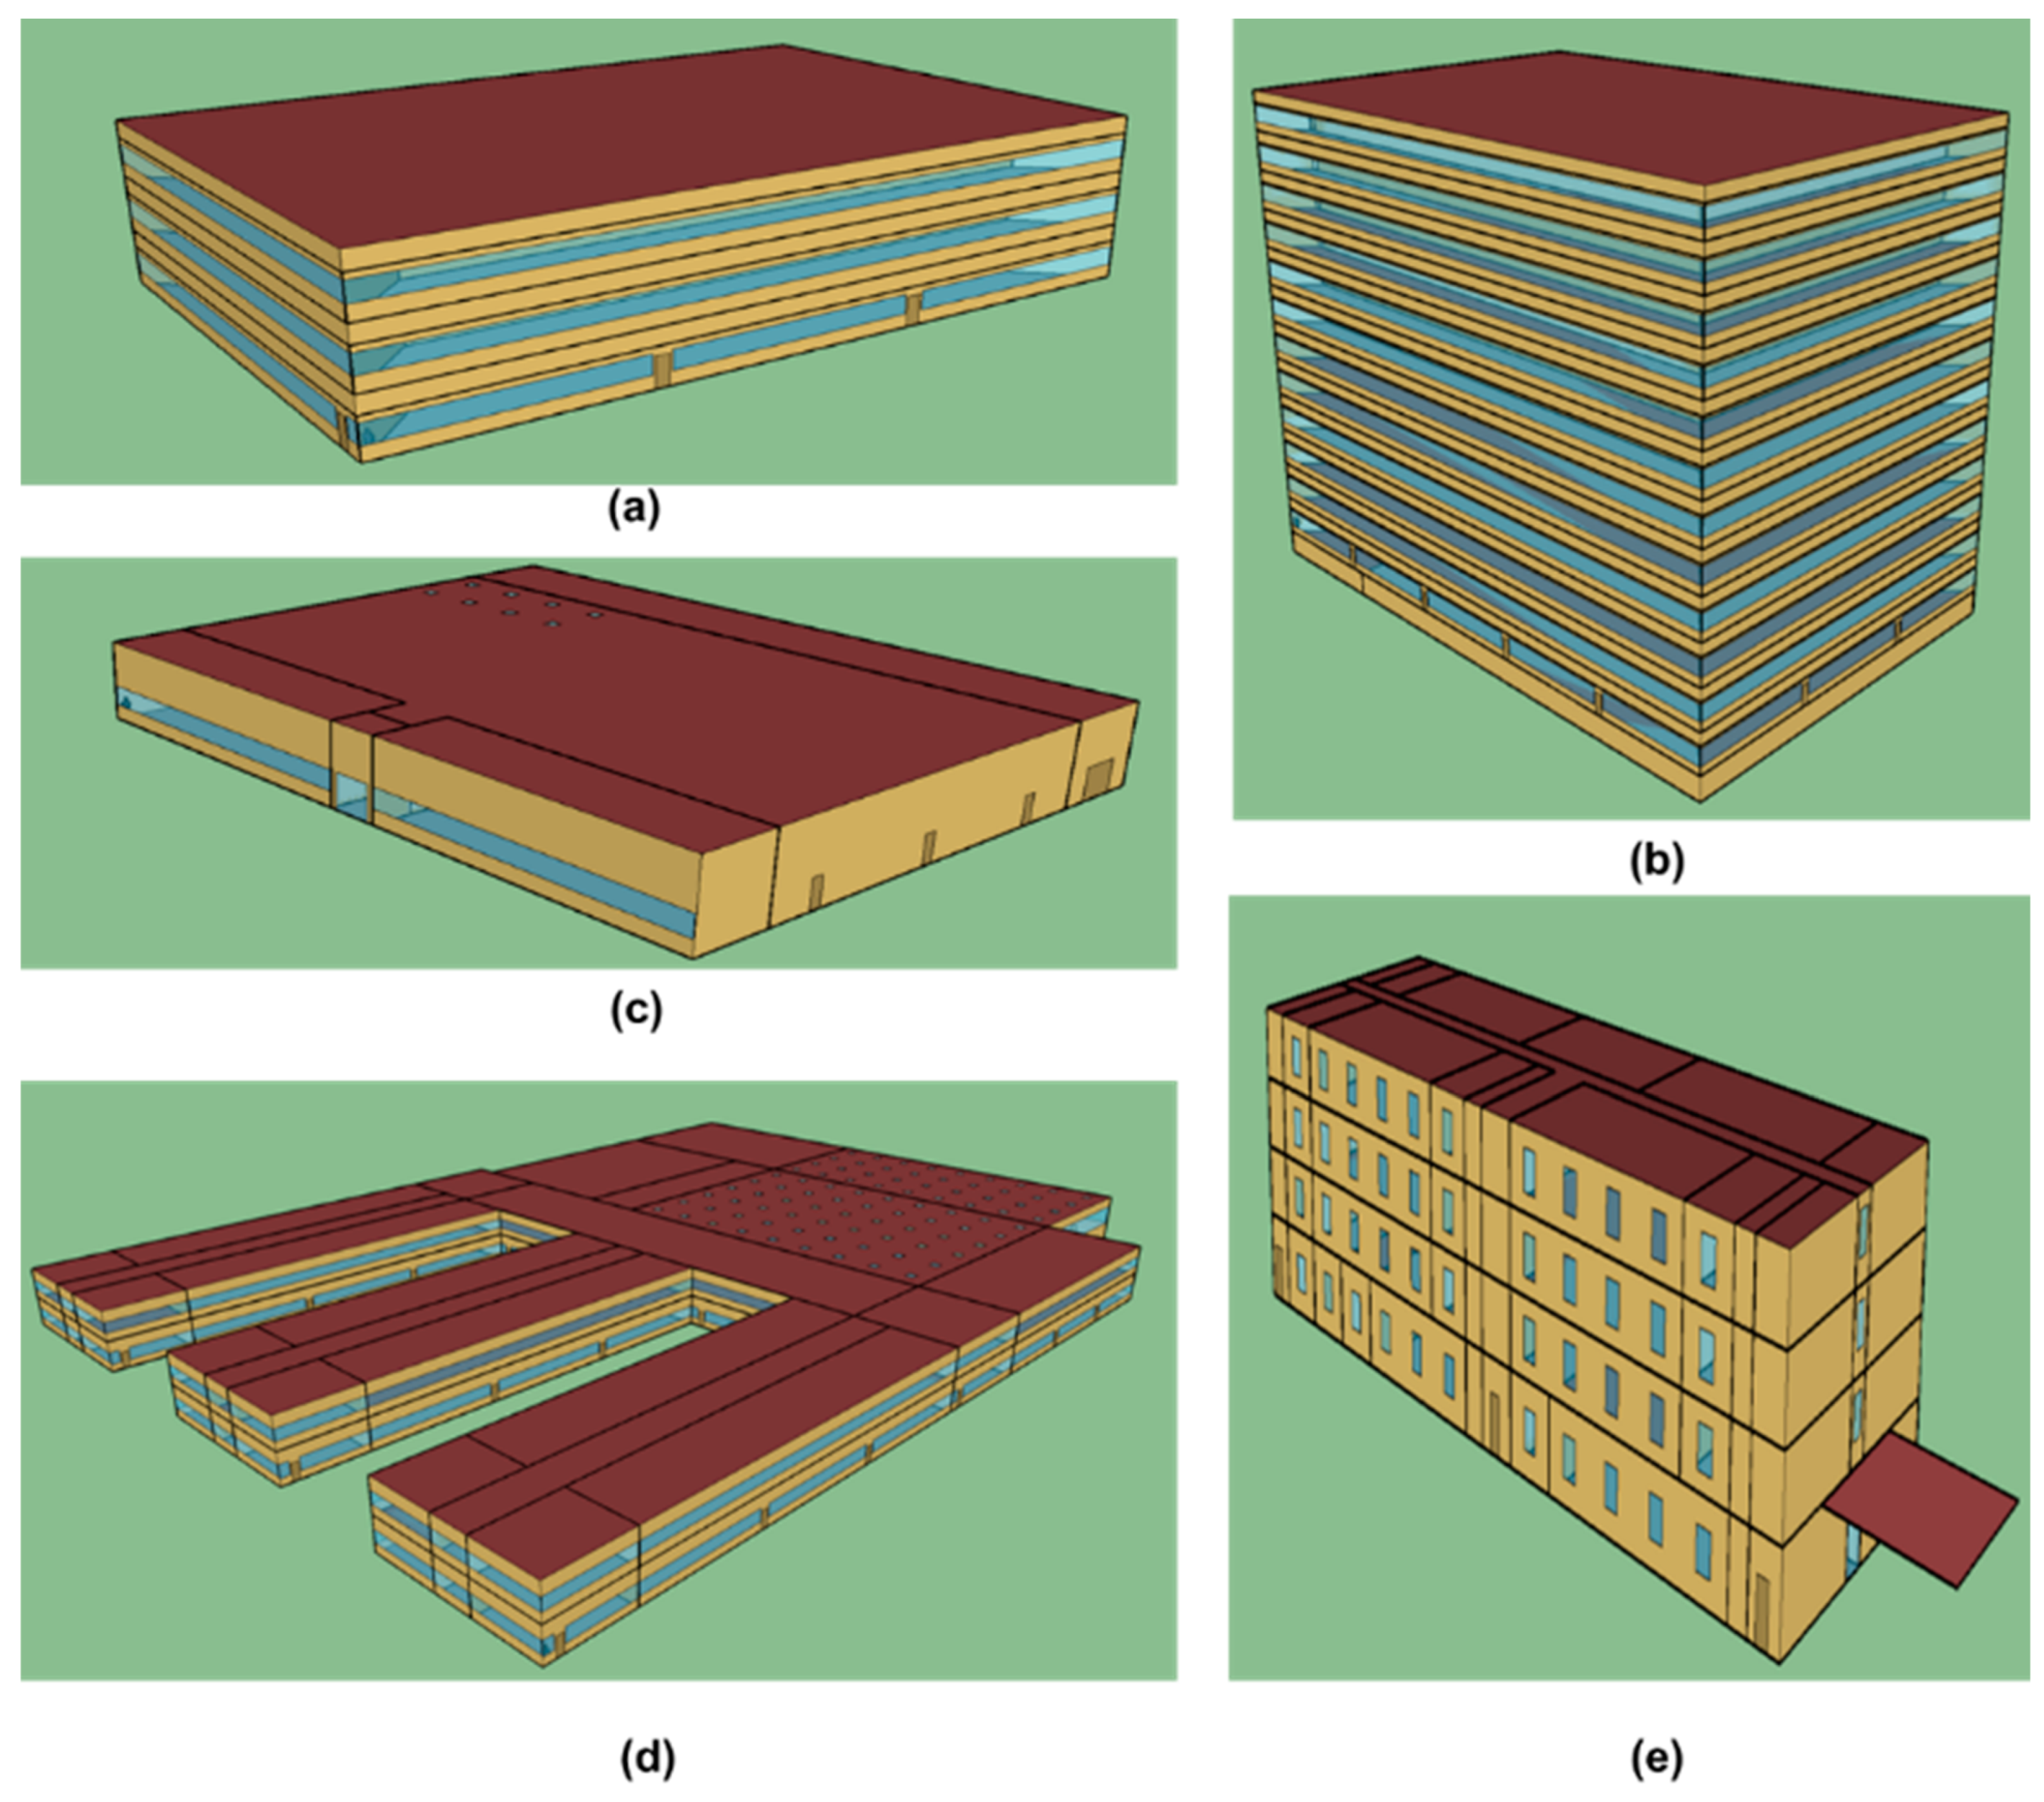
2.3. DOE Prototype Commercial Building Models

The floor layouts of CONTAM models of each DOE prototype building are illustrated in Figure 2. The medium office is a three-story, 1661 m2 footprint building with four perimeter zones and one core zone on each floor, except the basement. The large office building is 12 floors (3563 m2 footprint), also with four perimeter zones and one core zone on each floor. In the medium and large office, a single large leakage path was modeled, representing the half-height office partitions (fifty percent of the total wall area). The stand-alone retail is a single-floor building with a 2294 m2 footprint and five zones: core retail, backspace, point of sale, front retail, and restroom. The small hotel is a four-story building (1003 m2 footprint) with 19 zones on the first floor and 16 zones on upper floors. The secondary school is a two-story “E”-shaped building (19,592 m2 footprint), with 25 zones on the first floor and 21 zones on the second floor. More detailed descriptions of the buildings can be found in official DOE reports [27]. More information for investigated zones is in Table 1.
The occupancy and ventilation settings in the CONTAM models were employed from the EnergyPlus DOE prototype models [28]. Occupants’ exposure duration was determined focusing on the most at-risk occupants, namely, the employees who spend more time in the buildings. Simulations were performed for December 21st with Chicago Typical Meteorological Year version 3 (TMY3) weather (Figure 3). It should be noted that weather conditions would not influence system operations such as the outdoor air supply in the current models developed by National Institute of Standard and Technology (NIST). In addition, for the baseline cases in this study, a one-week simulation was performed as comparison for five weekdays in Chicago in December (18 December–22 December).

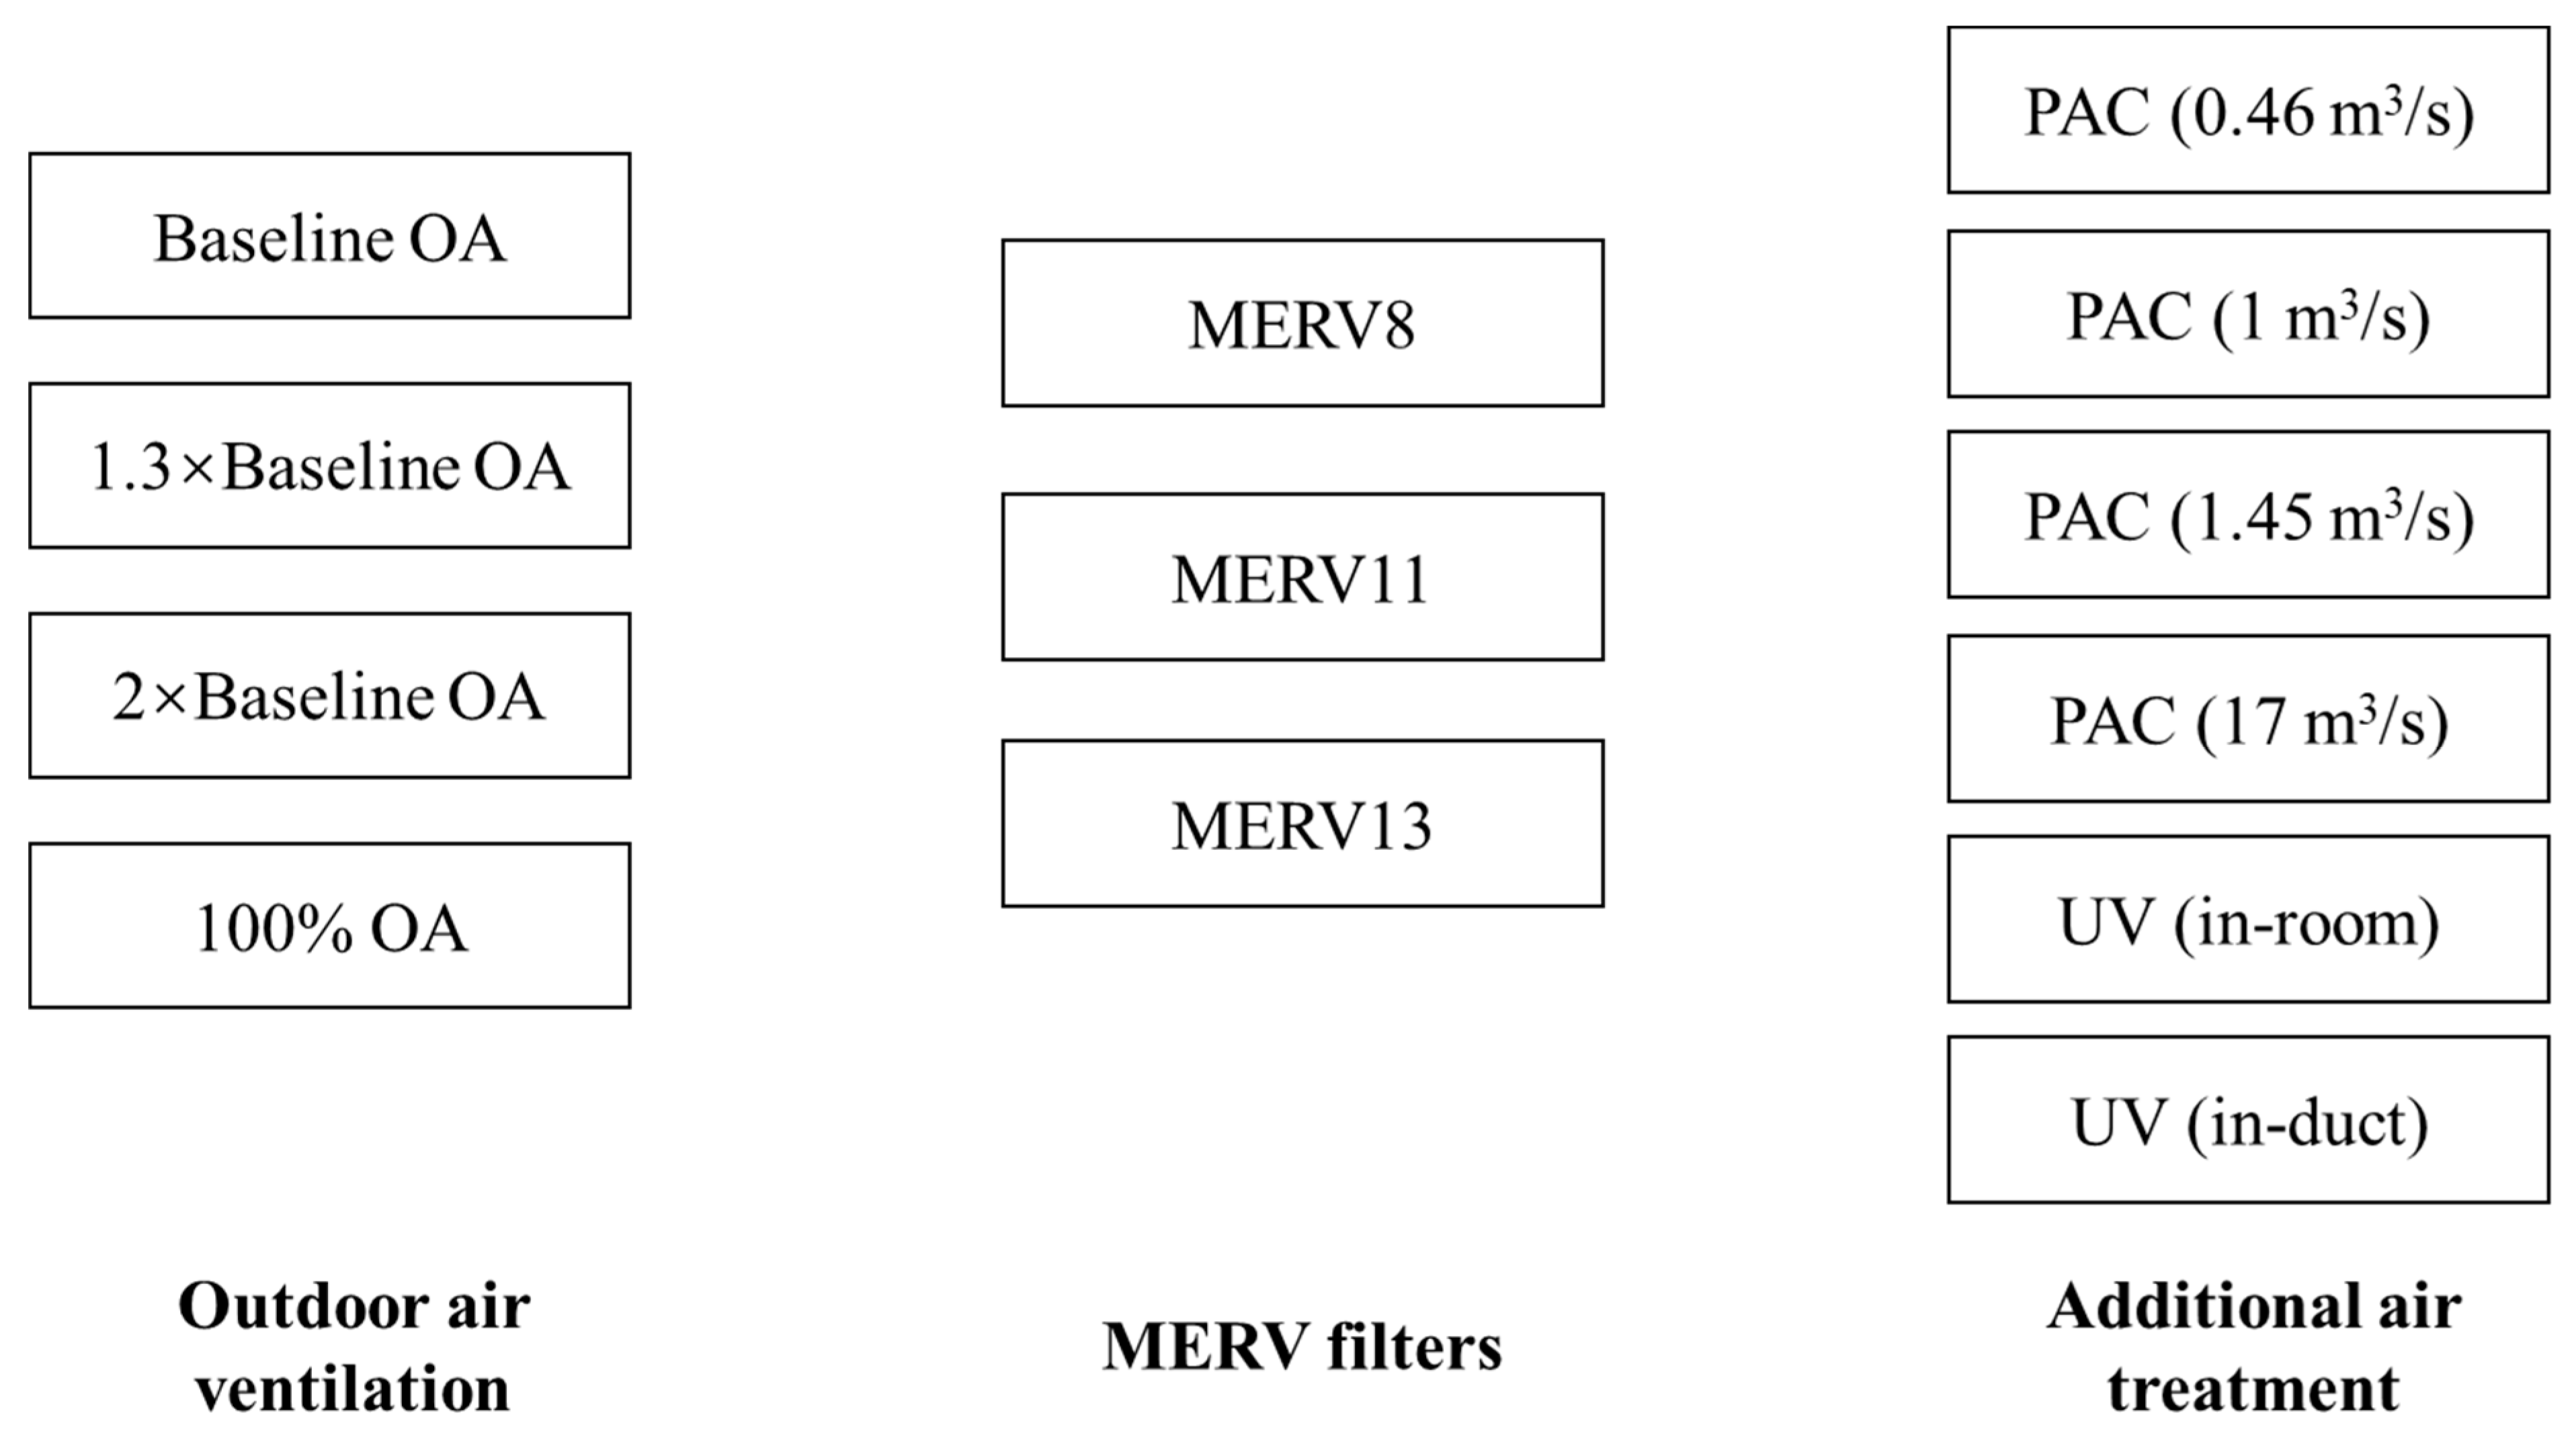
2.4. Baseline Case of Airborne Risk Mitigation Strategies

The baseline model case consisted of a baseline outdoor air setting and a MERV8 filter in the air-handling system. No additional air-cleaning devices were applied. One infector was assumed to stay in the investigated zone (list in Table 1) during the entire exposure time.
The mitigation strategies are presented in Figure 4. Four different outdoor air (OA) levels were simulated: Baseline OA, 1.3 × Baseline OA, 2 × Baseline OA, and 100% OA. Three levels of MERV filters were chosen: MERV8, MERV11, and MERV13. The use of PACs with clean air delivery rates at 0.46 m3/s, 1 m3/s, 1.45 m3/s, and 17 m3/s and GUV light in-room and in-duct were investigated. Additional detailed information is listed in Table 2.

3. Simulation Results

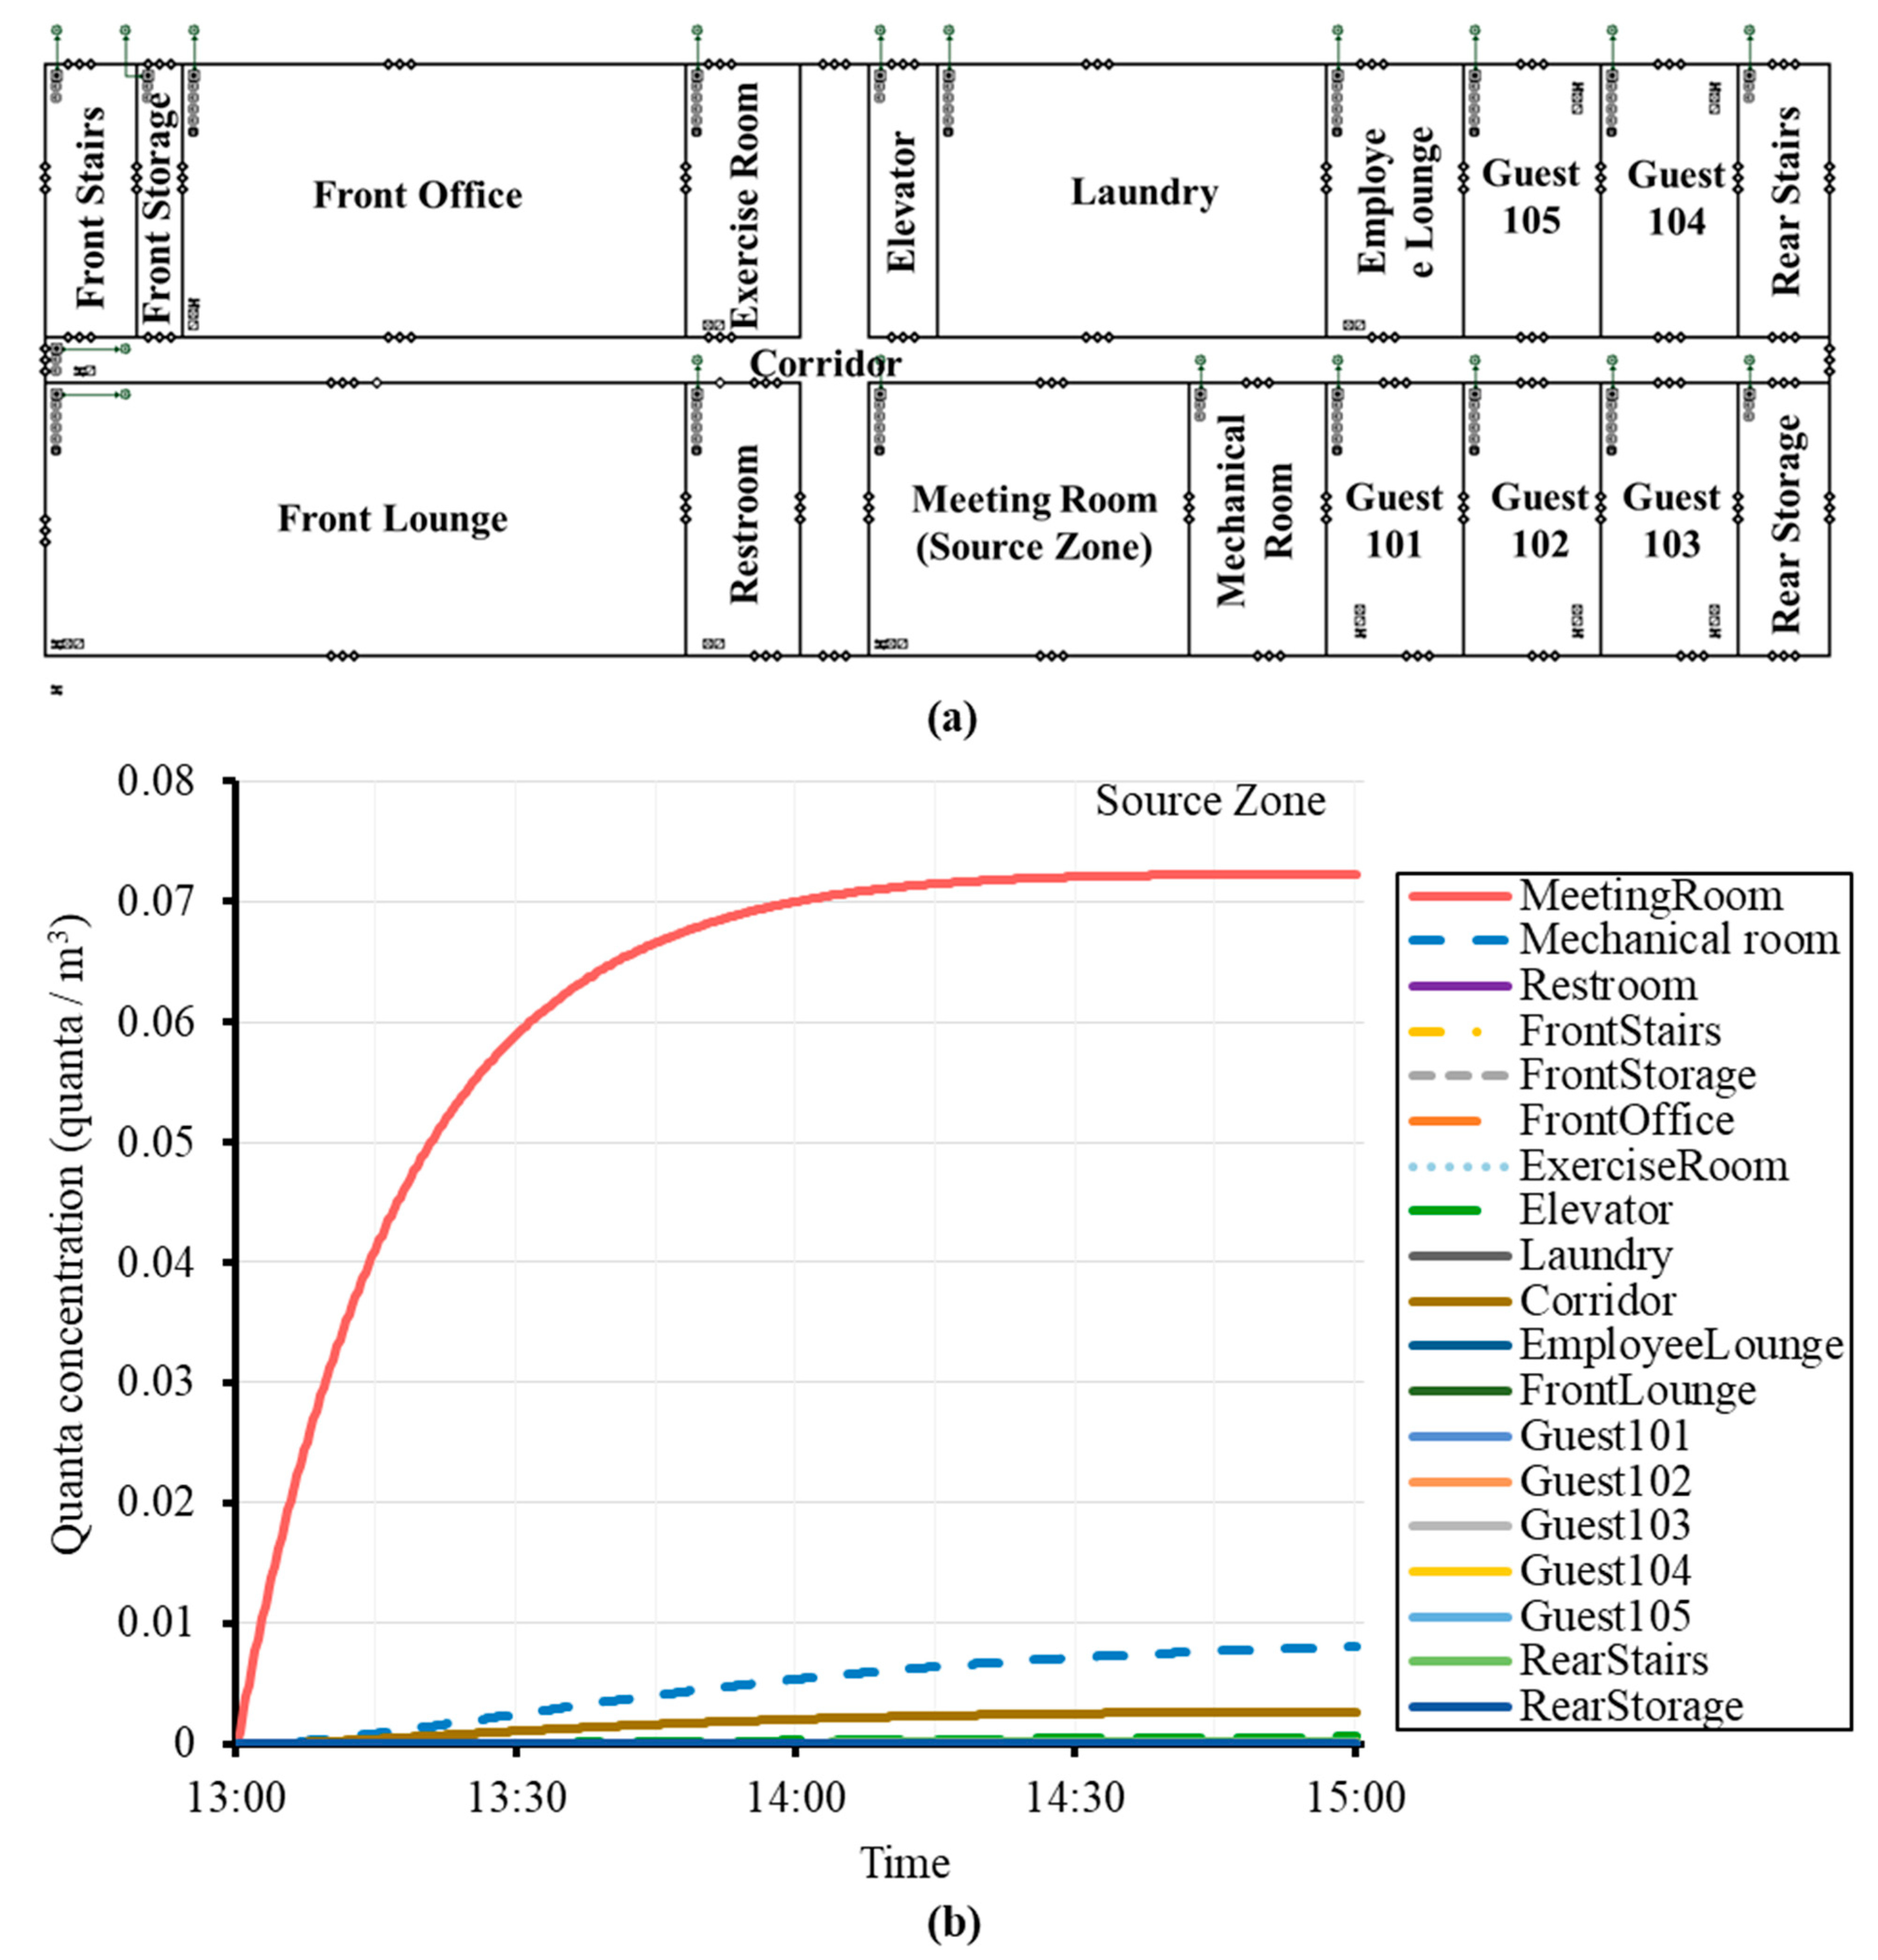
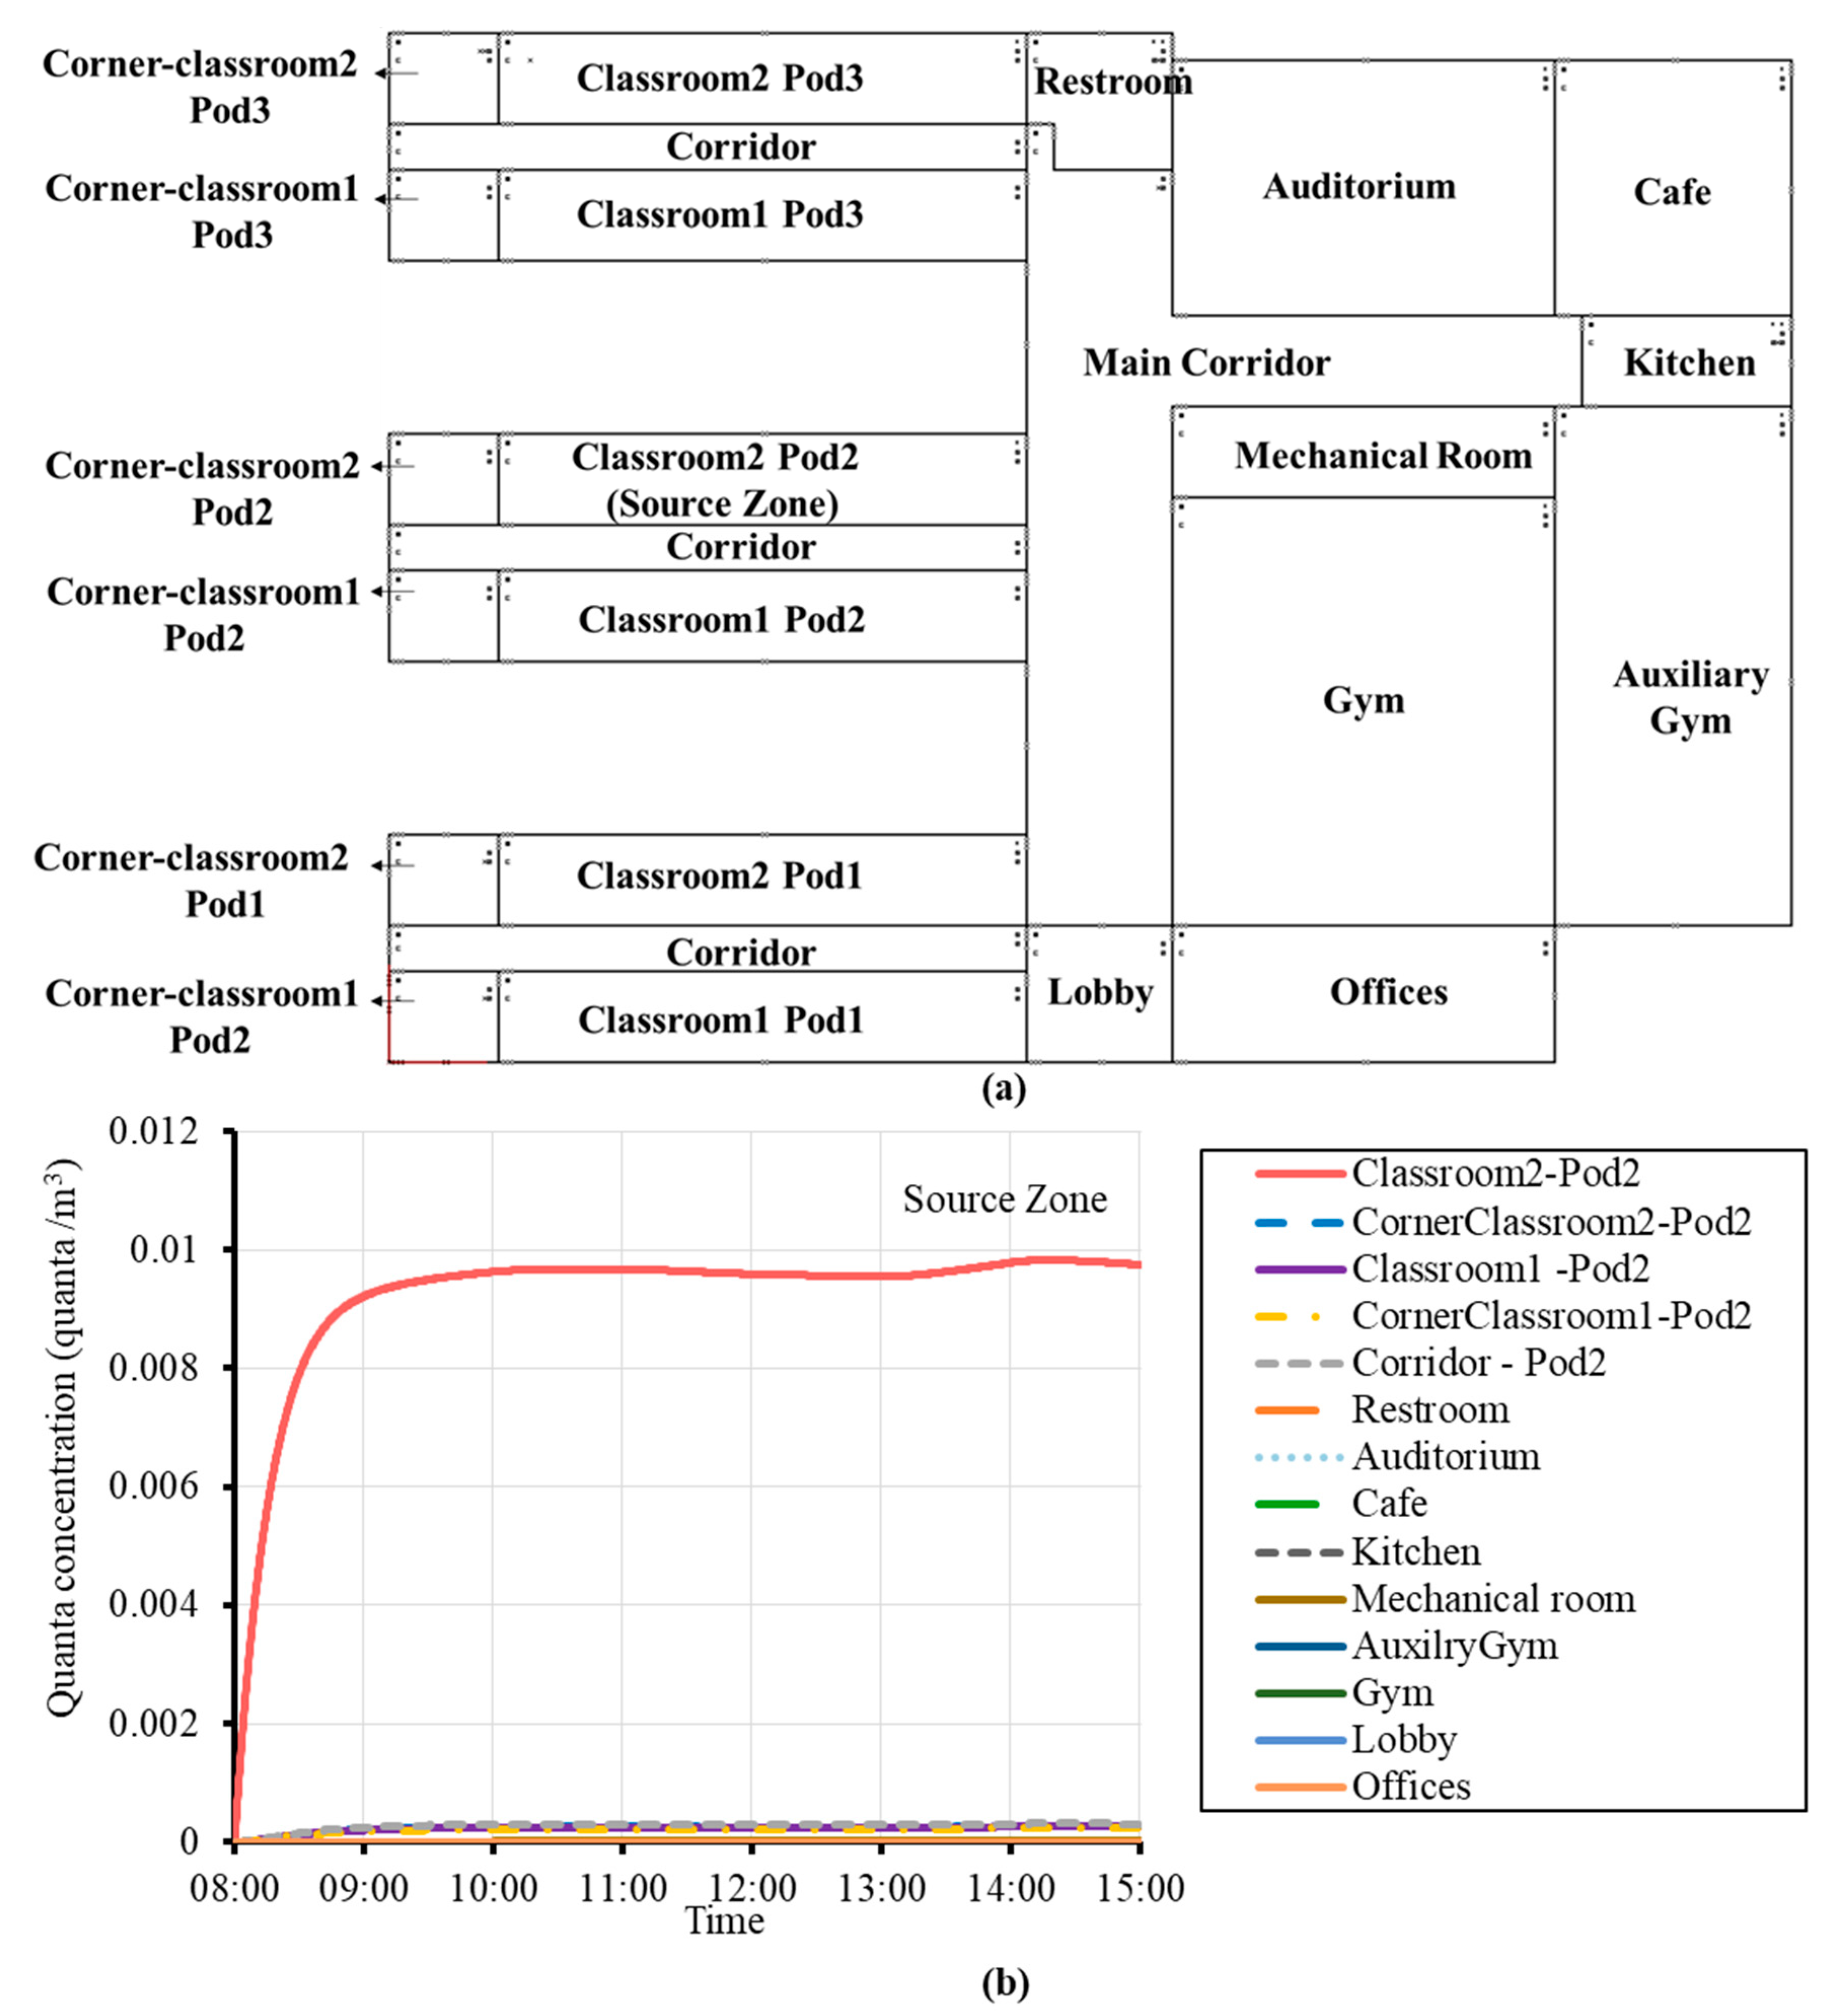
3.1. Zone-to Zone-Transmission

Figure 5, Figure 6, Figure 7, Figure 8 and Figure 9 illustrate the quanta concentrations in the different zones in the simulated DOE prototype buildings. The zone that contains the index person has the highest infection risk, far higher than the risk in other connected zones. It suggests that while quanta could transfer from the source zone to other zones, the risk that adjacent zones suffer is significantly lower.
In the office buildings, the restroom was the zone with the second-highest infection risk. This is because a return grille was designed on the restroom wall, connecting the restroom and the rest of the whole floor. All air-conditioned areas were pressurized (Core and Perimeter Zones). An exhaust fan was operating in the restroom, leading to the negative pressure inside it. Thus, more quanta could transmit to the restroom via air leakage sites and the return grille.
Air leakage may not be the only route for zone-to-zone transmission. In Figure 5 and Figure 6, neighboring zones in the office buildings tend to be more vulnerable than for the other types of buildings. This is explained by the different designs in the HVAC systems. A central ventilation system (variable-air-volume, VAV) was used in the Medium Office, Large Office, and Secondary School, while the Retail and Small Hotel meeting room used a constant-volume single-zone system and a packaged terminal air conditioner, respectively. The central air-handling system for the Medium Office is illustrated in Figure 5. Contaminated air in the source zone could re-enter zones through the ducts of the air-handling unit. Though a VAV system was also used in the Secondary School, its risk of zone-to-zone transmission was low, since high outdoor air rates were applied achieving 73% of the total air supplied.
In summary, zone-to-zone transmission happened via the air leakage and the HVAC ducts connecting zones. A dramatic ratio increase of OA would effectively limit the zonal transmissions in buildings with central ventilation systems.

3.2. Fate of Airborne Quanta

The impact of system-level mitigation strategies on quanta fates was investigated in this study. Figure 10 shows results for the Medium Office (Baseline case) and Figure 11 is a summary of the fates in different buildings using duct-treatment mitigation strategies. For buildings in which infection risks in multiple zones were investigated (Small Hotel and Secondary School), only one zone was selected to report respectively (meeting room and classroom). Four airborne quanta fates were assessed (exhausted, filtered, deposited, and deactivated) and compared with the quanta that remained airborne. Exhausted sums the number of quanta that exited the building via air leakage sites and HVAC systems. Filtered added up quanta trapped by filtration (e.g., MERV filters or PACs). Deposited and deactivated includes quanta removed by deposition on to surfaces and the natural decay of airborne virus.
The percentage of airborne quanta in the building decreased with exposure duration while the percentage that was filtered or exited the building through exhaust air gradually increased as the duration extended (Figure 10). The longer the exposure, the larger the role that the ventilation system plays in eliminating quanta. For example, during the first hour of exposure, 15% of airborne quanta were captured by the filter of the ventilation system; this number increased to over 30% after eight hours. In addition, settling and deactivation were important removal mechanisms.
The Small Hotel—Meeting Room scenario has the highest percentage of airborne quanta among the five buildings (Figure 11); for the baseline case, 20.7% of the generated quanta remained, while for other baseline cases, it was less than 10%. Even with the 100% outdoor air supply scenario, there was still 12.4% of the airborne quanta remaining in the room. This is due to the exposure time (2 h) being shorter than other scenarios. During the meeting, to reduce the infection risk, in addition to outdoor air flushing and MERV filtration, room-treatment strategies should be considered, such as PACs and in-room UV light.
For a designated building scenario, the larger the sum of exfiltrated and filtered components, the more prominent role that the duct-treatment strategies play. For example, this sum reached 48.3% for the baseline scenario for the Medium Office case. When the MERV filter was upgraded from MERV8 to MERV13, this sum was 74.3%, like that of the 100% OA strategy (76.9%). The BL + MERV13 combination was better than the 2 × BL + MERV11. Similar phenomena were also found in other building types. As a result, a proper match of outdoor air percentage and MERV filters can effectively improve mitigation effectiveness and nearly approach the performance of 100% outdoor air.

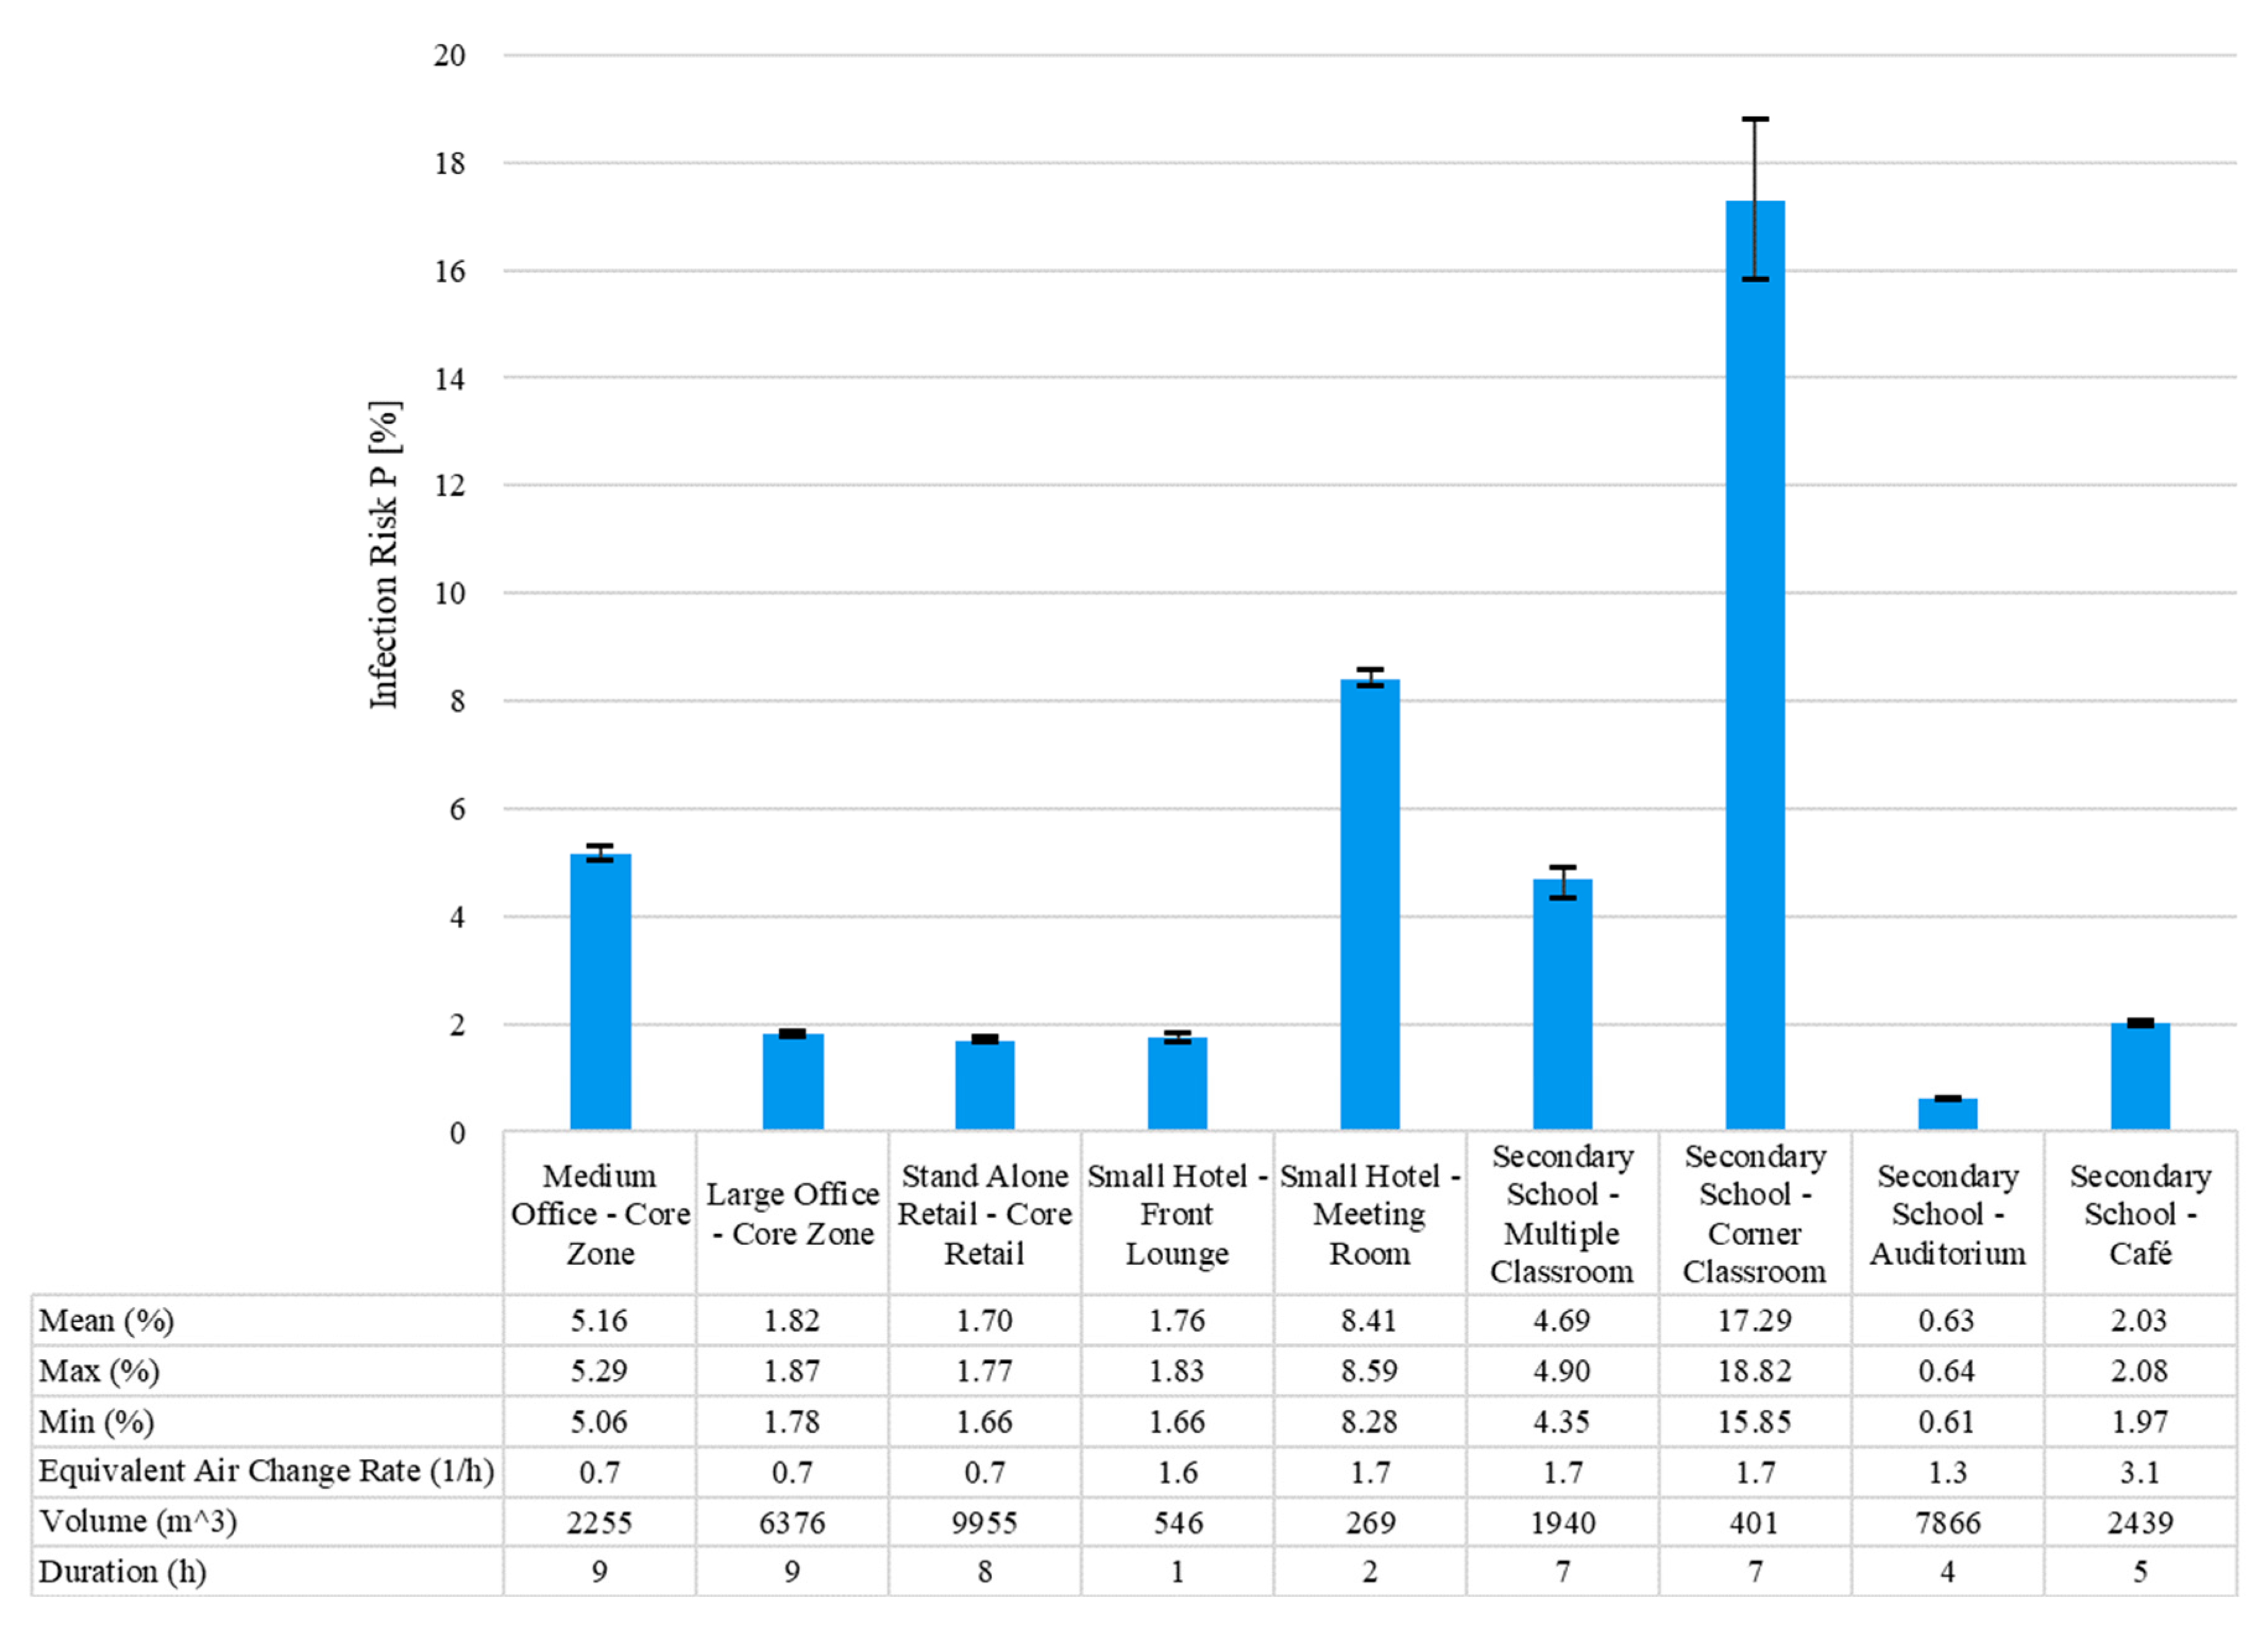
3.3. Risk Assessment for Baseline Cases

The individual infection risk for baseline cases is illustrated in Figure 12. The Secondary School (Corner Classroom) and Small Hotel (Meeting Room) had the highest mean infection risks (17.3% and 8.4%) during the five-day simulation period. Compared with other zones, these two areas have smaller volumes (269 m3 and 401 m3); thus, quanta concentrations in these two zones were higher, and therefore their corresponding infection risks were also high (see Equation (1)–(3)). A confined space tends to have a higher quanta concentration, which is consistent with findings from previous studies [44,45]. Despite similar baseline supply rates for OA, individual infection risks for the Corner Classroom were about twice as high compared to the Meeting Room. The Corner Classroom had longer exposure (7 h), while occupants stayed in the Meeting Room for only two hours. For confined spaces with longer exposures, infection risks should be addressed with additional mitigation measures, even if the outdoor air ventilation rates are high, such as in the Corner Classroom in the Secondary School.

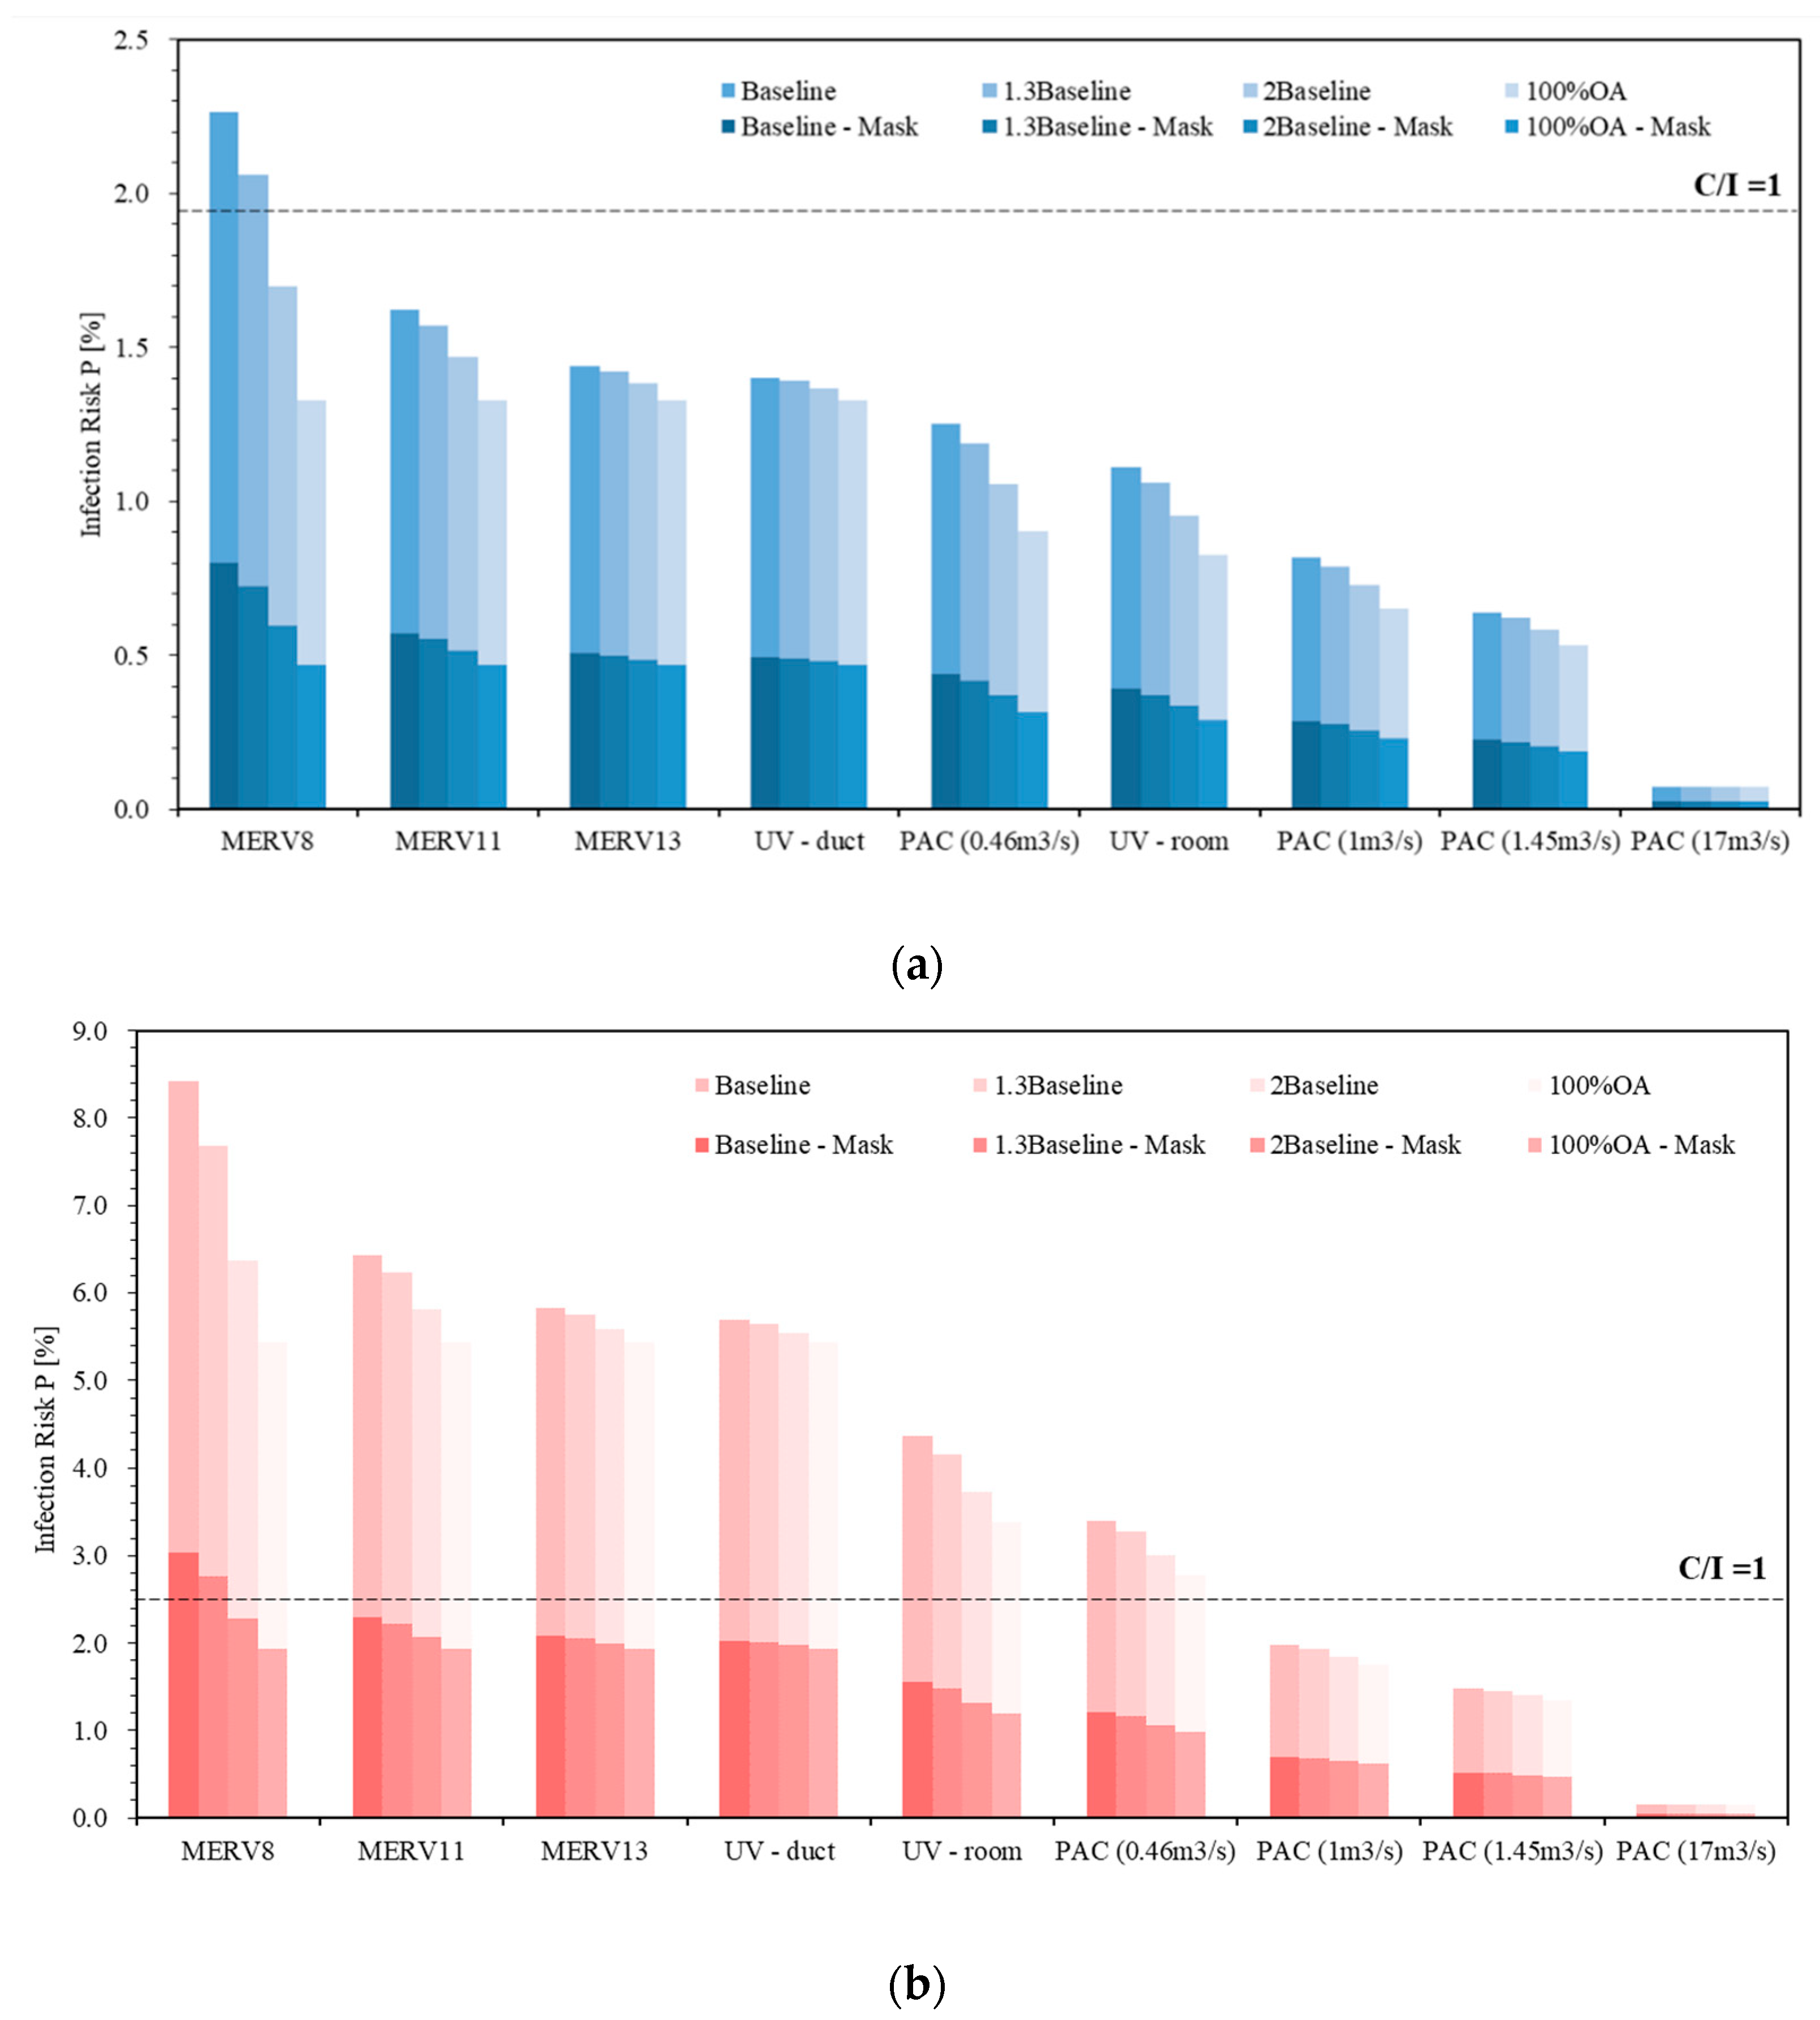
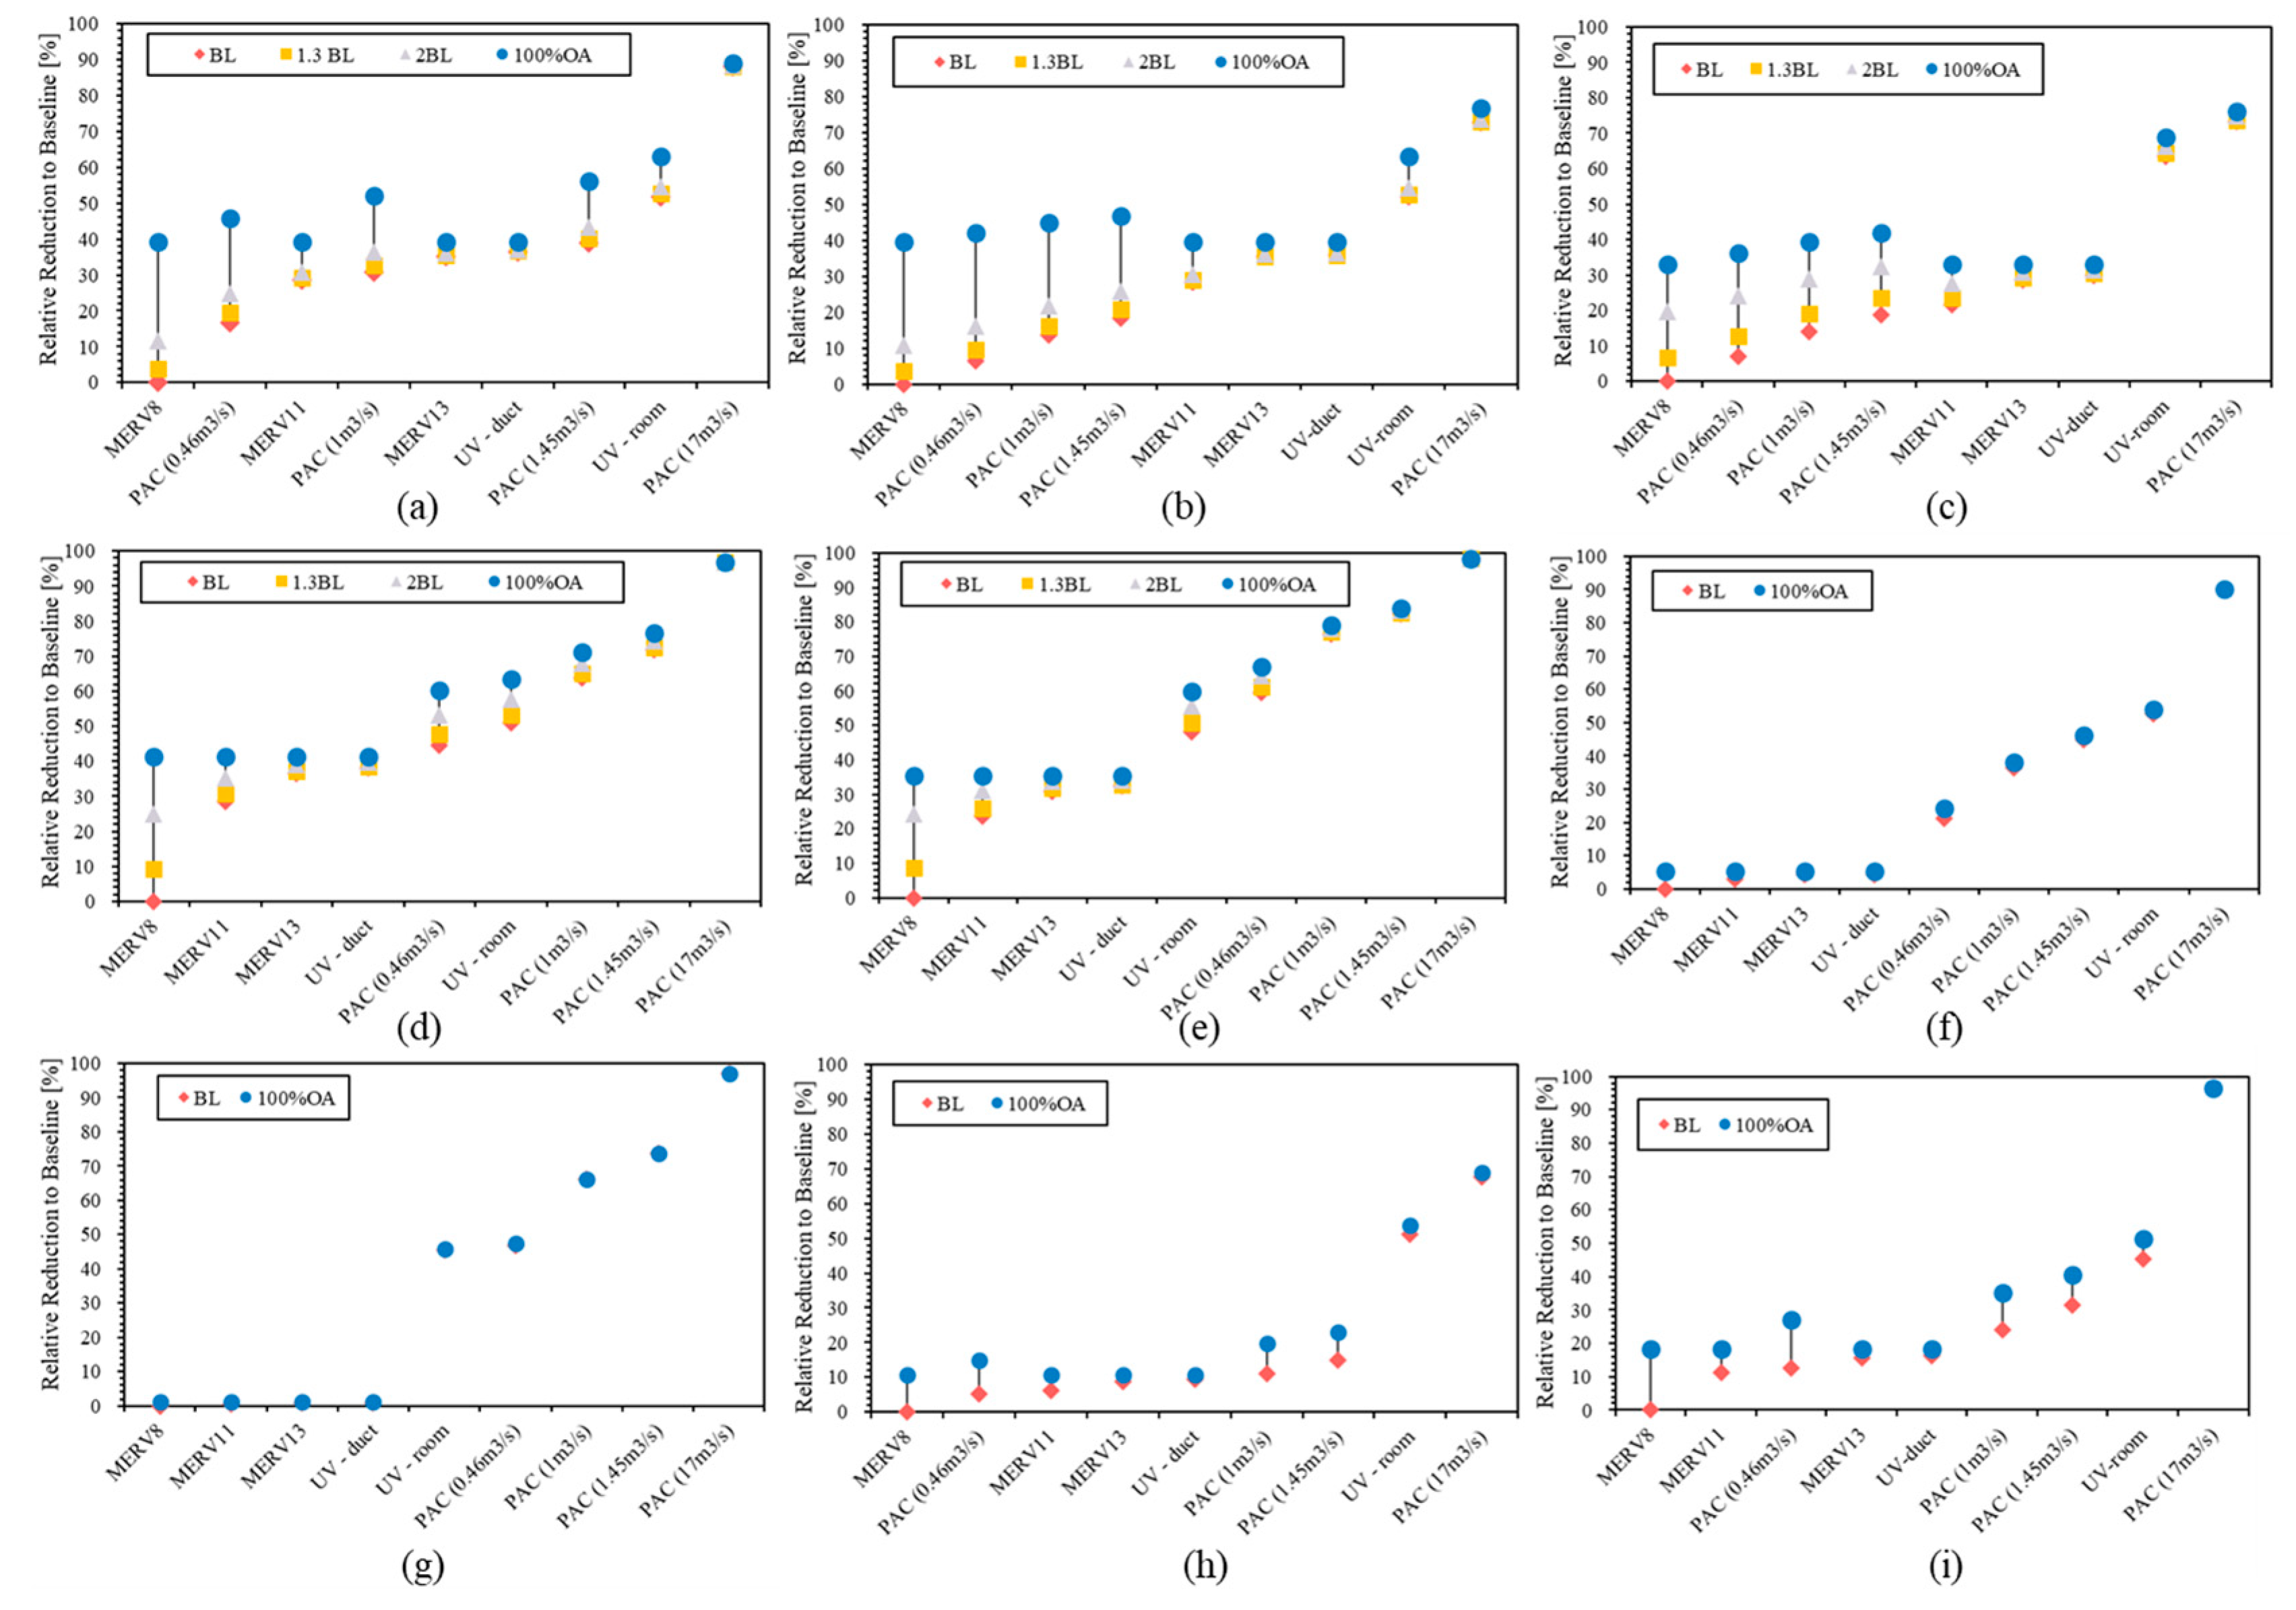
3.4. The Effectiveness of Risk Mitigation Strategies

To mitigate infection risks in these buildings, a variety of air-cleaning strategies were tested. Results for the Small Hotel’s Front Lounge and Meeting Room are in Figure 13. For the Front Lounge, most of the mitigation strategies effectively reduced risks below the contagious potential C/I = 1 line (Figure 13a), except for the baseline case and 1.3BL + MERV8. By contrast, more mitigation efforts were required for the Meeting Room. As previously mentioned, even the 100% outdoor air was not sufficient. Thus, strategies in the Meeting Room should be supplemented with in-room mitigation. For example, using a portable air-cleaner reduced risks to an acceptable level (Figure 13b).
Upgrading MERV filters benefit risk mitigations. For the baseline Hotel case, the upgrade from MERV8 to MERV11 led to a 0.7% decrease for the Front Lounge and a 2% decrease in risks for the Meeting Room. The switch from MERV11 to MERV13 contributed to further risk reductions of 0.2% and 0.6%, respectively. This indicates there are diminishing returns for upgrading MERV filters. An enhanced air filtration strategy has been widely suggested during the COVID-19 pandemic; specifically, MERV13 was recommended as the minimum [21]. However, there is a trade-off between improved air-cleaning performance with filter upgrades and added costs and potential operational difficulties in retrofitting existing HVAC systems.
For all evaluated mitigation strategies, individual infection risks for 100% mask-wearing occupants were also calculated and are shown in Figure 13 using dark colors. In the Meeting Room, except for the baseline case and 1.3 × BL + MERV8, risks for all evaluated cases were mitigated to acceptable levels with masks (C/I = 1). This means that the use of masks could permit a two-hour meeting in a meeting room with basic ventilation settings.
For all evaluated mitigation strategies, the relative reduction to their baseline risk levels was calculated (Figure 14) to compare the effectiveness across strategies. The relative reduction to baseline was calculated as (Pbaseline  Pstrategy)/Pbaseline. For duct-treatment strategies, the maximum “relative reduction to baseline” was reached with 100% OA. For the Medium Office, Large Office, Stand-Alone Retail, and Small Hotel, duct air-cleaning devices, such as upgraded MERV filters and in-duct UV lamps, achieved 30% to 40% relative reduction to baseline. For the Secondary School, it was in the range of 0% to 20%. Upgrading MERV filters and using in-duct UV should be a high priority in Large Office and Stand-Alone Retail spaces. Note that since high baseline OA rates were designed for the Secondary School, the duct-treatment equipment would be relatively less effective in this application because they only treat return air, and OA supply air is quanta free.
For room-treatment mitigations, the PACs performed well in the Small Hotel and Secondary School. The Hotel’s front lounge and meeting room were small spaces, resulting in high quanta levels. Moreover, for the zones in the Secondary School, high-design OA supply limited the increasing potential of in-duct air cleaning mitigation performance (see Figure 11); thus, PACs worked well for supplying extra clean air to these spaces. Notably, in-room UV was very effective at mitigation for all cases; the “relative reduction to baseline” achieved 50% to 70%.

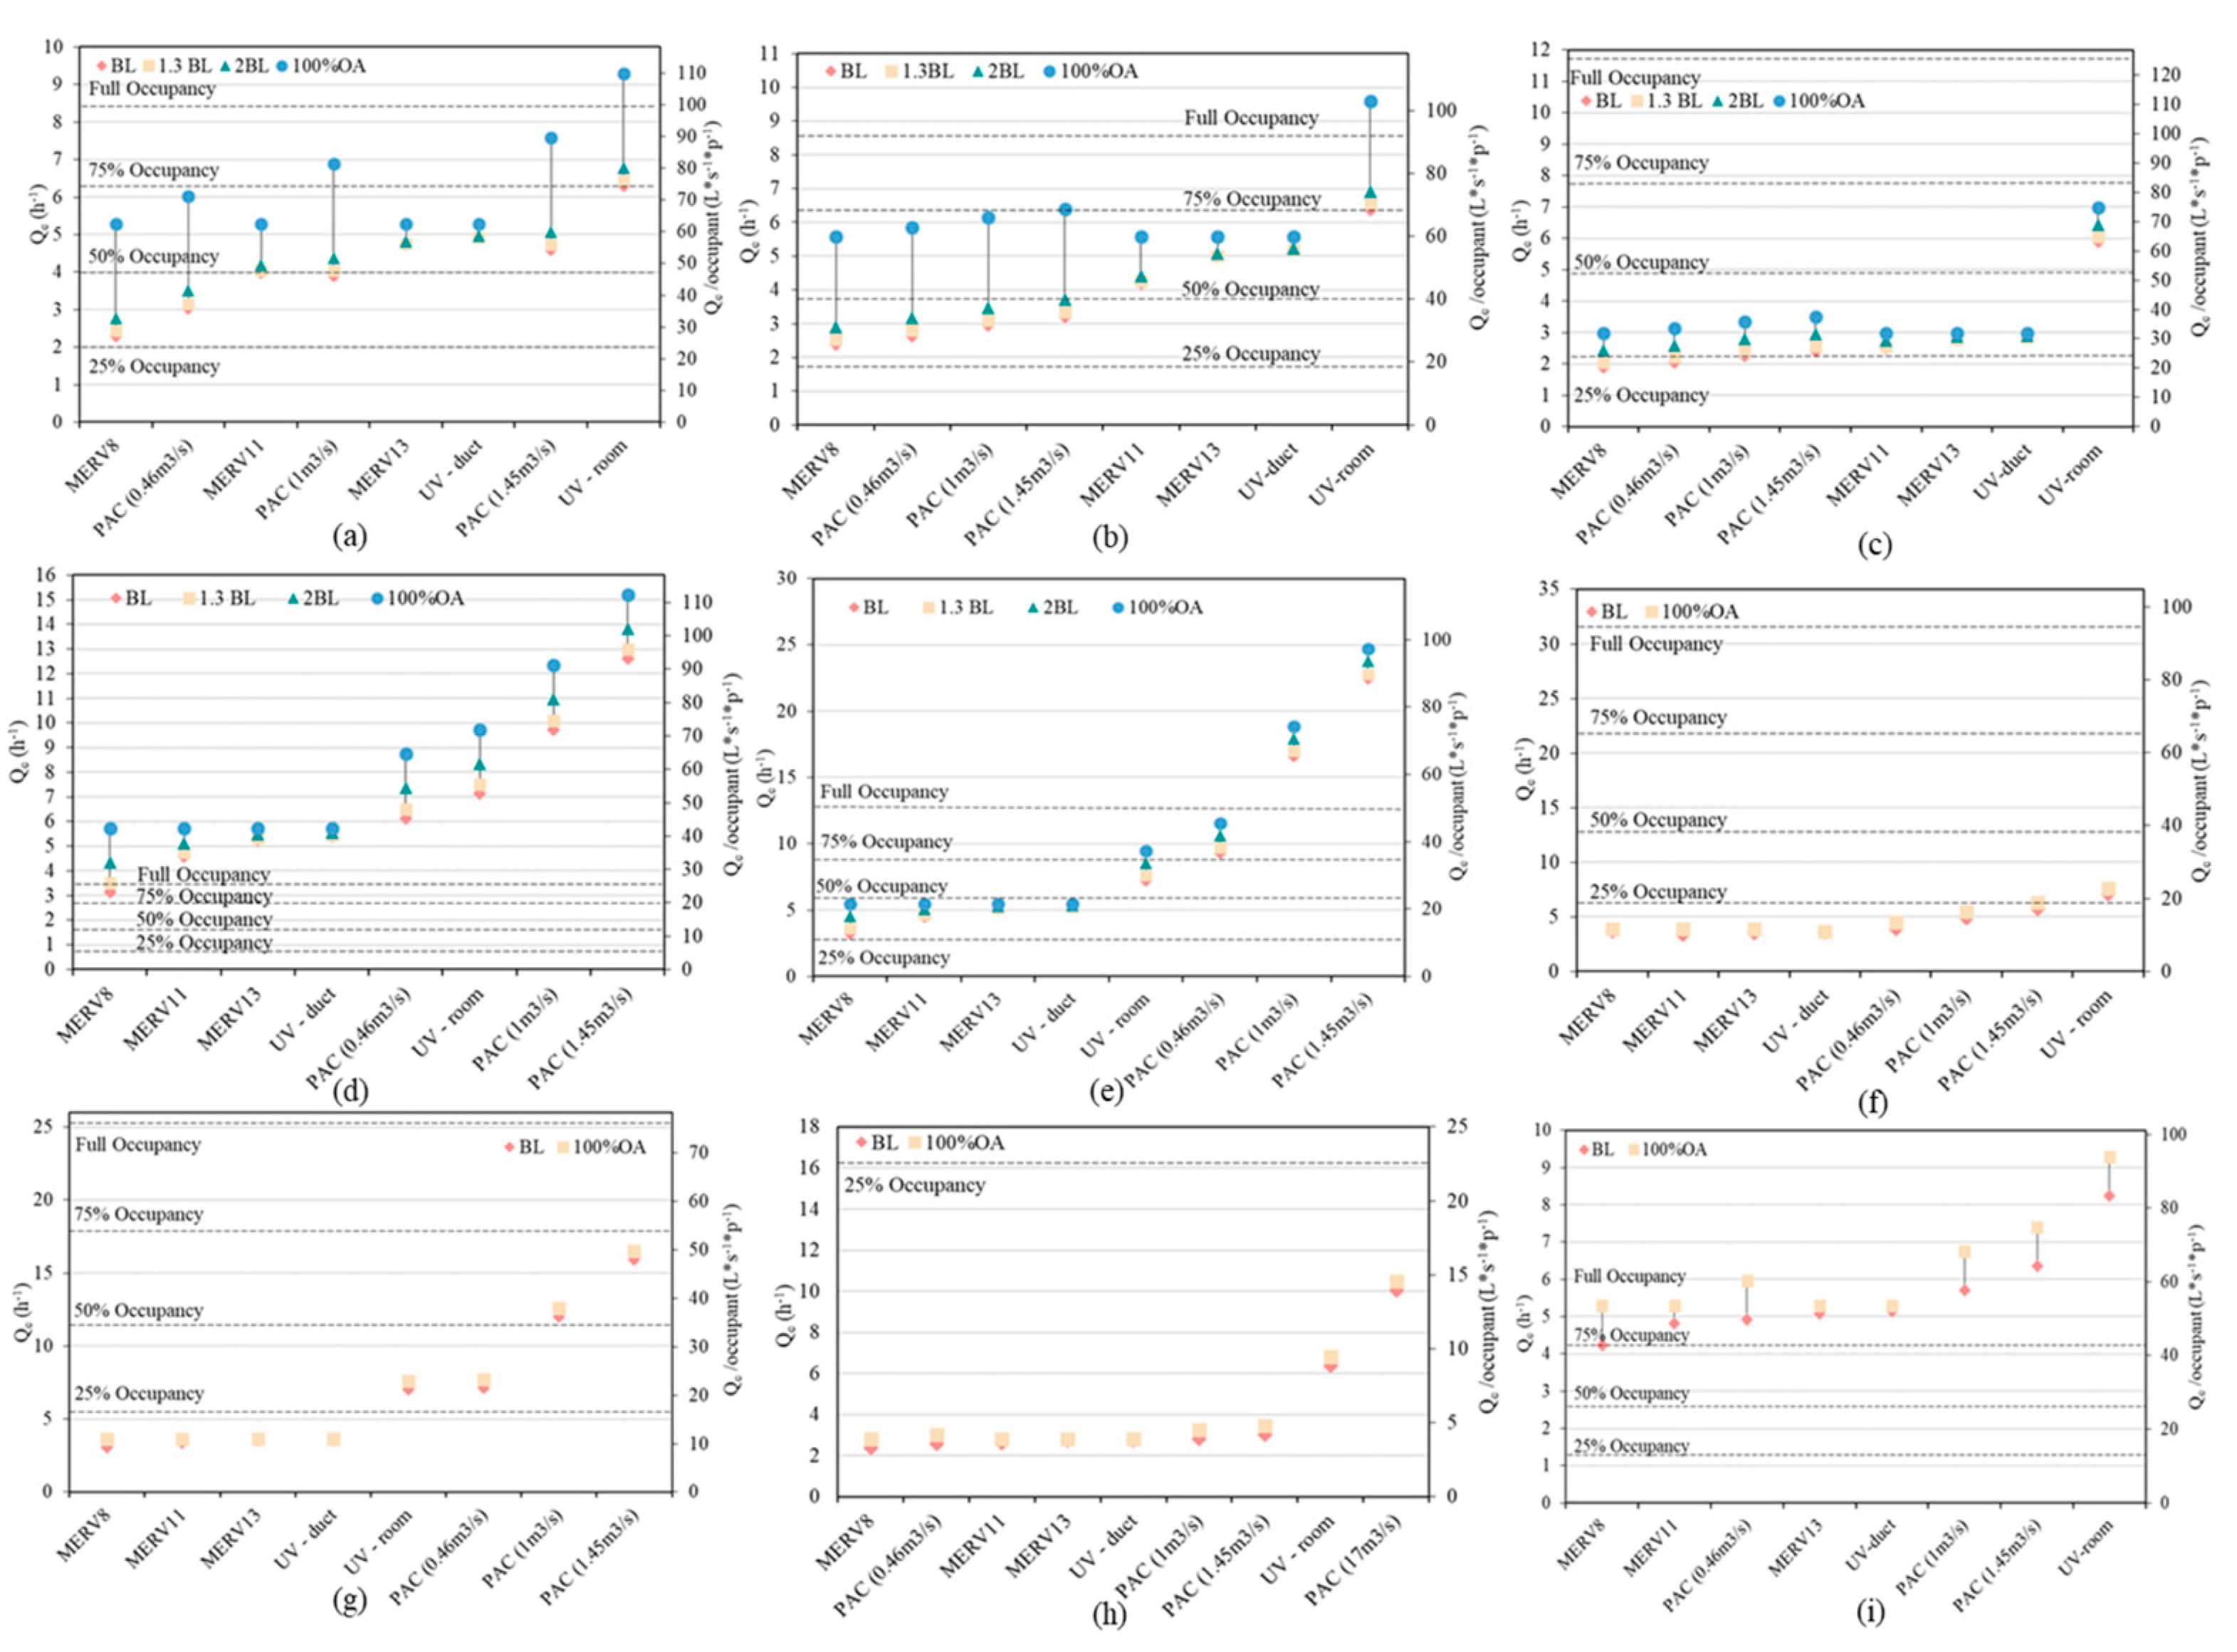
3.5. Association of Infective Risks with Equivalent Air Change Rate Qe

Exposure duration (h), room volume (V), and mitigation strategies determined individual infection risks, where the equivalent air change rate (Qe) represents the summation of mitigation strategies layered together. The Qe is the overall quanta removal ability of the mitigation measures. The association between h, V, Qe, and infection risk is presented in Figure 15a; different mask-wearing situations (50%, 80%, and 100% wearing) were also explored. In the 50% and 80% mask-wearing situations, the infector was assumed to not wear a mask. The association was derived using the multizone modeling results for all building types in this study. Results indicated that 100% mask-wearing would lead to a significant reduction. With the help of Figure 15a, the required Qe needed to meet a preferred risk can be determined. For example, for a 100-m3 office with five occupants, an acceptable risk level P = 1/5 = 20% and the D/(Qe × V) with no masking is 0.005 h2/m3. Thus, for an eight-hour exposure in this office, the required Qe is 8/(0.005 × 100) = 16 h−1. For a 500 m3 classroom with 25 students, an acceptable risk level P = 1/25 = 4% and the D/(Qe × V) with no masks is 0.001 h2/m3. Then for one-hour stay in the classroom, the required Qe is 2 h−1 and it increases to 10 h−1 for five-hour exposures (with 100% masking, the mitigation strategies would need to provide 5/(0.0028 × 500) = 3.6 h−1). Note that these mitigations are for reducing long-range transmission risk, but mask wearing helps with both long- and short-range transmission. As seen in Figure 15b, the multizone CONTAM simulation results predict P is lower for a given D/(Qe × V) compared to the single-zone Wells–Riley calculations, since some generated quanta exits to neighbor zones via air leakage sites and the HVAC systems.
For additional scenarios with different quanta generation levels, the relationships were plotted in Figure 16. This chart provides a quick check for individual infection risks in a room with known mitigation strategies. With known quanta generation rate, Qe of the ventilation system plus any mitigation measures, room size, and exposure duration, the infection risk can be estimated. The room design occupancy can help decide the acceptable risk level (see Section 2.3). Then, for a designated room, we can decide whether current mitigation measures are sufficient for occupants’ safety and implement more controls if needed.

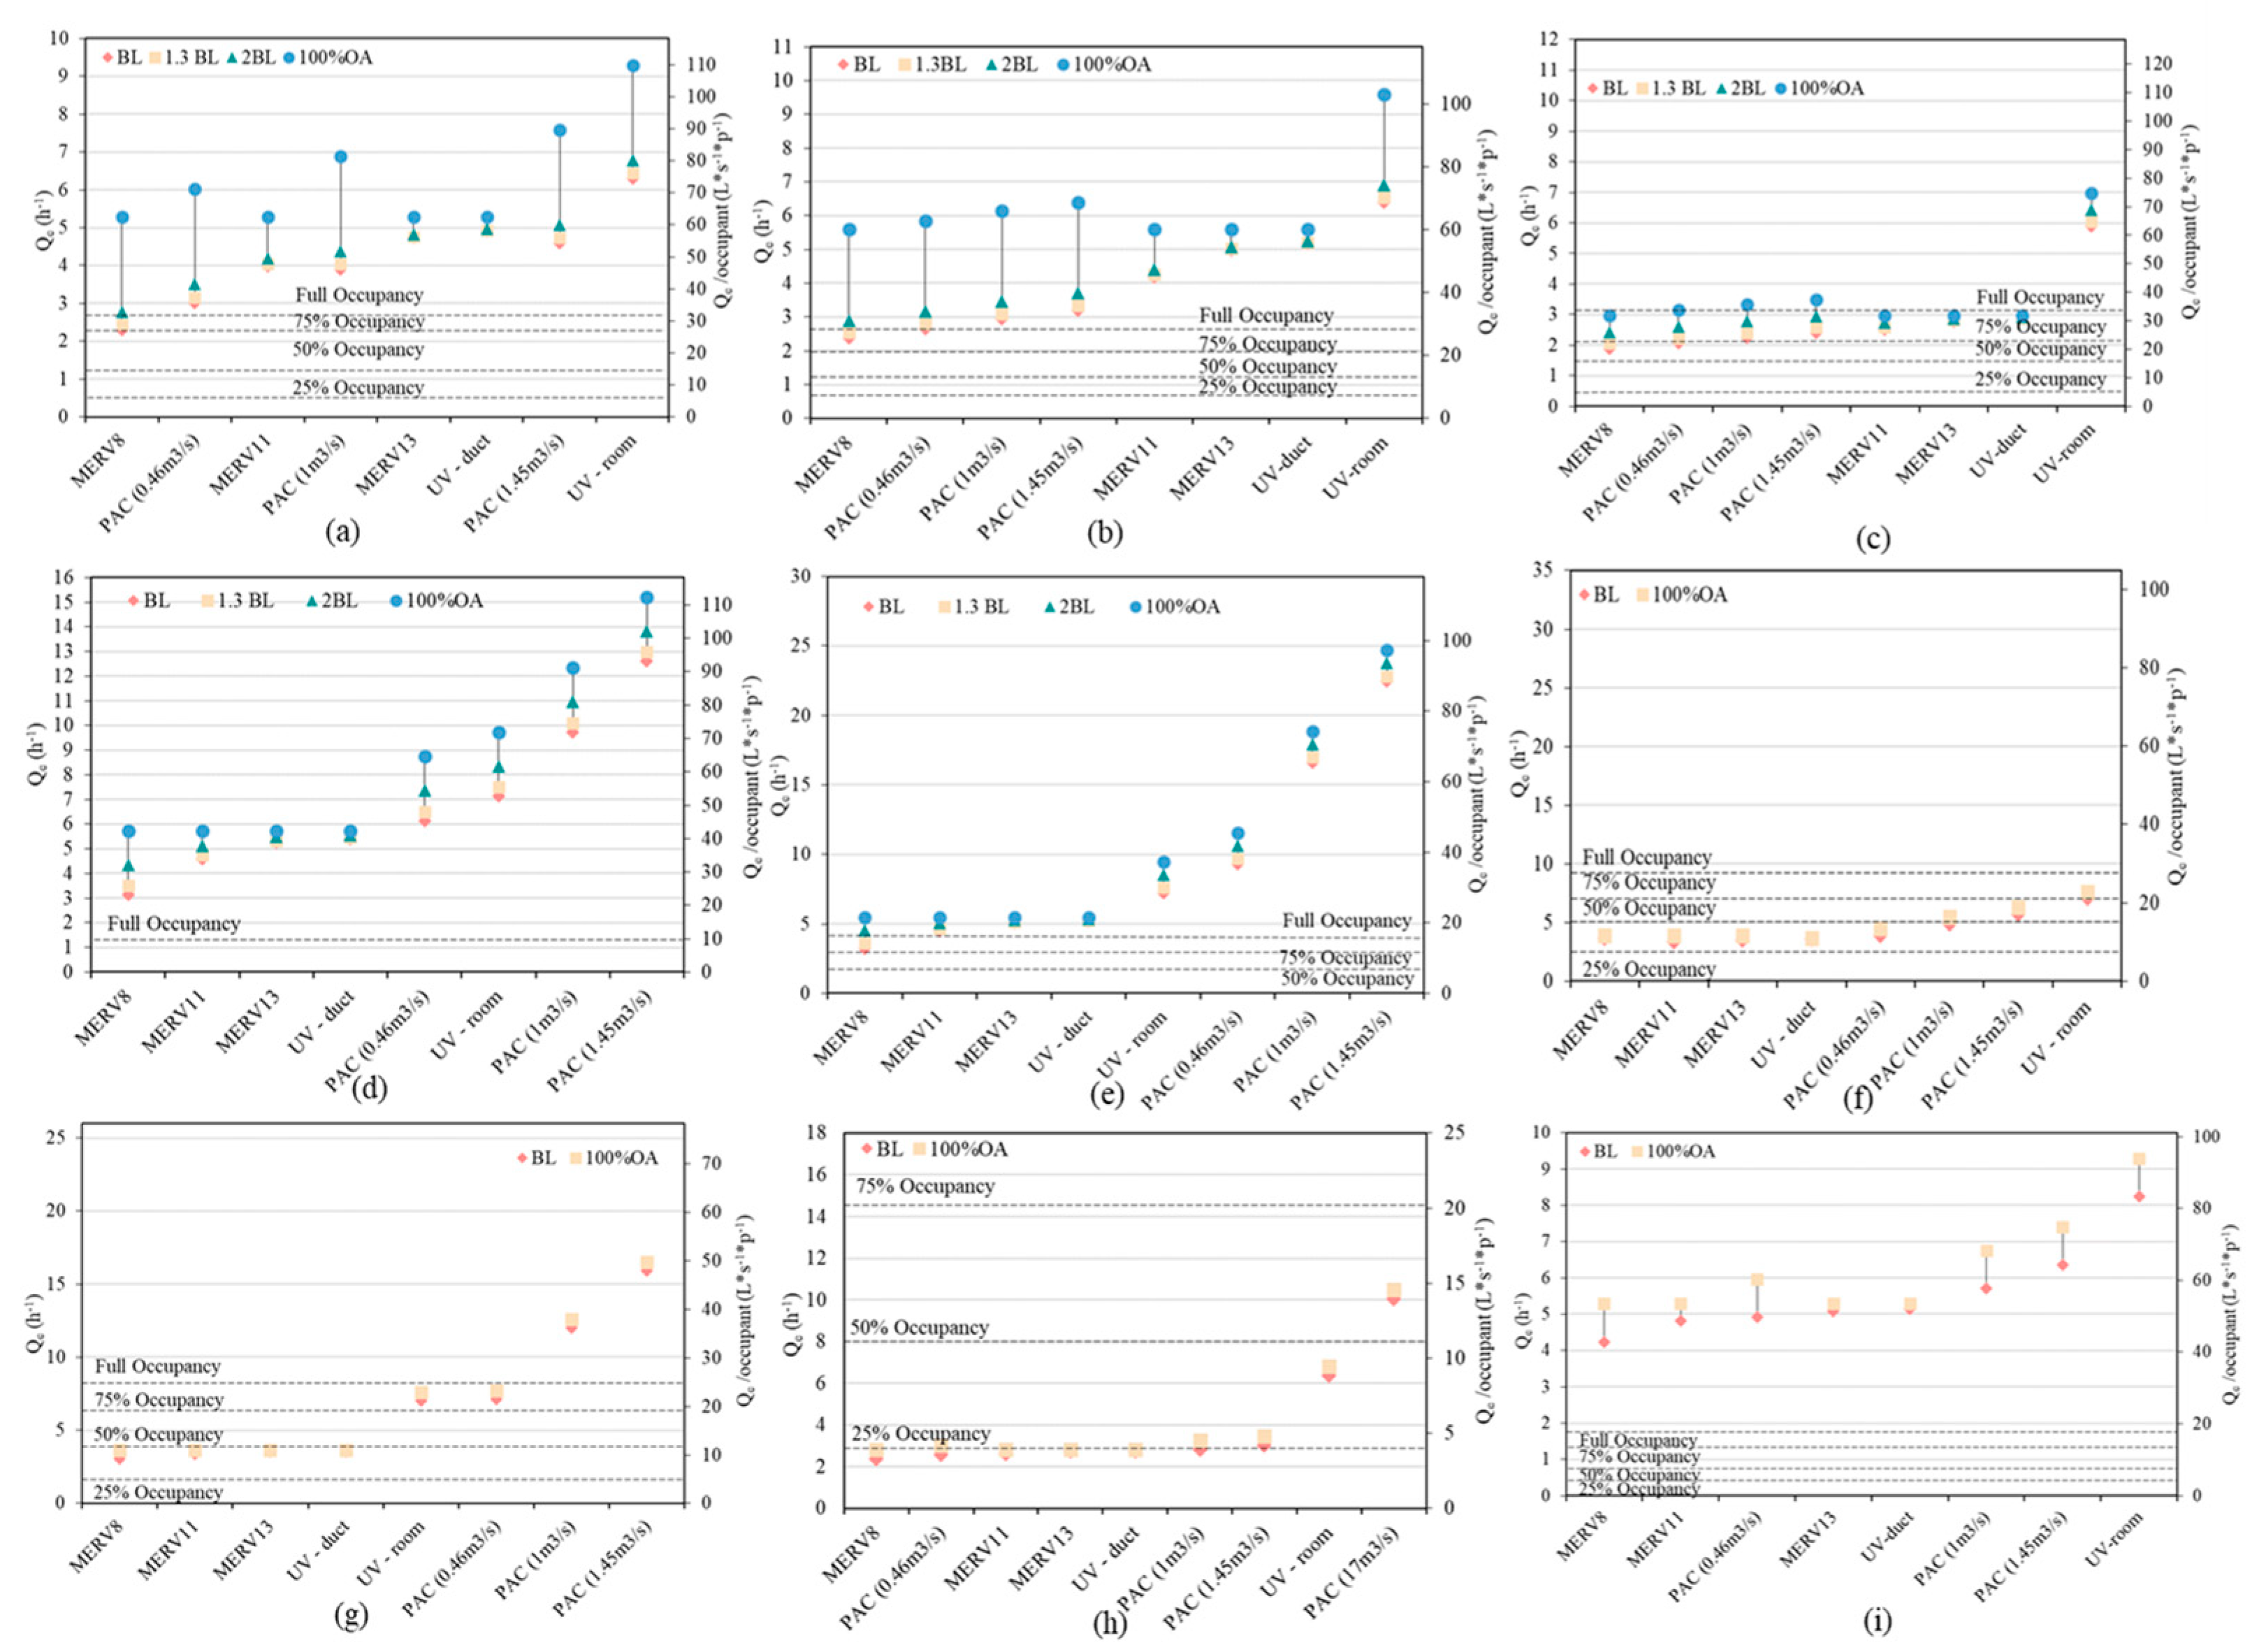
3.6. Mitigation under Different Occupancies

Minimum equivalent air change rates for different occupancies (100%, 75%, 50%, and 25%) for contagious potential C/I = 1 were calculated for no mask-wearing and full mask-wearing scenarios, using D/(Qe × V). Results are in Figure 17 and Figure 18. For example, for the baseline mitigation strategy “BL + MERV8” in the core zone of the Medium Office, 25% occupancy capacity could be allowed for no mask-wearing scenarios while 75% occupancy could be permitted with full mask-wearing. With baseline mitigation, 25% capacity could avoid community transmission for most no-mask wearing scenarios except for the large capacity public spaces: Stand-Alone Retail, Classrooms, and the Auditorium. For these spaces, full mask-wearing is suggested to be combined with 25% occupancy capacity. Moreover, for the auditorium, this was not sufficient, and in-room UV or the large capacity PAC (17 m3/s) must be used to satisfy the mitigation need. To return to the pre-pandemic situation (no mask, full occupancy), office working areas should adopt 100% OA and implement in-room air-cleaning (UV, large capacity PAC). Similar strategies are recommended for Retail and the time spent shopping should be limited.

4. Discussion

The aim of this study was to identify effective combinations of mitigation strategies for preventing the spread of SARS-CoV-2 in public buildings. The study of layered mitigation strategies modeled long-range transmission of SARS-CoV-2 quanta in five DOE prototype commercial buildings. Results showed that duct-treatment air-cleaning strategies (upgrading MERV filter levels, use of in-duct UV) are relatively more effective in large rooms that can accommodate hundreds of occupants. In contrast, room-treatment strategies (adding PACs, in-room UV) are more effective in smaller spaces. For different rooms, the priority of mitigation strategies would change depending on the room volume, occupants’ exposure time, and HVAC system designs. Results from this study can be generalized to other airborne infections such as measles or flu.
For mitigation strategies, the air-cleaning contribution from in-duct air cleaning devices (MERV, UV light) decreases as the OA ratio increases. The overall maximum duct-mitigation performance is in 100% OA supply. An appropriate match of outdoor air and MERV filters can achieve similar risk reduction to 100% OA supply performance. In a study by Stabile et al., twenty-five percent outdoor air and HEPA filters were found to have the same performance level as 100% outdoor air [12].
Thus, to achieve the optimal engineering control for mechanically ventilated buildings, duct mitigation should be designed to achieve a performance level such as that of 100% OA. This can be realized by adopting 100% OA or making a proper match of MERV filters and OA supply. Then, according to the expected exposure duration, occupancy capacity, and mask-wearing situation, efforts required for room-mitigation strategies (in-room UV, PACs) could be assessed (see Figure 17 and Figure 18).
Detailed strategy-design instructions have been investigated in hospitals [46]; note that in commercial public buildings, the current ventilation standard is significantly lower than in hospitals. Previous investigations found that increasing outdoor air supply rates and MERV filter levels could reduce infection risks, though a “case-by-case” design was suggested [14]. Additional room control measures and personal ventilation were proposed as auxiliary mitigation strategies; however, specific scenarios were not clarified. According to the results from this study, for the same mitigation strategy, the effectiveness could vary dramatically among different types of buildings, for example, for office buildings, the enhancement of duct treatment is more effective than schools, as office baseline OA design rates are significantly lower. The in-depth analysis of different building types and their mitigation measures can be further explored in future studies.
The relationship between infection risks and D/(Qe × V) (D—duration, V—room volume and Qe equivalent air change rate) were established. This enables an estimation of Qe in the engineering design of ventilation. With the known acceptable risk level, the value of D/(Qe × V) could be obtained from a given relationship (Figure 15a). The Qe could then be estimated from the given D and V of the scenario, as shown in Section 3.5. The Qe could then help make ventilation design decisions (MERV filter level, portable air cleaner capacity, etc.) in the room. However, each building has its own characteristics, and people should analyze their building if they want to understand it. It should be noted that the required Qe is calculated for the source zone, which is the room that contains the infector. For a multizone building in daily life, the design goal could be adjusted to a more general context. When an infector enters the building, how to make sure that there are no transmission risks inside the building? How to make sure the systematic designs of ventilation strategies achieve the overall mitigation goal? Limitations do exist in this study for taking a great deal of simulation cases into consideration, these questions could be answered with more detailed analysis in the future.
For future investigations, more real-life scenarios could be evaluated using the CONTAM-quanta approach. For example, more infectors could be included to take the local prevalence rate of SARS-CoV-2 into consideration. Occupancy schedules could be applied to evaluate various ventilation demands during the day. The vaccination rate can also be considered as the immune population is increasing over time. What is more, the stochastic effect could also be considered later as what has been done in the Skagit Valley Chorale super-spreading event investigation [47]. In addition, flow patterns could be manipulated to maximally reduce quanta concentrations in occupants’ breathing zone and promote the effectiveness of mitigation strategies. The computational fluid dynamics (CFD) is an effective method for predicting detailed indoor airflows, which has been developed for the CONTAM multizone modeling [48,49]. Utilizing the CFD capabilities of CONTAM, the pros and cons of different mechanical mitigation strategies would be better understood.

5. Conclusions

Effective layered mitigation strategies can reduce individual infection risks when occupying indoor spaces with COVID-19 infectors. The multizone CONTAM modeling used in this study enables a case-to-case design of mitigation approaches, and infection risks and mitigation strategies in five different types of DOE prototype buildings were investigated. The zone-to-zone quanta transmission and quanta fates were also reported. Results indicate that the potential of zone-to-zone transmissions exists, though the threat is relatively lower than that in the source zone. Both air-leakage sites and central ventilation systems can induce quanta into neighboring zones. For quanta fates, the sum of the amounts exfiltrated and filtered can display the air-cleaning ability of the ventilation system. A proper match of outdoor air percentage and MERV filters can achieve a similar performance to 100% outside air. Evaluation results also suggest that additional mitigation efforts are needed for confined spaces with long exposure duration. For these spaces, air-cleaning strategies cannot simply depend on duct mitigation; room-treatment strategies (PACs, in-room UV) are also needed. For example, the portable air-cleaner (PAC at 1 m3/s) is recommended for the Meeting Room scenario. In addition, masks can dramatically reduce infection risks. The use of masks could permit a two-hour meeting in Meeting Room with baseline ventilation settings. Finally, relationships between individual infection risks and a risk-relevant factor “Exposure duration (D, h)/(Equivalent air change rate (Qe, h−1) × Room volume (V, m3))” was obtained for a parametric estimation of risks, which could benefit future air-cleaning design and practice in response to the reopening of commercial buildings during an infectious airborne disease pandemic.

Author Contributions

Conceptualization, S.L.M., Z.Z., L.W. and M.J.B.; methodology, S.L.M., Z.Z. and L.W.; software, S.Y. and L.W.; validation, S.Y. and L.W.; formal analysis, S.Y., S.L.M., Z.Z. and L.W.; investigation, S.Y.; resources, S.Y., S.L.M., Z.Z. and L.W.; data curation, S.Y., S.L.M., Z.Z. and L.W.; writing—original draft preparation, S.Y.; writing—review and editing, S.L.M., Z.Z., M.J.B. and L.W.; visualization, S.Y., S.L.M., Z.Z., L.W. and M.J.B.; supervision, S.L.M., Z.Z. and L.W.; project administration, M.J.B. and S.L.M.; funding acquisition, M.J.B. and S.L.M. All authors have read and agreed to the published version of the manuscript.

Funding

The research was supported by Carrier Global Corporation (United States).

Data Availability Statement

The data presented in this study are available on request from the corresponding authors.

Acknowledgments

The authors acknowledge the much-needed technical support from William Stuart Dols, Steven Emmerich, and Lisa Ng at the US National Institute of Standards and Technology for the CONTAM models of the US DOE Prototype Commercial Buildings.

Conflicts of Interest

The authors declare no conflict of interest.

Nomenclature

ALEffective air leakage area (m2)
BBreathing rate (m3/s)
CNumber of infection cases
CavgAverage quanta concentration (quanta/m3)
CDFlow discharge coefficient
CiContaminant concentration in the infectious zone (quanta/m3)
CjContaminant concentration in neighbor zones (quanta/m3)
CsContaminant concentration of the supply air (quanta/m3)
CrecContaminant concentration of the recirculation air (quanta/m3)
CoaContaminant concentration of the outdoor air (quanta/m3)
EOccupant exposure to contaminants (quanta)
FmPercentage of mask-wearing occupants
GGeneration rate of quanta from the infector (quanta/m3)
MinhInhale removal efficiency of masks (%)
MexhExhale efficiency of masks (%)
nNumber of inhaled quanta
QVolumetric flow rate (m3/s)
QeEquivalent air change rate (1/h)
QOAOutdoor air ventilation rate (1/h)
QMERVEquivalent air change rate from MERV filters (1/h)
QPACEquivalent air change rate from portable air cleaner (1/h)
QGUVEquivalent air change rate from in-duct GUV light (1/h)
QdepositionQuanta deposition rate (1/h)
QdeactivationViral deactivation rate (1/h)
QrVolumetric flow rate of the return air (m3/s)
QlxVolumetric flow rate of the local exhaust air (m3/s)
QacVolumetric flow rate of the air cleaner (m3/s)
QrecVolumetric flow rate of the recirculation air (m3/s)
QUVrEquivalent volumetric flow rate of in-room GUV devices for pathogen inactivation (m3/s)
QdepEquivalent volumetric flow rate of aerosol deposition (m3/s)
QdecEquivalent volumetric flow rate of viral aerosol decay/inactivation (m3/s)
QexfExfiltration flow rate to neighbor zones (m3/s)
Qinf,jInfiltration from zone j (m3/s)
Qexf,jExfiltration from zone j (m3/s)
η MERV The efficiency of MERV filters
η UVduct The efficiency of in-duct GUV light
η ac The efficiency of portable air cleaner
SNumber of susceptible individuals
tTime (s)
VVolume (m3)
Δ t Exposure time (h)
Δ P r Reference pressure difference (Pa)
Δ P j , i Pressure difference between zone j and zone i (Pa)

References

  1. Comber, L.; Murchu, E.O.; Drummond, L.; Carty, P.G.; Walsh, K.A.; De Gascun, C.F.; Connolly, M.A.; Smith, S.M.; O’Neill, M.; Ryan, M.; et al. Airborne transmission of SARS-CoV-2 via aerosols. Rev. Med. Virol. 2021, 31, e2184. [Google Scholar] [CrossRef] [PubMed]
  2. Omicron Variant: What You Need to Know. Centers for Disease Control and Prevention. Available online: https://www.cdc.gov/coronavirus/2019-ncov/variants/omicron-variant.html (accessed on 10 January 2022).
  3. Map of COVID-19 Case Trends and Restrictions. Available online: https://www.usatoday.com/storytelling/coronavirus-reopening-america-map/ (accessed on 18 March 2022).
  4. COVID-19 Restrictions Easing Next Week, Fully Lifted on 21 March. Available online: https://novascotia.ca/news/release/?id=20220223008 (accessed on 18 March 2022).
  5. COVID-19 in Europe: England Ends all Restrictions and Removes Isolation Rule. Available online: https://www.euronews.com/2022/02/23/covid-19-in-europe-italy-to-end-state-of-emergency-and-ease-restrictions-in-april (accessed on 18 March 2022).
  6. Kurnitski, J.; Kiil, M.; Wargocki, P.; Boerstra, A.; Seppänen, O.; Olesen, B.; Morawska, L. Respiratory infection risk-based ventilation design method. Build. Environ. 2021, 206, 108387. [Google Scholar] [CrossRef]
  7. Li, Y.; Leung, G.M.; Tang, J.W.; Yang, X.; Chao, C.Y.H.; Lin, J.Z.; Lu, J.W.; Nielsen, P.V.; Niu, J.; Qian, H.; et al. Role of ventilation in airborne transmission of infectious agents in the built environment—A multidisciplinary systematic review. Indoor Air 2007, 17, 2–18. [Google Scholar] [CrossRef] [PubMed]
  8. Buonanno, G.; Stabile, L.; Morawska, L. Estimation of airborne viral emission: Quanta emission rate of SARS-CoV-2 for infection risk assessment. Environ. Int. 2020, 141, 105794. [Google Scholar] [CrossRef] [PubMed]
  9. Riley, E.C.; Murphy, G.; Riley, R.L. Airborne spread of measles in a suburban elementary school. Am. J. Epidemiol. 1978, 107, 421–432. [Google Scholar] [CrossRef]
  10. Peng, Z.; Rojas, A.P.; Kropff, E.; Bahnfleth, W.; Buonanno, G.; Dancer, S.J.; Kurnitski, J.; Li, Y.; Loomans, M.G.; Marr, L.C. Practical indicators for risk of airborne transmission in shared indoor environments and their application to covid-19 outbreaks. Environ. Sci. Technol. 2022, 56, 1125–1137. [Google Scholar] [CrossRef]
  11. Dai, H.; Zhao, B. Association of the infection probability of COVID-19 with ventilation rates in confined spaces. Build. Simul. 2020, 13, 1321–1327. [Google Scholar] [CrossRef]
  12. Shen, J.; Kong, M.; Dong, B.; Birnkrant, M.J.; Zhang, J. A systematic approach to estimating the effectiveness of multi-scale IAQ strategies for reducing the risk of airborne infection of SARS-CoV-2. Build. Environ. 2021, 200, 107926. [Google Scholar] [CrossRef]
  13. Stabile, L.; Pacitto, A.; Mikszewski, A.; Morawska, L.; Buonanno, G. Ventilation procedures to minimize the airborne transmission of viruses in classrooms. Build. Environ. 2021, 202, 108042. [Google Scholar] [CrossRef]
  14. Barbosa, B.P.P.; de Carvalho Lobo Brum, N. Ventilation mode performance against airborne respiratory infections in small office spaces: Limits and rational improvements for Covid-19. J. Braz. Soc. Mech. Sci. Eng. 2021, 43, 316. [Google Scholar] [CrossRef]
  15. Bertone, M.; Mikszewski, A.; Stabile, L.; Riccio, G.; Cortellessa, G.; d′Ambrosio, F.R.; Papa, V.; Morawska, L.; Buonanno, G. Assessment of SARS-CoV-2 airborne infection transmission risk in public buses. Geosci. Front. 2022, 13, 101398. [Google Scholar] [CrossRef]
  16. Yates, T.A.; Khan, P.Y.; Knight, G.M.; Taylor, J.G.; McHugh, T.D.; Lipman, M.; White, R.G.; Cohen, T.; Cobelens, F.G.; Wood, R.; et al. The transmission of Mycobacterium tuberculosis in high burden settings. Lancet Infect. Dis. 2016, 16, 227–238. [Google Scholar] [CrossRef] [Green Version]
  17. Shrestha, P.; DeGraw, J.W.; Zhang, M.; Liu, X. Multizonal modeling of SARS-CoV-2 aerosol dispersion in a virtual office building. Build. Environ. 2021, 206, 108347. [Google Scholar] [CrossRef]
  18. Kennedy, M.; Lee, S.J.; Epstein, M. Modeling aerosol transmission of SARS-CoV-2 in multi-room facility. J. Loss Prev. Process Ind. 2021, 69, 104336. [Google Scholar] [CrossRef]
  19. Pease, L.F.; Wang, N.; Salsbury, T.I.; Underhill, R.M.; Flaherty, J.E.; Vlachokostas, A.; Kulkarni, G.; James, D.P. Investigation of potential aerosol transmission and infectivity of SARS-CoV-2 through central ventilation systems. Build. Environ. 2021, 197, 107633. [Google Scholar] [CrossRef]
  20. Cotman, Z.J.; Bowden, M.J.; Richter, B.P.; Phelps, J.H.; Dibble, C.J. Factors affecting aerosol SARS-CoV-2 transmission via HVAC systems; a modeling study. PLOS Comput. Biol. 2021, 17, e1009474. [Google Scholar] [CrossRef]
  21. ASHRAE. ASHRAE Position Document on Infectious Aerosols; ASHRAE: Atlanta, GA, USA, 2020. [Google Scholar]
  22. REHVA. REHVA COVID-19 Guidance Document; REHVA: Ixelles, Belgium, 2020. [Google Scholar]
  23. Guo, M.; Xu, P.; Xiao, T.; He, R.; Dai, M.; Miller, S.L. Review and comparison of HVAC operation guidelines in different countries during the COVID-19 pandemic. Build. Environ. 2021, 187, 107368. [Google Scholar] [CrossRef]
  24. Axley, J.W. Multi-zone dispersal analysis by element assembly. Build. Environ. 1989, 24, 113–130. [Google Scholar] [CrossRef]
  25. Walton, G. Airflow and multiroom thermal analysis. ASHRAE Trans. 1982, 88, 78–91. [Google Scholar]
  26. Li, Y.; Duan, S.; Yu, I.; Wong, T. Multi-zone modeling of probable SARS virus transmission by airflow between flats in Block E, Amoy Gardens. Indoor Air 2005, 15, 96–111. [Google Scholar] [CrossRef]
  27. Deru, M.; Field, K.; Studer, D.; Benne, K.; Griffith, B.; Torcellini, P.; Liu, B.; Halverson, M.; Winiarski, D.; Rosenberg, M. US Department of Energy Commercial Reference Building Models of the National Building Stock; National Renewable Energy Laboratory: Golden, CO, USA, 2011.
  28. Ng, L.C.; Musser, A.; Persily, A.K.; Emmerich, S.J. Airflow and Indoor Air Quality Models of DOE Reference Commercial Buildings; National Institute of Standards and Technology: Gaithersburg, MD, USA, 2012; p. 12.
  29. Dols, W.; Polidoro, B. CONTAM User Guide and Program Documentation; version 3.4; National Institute of Standards and Technology: Gaithersburg, MD, USA, 2020; p. 1887.
  30. Ng, L.; Musser, A.; Persily, A.; Emmerich, S. Airflow and Indoor Air Quality Models of DOE Prototype Commercial Buildings; Technical Note (NIST TN); National Institute of Standards and Technology: Gaithersburg, MD, USA, 2019. [CrossRef]
  31. Yan, S.; Wang, L.; Birnkrant, M.J.; Zhai, J.; Miller, S.L. Evaluating SARS-CoV-2 airborne quanta transmission and exposure risk in a mechanically ventilated multizone office building. Build. Environ. 2022, 219, 109184. [Google Scholar] [CrossRef] [PubMed]
  32. Wells, W.F. Airborne Contagion and Air Hygiene: An Ecological Study of Droplet Infections; Commonwealth Fund: New York, NY, USA, 1955. [Google Scholar]
  33. Aganovic, A.; Bi, Y.; Cao, G.; Drangsholt, F.; Kurnitski, J.; Wargocki, P. Estimating the impact of indoor relative humidity on SARS-CoV-2 airborne transmission risk using a new modification of the Wells-Riley model. Build. Environ. 2021, 205, 108278. [Google Scholar] [CrossRef] [PubMed]
  34. Buonanno, G.; Morawska, L.; Stabile, L. Quantitative assessment of the risk of airborne transmission of SARS-CoV-2 infection: Prospective and retrospective applications. Environ. Int. 2020, 145, 106112. [Google Scholar] [CrossRef] [PubMed]
  35. Thatcher, T.L.; Lai, A.C.K.; Moreno-Jackson, R.; Sextro, R.G.; Nazaroff, W.W. Effects of room furnishings and air speed on particle deposition rates indoors. Atmos. Environ. 2002, 36, 1811–1819. [Google Scholar] [CrossRef] [Green Version]
  36. Van Doremalen, N.; Bushmaker, T.; Morris, D.H.; Holbrook, M.G.; Gamble, A.; Williamson, B.N.; Tamin, A.; Harcourt, J.L.; Thornburg, N.J.; Gerber, S.I.; et al. Aerosol and surface stability of SARS-CoV-2 as compared with SARS-CoV-1. N. Engl. J. Med. 2020, 382, 1564–1567. [Google Scholar] [CrossRef]
  37. Miller, S.L.; MacHer, J.M. Evaluation of a Methodology for Quantifying the Effect of Room Air Ultraviolet Germicidal Irradiation on Airborne Bacteria. Aerosol Sci. Technol. 2000, 33, 274–295. [Google Scholar] [CrossRef]
  38. Liu, Y.; Ning, Z.; Chen, Y.; Guo, M.; Liu, Y.; Gali, N.K.; Sun, L.; Duan, Y.; Cai, J.; Westerdahl, D.; et al. Aerodynamic analysis of SARS-CoV-2 in two Wuhan hospitals. Nature 2020, 582, 557–560. [Google Scholar] [CrossRef]
  39. ASHRAE. Method of Testing General Ventilation Air-Cleaning Devices for Removal Efficiency by Particle Size; American Society of Heating, Refrigerating and Air-Conditioning Engineer: Atlanta, GA, USA, 2018. [Google Scholar]
  40. Miller-Leiden, S.; Lohascio, C.; Nazaroff, W.W.; Macher, J.M. Effectiveness of in-Room Air Filtration and Dilution Ventilation for Tuberculosis Infection Control. J. Air Waste Manag. Assoc. 1996, 46, 869–882. [Google Scholar] [CrossRef]
  41. Kujundzic, E.; Hernandez, M.; Miller, S.L. Ultraviolet germicidal irradiation inactivation of airborne fungal spores and bacteria in upper-room air and HVAC in-duct configurations. J. Environ. Eng. Sci. 2007, 6, 1–9. [Google Scholar] [CrossRef]
  42. Pan, J.; Harb, C.; Leng, W.; Marr, L.C. Inward and outward effectiveness of cloth masks, a surgical mask, and a face shield. Aerosol Sci. Technol. 2021, 55, 718–733. [Google Scholar] [CrossRef]
  43. U.S. EPA. Exposure Factors Handbook 2011 Edition (Final Report); U.S. Environmental Protection Agency: Washington, DC, USA, 2011.
  44. Chu, D.K.W.; Gu, H.; Chang, L.D.J.; Cheuk, S.S.Y.; Gurung, S.; Krishnan, P.; Ng, D.Y.M.; Liu, G.Y.Z.; Wan, C.K.C.; Tsang, D.N.C.; et al. SARS-CoV-2 Superspread in Fitness Center, Hong Kong, China, March 2021. Emerg. Infect. Dis. 2021, 27, 2230–2232. [Google Scholar] [CrossRef]
  45. Li, Y.; Qian, H.; Hang, J.; Chen, X.; Cheng, P.; Ling, H.; Wang, S.; Liang, P.; Li, J.; Xiao, S.; et al. Probable airborne transmission of SARS-CoV-2 in a poorly ventilated restaurant. Build. Environ. 2021, 196, 107788. [Google Scholar] [CrossRef]
  46. Emmerich, S.J.; Heinzerling, D.; Choi, J.-I.; Persily, A.K. Multizone modeling of strategies to reduce the spread of airborne infectious agents in healthcare facilities. Build. Environ. 2013, 60, 105–115. [Google Scholar] [CrossRef]
  47. Miller, S.L.; Nazaroff, W.W.; Jimenez, J.L.; Boerstra, A.; Buonanno, G.; Dancer, S.J.; Kurnitski, J.; Marr, L.C.; Morawska, L.; Noakes, C. Transmission of SARS-CoV-2 by inhalation of respiratory aerosol in the Skagit Valley Chorale superspreading event. Indoor Air 2020, 31, 314–323. [Google Scholar] [CrossRef]
  48. Wang, L.; Chen, Q. Validation of a Coupled Multizone-CFD Program for Building Airflow and Contaminant Transport Simulations. HVACR Res. 2007, 13, 267–281. [Google Scholar] [CrossRef]
  49. Wang, L.L.; Dols, W.S.; Chen, Q. Using CFD Capabilities of CONTAM 3.0 for Simulating Airflow and Contaminant Transport in and around Buildings. HVACR Res. 2010, 16, 749–763. [Google Scholar] [CrossRef]
Figure 1. Mitigation strategies in multizone spaces for preventing airborne quanta transmission.
Buildings 13 00102 g001
Figure 2. DOE prototype models in CONTAM: (a) Medium Office, (b) Large Office, (c) Stand-Alone Retail, (d) Secondary School, and (e) Small Hotel.
Buildings 13 00102 g002
Figure 3. Outdoor atmospheric parameters for CONTAM simulations (Chicago, 21 December). Ta is the air temperature.
Buildings 13 00102 g003
Figure 4. Seventy-two combinations of mitigations evaluated in this study.
Buildings 13 00102 g004
Figure 5. Medium Office (a) top-view diagram showing outdoor air flows (blue) and exhaust/return flows (gray) and (b) quanta concentration as a function of time during a workday with the infector in the core zone on the first floor. Contaminant generation source and deposition/deactivation items were added on the top-left of each room (small symbols).
Buildings 13 00102 g005
Figure 6. Large Office (a) top-view diagram of the Large Office 1st floor and (b) quanta concentration as a function of time during a workday with the infector in the core zone on the first floor. Small icons in each room were contaminant generation source, deposition/deactivation items, and the supply/return of HVAC systems (small symbols).
Buildings 13 00102 g006
Figure 7. Stand-Alone Retail (a) top-view diagram of the Stand-Alone Retail and (b) quanta concentration as a function of time during a workday with the infector in the core zone on the first floor. Small icons in each room were contaminant generation source, deposition/deactivation items, and the supply/return of HVAC systems (small symbols).
Buildings 13 00102 g007
Figure 8. Small Hotel (a) top-view diagram of the Small Hotel 1st floor and (b) quanta concentration as a function of time during a workday with the infector in the core zone on the first floor. Small icons in each room were contaminant generation source, deposition/deactivation items, and the supply/return of HVAC systems (small symbols).
Buildings 13 00102 g008
Figure 9. Secondary School (a) top-view diagram of the Secondary School 1st floor and (b) quanta concentration as a function of time during a workday with the infector in the core zone on the first floor. Small icons in each room were contaminant generation source, deposition/deactivation items, and the supply/return of HVAC systems.
Buildings 13 00102 g009
Figure 10. The fate of airborne quanta in Medium Office (Baseline case) versus exposure duration.
Buildings 13 00102 g010
Figure 11. Quanta fate of released quanta during susceptible exposure duration. Infector was in the core zone of all buildings, except for small hotel and school, where they were in the meeting room and classroom, respectively. Susceptible duration information is indicated in the column labels (also see Table 1).
Buildings 13 00102 g011
Figure 12. Individual infection risk P [%] for baseline cases for evaluated DOE commercial prototype buildings. The height of the column is the mean risk value; error bars are maximum and minimum values.
Buildings 13 00102 g012
Figure 13. Individual Infection risks for Small Hotel: (a) Front Lounge—1 h exposure, and (b) Meeting Room—2 h exposure. C/I is the contagious potential. The spread could happen when C/I exceeds unity.
Buildings 13 00102 g013
Figure 14. Estimated mitigation strategy risk reduction relative to the baseline case ((Pbaseline  Pstrategy)/Pbaseline): (a) Medium Office—Core zone, (b) Large Office—Core zone, (c) Stand Alone Retail—Core Retail, (d) Small Hotel—Front Lounge, (e) Small Hotel—Meeting Room, (f) Secondary School—Classroom, (g) Secondary School—Corner Classroom, (h) Secondary School—Auditorium, (i) Secondary School—café.
Buildings 13 00102 g014
Figure 15. Relationship between individual infection risks and D/(Qe × V) (Qe—Equivalent air change rate (per hour); V—Volume; D—Duration). (a) Different mask-wearing scenarios. (b) Comparisons between multizone modeling and single-zone Wells–Riley.
Buildings 13 00102 g015
Figure 16. The relationship between individual infection risk and D/(Qe × V), where Qe is Equivalent air change rate (per hour); V is Volume (m3), and D is Duration (h) for (a) No masks; (b) 100% mask-wearing.
Buildings 13 00102 g016
Figure 17. Minimum Qe for different mitigations without mark-wearing: (a) Medium Office—Core zone, (b) Large Office—Core zone, (c) Stand Alone Retail—Core Retail, (d) Small Hotel—Front Lounge, (e) Small Hotel—Meeting Room, (f) Secondary School—Classroom, (g) Secondary School—Corner Classroom, (h) Secondary School—Auditorium, (i) Secondary School—Café.
Buildings 13 00102 g017
Figure 18. Minimum Qe for different mitigations with mark-wearing: (a) Medium Office—Core zone, (b) Large Office—Core zone, (c) Stand Alone Retail—Core Retail, (d) Small Hotel—Front Lounge, (e) Small Hotel—Meeting Room, (f) Secondary School—Classroom, (g) Secondary School—Corner Classroom, (h) Secondary School—Auditorium, (i) Secondary School—Cafe.
Buildings 13 00102 g018
Table 1. Infectious Zone Characteristics for Simulated Prototype Buildings.
Building TypeArea (m2)Volume (m3)HVAC System TypeSupply Airflow Rates
(m3/s)
OA Ratio (%)Baseline Air Change Rate
(1/h)
Maximum OccupancyDuration of Exposure Modeled
Medium Office (Core Zone)8222255variable air volume (VAV)2.9514.40.68538:00–17:00 (9 h)
Large Office (Core Zone)23246376variable air volume (VAV)8.25140.651348:00–17:00 (9 h)
Stand-Alone Retail
(Core Retail)
16329955constant-volume single-zone system5.6733.30.68258Infector (Staff):
8:00–22:00
Susceptible (Customer):
8:00–16:00
Susceptible
Small Hotel
(Front Lounge)
163546packaged terminal air conditioner (PTAC)0.7432.11.5753Infector (Staff):
5:00–20:00
Susceptible (Guest):
12:00–13:00 (1 h)
Small Hotel
(Meeting Room)
80269packaged terminal air conditioner (PTAC)0.34371.6843Infector:
13:00–15:00
Susceptible:
13:00–15:00 (2 h)
Secondary School
(Classroom)
4851940variable air volume (VAV)1.27731.721808:00–15:00 (7 h)
Secondary School
(Corner Classroom)
100401variable air volume (VAV)0.26731.70378:00–15:00 (7 h)
Secondary School (Auditorium)19677866constant air volume (CAV)4.10701.31159615:00–19:00 (4 h)
Secondary School
(Café)
6092439constant air volume (CAV)2.95703.05679:00–14:00 (5 h)
Table 2. SARS-CoV-2 Quanta-Related Modeling Parameters.
InputParametersReference
Initial concentration0 quanta/m3-
Generation rate65 quanta/h[8,34]
Quanta removalSurface deposition rate0.3 h−1[35]
Quanta deactivation rate0.63 h−1[36]
UVGI (in-room) Qe4 h−1[37]
Default quanta particle size1–3 μm[38]
MERV8 removal efficiency20%[39]
MERV11 removal efficiency65%[39]
MERV13 removal efficiency85%[39]
HEPA removal efficiency99%[40]
UVGI (in-duct) removal efficiency87%[41]
PAC10.46 m3/sFrom manufacturer
PAC21 m3/s
PAC31.45 m3/s
PAC417 m3/s
Mask wearingMask wearing percentage0/100%-
Outward protection effectiveness50%[42]
Inward protection effectiveness30%[42]
Breathing rate0.72 m3/h[43]
Disclaimer/Publisher’s Note: The statements, opinions and data contained in all publications are solely those of the individual author(s) and contributor(s) and not of MDPI and/or the editor(s). MDPI and/or the editor(s) disclaim responsibility for any injury to people or property resulting from any ideas, methods, instructions or products referred to in the content.

