Abstract
Recently, expanded metal mesh has been used on the facades of many buildings in Taiwan. Therefore, in this study, we evaluated the impact of expanded metal mesh on natural lighting and energy consumption in office buildings. First, the compatibility of EnergyPlus and DIVA simulation software with expanded metal mesh was verified using field measurements. The results show a high correlation between simulation and measurement, except for some periods of direct sunlight. Then, we evaluated the effects of window-to-wall ratio (WWR), glass, and expanded metal mesh on energy consumption and lighting. The results show that WWR has a significant influence on both lighting and energy consumption. The greater the WWR, the greater the energy saving potential of the expanded metal mesh and glass. If the SHGC of the glass is lower, the potential of the expanded metal mesh to save air conditioning energy consumption is smaller, and, as a result, the expanded metal mesh may increase the total energy consumption. Of the 36 simulation cases performed, three cases met the LEED lighting standard. The case with minimum energy consumption is achieved when SHGC = 50%, using laminated clear glass and expanded metal mesh with a 21% perforated ratio.
1. Introduction
The carbon emissions caused by the construction industry account for about 38% of the world’s carbon emissions, and the energy consumption accounts for about 35% worldwide [1]. In 2015, the Taiwanese government announced the “Greenhouse Gas Reduction and Management Act,” which aims to reduce carbon emissions by 50% by 2050 compared to 2005.
In Taiwan, according to the statistics of the Taiwan Green Productivity Foundation, of the average total energy consumption of office buildings in 2020, air conditioning accounted for 56.42%, lighting accounted for 13.34%, business affairs equipment accounted for 9.81%, and other equipment accounted for 20.43% [2]. Therefore, to reduce the total energy consumption of office buildings in Taiwan, reducing the energy consumption related to air conditioning and lighting is the primary goal. Many office buildings tend to be designed with a high proportion of windows, and most building types in Taiwan are fully air-conditioned. Reducing the total energy consumption of an office building has great potential if external shadings can be used in conjunction with natural light sources. In Taiwan’s green building label [3], one of the indicators is the energy-saving design of air conditioning and lighting electricity for the largest power-consuming parts. The evaluation focuses on the energy-saving design of the building shell, air conditioning efficiency design, and lighting efficiency design.
In the humid subtropical climate, summers are usually long, hot, and humid, whereas winters are mild and cool. Taiwan, Hong Kong, and Singapore have such warm and humid climate conditions. Therefore, in order to deal with these high temperatures and humidity, many construction techniques and forms have been derived [4,5,6]. For example, the use of deep overhangs or external shadings to reduce solar radiation entering the room is a common method [7,8]. Lau et al. [9] discussed the difference in energy-saving effect using different external shadings in high-rise office buildings with all-glass curtains in Malaysia. Bellia et al. [10] investigated the effect of horizontal external shading on the energy of office buildings in three different Italian climates. Their results showed that shading devices have greater energy-saving efficiency when applied in warm and humid climates than in cold climates.
However, many physical limitations are associated with the use of external shadings. Such issues include the blocking of the view by the shading device, the impact on natural ventilation, and the requirement of indoor natural lighting. Numerous studies have shown that proper natural lighting is beneficial to people’s work productivity, health, and mood [11,12,13].
Kikuchi et al. [14] discussed the effect of different depths of horizontal shadings on indoor lighting and energy consumption. The results showed that horizontal shades installed on the outdoor side blocked the greatest amount of sunlight; the demand for artificial lighting decreased while the demand for air conditioning increased as the shading was moved to the indoor side. Chi et al. [15] studied the performance of perforated shadings with different perforated ratios, hole sizes, and numbers in terms of lighting and building energy savings.
As mentioned above, the use of external shadings can reduce the energy consumption of air conditioning but may also reduce the amount of natural light entering, thus resulting in insufficient indoor light and requiring additional lighting equipment to achieve the desired light environment. Finding a balance between the quality of indoor lighting and building energy consumption is worth considering and discussing [16,17].
In recent years, many architectural cases have adopted expanded metal mesh as a design element for the building facade and interior decoration. Expanded metal mesh is a metal sheet that is slit and stretched by machine to form a three-dimensional mesh of the same size and shape. Its structure is stable and safe, its material is highly weather resistant, and mesh adjustment is flexible [18]. Furthermore, this three-dimensional mesh can effectively block direct sunlight, reduce the entry of solar radiation, and make the interior more comfortable and energy-saving.
Owada et al. [19] explored the influence of expanded metal mesh with different mesh sizes, as well as two installation methods, upward and downward, on shading performance. The results showed that the installation method clearly has different effects on solar shading. Research on the relationship between the perforated ratio (horizontal projection), mesh size of the expanded metal mesh, and shading performance show that compared with general perforated materials, expanded metal mesh has a better shading effect due to its three-dimensional perforation form [20,21].
The research purpose of this study was to investigate the natural lighting benefits and air conditioning and lighting energy consumption of applying expanded metal mesh on the facade of office buildings in Taiwan’s climate. This study took the expanded metal mesh installed on the facade of an office building as the research object, and we evaluated the influence of the expanded metal mesh on the indoor light environment and building energy consumption. In this study, we used actual measurements to verify the compatibility of the simulation software in expanded metal mesh simulation and to confirm the scope of application of the software.
2. Methodology
2.1. Overview
This research is divided into two parts: the first is the field measurement and simulation software compatibility, followed by office building lighting and energy consumption simulation (Figure 1).
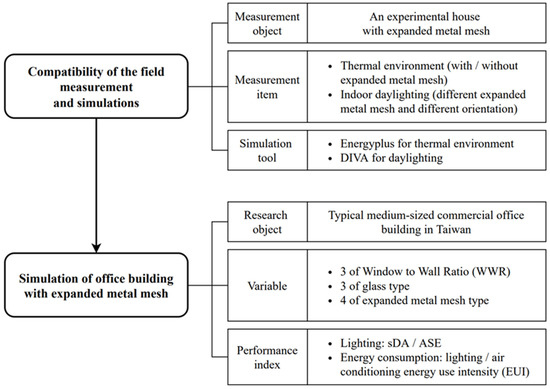
Figure 1.
Workflow of this research.
The main purpose of simulation software compatibility is to verify whether the selected software and field measurement are reproducible for predicting indoor temperature and lighting when expanded metal mesh is used in the opening of a building. Therefore, field measurement and simulation by software are carried out on the situation of the building using expanded metal mesh; then the simulation of the second part is carried out after confirming the compatibility.
The verification process had two phases. The first phase verified the thermal environment parameters simulated by EnergyPlus, including the mean radiant temperature (MRT) and operative temperature (OT); the second phase verified the indoor illuminance simulation by DIVA.
For the simulation and evaluation of lighting and energy consumption, we took a medium-sized office building as a simulated case and further explored the influence of three different variables, the window-to-wall ratio (WWR), the glass type of the facade opening, and different perforated ratios of the expanded metal mesh, on the indoor lighting quality and building energy consumption.
2.2. Compatibility of the Field Measurement and Simulations
2.2.1. Experimental Procedures
In order to verify whether the thermal environment and lighting predictions provided by the simulation software would be reproducible when the expanded metal mesh was used in the opening of a building, field measurement was carried out in the experimental house on the top floor of the Technology Building of National Cheng Kung University. The experimental house is shown in Figure 2, and the plan and section are shown in Figure 3. The experimental house is a rectangular space with an area of 200 cm (length) × 200 cm (width) × 220 cm (height). Only one facade has a window opening, which is 160 cm (width) × 80 cm (height). The bottom of the experimental house is equipped with pulleys, which can carry out solar irradiance experiments in different orientations.
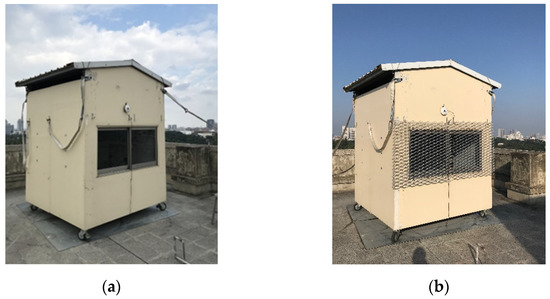
Figure 2.
Photo of experimental house. (a) Without Expanded Metal Mesh; (b) With Expanded Metal Mesh.
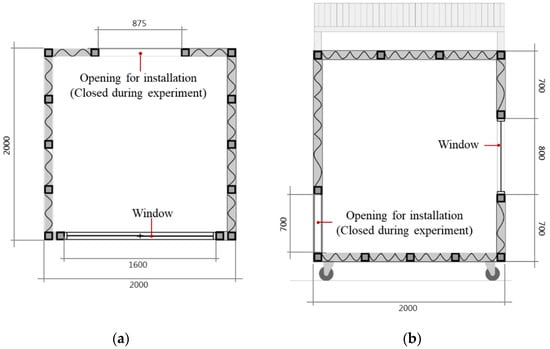
Figure 3.
Size of experimental house (unit: mm). (a) Plan; (b) Section.
The sky view factor (SVF) was evaluated prior to construction. SVF represents how much sky is visible at the measuring point [22]. The higher the value, the more sky can be seen and the less coverage by the surrounding environment. The maximum value is 1, and the minimum value is 0. The SVF of the experimental house is 0.865, indicating that the measurement point will not be blocked by surrounding buildings.
2.2.2. Indoor Temperature Measurement and Simulation Setting
In this study, EnergyPlus was used to simulate the thermal environment and energy consumption. EnergyPlus is building energy simulation software that was developed by the Department of Energy (DOE), Lawrence Berkeley National Laboratory (LBNL), US Construction Engineering Research Laboratory, Oklahoma State University, University of Illinois, and other institutions. It can be used to perform comprehensive energy simulation analysis of a building’s heating load, lighting, ventilation, and other equipment energy consumption [23].
In the field measurement, we suspended an expanded metal mesh with perforated ratio of 70% (horizontal projection) at a distance of 10 cm from the glass surface of the opening, with the opening of the hole facing down. The expanded metal mesh used in this research (Figure 4) is made of aluminium, which is made by uniformly piercing and stretching a single piece of metal, retaining its structural integrity that can withstand breakage and damage.
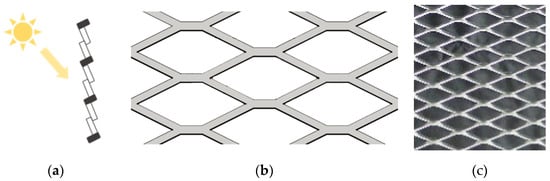
Figure 4.
Schematic diagram of expanded metal mesh. (a) Section (the opening of the hole facing down); (b) Plan; (c) Photo.
This experimental configuration is shown in Figure 5. A solarimeter was installed above the window outside the experimental house to measure the direct normal irradiation of the facade. Two black-ball thermometers were set up in the experimental room and placed at the window and the center of the room; furthermore, two temperature and humidity meters and one anemometer were set up in the center of the room, the heights of which were set in the range of 100–135 cm. Since the experimental room is a closed space, in order to make the experimental conditions resemble a general living space with weak airflow, a fan was set up to provide a weak wind speed so that the indoor wind speed was <0.2 m/s. In addition, this study only addressed the change of indoor temperature in the situation of an empty room, so the room has no personnel, equipment, or air conditioners.
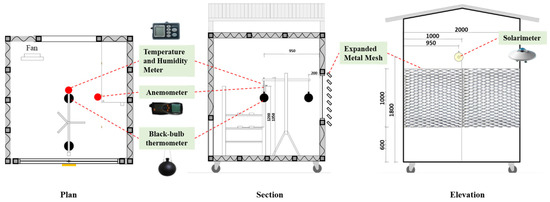
Figure 5.
Measurement configuration of indoor temperature experiment.
The field measurement of the installed and non-installed expanded metal mesh was carried out in October 2017, and the measurement time was from 9:00 a.m. to 6:00 p.m. The solarimeter, temperature and humidity meters, anemometer, and black-ball thermometers were all set to record data per minute. The measurement parameters and instruments are shown in Table 1. To obtain consistent experimental conditions, each experiment measured the global horizontal irradiance, the direct normal irradiation, and the outdoor temperature.

Table 1.
Measurement parameters and instruments.
The meteorological data used in the simulation were the actual data from the on-site weather station, and the data of temperature, relative humidity, wind direction/velocity, and global horizontal irradiance were collected. The location is 120°12′ E and 22°59′ N in Tainan, Taiwan, the average altitude is 41 m, and the time zone is UCT + 8. The model was set up according to the current conditions of the experimental house. The roof and exterior walls are constructed of two layers of 9 mm cement boards with 60 K rock wool in between the layers. We also measured the glass solar gain rate (SHGC) in this study. The properties of the construction materials used are shown in Table 2 and Table 3.
Table 2.
Material setting of exterior wall, roof, and floor construction.
Table 3.
Material setting of window.
Expanded metal mesh is quite similar to a metal perforated plate, except the shape of the holes is a three-dimensional curved surface. The solar transmittance differs from that of the perforated plate despite having the same perforated ratio (horizontal projection) [21]. In EnergyPlus, the perforated ratio or solar transmittance of the expanded metal mesh cannot be calculated through geometric methods. Only the value of the solar transmittance of the external shading member can be directly set for calculation. In order to input solar transmittance that corresponds to the real expanded metal mesh, this study calculated the insolation amount measured every 10 min during the day as the solar transmittance of the EnergyPlus shading member.
2.2.3. Indoor Daylighting Measurement and Simulation Setting
In this study, we used DIVA for the simulation of indoor lighting. Developed by the Harvard University Graduate School of Design in 2009, DIVA for Rhino/Grasshopper is software that analyzes building environment. In 2012, the original development team formed Solemma LLC, which continues to develop new functions and maintain management. DIVA performs daylight analysis on building models through the simulation engine of Radiance and DAYSIM [24]. It can run such assessments as solar radiation analysis, daylighting analysis, and building energy consumption analysis. The version used in this study was DIVA 4.
The experiment also used the measured value of the experimental house to compare the reproducibility of the indoor illumination simulation. For the measurement, three different types of expanded metal mesh with 81%, 42% and 21% perforated ratio were installed in the openings; in the last case, no expanded metal mesh was installed. The openings of the experimental house face the four directions of east, west, south, and north, respectively, with a total of 16 sets of measured data. As shown in Figure 6, six illuminometers were installed. Pursuant to the working surface height standard for indoor lighting in the LEED evaluation system [25], the sensor was set at a height of 76 cm. The measurement was carried out from the end of November 2017 to January 2018. The measurement time was from 9:00 a.m. to 6:00 p.m., and the illuminometer recorded data per minute.
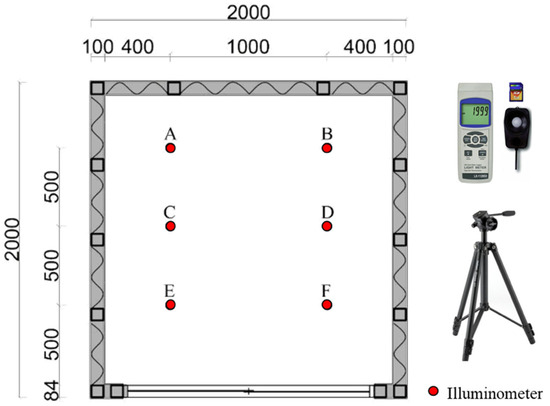
Figure 6.
Measurement configuration of lighting experiment.
Table 4 shows the settings of DIVA lighting simulation conditions, and the material properties refer to the range of solar reflectance of the Book Architecture System [26] in Japan. Meteorological data, such as temperature and humidity, in the simulation were based on the typical meteorological year in Tainan, Taiwan. As for sky model, the Perez sky model was used in this study, and the measured value of the global horizontal irradiance was input as the calculation condition of the sky model in order to ensure that the boundary conditions of the simulation analysis were as close to the field measurement as possible.
Table 4.
Material setting for DIVA of lighting experiment.
2.3. Simulation of Office Building with EMM
2.3.1. Simulated Object Building Information
To carry out this study, we referred to the research on energy consumption simulation of typical medium-sized commercial office buildings in the United States, Taiwan, and Indonesia, which focuses on two types of plan configurations: rectangular and square [27]. Since this study focuses on the actual energy saving and lighting benefits of expanded metal mesh, the differences in energy consumption caused by building orientation and configuration are not discussed. Therefore, we selected the case of an office building with a square plan configuration as the simulation object (Figure 7).
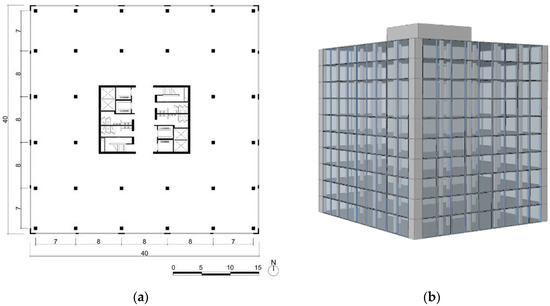
Figure 7.
Research object. (a) Standard floor plan of an office building (unit: m); (b) Perspective (WWR = 80%).
The object simulation case is a 40 m × 40 m 10-story RC structure office building, which is a medium-sized office space among the 16 building types defined by the U.S. Department of Energy [28]. The positions of the windows correspond to the positions of the columns, and the vertical traffic flow and bathrooms are concentrated in the center of the building plan. The rest of the space is flexibly arranged for office, meeting, and discussion spaces.
2.3.2. Description of Variables
This study focused primarily on three variables, namely, the WWR, the type of glass, and the expanded metal mesh. WWR values were 80%, 50%, and 30%, respectively. The type of glass was considered based on the practical applicability and the performance of the glass and thus included laminated clear glass, laminated blue glass, and off-line Low E glass with a thickness of 6 mm + 6 mm. The expanded metal mesh was 81% for mesh A, 42% for mesh B, and 21% for mesh C according to their perforated ratios, and they were all installed on the east and west sides of the building facade with the opening facing down. A total of 36 cases of simulation schemes are shown in Table 5.
Table 5.
List of simulation cases.
2.3.3. Simulation Condition Settings
The settings of the simulated meteorological conditions were imported using the typical meteorological year in Tainan, Taiwan. In terms of simulation grid settings, the minimum spacing of this spatial grid was set to 60 cm according to the spatial scale, and the height of the work surface was set to a height of 76 cm. In terms of material settings, DIVA lighting simulation material settings are shown in Table 6. The materials of each case were set to the same value, and the type of window glass was adjusted according to different cases.
Table 6.
Material settings for DIVA of an office building.
In terms of lighting control, the reduced artificial lighting due to natural lighting benefits was included in the calculation of energy consumption, and the simulation settings are shown in Table 7. The lighting switch setting adopts “Dimming with Occupancy On/Off Sensor” in the software lighting control system. To elaborate, the software first determines whether the space is being used based on the user activity time. Artificial lighting is not turned on if not in use. When users use the space, it will be judged whether to turn on artificial lighting according to the current space illuminance to reach the target illuminance value. The user activity time is set from 8:00 a.m. to 6:00 p.m. Taiwan’s national standard CNS 12112 [29] is based on ISO 8995-1 [30]. According to the recommended illuminance for office work, the target illuminance value was set to 500 lx. When the software performs its calculation, it automatically determines the lighting switch period and the lighting usage ratio and exports the lighting schedule (Figure 8). Then we imported the lighting schedule into EnergyPlus to calculate the lighting energy consumption.
Table 7.
Simulation settings for DIVA of an office building.
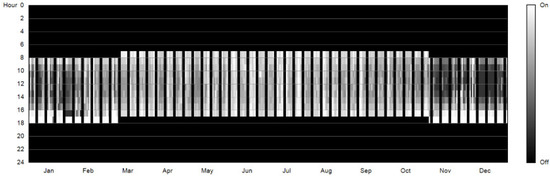
Figure 8.
Lighting schedule setting simulated by DIVA (WWR = 30%, laminated clear glass, perforated ratio of expanded metal mesh = 21%).
The energy consumption simulation conditions are shown in Table 8. We referred to the Green Building Evaluation Manual-Basic Version for the indoor conditions [3]. The conditions of the 10 h administrative office space type were adopted, including density of people, equipment load, ventilation, hourly load change rate, etc. The lighting schedule produced by the DIVA lighting simulation was imported to the hourly load change rate of lighting. Therefore, the setting of each case produced differences in energy consumption due to the lighting simulation results. For the air conditioning, we adopted the ideal load air system.
Table 8.
Indoor conditions and hourly load change rate setting of the office space.
In addition, for settings of the structure, this office building case refers to the Green Building Evaluation Manual-Basic Version settings [3], as shown in Table 9. The insolation transmittance of the expanded metal mesh is set by the measured value [20].
Table 9.
Material settings for the office building.
2.4. Building Performance Index
The lighting assessment covers the entire office use area, that is, the area outside the central service core of the building. The lighting performance was evaluated using the LEED’s indoor environmental quality of U.S. Green Building Council [25]. In this study, we used the simulation software to calculate the spatial daylight autonomy (sDA) and the annual sunlight exposure (ASE). The LEED specification requires that the grid of the sDA and ASE calculation should not exceed 60 cm2 and that the analysis area should be in the frequently used area and on a working surface of 76 cm in height. Furthermore, the typical meteorological data of the nearest location must be used as the boundary condition for the analysis.
sDA evaluates whether a space receives sufficient daylight; specifically, sDA describes the percentage of floor area that receives at least 300 lux for at least 50% of the annual occupancy time (8 a.m.–6 p.m.) on a horizontal work plane. ASE evaluates surfaces receiving too much direct sunlight that may cause glare (visual discomfort), which is defined as the percentage of space where the illuminance on the work plane exceeds 1000 lux and is at least 250 h per year. These terms are defined in the IES LM-83-12 standard [31]. The scoring criteria vary depending on the type of building. Office space criteria indicate that when the sDA is above 75% and the ASE is less than 10%, 3 points can be obtained; when the sDA is 55%–74% and the ASE is less than 10%, 2 points can be obtained.
We evaluated energy consumption using the energy use intensity (EUI) of air conditioning and lighting. EUI is defined as the annual energy consumption of the building divided by the total floor area of the building, and its unit is kWh/m2∙year.
3. Results and Discussion
3.1. Compatibility of the Field Measurement and Simulations
3.1.1. EnergyPlus Simulation and Measurement Comparison
Two days with similar external conditions were selected from the multi-day measurement (Figure 9), namely, 1 October 2017 (without expanded metal mesh) and 10 October 2017 (with expanded metal mesh). The field measured data of these two days were compared with the simulated values of EnergyPlus.
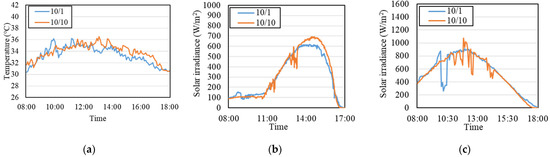
Figure 9.
External conditions for measurement days. (a) Outdoor temperature; (b) Direct normal irradiation (facing west); (c) Global horizontal irradiance.
Figure 10, Figure 11 and Figure 12 compare various indoor conditions with and without expanded metal mesh. When the expanded metal mesh was not installed, the measured results show that the air temperature and the MRT had the same trend, but the MRT suddenly rose between 16:00 and 17:00, since it is calculated using air temperature, black bulb temperature, and wind speed. However, the measurement results showed no sudden rise in the air temperature, and the wind speed was always less than 0.2 m/s, so it is speculated that this phenomenon is caused by the increase in black bulb temperature. This rise is due to the angle of incidence of sunlight near evening being larger; that is, the sunlight can directly irradiate the black-ball thermometer. Although this phenomenon is difficult to reproduce on EnergyPlus, the predictions of air temperature, MRT, and OT are consistent with the overall trend of the measurement. In particular, the measurement and simulation of OT has a high correlation (Figure 13), R2 > 0.76. Furthermore, the maximum root mean square deviation (RMSD) is about 1 °C, showing good reproducibility for simulations with EnergyPlus.
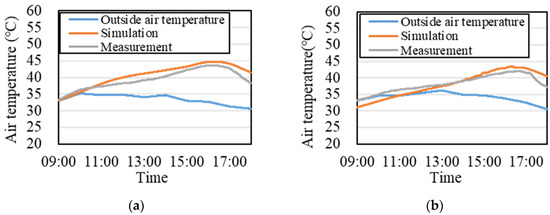
Figure 10.
Air temperature comparison of simulation and measurement. (a) Without Expanded Metal Mesh; (b) With Expanded Metal Mesh.
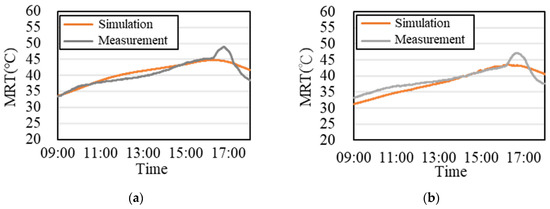
Figure 11.
MRT comparison of simulation and measurement. (a) Without Expanded Metal Mesh; (b) With Expanded Metal Mesh.
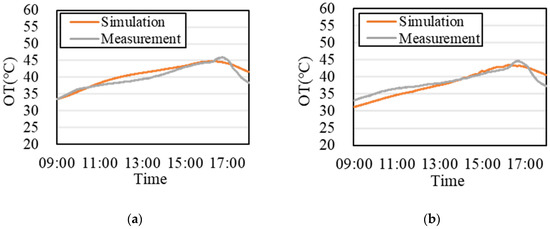
Figure 12.
OT comparison of simulation and measurement. (a) Without Expanded Metal Mesh; (b) With Expanded Metal Mesh.
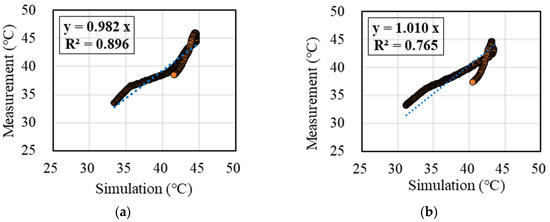
Figure 13.
Scatter plot of OT. (a) Without Expanded Metal Mesh; (b) With Expanded Metal Mesh.
3.1.2. DIVA Simulation and Measurement Comparison
The results of DIVA simulation and measurement are compared in Figure 14. The measurement and the DIVA simulation have the same trend. However, during the period of direct sunlight on the opening (12:00–15:30), the error between the measurement and the simulation of the illuminance is relatively large, whereas the error is relatively small during the period of more diffuse light. In addition, we found that when the measured illuminance was below 1000 lx, the accuracy of DIVA simulation was quite high, and all errors were less than 15%. However, when the measured illuminance was above 1000 lx, the DIVA simulated illuminance was too large or too small for evaluation, and the overall error was within 48%.
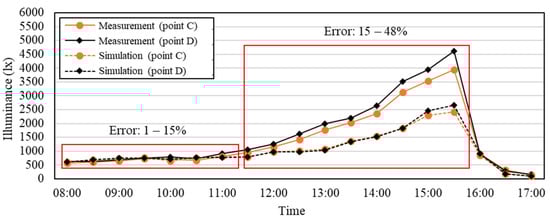
Figure 14.
Illuminance comparison of simulation and measurement. (The opening is facing west without expanded metal mesh).
Figure 15 shows the scatter plot with measured illuminance less than 1000 lx from all cases. The results demonstrate that when the measured illuminance is less than 1000 lx, the simulation and measurement have a high positive correlation and accuracy (R2 = 0.87). Since we also discuss the office work environment with the illumination range below 1000 lx, this result can prove that when the measured value is less than 1000 lx, regardless of the orientation of the building openings, the installation of expanded metal mesh with different perforated ratio, or no shading devices, the simulation of DIVA with regard to indoor illumination is reproducible and accurate.
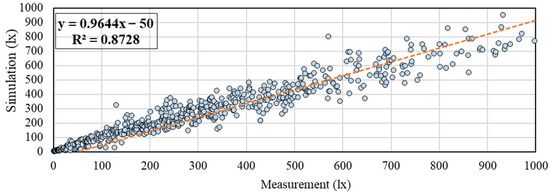
Figure 15.
Scatter plot of illuminance. (Illuminance < 1000 lx).
3.2. Evaluation of Lighting and Energy Consumption of Office Buildings
In this study, we carried out a total of 36 simulation cases according to different WWRs, glass types, and expanded metal meshes. The simulation results of lighting and energy consumption are summarized in Table 10.
Table 10.
Lighting and energy consumption result table of each simulated case.
3.2.1. Evaluation of Lighting
As shown in Table 10, in the 27 cases with the expanded metal mesh installed, the sDA and ASE decreased after the expanded metal mesh was installed compared to when expanded metal mesh was not installed. Figure 16 compares case 1 and case 2, showing that the east and west ASE of case 2 (with expanded metal mesh) is significantly improved.
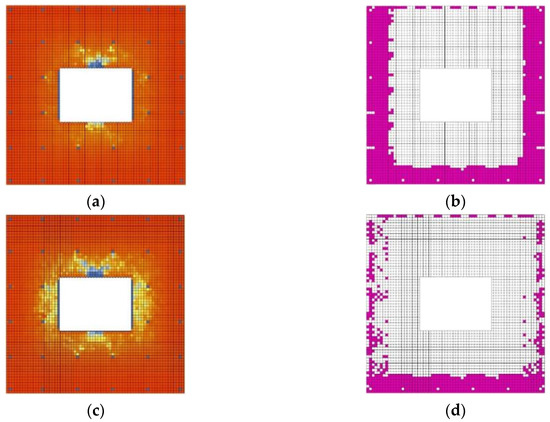
Figure 16.
Lighting simulation result with or without expanded metal mesh (WWR = 80%). (a) Case 1: sDA = 99%; (b) Case 1: ASE = 39.0%; (c) Case 2: sDA = 96%; (d) Case 2: ASE = 18.9%.
WWR is a very important parameter in lighting evaluation. In the simulated case of WWR = 30%, the sDA did not reach the standard when the expanded metal mesh was not installed, and the daylighting was also insufficient after the installation. In all cases with WWR = 80%, no matter what kind of glass and expanded metal mesh were used, the sDA was higher than the standard value (55%), but the ASE was more than 10%, indicating excessive daylighting. In the case of WWR = 50%, different glass and expanded metal mesh combinations can achieve an appropriate lighting effect.
When using Low-E glass, the overall natural lighting is poor. Among the nine cases of Low-E glass with the expanded metal mesh, five cases did not meet the sDA standard. Although five cases passed the ASE standard, no simulated cases met both.
Three cases met the LEED lighting standard, that is, cases in which the sDA was more than 55% and the ASE was less than 10%. Among them, two cases had the scheme of WWR = 50%, using laminated clear glass with meshes B and C, and the scheme of WWR = 50%, using laminated blue glass with mesh B.
Overall, the WWR is the most important factor in lighting assessment, and the expanded metal mesh effectively reduces the ASE and direct and excessive sunlight. Under the condition of WWR = 50%, the appropriate combination of glass and expanded metal mesh can meet the LEED lighting standard. However, when using Low-E glass, reaching the standard is difficult.
3.2.2. Evaluation of Energy Consumption
Figure 17, Figure 18 and Figure 19 show the energy consumption simulation results of lighting and air conditioning when the WWR = 80%, 50%, and 30%, respectively. The horizontal axis is the simulation case number, and the vertical axis is the EUI. As shown in the 36 simulated cases, the higher the WWR, the higher the EUI. The energy saving potential of expanded metal mesh and glass is highly related to WWR; that is, the greater the WWR, the greater the contribution of the two to energy saving.
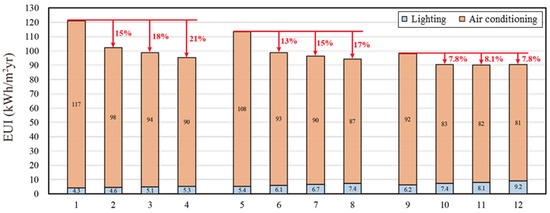
Figure 17.
Energy simulation analysis of cases with WWR = 80%.
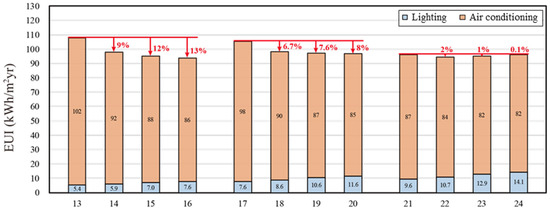
Figure 18.
Energy simulation analysis of cases with WWR = 50%.
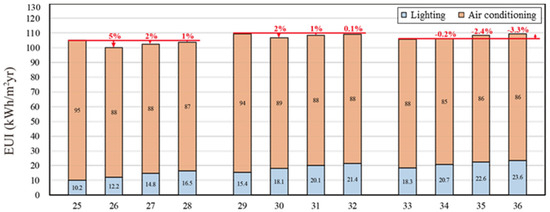
Figure 19.
Energy simulation analysis of cases with WWR = 30%.
When WWR = 80% (Figure 17), the EUI is lower when using glass with lower SHGC or expanded metal mesh with a smaller perforated ratio. When Low-E glass is used, since the glass blocks a large amount of solar radiation, the influence of different perforated ratios of the expanded metal mesh on the energy consumption is relatively reduced. However, when using Low-E glass with mesh C (case 11), the air conditioning energy consumption was reduced by 0.9 kWh/m2∙year compared to mesh B (case 12), but the lighting energy consumption increased by 1.1 kWh/m2∙year, which ultimately results in more energy consumption than using mesh B. Therefore, when using expanded metal mesh on a facade to reduce air conditioning energy consumption, the increase in lighting energy consumption should be simultaneously considered to avoid an increase in overall building energy consumption.
When WWR = 50% (Figure 18), due to the reduction of building openings area, the amount of solar radiation entering is reduced compared to WWR = 80%, so the energy-saving effect of glass types and expanded metal mesh to air conditioning energy consumption is also reduced. When WWR = 30% (Figure 19), the installation of expanded metal mesh has a very small energy saving benefit; furthermore, when Low-E glass is used at the same time, more total energy is consumed due to the increased lighting demand.
Overall, the larger the WWR, the greater the energy saving potential of the expanded metal mesh and glass. If the SHGC of the glass is lower, the expanded metal mesh has less influence on saving air conditioning energy consumption. In this case, the addition of the expanded metal mesh may increase the total energy consumption (due to an increase in lighting energy consumption).
3.2.3. Section Summary
Among the 36 cases of simulation schemes in this study, three cases can meet the LEED indoor lighting standard (cases 15, 16, and 19), and all three of those cases can obtain 2 points in the evaluation system. As shown in Table 11, if the maximum sDA is used as the basis for selecting the best combination, then the best choice is case 15, that is, when WWR = 50% and laminated clear glass and mesh B are used. The solution with the minimum building energy consumption among the three cases is when WWR = 50% and laminated clear glass is used with mesh C.
Table 11.
Cases that meet LEED lighting standards.
4. Conclusions
This study explores the impact of expanded metal mesh used for the exterior shading design of office building facades in Taiwan on indoor lighting and building energy consumption. First, we compared the simulation results with the measurement results to confirm the simulation reproducibility of EnergyPlus and DIVA. Then, taking an office building in Tainan as an example, we discussed the effects of window-to-wall ratio, glass type, and expanded metal mesh type on lighting and air conditioning energy consumption.
The results of the comparison between the simulation and the field measurement show that the thermal environment simulated by EnergyPlus has good reproducibility, except for when the sun directly shines on the opening. In the analysis results of the illuminance, when the measured illuminance was less than 1000 lx, the accuracy of the DIVA simulation and the measured value was quite high and had a high positive correlation whether the expanded metal mesh was installed or not or whether the opening was oriented in different directions.
To consider the impact of natural lighting on lighting energy saving, this study used DIVA to simulate lighting and generate the lighting schedules, which were then imported into EnergyPlus to calculate the energy consumption of lighting and air conditioning. The simulation results show that the WWR has an important influence on both lighting and air conditioning energy consumption. When WWR = 80% and WWR = 30%, no matter what type of glass and expanded metal mesh was used, such cases could not meet the lighting standards of LEED. When WWR = 50%, three different cases can achieve the LEED lighting standards with a good combination of glass and expanded metal mesh.
In terms of light environment, expanded metal mesh can effectively reduce glare while also having the opportunity to achieve a comfortable natural light environment. For building energy consumption, we found that the lower the WWR, the lower the impact of glass and expanded metal mesh on building energy consumption. However, when expanded metal mesh is used on the facade to reduce air conditioning energy consumption, it may result in insufficient lighting and thus increase lighting energy consumption. Both WWR and glass types should be considered to achieve minimum energy consumption. Otherwise, the increase in lighting energy consumption may be greater than the decrease in air conditioning energy consumption, and the installation of expanded metal mesh will consume more energy than when not installed.
Among the 36 cases of simulation schemes in this study, three cases met the LEED indoor lighting standard, and the scheme with the minimum building energy consumption was when WWR = 50% and laminated clear glass was used with mesh C. However, this study only focused on the relationship between WWR, glass type, and external shading on air conditioning and lighting energy consumption. As a reference for designs related to indoor lighting effect and building energy consumption, factors such as construction cost and visual effect should be considered in future research.
Author Contributions
Conceptualization, Y.-S.T.; methodology, Y.-S.T.; software, C.-H.Y.; validation, C.-H.Y.; formal analysis, Y.-S.T.; resources, Y.-S.T.; data curation, Y.-S.T.; writing—original draft preparation, Y.-S.T. and C.-H.Y.; writing—review and editing, Y.-S.T. and C.-Y.Y.; visualization, C.-Y.Y.; supervision, Y.-S.T.; project administration, Y.-S.T.; funding acquisition, Y.-S.T. All authors have read and agreed to the published version of the manuscript.
Funding
This research was funded by Ministry of Science and Technology, grant number 111-2221-E-006-055.
Institutional Review Board Statement
Not applicable.
Informed Consent Statement
Not applicable.
Data Availability Statement
The data presented in this study are available on request from the corresponding author.
Conflicts of Interest
The authors declare no conflict of interest.
References
- United Nations Environment Programme. 2020 Global Status Report for Buildings and Construction: Towards a Zero-Emission, Efficient and Resilient Buildings and Construction Sector. 2020. Available online: https://globalabc.org/news/launched-2020-global-status-report-buildings-and-construction (accessed on 8 January 2022).
- Energy Audit Annual Report for Non-productive Industrials 2021, Taiwan. 2021. Available online: https://www.ecct.org.tw/Knowledge/knowledge_more?id=97b85b30c03343d88eff851b993a33af (accessed on 8 January 2022).
- Lin, H.T.; Lin, T.P.; Tsay, Y.S. Green Building Evaluation Manual—Basic Version; Architecture and Building Research Institute, Ministry of the Interior: Taipei, Taiwan, 2019. [Google Scholar]
- Lin, H.T. Thermal Environment of Human Habitat; Chansbook: Taipei, Taiwan, 2009. [Google Scholar]
- Hyde, R. Climate Responsive Design: A Study of Buildings in Moderate and Hot Humid Climates; Taylor & Francis: Abingdon, UK, 2013. [Google Scholar] [CrossRef]
- Mirrahimi, S.; Mohamed, M.F.; Haw, L.C.; Ibrahim, N.L.N.; Yusoff, W.F.M.; Aflaki, A. The effect of building envelope on the thermal comfort and energy saving for high-rise buildings in hot–humid climate. Renew. Sustain. Energy Rev. 2016, 53, 1508–1519. [Google Scholar] [CrossRef]
- Valladares-Rendón, L.G.; Lo, S.L. Passive shading strategies to reduce outdoor insolation and indoor cooling loads by using overhang devices on a building. Build. Simul. 2014, 7, 671–681. [Google Scholar] [CrossRef]
- Freewan, A.A.Y. Impact of external shading devices on thermal and daylighting performance of offices in hot climate regions. Sol. Energy 2014, 102, 14–30. [Google Scholar] [CrossRef]
- Lau, A.K.K.; Salleh, E.; Lim, C.H.; Sulaiman, M.Y. Potential of shading devices and glazing configurations on cooling energy savings for high-rise office buildings in hot-humid climates: The case of Malaysia. Int. J. Sustain. Built Environ. 2016, 5, 387–399. [Google Scholar] [CrossRef]
- Bellia, L.; de Falco, F.; Minichiello, F. Effects of solar shading devices on energy requirements of standalone office buildings for Italian climates. Appl. Therm. Eng. 2013, 54, 190–201. [Google Scholar] [CrossRef]
- Franta, G.; Anstead, K. Daylighting Offers Great Opportunities; Window & Door Specifier-Design Lab. Spring: Berlin/Heidelberg, Germany, 1994; pp. 40–43. [Google Scholar]
- Heerwagen, J.H. Design, Productivity and Well Being: What are the links? In Proceedings of the AIA Conference on Highly Effective Facilities, Cincinnati, OH, USA, 12–14 March 1998; pp. 12–14. [Google Scholar]
- Aries, M.B.C.; Aarts, M.P.J.; van Hoof, J. Daylight and health: A review of the evidence and consequences for the built environment. SAGE J. 2013, 47, 6–27. [Google Scholar] [CrossRef]
- Kikuchi, T.; Higuchi, M.; Igawa, N. Simulation study of impact of energy saving effect and indoor environment by daylighting. J. Environ. Eng. 2009, 74, 133–139. [Google Scholar] [CrossRef][Green Version]
- Chi, D.A.; Moreno, D.; Navarro, J. Design optimisation of perforated solar façades in order to balance daylighting with thermal performance. Build. Environ. 2017, 125, 383–400. [Google Scholar] [CrossRef]
- Alzoubi, H.H.; Al-Zoubi, A.H. Assessment of building façade performance in terms of daylighting and the associated energy consumption in architectural spaces: Vertical and horizontal shading devices for southern exposure facades. Energy Convers. Manag. 2010, 51, 1592–1599. [Google Scholar] [CrossRef]
- Atzeri, A.M.; Pernigotto, G.; Cappelletti, F.; Gasparella, A.; Tzempelikos, A. Energy performance of shading devices for thermal and lighting comfort in offices. In Proceedings of the Building Simulation Applications BSA 2013, Bolzano, Italy, 30 January 2013; pp. 233–242. [Google Scholar]
- Smith, D.; Graciano, C.; Martínez, G. Expanded metal: A review of manufacturing, applications and structural performance. Thin-Walled Struct. 2021, 160, 107371. [Google Scholar] [CrossRef]
- Oowada, J.; Katoh, M. A Study on Sun Shading Effect of Expanded Metal; Techinical Papers of Annual Meeting the Society of Heating, Air-Conditioning and Sanitary Engineers of Japan; Society of Heating, Air-Conditioning and Sanitary Engineers of Japan: Tokyo, Japan, 2012; pp. 1033–1036. [Google Scholar] [CrossRef]
- Lin, C.H.; Tsay, Y.S.; Yang, C.H.; Lin, Y.F. Study on the Shading Performance of Expanded Metal Mesh. In Proceedings of the WSBE 2017, Hong Kong, China, 5–7 June 2017. [Google Scholar]
- Tsay, Y.S.; Lin, C.; Yang, J. Study on the Shading Effect of Expanded Metal Mesh Applied to Building Facades. In Proceedings of the Healthy Building 2017 Asia, Tainan, Taiwan, 2–5 September 2017. [Google Scholar]
- Middel, A.; Lukasczyk, J.; Maciejewski, R.; Demuzere, M.; Roth, M. Sky View Factor footprints for urban climate modeling. Urban Clim. 2018, 25, 120–134. [Google Scholar] [CrossRef]
- Crawley, D.B.; Lawrie, L.K.; Winkelmann, F.C.; Buhl, W.F.; Huang, Y.J.; Pedersen, C.O.; Strand, R.K.; Liesen, R.J.; Fisher, D.E.; Witte, M.J.; et al. EnergyPlus: Creating a new-generation building energy simulation program. Energy Build. 2001, 33, 319–331. [Google Scholar] [CrossRef]
- Jakubiec, J.A.; Reinhart, C.F. DIVA 2.0: Integrating daylight and thermal simulations using Rhinoceros 3D, Daysim and EnergyPlus. In Proceedings of the Building Simulation 2011: 12th Conference of International Building Performance Simulation Association, Sydney, Australia, 14–16 November 2011; pp. 2202–2209. [Google Scholar]
- LEED v4.1 BD+C: Healthcare: Daylight|U.S. Green Building Council, (n.d.). Available online: https://www.usgbc.org/leed/v41#bdc (accessed on 1 July 2022).
- Architecture System Editorial Committee. Architecture System No. 22 (Indoor Environment Planning); Shokokusha: Tokyo, Japan, 1969. [Google Scholar]
- Zumstein, K.; Parton, H. Total Office Design: 50 Contemporary Workplaces; Thames and Hudson Ltd.: London, UK, 2011. [Google Scholar]
- Deru, M.; Field, K.; Studer, D.; Benne, K.; Griffith, B.; Torcellini, P.; Liu, B.; Halverson, M.; Winiarski, D.; Rosenberg, M.; et al. US Department of Energy: Commercial Reference Building Models of the National Building Stock; US DOE: Washington DC, USA, 2011.
- CNS 12112-2012; Lighting of Indoor Work Places. Bureau of Standards, Metrology and Inspection. M.O.E.A.: Taipei, Taiwan, 2012. Available online: https://www.cnsonline.com.tw/?node=detail&generalno=12112&locale=en_US (accessed on 9 January 2022).
- ISO 8995-1:2002; Lighting of Work Places—Part 1: Indoor. International Organization for Standardization: Geneva, Switzerland, 2002. Available online: https://www.iso.org/standard/28857.html (accessed on 9 January 2022).
- Lm, I. Approved Method: IES Spatial Daylight Autonomy (sDA) and Annual Sunlight Exposure (ASE); Illuminating Engineering Society: New York, NY, USA, 2013; Available online: https://www.ies.org/Product/Ies-Spatial-Daylight-Autonomy-Sda-and-Annual-Sunlight-Exposure-Ase (accessed on 10 May 2022).


Publisher’s Note: MDPI stays neutral with regard to jurisdictional claims in published maps and institutional affiliations. |
© 2022 by the authors. Licensee MDPI, Basel, Switzerland. This article is an open access article distributed under the terms and conditions of the Creative Commons Attribution (CC BY) license (https://creativecommons.org/licenses/by/4.0/).