Article

Analysis of Energy and Environmental Indicators for Sustainable Operation of Mexican Hotels in Tropical Climate Aided by Artificial Intelligence

by
S. G. Mengual Torres
1,
O. May Tzuc
2,*,
K. M. Aguilar-Castro
3,
Margarita Castillo Téllez
2,
J. Ovando Sierra
2,
Andrea del Rosario Cruz-y Cruz
2 and
Francisco Javier Barrera-Lao
2
1
Estudiante de Posgrado, Facultad de Ingeniería, Universidad Autónoma de Campeche, Campus V, Av. Humberto Lanz, Col. Ex Hacienda Kalá, San Francisco de Campeche 24085, Campeche, Mexico
2
Facultad de Ingeniería, Universidad Autónoma de Campeche, Campus V, Av. Humberto Lanz, Col. Ex Hacienda Kalá, San Francisco de Campeche 24085, Campeche, Mexico
3
División Académica de Ingeniería y Arquitectura, Universidad Juárez Autónoma de Tabasco, Carret. Cunduacán-Jalpa de Méndez Km. 1, Unidad Chontalpa, Cunduacán 86690, Tabasco, Mexico
*
Author to whom correspondence should be addressed.
Buildings 2022, 12(8), 1155; https://doi.org/10.3390/buildings12081155
Submission received: 10 June 2022 / Revised: 7 July 2022 / Accepted: 21 July 2022 / Published: 3 August 2022
(This article belongs to the Special Issue Building Energy Consumption and Urban Energy Planning)

Abstract

:
This study assessed the energy-use index and carbon-footprint performance of nine medium-category Mexican hotels (two–four stars) located in tropical-climate regions. The consumption of electrical and thermal energies of each hotel was collected during audits. Based on this, various scenarios of the partial replacement of the most energy-consuming devices were evaluated and synthesized in an expert model based on artificial neural networks. The artificial-intelligence model was designed to simultaneously associate the energy-consumption indicators, environmental impact, and economic savings of hotels based on their category, location, room number, number of existing electrical or thermal devices, and their percentage of substitution with more energy-efficient technologies. The model was used to compare the various partial-technology-substitution alternatives in each hotel that could reduce energy consumption and CO2 emissions based on the current values reported by the energy-use and environmental-impact indicators. The results of the proposed approach showed that even without making total replacements of equipment such as interior and exterior lighting or air conditioners, it was possible to identify configurations that could reduce the hotels’ energy use per room-year by 9–12%. In the environmental case, using more efficient technologies could reduce environmental mitigation. The proposed methodology represents an attractive option to facilitate the analyses and the decision making of administrators according to the needs of the type of hotel to improve its performance, which also affects the reduction in operating costs.

1. Introduction

Currently, the Mexican hotel industry is one of the most dynamic and fastest growing, occupying the seventh place among the most frequented tourist destinations above tourist powers such as the United Kingdom, Thailand, and Germany [1]. This industry significantly impacts the national economy by representing more than 8.7% of the gross domestic product (GDP) and generating 6% of employment [2]. However, the high tourist affluence in the country combined with the various services offered by hotels drastically increased the energy demand of this sector in recent years.
According to data from National Commission for the Efficient Use of Energy (CONUEE) [3], the energy consumption of hotels in Mexico is excessive, representing about 20% of the annual operating costs. In the case of hotels located in tropical-climate regions (representing 41%), this problem is aggravated, since their electrical consumption is up to 52% higher than that of those in temperate climates. It is due to the intensive use of artificial air conditioning to provide comfort for guests. This has repercussions not only in terms of a greater demand for energy but also in terms of an increase in greenhouse-gas emissions, since most of the tourist complexes in this climatic zone cover 80% of their energy needs with fossil fuels [4]. Therefore, implementing energy-efficiency actions is imperative to reduce the use of energy and CO2 emissions produced by hotel activity in tropical-climate regions, being the hotels of lower categories the most benefited by not having to resort to structural changes [5].
In this context, various studies showed that environmental and energy indicators are suitable instruments for reducing the carbon footprint and improving the energy use in hotels. These were used to analyze future scenarios of the energy consumed by (kWh-year) and the pollution levels (Ton CO2-year) of the Italian hotel sector [6]. A similar analysis based on the energy index (kWh/guest-year) and annual CO2 emissions per guest (kg CO2/guest-year) was used to propose operational-improvement strategies for luxury hotels in Iran [7]. Similarly, an approach based on energy consumption (kWh/m2-year) and annual emissions per square meter (kg CO2/m2-year) was used for an efficiency-performance analysis of United Kingdom conventional hotels [8]. These indicators were also individually used to identify the performance in terms of electrical energy of hotels in Fiji (kWh/m2-year) [9], South Africa (kWh/m2-year) [10], China (kWh/m2-year). year) [11], and Spain (kWh/m2-year) [12], as well as the thermal energy consumption of hotels in Cyprus (kWh/night) [13], to mention a few. However, despite the benefits that these indicators show for the hotel industry in Europe, Asia, and Africa, to date, no formal studies are to be found for Latin America [14].
Specifically for Mexico, in recent years, an attempt was made to use this approach for hotels in tropical-climate regions; however, studies were limited exclusively to luxury hotels and resorts [3]. Nevertheless, the energy problem is more severe in lower-category hotels (one–four stars), which lack operation and maintenance programs, and updated electrical devices and boilers and are characterized by the ignorance of managers and administrators in terms of the economic impact that the inefficient use of energy entails. In addition, due to costs, a considerable number of these hotels are hesitant to invest in more energy-efficient technologies despite the fact that their implementation is regulated by national regulations. Therefore, the development of alternatives that allow one to analyze the benefits of energy-saving strategies is vital for this subcategory of the Mexican hotel industry.
Thus, this paper analyzed the energy, environmental behavior, and economic characteristics of intermediate-level hotels (two–four stars) under the tropical-climate conditions of southeastern Mexico. The study focused on using these indicators to compare the current levels of energy use and hotels’ carbon footprint to those achieved under specific technology-substitution scenarios. For this purpose, the work took the energy consumption measured during the audits of hotels in the Yucatan Peninsula as a point of reference.
Since the calculation of these indicators is influenced by various factors, such as geographical location, the number of guests, the category of the hotel, and the additional services they offer, the study used an artificial intelligence (AI) model based on artificial neural networks (ANNs) as the calculation engine. The choice of the approach was due to its ability to solve the non-linear multivariable regression problems reported in previous studies of energy-use indicators in the hotel sector [10,15,16]. In addition, the use of AI showed promising results for the analysis of non-residential buildings with high energy consumption such as public schools [17], offices [18], and commercial buildings [19], significantly reducing computation times and facilitating decision making in the energy, environmental, or economic field. However, according to the literature review, there are no studies that linked the use of AI to the analysis of energy or environmental indicators in hotels.
Based on those mentioned above, the novelty of this work lies in being one of the first studies focused on improving the energy performance of Mexican hotels based on the use of indicators. In the same way, it presents an ANN model based on easily measurable characteristics of hotels, which allows one to perform the analysis of potential savings by adopting reduction strategies while remaining competitive. This study is divided as follows: Section 2 presents the general characteristics of the hotels evaluated and the results of the energy audits. Section 3 shows the approach and evaluation of the energy indicators used. The fourth part describes the use of an ANN as a modeling tool. Finally, the fifth part shows the results of the substitution scenarios.

2. Mexican Hospitality Industry
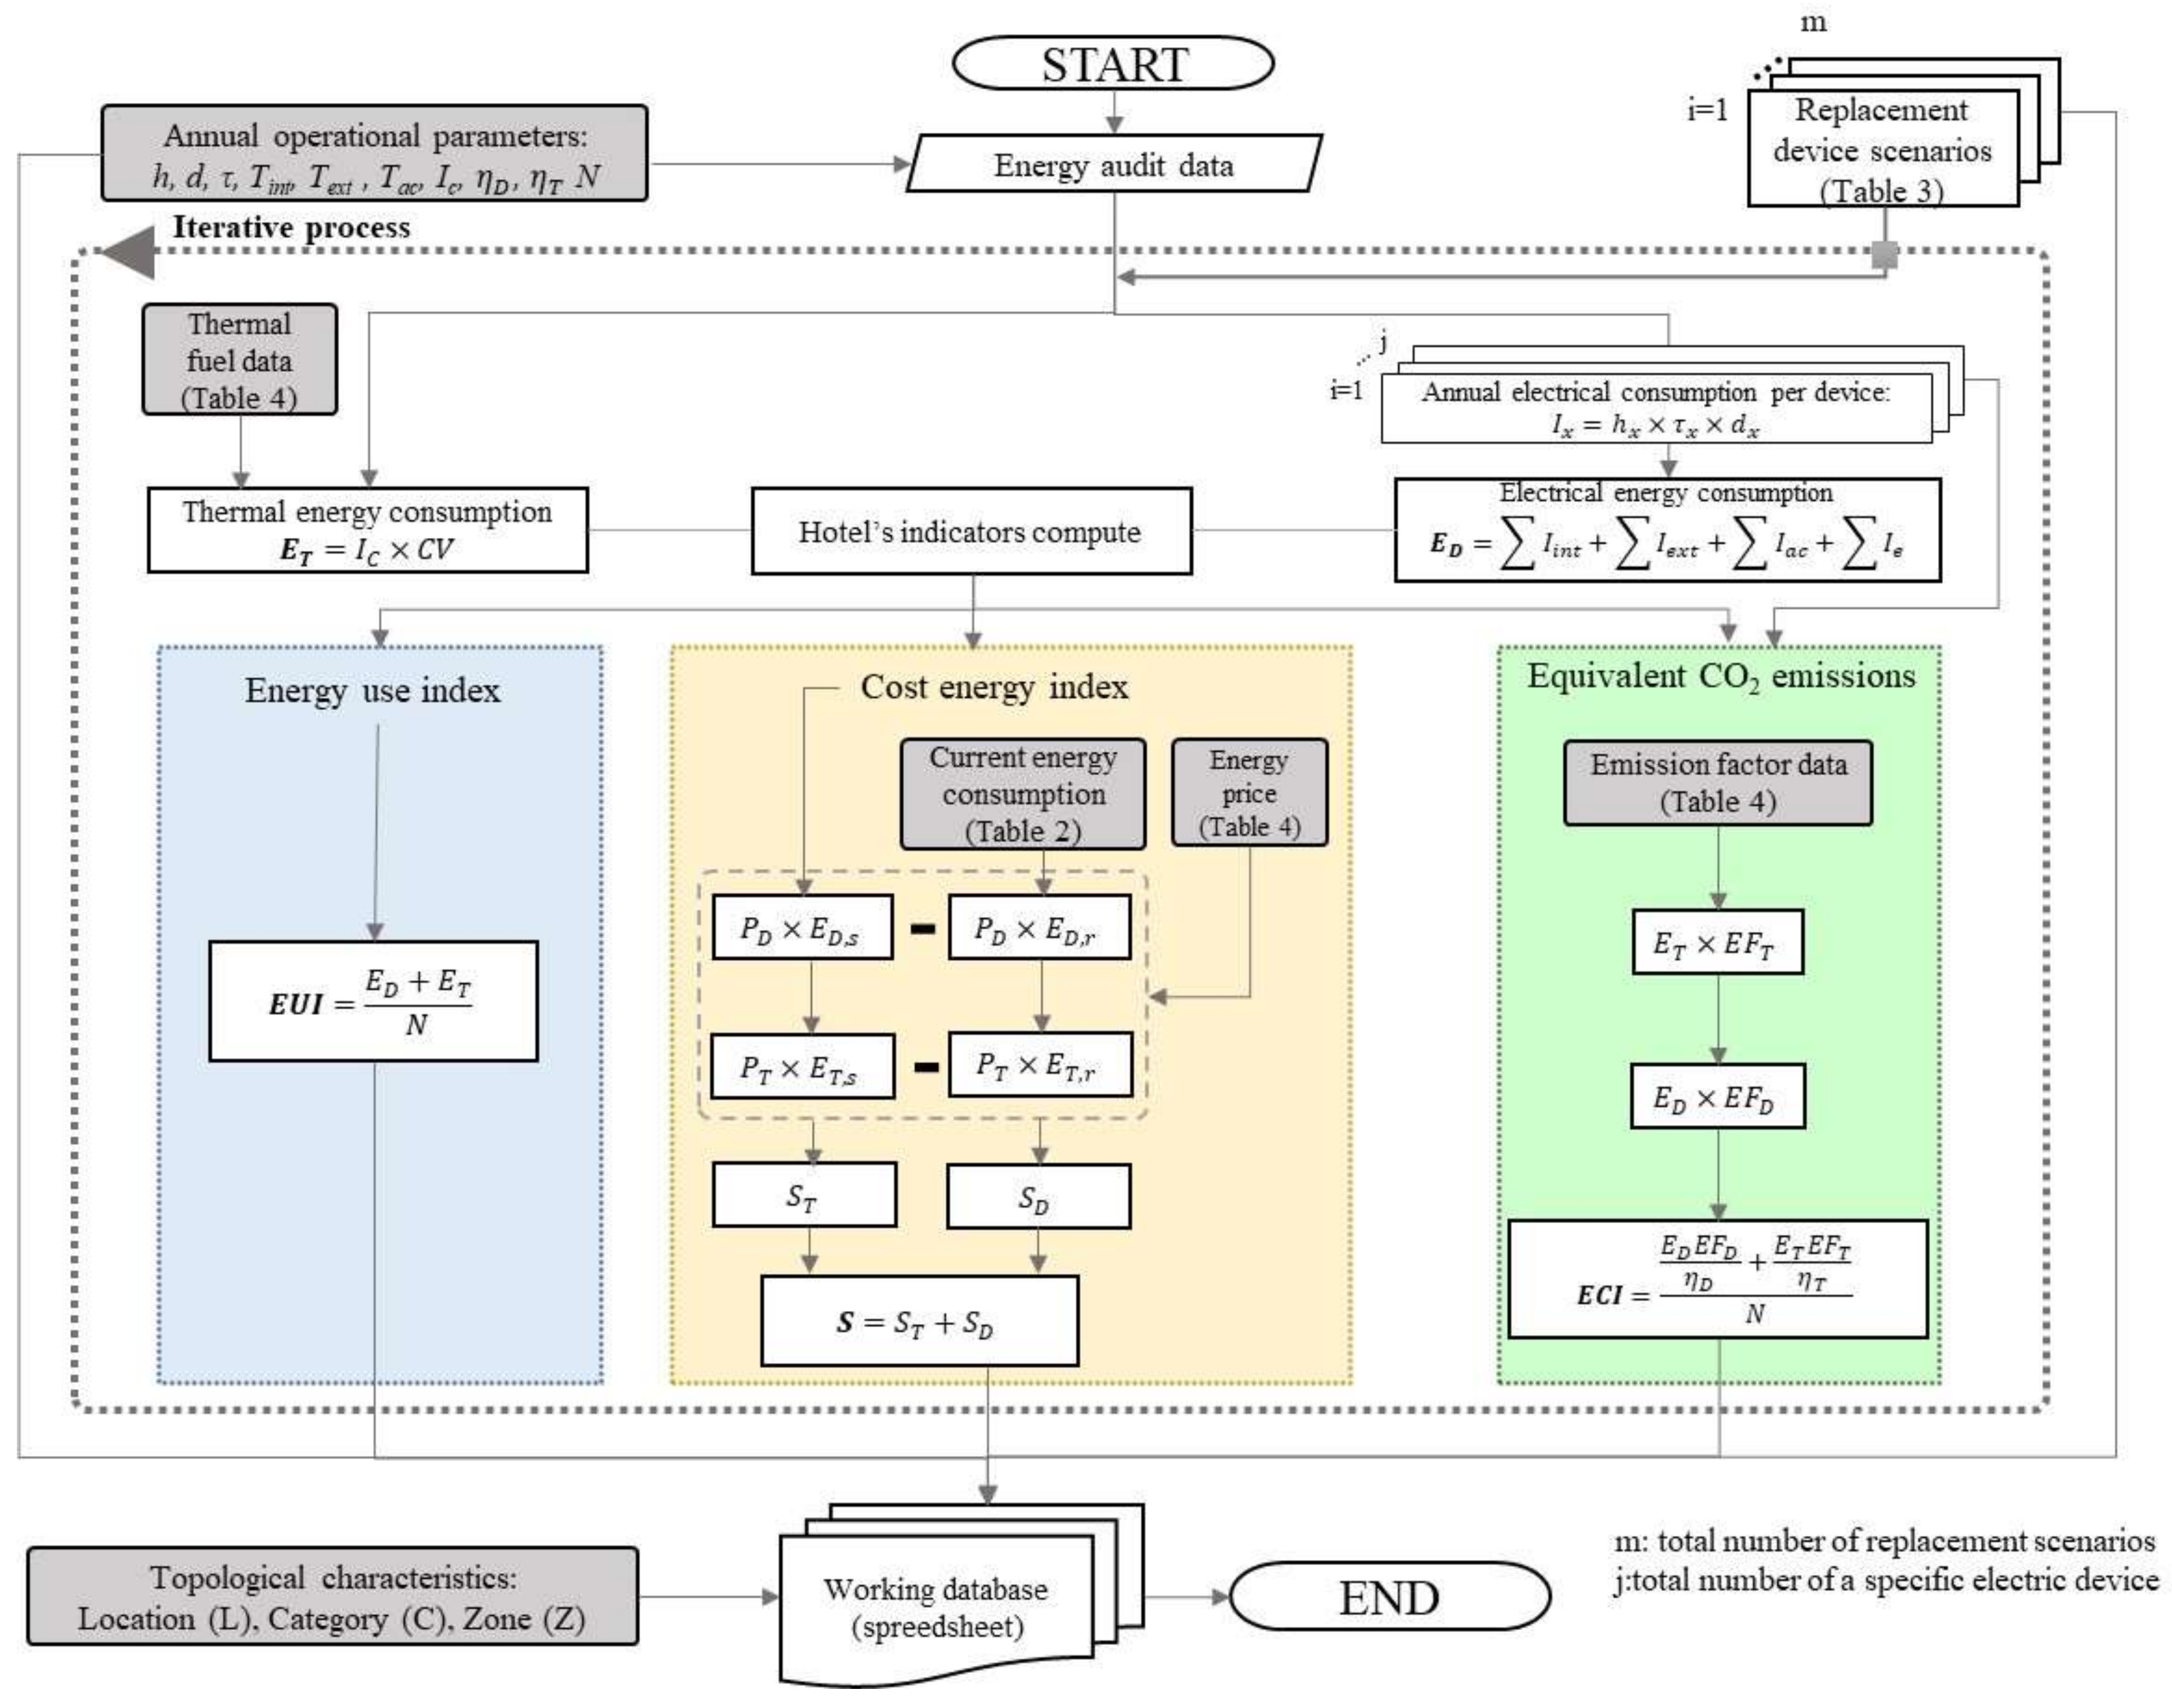
According to data from Secretariat of Tourism [20], hospitality establishments in Mexico have various classifications. Two of the most representative are the classification by commercial-activity zone and the classification according to the quality and quantity of the services offered. The first refers to the commercial zone of the region where the building is located (independent of the geographical location) and is subdivided into tourist, commercial, city, and beach, where the intensity of energy consumption is associated with its activity. On the other hand, for the quality of accommodation services, the buildings are grouped into five categories from one to five stars: (1) one star, establishments that only have the essentials for the guest (room, bathroom, and shower); (2) two stars, infrastructure and essential services such as reception and lighting; (3) three stars, well-equipped and standardized buildings with full services including green areas, garden, cafeteria, parking, and elevators; (4) four stars, luxury facilities and impeccable services including heating, bar, restaurant, swimming pool, gym, and meeting rooms; (5) five stars, exceptional facilities and services such as room service, concierge, entertainment staff, and all of the above.
From the energy point of view, the classification by service is significant, since it is associated with the use of energy. Table 1 summarizes the statistical information up to 2020 of the various hotels in the country. Concerning the distribution of the hotel supply, the concentration of three-star establishments stood out; however, the most significant number of rooms was found in five-star hotels, because hotels in this category are generally larger. On the other hand, the highest occupancy was found in hotels from two to four stars, concentrating around 60% of annual occupancy. From the point of view of rooms per hotel, there was a marked tendency for hotels in lower categories (below four stars) to have fewer rooms. This implies a decentralized and dispersed energy consumption among the buildings in these categories, which are of interest due to their high occupancy percentage.
Due to the vast extension of the Mexican territory, the climatic region plays a predominant role from the energy perspective in hotels. CONUEE [3] divides the Mexican territory into three large climatic regions: dry, temperate, and tropical. Figure 1 illustrates the territorial distribution by type of climate of the states that make up the national territory, with the respective occupation percentage. The image indicates that hotels in a tropical climate represented 35% of the hotel occupancy in the country, just below the dry climate. Therefore, two–four star hotels under these climatic conditions are of vital interest from the perspective of energy efficiency due to their tendency to consume more energy.
Unfortunately, unlike in other nations, there are no official reports on the energy consumption of the Mexican hotel sector. This leaves for granted the need for analysis and audits in this sector to reduce the intensive use of energy due to its preponderance in the energy consumption of the country’s commercial sector.

3. Methodology

Figure 2 illustrates the methodology applied in this study, consisting of four phases. The first phase contemplated using audits to collect operational and typological information that influenced the energy consumption of hotels located in the southeast. The information collected was used in the second phase to estimate technological-substitution scenarios based on a gradual-replacement approach of the devices with the highest energy consumption in hotels. In this stage, the indicators used to determine the energy, environmental, and economic impact were: the index of annual energy use per room (EUI), the index of annual equivalent CO2 emissions per room (CEI), and the energy cost (S). From this stage, a working database was obtained with topological and operational characteristics as well as indicator values for the considered replacement scenarios. The third phase involved the development of an ANN-based digital twin using the results of the energy scenarios. This hybridization approach with AI allowed us to generate an expert model linked to the three indicators, which, based on particular examples, could provide the full range of possible combinations of technology substitution in extremely reduced computation times. Finally, in the last phase, aided by the digital twin, the impact of all the possible scenarios of the replacement of energy devices on the indicators was analyzed. During this phase, those combinations of partial replacement of technology that improved hotels’ energy, environmental, or economic performance were identified. A detailed description of these phases is provided in the following subsections.

3.1. Hotel Energy Audits

The data used in the study came from energy audits consisting of surveys, measurements, and reports of electrical and thermal energy consumptions. A total of 9 hotels located in the hot-humid climate region were audited, distributed in the Mexican states of Campeche (CA), Chiapas (CH), Yucatan (YU), and Quintana Roo (QR). The electrical energy consumption considered internal and external lighting systems, air conditioning, refrigeration, irrigation pumps, household appliances, and computer equipment. The main information collected from such electrical equipment corresponded to the number of devices and their respective electrical power, hours of use per day, number of days they operated in the year, and the billed total energy consumption of the building or complex. The thermal analysis considered the fuel used for the boiler operation destined for the heating of sanitary water, laundry, and the showers of the guests. It was based on information corresponding to the liters of LP gas consumed annually by the building, the boiler efficiency, and the billed cost of the fuel. Table 2 summarizes the characteristics (category, number of rooms, and energy equipment) and energy information of the audited hotels, as well as the nomenclature assignment for data-privacy purposes. From the table, it can be seen that the audited hotels were between the categories of 2 and 4 stars. However, despite these characteristics, the number of rooms showed notable differences, even among hotels in the same state. It is worth mentioning that in the audits carried out, obsolete and inefficient technologies were detected, causing greater energy consumption.

3.2. Scenarios for Replacing Energy-Intensive Devices

In order to analyze alternatives to reduce energy use and CO2 emissions, a gradual-replacement approach for high-consumption devices was applied based on Mexican Standards [21,22,23,24]. Table 3 summarizes the information on the current devices used in the hotels and the low-energy devices with which the replacement was foreseen. The approach considered scenarios in which indoor and outdoor lighting, air conditioners, and boilers were partially replaced in intervals from 10% to 90% with steps of 10%. In the first instance, the replacement of electrical devices was carried out individually. Subsequently, this was conducted in tuples, and finally, the cases of the three devices were considered in a simulated way. For the case of the thermal device (boiler), only the total substitution was considered since it could not be fractioned. The final result was a database of 7040 energy scenarios per hotel (63,360 samples).

3.2.1. Use-of-Energy Index

The index considered in this study was determined based on the annual energy use per room (EUI), which is given as [14]:
E U I = E T + E D / N
where N represents the number of rooms per building, while ET and ED are the thermal and electrical energy consumptions, respectively, billed per year. In the case of ET, it was obtained as the product of the annual LP gas consumption (Ic, expressed in liters) and the calorific value (CV) presented in Table 4. On the other hand, E D was given by the consumption of each electrical device accounted for in the audit:
E D = i T i n t I i n t + j T e x t I e x t + k T a c I a c + I e ;       I = τ h d
where the energy consumption for each device is given by its electrical power (τ), operation hours per day (h), and the operating days per year (d), with I i n t being the energy consumption for each interior luminaire, I e x t the energy consumption for each exterior luminaire, I a c the consumption associated with each air conditioner, and I e the consumption corresponding to other equipment, such as computers, monitors, and appliances, among others. For their part, terms Tint, Text, and Tac are allusive to the number of indoor-lighting, outdoor-lighting, and air-conditioning devices per hotel, respectively.

3.2.2. Environmental Emission Index

The equivalent-CO2-emission index (CEI) was used to determine the environmental impact derived from the energy activity of each hotel. The CEI is defined as the annual total equivalent emissions in kg of CO2 per room [6]:
C E I = x = 1 n i = 1 n E x / η i F E x N
where subscript x represents the thermal or electrical energy consumption, while η is the efficiency of the i-th thermal or electrical device evaluated. FE represents the emission factor by energy source, whose values are described in Table 4.

3.2.3. Energy-Cost Index

In a complementary way, to define the technically feasible substitution alternatives, the study included an indicator of the annual energy cost saved (S):
S = S D + S T
where S D and S T are the annual electrical and thermal economic savings, respectively, defined by:
S x = P x E x , s E x , r
where Px represents the price of thermal or electrical energy (Table 4), E x , r is the current consumption per year for a given energy source, and E x , s is the estimated annual energy consumption using the technological substitution. In the case of thermal energy, the variability of the cost of LP gas according to the federal entity was considered (Table 3). The cost of the electricity consumed by the hotels was determined according to the tariff scheme of Great Demand in Medium Voltage (GDMT) [27] and whose average value is presented in Table 4.

3.2.4. Working-Database Formation

Figure 3 summarizes the procedure adopted for computing the performance of the three indicators associated with the technological-substitution scenarios and creating the working database. In the first instance, the hotel’s annual operation data obtained via the energy audits (Table 3) were integrated, and subsequently, the characteristics of the device-replacement scenarios to be evaluated were incorporated. Afterward, the annual energy consumption of the building was calculated. The thermal energy consumption was determined from the yearly LP gas bills expressed in liters, the calorific value information reported by Energy Regulatory Commission (Table 4), and the efficiency reported by the boilers in Table 3. Regarding electrical energy, it was considered as the sum of each device’s consumption (current or replaced, depending on the scenario), aided by the information presented in Table 3, the hours of use, and the days of operation per year. To guarantee these calculations’ reliability, each hotel’s original energy consumption was contrasted with its respective bills. Once the simulation of energy consumption was completed, the information was used as input data to obtain the EUI, CEI, and S. For the case of the EUI, the data were used as described in Equation (1). In the case of the CEI, both the electrical and thermal consumptions were previously multiplied by their respective emission factors (contained in Table 4) and subsequently implemented in Equation (3). While for the case of S, this involved a contrast between the current energy information (Table 2) and the energy consumption of the scenario to be evaluated, where the savings based on the energy prices presented in Table 4 were later computed. This process was repeated for each device-replacement scenario (Section 2) in the 9 audited hotels. Finally, these were stored in a spreadsheet, associating them with their respective replacement percentage and the number of devices with which the calculation was made, as well as the topological characteristics of the building (location (L), category (C), and area of commercial activity (Z)).
It is important to emphasize that although the algorithm presented is adequate to compute the result of the indicators in each device-substitution scenario, personnel with specific knowledge about energy efficiency are required to carry it out. Therefore, it is necessary to develop computational alternatives that simplify and facilitate this process for the use of hotel managers, one of the most feasible being the development of digital twins.

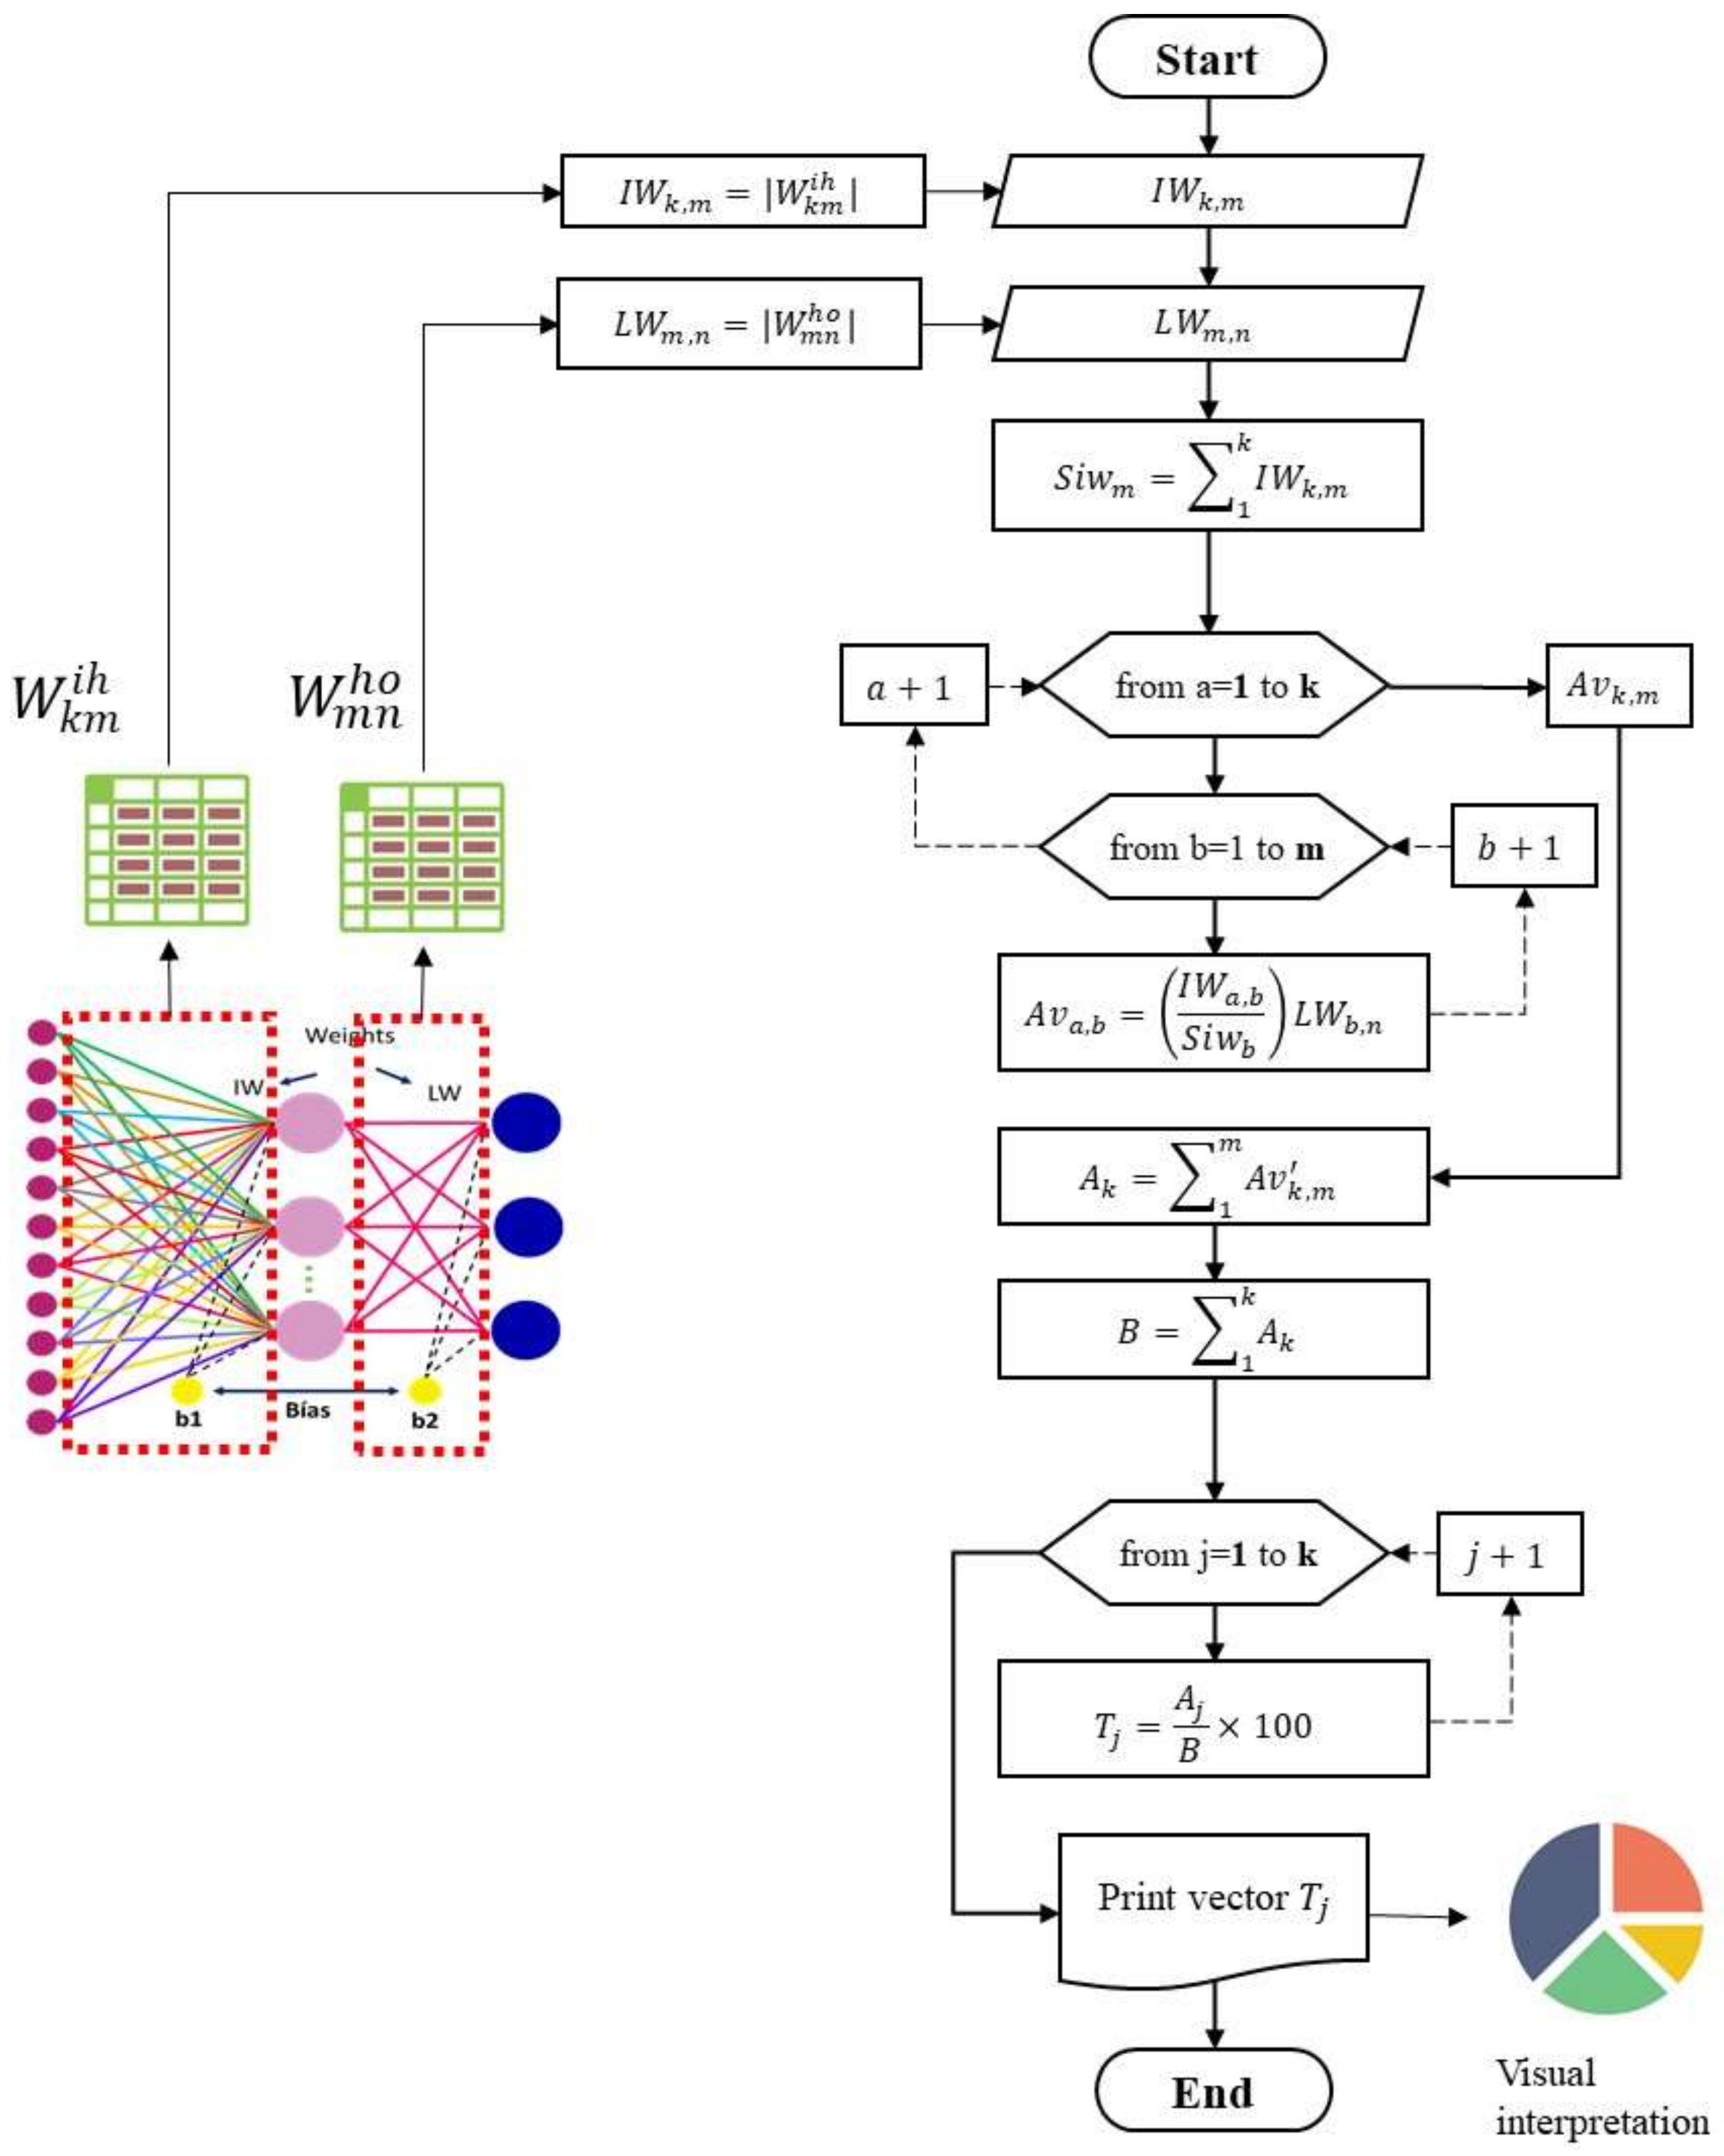
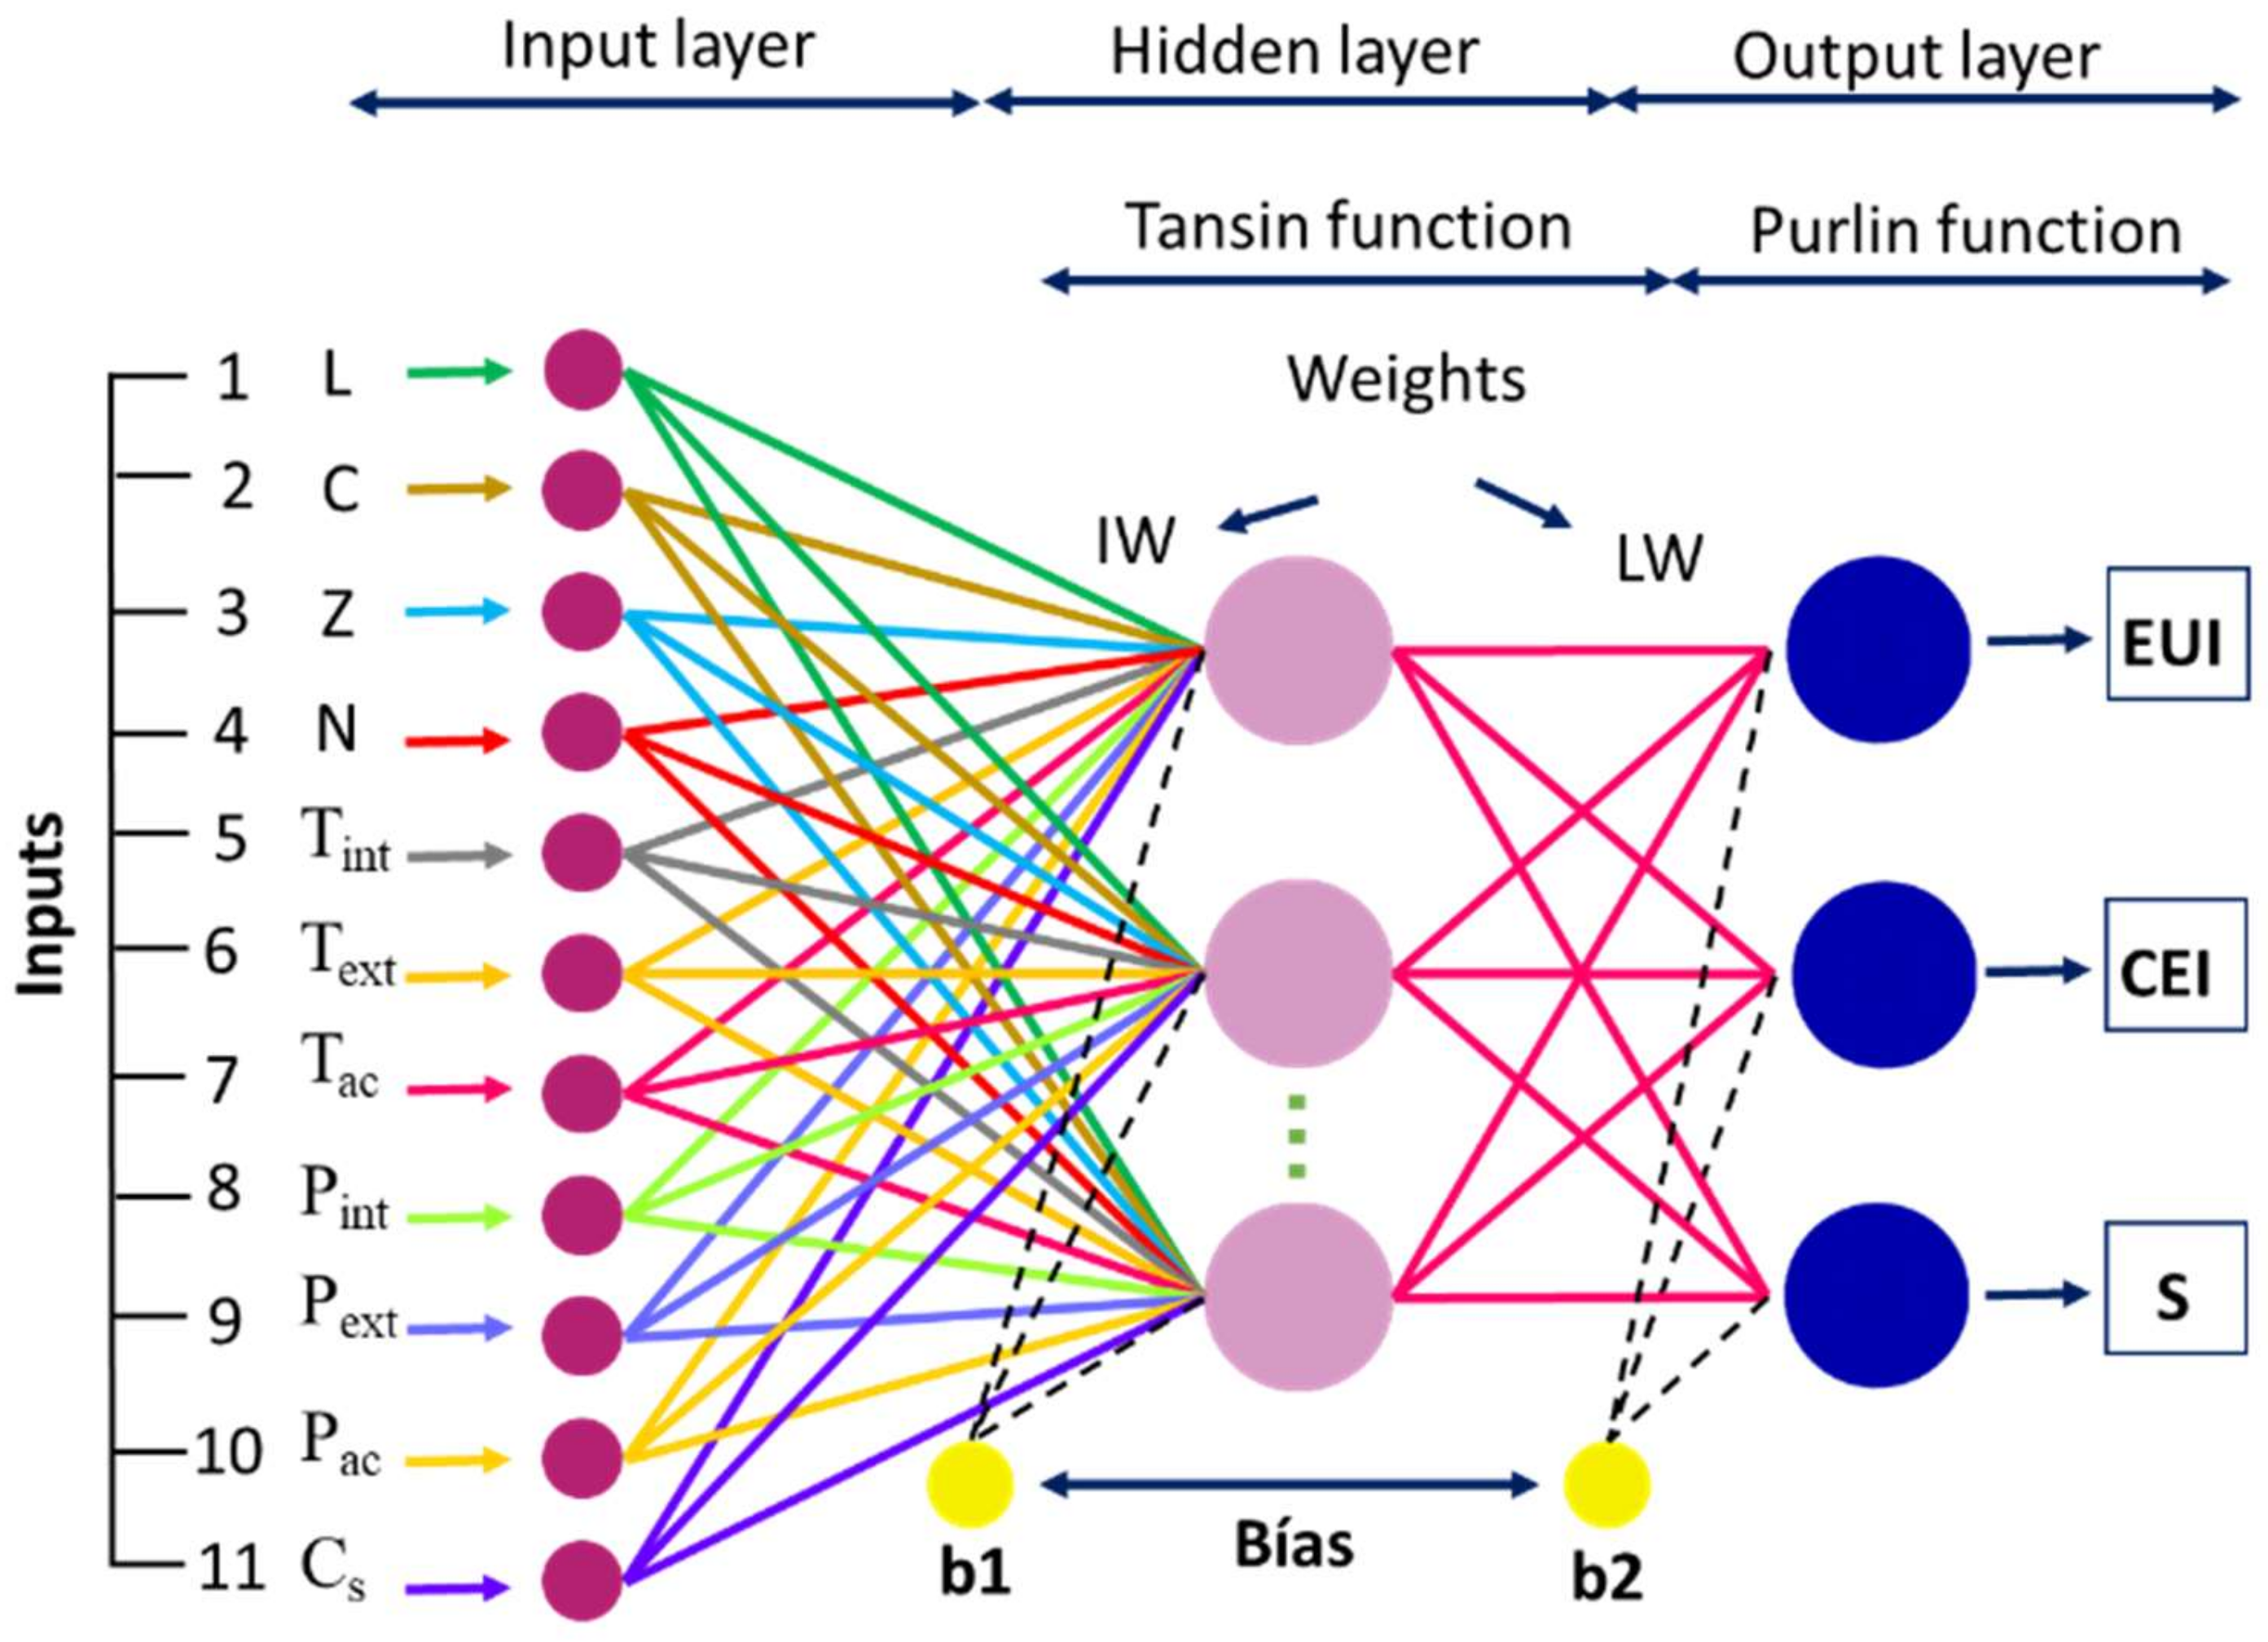
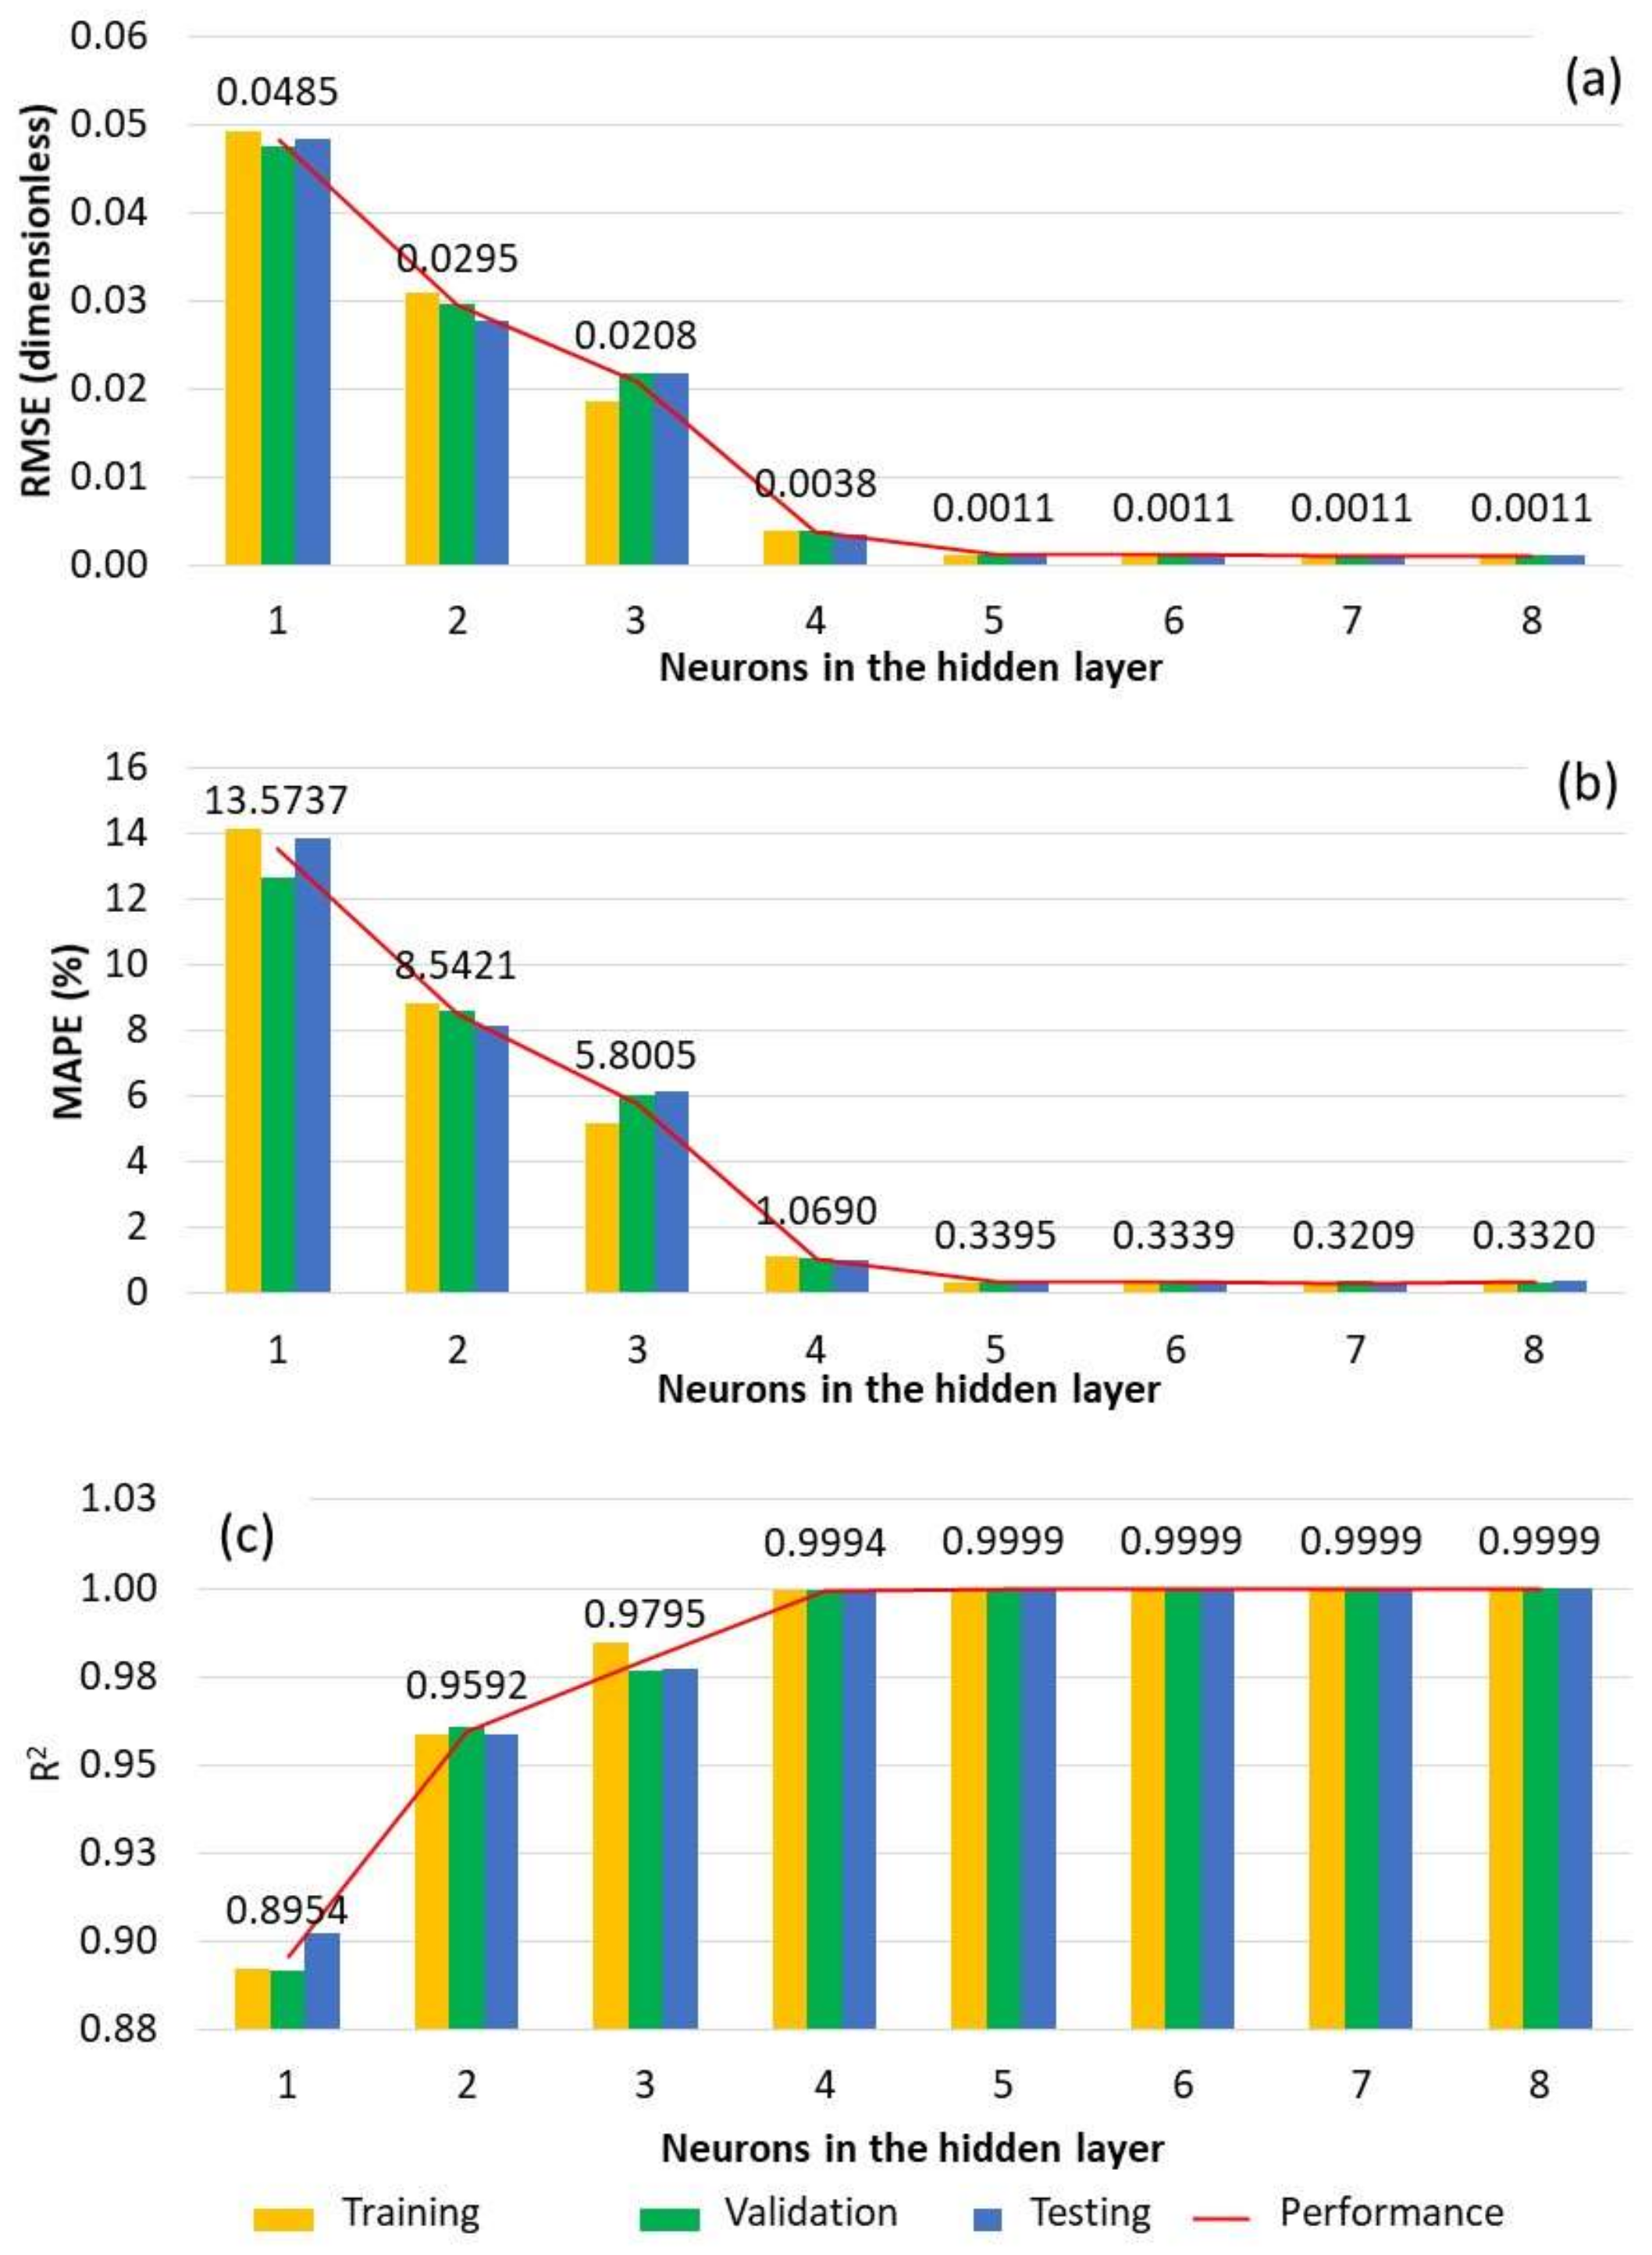
3.3. Artificial Neural Network Modeling

The information generated in the various energy-saving scenarios was synthesized in an expert model based on an ANN. The choice of this multivariable technique was due to its feasibility in the energy field for solving complex problems and its ability to produce multi-output models using a supervised learning process. These characteristics make it a suitable tool for developing digital twins (expert models based on other models), allowing the behavior of concatenated mathematical expressions to be emulated and producing simpler representations of the phenomenon in shorter computation times [28,29].
ANN modeling is executed through two main stages called training and testing. The conventional structure of an ANN is given by an input layer (input parameters), one or more hidden layers, and an output layer (values to be estimated by the ANN). The network function that describes the behavior of the modeled process is determined by the interconnection of the neurons in each layer through the connection weights (Figure 4). The relationship between the input and output parameters is obtained through a supervised learning process called backpropagation, in which the network continually modifies its connection weights until the best approximation is found [30].
In the present work, an ANN was applied as a digital twin to model the behavior of the indicators and determine the efficiency potentials based on the 63,360 technological-device-substitution scenarios. Table 5 summarizes the basic information of the variables considered as the inputs of the digital model, which are made up of building aspects, such as topological characteristics (location (L), category (C), and hotel zone (Z)), operational elements (quantity of rooms (N), indoor lighting (Tint), outdoor lighting (Text), and air conditioning (Tac)), and the partial-replacement scenarios given in substitution percentages (indoor lighting (Pint), outdoor lighting (Pout), air conditioning (Pac), and boiler (Cs)). Based on this, the ANN architecture comprised 11 input neurons (defined in Table 5), a single hidden layer, and an output layer made up of 3 neurons to simultaneously predict the energy-use index (EUI), the equivalent-CO2-emission index (CEI), and the energy-cost index (S).
For the modeling, the database was standardized using Equation (6), where X, σ, and u represent the value, standard deviation, and mean of the given input or output variable, whereas zn corresponds to the standardized equivalent value. The use of standardization avoided the sensitivity to outliers and the indeterminacy of the data:
Z n = X u σ
Subsequently, the normalized information was divided into two fractions, assigning 80% of the data to the training process and the remaining 20% to the validation (10%) and testing (10%) stages. During training, the ANN used the backpropagation algorithm to calculate the error between the current values (those provided for the network to learn) and the estimated ones (those calculated by the ANN) and improve the value of ANN’s weights and bias matrices, reducing the estimation error in each iteration. The goal was to minimize the error between the estimations and the sample data until a model that described as accurately as possible the phenomenon under study was achieved.
The activation functions implemented for the neurons in the hidden layer and the output layer were the sigmoid tangent (Equation (7)) and the linear function (Equation (8)), respectively:
f α = 2 / 1 + e 2 α
f α = α
where α corresponds to the weighted sum of the output values from the neurons of the previous layer (u) in terms of the interconnection weights between layers (w) and the adjustment factor or bias (b):
α j = i = 1 a w i , j u i + b j
The supervised learning algorithm used in the backpropagation process for the optimization of weights and bias values was the Levenberge-Marguardt (LM) algorithm. The numerical calculations of the ANN were performed using the ANN’s Toolbox package in MATLAB [31]. Table 6 summarizes the information of the hyperparameters used to train the artificial-intelligence models. The modeling process contemplated a total of 500 epoch of full-batch size. The model’s performance was computed using the mean square error (mse) function, the initialization of weights and bias was conducted with the Nguyen-Widrow function [32], while the default values contained in the toolbox were considered for the other elements.
The performance of the digital twin was calculated using three statistical parameters: root-mean-square error (RMSE), mean absolute percentage error (MAPE), and the coefficient of determination (R2). These indicators were formulated in terms of predictions by the ANN (ysim) and the values used for network training (yactual). The RMSE (Equation (10)) is used to calculate the differences between the experimental and simulated values, with its main characteristics being to cushion minor errors and punish marked differences. The MAPE (Equation (11)) is a statistical parameter ranging from 0 to 100; it is used to calculate the percentage of the model error when estimating a variable (%). R2 (Equation (12)) illustrates the intensity of the variability relationship in a set of data, generally between 0 and 1. For both the RMSE and MAPE, the smaller their value are, the better the model’s performance is. On the other hand, for R2, the best models are those in which R2 ≈ 1, and the slope and order of the regression line are close to one and zero, respectively.
R M S E = 1 a i = 1 a y s i m i y a c t u a l i 2
M A P E = 1 a i = 1 a y s i m i y a c t u a l i y a c t u a l i × 100
R 2 = 1 i = 1 a y a c t u a l i y s i m i 2 i = 1 a y a c t u a l i y ¯ a c t u a l 2

4. Analysis of Results

4.1. Digital-Twin Model

The digital model was obtained by evaluating various ANN architectures. Supervised learning was carried out contemplating 500 iterations for each architecture. The number of neurons in the hidden layer gradually increased (from 1 to 10) to find the optimal number of neurons that minimized the estimation error.
Figure 5 summarizes the analyzed ANN architectures’ statistical performance results (RMSE, MAPE, and R2). As can be seen, the increase in the number of neurons in the hidden layer favored the correlation between the data assigned for training and those estimated by the ANN. Similarly, as the number of hidden neurons increased, the difference between the values calculated by the network and the experimental measurements considerably decreased (Figure 5a,b). In this sense, the trend line present in this figure indicates that after the inclusion of five neurons in the hidden layer, the increase did not significantly contribute to improvements of the estimation capacity. Therefore, the analysis of the statistical performance of the architectures suggested that the reliable results with minor topological complexity were given using five neurons in the hidden layer. This model contained the highest coefficient of determination (R2 = 0.9999), as well as some of the lowest statistical parameters (RMSE = 0.0009 and MAPE = 0.252%) of all the topologies evaluated. In addition, the results corresponding to the validation and testing phases showed that the variation among the three data sets was minimal, which indicated a good generalization capacity of the expert model.

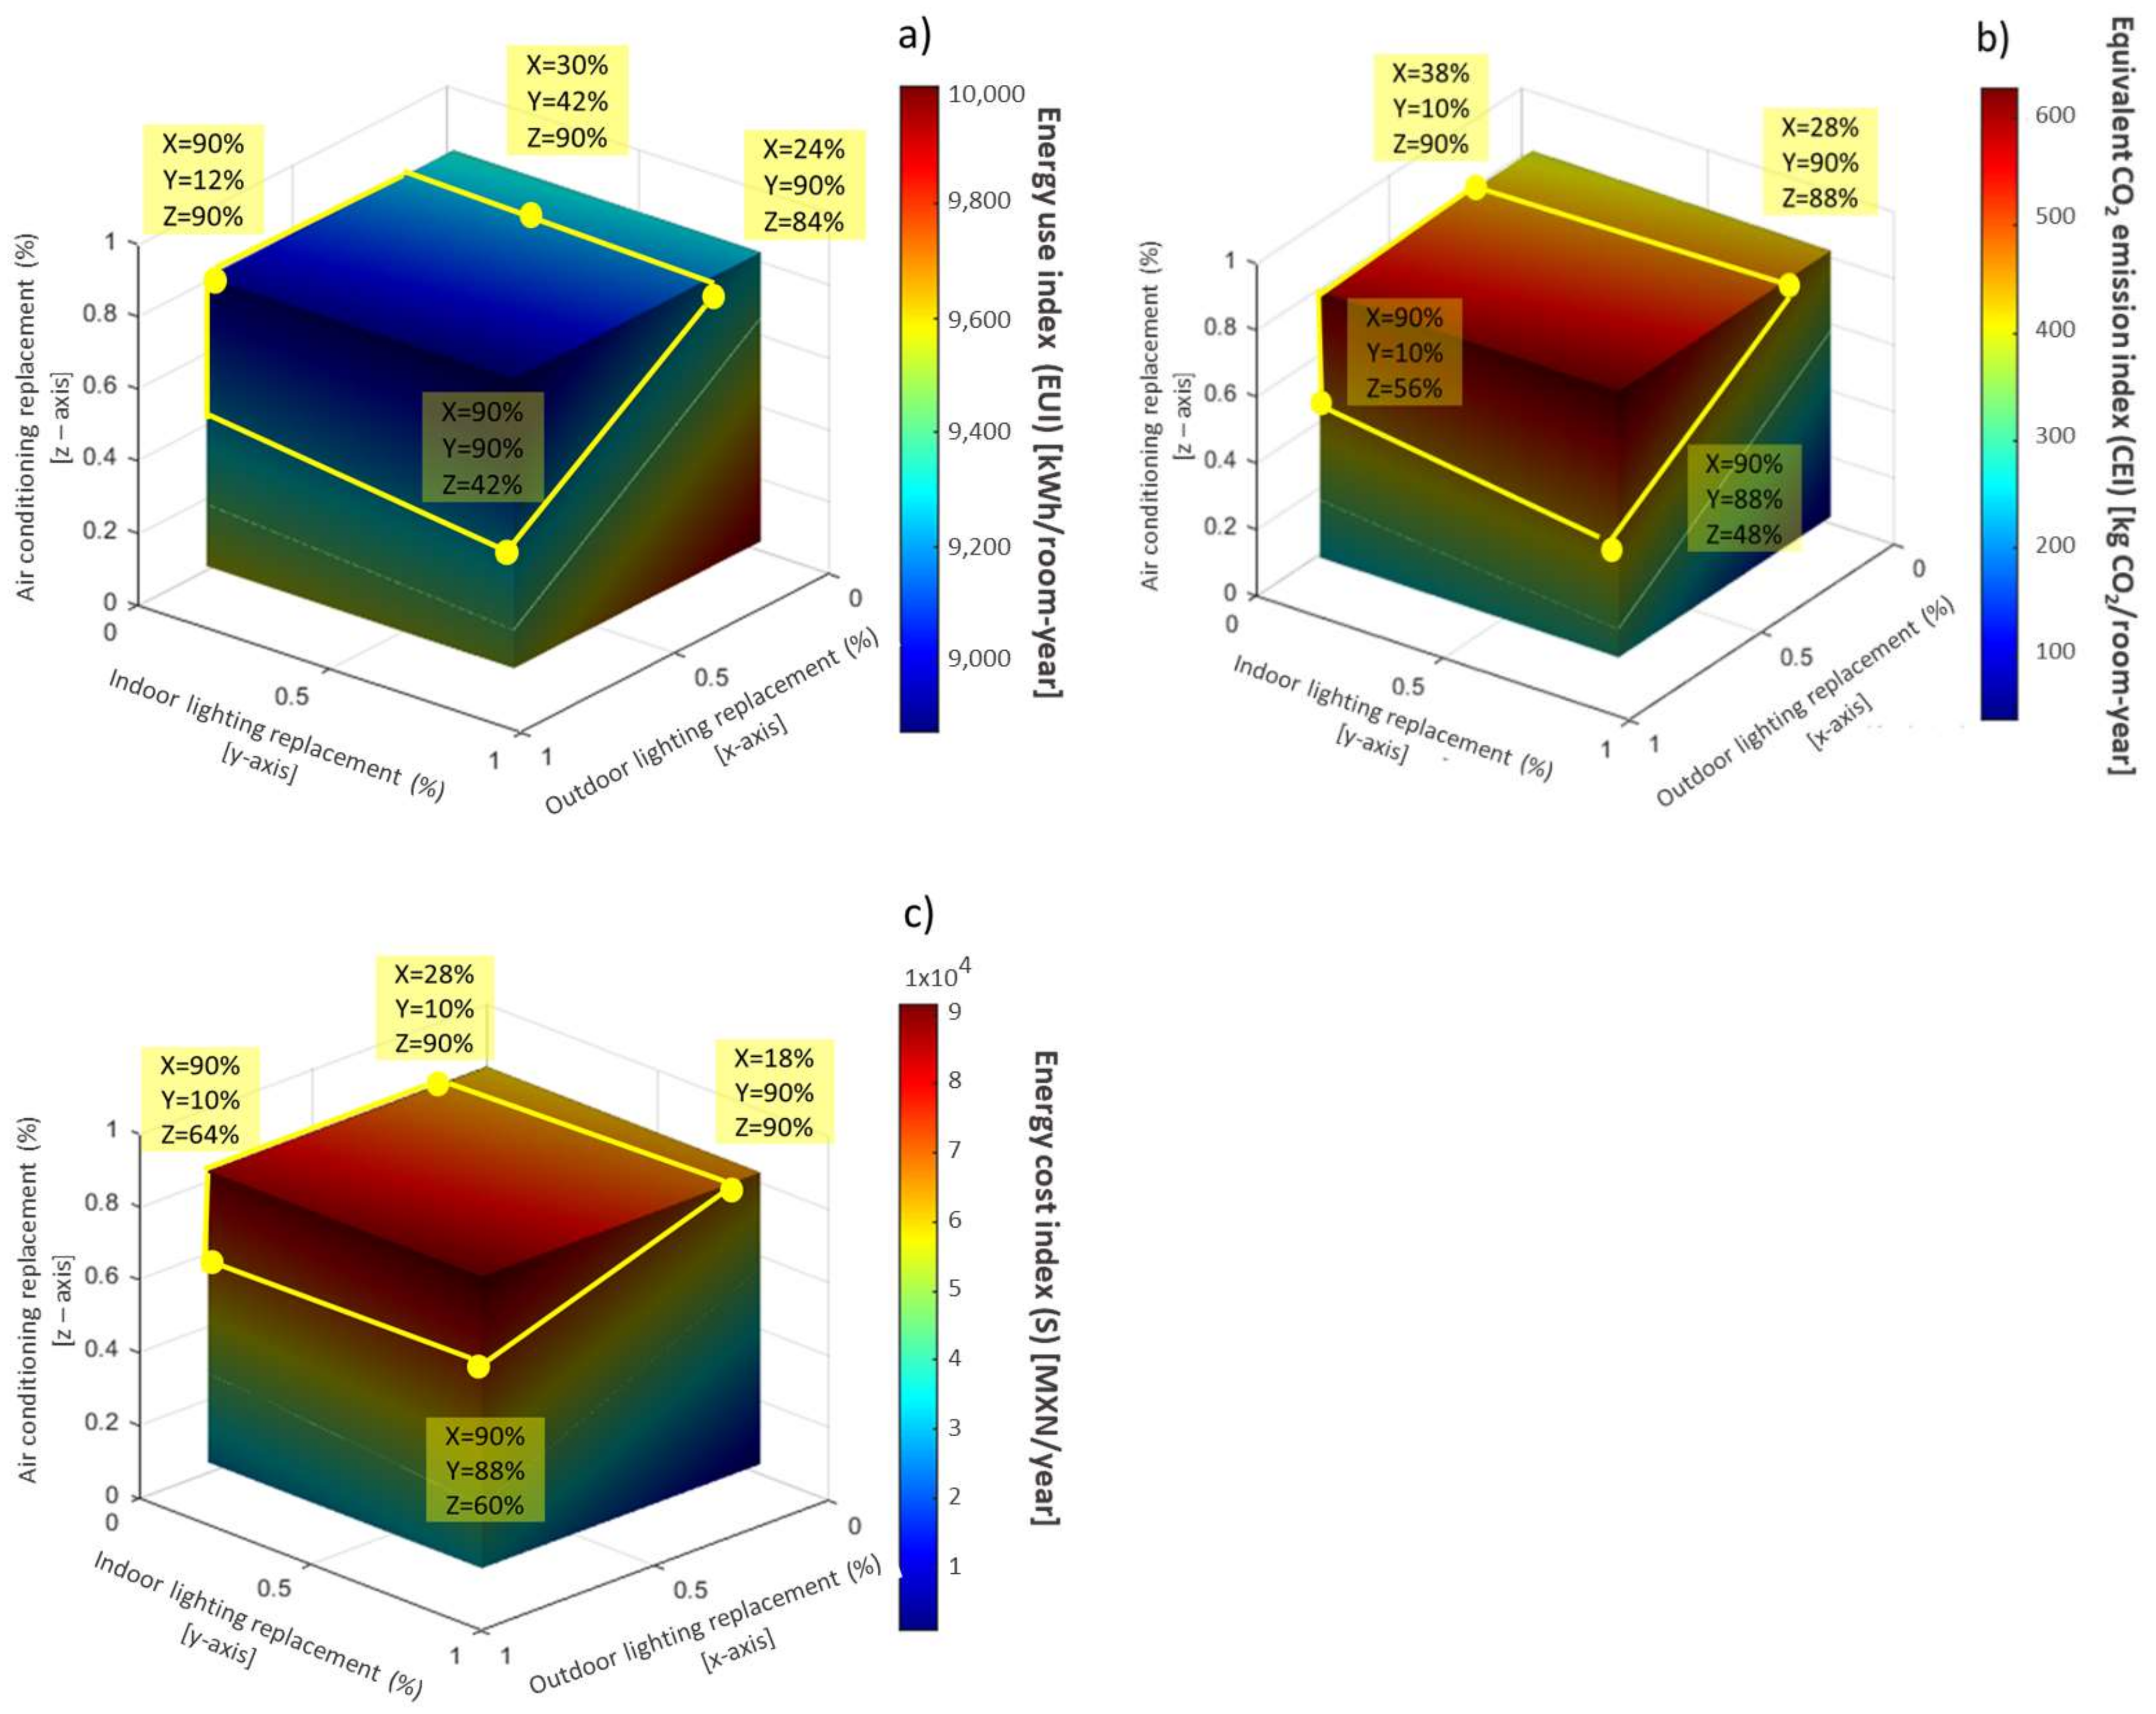
4.2. Sensitivity Analysis

A sensitivity analysis was performed to validate the physical interpretation of the developed ANN model and guarantee its applicability to the case study. This analysis focused on measuring the impact that each of the model inputs produced on the ANN outputs (EUI, CEI, and S). The more significant the effect observed on the output was, the greater sensitivity to the input it presented was. For this purpose, the Garson’s technique [33] was used, which is based on determining said impact from the network interconnection weights:
T j = m = 1 m = N h ( W j m i h / k = 1 N i W k m i h ) x W m n h o ) k = 1 k = N h { ( W j m i h / k = 1 N i W k m i h ) x W m n h o }
where Tj is the relative importance of the j input variables over the ANN output; Ni and Nh are the numbers of input and hidden neurons, respectively; W are the connection weights; and superfixes ih and ho refer to the input, hidden, and output layers respectively. Finally, suffixes k, m and n refer to the neurons located in the input, hidden, and output layers. The results show the impact of each of the inputs on the output variable as a percentage, which is complex to understand using other statistical modeling strategies. Garson’s method was chosen because it is a fast and easy-to-implement technique that operates using the information stored in the weights of the ANN. In addition, its results are presented in percentage form, facilitating understanding and the application in the decision making of hotel managers.
The sensitivity analysis was computed through a programming script implemented in MATLAB (described in Appendix A). Figure 6 shows the results of the 11 variables integrated in the digital-twin model: location (L), category (C), and hotel zone (Z); operational elements (quantity of rooms (N), indoor lighting (Tint), outdoor lighting (Tout), and air conditioning (Tac)); and the partial-replacement scenarios given in substitution percentages (indoor lighting (Pint), outdoor lighting (Pout), air conditioning (Pac), and boiler (Cs)). Analyzing the graphs, it can be seen that regardless of the indicator, the impact of the operational elements was distributed semi-proportionally between the number of devices and the percentage of technological substitution, showing that the general importance of high-consumption devices was distributed between both variables. The foregoing implies that the technological replacement impacted based on the number of devices present in the tourist buildings, coinciding with what is reported in the literature. Based on this, the gray boxes indicate the sum of the total influence of the high-energy-demand device, whose grouping allows one to visualize its true impact on the indicators.
Figure 6a shows that except for the thermal energy produced by the boilers, the variables considered had a representative role in the intensive use of energy. By analyzing the graph, the sum of the effect of the electrical devices (internal and external lighting and air conditioners) represented just under 50% of the impact on the EUI. This confirmed that actions to reduce energy use were linked to the substitution capacity of these devices. In addition, it is necessary to note that the category of the hotel and the rooms were also representatives. It was consistent with what is indicated in Table 1 and Table 2 and gave certainty of the reliability of the digital twin.
In the case of Figure 6b, similarities could be seen concerning the EUI case. The foregoing was because the emissions they generated was in accordance with the consumption of equipment with the highest power and the geographical location. According to this, interior lighting was the device that most affected CO2-equivalent emissions above air conditioning and exterior lighting. In addition, it was observed that in terms of emissions, it was the hotel category and not the number of rooms that had the most significant repercussions.
Concerning the reduction in the operating costs (Figure 6c), it stood out that the replacement of interior lighting obtained significant economic savings of more than 37%, because it was the device with the largest number of elements installed per room. This was followed by air conditioning with more than 28%, linked to it being among the most powerful electronic equipment with greater use time throughout the day. As the last point, exterior lighting represented 12%, implying that its replacement also favored annual energy cost savings. It is important to emphasize that the location significantly impacted the three indicators, even though they were in the same climatic region. It indicates the need for studies and audits more focused on analyzing the energy performance of hotels in the Mexican tropical climate in the various states involved in this classification. On the other hand, the category and zone were not as significant as in previous cases (Figure 6a,b); this was due to the index’s nature. Being a subtraction between the current cost and the potential cost of applying the energy reduction actions, the effect of the activities between the various classifications was reduced. This prioritized the weights of the ANN of the monetary difference produced by the number of devices and the replacement percentages (giving them greater importance, as shown in the figure).
Finally, for all cases, it can be seen that the boiler did not have relevant impacts on the three indicators, with the case of annual monetary savings being where it stood out the most, with 0.51%. The previous was due to the high environmental temperatures in this climatic region that limit heating and water-heating systems, making their energy consumption insignificant.

4.3. Evaluation of Indicators

In this section, the analysis of the EUI, CEI, and S indicators was carried out based on the percentage of technological substitution. A 3D-isolayer scheme aided the analysis for each scenario, where the x-axis represents Pext, the y-axis is Pint, and the z-axis is Pac. Figure 7 shows an example of this analysis for the case of the CA5 hotel, where the color scale reflects the variation from lower to higher for each of the indicators, with the cold colors (blue) being associated with reduction cases and warm colors (red) with increase cases. In the same way, the yellow lines delimit those configurations that reached a significant percentage of the indicators. For all the hotels, the criterion for assigning the significant percentages (yellow line) was based on the color scale linked to the indicators’ results, subdividing them into eight categories: ocean, blue, cyan, green, yellow, orange, red, and brown. For the case of the EUI, whose purpose was to reduce the index value, the transition point between cyan and blue was considered significant. In contrast, the transition point between orange and red for the CEI and S was considered significant. It is important to emphasize that assigning these delimitations using color scales can allow better identification and interpretation to be performed by hotel personnel with little or no knowledge in these areas, making it possible to obtain greater economic, energy, and environmental benefits.
Figure 7a exemplifies the analysis performed for the EUI. According to the delimitation of the yellow line, there were various configurations of technological substitution that allowed the intensity of energy use on similar scales to be reduced. In the case of this hotel, the contour generated by the limit line indicates all the possible configurations that allowed a reduction of 9.05% in the EUI to be achieved; similarly, increases are indicated as the substitution percentage of the three electrical devices converging to 90% replacement (19.46%). As can be seen, to achieve at least a 9.05% reduction in the EUI, there were various alternatives. Among them, one of the most interesting configurations from the economic-energy points of view was 90% exterior and interior lighting and a 42% replacement of air conditioners. The above was based on the replacement costs presented in Table 3, whereby the replacement of almost all types of luminaires was found to be cheaper and to deliver similar energy reductions compared to several cases of air-conditioner replacements of 90%. Thus, this represents a decision-making aid for managers of two–four star hotels, as it would help to identify energy-reduction strategies by integrating current and more efficient technologies without making a total investment immediately. In addition, it would allow hotel managers to schedule an intercalated replacement of the devices.
Figure 7b shows the difference between the current CEI and the one obtained for the technological-substitution scenarios, with the objective being to maximize CO2 mitigation per room. According to the image, the configurations within the boundary lines improved CO2 mitigation by 18.85% for this hotel. Similar to the previous case, it was possible to obtain a deck of alternatives with identical results. For example, substituting interior lighting, exterior lighting, and air conditioning in the proportion of 90–88–48% provided the same indicator performance as a 90–10–56% proportion. These results are significant since they give hotels alternatives for decision making and immediate compliance with environmental regulations through partial substitutions and efficient technological replacement.
Finally, for the case of economic savings due to technology change, Figure 7c shows the profile of alternatives for its maximization. As can be seen, the best cases occurred when the technology change was total (savings of 12.3% per year), implying, at the same time, a high investment cost. However, the analysis showed that without resorting to total replacement, it was possible to achieve significant savings of up to 11.97%, as in the case of replacing interior lighting, exterior lighting, and air conditioning by 90–10–64%. The same results could be achieved with a 90–88–60% setting. It is interesting and useful for administrators, because it offers them a range of possibilities to reduce costs in their establishments, obtain satisfactory results in their economy, and be more competitive in the tourism market.
A similar analysis was carried out using the digital twin for each hotel, and the results are summarized in Table 7. The approach allowed us to obtain a reduction between 11.48 and 18.85% in the case of the CEI, 9.05–19.46% for the EUI, and 8.23–30.22% for monetary savings (S). It is reflected that for the CH2 hotel, the best savings were obtained because it was one of the hotels with the lowest energy consumption and one with the fewest number of rooms; in addition, it presented greater services, and its consumption was comparable to that of a two-star hotel. This implies that in this hotel they made more efficient use of energy. However, for the hotels located in Campeche, the strategy of partial substitutions could improve up to 16.09% of the use of energy, reaching a reduction of 7300 kWh/person-year. Regarding the CEI, the partial substitution alternatives also showed savings of at least 16.53% for the case of Campeche; for Chiapas and Quintana Roo, they were on average 18%, while for the case of Yucatan, a minimum of 11.48% was reported. These differences among hotels may have been associated with the intensity of tourist activity in each location, and the categories and location area also played essential roles.
For the S index, it could be seen that the CH2 hotel had the most significant capacity to reduce costs (30.22%) with 360,000.00 MXN kWh/year. In monetary terms, the hotel with the greatest benefits was CA4, with savings of 2,524,334.90 MXN/year. The hotel had the highest energy consumption, the largest number of installed air conditioners, and lighting devices exceeding 1000. It should be noted that these results represent a practical option in order to capture the interest of administrators to opt for a means of reduction for the benefit of their company, to encourage them to make these changes in a partial way to achieve savings in regions with a tropical climate, and to establish economical and environmentally friendly tourist-attraction hotels.

5. Conclusions

This work presented a new approach based on an artificial-intelligence model for estimating energy-reduction scenarios and carbon-footprint mitigation in hotels in tropical-climate regions. Based on an artificial neural network (ANN), we developed an expert model to synthetize the energy-reduction scenarios based on data from audits and link them with energy-use, equivalent-CO2-emissions, and economic-saving indicators. The model obtained its best data fit from five hidden neurons, obtaining excellent statistical parameters (R2 = 0.9999, RMSE = 0.0009, and MAPE = 0.252%). Subsequently, the model was used to perform a sensitivity analysis where the impact of the variables on the indicators of interest was measured, obtaining that the federal entity played an important role because the cost of energy varied depending on the geographical location. Another critical factor was the category of stars that hotels had, since they measured the activity and services they required for their operation. In addition, the quantities of the energy-consuming devices found also had a significant influence. On the other hand, despite the fact that the influence of thermal systems was almost nil for the tropical region under study, their presence was useful to demonstrate the implementation of the methodology, which can become relevant when moving to other climatic regions. Finally, the energy indicators on the reduction scenarios were evaluated. The replacement configurations of higher-energy-consumption devices were implemented to capture the attention of administrators and incentivize them to opt for reduction solutions according to the economic resource they have available. The results showed that the monetary savings could reach 2,524,334.90 MXN/year and decrease by 19.46% in terms of the rate of energy use. These savings could help direct hotels in the Mexican southeast to be competitive with those in other climatic zones of the country.
The proposed approach is vitally helpful for intermediate-class hotels. It provides a tool to reduce consumption costs and environmental impact based on the accessible information collected. In addition, implementing a simple sensitivity analysis method provides easy-to-understand results in percentage form, allowing quicker decision making to be performed by hotel managers with little or no knowledge of energy and environmental issues. It is essential to highlight that this is not intended to replace in-depth energy audits but rather to be an alternative to aid the decision making of hotel administrators. It allows partial- and gradual-technology-replacement plans to be managed and encourages energy efficiency without high investment. Its application through a mathematical model allows its transfer to digital platforms and smartphone applications to be conducted. In addition, being based on a supervised learning process, it can be fed with information from new energy audits, increasing the scope of the hotels and regions it could impact. Finally, the methodological approach presented can be easily extrapolated to other categories of the tourism sector and climate zones of Mexico and Latin America.

Author Contributions

Conceptualization, O.M.T. and J.O.S.; Data curation, K.M.A.-C.; Funding acquisition, A.d.R.C.-y.C. and F.J.B.-L.; Methodology, O.M.T. and M.C.T.; Project administration, O.M.T.; Resources, J.O.S.; Software, S.G.M.T.; Supervision, A.d.R.C.-y.C.; Validation, K.M.A.-C. and F.J.B.-L.; Writing—original draft, S.G.M.T.; Writing—review and editing O.M.T. and K.M.A.-C. All authors have read and agreed to the published version of the manuscript.

Funding

The APC was funded by Autonomous University of Campeche.

Institutional Review Board Statement

Not applicable.

Informed Consent Statement

Not applicable.

Data Availability Statement

Data available upon request from the corresponding author.

Acknowledgments

The first author thanks Autonomous University of Campeche, Pablo García Foundation, and National Council for Science and Technology (CONACYT-CVU: 1091348) for the scholarship for the development of postgraduate studies. The authors thank the CONACYT-249322 project for providing the information of the energy audits.

Conflicts of Interest

The funders had no role in the design of the study; in the collection, analyses, or interpretation of the data; in the writing of the manuscript; or in the decision to publish the results.

Appendix A

Figure A1 details the implementation of Garson’s algorithm described in Section 4.2 (Equation (13)). This starts by converting to positive all the ANN’s weight matrix elements using the absolute value function (IW, weights between hidden and input layers; LW, weights between hidden and output layers). To facilitate the calculations, vector Siwm is created where its elements represent the input neurons’ influence (the sum) on each hidden neuron (m). The vector enters an iterative process to identify the importance ratio of each element of the IW matrix to the total of the weights that affect a given hidden neuron and use it to express the impact of the LW weights (creating the Avk,m matrix). Finally, the total value of the columns of this new matrix (which contains the information of the input variables) is divided by the sum of all its elements. This division calculates the impact of the start–finish weights associated with a specific input with respect to all the weights embedded in the ANN.
Figure A1. Numerical procedure for the implementation of Garson’s method as a sensitivity analysis tool.
Buildings 12 01155 g0a1

References

  1. UNWTO. Panorama Del Turismo Mundial; World Tourism Organization: Madrid, Spain, 2019. [Google Scholar]
  2. SETUR. Compendio Estadístico del Turismo en México 2020; SETUR: Mexico City, Mexico, 2020. [Google Scholar]
  3. CONUEE. Consumo de Electricidad de Edificios no Residenciales en México: La Importancia Sel Sector Servicios; CONUEE: Mexico City, Mexico, 2019. [Google Scholar]
  4. Wang, Q.-C.; Xie, K.-X.; Liu, X.; Shen, G.Q.P.; Wei, H.-H.; Liu, T.-Y. Psychological Drivers of Hotel Guests’ Energy-Saving Behaviours—Empirical Research Based on the Extended Theory of Planned Behaviour. Buildings 2021, 11, 401. [Google Scholar] [CrossRef]
  5. Secretaría de Medio Ambiente y Recursos Naturales. Guía de Eficiencia Energética En El Diseño, Construcción y Operación de Hoteles En Climas Cálidos; Secretaría de Medio Ambiente y Recursos Naturales: Mexico City, Mexico, 2020; 53p. [Google Scholar]
  6. Bianco, V.; Righi, D.; Scarpa, F.; Tagliafico, L.A. Modeling Energy Consumption and Efficiency Measures in the Italian Hotel Sector. Energy Build. 2017, 149, 329–338. [Google Scholar] [CrossRef]
  7. Salehi, M.; Filimonau, V.; Asadzadeh, M.; Ghaderi, E. Strategies to Improve Energy and Carbon Efficiency of Luxury Hotels in Iran. Sustain. Prod. Consum. 2021, 26, 1–15. [Google Scholar] [CrossRef]
  8. Salem, R.; Bahadori-Jahromi, A.; Mylona, A.; Godfrey, P.; Cook, D. Energy Performance and Cost Analysis for the NZEB Retrofit of a Typical UK Hotel. J. Build. Eng. 2020, 31, 101403. [Google Scholar] [CrossRef]
  9. Prasad, K.; Singh, A. Towards Low Carbon Hotels in the Pacific Region: A Study of Energy Consumption and Efficiency in Hotels Using Models Based on Energy Performance Indicators. In Climate Change in the Asia-Pacific Region; Leal Filho, W., Ed.; Springer International Publishing: Cham, Switzerland, 2015; pp. 357–374. ISBN 978-3-319-14938-7. [Google Scholar]
  10. Idahosa, L.O.; Marwa, N.N.; Akotey, J.O. Energy (Electricity) Consumption in South African Hotels: A Panel Data Analysis. Energy Build. 2017, 156, 207–217. [Google Scholar] [CrossRef]
  11. Sheng, Y.; Miao, Z.; Zhang, J.; Lin, X.; Ma, H. Energy Consumption Model and Energy Benchmarks of Five-Star Hotels in China. Energy Build. 2018, 165, 286–292. [Google Scholar] [CrossRef]
  12. López-Bernabé, E.; Foudi, S.; Linares, P.; Galarraga, I. Factors Affecting Energy-Efficiency Investment in the Hotel Industry: Survey Results from Spain. Energy Effic. 2021, 14, 41. [Google Scholar] [CrossRef] [PubMed]
  13. Michopoulos, A.; Ziogou, I.; Kerimis, M.; Zachariadis, T. A Study on Hot-Water Production of Hotels in Cyprus: Energy and Environmental Considerations. Energy Build. 2017, 150, 1–12. [Google Scholar] [CrossRef]
  14. Dibene-Arriola, L.M.; Carrillo-González, F.M.; Quijas, S.; Rodríguez-Uribe, M.C. Energy Efficiency Indicators for Hotel Buildings. Sustainability 2021, 13, 1754. [Google Scholar] [CrossRef]
  15. Lai, J.H.K. Energy Use and Maintenance Costs of Upmarket Hotels. Int. J. Hosp. Manag. 2016, 56, 33–43. [Google Scholar] [CrossRef]
  16. Goldstein, D.B.; Eley, C. A Classification of Building Energy Performance Indices. Energy Effic. 2014, 7, 353–375. [Google Scholar] [CrossRef] [Green Version]
  17. Da Silva Jota, P.R.; de Souza, A.P.A.; da Silva, V.R.B. Energy Performance Indexes: Analysis in Public Schools in Brazil. Energy Effic. 2017, 10, 1433–1451. [Google Scholar] [CrossRef]
  18. Ascione, F.; Bianco, N.; De Stasio, C.; Mauro, G.M.; Vanoli, G.P. Artificial Neural Networks to Predict Energy Performance and Retrofit Scenarios for Any Member of a Building Category: A Novel Approach. Energy 2017, 118, 999–1017. [Google Scholar] [CrossRef]
  19. Zeng, A.; Ho, H.; Yu, Y. Prediction of Building Electricity Usage Using Gaussian Process Regression. J. Build. Eng. 2020, 28, 101054. [Google Scholar] [CrossRef]
  20. SECTUR. Sistema de Clasificación Hotelera Mexicano: Análisis de Mejores Prácticas y Generación de Una Metodología Para La Clasificación Hotelera En México; SECTUR: Mexico City, Mexico, 2016. [Google Scholar]
  21. SEGOB. Norma Oficial Mexicana NOM-003-ENER-2021, Eficiencia Térmica de Calentadores de Agua Para Uso Doméstico; SEGOB: Mexico City, Mexico, 2021. [Google Scholar]
  22. SEGOB. Norma Oficial Mexicana NOM-011-ENER-2006, Eficiencia Energética En Acondicionadores de Aire Tipo Central, Paquete o Dividido. Límites, Métodos de Prueba y Etiquetado; SEGOB: Mexico City, Mexico, 2006. [Google Scholar]
  23. SEGOB. Norma Oficial Mexicana NOM-007-ENER-2014, Eficiencia Energética Para Sistemas de Alumbrado En Edificios No Residenciales; SEGOB: Mexico City, Mexico, 2014. [Google Scholar]
  24. Secretaría de Medio Ambiente y Recursos Naturales. Norma Mexicana NMX-AA-171-SCFI-2014. Requisitos y Especificaciones de Desempeño Ambiental; Secretaría de Medio Ambiente y Recursos Naturales: Mexico City, Mexico, 2014. [Google Scholar]
  25. INECC. Acuerdo Que Establece Las Particularidades Técnicas y Las Fórmulas Para La Aplicación de Metodologías Para El Cálculo de Emisiones; INECC: Mexico City, Mexico, 2015. [Google Scholar]
  26. SEMARNAT. Factor de Emisión Del Sistema Eléctrico Nacional 2020; SEMARNAT: Mexico City, Mexico, 2020. [Google Scholar]
  27. CFE Negocios: Esquema Tarifario Vigente. Available online: https://app.cfe.mx/Aplicaciones/CCFE/Tarifas/TarifasCRENegocio/Negocio.aspx (accessed on 1 June 2022).
  28. May Tzuc, O.; Chan-González, J.J.; Castañeda-Robles, I.E.; Lezama-Zárraga, F.; Moheno-Barrueta, M.; Jiménez Torres, M.; Best, R. Multivariate Inverse Artificial Neural Network to Analyze and Improve the Mass Transfer of Ammonia in a Plate Heat Exchanger-Type Absorber with NH3/H2O for Solar Cooling Applications. Energy Explor. Exploit. 2022; preprint. [Google Scholar] [CrossRef]
  29. Tariq, R.; Torres-Aguilar, C.E.; Xamán, J.; Zavala-Guillén, I.; Bassam, A.; Ricalde, L.J.; Carvente, O. Digital Twin Models for Optimization and Global Projection of Building-Integrated Solar Chimney. Build. Environ. 2022, 213, 108807. [Google Scholar] [CrossRef]
  30. Wu, X.; Hou, J.; Hui, J.; Tang, Z.; Wang, W. Revealing Microclimate around Buildings with Long-Term Monitoring through the Neural Network Algorithms. Buildings 2022, 12, 395. [Google Scholar] [CrossRef]
  31. Beale, M.H.; Hagan, M.T.; Demuth, H.B. Neural Network ToolboxTM User’s Guide R2017a; The MathWorks, Inc.: Natick, MA, USA, 2017; ISBN 9781597181709. [Google Scholar]
  32. Wayahdi, M.R.; Zarlis, M.; Putra, P.H. Initialization of the Nguyen-Widrow and Kohonen Algorithm on the Backpropagation Method in the Classifying Process of Temperature Data in Medan. J. Phys. Conf. Ser. 2019, 1235, 012031. [Google Scholar] [CrossRef]
  33. Montano, J.J.; Palmer, A. Numeric Sensitivity Analysis Applied to Feedforward Neural Networks. Neural Comput. Appl. 2003, 12, 119–125. [Google Scholar] [CrossRef]
Figure 1. Percentage of hotel occupancy by climatic distribution in the Mexican Republic (Figure developed with data from SECTUR [2]).
Buildings 12 01155 g001
Figure 2. Simplified description of the methodology for the analysis of energy, environmental, and economic indicators aided by artificial intelligence.
Buildings 12 01155 g002
Figure 3. Flow chart of the process for assessing the hotels’ economic, energy, and environmental-performance indicators based on the device-replacement scenarios.
Buildings 12 01155 g003
Figure 4. ANN architecture for the digital-twin development that simultaneously estimates the three indicators based on the 11 parameters of interest in hotels.
Buildings 12 01155 g004
Figure 5. Statistical analysis for the diverse ANN architectures evaluated: (a) RMSE performance, (b) MAPE performance, (c) R2 performance.
Buildings 12 01155 g005
Figure 6. Sensitivity analysis applied to the best ANN model architecture: (a) sensitivity results for the EUI; (b) sensitivity results for the CEI; (c) sensitivity results for S.
Buildings 12 01155 g006
Figure 7. Effects of percentages of technological substitution of indoor lighting, outdoor lighting, and air conditioning on the indicators of interest: (a) energy-use index; (b) equivalent CO2 emissions; (c) energy-cost index.
Buildings 12 01155 g007
Table 1. Hospitality structure and topology for Mexico (table developed with data from SECTUR [20] (December 2020)).
CategoryHotelsRoomsRooms per HotelOccupancy
5 Stars1579210,01613325.50%
4 Stars2628174,7466622.38%
3 Stars4397150,5453419.75%
2 Stars309378,3252517.17%
1 Star288557,4802015.20%
Others9117165,18818Undefined
Total23,699836,30035100.00%
Table 2. Information collected during energy audits of hotels in the Mexican southeast.
HotelCategory
(Stars)
RoomsTotal Energy
Consumption (kWh/Year)
Energy
Cost (MXN/Year)
Equivalent CO2 Emissions
(kgCO2/Year)
Devices
Indoor LightingOutdoor LightingAir Conditioning
CA1495994,8471,791,256.48470,682.2381552103
CA2282800,0701,341,219.072352,426.714981082
CA34871,033,1781,942,375.354510,695.62136653105
CA44781,562,0032,457,035.168645,625.20113227146
CA5340401,482741,535.168194,850.203171345
CH1440788,2571,229,670.4323,115.522452177
CH2446645,868691,579.808181,723.634099053
YU1348395,8371,053,893.408276,927.31971245
QR1395767,730723,968.5608190,234.261021347
Table 3. Technical characteristics of current and replacement technologies.
Current DevicesReplacement Devices
LightingLumensPowerPrice (MXN)TechnologyPowerPrice (MXN)
Fluorescent332550 W72.80LED20 W153.00
Incandescent100060 W75.00LED20 W113.75
Outdoor Fluorescent80020 W36.00LED9 W35.58
Halogen9000300 W700.00LED100 W250.00
Air conditioningCapacityPowerPrice (MXN)TechnologyPowerPrice (MXN)
Minisplit12,000 BTU1650 W5599.00Inverter125013,599.00
BoilerEfficiencyCapacityPrice (MXN)EfficiencyCapacityPrice (MXN)
80%300,000 BTU/HR 95%400,000 BTU/HR346,679.32
Table 4. Costs, and energy and environmental properties of energy sources used in hotels.
Mexican StateEnergy SourceCalorific Value
(kWh/Liter)
Emission Factor
(kg CO2/kWh)
Fuel Price
(MXN/kWh)
Ref.
CampecheLP Gas6.7320.2271.44
Yucatán1.33[25]
Quintana Roo1.50
Chiapas1.61
NationalElectricity0.5820.5821.88[26]
Table 5. Nomenclature and values of input and output variables.
Variable MinimumMaximumUnits
Inputs:
LocationL14-
CategoryC24-
Hotel zoneZ12-
RoomsN4095Number of rooms
Indoor lightingTint971366Number of devices
Outdoor lightingText2553Number of devices
Air conditioningTac45146Number of devices
Indoor-luminary substitutionPint2080%
Outdoor-luminary substitutionPext2080%
Air-conditioning substitutionPac2080%
BoilerCs01-
Outputs:
Use-of-energy indexEUI6748.4319,988.24(kWh/room-year)
CO2-emission indexCEI45.612279.63(kgCO2/room-year)
Energy-cost indexS1097.92336,615.86(MXN/year)
Table 6. Hyperparameters assigned to the ANN during the training phase for the development of the predictive model.
HyperparameterDescription
Number of epochs500
Batch sizeFull batch
Performance goal1 × 10−20
Validation faulers10
Performance gradient1 × 10−7
Time out
Initial µ0.001
Maximum µ1 × 10¹⁰
Cross-validation10
Performance functionMse
Weights and bias initializerNguyen-Widrow
Table 7. Analysis of the behavior of indicators according to the percentage of substitution.
HotelEnergy-Use Index
(kWh/Room-Year)
Equivalent-CO2-Emission Index
(kgCO2/Room-Year)
Energy-Cost Index
(MXN/Year)
ActualProcurable(%)ActualProcurable(%)ActualProcurable(%)
CA110,472.07920012.155055425515.831,851,810.591,601,810.5913.50
CA28700.17730016.094537.77378816.53787,346.81627,346.8120.32
CA315,162.4213,50010.966645.60573213.741,388,121.271,188,121.2714.41
CA420,025.6717,80011.119019.56732018.852,824,334.902,524,334.9010.62
CA510,037.04900010.334911.25431112.22751,684.65661,684.6511.97
CH119,706.4217,8009.678839.34723918.101,445,695.701,305,695.709.68
CH212,664.0810,20019.465809.55481017.211,191,204.50831,204.5030.22
YU182,46.5975009.053918.2346811.48728,786.59668,786.598.23
QR116,689.7714,60012.526023.77492418.261,297,928.751,157,928.7510.79
Publisher’s Note: MDPI stays neutral with regard to jurisdictional claims in published maps and institutional affiliations.

