Abstract
The purpose of this study is to utilize timber material to enhance the in-plane shear strength and deformation capacity of a brick wall. The proposed strengthening method is light-weight and easy to assemble and includes a timber frame, plywood panel, M12 threaded rod with chemical epoxy, and the hold-down anchor. To evaluate the effectiveness of the reinforced brick wall, three walls were tested under a cyclic horizontal load and static compression stress: the brick wall (BW wall), the reinforced brick wall with timber (BW-T wall), and the reinforced brick wall with timber and the hold-down anchor (BW-TA wall). The proposed prediction method of the Kamiya and Inayama Murakami models assessed the BW-TA wall. The rocking was caused by the failure of BW and BW-T walls. However, because the BW-T wall failed in the lowest part of the wall, the timber part retained the original shape of the brick wall. When the diagonal on the BW-TA wall failed, the horizontal load at maximum load increased by 22%, and the drift angle calculated from the diagonal measurement increased 4.6 times.
1. Introduction
Post-earthquake investigations and scientific studies have revealed that unreinforced masonry (URM) buildings have a limited ability to withhold seismic loads. Countermeasures are needed to reduce earthquake risk and prevent earthquake hazards. Therefore, it is necessary to evaluate and carry out strengthening of the unreinforced masonry buildings. The horizontal load can create shear force and bending moments in the masonry walls in plane. Sliding and diagonal failures occur under shear load, and rocking and compression failures occur under bending moment due to in-plane shear behavior [1,2]. It is possible that the foregoing failures, either singly or in combination, will occur in an unreinforced masonry building that has not been designed to withstand seismic action [3]. Some researchers have been carrying out various methods to strengthen unreinforced masonry buildings. The fundamental concept of strengthening/retrofitting approaches is to (i) reduce the influence of external loads, (ii) enhance the load-carrying capability of individual elements, and (iii) improve the masonry structure’s integrity [4].
Carbon fiber-reinforced polymer sheets and polyethylene terephthalate fiber-reinforced polymer sheets are used to strengthen the URM wall [1]. Both fiber-reinforced polymer sheets and the ductility of a cross-diagonal polyethylene terephthalate fiber-reinforced polymer sheet can improve the in-plane shear strength of brick walls [1]. An experimental study [5] was conducted to assess the URM shear panel with near-surface-mounted (NSM) carbon fiber-reinforced polymer (CFRP) strips, and the results showed an increase in ultimate load (9%), displacement capacity (up to 133%), ductility, and energy dissipation (up to 382%). The seismic performance of masonry building models was improved using a cost-effective material, including polypropylene (PP) band and steel wire mesh (WM) [6]. The experimental results [6] show that the masonry building model’s strength, global stiffness, and damage tolerance improved, and the cost was increased by 2.8% for the PP band model and 11.1% for the WM model. The textile-reinforced mortar was employed to strengthen the clay brick masonry walls [7], and the results indicated an increase in tensile-bond strength (81%) and initial shear strength (78%) as well as shear capacity of 1.5 times the single-sided and 2.6 times the double-sided strengthening. The above studies investigated strengthening methods that made use of lightweight and low-cost materials. The results have shown that the above materials can increase the shear strength and deformation capacity of the unreinforced masonry wall.
In recent years, researchers have conducted experimental studies on the use of lumber to strengthen masonry structures. For masonry construction refurbishment [8], the existing masonry building was covered by cross-laminated timber (CLT). The application of the facadism method indicated the need to intervene in masonry construction and safeguard heritage masonry buildings [8]. The CLT panels were used to reinforce the unreinforced masonry wall, and the strap was attached to the URM wall with a chemical-anchored steel rod [9]. Under high vertical load, the strength increases by 40%, and the ductility improves by 100%. Under cyclic response [10], the calcium silicate masonry piers were retrofitted with timber frames (80 mm × 60 mm cross-section) and 18 mm oriented strand timber boards (OSB), and the timber frame was connected by mechanical steel fasteners to the masonry wall, while OSB was nailed to the timber frame. The lateral strength due to its high flexibility could increase by 35% and ultimate displacement by 167% [10]. The retrofitted unreinforced masonry wall panels were tested for diagonal compression using two different methods: (1) timber strong-backs and (2) plywood overlays [11]. Additionally, 8 mm diameter screw-ties were screwed into the masonry wall. Experimental results show that plywood panels can withstand diagonal tension forces better than timber frames [11]. Timber strong-back was used for seismic retrofit to prevent the out-of-plane failure of masonry walls [12], and strong-back is a simple and cost-effective retrofit solution. The mechanical screw-ties were used to connect the timber to the masonry wall, and the experimental result illustrates a significant reduction in displacement and an increased peak ground acceleration of three times greater than the unreinforced masonry wall [12]. On-site testing of masonry shear walls strengthened with timber panels (CLT and LVL-laminated veneer lumber) [13] was carried out on three clay-brick walls under in-plane semi-cyclic quasi-static loading; the connection between timber and masonry was used to screw fasteners; and a steel bracket was fixed to prevent panel uplift. The outcome of the experiment shows that the in-plane shear force of the damaged specimen increased by 20% and 40% for the undamaged masonry wall, with drift levels of both specimens being up to 2% [13]. Under full-scale shake-table tests, an innovative timber retrofit solution was implemented on unreinforced masonry cavity-wall buildings [14]. The timber retrofitting solution improves both the in-plane and out-of-plane capacities of the buildings, and for near-collapse conditions, the peak ground acceleration increased from 0.39 g to 0.78 g [14]. The brick wall retrofitting technique emphasizes oriented strand board (OSB) panels as well as chemical and mechanical connections [15]. The flexural strength of the strengthened wall using chemical anchor was seven times greater than the unreinforced masonry wall, and that employing mechanical anchor was five times higher than the plain wall [15]. The study of timber-based integrated techniques [16] aims to improve the energy efficiency and seismic behavior of existing masonry buildings. The numerical result shows the timber panel decreases thermal transmittance by 78% and the proposed solution improves the stiffness and shear response of the wall [16]. Timber has the advantage of being a lightweight and easy-to-assemble material. The experimental result shows that the wooden material used in the strengthening method may increase strength by around 30%, while improving displacement by more than 100%.
The results of the above studies emphasize the use of timber and other lightweight materials to increase the strength, stiffness, and deformation of an unreinforced masonry wall. The use of lightweight materials has the additional advantage of reducing the weight of the strengthened structure. This study emphasizes the in-plane shear behavior of the strengthening solution for the unreinforced brick masonry wall using the SPF (spruce, pine, and fir) frame and plywood panel. The advantage of our retrofitting technique is compared with other research: cost-effective and lightweight material, easy assembling, and the masonry-to-timber connection has high stiffness. The effective connection which is an M12 bolt with a chemical anchor [17] was selected in this study. The aim of this study is to investigate the reinforced effect on brick walls using timber walls and the experimental study and prediction method to determine the initial stiffness and ultimate load for unreinforced brick walls and reinforced brick walls. The benefit of this study is the usage of local material, light members, and estimation of reinforced masonry using a simple formula.
2. Material Properties, Description and Set-Up of the Wall Specimens
The material properties of the brick masonry specimen were determined using brick, mortar, pre-compression shear, and compressive tests. All tests use the same materials, such as clay brick, Portland cement, and sand. The mechanical properties of the connection between brick and timber were obtained from the previous study. The wooden material properties were taken from the standard of timber structure [17,18]. The wall description describes each wall’s dimension, preparation procedure, and boundary condition. The loading state and position of the displacement measurements comprise the experimental set-up of the wall specimen.
2.1. Brick and Mortar
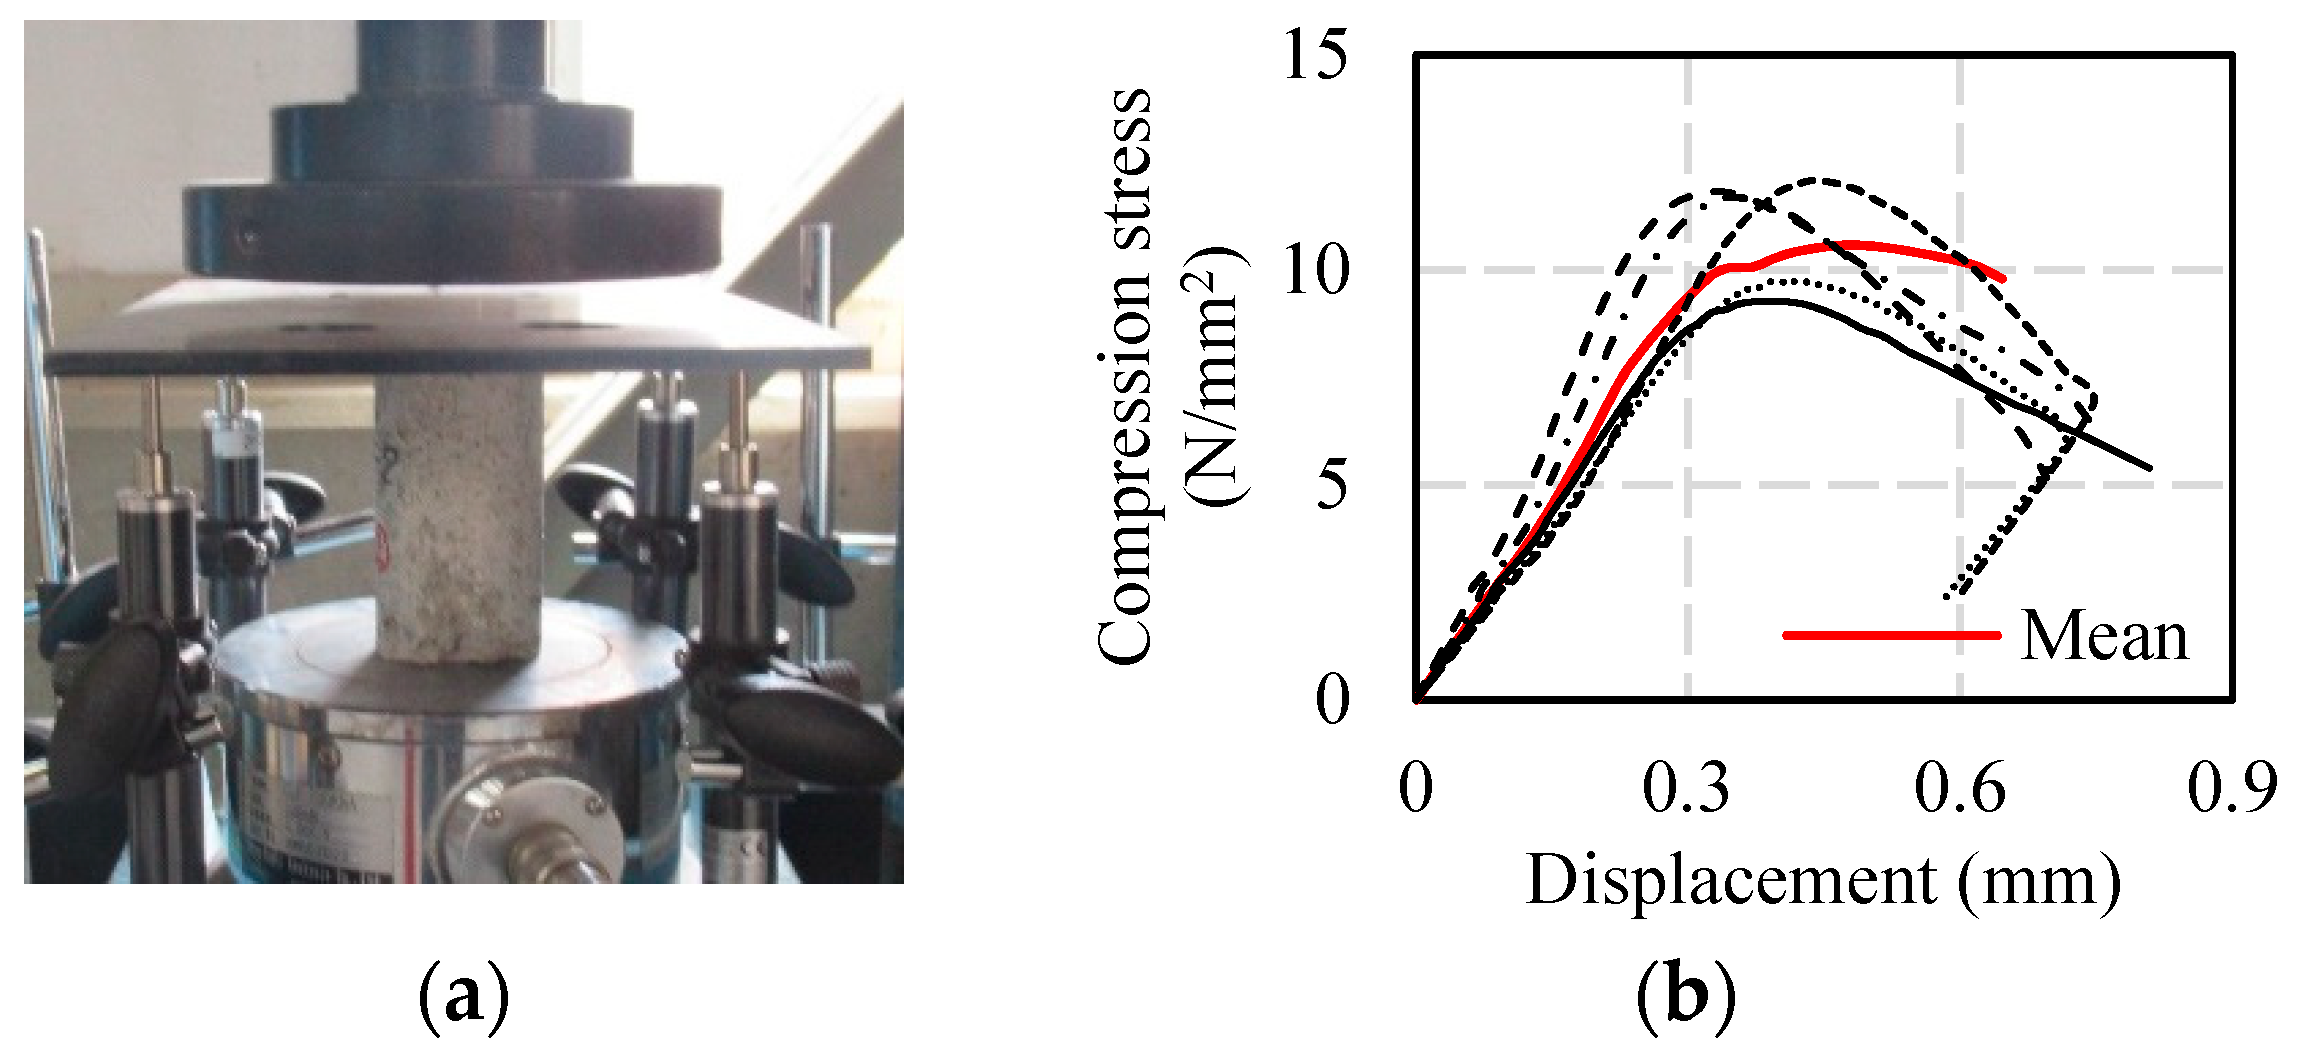
In this study, the dimensions, density, flexural strength, and compressive strength of the clay brick were the same as in the previous study [17]. The nominal brick size is 210 mm × 100 mm × 60 mm. The flexural and compressive strengths are both 3.9 N/mm2 and 31.4 N/mm2. In this study, the strength of the cement mortar is assumed to be less than the strength of brick. The cement-to-sand ratio is 1:6, and the specimen is cylinder shaped. The sizes are 50 mm in diameter and 100 mm in height. Five specimens were taken from the same mortar at the brick wall construction site and cured in conditions comparable to the wall specimens. After six months, the cement mortar was subjected to a uniaxial compressive test on cylinder specimens as shown in Table 1 and the number in the bracket is the coefficient of variation.

Table 1.
Test result of cement mortar.
Figure 1 shows the experimental photo and result of the cylinder cement mortar. The four displacement measurements were used in this experiment shown in Figure 1a. The displacement measurements were placed in the corners of top steel plate on the cylinder specimen.
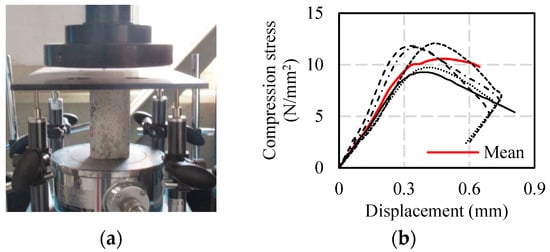
Figure 1.
Experimental result of cylinder cement mortar. (a) Photo of compression test; (b) compression stress and displacement curve.
2.2. Shear Strength of Masonry
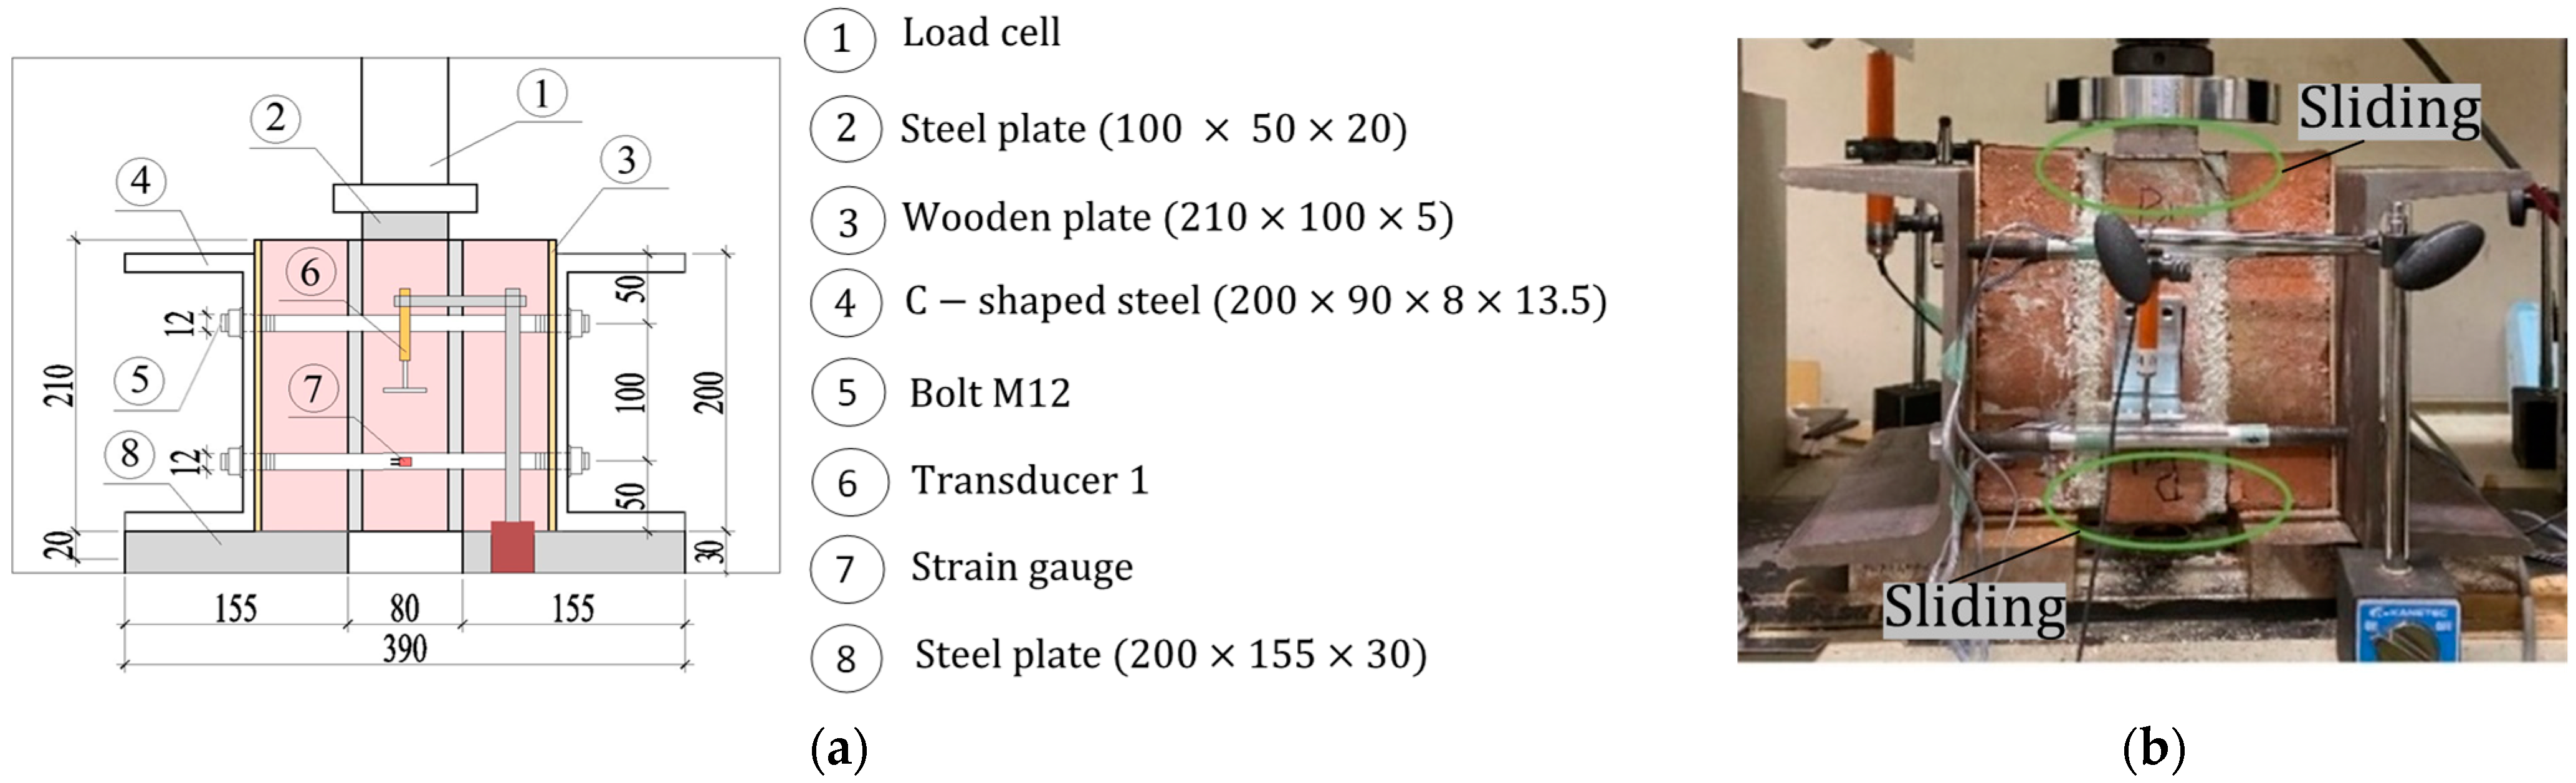
To determine the interaction between brick and mortar, the coefficient of friction and the adhesion strength must be defined. The share experiments were carried out on the universal testing machine (Instron 4204). To establish the shear strength characteristics of specimens, the EN 1052-3 [19] standard was used. The experimental set-up for the pre-compression single shear test is highlighted in Figure 2a. In this study, there were three different pre-compression stresses, such as 0.2 N/mm2, 0.6 N/mm2, and 0.8 N/mm2. There are three specimens in each pre-compression experiment. To determine the shear strength of masonry, nine specimens were tested.

Figure 2.
Pre-compression single shear test. (a) Scheme of set-up; (b) Failure photo of shear test.
According to EN 1052-3 [19], the maximum pre-compression stress is 1 N/mm2. When the pre-compression stress was anticipated to be 1 N/mm2, the universal testing machine’s load cell capacity (50 kN) was insufficient in our case. Therefore, the pre-compression stress was lowered to 0.8 N/mm2. As shown in Figure 2a, the shear specimen is clamped by two C-shaped steels. To generate the pre-compression stress, four M12 bolts (SS400) were tightened on both sides of the shear specimen. The axial strain was measured using strain gauges placed in the middle of the bolt. The data logger could present the strain value when bolts were tightened with the wrench. The tightening procedure was stopped for each pre-compression stress as the desired strain value was indicated on the data logger. The shear specimen was subjected to a uniform vertical load until failure after the pre-compression stress was adjusted. Figure 2b shows a sliding failure between brick and mortar.
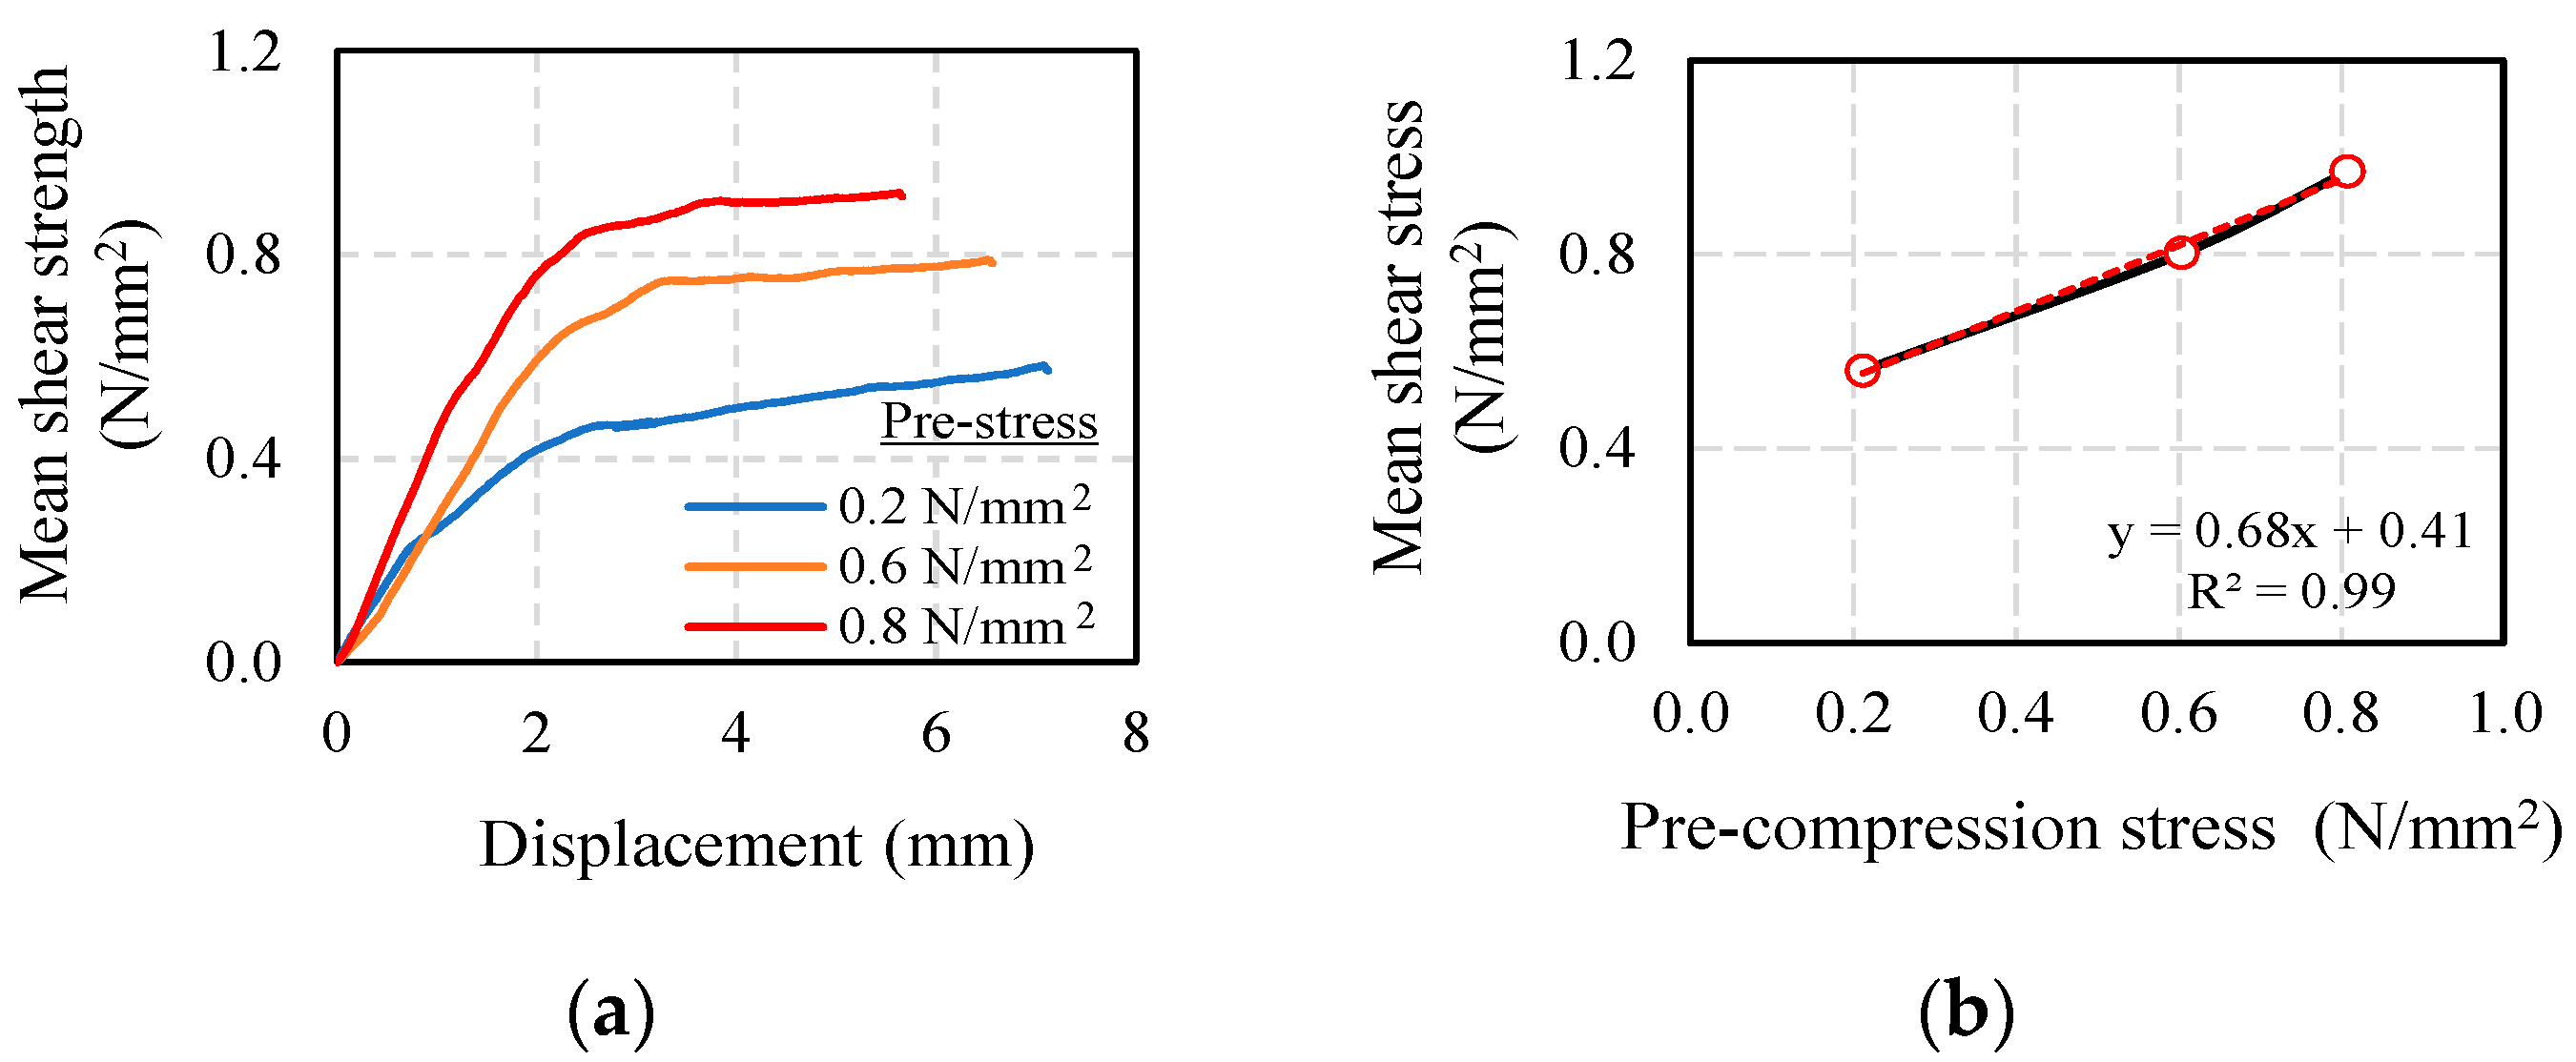
Figure 3a illustrates the shear stress–displacement diagram, and three shear stress–displacement diagrams present non-elastic behavior. As a result of increasing the pre-compression stress in Figure 3a, the shear stress also increases. As can be seen from Figure 3b, the pre-compressive stress and the shear stress are proportional. The mean shear strength in Figure 3b indicates the maximum value in Figure 3a. The frictional coefficient and adhesion strength of the shear specimen were the result of the regression line in Figure 3b. Table 2 shows the material properties of the pre-compression single shear experiment, and the number in brackets is the coefficient of variation. The shear modulus (G) is calculated from ratio between shear strength and shear strain obtained from the single shear test.
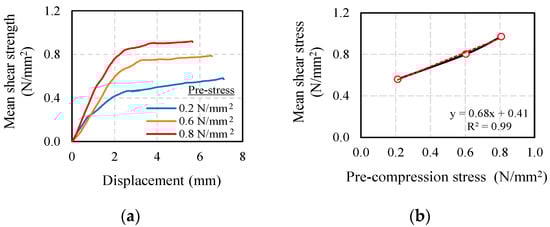
Figure 3.
Result of a pre-compression single shear test. (a) Relation between shear strength and displacement; (b) relation between pre-compression and shear stress.
Table 2.
Result of shear test.
2.3. Compressive Strength of Masonry
The compressive strength of the masonry was determined using masonry specimens in accordance with ASTM C1314-18 [20]. The specimen’s dimensions are 210 mm × 200 mm × 100 mm with a height-to-thickness ratio of 2. Figure 4a,b shows the failure of the uniaxial compressive test of a small masonry specimen. The tensile cracks appeared on the specimen while the compression load was reaching the maximum value. Figure 4c illustrates the compression stress–displacement diagram of the masonry prism in which five specimens were tested under compression load. To quantify the vertical displacement, two inductive displacement sensors were placed under the specimen’s top steel plate. The elastic modulus was calculated at 5 to 30% of the maximum compression load.
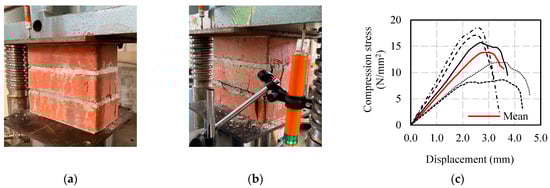
Figure 4.
Brick masonry compression test. (a) Front view of failure; (b) back view of failure (c) compressive stress–displacement diagram of the uniaxial test.
Table 3 shows the material properties of the masonry compression experiment, and the number in brackets indicates the coefficient of variation. The ratio of shear modulus (G) to elastic modulus (E) in Table 3 can be defined using the results of the pre-compression single shear test and the masonry compression test. In comparison to our experimental result, Eurocode 6 [21] shows that the G/E ratio is relatively high at 0.4 compared with our experimental result. The study [2] defined the low G/E ratio by experiment, and the G/E is around 0.1 for 1 N/mm2 at the pre-compression stress.
Table 3.
Result of prism masonry compression test.
2.4. Wooden Material and Connection
To reinforce the unreinforced brick wall, 2-inch × 4-inch SPF (spruce-pine-fir) lumber and a 12 mm plywood panel were employed. Table 4 shows the properties of SPF lumber and plywood panels based on the standard for structural design of timber structures [18] in Table 4.
Table 4.
Allowable strength of SPF lumber and plywood panel.
The parameters of the connection between brick and timber [17] are shown in Table 5. The fastener is an M12 bolt (SS400), which was bonded by chemical epoxy to the brick and SPR lumber.
Table 5.
Mechanical properties of connection between brick and timber.
2.5. Description of the Brick Masonry Walls
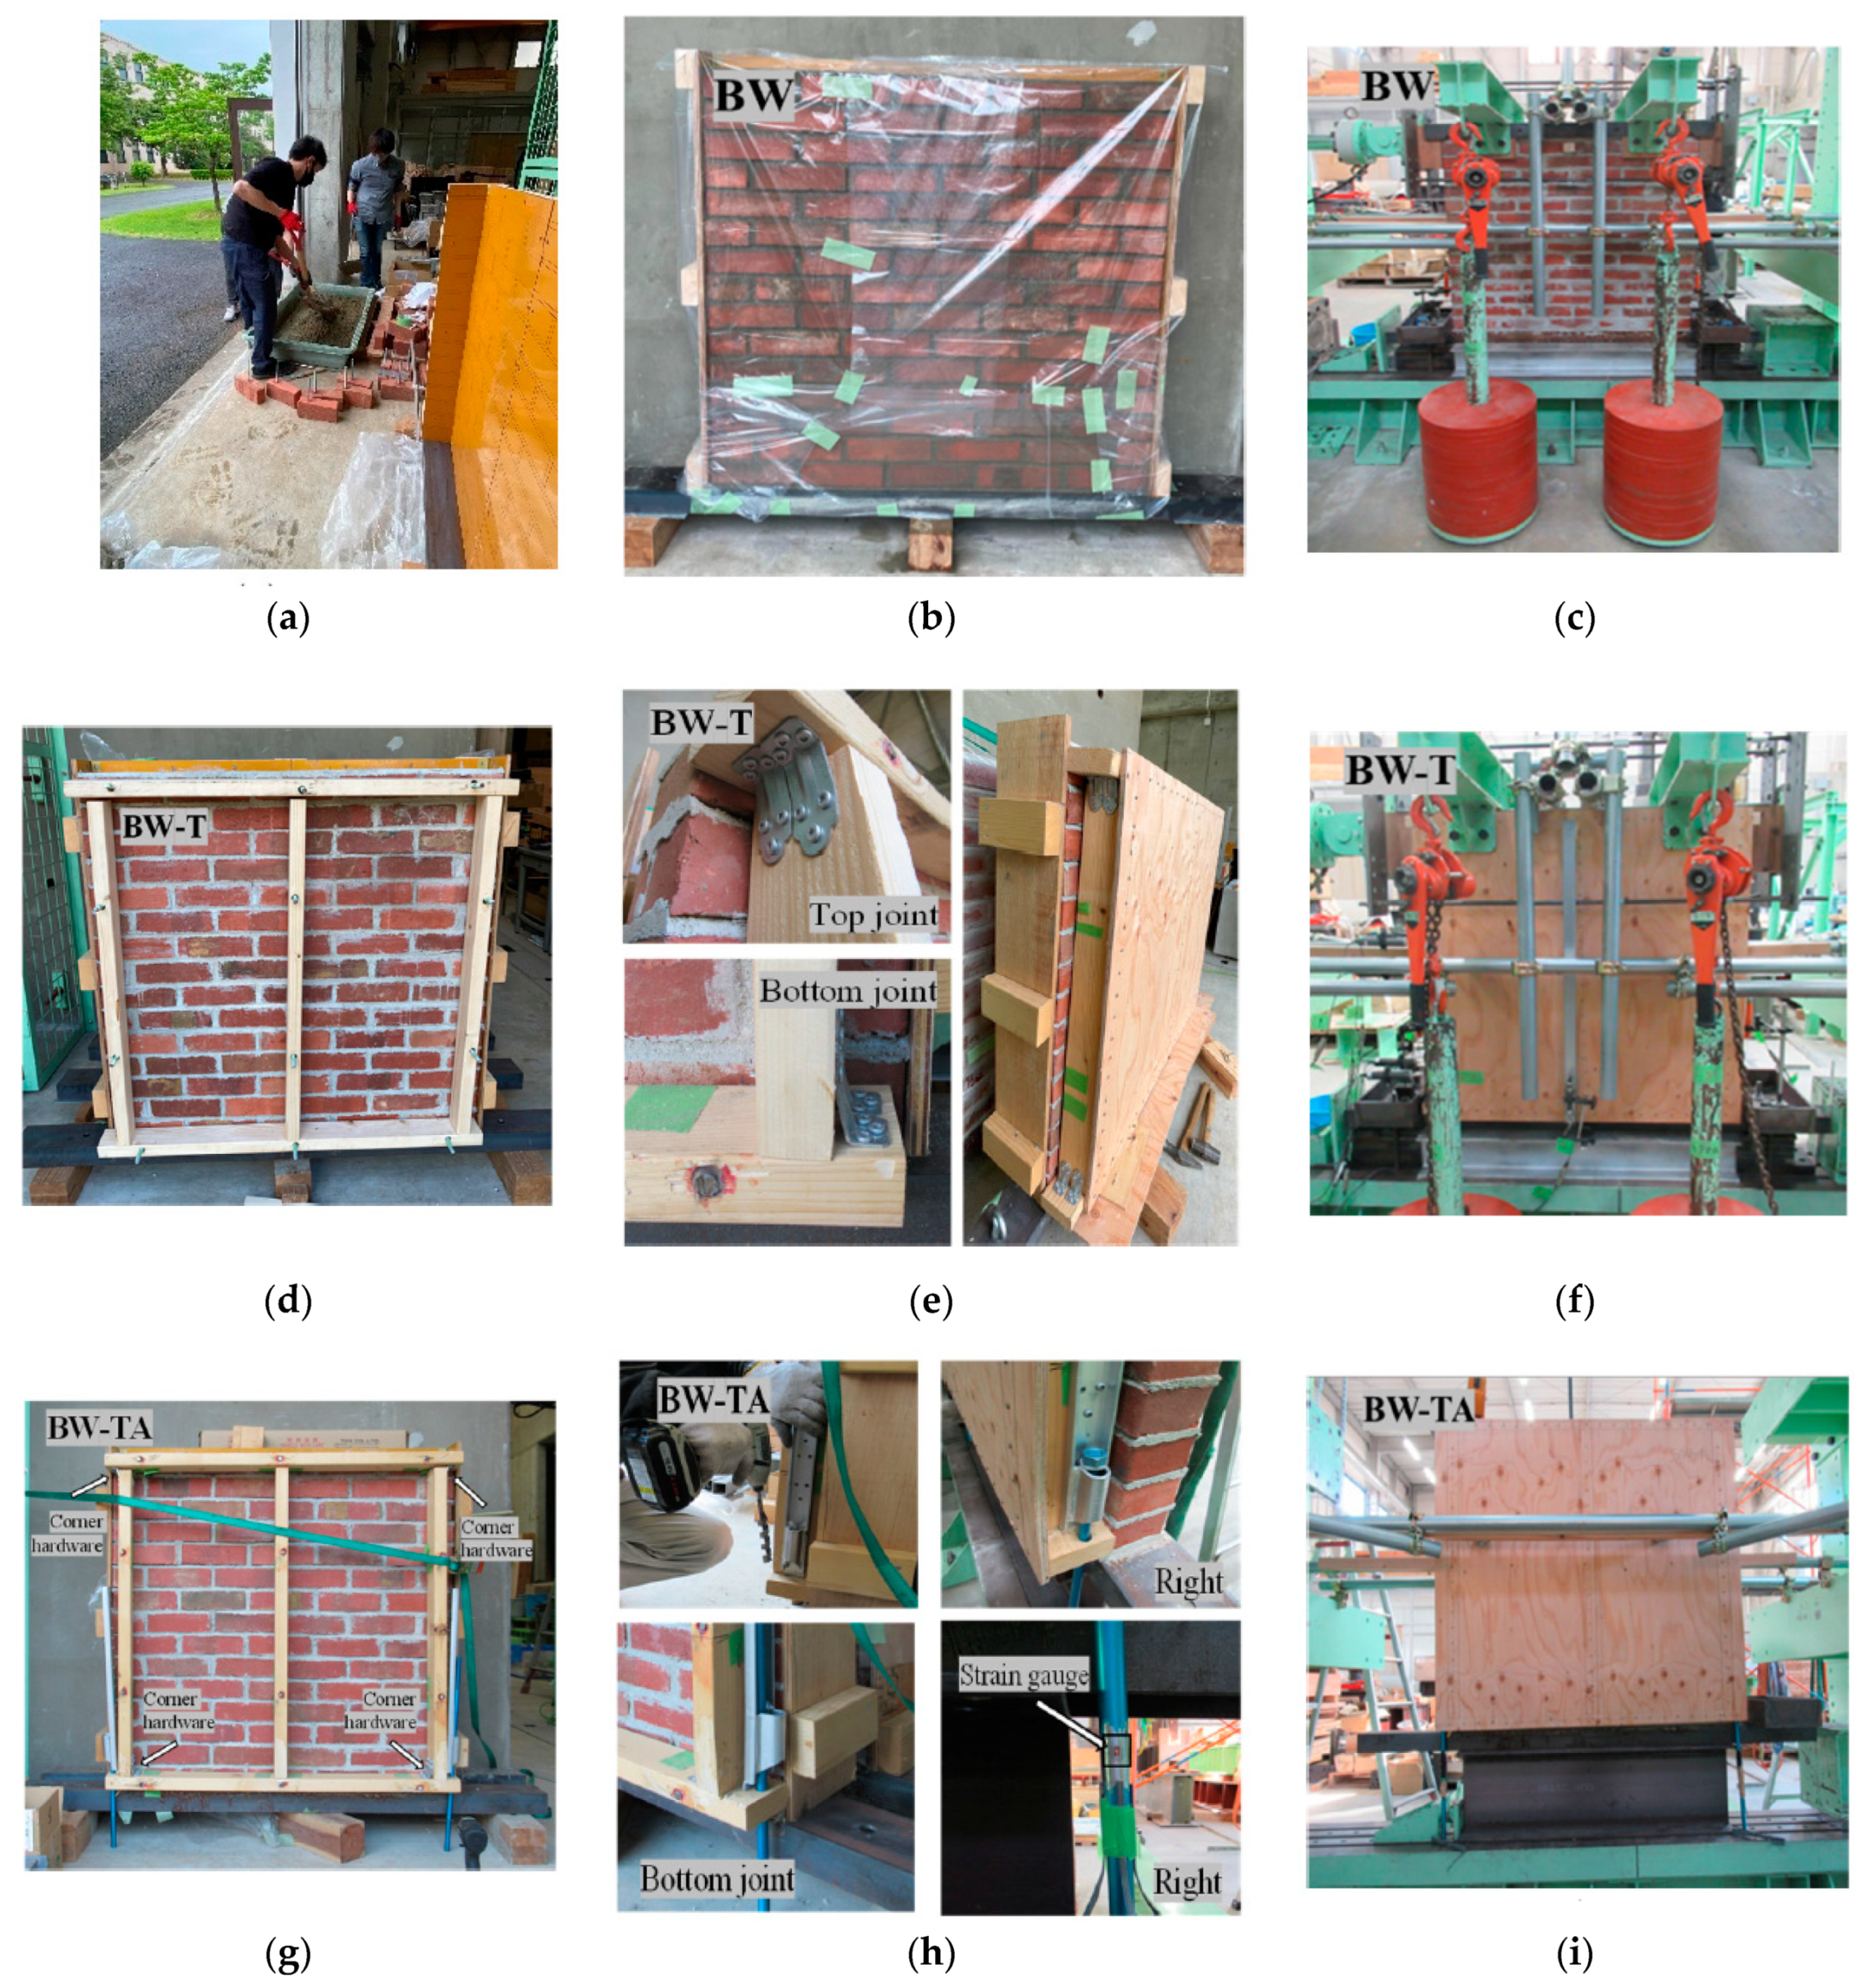
The unreinforced masonry (URM) wall and reinforced masonry (RM) wall with timber frame and plywood panel were constructed and tested at Kinki University’s Engineering Faculty Laboratory in Japan. The brick wall (BW), reinforced brick wall with timber (BW-T), and reinforced brick wall with timber including the hold-down anchor (BW-TA) are the three walls. In Figure 5c,f, the boundary condition of walls is that the upper part of the walls is free, and the bottom part of the walls is clamped by C-shaped steel on both sides. The experimental frame’s foundation is made of C-shaped steel. Table 6 shows the detailed wall dimensions as well as the pre-compressive stress. The dimension of the BW-T and BW-TA wall includes the timber frame and plywood panel in Table 6.
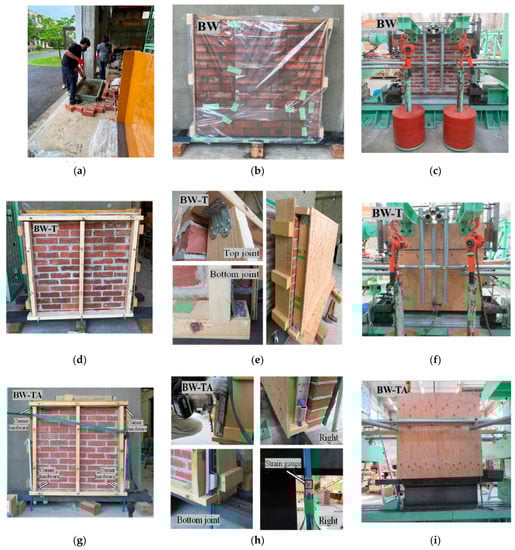
Figure 5.
Photos of wall preparation. (a) Assembly site and mortar preparation; (b) BW wall with polyethylene plastic sheet; (c) BW wall on experimental base; (d) brick wall with timber frame (BW-T); (e) The joint of timber frame; (f) brick wall with timber frame and plywood panel (BW-T); (g) brick wall with timber frame (BW-TA); (h) bottom joint of BW-TA wall; (i) BW-TA wall on experimental base.
Table 6.
The description of the wall.
Figure 5a shows a wooden formwork that was created and installed on the base beam (C-shaped steel) before building the brick wall. The cement mortar had a sand–cement ratio of 1:6, and the head and bed joint mortar thickness was 10 mm. On the brick wall, a total of 15 brick layers were laid. The experimental walls were single-leaf brick walls that were built in June 2021, and the BW wall in Figure 5c was tested in early December 2021. The walls were built in a separate area from the experimental frame and crane-lifted onto the experimental frame. The brick wall was built using the running bond technique. After the wall was completed, the walls were covered with a polyethylene plastic sheet as shown in Figure 5b and stored at the Kinki University laboratory until the experimental day.
Figure 5d–f illustrate the BW-T wall construction procedures. The BW-T construction and storage conditions were the same as the BW wall. To reinforce a brick wall with wooden materials, there were several installation steps. In the first step, the brick was pre-drilled with a hole depth of 50 mm. The hole diameter was 2 mm greater than the M12 bolt diameter. The chemical adhesive (HIT-RE 500 V3, Hilti Inc., TX, USA) was then poured slowly into two-thirds of the hole, followed by the bolt. After installing the bolts to the desired depth, the prepared specimens should be cured at room temperature for 24 h. A total of 12 anchors were placed, with 4 in the vertical and 3 in the horizontal directions, respectively. During the brick wall construction, the prepared bricks were placed in marked positions. In the second step, after 28 days, SPF lumber (2 × 4) was installed on the brick wall. The chemical adhesive was used to bond the brick to the bolt and lumber to the bolt. SPF lumber was placed on the brick wall and then a chemical adhesive was injected into a gap between the bolts and the hole of lumber. As shown in Figure 5d, the length of a bolt (200 mm) is longer than the width (89 mm) of SPF lumber. Therefore, the excess length of the threaded rod was cut after the chemical adhesive had cured as shown in Figure 5e. In Figure 5e, the corners of the timber frame were secured with two corner hardware (DH tight corner guardian №1460) using six flat head screws (ø5.6 mm × 45 mm). As shown in Figure 5e, the corner hardware was connected outside the frame intersection for the BW-T wall. The final installation step is to connect the plywood panel to the SPF lumber. The plywood was pre-cut to the desired dimension. The plywood panel was nailed to the SPF lumber using CN 65 nails. The nail pitch was 50 mm, and the nails were connected to all lumber in horizontal and vertical directions. When the nails were struck, the brick-to-mortar adhesion strength may be reduced. Figure 5e shows a photo connecting the lumber and plywood panels to the brick masonry wall. In Figure 5f, a crane was used to carry the reinforced masonry wall to the test frame.
The assembling steps for the BW-TA wall in Figure 5g–i are the same as for the BW-T wall. As indicated in Figure 5g, the corner hardware was placed outside the top joint and inside the bottom joint. To avoid the rocking failure shown in Figure 5g–i, two hold-down bolts were installed on both sides of the timber frame. The bolted hold-down has a capacity of 50 kN, and the hold-down is attached to the SPF lumber with 18 screws in Figure 5h. The bolt diameter is 14.54 mm, and the bottom part of the bolt is connected to the experimental frame’s base in Figure 5i, and the top part of the bolt is connected to the hold-down by tightening the washer in Figure 5h. To measure the axial load on the bolt during the cyclic load, four strain gauges were attached to each bolt in Figure 5h. Following the placement of the strain gauges, the coating material was used to protect the strain gauges from the surface from moisture or waterproofing, and vinyl mastic (VM) tape was covered with the coating material.
2.6. Experimental Set-Up of the Brick Wall
Figure 6 shows a schematic set-up of the BW and BW-T walls as well as the set-up photo of the BW-TA wall. The top of the masonry wall was subjected to a static vertical load and the top corner of the wall specimen was subjected to a cyclic horizontal load. The wall was subjected to a pre-compression stress of 0.2 N/mm2. Two steel beams were placed on the top side of the wall specimen to apply the pre-compression stress, and one steel beam has two steel suspended 5 kN loads (Figure 6). Following the crane transfer of the prepared masonry wall which was moved to the test frame, additional horizontal supports were installed on the front and back side of the wall as shown in Figure 6e,f. In addition, the horizontal supports were double attached to the test frame. Figure 6g shows a rubber wheel being placed between the wall specimen and the additional support. When a horizontal load is applied to a brick wall, the rubber wheel rotates freely. It is assumed that the additional supports do not affect the result of the brick wall under the horizontal cyclic load. A C-shaped steel beam was placed at the top and bottom parts of the BW wall, and the steel plate was on the top part of the BW-T and BW-TA walls. The metal base of the test frame was bolted to the concrete floor of the laboratory. The oil jack and load cell have a capacity of 300 kN and were placed on the upper edge of the wall in the horizontal direction. The steel plates were placed on both sides of the upper edge of the wall in a vertical direction, and both steel plates were connected by long bolts to each other as shown in Figure 6a.
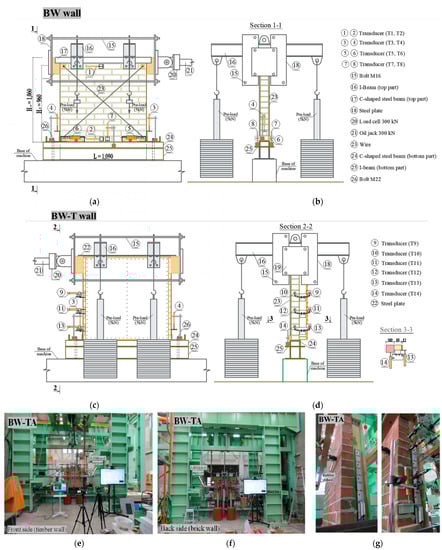
Figure 6.
Test set-up for wall specimens. (a) Schematic view of the back side (BW wall); (b) Elevation view (BW wall); (c) Schematic view of front side (BW-T wall); (d) Schematic view of elevation (BW-T wall); (e) Front side photo of BW-TA wall; (f) Back side photo of BW-TA wall; (g) Elevation photo of BW-TA wall.
During the experiment, transducers were placed to measure the displacements of the BW, BW-T, and BW-TA walls, as shown in Figure 6a. The transducers were placed on the brick side of the wall specimen to measure the horizontal, vertical, and diagonal displacements. Transducers (capacity 50 mm, Tokyo Measuring Instruments Lab) were placed in the middle of the upper (index T1) and lower (index T2) parts of the wall specimen as shown in Figure 6a. For the vertical displacement of the wall, two transducers (index T3 and T4) were placed on both sides of the lower edge of the wall. To measure the displacement in the diagonal direction, transducers (indexes T5 and T6) were placed at the lower two corners of the wall. The nail was attached to the two small squares of wood that were glued to the top edges of the wall. A thin wire rope (index 23 in Figure 6a) was attached to a nail in the wooden piece and connected to the transducer (T5 or T6) in the diagonal direction.
An attempt was made for the reinforced walls to measure the relative displacement between the brick wall and the timber part. The transducers (index T9 to T14) were placed at the same level on the brick wall and wooden frame in Figure 6d,g to measure the relative horizontal displacement. The three transducers were placed at the top, middle, and bottom positions in the vertical direction on the brick and timber sides of the BW-T and BW-TA walls. While pre-compression stress was applied to the wall, the transducers (indices T7 and T8 in Figure 6b) were placed in the middle of the lower part of the wall and then removed after the pre-compression stress was applied to the test wall.
Under cyclic loading, the brick walls were tested using the displacement method of control. Under the lateral cyclic load, a load control and the corresponding displacement in positive and negative loadings were measured. The first and second cycles each had three runs. Table 7 shows the cyclic numbers, rotational angle, and horizontal maximum displacement. The displacement protocol was arbitrarily defined by the authors. Until the ninth cycle, all walls were tested. The horizontal load cell’s capacity is necessary for the test. It is assumed that the experiment will be terminated if the load cell reaches its limitation.
Table 7.
Rotational angle and maximum displacement.
3. Experimental Results
The elastic modulus of the wall was determined during the pre-load process installation, as shown in Table 8. In Table 1, the wall elastic modulus presents the approximate value for the elastic modulus of the cement mortar specimen. According to the study [13], the mortar stiffness was reason for the small modulus of elasticity. It is assumed that the height to thickness ratio is different between prism and wall specimen. That is why it is considered that the elastic modulus shows different values in Table 3 and Table 8. The hysteretic curve, the envelope curve, failure modes, the load at first crack and the corresponding displacement, and the maximum load and the corresponding displacement were used to evaluate the experimental findings of the walls under a horizontal cycle load. Figure 7 shows the relationship between steps and experimental wall top displacement.
Table 8.
Elastic modulus obtained from pre-compression stress.
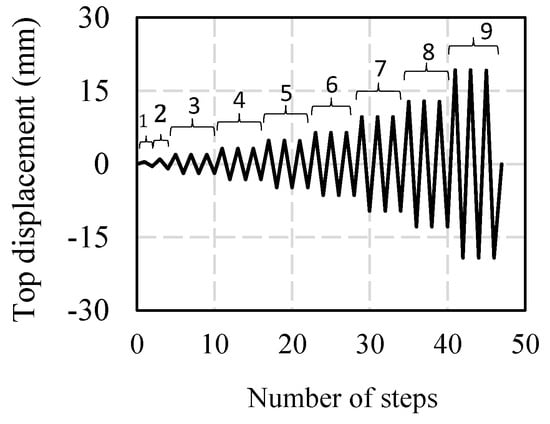
Figure 7.
Steps and the top displacement relation.
3.1. Hysteretic Response and Failure
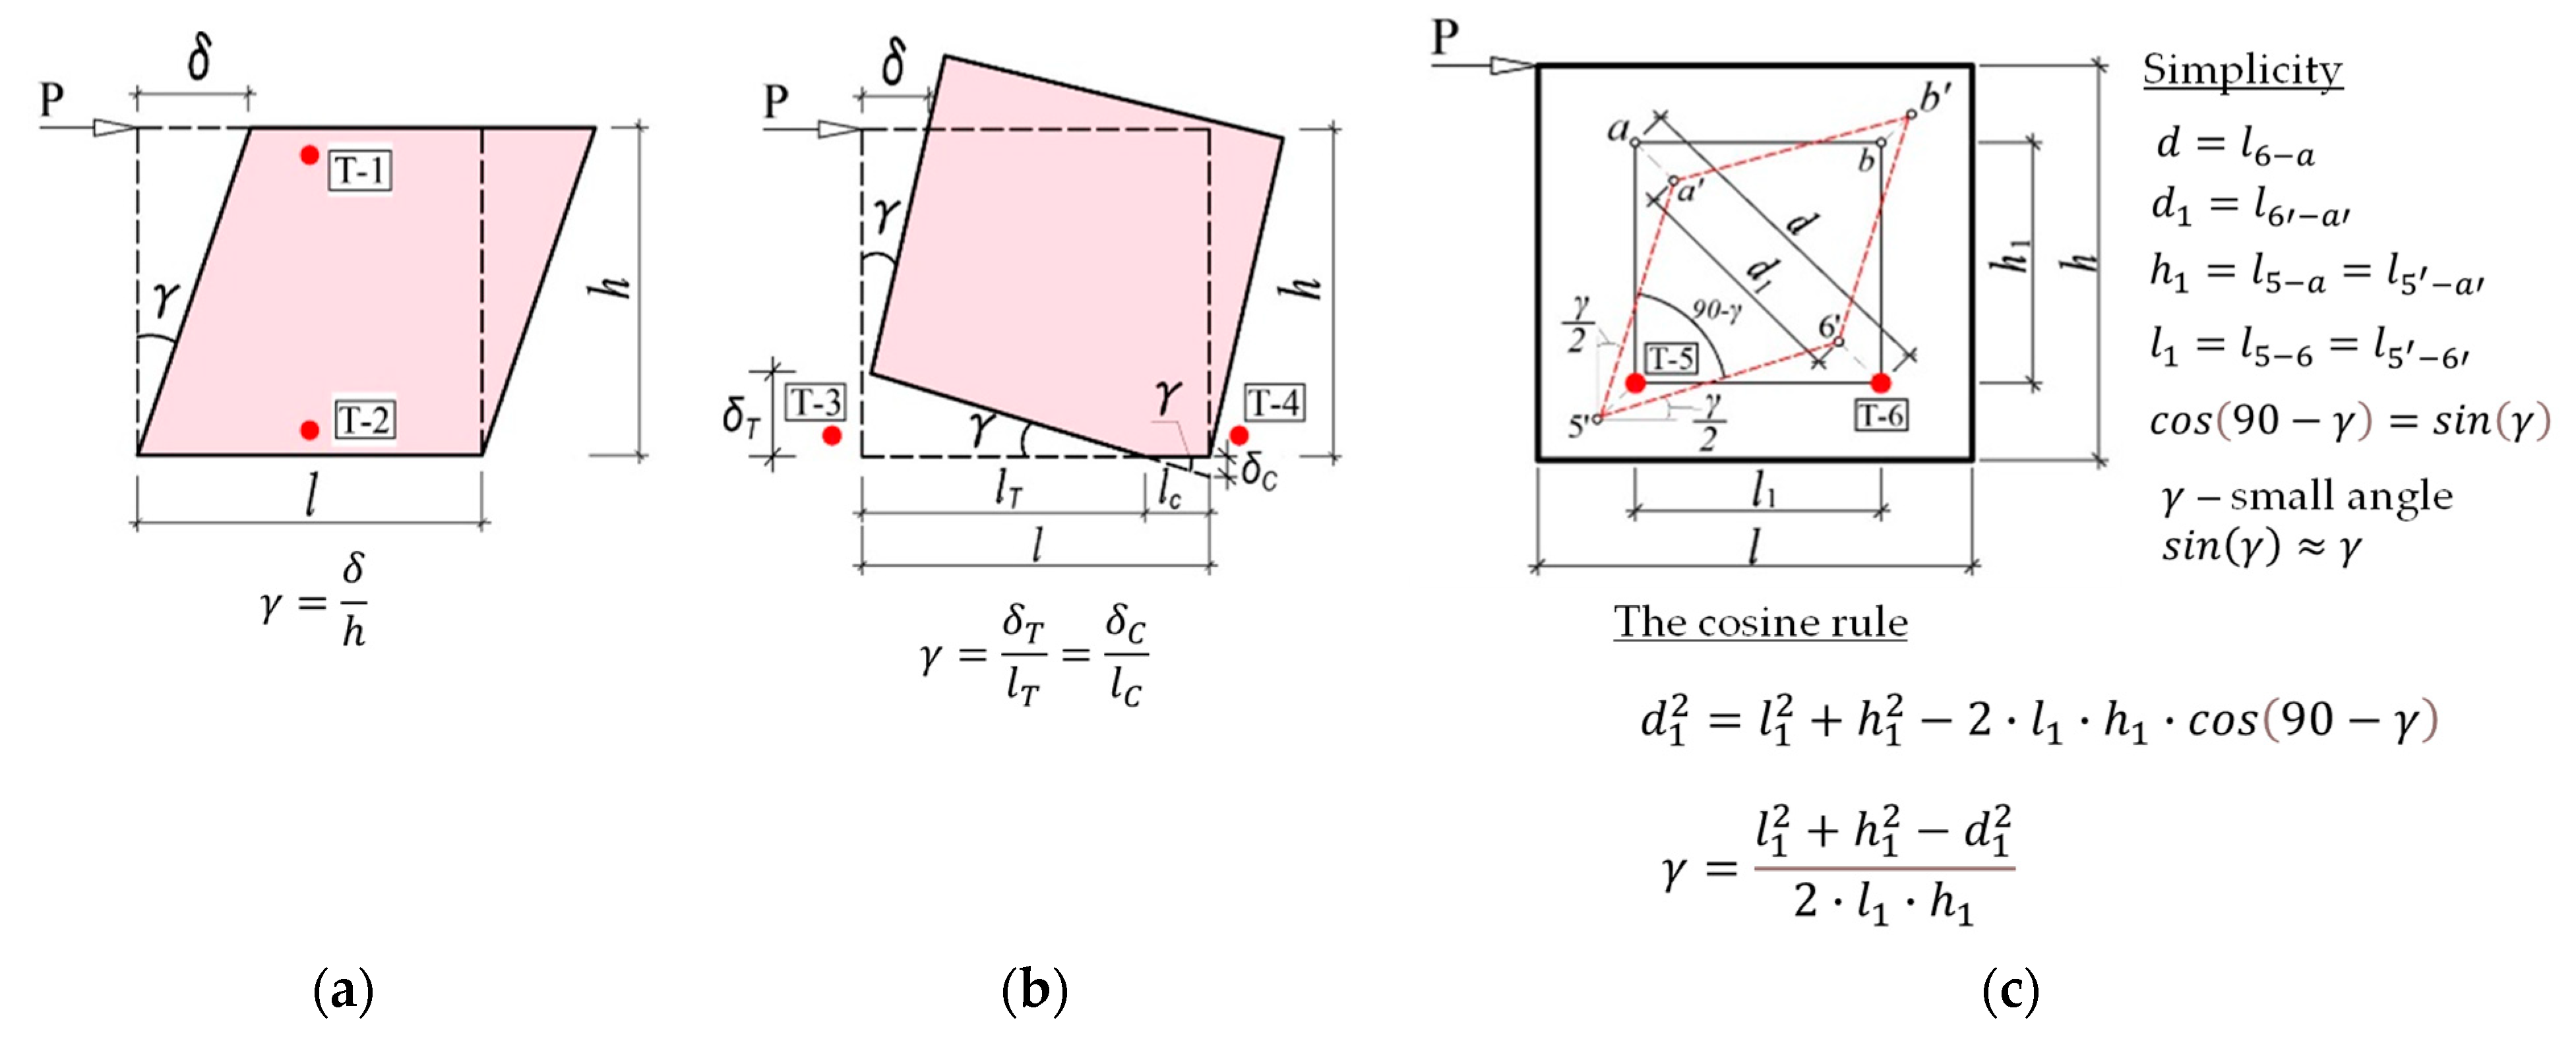
Deformation measurements were taken in the horizontal, vertical, and diagonal directions. As shown in Figure 6a, the horizontal relative displacement is defined as the difference between transducers T1 and T2. The drift angle in Figure 8a shows the horizontal relative displacement divided by the wall height, indicated as a radian. In the case of wall height, transducer T1 was placed 960 mm from the bottom bricks to record horizontal displacement. The tensile and compression displacement can be recorded in the vertical direction during cyclic horizontal loading. The drift in Figure 8b is assumed that the tensile displacement is divided by the tensile length of the wall. When the rotation deformation occurs in the wall, it is assumed that the vertical rotational angle is equal to the horizontal rotational angle. The diagonal tension deformation is used to calculate the drift in Figure 8c. To determine the drift in that case, several simplifications were assumed. Transducers T5 and T6 are placed in the lower two corners of the wall to measure displacement in a diagonal direction as shown in Figure 6a. The tensile displacement measured by the T5 transducer increased as the positive load acted on the wall. The dashed red line in Figure 8c depicts the compression diagonal contraction and the tensile diagonal extension. The cosine rule can be used to determine the angle between the two elongated slopes (la’-5′, l5′-6′) of the created deformation. For simplification, the length of the deformed slope (la’-5′ and l5′-6′) is considered equal to the length of the undeformed state (la-5 and l5-6) in Figure 8c. In determining the angle by the cosine rule, it is necessary to determine the diagonal length of the compressed part. Therefore, it was assumed that the compressed of the diagonal was equal to the elongation of the tensile diagonal. Considering the above simplifications, the drift was determined by diagonal measurement.
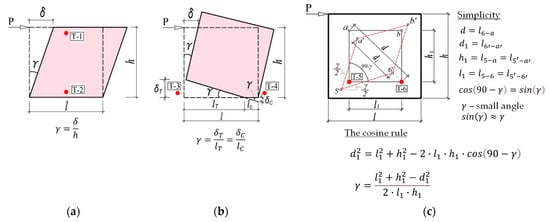
Figure 8.
Deformations of panel. (a) Shear deformation; (b) Rotation of rigid-body; (c) Diagonal deformation.
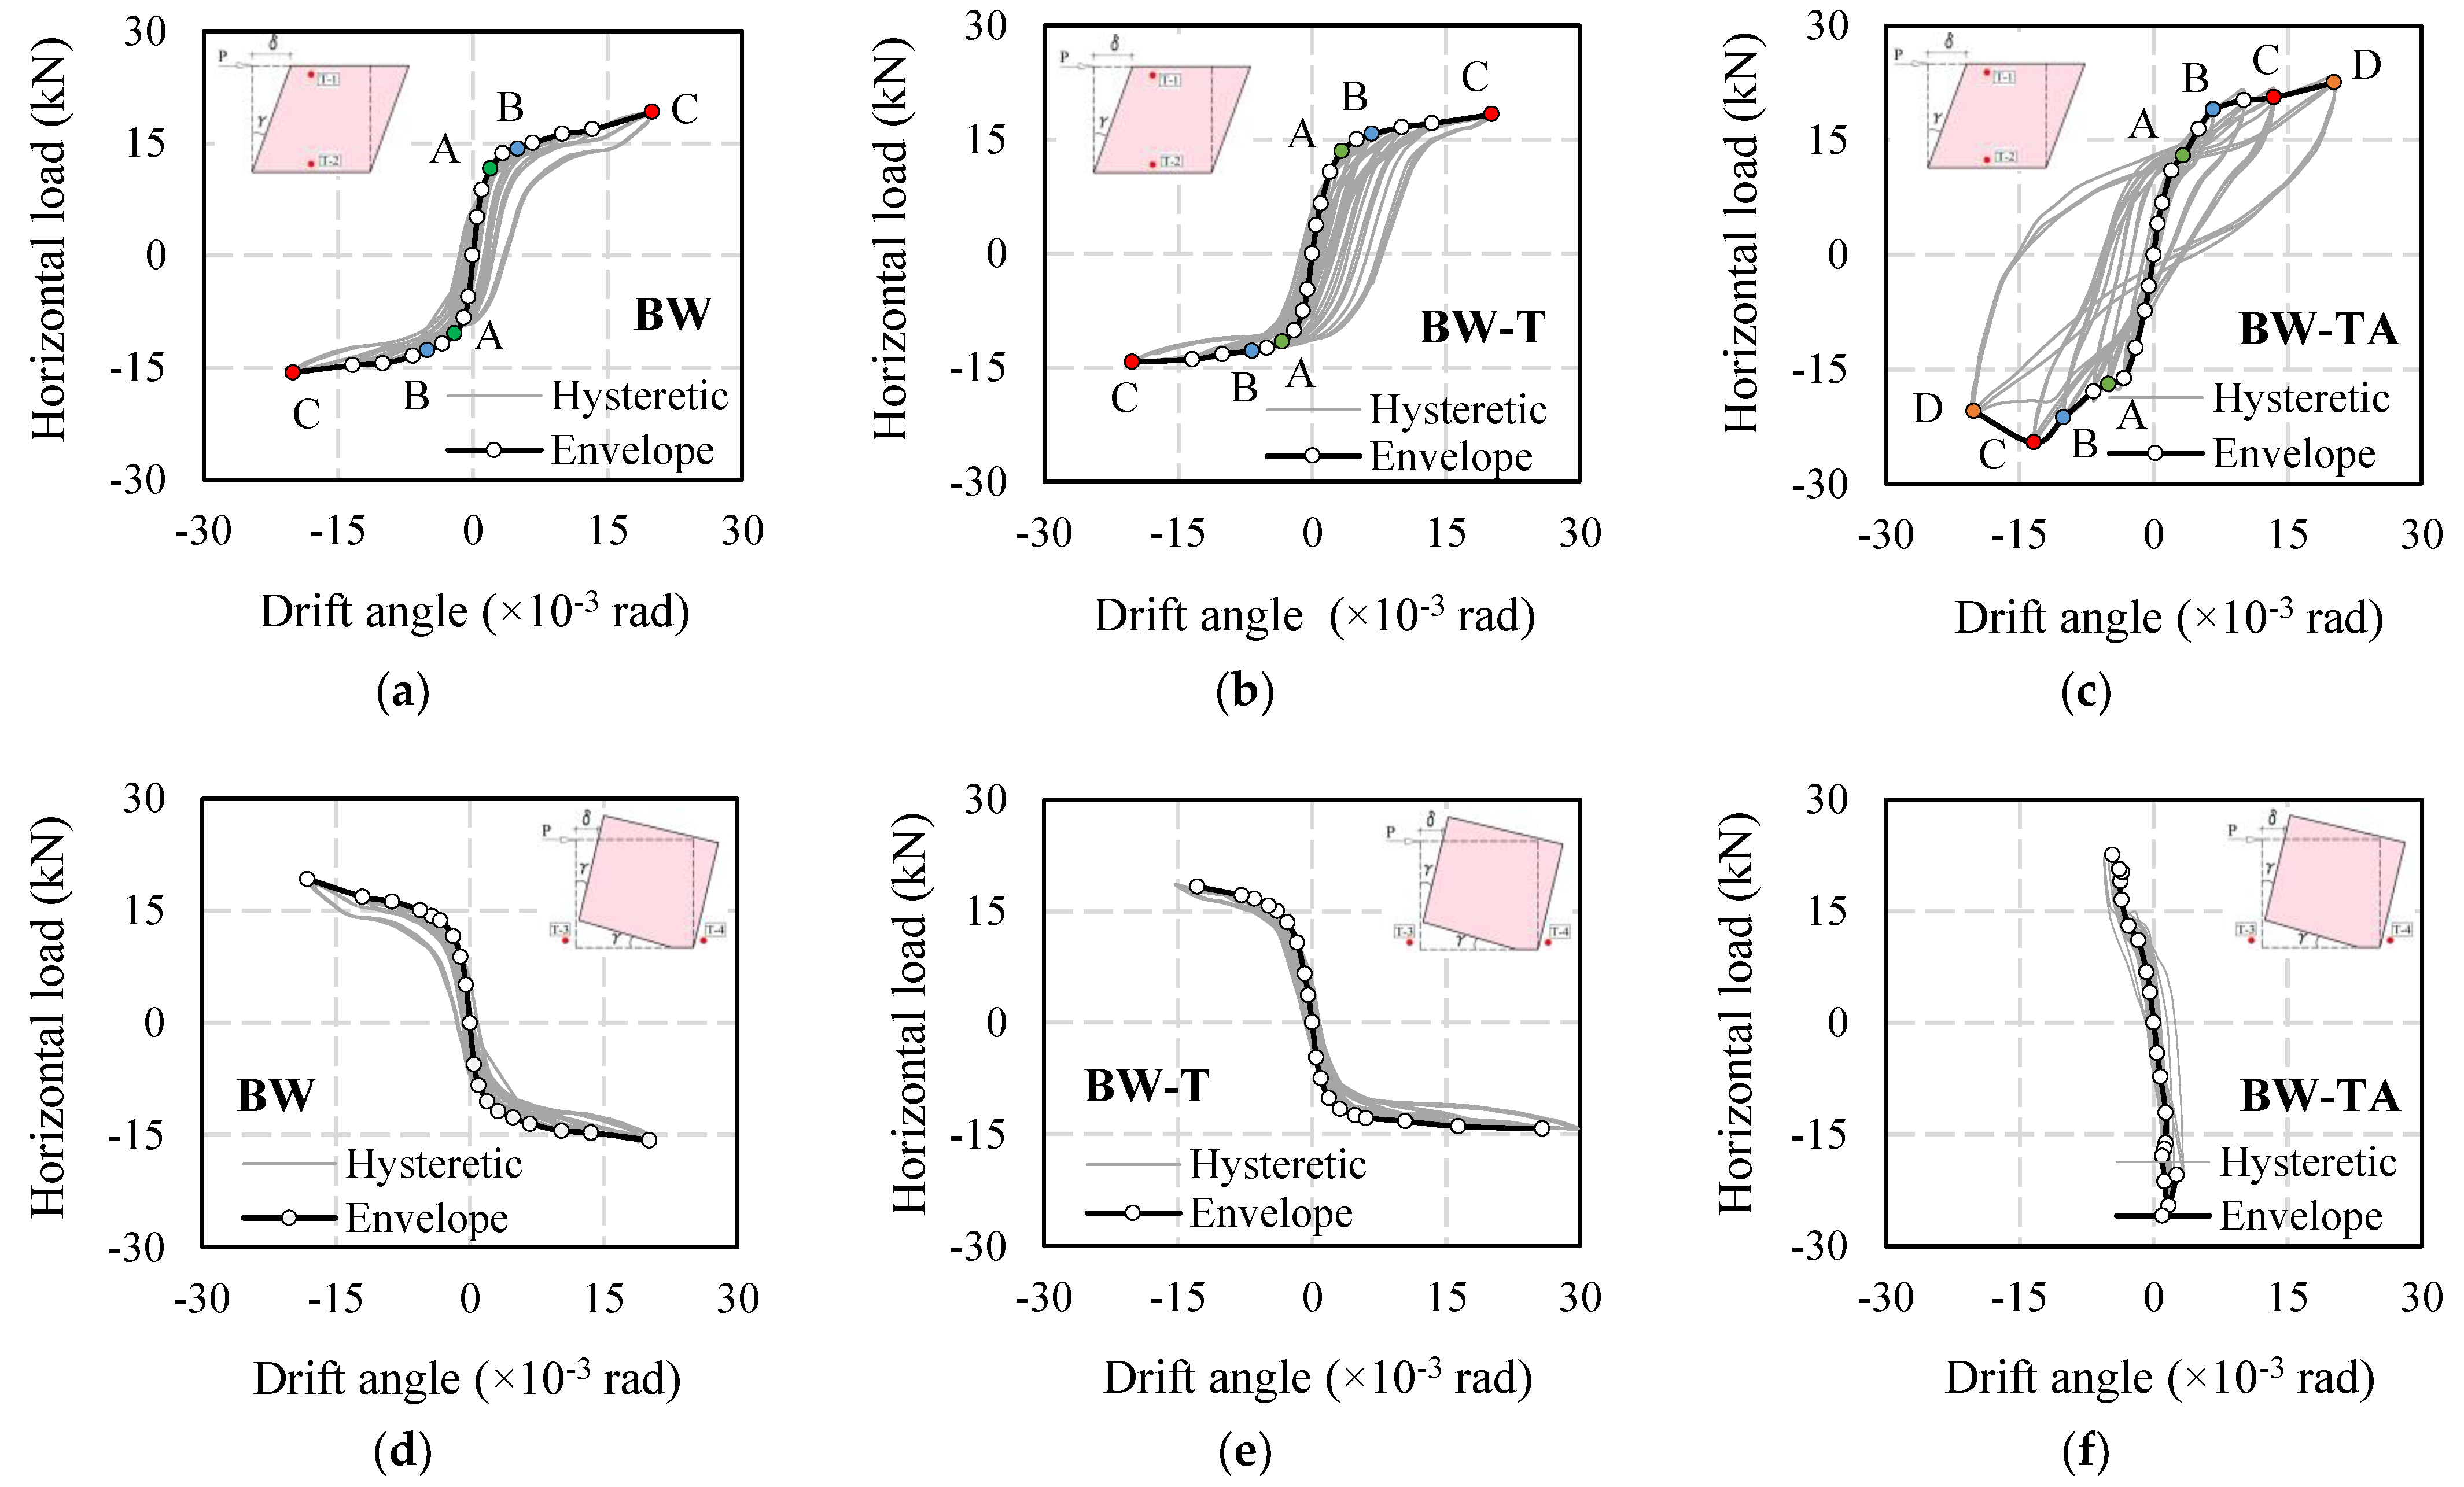
Figure 9 illustrates the load–drift hysteretic curve and the envelop curve obtained under cyclic horizontal load. The envelope curve is created by connecting the maximum load line in each cycle. As shown in Figure 9, the direction in which the oil jack pushes to the wall specimen indicates the positive loading, whereas the wall specimen is pulled in negative loading.
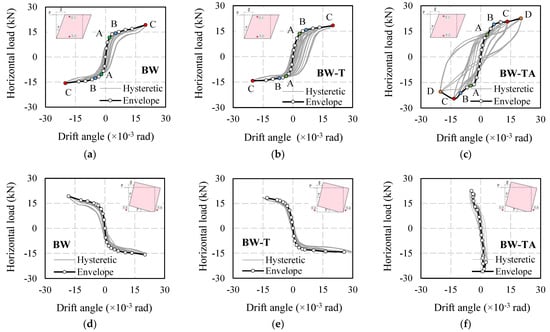
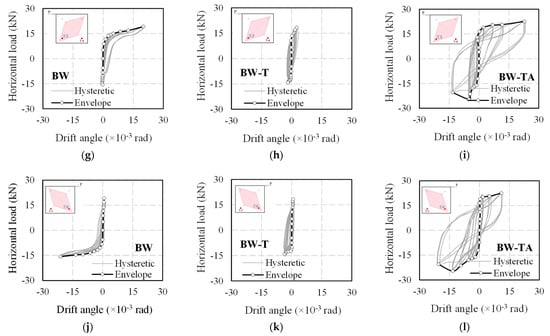
Figure 9.
Horizontal load–drift hysteretic and envelope curve of experiments. (a) BW wall (horizontal); (b) BW-T wall (horizontal); (c) BW-TA wall (horizontal); (d) BW wall (vertical); (e) BW-T (vertical); (f) BW-TA wall (vertical); (g) BW wall (diagonal T5); (h) BW-T wall (diagonal T5); (i) BW-TA wall (diagonal T5); (j) BW wall (diagonal T6); (k) BW-T wall (diagonal T6); (l) BW-TA wall (diagonal T6).
3.1.1. BW Wall
Figure 10b shows the failure mode of the BW wall. Figure 9a,d,g,j illustrate the load–drift angle curve of the BW wall. The horizontal measurement defines the drift angle in Figure 9a, and the load–drift angle curve is the S shape. The initial slope is linear until the “A” point, and the line slope from “A” to “C” point decreases and shows a nonlinear characteristic in Figure 9a–c. The first crack appears at “A” point in Figure 9a, and the horizontal load (Pcr) is 11.6 kN (−10.5 kN) in the positive (negative) loading. The drift angle in Table 9 is obtained from the horizontal measurement. The initial stiffness (Ke) is defined by the load at the 2nd cycle being over the displacement at the 2nd cycle in Table 9.
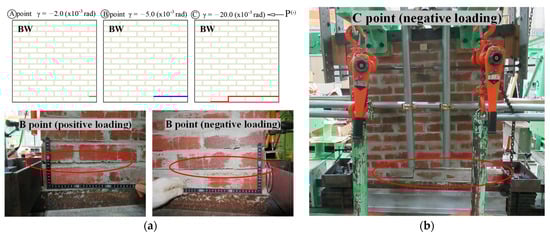
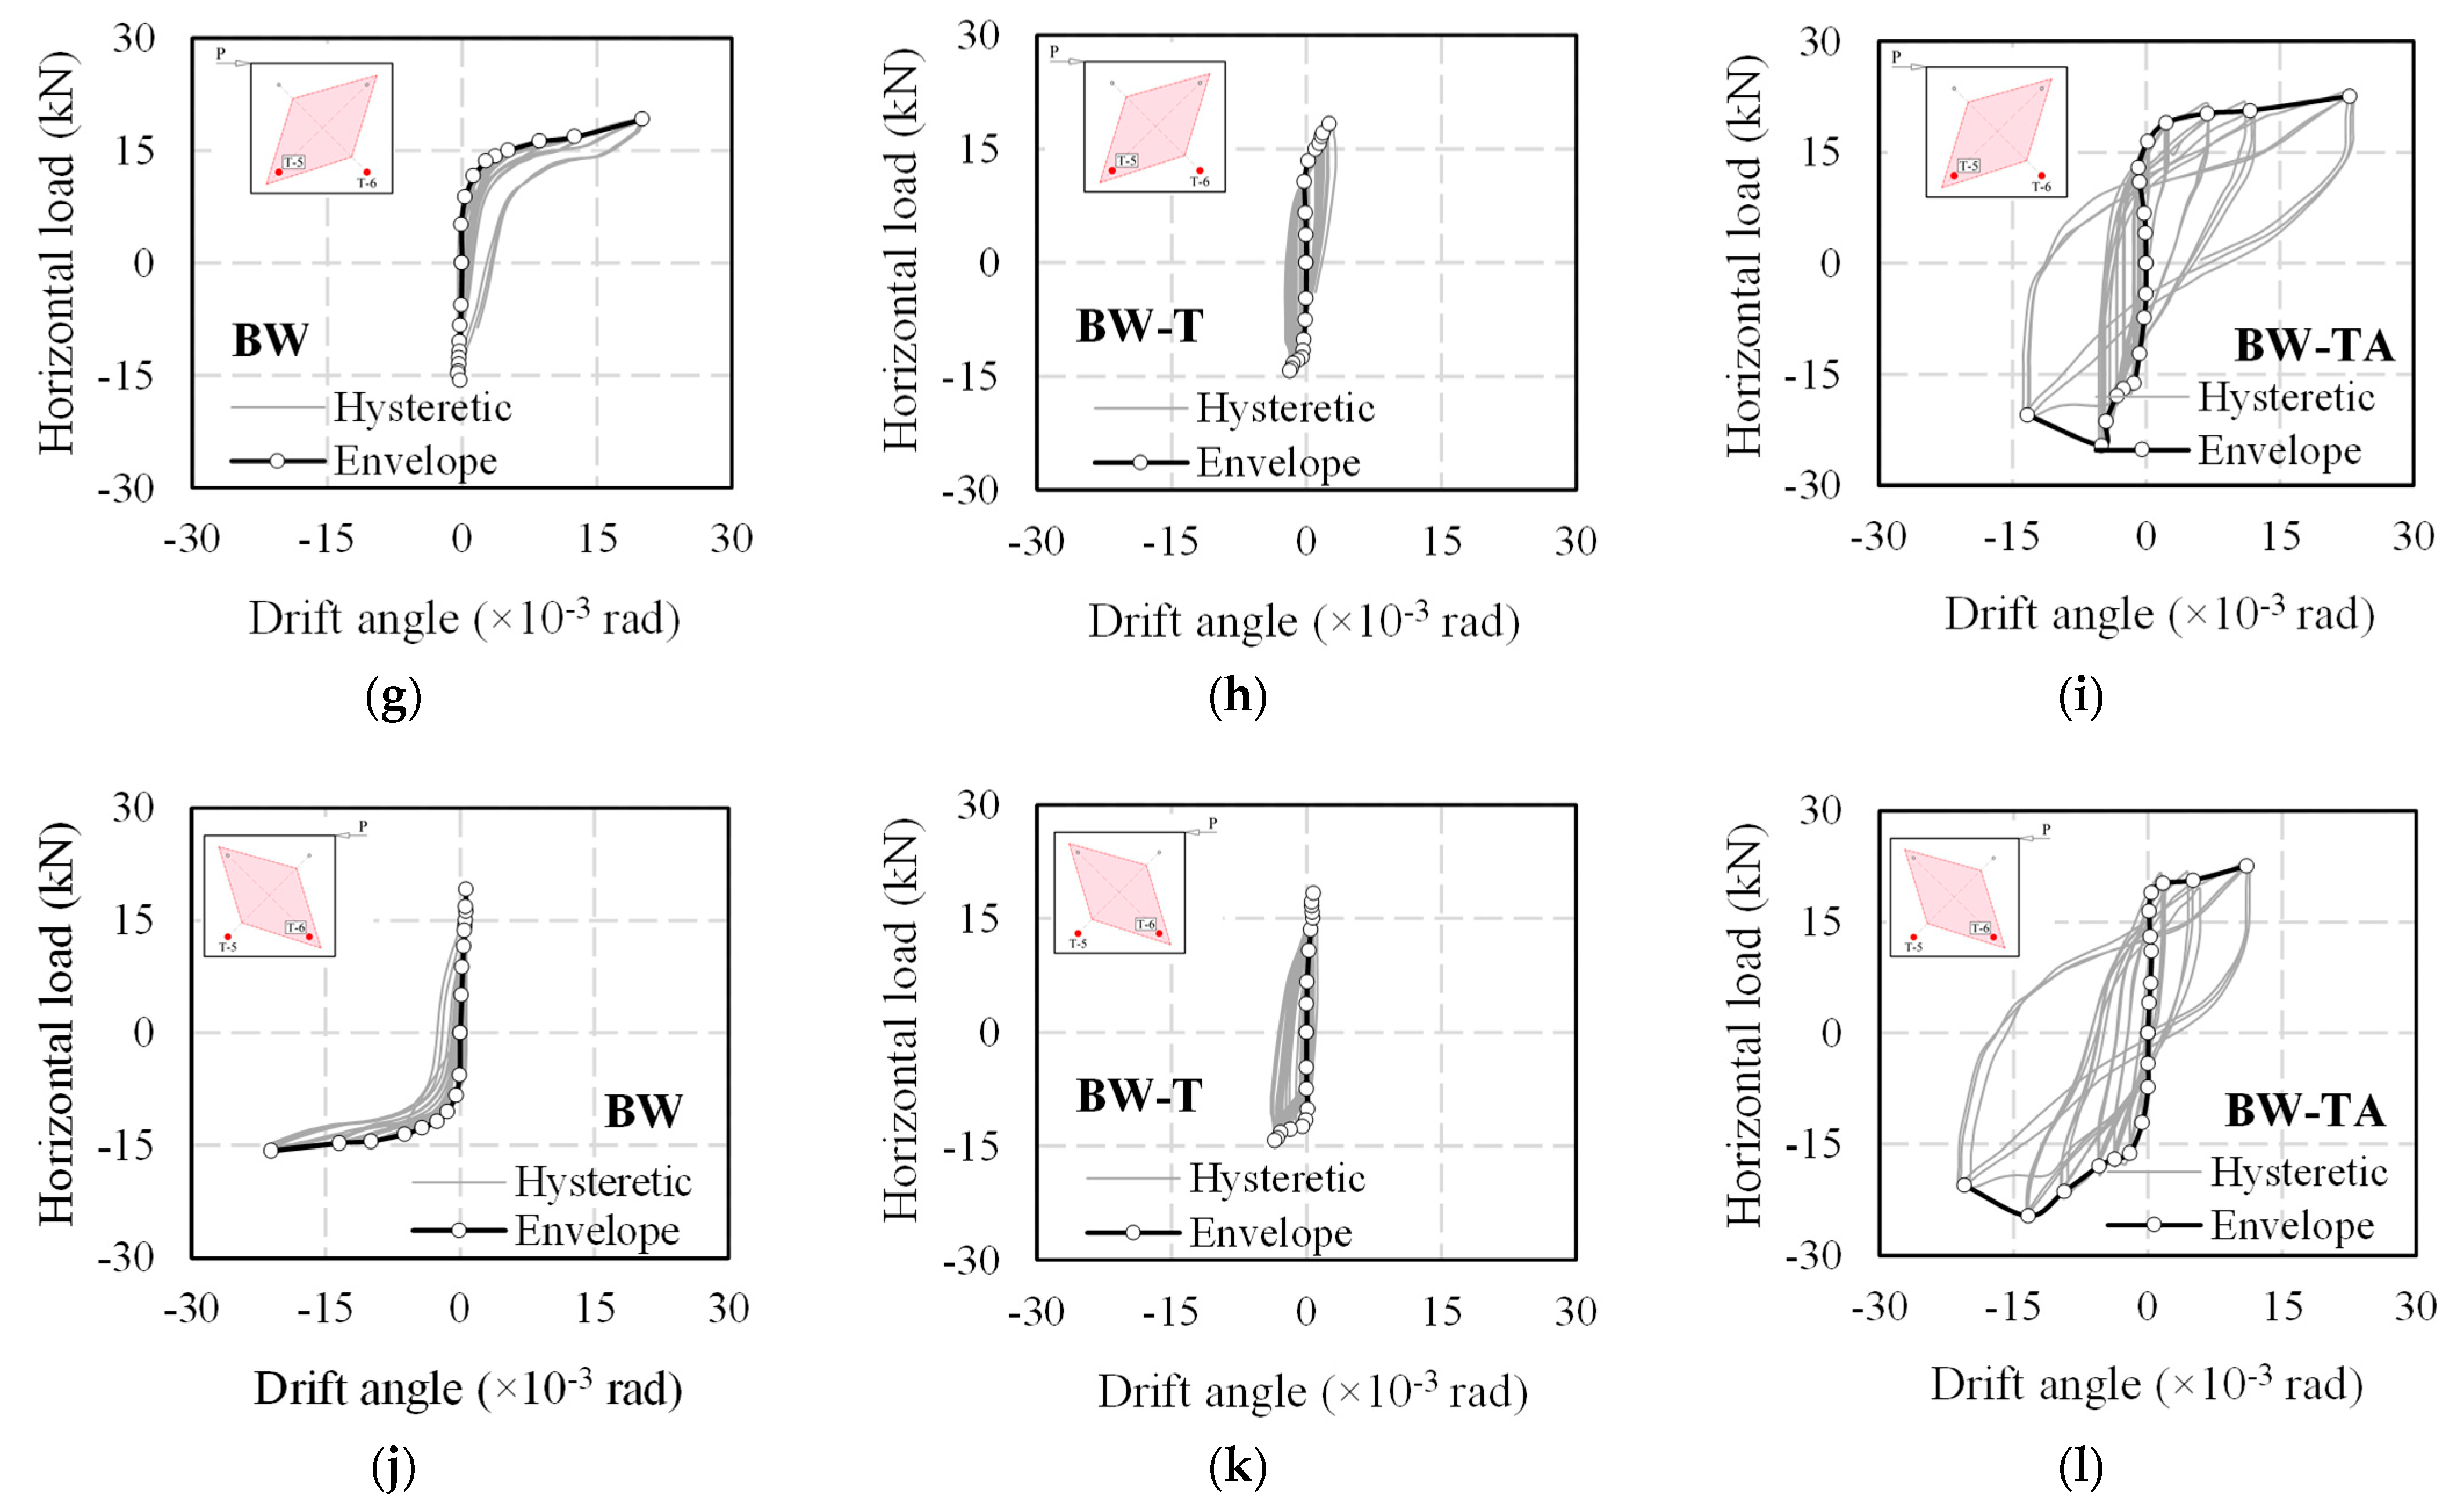
Figure 10.
Failure and crack pattern of BW wall. (a) Scheme of the crack pattern and photo of the crack at uplift (B point); (b) photo of failure at the maximum load.
Table 9.
Result of wall experiment.
In Figure 9, the drift angle from the vertical measurement is increased during the horizontal load for the BW. It indicates that the bottom of the BW wall is lifted. The wall is assumed to have been damaged due to bending deformation. Figure 9g,j show drift angles determined by transducers 5 and 6, respectively. The diagonal measurement implies that the BW wall is not deformed along the diagonal direction. The extension of the drift angle in Figure 9g,j includes uplift deformation.
As shown in Figure 10, the dominant failure of the BW wall is related to the in-plane flexural failure. As indicated by the “A” point in Figure 9a and Figure 10a, the initial crack was launched in the bottom corner of the wall in both positive and negative loading, as illustrated by the “A” position in Figure 9a and Figure 10a. The first crack was extended to increase the cyclic lateral load. Failure at maximum load occurred only in the bottom part of the BW wall, and vertical cracks were observed in the head-joint of the bottom brick layer in Figure 10b. The uplift at the BW wall is indicated by the “B” point in Figure 9a and Figure 10a. The failure at maximum load is represented by the “C” point in Figure 9a and Figure 10a. The failure photo and vertical measurement results clearly show that the rocking failure occurred.
3.1.2. BW-T Wall
Figure 9b,e,h,k show the load–drift angle curve of a BW-T wall, and the drift angle in Figure 9b is calculated by the horizontal measurement. The first crack was observed at “A” point, and the load at the first crack (the fourth cycle) was 13.5 kN (−11.6 kN) in positive (negative) loading. Table 9 shows the initial stiffness, the load and drift angle at the yield and ultimate state. Figure 9e shows the drift angle from the vertical measurement increased during the horizontal load for the BM-T wall. It is claimed that the cyclic lateral load caused the bottom of the wall to be lifted in the upward direction. Figure 9h,k show that the drift angle is a small value relying on the small displacements recorded under the positive and negative loads. The BW-T wall is not deformed along the diagonal direction as the diagonal measurement.
Figure 11 shows the failure modes of the BW-T wall. The first cracks started at the bottom of the wall corner, and the uplift occurred between the lowest mortar and the bottom of the lowest brick in Figure 11a. In-plane flexural failure was caused by horizontal cycle loads. There were no cracks in the brick walls, timber, connection, and the head-joint of the bottom brick layer. It shows that the head-joint of the bottom brick layer has good adhesion because of the horizontal connection of the SPF lumber. The marked point “B” is the uplift of the BW-T wall, and the point “C” is the failure at maximum load in Figure 9b and Figure 11. The effect of the wooden wall did not increase the horizontal load of the BW-T wall during the cyclic load, but it retained the original shape of the brick wall. Therefore, the least strong part is damaged, which is the lowest part of the BW-T wall.
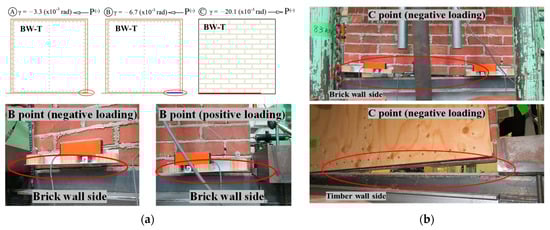
Figure 11.
Failure and crack pattern of BW-T wall. (a) Scheme of the crack pattern and photo of the crack at uplift (B point); (b) photo of failure at the maximum load.
3.1.3. BW-TA Wall
The initial crack in the BW-TA wall started in the negative direction in the fourth cycle (“A” point and −16.2 kN) and in the positive direction at the fifth cycle (“A” point and 16.4 kN) in Figure 9c. Table 9 presents the initial stiffness, the load and drift angle in the yield and ultimate state. The uplift of the BW-TA wall was initiated in the negative direction in the “B” point. The BW-TA wall was not uplifted till failure mode, and only small displacements in the vertical direction were recorded. The drift angle increases under positive and negative loadings in Figure 9i,l. As a result of the diagonal measurement, the BW-TA wall is supposed to be deformed along the diagonal direction from its original state.
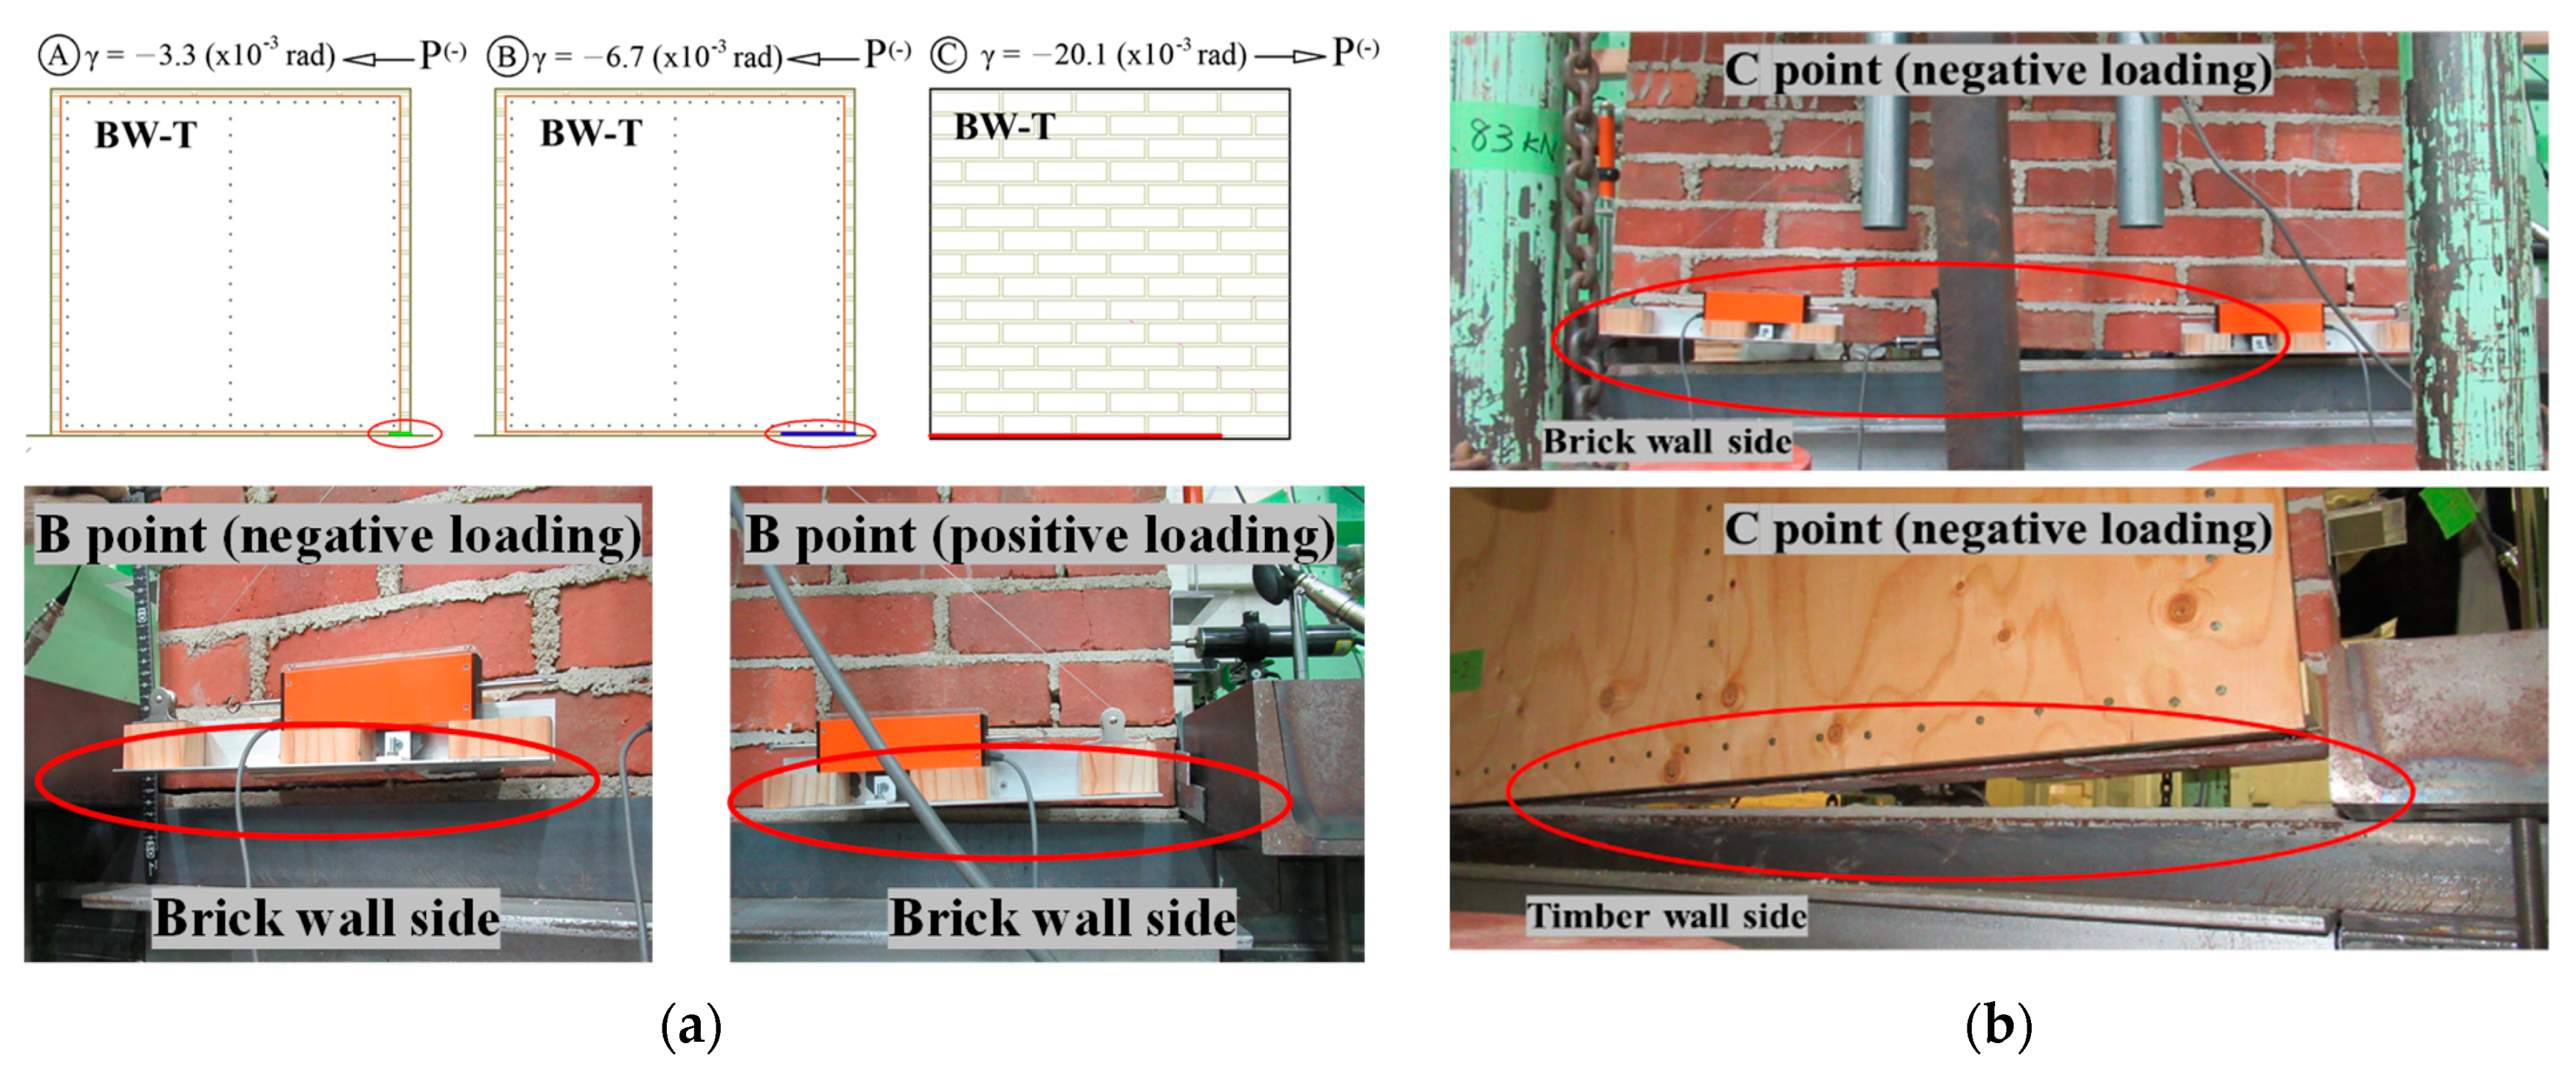
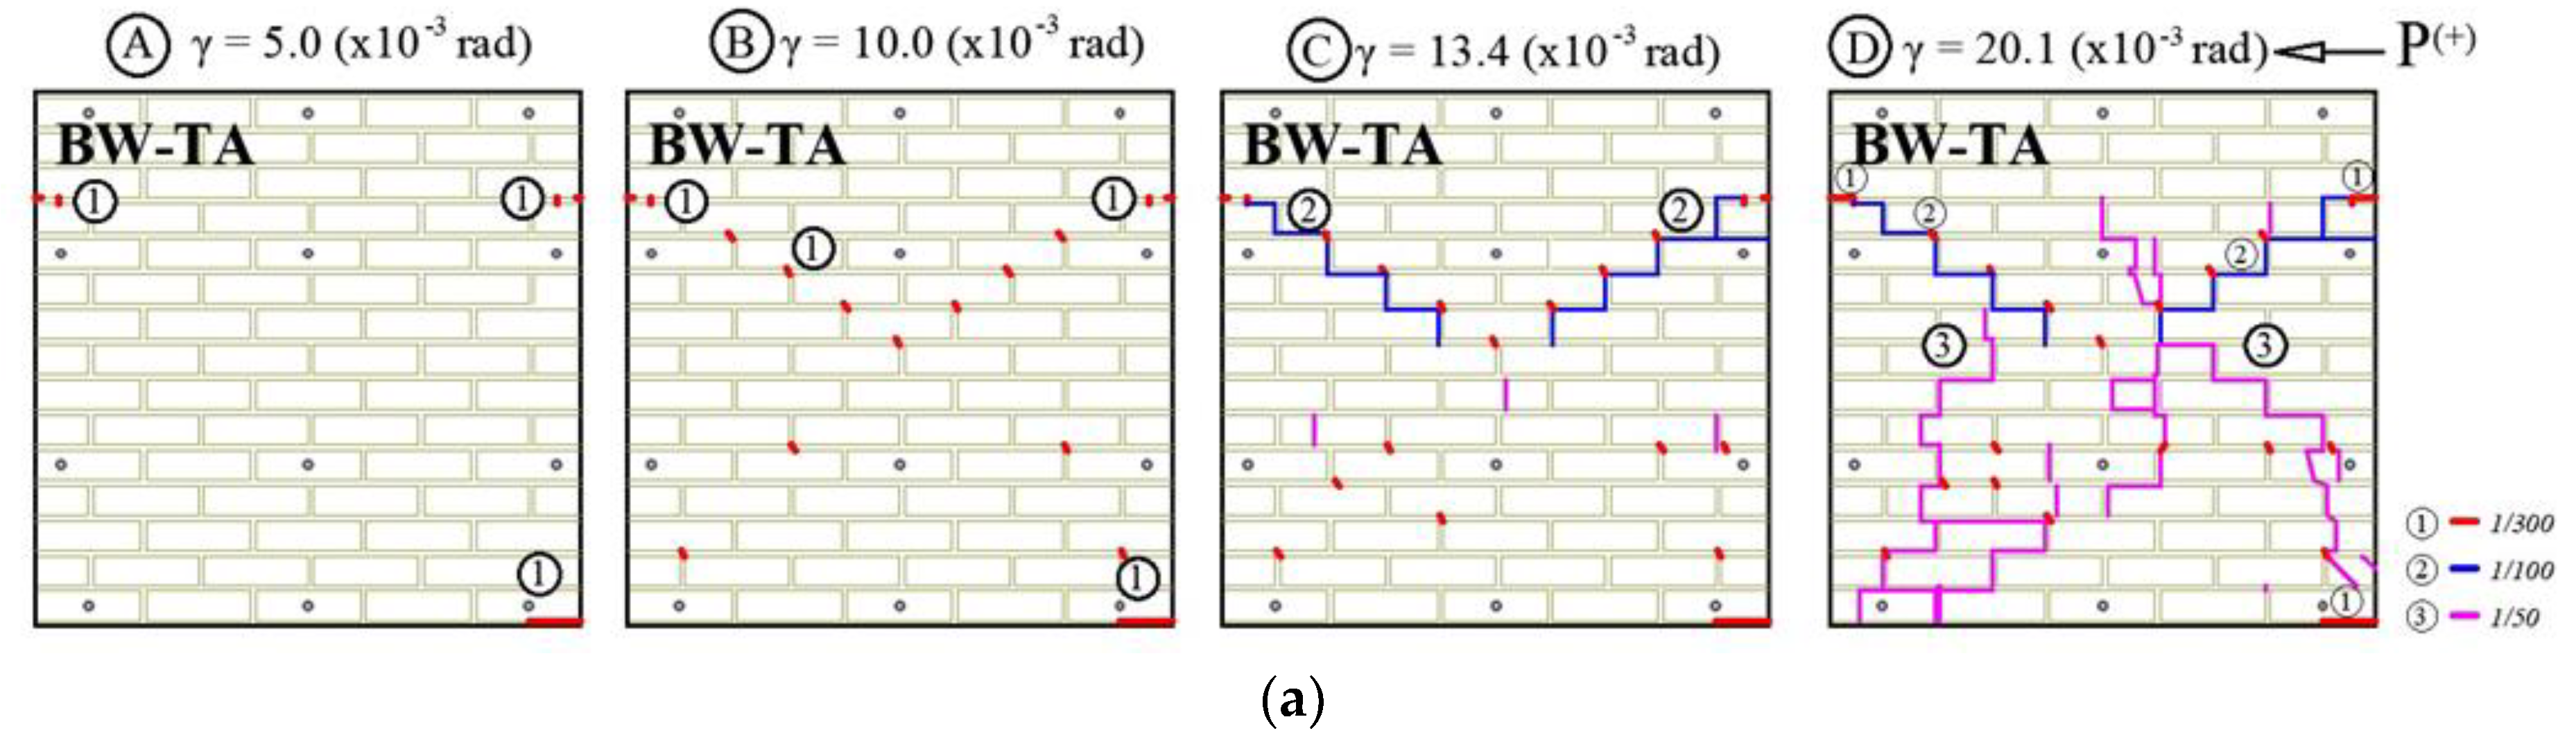
Figure 12a shows the schematic crack pattern of the BW-TA wall from “A” to “D” points as marked in Figure 9. Under the positive loading, the first crack started in the bottom right corner of the wall marked with the number “1” in Figure 12a and was observed in the fourth cycle (“A” point). Under the negative loading, the first crack appeared in the fifth cycle (“A” point) in the upper left corner of the wall marked with the number “1” in Figure 12a. Up to 7 cycles (“B” point), the crack in the middle of the wall was formed at the intersections of the bed-joint and the head-joint mortar.
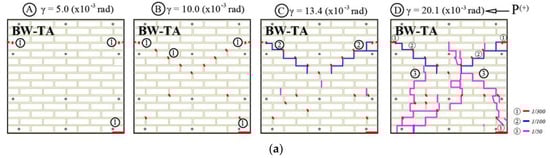
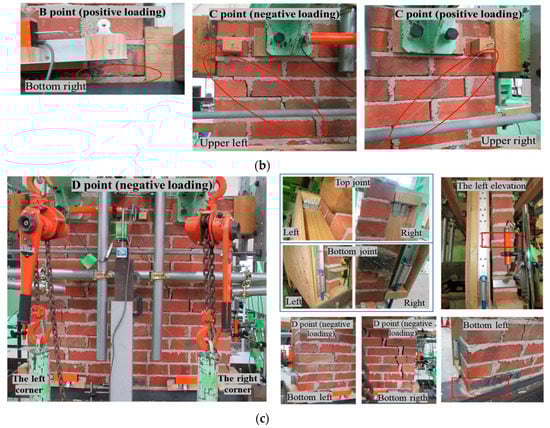
Figure 12.
Failure and crack pattern of BW-TA wall. (a) Scheme of the crack; (b) failure photo at “C” point; (c) failure photo at “D” point.
A slip occurred between the brick and mortar as marked by the number “1” in the upper left corner of the wall in Figure 12a. As the load increases, the vertical cracks are formed in the head-joint mortar, and the stepped diagonal cracks are shown as number “2” at the top part of the BW-TA wall. The stepped diagonal crack was the same for both positive and negative loads in the “C” point. When the ninth cycle (“D” point) began and the load increased, vertical cracks were detected in the bricks. In the negative load, diagonal cracks dominated, and vertical cracks prevailed in the middle of the wall in the positive load. As shown in the crack pattern, the timber part and bolts affected the wall damage. It indicates that the horizontal load was applied to the brick wall during a load until the initial crack appeared on the BW-TA wall. The vertical load from the moment was then received by the hold-down bolt of the BW-TA’s timber wall. The results of the diagonal measurements in Figure 9i,l show that the timber wall can increase the deformation of the masonry part. The shear and tensile strength of the masonry part is much less than the timber wall. Therefore, the brick wall is considered damaged, while no damage or cracks occurred in the timber wall or the joint in Figure 12c. Figure 12c shows the lower base of the wall has moved from its original position, and the base of a brick wall is bent to the timber frame during in-plane horizontal loads.
To determine the relative displacement between the brick wall and the timber frame, transducers (T9 to T14) were placed on the sides of the BW-T and BW-TA walls in Figure 6d,g. The relative displacement was determined by subtracting the horizontal displacement of the timber frame from the horizontal displacement of the brick wall. Until “A” point, the relative displacement is almost non-existent (forth cycle). It is supposed that no deformation occurs between the brick wall and wooden wall until the first crack appears in the BW-T and BW-TA walls. The measurement results indicated that the displacement in the brick wall was greater than the timber frame. It is considered that the connection between the brick and wooden walls has high stiffness.
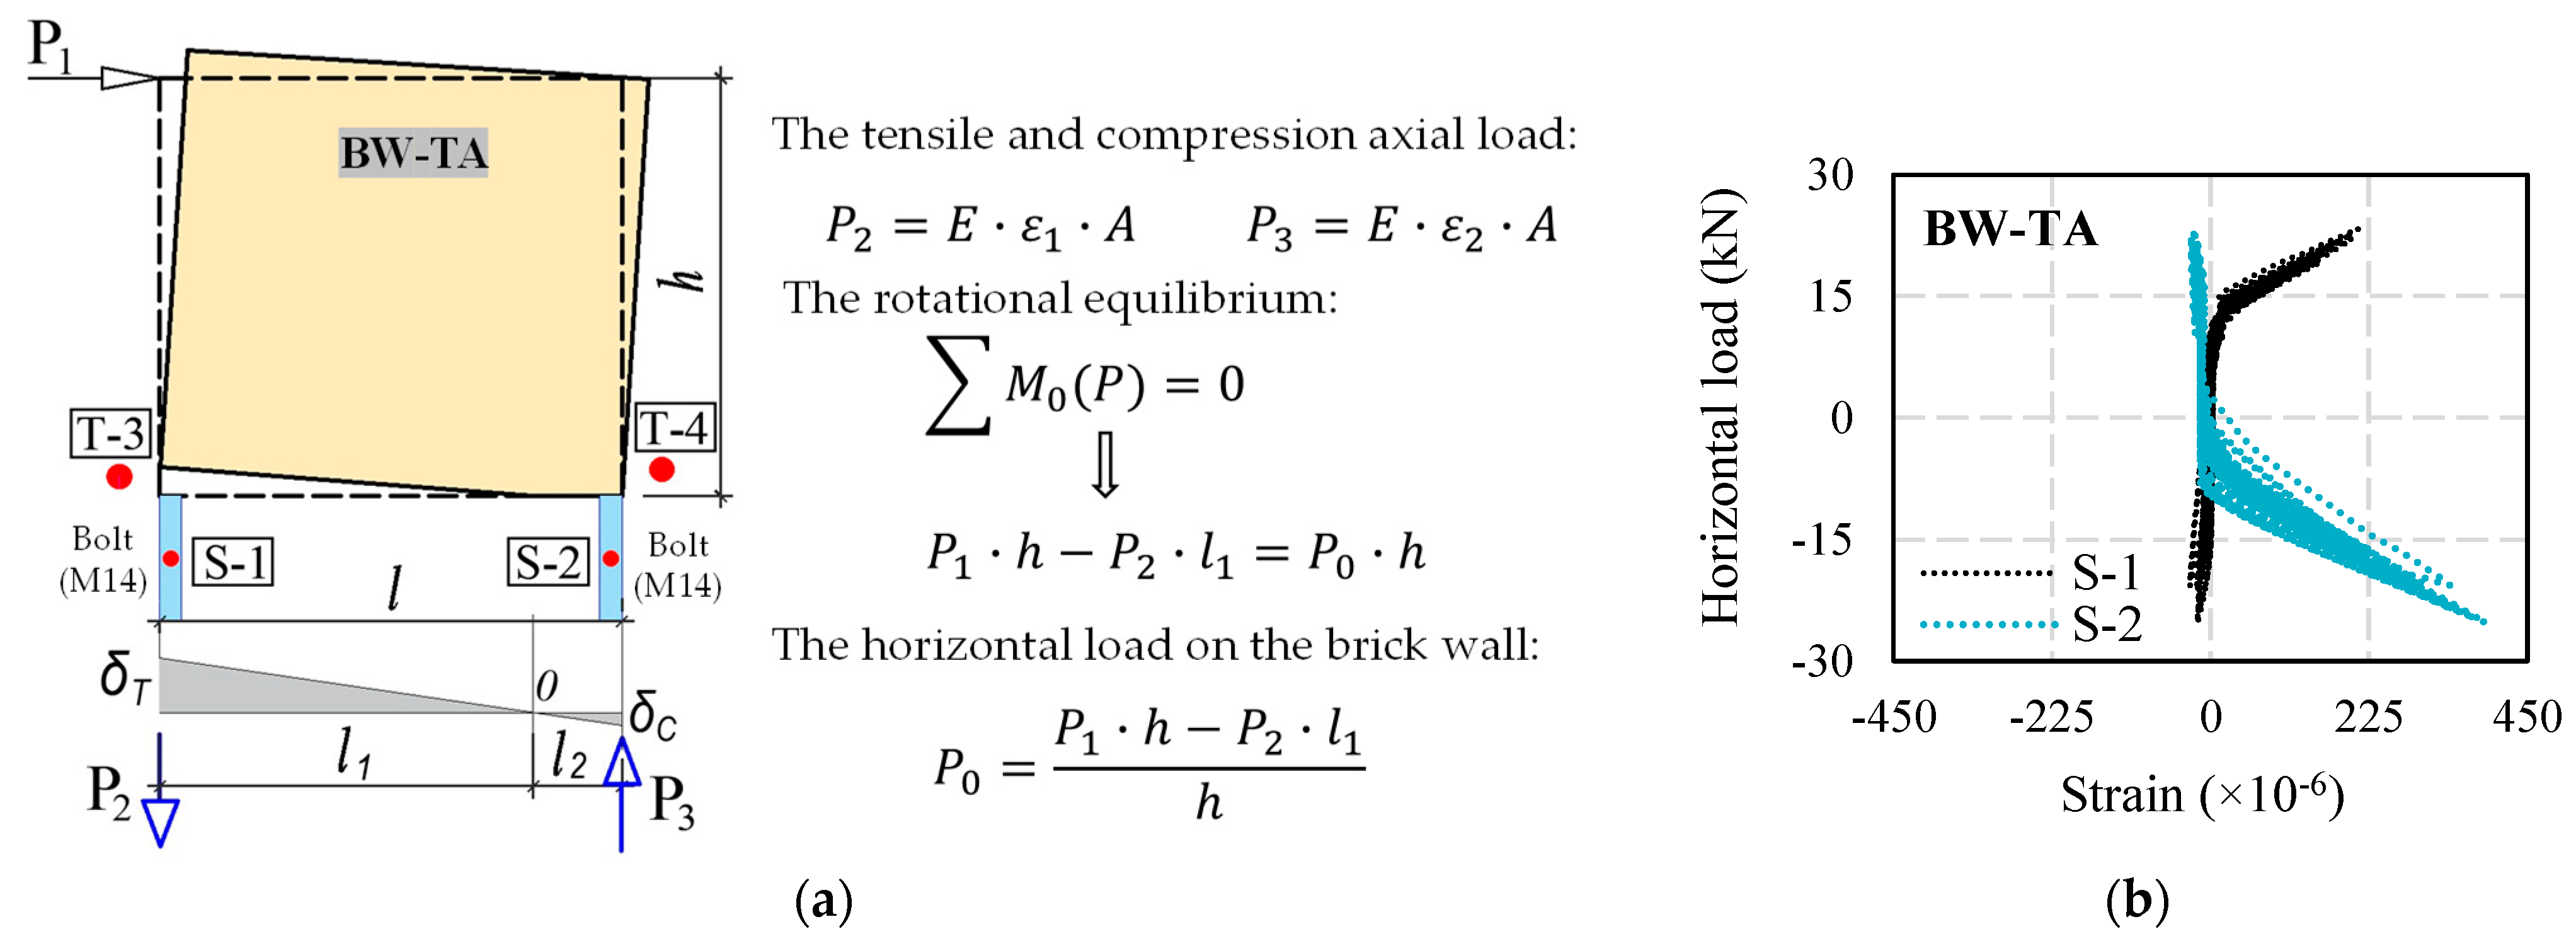
The BW-TA wall’s timber frame is bolted to the base, and strain gauges (S1 and S2 in Figure 13) are attached in the middle of the bolts. Figure 13b illustrates the relation between the horizontal load and strain on the bolt, in the positive and negative loading. S-1 (black line) and S-2 (blue line) in Figure 13b are the names of the strains on the bolt: S-1 is the strain placed on the left side of the BW-TA wall, and S-2 on the right side. In the positive loading, the value of the S-1 strain increases, showing tensile properties, while the value of the S-2 strain reduces. On the other hand, the strain values indicate the opposite state in negative loading.
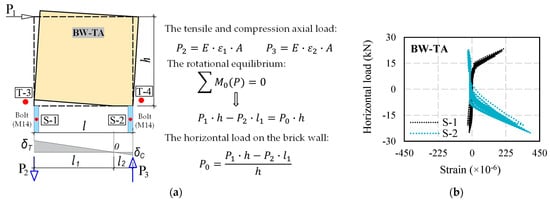
Figure 13.
(a) Equilibrium condition of BW-TA wall; (b) Relation between horizontal load–strain on bolt, where P1 is the horizontal load recorded by the experiment; P2 is the tensile load on the bolt during the positive loading; P3 is the compression load on the bolt during the positive loading; E is the elastic modulus of the bolt; ε1 (ε2) is the strain value recorded by S-1 (S-2) strain gauge; A is the cross-sectional area of the bolt M14; l1 is the tensile length of the wall; l2 is the compression length of the wall; P0 is the horizontal load on the brick wall without the hold-down bolt; l is the length of the wall; and h is the height of the wall.
Knowing the strain in the bolts makes it possible to determine the tensile and compression load. The tensile axial load (P2 in Figure 13a) of a bolt is proportional to the elastic modulus (E), tensile strain (ε1), and cross-sectional area (A). The axial compression load (P3 in Figure 13a) is determined in the same way. In Figure 13a, the tensile displacement (δT) of the BW-TA wall was measured at transducer T-3 and the compressive displacement (δC) was measured at transducer T-4 under the positive loading. Point “0” touches the horizontal axis when the tensile and compression displacement are connected in a straight line. The rotational equilibrium can be written using the “0” point. The compression length (l2) is difficult to quantify for calculation simplification, and the compressive axial load is neglected in the calculation. We may calculate the horizontal load on the wall without the hold-down bolt using the rotational equilibrium conditions (P0). It means that the experimental results of the BW-TA wall can be used to calculate the horizontal load acting on a brick wall.
3.1.4. Experimental Comparison Result of Walls
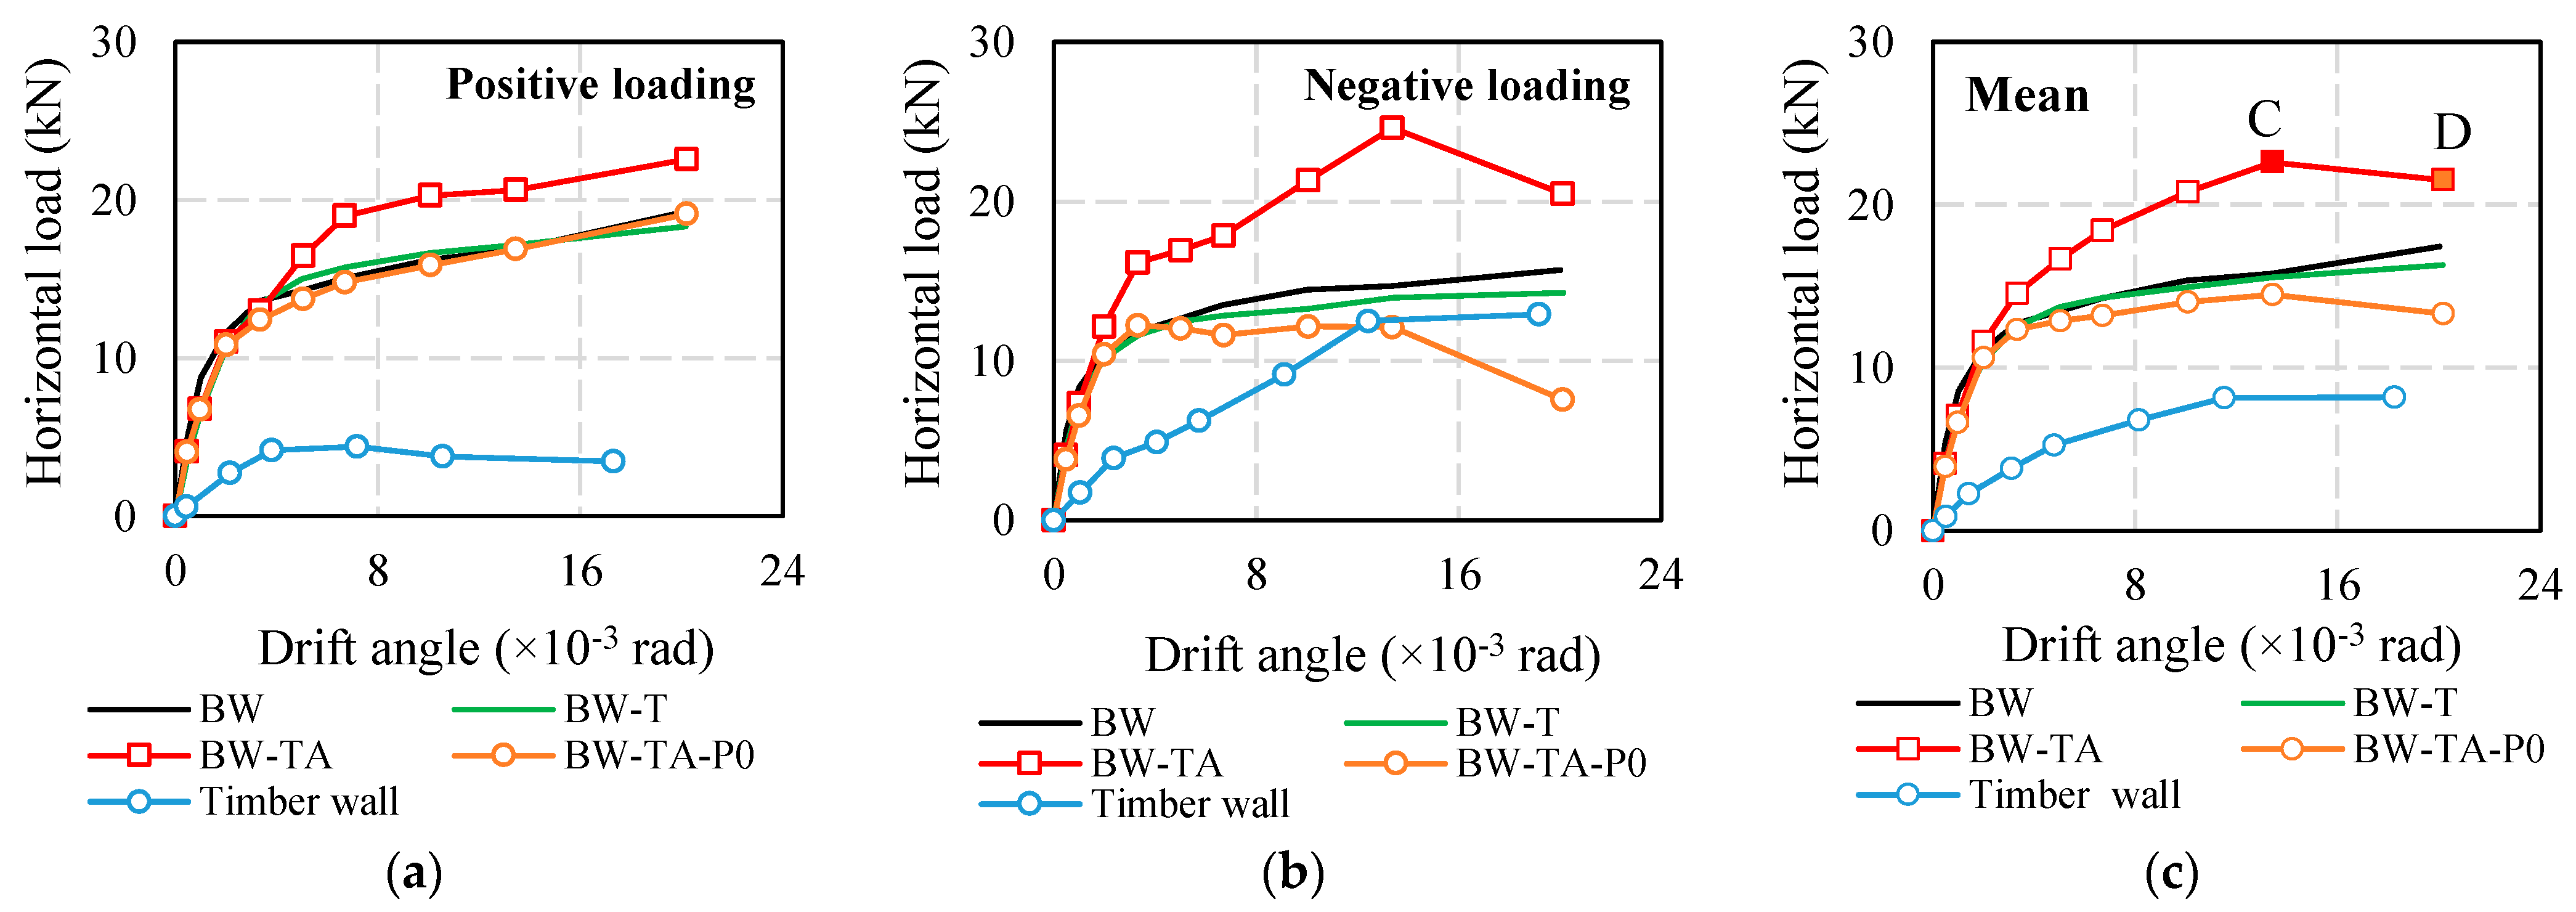
Figure 14 shows the comparative result of the wall specimens, with the envelope curve creating the curve. Figure 14a shows the load–drift angle envelope curve under positive loading. Figure 14b shows the load–drift angle envelope curve under the negative loading, with the positive representing the sign of the negative load and drift angle. Figure 14c shows the mean envelope curve, which is calculated by taking the average of the positive and negative values. Figure 14 shows a load–drift angle diagram created by P0, denoted by BW-TA-P0. The positive loading result of the BW-TA-P0 wall is almost the same compared with the BW and BW-T walls in the positive loading, but a little lower value is shown in the negative loading. Additionally, the BW and BW-T wall results are comparable. The horizontal load on the timber wall of the BW-TA wall can be obtained by subtracting the BW-TA and BW-TA-P0 diagrams as illustrated in Figure 14. The maximum horizontal load of the timber wall is 4.4 kN (12.9 kN) in the positive (negative loading), and the mean value in the negative and positive loadings is 8.2 kN.
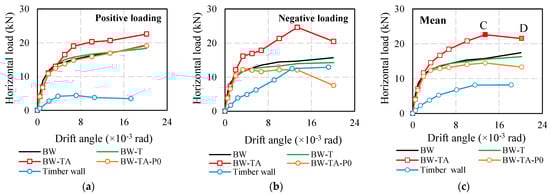
Figure 14.
Comparison envelope curve of horizontal load and drift angle for walls (BW. BW-T, BW-TA, BW-TA-P0, and timber wall). (a) Result of positive loading; (b) result of negative loading; (c) mean result.
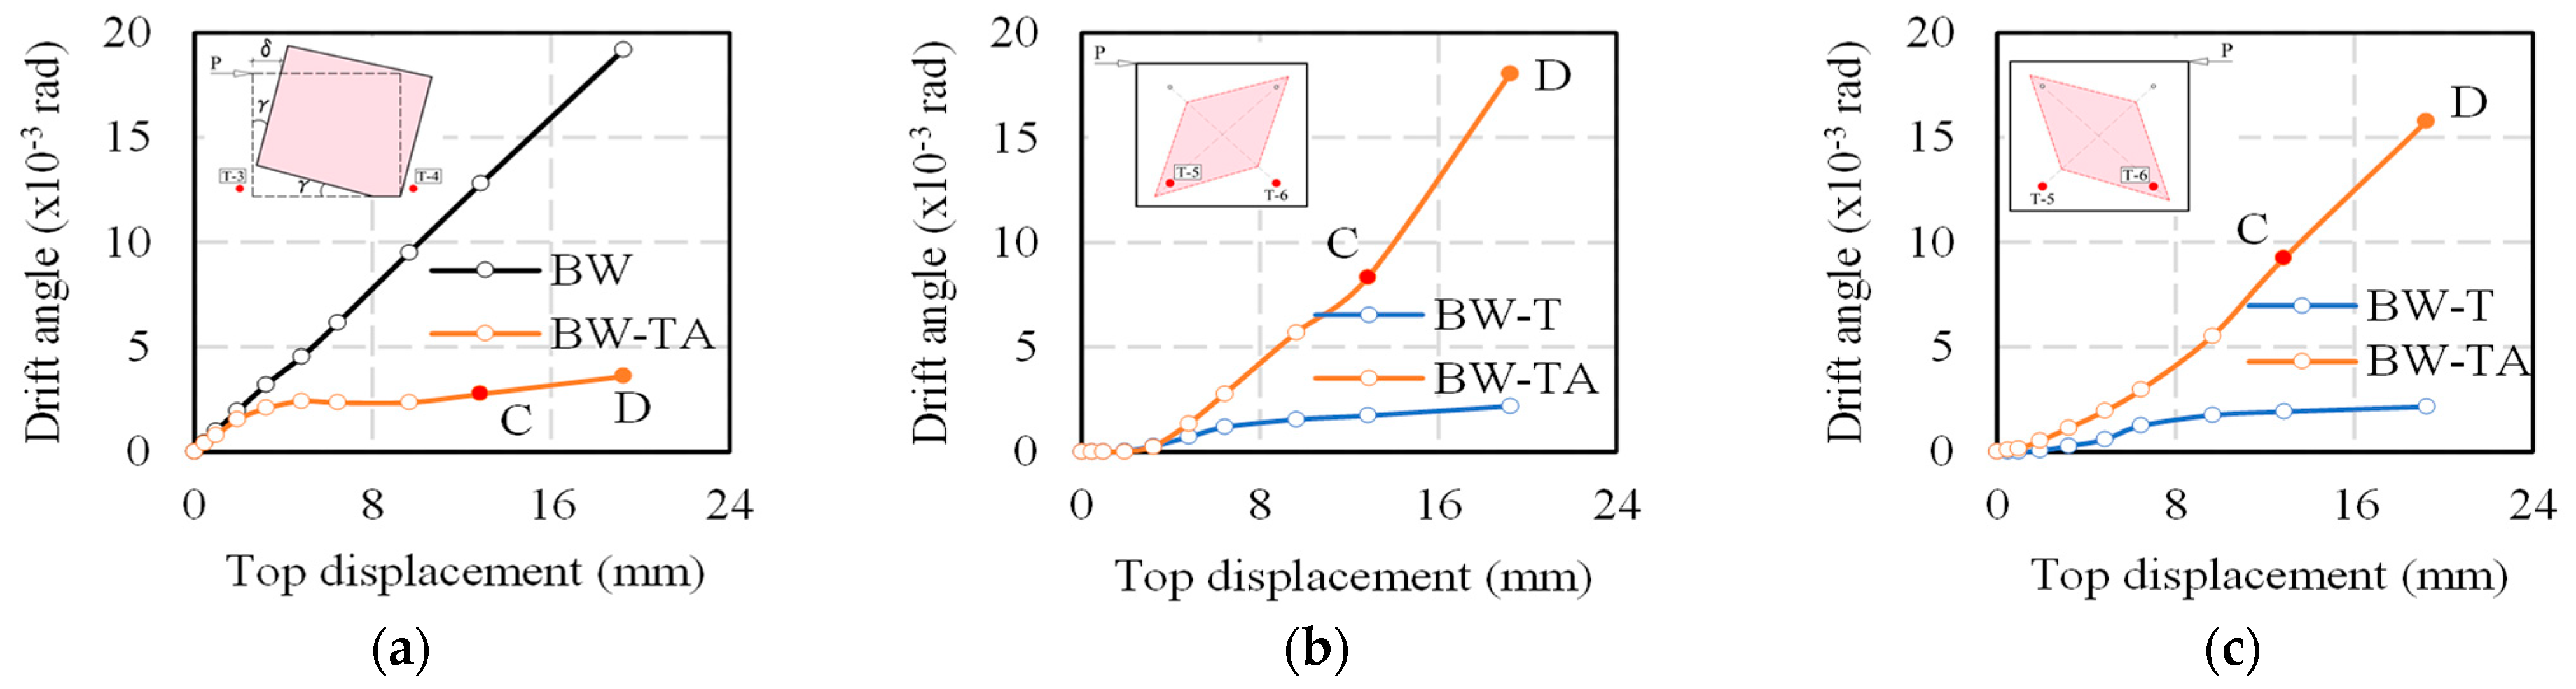
As shown in Figure 14, the horizontal load of the BW-TA wall is 14.8% (36.2%) higher than the BW wall in the positive (negative) loading, and it is 22% greater in the mean result at maximum load. When the flexural fracture emerged on the BW-TA wall, the combined effect of the timber wall and the hold-down anchor started. Figure 14 shows the lateral load and stiffness of the reinforcing performance of the timber part. Figure 9d,f show the vertical measurement estimates of the drift angle of the BW and BW-TA walls. The drift angle of the BW wall in Figure 9d is the same as the horizontal measurement. Therefore, it can be determined how many times the vertical displacement of the BW wall decreases after strengthening in Figure 15a. The ratio of the BW and BW-TA wall’s drift angle estimated by the vertical measurement is 4.6 at “C” point (the maximum load in Figure 14c). Figure 15b,c show the drift angle obtained from the diagonal transducers T5 and T6 of the BW-T and BW-TA walls. The result of the diagonal measurement of the BW-T is a low value. It is assumed the BW-T wall did not deform in the diagonal direction. As a result of comparing the drift angles of the BW-T and BW-TA walls, it is discovered that the drift angles of the BW-TA wall can increase 4.8 times at the “C” point in Figure 15b,c. It is assumed that the shear deformation of the BW wall can be improved by the strengthening technique using the timber material. The experimental result of the BW-TA wall shows that the initial stiffness did not increase after strengthening. The brick wall is considered to have received the horizontal load during the initial cyclic loading.
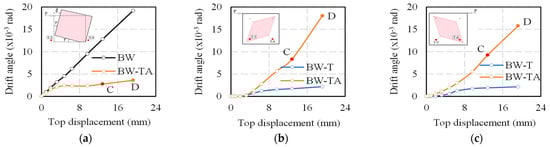
Figure 15.
The drift angle and top displacement relation. (a) The vertical measurement of the BW and BW-TA walls; (b) the diagonal measurement by T5 of the BW-T and BW-TA walls; (c) the diagonal measurement by T6 of the BW-T and BW-TA walls.
4. Prediction and Discussion
This section includes the prediction analysis of the unreinforced brick masonry wall (URM) and the reinforced brick masonry wall with timber frame and plywood panel.
4.1. Unreinforced Brick Masonry Wall (BW Wall)
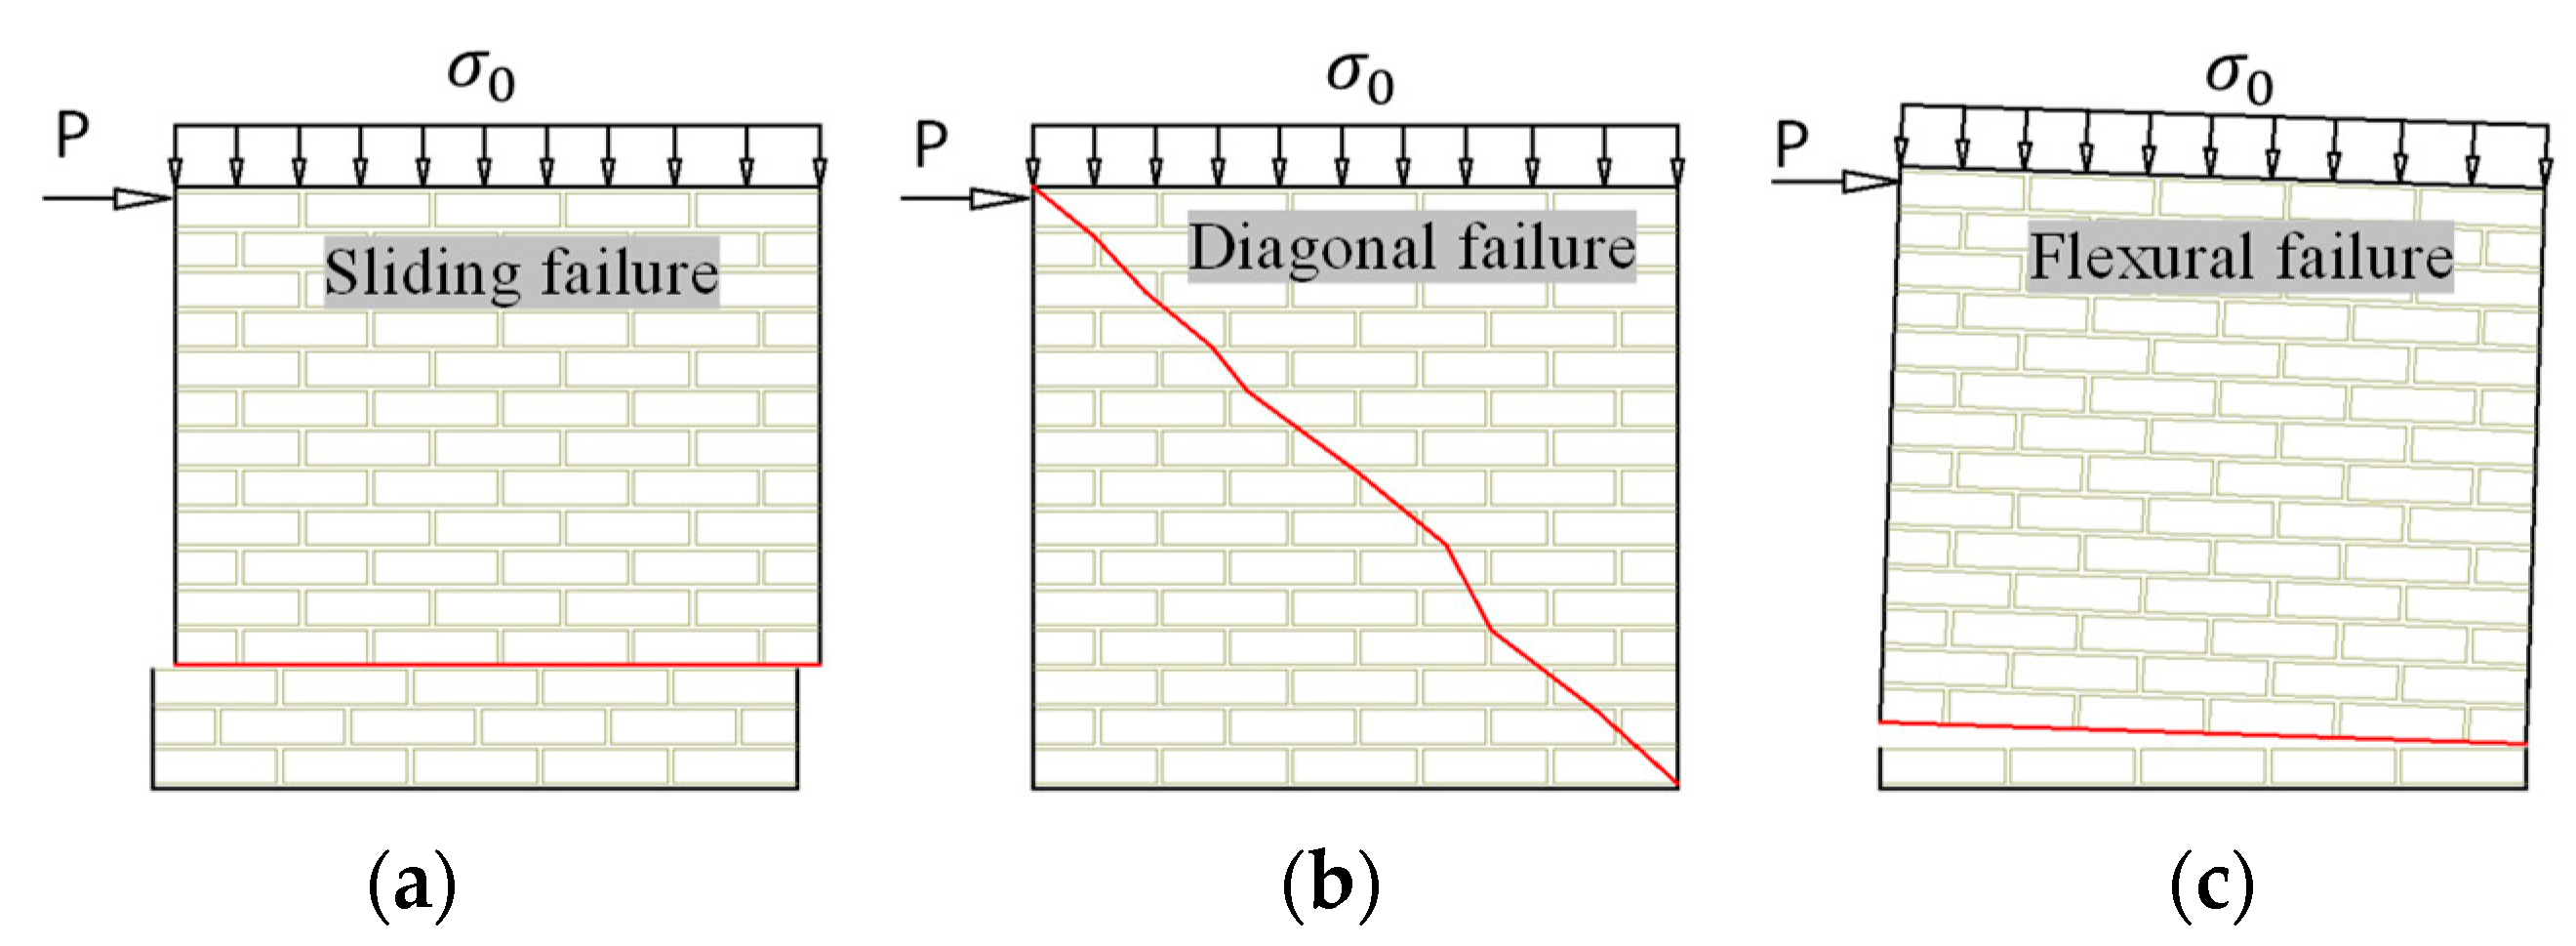
Due to lateral loads, sliding, diagonal, and flexural failures occur in unreinforced masonry walls in the in-plane direction as shown in Figure 16. Shear resistance is related to sliding and diagonal tensile failure, while the bending moment causes flexural failure. The effective stiffness, shear capacity, and drift capacity of an unreinforced masonry wall are necessary to predict its shear strength capacity [22]. In this study, the bi-linear curve predicts the load–drift angle relationship. The experiment yielded the corresponding material properties. Simple theories were used to calculate the in-plane shear capacity of an unreinforced brick wall, and masonry walls were assumed to be elastic and homogeneous.
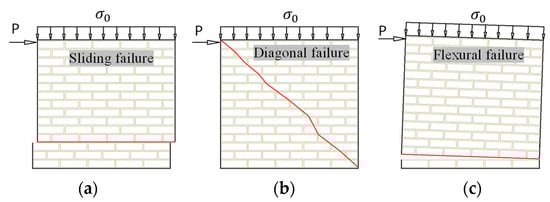
Figure 16.
In-plane failure modes. (a) Sliding failure; (b) diagonal compression failure; (c) flexural failure.
Table 10 shows the horizontal load of prediction formulas. The bed-joint sliding failure theory shown in Formula (1) in Table 10 is based on the well-known failure criterion Morh–Coulumb. The Morh–Coulumb formula contains parameters that express the nonlinear properties of the masonry wall, including adhesion strength and friction coefficient. In this study, the nonlinear material properties, such as adhesion strength and frictional coefficient, were obtained by the pre-compression shear test [19]. The horizontal load causing the sliding failure was calculated using the cross-sectional area of the wall. Formula (2) in Table 10 is used to forecast the type of failure. The failure occurs as a result of a combination of normal and shear stress on the wall [23]. In this case, the principal tensile strength in the cross-section of the wall exceeds the diagonal tensile strength of the masonry wall [2,24]. Diagonal cracks can be the stepped and straight modes in the masonry wall [25]. The tensile strength of a masonry wall derived from the experiment is 3% to 9% of the compressive strength of a masonry wall [26]. The flexural failure prediction is shown in Formula (3) of Table 10. Cracks form in the tensile part of the wall as a result of the bending moment. The crack lengthens as the horizontal load increases while the compressed wall lengthens, and the compressed area receives the most stress concentration [26]. Flexural capacity is determined by parameters such as the pre-compression stress, the thickness of the wall, the length of the wall, and the compressive strength of the masonry. The horizontal load from the bending moment is defined by comparing the height of the wall with the boundary conditions. The predicted failure load at the ultimate state assumes the minimum horizontal load of sliding failure, diagonal failure, and flexural failure (PBW,U).
Table 10.
Prediction formula of horizontal load.
The Timoshenko beam theory assumes the lateral displacement obtained from the shear and flexural strength to define the initial stiffness [24,27]. The ratio between the shear and elastic modulus (G/E) is 0.05 for the 0.2 N/mm2 pre-compression stress by experiment in Table 3. The BW wall’s elastic modulus was determined during the pre-compression loading presented in Table 8.
The near-collapse drift was considered in the prediction in accordance with EN 1998-3 [27,28]. Table 11 shows that the drift occurs during shear and flexural failure.
Table 11.
The near collapse of drift (EN 1998-3).
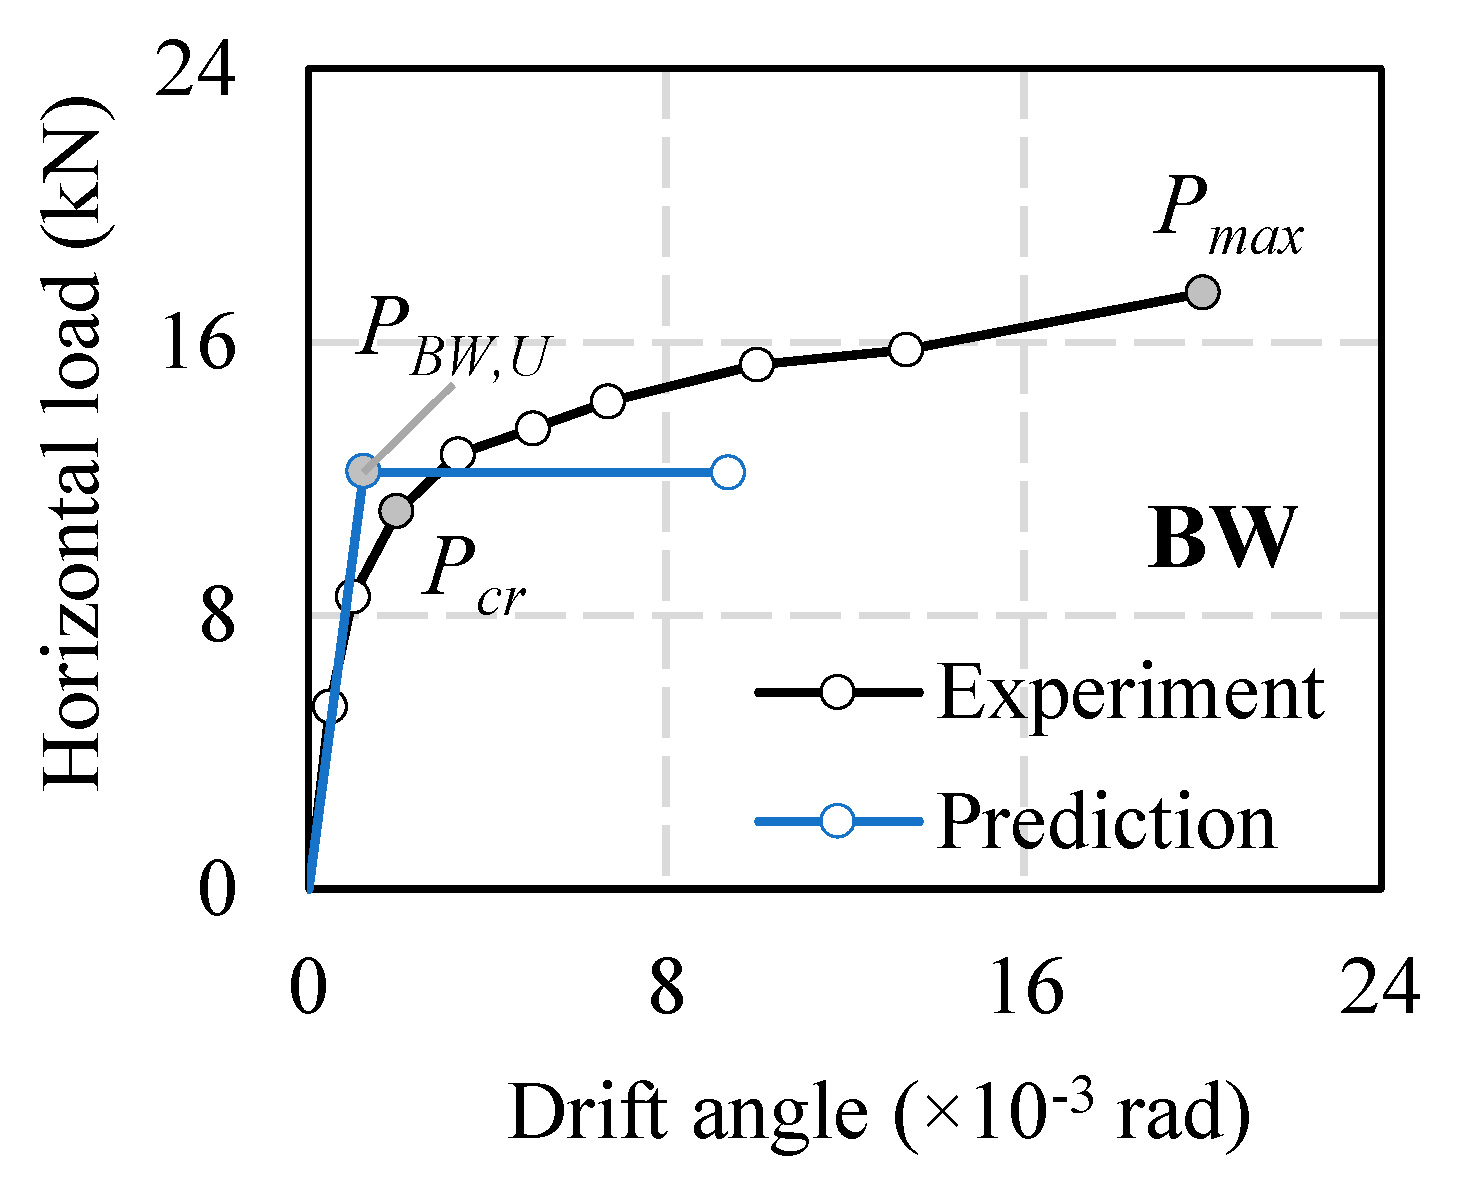
Considering the above conditions, the bi-linear predicted curves are compared to the experimental results, as illustrated in Figure 17. In this study, the flexural capacity is the minimum value of the predicted horizontal load. As shown in Figure 17, the predicted horizontal load (PBW,U) is 12.2 kN, while the load at the initial crack in the experiment (Pcr) is 11 kN. The predicted load represents the value obtained after the first crack appeared on the BW wall. Under cyclic load, unreinforced masonry walls have brittle behavior, and the BW wall was damaged along the initial crack when the pre-compression stress was low in our study. The assumption is considered reasonable. The initial stiffness obtained by Formula (4) and the experiment is almost the same value, with 10.21 kN/mm for Formula (4) and 8.9 kN/mm for the test. The mean initial stiffness of the experiment was determined by the horizontal load of the second cycle and the corresponding displacement. The shear modulus influences the slope of the initial stiffness (G). Material tests in this study show that the G/E ratio is the lowest value in Table 3, the low vertical loads. The drift is estimated from the flexural failure reported in Table 11 for the prediction deformation capacity. After the first cracks appeared in the experiment, the vertical displacement in the bottom corners of the BW wall increased. It indicates that the wall is already in a state of failure mode. Therefore, it is considered appropriate to limit the expected drift.
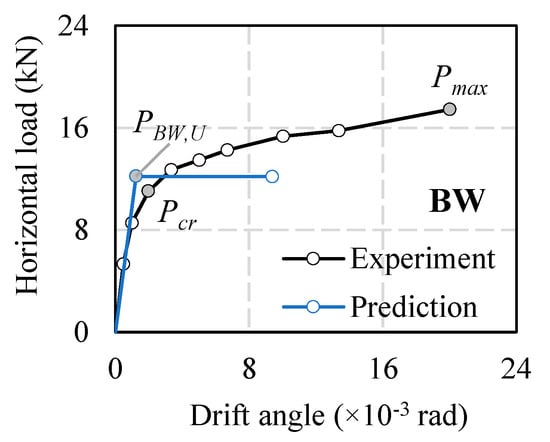
Figure 17.
Comparison curve of experimental and predicted results.
4.2. Reinforced Brick Masonry Wall (BW-TA Wall)
The reinforced brick wall’s shear capacity (PBW-TA) is the sum of the horizontal loads from the URM wall (PBW) and the timber wall (PTA).
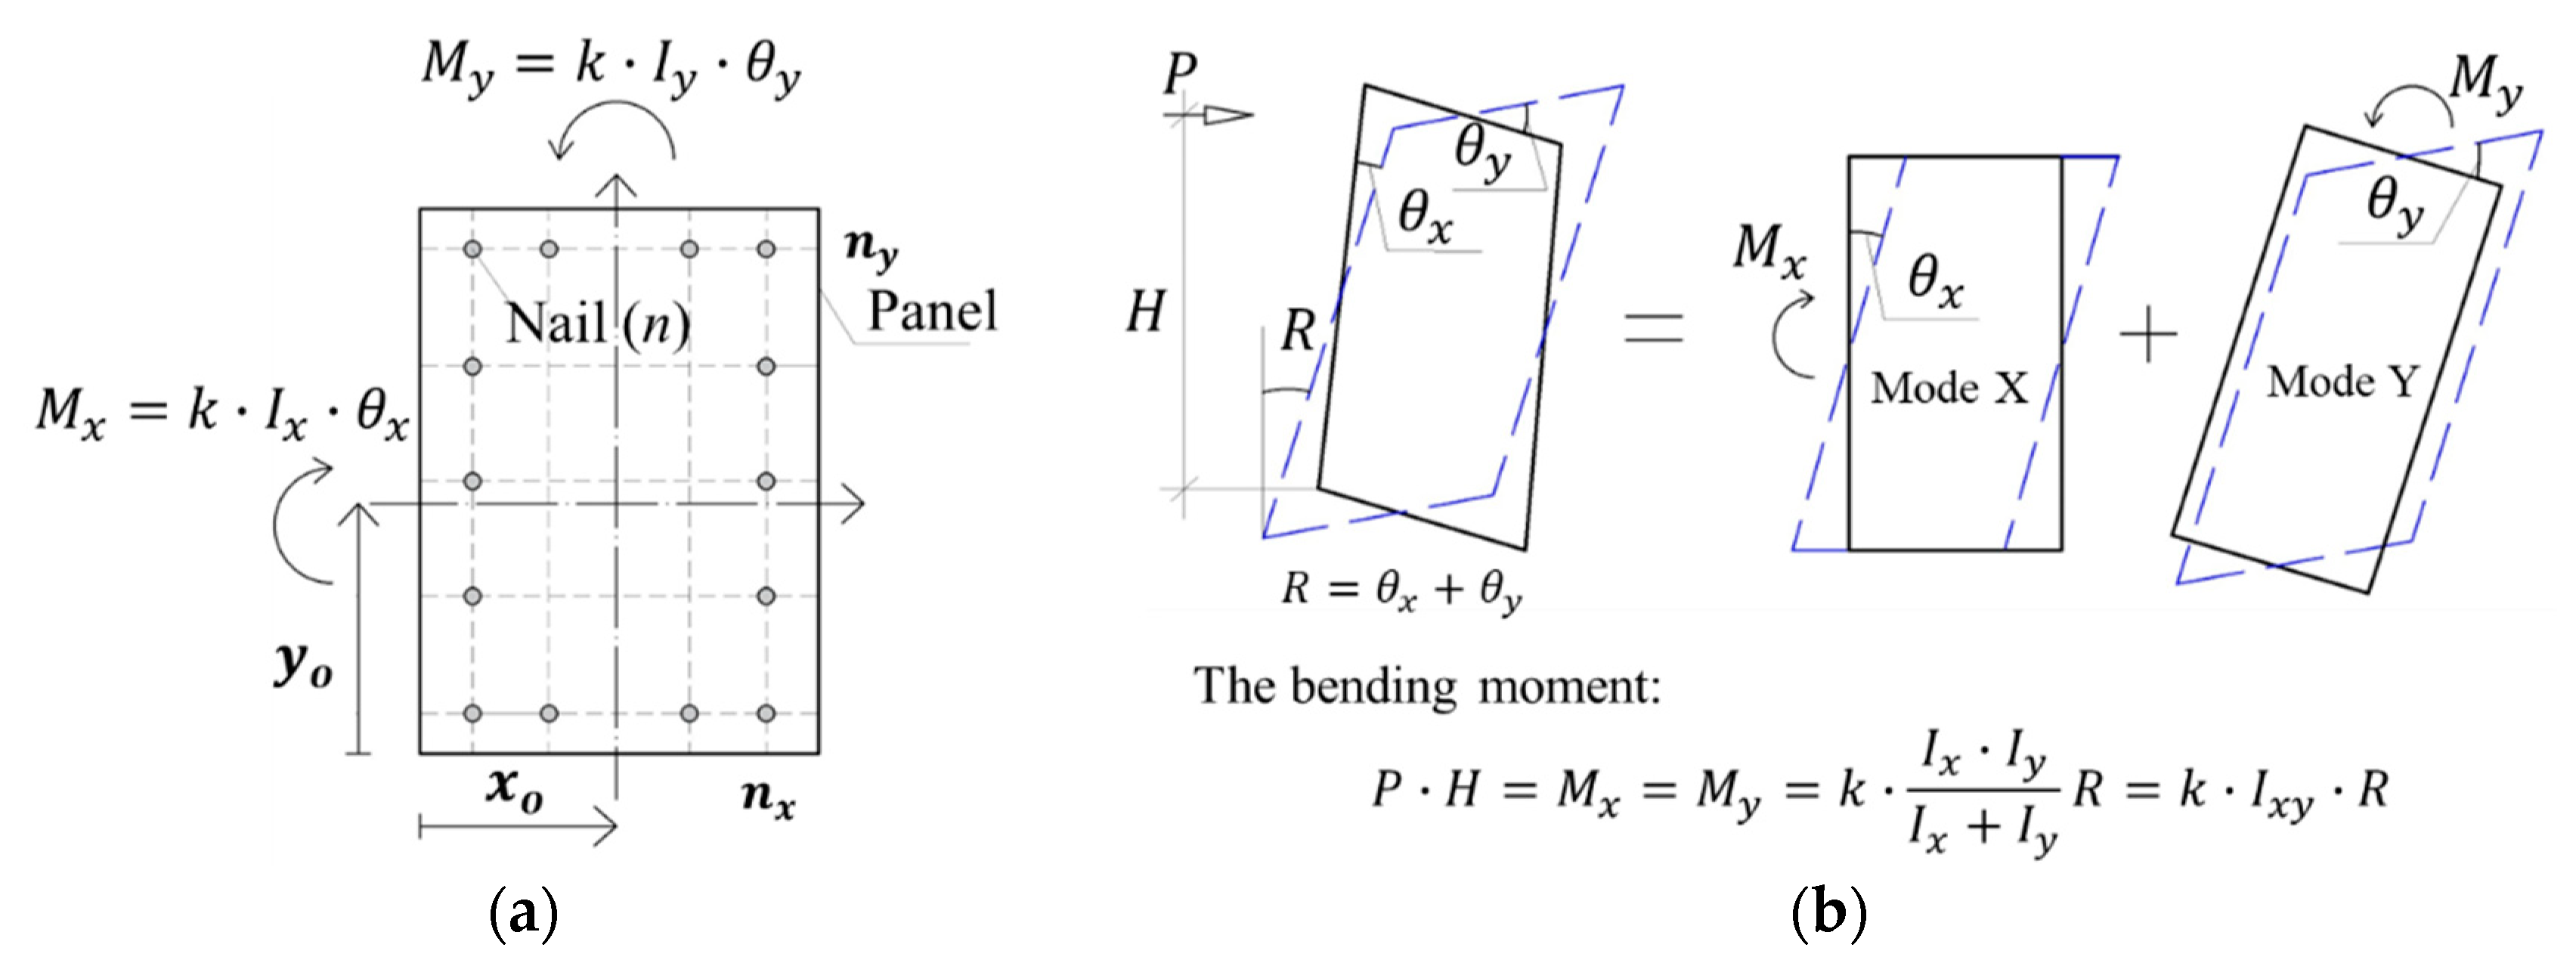
In this study, the timber wall is made out of a lumber frame, a plywood panel, and CN65 nails. The racking load is a horizontal load that acts on the nailed wall. There is a literature review [29,30] to predict the racking strength. In this study, the prediction calculation is used by the model of Kamiya and Inayama Murakami [31] in Figure 18. This prediction model shows the non-linear characteristics of the nailed wall. The model is assumed by the rigid body, and the rotational angles ( are in the X and Y axes when the pin-joint frame deforms into a parallelogram in Figure 18b. The rotational angles are defined by the equilibrium conditions of the moments in the X and Y axes (Mx = My) in Figure 18b.
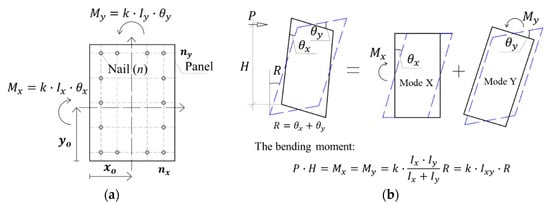
Figure 18.
Model of Kamiya and Inayama Murakami. (a) Coordinates of nails and moments acting on wall; (b) deformation shape by rotation.
The moment of resistance applies to each nail in the X and Y axes as a result of the horizontal load (P) acting on the wall. Therefore, the moment (P · H = Mx = My) from external and internal forces is assumed to be equal in Figure 18b based on the energy method. Table 12 shows the elastic stiffness, yield moment, plasticity ratio, and ultimate moment of the Kamiya and Inayama Murakami [31] model. The predicted yield displacement is determined by the ratio between the yield horizontal load and elastic stiffness. The predicted ultimate displacement is the yield displacement multiplied by the plasticity ratio shown in Table 12.
Table 12.
Parameters of Kamiya and Inayama Murakami model.
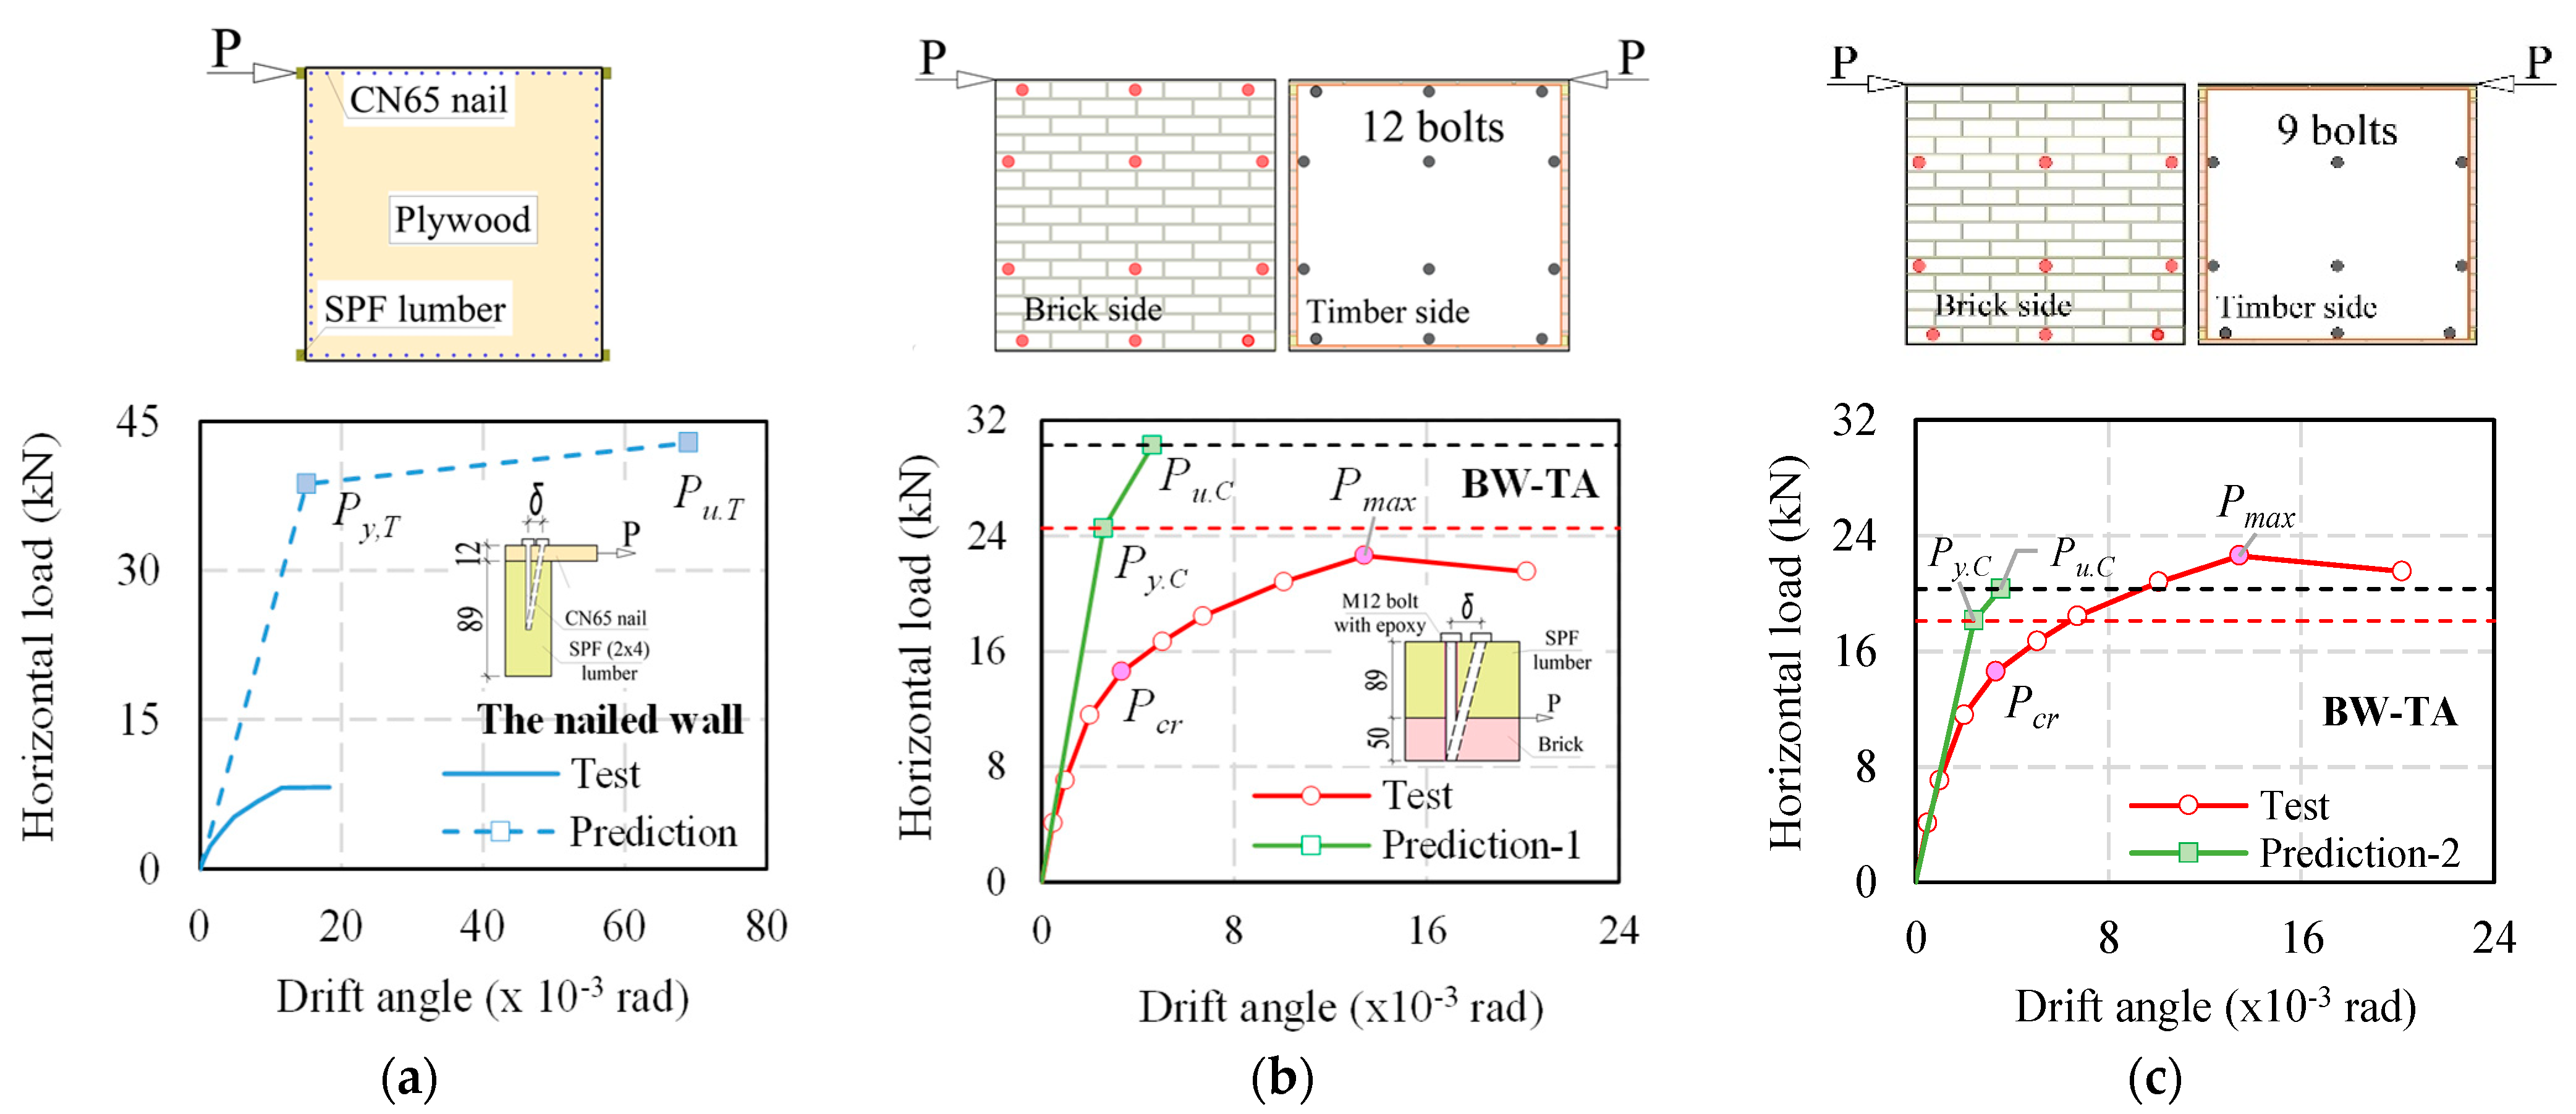
The nailed joint shear behavior shows perfect elasto-plasticity, and the shear values per CN65 nail are taken from the reference experimental results in Table 13 [32]. The timber wall prediction calculation is compared to the experimental result, as shown in Figure 19a. The yield and ultimate of the predicted timber are much higher than those of the experimental timber wall. However, the initial stiffness of a timber wall is 1.7 kN/mm for the experiment and 2.6 kN/mm for the prediction in Table 14. The prediction yield load of the nailed wall (Py,T) indicates up until the nails are distorted. During the BW-TA wall test, no damage to the wooden walls or nail joints was discovered. The load–drift angle curve of the timber wall shown in Figure 19a is determined from the BW-TA wall test load-drift angle curve. Therefore, it is assumed that the brick wall was already damaged, despite the fact that the nail joint was not deformed.
Table 13.
Shear values per CN65 nail.
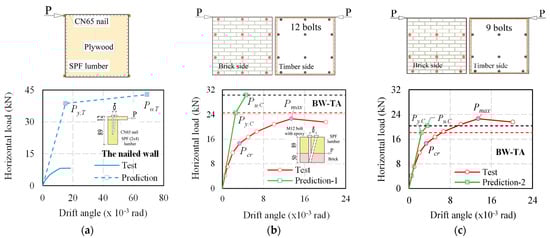
Figure 19.
The comparison results of the experimental and predicted load-drift curves. (a) Timber wall; (b) prediction-1 of the BW-TA wall; (c) prediction-2 of the BW-TA wall.
Table 14.
Comparison results of horizontal load and stiffness of walls.
The plywood was fastened to the lumber frame with nails. Similarly, M12 bolts with chemical adhesive were employed to attach the wood to the brick wall. Although the materials used in these cases are different, the overall structure of the walls remains the same. Connection calculations are important not only for the timber structures, but also for joint calculations between timber and brick walls. In this study, the Kamiya and Inayama Murakami model was used to predict the load–drift curve of the BW-TA wall. The BW-TA wall has 12 bolts (prediction-1) connected to the wood and brick wall in Figure 19b, and the horizontal load is applied to the top corner of the wall. Figure 9c shows the prediction-2 result, and the BW-TA wall is assumed to have 9 bolts. The crack pattern did not appear on the top three layers of the brick part, as illustrated in the failure scheme of the BW-TA wall. The effect of the upper three bolts on the masonry wall was not considered in prediction-2, and the panel size did not change because the effect of the upper nail on the timber wall is considered to be greater under the horizontal load.
Table 5 shows the material parameters required by the Kamiya and Inayama Murakami model to calculate the masonry wall using timber. The slip modulus (k), the ductility ratio, and yield load (ΔP) of the brick and timber joint were taken from the single shear test, and the shear modulus of the timber wall (GB = 17.1 kN/cm2) was estimated from the BW-TA wall’s experimental result.
Table 14 shows the comparison results between the experiment and the prediction of the BW-TA wall. The experimental yield load is assumed to be the load at the initial crack on the BW-TA wall, and the ultimate load is 90% of the maximum load in Table 14. The prediction-1 initial stiffness is 21% greater than the experimental stiffness. However, the prediction-1 yield horizontal load is 1.67 times higher than the test value, and the ultimate horizontal load is 33% greater than the experimental value. The prediction-2 result shows that the initial stiffness is 14.7% greater than the test value and the ultimate load is almost the same as the experimental value. The experimental value is 1.23 times greater than the yield horizontal load. When compared to prediction-1, the result of prediction-2 can give a reasonable value for the initial stiffness and ultimate horizontal load. It is assumed that the yield load and displacement are related to the solid body model. It means that the Kamiya and Inayama Murakami model indicates until the joint is deformed and is not considered brick–mortar sliding. The BW-TA wall failure showed that vertical cracks appeared on the bricks when the horizontal load was reaching its maximum load. The BW-TA wall test ended with brick cracks. The ductility ratio in the prediction calculation could not show a suitable value. Low ultimate displacement is presented for BW-TA wall in Figure 19. In that case, the brick–mortar slip effect did not consider in the prediction calculation.
5. Conclusions
The study used timber to improve the in-plane shear strength under cyclic horizontal load by the retrofitting method of the single-leaf brick masonry wall. Three types of walls were tested: a brick wall (BW wall), a reinforced brick wall with timber (BW-T wall), and a reinforced brick wall with timber including a hold-down anchor (BW-TA wall). The results of the experimental walls were compared to the proposed analytical method. During the cyclic horizontal load, displacements of all walls were measured in horizontal, vertical, and diagonal directions, and the shear deformation was obtained from each measurement and compared. The proposed strengthening technique has the advantages of being light-weight, cost-effective, and easy to assemble. Timber with a hold-down anchor is an effective retrofitting solution to enhance the in-plane shear strength and the shear deformation of the masonry wall.
The BW and BW-T walls failed in the rocking mode due to achieved flexural resistance due to low pre-compression load. The prediction of BW wall can give a reasonable initial stiffness as well as an ultimate horizontal load. The BW-T wall exhibited the same characteristics as the BW wall. However, the timber panel of BW-T wall can keep the original shape of the brick wall.
The BW-TA wall failed due to diagonal compression failure under cyclic horizontal load. The initial stiffness of a BW-TA wall is the same as for BW and BW-T walls. The connection between brick and timber wall (BW-TA and BW-T) shows high stiffness because of no failure on the joint, bolt, and timber material. When compared to the BW wall, the horizontal load of the BW-TA wall was increased by 22% at maximum load. The hold-down anchor can decrease the vertical tensile cracking of the BW-TA wall. The drift angle defined by diagonal measurement of BW-TA wall was increased by 4.6 times greater compared to BW-T wall. The proposed theoretical method (Kamiya and Inayama Murakami model) has shown good matching in results by determining the initial stiffness and the ultimate horizontal load of the BW-TA wall.
In the future, the pre-compression stress and the number of specimens need to increase. In the prediction calculation, it is necessary to approximate the values of the yield load and the in-elastic stiffness. This study will also contribute to the numerical analysis of the reinforced brick wall with timber.
Author Contributions
Conceptualization, methodology, data curation, writing–original draft preparation A.G., T.M., S.M. and R.I.; supervision, writing–review and editing T.M. All authors have read and agreed to the published version of the manuscript.
Funding
This research received no external funding.
Institutional Review Board Statement
Not applicable.
Informed Consent Statement
Not applicable.
Data Availability Statement
Not applicable.
Acknowledgments
The authors thank MJEED (Mongol-Japan Higher Engineering Education Development Project) for supporting this study.
Conflicts of Interest
The authors declare no conflict of interest.
References
- Rahman, A.; Ueda, T. In-Plane Shear Performance of Masonry Walls after Strengthening by Two Different FRPs. J. Compos. Constr. 2016, 20, 04016019. [Google Scholar] [CrossRef] [Green Version]
- Tomaževič, M. Shear Resistance of Masonry Walls and Eurocode 6: Shear versus Tensile Strength of Masonry. Mater. Struct. 2009, 42, 889–907. [Google Scholar] [CrossRef]
- Vlachakis, G.; Vlachaki, E.; Lourenço, P.B. Learning from Failure: Damage and Failure of Masonry Structures, after the 2017 Lesvos Earthquake (Greece). Eng. Fail. Anal. 2020, 117, 104803. [Google Scholar] [CrossRef]
- Wang, C.; Sarhosis, V.; Nikitas, N. Strengthening/Retrofitting Techniques on Unreinforced Masonry Structure/Element Subjected to Seismic Loads: A Literature Review. Open Constr. Build. Technol. J. 2018, 12, 251–268. [Google Scholar] [CrossRef] [Green Version]
- Konthesingha, K.M.C.; Masia, M.J.; Petersen, R.B.; Page, A.W. Experimental Evaluation of Static Cyclic In-Plane Shear Behavior of Unreinforced Masonry Walls Strengthened with NSM FRP Strips. J. Compos. Constr. 2015, 19, 04014055. [Google Scholar] [CrossRef]
- Banerjee, S.; Nayak, S.; Das, S. Seismic Performance Enhancement of Masonry Building Models Strengthened with the Cost-Effective Materials under Bi-Directional Excitation. Eng. Struct. 2021, 242, 112516. [Google Scholar] [CrossRef]
- Giaretton, M.; Dizhur, D.; Garbin, E.; Ingham, J.M.; da Porto, F. In-Plane Strengthening of Clay Brick and Block Masonry Walls Using Textile-Reinforced Mortar. J. Compos. Constr. 2018, 22, 04018028. [Google Scholar] [CrossRef]
- Lucchini, A.; Mazzucchelli, E.S.; Mangialardo, S.; Persello, M. Façadism and CLT technology: An innovative system for masonry construction refurbishment. In Proceedings of the 40th IAHS World Congress on Housing, Funchal, Portugal, 16–19 December 2014. [Google Scholar] [CrossRef]
- Sustersic, I.; Dujic, B. Seismic Strengthening of Existing Concrete and Masonry Buildings with Crosslam Timber Panels. In Materials and Joints in Timber Structures; Aicher, S., Reinhardt, H.-W., Garrecht, H., Eds.; Springer: Dordrecht, The Netherlands, 2014; pp. 713–723. ISBN 978-94-007-7810-8. [Google Scholar]
- Guerrini, G.; Damiani, N.; Miglietta, M.; Graziotti, F. Cyclic Response of Masonry Piers Retrofitted with Timber Frames and Boards. Proc. Inst. Civ. Eng.-Struct. Build. 2021, 174, 372–388. [Google Scholar] [CrossRef]
- Maduh, U.J.; Shedde, D.; Ingham, J.; Dizhur, D. In-Plane Testing of URM Wall Panels Retrofitted Using Timber Strong-Backs. In Proceedings of the Australian Earthquake Engineering Society 2019 Conference, Newcastle, Australia, 29 November–1 December 2019; p. 13. [Google Scholar]
- Dizhur, D.; Giaretton, M.; Giongo, I.; Ingham, J. Seismic Retrofit of Masonry Walls Using Timber Strong-Backs. SESOC J. 2017, 30, 30–44. [Google Scholar]
- Giongo, I.; Rizzi, E.; Riccadonna, D.; Piazza, M. On-Site Testing of Masonry Shear Walls Strengthened with Timber Panels. Proc. Inst. Civ. Eng.-Struct. Build. 2021, 174, 389–402. [Google Scholar] [CrossRef]
- Miglietta, M.; Damiani, N.; Guerrini, G.; Graziotti, F. Full-scale Shake-table Tests on Two Unreinforced Masonry Cavity-wall Buildings: Effect of an Innovative Timber Retrofit. Bull. Earthq. Eng. 2021, 19, 2561–2596. [Google Scholar] [CrossRef]
- Iuorio, O.; Dauda, J.A. Retrofitting Masonry Walls against Out-Of-Plane Loading with Timber Based Panels. Appl. Sci. 2021, 11, 5443. [Google Scholar] [CrossRef]
- Busselli, M.; Cassol, D.; Prada, A.; Giongo, I. Timber Based Integrated Techniques to Improve Energy Efficiency and Seismic Behaviour of Existing Masonry Buildings. Sustainability 2021, 13, 10379. [Google Scholar] [CrossRef]
- Ganbaatar, A.; Mori, T.; Inoue, R.; Danzandorj, S. Strength Performance of the Connection between Brick and SPF Lumber. Buildings 2022, 12, 465. [Google Scholar] [CrossRef]
- Architectural Institute of Japan. Standard for Structural Design of Timber Structures; Architectural Institute of Japan: Tokyo, Japan, 2002. [Google Scholar]
- CEN 1052-3; Methods of Test for Masonry—Part 3: Determination of Initial Shear Strength. European Standard; European Committee for Standardization: Brussels, Belgium, 2002.
- ASTM C1314-18; Test Method for Compressive Strength of Masonry Prisms. American Society for Testing and Materials (ASTM): West Conshohochen, PA, USA, 2018.
- CEN Eurocode 6-EN 1996-1-1; Design of Masonry Structures-Part 1-1: General Rules for Reinforced and Unreinforced Masonry Structures. European Committee for Standardization: Brussels, Belgium, 2005.
- Wilding, B.V.; Beyer, K. Prediction of stiffness, force and drift capacity of modern in-plane loaded URM walls: Vorhersage von Steifigkeit, Festigkeit und horizontaler Verformungskapazität von unbewehrten Mauerwerksscheiben. Mauerwerk 2018, 22, 77–90. [Google Scholar] [CrossRef]
- Turnšek, V.; Čačovič, F. Some Experimental Results on the Strength of Brick and Block Masonry Walls. In Proceedings of the 2nd International Brick and Block Masonry Conference, Stoke-on-Trend, UK, 12–15 April 1971; pp. 149–156. [Google Scholar]
- Elghazouli, A.Y.; Bompa, D.V.; Mourad, S.A.; Elyamani, A. In-Plane Lateral Cyclic Behaviour of Lime-Mortar and Clay-Brick Masonry Walls in Dry and Wet Conditions. Bull. Earthq. Eng. 2021, 19, 5525–5563. [Google Scholar] [CrossRef]
- Kišiček, T.; Stepinac, M.; Renić, T.; Hafner, I.; Lulić, L. Strengthening of Masonry Walls with FRP or TRM. JCE 2020, 72, 937–953. [Google Scholar] [CrossRef]
- Miha, T. Earthquake-Resistance Design of Masonry Buildings; Imperial College Press: London, UK, 1999; Volume I, ISBN 1-86094-066-8. [Google Scholar]
- Messali, F.; Esposito, R.; Ravenshorst, G.J.P.; Rots, J.G. Experimental Investigation of the In-Plane Cyclic Behaviour of Calcium Silicate Brick Masonry Walls. Bull. Earthq. Eng. 2020, 18, 3963–3994. [Google Scholar] [CrossRef] [Green Version]
- CEN Eurocode 8-EN 1998-3; In Design of Structures for Earthquake Resistance-Part3: Assessment and Retrofitting of Buildings. European Committee for Standardization: Brussels, Belgium, 2005.
- Tuomi, R.L.; McCutcheon, W.J. Racking Strength of Light-Frame Nailed Walls. J. Struct. Div. 1978, 104, 1131–1140. [Google Scholar] [CrossRef]
- McCutcheon, W.J. Racking Deformations in Wood Shear Walls. J. Struct. Eng. 1985, 111, 257–269. [Google Scholar] [CrossRef]
- Architectural Institute of Japan. Fundamental Theory of Timber Engineering; Architectural Institute of Japan: Tokyo, Japan, 2010. (In Japanese) [Google Scholar]
- Architectural Institute of Japan. Allowable Stress Design of Wooden Framed Houses 1; Architectural Institute of Japan: Tokyo, Japan, 2017. (In Japanese) [Google Scholar]


Publisher’s Note: MDPI stays neutral with regard to jurisdictional claims in published maps and institutional affiliations. |
© 2022 by the authors. Licensee MDPI, Basel, Switzerland. This article is an open access article distributed under the terms and conditions of the Creative Commons Attribution (CC BY) license (https://creativecommons.org/licenses/by/4.0/).