Abstract
The research agenda on smart cities has increasingly extended not only on perspectives of social–economic relations between technologies and cities but also on the industrial economic ecosystem. The purpose of this study is to focus on an analytical method for the characteristics of a smart city’s ecology and industry. With that thought, we have developed a smart SPIN (Spectrum, Penetration, Impact and Network) model and applied it to analyze the ecology of the Korean smart city industry in general. This model consists of smart spectrum model, smart penetration model, smart impact path model and smart network clustering model. The smart SPIN model shows great potential as an analytical method for the smart city industry ecosystem. As a source of data for analyses from 1960, 1985 and 2015 via input–output table, we revised these data into 25 and 8 industries related to the smart city ecosystem. Additionally, we applied the 2015 GDP deflator. The results of analysis are as follows: First, spectrum, the number of smart industries is increasing. This means that the smart city industry scope and area are expanding. Second, analysis of the smart penetration model and smart ecological industry can be applied into other industries. In other words, traditional industries can crossover and utilize smart technology. Third, with the results of our analysis of the smart impact path model, production paths are increasing while parameter paths did not show a triple parameter path. This means the value chain of the smart city industry is highly divested, but the structure of the industry is weakening. Fourth, smart network analysis shows important clusters to be centered on traditional industries: the clusters do not appear in smart industry centers. This means the impact of the smart city is not strong. Our analysis shows that, today, the Korean industrial ecosystem of smart cities is interacting with existing industries and raising it to a more intelligent and smarter level. Thus, there is a need for this kind of analysis study in order to find optimized smart city industry ecosystem.
1. Introduction
The World Economic Forum has stated that the most important issue in the world at present is the fourth Industrial Revolution (IR) and the Industrial Internet of Things (IIoT) [1]. The fourth IR and IIoT will accelerate IT convergence with existing sustainable businesses and industries along with hyper-connected societies while expecting to create a new business model [2]. From a sustainable perspective, there have been various city models convergent with information and communication technologies, and ecology technologies such as resilience city [3], u-eco city [4], smart city [5] and floating city [6]. Smart city is one such model. It is a burgeoning area matching the fourth IR. Smart cities can be applied as a model to solve existing urban problems while simultaneously creating a brand new industry. In general, smart cities have a special role in managing the physical infrastructure of the city [7]. They utilize communication technology for transportation, supply, electricity, sewage, water supply and management. This technology is then embedded in the cities, such as mobile and sensor networks, which can be controlled through wireless technology and monitored through communication with personal devices linked with building sensors [8]. Smart cities give us a new paradigm in which urban areas can converge with communication technology [9]. They join various technologies and industries such as knowledge, construction and energy. Through this, they implement a smart economy, smart environment, smart mobility, and therefore, a smart life [8,10].
The ecosystem of the smart city industry works closely with the ecology of technology and the corporate ecosystem [11]. Smart cities settle in as an important concept as well as a paradigm in industrial ecosystem aspects and technological ecosystems [12]. Consequently, there have been more studies on the ecology of smart cities recently. Typically, studies have focused on smart city industrial ecosystems [10,12], smart city governance ecosystem [13,14], smart city service and technology ecosystems [15,16,17] and smart city data management ecosystems [18,19]. The study aims to clarify the concepts of enterprise architecture, big and open linked data analytics and smart city and how they are related to each other [18]. The research draws on orchestration to address multi-layer tensions in smart city data ecosystems and present a case study of London’s city data ecosystem between 2017 and 2019 [19].
However, most studies are discursive in nature, structured on the smart city’s concept to measure economic efficiency rather than the empirical means to focus on its industrial mechanisms. There are some empirical studies, but they suffer from the limits of the analysis methodology and fragmented data on the ecosystem of the smart city industry. Most analyses of empirical studies evaluate the smart city industry ecosystem through a piecemeal approach due to analytical limitations and focus on a part of the smart city industry’s ecological framework. Most empirical studies on a smart city’s industry have utilized input–output tables. Most studies have been centered around economic impact such as forward linkage effect, backward linkage effect and multiplier effect [20,21,22,23]. In this study, the economic ripple effect of smart city construction was investigated through the cases of Dongtan city and Seoul city using regional input–output tables [20,22]. Jeong’s study calculated the effect of smart city development on the entire industry [21]. There is a study that classifies the industry and analyzes the ripple effect by viewing the Internet of Things technology as a smart city industry [23].
Recently, these studies have added importance to the value chain in the industrial ecosystem using structural path analysis with input–output tables [10,12]. Analyzing clusters is important while performing industrial ecosystem analysis. Industry clusters help strengthen local regional economic structures and internal growth agents and positively develop the local economy through technology and knowledge promotion [24]. Distinguishing the industry cluster helps prioritize industry value chain partners as well as decision-making for industry policies [25]. Despite this, studies on the industrial clusters related to the smart city industry still have much work to do. From this viewpoint, current studies utilize a methodology that considers the relationship between industrial clusters and smart city industries to study the ecosystem of the industry. As a result, this study aims to develop an analytical model for the smart city ecosystem and apply it to case studies on changes in the Korean smart city industry and ecosystem. The introduction of different empirical approaches through the smart SPIN model can provide better insight and understanding of how smart city capital and capacity can structurally shape industrial convergence outcomes within an economic context.
The remainder of this study is structured as follows. In Section 2, we show the theoretical background and previous studies for the identification of smart city industry ecosystem in the economy. Section 3 presents the smart SPIN model and data analysis for a detailed methodological framework that enables us to quantify the smart sector’s influence on the whole industry in terms of smart city. Discusses implications that derive from the results and concludes the paper in Section 5, while Section 6 presents the policy remarks and recommendations for future research. By analyzing the ecosystem of the smart city industry, this study will be able to know what industries need to be strengthened in the era of the fourth Industrial Revolution and the policy direction of the industry can be suggested.
2. Literature Review
2.1. Smart City Industry
Defining the industry scope has become difficult because of the development of communication technology, acute competition at the global level and fast integrated, converging technology [26]. The trend of the smart city industry has not been clearly defined as a result of the conversion of science and technology. The growth of science and technology integration has slowed down as well. Therefore, this study attempted to define the smart city industry through related literature and case studies. Case studies related to the smart city industry building technology were also considered.
Early studies on the definition of the smart city industry were classified diversely according to the respective researchers’ study objectives and subjective opinions. Cho et al. [27] analyzed the Korean smart city industry to determine its national economic impact. They reclassified the smart city industry into 15 industry categories. These categories consist of larger groups regarding personal life (5), mechanical devices (7) and public administration and services (3).
Jeong [21] classified the following as smart city industries: communication, broadcasting, visual and sound devices, transport facility, construction, other business services, education institute, culture and entertainment services. Lim et al. [22] studied the Seoul case to suggest smart city policy directions. They defined the smart city industry as having two parts: infrastructure and utilization. They categorized the smart city industry into eight wide classifications such as electric and electronic devices, construction, real estate, business services and so on.
Kim et al. [23] looked into the supply and demand of sensors for the Internet of Things (IoT). Simultaneously, they utilized the Delphi method to analyze the relationship between IoT sensors and the smart city industry. This study has reclassified the smart city industry into 30 small categories, based on the converging characteristics of science and technology. It aimed to verify the reclassification of the smart city industry and traditional industry by analyzing existing literature. The smart industry is reclassified and built on information and communication technology (ICT), as well as software and hardware. In contrast, the traditional industry is reclassified as the construction industry and public administration services industry, the former being a definitive classification. As we have noted previously, smart cities are integrated not only in the construction industry but also in the service and manufacturing industries as well.
Overall, research on smart city industry classification has been conducted in consultation with smart city experts and the smart city industry has been classified differently according to the smart city concept definition. According to the previous research, the smart industry was classified into IT manufacturing (e.g., computer, and electronic and electricity equipment), IT service (e.g., communication, S/W and broadcast) and knowledge service (e.g., education, health and welfare, culture and sports). In order to define the smart industry, this study identified the main technologies applied to the smart city through the smart-x case such as smart car [28], smart building [29], smart farm [30] and smart factory [31]. This smart-x industry expects production to grow exponentially by 2026 [32,33,34,35].
The following procedure was performed to connect the technology and services of the smart-x case with the industry. (1) The elements constituting the smart-x case such as service, technology and infrastructure were identified. (2) Technology and industry were reconnected based on the Harmonized Classification System of ICTs developed by TTA (Telecommunications Technology Association) in South Korea. The linked industries were finally applied to the Bank of Korea’s input–output table.
Therefore, this study overcame the limited industry classification to define smart city industry classification: technology derived from the cases of smart cars, smart buildings, smart factories and smart farms. We focused on the technology and mapping through the input–output table approach as an acceptable method for industry classification [12]. The smart-x industry had 20 common industries classified as IT manufacturing, IT services and knowledge services (See the Appendix A, Table A1).
In our study, smart industry is defined as: IT manufacturing (semiconductor manufacturing, electronic display manufacturing, printed circuit board manufacturing, other electronic components manufacturing and computers and peripherals manufacturing); IT service (information service, software development supply services and communication and so on); knowledge service (research and development, building and civil engineering services, scientific and technical services and so on). In other words, all industries other than the smart industry are classified as traditional industries. For this study, we defined smart city industry as the conversion of the smart city industry with traditional industries (Figure 1).
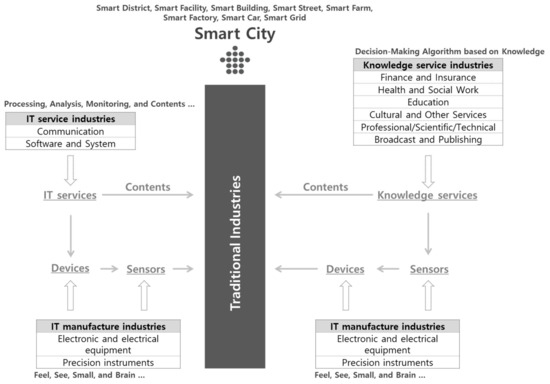
Figure 1.
Concept of the smart city focused on industries.
2.2. Industrial Ecosystem of Smart City
2.2.1. Theory of Ecosystem
The word ‘ecosystem’ has been used in various fields such as industry ecosystem, business ecosystem, innovation ecosystem and urban ecosystem. Industries began discussing the key concepts of the ecosystem where the materials and energy flow effectively match [36]. Additionally, the industry value chain labor division started to increase the interdependency between business and industry. This discussion was activated as a base requirement. Research on the industry ecosystem started with Ayres in 1989. When he studied the environment and industry, he discovered industrial metabolism and related studies. Tibbs [37] focused on the harmony between industry and the natural ecosystem to help one understand the basic mechanisms of the natural ecosystem.
The industrial ecosystem (industrial value chain) in the business ecosystem focuses on the relationship between enterprises [38]. The industrial value chain is an industrial and economic concept based on technical and economic relationships between industries [39]. The industry ecosystem in the innovation ecosystem is shaped by the relationships among performers (material resources, human resources) and entities (institute systems) [40]. It is differentiated from the research economy and commercial economy as well as innovation ecosystems based on the energy circle. The urban ecosystem recognizes a city as an ecological unit and it analyzes the material and energy circle aspects. It regulates the various inputs and outputs: if the strength of the metabolism increases, the inputs and outputs increase. When there is a mismatch between input and output in the urban ecosystem, it is necessary to intervene from the external environment to balance the ecosystem. We should comprehend a city as a system and attempt to match the theological structure. In order to understand the urban ecosystem, one should know that a city is alive and can be interacted with as a system. Thus, we need a comprehensive and macro perspective on the urban ecosystem.
To summarize, the theoretical framework of the ecosystem for the study is as follows: (1) ecosystems converge on the defined keyword of interaction; (2) economic, industrial, technical perspectives and ecosystems accommodate a new thing appearing to characterize and increase its scope and territory; (3) an ecosystem has the characteristics to create new value through convergence between technologies and businesses; and (4) optimal ecosystems can be made and characterized by forming clusters integrated among different industries [12].
2.2.2. Previous Study of Smart City Industrial Ecosystem
Studies of smart city industrial ecosystems have seen little research and progress worldwide. Most representative and qualitative research studies such as system architecture design and governance establishment were on smart city ecosystems [19,41,42,43] and smart city innovation ecosystems [44], whereas quantitative studies were on the changes of smart city industry convergence [10,12,44].
The study by Abella et al. [41] presented the continuous reuse of data, which are produced, collected, processed, treated and circulated from smart cities. This produced an ecosystem model that created new value. This data ecosystem model consists of three stages. The first stage is framed to validate the reuse of open data. The second stage utilizes value created by continuous reuse of open data. The third stage is economic and social value creation based on the first and second stages. This study builds a staged smart city data ecosystem and provides smart city services according to citizens’ practical needs.
Gupta’s [19] study performed a smart city data ecosystem of the orchestration governance direction through the London case study. This form of governance has zeroed-in on openness, diffusion and sharing. He asserted that the openness of archives has decreased the duplication of administration and, at the same time, maximized efficiency when technique and organization have had flexible systems. Diffusion was also implemented through innovative organization based on literacy. In other words, it needed capable organization to obtain information and power to understand the information. He claims that sharing ownership was based on co-work at public institutions in London.
Ahlers et al. [42] presented a system architecture for an IT-oriented smart city ecosystem. Its architecture aims to integrate systems with the multiple stakeholders that operate and manage smart cities. In addition, it is a supporting system that can be easily replicated into other smart city projects. This architecture will investigate the influences of the energy transition into urban management and planning, the integration of eMaaS (e-Mobility as a service) into positive energy communities and the growth of local trading markets and new business models [42].
Linde et al. [43] provide insight into how to develop dynamic capabilities to innovate the smart city industry ecosystem. The dynamic functions are configuring ecosystem partnerships, value proposition deployment and governing ecosystem alignment. This study offered insights into the specific micro-foundations or seizing and reconfiguring capabilities, which are necessary to orchestrate ecosystem innovation through a multiple case study of smart city initiatives [43].
Kim et al. [44] focused on the activation of smart city innovative ecosystems. They argue that the smart city innovation ecosystem defines a view of traditional cities combined with the Korean smart city model. The study proposed a framework on smart city innovative ecosystems, consisting of six key points: physical resource; virtual assets; human resource; economic assets; governing system; and socio-culture. Additionally, they suggested ways to activate smart-city-related businesses and analyzed the smart city innovative ecosystem centered around the six key points.
The study by Jo and Lee [10] defined smart city industry as consisting of IT manufacturing, IT services and construction based on knowledge services. Data for this study used input–output tables from the years 1980 and 2012. This study focused on analyzing qualitative change, quantitative change and conversion change in the smart city industry ecosystem. The results of analysis and the smart city industry were growing from both the qualitative and quantitative points of view. The smart city industry is led by conversion changes, which the analysis revealed to be a central force for strengthening the ecosystem. However, when we examine industrial perspectives in general, traditional industries show greater conversion changes than the smart city industry. Traditional industries are leading changes in conversion, which means smart cities are still at the beginning stage in Korea.
Jo et al.’s study analyzed how the ecosystem of the smart city industry is changing from a sustainable perspective. This study used the input–output model and structural path analysis. The analysis data are input–output tables from 1960 to 2015. As a result of the analysis, it was confirmed that the smart city industry is replacing other industries in the overall industry structure and creating a new value chain [12].
Most of the existing research has been limited to qualitative research such as system development and design and governance establishment. Quantitative research in industrial and economic aspects was analyzed using the input–output model and the structural path analysis and has limitations that cannot deviate from the analysis of input–output coefficients and multiplier coefficients. Therefore, this study developed a smart SPIN model based on the input–output model, structural path analysis and network analysis methods to develop and apply a new methodology that is different from existing studies.
3. Research Model and Data
3.1. Development of a Smart SPIN Model for Analyzing the Industrial Ecosystem in Terms of Smart Cities
This study developed a new analytical method: smart SPIN model. The smart SPIN model formulation uses data from input–output tables and consists of four models: smart spectrum model (SSM), smart penetration model (SPM), smart impact path model (SIM) and smart network clustering model (SNM). Our smart SPIN model was formulated by fixing and upgrading (as well as integrating) existing analytical tools. In order to understand the smart SPIN model, it is necessary to understand models such as the input–output model [45], structural path analysis [46] and social network analysis [47].
The outline for understanding the model is as follows. First, the new interpretations of the input–output model are SSM and SPM. Analysis using the existing input–output model focuses on measuring the ripple effect using the multiplier coefficient such as employment inducement effect, income inducement effect and value-added inducement effect. However, it is not suitable for analyzing the ecosystem characteristics of industries, such as the expansion of the industrial scope and the analysis of inter-industry convergence.
Therefore, in this study, a smart spectrum model was presented as a model to analyze how much scope the smart industry has. In addition, a smart penetration model was developed to measure how much the smart industry penetrates (or converges) into the traditional industry and the smartization of the traditional industry. Second, this study presented a SIM that reinterpreted structural path analysis in a macroscopic dimension. As described in the literature review, studies using the existing structural path analysis are limited as they focus on finding new paths and extinct paths. In other words, it is difficult to find the characteristics of the industry creating a new value chain. Therefore, this study focused on the smart industry and analyzed the macroscopic smart city industry ecosystem called the industrial value chain through the total number and pattern of industrial paths. In particular, this model can analyze industry intervention paths that have not been analyzed in other studies. This is an analysis of how important the smart industry is among other industries. Third, we developed a SNM. This is an application of the existing network analysis. Existing network analysis focuses on the study of industry centrality indicators. Analysis using centrality can confirm the relationship between industries, but there is a limit to finding clusters between industries. This study presented a method that enables clustering based on the existing network analysis. The smart SPIN model presented in this study can be developed by interpreting the existing model from a new perspective, focusing on the smart city industry rather than focusing on various industries. Detailed smart SPIN modeling is given in Figure 2.
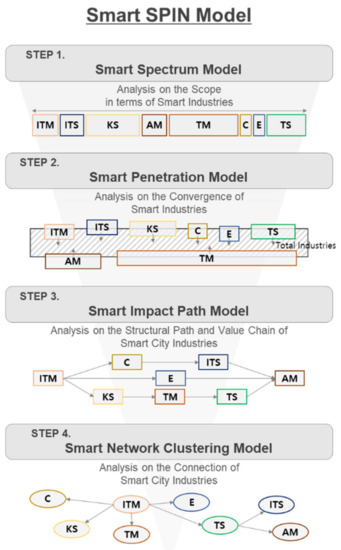
Figure 2.
Concept of the smart SPIN model.
3.1.1. Smart Spectrum Model
The smart spectrum model can analyze the scope of the smart industry in its ecosystem. The scope of smart industries is the sum of the number of smart industries among whole industries in input–output tables (See Figure 3). The scope of the smart city industry is analyzed by the sum of the number of industries (Equation (1)). The model shows how many smart industries are within the nation’s industries.
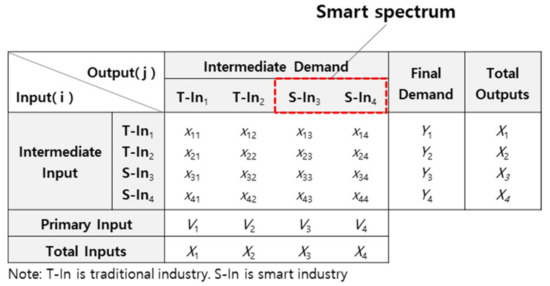
Figure 3.
Example of the calculation of the smart spectrum.
- : smart spectrum;
- : industry placed in rows in the input–output table;
- : total number of whole national industries.
3.1.2. Smart Penetration Model
Smart penetration model is calculated as a technical coefficient (input–output coefficient, see Figure 4). This model is able to analyze smart input and the level of conversion. The smart penetration model can be written as Equation (3). It has been analyzed through a technical coefficient. The smart industry input means that when all industries produce one unit of production, it shows the smart city industry’s input by measuring a portion of smart industry revision compared to traditional industries.
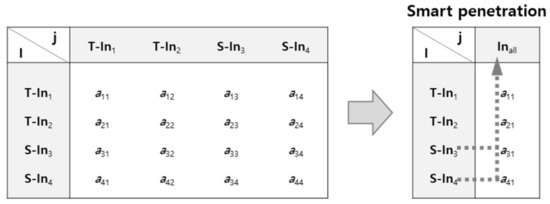
Figure 4.
Example of the calculation of the smart penetration.
- : smart penetration;
- : technical coefficient;
- : industry that appears in a column in the input–output table;
- : total number of whole national industries.
3.1.3. Smart Impact Path Model
The smart impact path model is a tool to analyze the production paths and intervention paths. Here, we analyze smart production paths as measured by two indicators: the number of smart production paths and the number of production-type paths. The smart production paths are the sum of paths shown in the evaluation of structure paths. Smart production path analysis is able to see production triggers. More paths in the smart production path means a stronger link in the value chain (Equation (5), Figure 5).
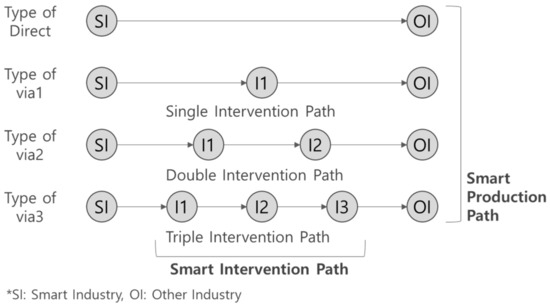
Figure 5.
Concept of analysis for the smart production path and the smart intervention path.
- : smart production path;
- : production path in the industry structural path;
- : total number of production paths;
- : smart industries;
- : other industries.
There are four types of production-type paths. They are direct, via1, via2 and via3 types. Direct refers to no stopping in the middle; this type goes direct. Via1 is a path from the beginning; there is one industry at the beginning and another industry before the last industry. Via2 means there are two different industries to get the last industry. Via3 means there are three different industries linked from the star industry to the final industry. The direct type is a simple production path, while the via3 type is a complex production path. If the smart industry has new value chains and a business structure more diversified than via2 and via3 types, it will turn up more than direct and via1 types. Equations for obtaining a production path are as follows:
where:
- : smart production path of direct type;
- : smart production path of via1 type;
- : smart production path via2 type;
- : smart production path via3 type;
- : number of smart production paths of direct type;
- : number of smart production paths of via1 type;
- : number of smart production paths of via2 type;
- : number of smart production paths of via3 type;
- : total number of production paths.
The smart intervention path can find out the smart industry’s linking contribution to other industries. For example, in the via2-type path (I1-I2-I4-I3) situation, all the paths are summed up as ITM/ITS, ITM/KS and ITS/KS. Earlier information about the via1, via2 and via3 path types could be confused with the explanation of smart production paths. Therefore, when we analyze smart intervention paths, via1 is a single intervention path, via2 is a double intervention path and via3 is a triple intervention path. If there is an increase in the number of smart intervention paths, smart industries growing as intermediate goods or semi-finished products or ingredients at the same time, then transactions among industries are very active. This is expressed in Equations (11)–(13).
where:
- : single intervention path;
- : ITM production path;
- : ITS production path;
- : KS production path;
- : number of ITM production paths;
- : number of ITS production paths;
- : number of KS production paths;
- : total number of production paths.
The double intervention path comes from calculating Equation (12) below.
where:
- : double intervention path;
- : gets each ITM and ITS production path;
- : gets each ITM and KS production path;
- : gets each ITS and KS production path;
- : number of ITM and ITS production paths;
- : number of ITM and KS production paths;
- : number of ITS and KS production paths;
- : total number of production paths.
The triple intervention path comes from calculating Equation (13) below.
where:
- : a triple intervention path;
- : obtains an ITM, ITS and KS simultaneously in the production path;
- total number of production paths which obtain ITM, ITS and KS simultaneously in the production path.
3.1.4. Smart Network Clustering Model
The analysis of network clustering used minimum spanning tree (MST), which would extract the backbone of the industrial network—that directionality exists—from production inducement coefficients [48,49]. MST is an algorism to extract a whole network to look for minimum distance, which is then combined sequentially. This study assumed that production inducement coefficients are the minimum distance between industries. In other words, if we find the smallest distance between different industries, those connect these industries. The industries connected by minimum distance means to look for the smallest production inducement coefficients of all industries until one industry is linked to the minimum distance industry. This process is repeated until all industries are connected [49]. The core which obtained the most production inducement coefficients in the industry network, or extracted the basic structure that this algorism implemented, can do the clustering [50,51]. We can write it in equation form, which would be Equation (14).
where:
- : backbone network using MST;
- : multiplier coefficient in network path.
The backbone network is the summation of minimized paths so that production inducement coefficients become the smallest. In this study, we applied the MST algorithm which prediction inducement coefficients multiply by minus one. This is to look for the minimum coefficient at the path.
The industrial network clustering can be found using the backbone network as derived previously. The industrial network clustering must comprise a minimum of three or more industrial nodes bundled as one and also include two or more links within. The two conditions noted above must be satisfied to form a network clustering. The boundary of network clustering is established when the links of nodes are connected in opposite directions (See Figure 6) [51]. We found industry clusters using these methods from MST. Equation (15) is another way to express this.
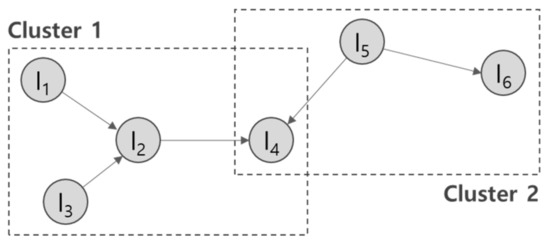
Figure 6.
Example of the smart network clustering.
- : MST cluster in backbone network;
- : industry node value of more than three;
- : industry link value of more than two.
When these two conditions are fulfilled, network clustering could be built in the backbone network. Smart network clustering model can analyze how the industry clusters are formed and connected, and their level of complexity. The indicator is the number of smart clustering. Through this, we can find out its existence and numbers.
3.2. Data Analysis
This study used an input–output table for the years 1960, 1985 and 2015 from the Bank of Korea [52]. The input–output tables issued take into account the commodity prices during the given time period. These years were specifically selected as 1960 is the first year Korea made an input–output table, 2015 is the most recent input–output table available and 1985 falls in the middle. Smart city (information city) started in South Korea with government informatization as a starting point in 1960 [53]. Various smart policies have been established in South Korea (e.g., Administrative Computerization Plan (1978), National Infrastructure Network Plan (1987), Cyber Korea (1999), e-Korea (2002), Broadband IT Korea (2003), u-Korea (2006), U-City Raw (2008) and the first and second U-City Comprehensive Plan (2009, 2014)).
The input–output table established by the Bank of Korea is published every five years. The latest version of the input–output table is 2015. This study used the 2015 input–output table as the latest data at the time of conducting the study. Therefore, the data from 1960 to 2015 are data that can examine changes in the smart city industrial ecosystem in South Korea. This study analyzed changes in Korean smart city development. It utilized the GDP deflator of the year 2015 to compare annual input–output tables and to smoothen commodity increase, which will eliminate the nominally increased portion.
Smart industries can be classified by understanding smart technologies. In this study, smart technologies were defined as a sensing, processing, networking and interfacing [4,8,53]. The smart technologies characteristics are as follows: Sensing are technologies of seeing (e.g., camera and lens), hearing (e.g., auditory sensor) and smelling (e.g., olfactory sensor). Processing is a technology that processes data received from a sensor such as knowledge algorithm (e.g., artificial intelligent) for data processing. The technologies used to transmit data for processing are in the area of networking technologies such as Wi-Fi, 5G and broadband network. Interfacing are technologies for output by display such as monitor and large electronic display. These technologies were able to classify as an area of three from industrial perspectives. Firstly, sensing and interfacing technologies were related to IT manufacturing industries. Secondly, processing technologies included knowledge-based service industries. Thirdly, networking technologies can be said to be related to the IT service industries area. These contents are also related to smart-x case analysis (see the Appendix A, Table A1).
In particular, the OECD broke the traditional dichotomy between the manufacturing and service industries for economic activity by introducing a formal definition of the industrial sector of information and communication technology and knowledge service [54,55,56]. Although the OECD’s definition of industry for ICT and knowledge services is a useful classification, it may not cover the full range of related activities [10,12,57]. However, the industrial classification approach introduced by the OECD is undoubtedly the most appropriate classification method because it can be quantified from an economic point of view and can conduct economic comparison studies between countries [57]. Based on this classification, this study classified relevant smart technology industries into IT manufacturing, IT services and knowledge services [8,10,12,57].
We reclassified industries for the three years of input–output tables to analyze the smart city industry ecosystem; the sub-subcategories that are the minimum unit of each industry were reclassified into 8 and 25 industries (See the Appendix A, Table A2). Analysis data on SSM, SPM and SIM were used for the 8 reclassified industries and SNM was adapted for the 25 reclassified industries. Each model uses different data because each model has different characteristics. For example, in the case of SNM, if we had used the eight reclassified industries, it would have been difficult to find industry clusters.
The eight reclassified industries are: agriculture and mining (AM), traditional manufacturing (TM), IT manufacturing (ITM), construction (C), energy generation and supply (E), IT service (ITS), traditional service (TS) and knowledge service (KS). We reclassified ITM, ITS and KS industries as smart industries and the other AM, TM, C, E and TS industries as traditional industries.
This study reclassified AM based on primary industries such as agriculture, fisheries, mining and quarrying. TM was classified as secondary industry oriented. In the case of ITM, we classified by criteria based on the recent technologies’ statistic data and literature search. ITM has smaller detailed classifications: it has 11 categories such as semiconductor, electronic display equipment, circuit board, electric device and computer. C is classified as building construction and civil construction. E included electricity, gas and waterworks recycling energy. ITS was categorized around wired/wireless communication, communication service and software service. Based on existing literature, KS included finance and insurance, professional science and technology, education, health and culture [58,59]. The KS industry includes ITS, but since our study was focused on a specific ecosystem analysis of the smart city industry, we separated the two. TS covered food, accommodation, real estate, business support and other services.
4. Analysis Result: Application and Interpretation of the Smart SPIN Model
4.1. Result of Application of Smart Spectrum Analysis
This section of the study shows an analysis on the increased scope of smart industries through the spectrum model (Table 1). The smart industry proportion was 8.4% (9) of the total Korean industries in 1960. Proportions of the smart industry increased to 10.7% (17) in 1985 and 20.1% (33) in 2015. The analysis revealed an increase in spectrum. However, the traditional industry showed spectrum decrease annually: 91.7% (99), 98.3% (142) and 79.9% (131).

Table 1.
Changes in the smart spectrum (unit: no, %).
We can also see impressive changes in the number of units. The smart industry increased by 8% between year 1960 and 1985 and by 16% from 1985 to 2015. Conversely, traditional industry increased by 43% between the years 1960 and 1985 and then decreased by 11% from 1985 to 2015. ITS was categorized as the communication industry until 1985; however, in 2015, it emerged as the information service, software development supply and wired/wireless communication services. In 1960, KS was classified into three parts, education service, medical/health service and cultural service, but the finance and insurance categories were added in 1985. Professional science and technology services were added, and KS was further subdivided in 2015. In a nutshell, since the smart spectrum is increasing, the smart industry is expanding.
Smart spectrum analysis showed that the smart industry is becoming increasingly segmented. This means that the smart industry is building a new economic system. It also means that the smart industry is emerging as an important industry in the industrial ecosystem due to the continuous development of information and communication technology.
4.2. Application Results of Smart Penetration Analysis
The results of smart penetration analysis revealed the pace with which the smart industry is progressing. It also shows the contribution made by the smart industry’s ingredients into the industry (Table 2). The penetration ratio of smart industry to whole industries was 5.2% in 1960. However, it rose to 22.8% in 1985 and 27.6% in 2015. On the contrary, the traditional industry’s penetration ratio was 94.7% in 1960. It declined to 77.1% in 1985 and reduced to 72.4% in 2015. This ratio means the penetration of the smart industry has increased while traditional industry has decreased in all Korean industries. To produce a unit of goods, smart industry penetrates faster and traditional industry’s penetration ratio decreases as technology progresses towards 5G, AI, robots and IoT.
Table 2.
Changes in smart penetration (unit: coefficient, %).
Smart industry’s penetration ratio increased year on year: 17.6% between 1960 and 1985 and 4.8% from 1985 to 2015. On the contrary, traditional industry reduced for the same time periods. Smart industry’s technical coefficient rose from 0.156% in 1960 and 0.840% in 1985 to 1.192% in 2015. This means that each year every industry needs smart industry input worth USD 19 in 1960, USD 105 in 1985 and USD 142 in 2015 to produce goods worth USD 1000. This input will keep rising as we move to the fourth IR.
Analysis result of this study shows ITM and KS categories have a big penetration ratio in all smart industries. ITM had a bigger penetration rate than KS in 1960 and 1985. The average rate of increase, smart industry wide, for ITM is 236.1%, for ITS is 183.7% and for KS is 282.7%. On the contrary, traditional industry’s TM, E and TS are much lower compared to KS. Finally, the penetration of smart industry is on the rise, meaning that the smart industry has become an important material for growth. It can be stated that smart industry already penetrates other industries.
The results of this analysis suggest that the city is changing from a physical city of rebar and concrete to a smart city that can see, hear and smell. In other words, smartization is progressing in all areas of industry. In particular, it can be confirmed that these results are closely connected with Korea’s smart (or informatization) policies [53].
4.3. Application Results of Smart Impact Path Analysis
Analyzing smart impact path tells us how the structure of production is changing and how it impacts many industries. Smart impact path analyzed two sides: one is smart production path and the other is parameter path. Smart industry’s impacts to other industries are shown as production path and the results of the analysis are shown in Table 3. It is evident that the average number of smart production paths is increasing. It was 50.3 in 1960, 58 in 1985 and 70 in 2015. Average number of traditional industries showed 38, 58.6 and 73.8, respectively.
Table 3.
Changes in smart production pathw (unit: no).
Looking at the average increase, smart industry’s ITM increased to 6.8, ITS increased to 41.3 and KS increased to 11. In most of traditional industries, the production paths were higher than the smart industry: AM 73, TM 40, C 42.5, E 33.4 and TS 24.8. This result can observe that smart industry’s ITM and KS average increase in the number of paths is lower than the traditional industry. This contrasts smart spectrum analysis as the traditional industries have better and various paths than smart industry to deliver the industry’s impact. At the same time, value chain started by smart industry is weaker compared to traditional industries.
Analysis of smart intervention path reveals the extent of the mediation of the smart industry between industries and convergence (Table 4). In general, several cases show the smart industry’s single intervention path. In 1960, 56 single intervention paths appeared and two double intervention paths. In 1985, there were 133 single intervention paths, and the number increased to 218 in 2015. In 1985, there were 4 double intervention paths and 22 paths in 2015. These increased about five times from 1985 to 2015. However, these numbers seem unremarkable when compared with single intervention paths. Our study carefully checked for any triple intervention paths but found none for all the years studied. When we examine single intervention paths from year to year, ITM had the most paths in 1960, but KS mediated more industries since 1985. From a double intervention path point of view, it was clear that the ITM and the ITS were converged to connect other industries in 1960. The ITM and KS were converged in 1985, and the ITS and the KS were converged to connect other industries in 2015.
Table 4.
Changes in smart intervention paths (unit: no).
These results show that the smart industry creates new value chains on behalf of the existing traditional industry. In addition, it complements other industries and, eventually, becomes a substitute. However, now it has become a mandatory industry. Notably, the smart city industry ecosystem moves from a simple converging structure to multiple, complex converging structures. Considering that a triple intervention path has not appeared, we assume that the smart city industry is still in its infancy.
4.4. Application Results of Smart Network Clustering Analysis
An analysis of the smart network shows whether clusters were formed centered around the smart industry. Through the minimum spanning tree algorithm function which generates the backbone network, we look for clusters around the smart industry. (Table 5, see the Appendix A, Figure A1).
Table 5.
Changes of smart network clustering (unit: no).
There were three clusters formed in 1960: light industry, metal and non-metal industry within TM. Isolated nodes appeared for broadcasting, publishing, professional, scientific and technical activities within KS, and accommodation and food services in the traditional industry. KS and ITS linked with the light industry in 1960, while ITM linked with the metal and non-metal industry, and the medical and human health service linked with the chemical industry. In 1985, three clusters were formed centered around the chemical industry and the metal and non-metal industry. Isolated node confirmed KS’s broadcasting and publishing. On the smart industry front, finance and insurance services linked closely with business service and real estate service in the traditional industry. While KS’s professional, scientific and technical activities linked with the light industry, the smart industry linked with the chemical industry, which has the largest node.
There were five clusters in 2015 centered around the traditional industry. Isolated nodes did not appear. From the smart-industry-centered view, the chemical industry linked with education service, medical and human health service and ITM in 2015. The light industry is associated with broadcasting, publishing and cultural service. Professional, scientific and technical services are associated with broadcasting and publishing. Finance and insurance services are associated with ITS. The analysis shows that no smart cluster appeared in the smart industry for the years 1960, 1985 and 2015. Based on this, it can be said that the smart industry acts as a supporting industry to the traditional industry. This means the smart industry is insignificant to connect small clusters. In other words, impact ramifications are small and the smart industry lacks the capacity to form an industry ecosystem by itself.
5. Conclusions
The purpose of this study is two-fold. First, to develop a tool to analyze changes in the Korean smart city industry ecosystem—smart SPIN model. Second, to apply the analysis tool (smart SPIN model) with Korean input–output tables of three years to find the interaction among industries.
The findings and conclusions can be summarized as follows. First, from the smart spectrum model, the number of smart industries has increased. This means the scope of smart industries is expanding. Second, an analytical study of penetration shows that the smart industry has higher technical penetration than traditional industries. This means traditional industries use the smart industry as an important base. The smart industry integrates into various traditional industries and increases their value. Third, analysis of the smart impact path revealed that the number of production paths increases. The value chain structure started by the smart industry is weaker than the traditional industry, which means that the Korean traditional industry manufacturing is strong. The smart city industry ecosystem’s value chain is not strong enough and the smart industry substitutes existing industries to make new value chains. Fourth, smart network clustering showed that important clusters are centered on the traditional industry. At the same time, the cluster did not appear around the smart industry, which tells us that while the smart industry is growing along with the traditional industry, it is still weak to stand on its own or be indigenous.
We believe, this study can contribute in the following ways. First, our study defined the term ‘smart city’ based on technology factors structuring the smart city. This study proposes a new method to analyze the ecosystem beyond the existing studies of the smart industry’s impact such as production inducement impact and labor inducement impact. Finally, we were able to analyze the smart city industry ecosystem using the smart SPIN model. The satisfactory results confirm that the model is well used.
6. Policy Remarks and Future Research
In the industry ecosystem, the birth of a new industry translates to the parasite stage of an existing industry, expanding the new industry to integrate with the existing industry (called the conversion stage) and eventually replacing the existing industry (called the conception stage). At the moment, the Korean industrial ecosystem in a smart city is interacting with the existing industry and transforming it to a more intelligent and smarter stage. However, the Korean policy on the smart city is to throw the existing traditional industry away and treat the smart city industry as an independent industry. The government pushes it forward as a new growth engine of the nation to guide the economic future of Korea. We think such a policy is pre-mature. We should monitor the emerging industries and focus on converging the smart and traditional industries.
This study has several limitations. This study has classified the smart city industry through smart-x cases studies despite the fact that there are limitations in the classification. Moreover, there are limitations in the analysis models. The input–output model is a macroscopic analysis method and hence there is a limit to the analysis of rapid changes in economic conditions. This study was analyzed by reflecting three input–output tables. This data sample has limitations as it does not reflect the overall characteristics of the Korean industry.
The study presents several options for future research. The analysis model can be applied and used not only in Korea but also in other countries and produce a reasonable output. Thus, we need comparative studies with other countries. However, it is difficult to use the model presented in this study in countries where input and output tables are not prepared. It is necessary to study new models using qualitative indicators. We must also encourage continuous research to find the optimized smart city industry classification. The findings of this study can help us understand the path that the smart city, as a new growth engine of the national industry policy, will lead to.
Author Contributions
Conceptualization, S.J. and S.L.; Methodology, S.J. and S.L.; Data curation, S.J.; Formal analysis, S.J.; Writing—original draft, S.J.; Writing—review and editing, S.J. and S.L.; Supervision, S.L. All authors have read and agreed to the published version of the manuscript.
Funding
This work was supported by the National Research Foundation of Korea grant funded by the Korea government (Ministry of Science and ICT) (No. 2021R1F1A1049301).
Institutional Review Board Statement
Not applicable.
Informed Consent Statement
Not applicable.
Data Availability Statement
Not applicable.
Acknowledgments
The assistance provided by Byung-Ho OH is greatly appreciated.
Conflicts of Interest
The authors declare no conflict of interest.
Appendix A
Table A1.
Reclassification of industries using cases of smart-x.
Table A1.
Reclassification of industries using cases of smart-x.
| Industries of Input–Output Table | Smart-× Cases | Smart Industry | |||
|---|---|---|---|---|---|
| Smart Car | Smart Building | Smart Factory | Smart Farm | ||
| Semiconductor Manufacturing | o | o | o | o | IT Manufacturing |
| Electronic Display Manufacturing | o | o | o | o | |
| Printed Circuit Board Manufacturing | o | o | o | o | |
| Other Electronic Components Manufacturing | o | o | o | o | |
| Computers and Peripherals Manufacturing | o | o | o | o | |
| Communications and Broadcasting Equipment Manufacturing | o | o | o | o | |
| Medical and Measuring Devices Manufacturing | - | o | - | o | |
| Generator and Motor Manufacturing | o | o | o | o | |
| Electrical Conversion and Supply Control Unit Manufacturing | o | o | o | o | |
| Battery Manufacturing | o | - | - | o | |
| Wire and Cable Manufacturing | o | - | o | o | |
| Other Precision Instruments Manufacturing | o | - | o | - | |
| Wired, Wireless, and Satellite Communication Services | o | o | o | o | IT Service |
| Other Telecommunications Services | o | o | o | o | |
| Information Service | o | o | o | o | |
| Software Development Supply Services | o | o | o | o | |
| Other IT Services | o | o | o | o | |
| Research and Development | o | o | o | - | Knowledge Service |
| Building and Civil Engineering Services | o | - | - | - | |
| Scientific and Technical Services | o | o | o | o | |
| Other Professional Services | o | o | o | o | |
Source: Jo et al., adapted from ref. [10], revised and supplemented. The o means that the smart-x case has been applied to the relevant industry.
Table A2.
Reclassification of smart city industries (unit: industry no.).
Table A2.
Reclassification of smart city industries (unit: industry no.).
| NO | 1960 | 1985 | 2015 | Reclassification (8 and 28 Industries) |
|---|---|---|---|---|
| 1 | 1–7 | 1–13 | 1–8 | (AM) Agriculture and Fishing |
| 2 | 8–11 | 14–20 | 9–12 | (AM) Mining and Quarrying |
| 3 | 12–43 | 21–64 | 13–35 | (TM) Light Industry |
| 4 | 44–55 | 65–83 | 36–51 | (TM) Chemical Industry |
| 5 | 56–68 | 84–100 | 52–67 | (TM) Non-Metal and Metal Industry |
| 6 | 69–74 | 101–106 | 83–93 | (TM) Manufacturing of Machinery |
| 7 | 78–81, 84 | 114–118 | 94–100 | (TM) Manufacturing of Transport Equipment |
| 8 | 76, 82, 83 | 107, 110, 120, 122 | 74, 76, 81, 82, 101–103 | (TM) Other Manufacturing |
| 9 | 75, 77 | 108, 109, 111–113, 119 | 68–73, 75, 78–80 | (ITM) IT Manufacturing |
| 10 | 85–89 | 127–131 | 111–117 | (C) Construction |
| 11 | 90 | 123–126 | 104–110 | (E) Energy Generation and Supply |
| 12 | – | 142 | 131, 132, 134–136 | (ITS) IT Services |
| 13 | – | – | 133, 137, 138 | (KS) Broadcast and Publishing |
| 14 | 91 | 143, 144 | 139–142 | (KS) Finance and Insurance |
| 15 | 93, 100 | 153, 154 | 158, 159 | (KS) Medical and Human Health Services |
| 16 | 104 | 157 | 160, 161 | (KS) Cultural Services |
| 17 | 99 | 151 | 157 | (KS) Education Services |
| 18 | – | 147, 148, 152 | 146–150 | (KS) Professional, Scientific and Technical Activities |
| 19 | – | 133, 134 | 129, 130 | (TS) Accommodation and Food Services |
| 20 | 98 | 132 | 118 | (TS) Wholesale and Retail Trade |
| 21 | 95–97 | 135–141 | 119–128 | (TS) Transport Services |
| 22 | 92 | 145, 146 | 143–145 | (TS) Real Estate Services |
| 23 | 101 | 150 | 155, 156 | (TS) Public Administration and Defense Services |
| 24 | 102, 103 | 149 | 151–154 | (TS) Business Support Services |
| 25 | 105 | 156, 158 | 162–164 | (TS) Other Services |
Source: Jo et al., adapted from ref. [10], revised and supplemented.

Figure A1.
Changes in Smart Network Clustering. (Note: The red nodes are smart industries. The green nodes are traditional industries).
Table A3.
Abbreviation List.
Table A3.
Abbreviation List.
| Abbreviation | Large Sector Definition | Abbreviation | Small Sector Definition |
|---|---|---|---|
| AM | Agriculture and Mining | AF | Agriculture and Fishing |
| MQ | Mining and Quarrying | ||
| TM | Traditional Manufacturing | LI | Light Industry |
| CI | Chemical Industry | ||
| NMMI | Non-Metal and Metal Industry | ||
| MM | Manufacturing of Machinery | ||
| MTE | Manufacturing of Transport Equipment | ||
| OM | Other Manufacturing | ||
| ITM | IT Manufacturing | ITM | IT Manufacturing |
| C | Construction | C | Construction |
| E | Energy Generation and Supply | E | Energy Generation and Supply |
| ITS | IT Services | ITS | IT Services |
| KS | Knowledge Services | BP | Broadcast and Publishing |
| FI | Finance and Insurance | ||
| MHS | Medical and Human Health Services | ||
| CS | Cultural Services | ||
| ES | Education Services | ||
| PSTA | Professional, Scientific and Technical Activities | ||
| TS | Traditional Services | AFS | Accommodation and Food Services |
| WRT | Wholesale and Retail Trade | ||
| TS | Transport Services | ||
| RES | Real Estate Services | ||
| PADS | Public Administration and Defense Services | ||
| BSS | Business Support Services | ||
| OS | Other Services |
References
- Schwab, K. The Fourth Industrial Revolution; Currency: New York, NY, USA, 2017. [Google Scholar]
- Park, S.-J.; Kim, B.-W. 4th Industrial Revolution and Open Access Network for Smart City. In Proceedings of the 2018 Portland International Conference on Management of Engineering and Technology (PICMET), Honolulu, HI, USA, 19–23 August 2018. [Google Scholar]
- Desouza, K.; Flanery, T.H. Designing, planning, and managing resilient cities: A conceptual framework. Cities 2013, 35, 89–99. [Google Scholar] [CrossRef]
- Yigitcanlar, T.; Lee, S.H. Korean ubiquitous-eco-city: A smart-sustainable urban form or a branding hoax? Technol. Forecast. Soc. Change 2014, 89, 100–114. [Google Scholar] [CrossRef]
- Nam, T.; Pardo, T.A. Conceptualizing Smart city with Dimensions of Technology, People, and Institutions. In Proceedings of the 12th Annual International Digital Government Research Conference: Digital Government Innovation in Challenging Times, College Park, MD, USA, 12–15 June 2011; pp. 282–291. [Google Scholar]
- Umar, T. Making Future Floating Cities Sustainable: A way Forward. Proc. Inst. Civ. Eng. Urban Des. Plan. 2020, 173, 214–237. [Google Scholar] [CrossRef]
- Serrano, W. Digital Systems in Smart City and Infrastructure: Digital as a Service. Smart Cities 2018, 1, 134–153. [Google Scholar] [CrossRef]
- Lee, S.H.; Moon, T.H.; Leem, Y.T.; Nam, K.W. An empirical investigation on the dynamics of knowledge and it industries in korea. Int. J. Struct. Constr. Eng. 2016, 10, 2452–2456. [Google Scholar]
- Embarak, O. Smart Cities New Paradigm Applications and Challenges. In Immersive Technology in Smart Cities; Aurelia, S., Paiva, S., Eds.; EAI/Springer Innovations in Communication and Computing; Springer: Cham, Switzerland, 2022; pp. 147–177. [Google Scholar] [CrossRef]
- Jo, S.-S.; Han, H.; Leem, Y.; Lee, S.-H. Sustainable Smart Cities and Industrial Ecosystem: Structural and Relational Changes of the Smart City Industries in Korea. Sustainability 2021, 13, 9917. [Google Scholar] [CrossRef]
- Jo, S.S.; Lee, S.H. An analysis on the change of convergence in smart city from industrial perspectives. J. Korean Reg. Sci. Assoc. 2018, 34, 61–74. [Google Scholar]
- Porter, M.E. The competitive advonioge of notions. Harv. Bus. Rev. 1990, 73, 91. [Google Scholar]
- Hefnawy, A.; Bouras, A.; Cherifi, C. Lifecycle Based Modeling of Smart City Ecosystem. In Proceedings of the World Congress in Computer Science, Computer Engineering and Applications (WORLDCOMP 2015), Las Vegas, NV, USA, 27–30 July 2015. [Google Scholar]
- Pellicano, M.; Calabrese, M.; Loia, F.; Maione, G. Value Co-Creation Practices in Smart City Ecosystem. J. Serv. Sci. Manag. 2019, 12, 34–57. [Google Scholar] [CrossRef][Green Version]
- Díaz-Díaz, R.; Muñoz, L.; Pérez-González, D. Business model analysis of public services operating in the smart city ecosystem: The case of Smart Santander. Future Gener. Comput. Syst. 2017, 76, 198–214. [Google Scholar] [CrossRef]
- Rotuna, C.; Gheorghita, A.; Zamfiroiu, A.; Smada, D.-M. Smart City Ecosystem Using Blockchain Technology. Inform. Econ. 2019, 23, 41–50. [Google Scholar] [CrossRef]
- Mrazovic, P.; De La Rubia, I.; Urmeneta, J.; Balufo, C.; Tapias, R.; Matskin, M.; Larriba-Pey, J.L. CIGO! Mobility Management Platform for Growing Efficient and Balanced Smart City Ecosystem. In Proceedings of the International Smart Cities Conference (ISC2), Trento, Italy, 12–15 September 2016; pp. 1–4. [Google Scholar]
- Lnenicka, M.; Machova, R.; Komarkova, J.; Pasler, M. Government Enterprise Architecture for Big and Open Linked Data Analytics in a Smart City Ecosystem. In Smart Education and e-Learning 2017, Proceedings of the 4th International KES Conference on Smart Education and Smart E-Learning (KES-SEEL-17), Vilamoura, Portugal, 21–23 June 2017; Springer: Cham, Switzerland, 2018; Volume 75, pp. 475–485. [Google Scholar] [CrossRef]
- Gupta, A.; Panagiotopoulos, P.; Bowen, F. An orchestration approach to smart city data ecosystems. Technol. Forecast. Soc. Change 2020, 153, 119929. [Google Scholar] [CrossRef]
- Kim, P.-R.; Cho, B.-S.; Jeong, W.-S. The propagation effects on the regional economy induced by u-city construction in wha-sung and dong-tan city. J. Korean Inst. Commun. Inf. Sci. 2006, 31, 1087–1098. [Google Scholar]
- Jeong, S.Y. Economic Impact Analysis on the u-City Development. Master’s Thesis, University of Seoul, Seoul, Korea, 2008. [Google Scholar]
- Lim, S.-Y.; Lim, Y.M.; Hwang, B.J.; Lee, J.Y. A Study on the Characteristics of the U-City Industry Using the I-O Tables. J. Korea Spat. Inf. Soc. 2013, 21, 37–44. [Google Scholar] [CrossRef]
- Kim, K.; Jung, J.-K.; Choi, J.Y. Impact of the Smart City Industry on the Korean National Economy: Input-Output Analysis. Sustainability 2016, 8, 649. [Google Scholar] [CrossRef]
- Eitzen, H.C. Dilemmas of Diversification: Regional Economic Development and Business-Industrial Clusters in China and Kazakhstan. J. Emerg. Knowl. Emerg. Mark. 2012, 4, 2. [Google Scholar] [CrossRef][Green Version]
- Cho, S.-S. Cheongyang Industrial Development Strategy Using a Spectral Clustering Identification Method. Chungnam Stud. 2021, 5, 77–92. [Google Scholar]
- Moore, J.F. The Death of Competition: Leadership and Strategy in the Age of Business Ecosystems; HarperCollins: New York, NY, USA, 2016. [Google Scholar]
- Cho, B.-S.; Jeong, W.; Cho, H. A study on the business and trend of u-city. Electron. Telecommun. Trends 2006, 21, 152–162. [Google Scholar]
- Nakrani, P.K. Smart Car Technologies: A Comprehensive Study of the State of the Art with Analysis and Trends; Arizona State University: Tempe, AZ, USA, 2015. [Google Scholar]
- Buckman, A.H.; Mayfield, M.; Beck, S.B. What is a smart building? Smart Sustain. Built Environ. 2014, 3, 92–109. [Google Scholar] [CrossRef]
- Chun, E.; Jun, S.; Lee, C. Identification of Promising Smart Farm Technologies and Development of Technology Roadmap Using Patent Map Analysis. Sustainability 2021, 13, 10709. [Google Scholar] [CrossRef]
- Chen, B.; Wan, J.; Shu, L.; Li, P.; Mukherjee, M.; Yin, B. Smart Factory of Industry 4.0: Key Technologies, Application Case, and Challenges. IEEE Access 2018, 6, 6505–6519. [Google Scholar] [CrossRef]
- Markets and Markets. Market Research Report (Smart Factory). 2021. Available online: https://www.marketsandmarkets.com/Market-Reports/connected-car-market-102580117.html?clid=CjwKCAjwY8BRBiEiwA5MCBJjpuNcMnddDSRB2lsq6I2EInPWcrc1XEj2JpSU226ph-WWarPNTuBoCiFIQAvDBwE (accessed on 28 June 2022).
- Markets and Markets. Market Research Report (Smart Agriculture). 2021. Available online: https://www.marketsandmarkets.com/Market-Reports/smart-agriculture-market-239736790.html?gclid=CjwKCAjwquWVBhBrEiwAt1KmwoYwUjj3JqkvC4tRyYioOWEo0Yj3FdhDlWcWy0uIPDjhKXuQU7IrCxoCaTgQAvD_BwE (accessed on 28 June 2022).
- Markets and Markets. Market Research Report (Connected Car). 2021. Available online: https://www.marketsandmarkets.com/Market-Reports/connected-car-market-102580117.html?gclid=CjwKCAjwquWVBhBrEiwAt1KmwqOYi4ooBXSn3cBdaGPPrzafvoDpChNcCpE4stTHzMwf1_cp-OVgCBoCPT8QAvD_BwE (accessed on 28 June 2022).
- Markets and Markets. Market Research Report (Smart Building). 2021. Available online: https://www.marketsandmarkets.com/Market-Reports/smart-building-market-1169.html (accessed on 28 June 2022).
- Ayres, R.U. Industrial metabolism. Technol. Environ. 1989, 1989, 23–49. [Google Scholar]
- Tibbs, H.B. Industrial ecology–An agenda for environmental management. Pollut. Prev. Rev. 1992, 2, 167–180. [Google Scholar]
- Moore, J.F. Predators and prey: A new ecology of competition. Harv. Bus. Rev. 1993, 71, 75–86. [Google Scholar]
- Coursaris, C.; Hassanein, K.; Head, M. Mobile Technologies and the Value Chain: Participants, Activities and Value Creation. In Proceedings of the 2006 International Conference on Mobile Business, Copenhagen, Denmark, 26–27 June 2006. [Google Scholar]
- Jackson, D.J. What is an innovation ecosystem. Natl. Sci. Found. 2011, 1, 1–13. [Google Scholar]
- Abella, A.; Ortiz-De-Urbina-Criado, M.; De-Pablos-Heredero, C. A model for the analysis of data-driven innovation and value generation in smart cities’ ecosystems. Cities 2017, 64, 47–53. [Google Scholar] [CrossRef]
- Ahlers, D.; Wienhofen, L.W.; Petersen, S.A.; Anvaari, M. A Smart City Ecosystem Enabling Open Innovation. In Innovations for Community Services, Proceedings of the I4CS 2019, Wolfsburg, Germany, 24–26 June 2019; Lüke, K.H., Eichler, G., Erfurth, C., Fahrnberger, G., Eds.; Communications in Computer and Information Science; Springer: Cham, Switzerland, 2019; Volume 1041, pp. 109–122. [Google Scholar] [CrossRef]
- Linde, L.; Sjödin, D.; Parida, V.; Wincent, J. Dynamic capabilities for ecosystem orchestration A capability-based framework for smart city innovation initiatives. Technol. Forecast. Soc. Chang. 2021, 166, 120614. [Google Scholar] [CrossRef]
- Kim, I.-H.; Lee, J.-Y.; Seo, J.-M.; Lee, J.-C. A Study on Vitalizing and Promoting Measures of Innovation Ecosystems in the Korean Smart Cities; Korea Research Institute for Human Settlements Publishing: Sejong-si, Korea, 2019. [Google Scholar]
- Leontief, W. Input-Output Economics; Oxford University Press: Oxford, UK, 1986. [Google Scholar]
- Defourny, J.; Thorbecke, E. Structural Path Analysis and Multiplier Decomposition within a Social Accounting Matrix Framework. Econ. J. 1984, 94, 111. [Google Scholar] [CrossRef]
- Freeman, L.C. Centrality in social networks conceptual clarification. Soc. Netw. 1978, 1, 215–239. [Google Scholar] [CrossRef]
- Quirin, A.; Cordón, O.; Guerrero-Bote, V.P.; Vargas-Quesada, B.; Moya-Anegón, F. A quick mst-based algorithm to obtain pathfinder networks (∞, n − 1). J. Am. Soc. Inf. Sci. Technol. 2008, 59, 1912–1924. [Google Scholar] [CrossRef]
- Park, M.-S.; Lee, D.-H.; Choi, J.-A. Analysis on the Industrial Linkages between Manufacturing and Service Sector in Daegu and Gyeongbuk Region. J. Korean Reg. Dev. Assoc. 2017, 29, 99–120. [Google Scholar]
- Yu, M.; Hillebrand, A.; Tewarie, P.; Meier, J.; van Dijk, B.; Van Mieghem, P.; Stam, C.J. Hierarchical clustering in minimum spanning trees. Chaos: An Interdisciplinary. J. Nonlinear Sci. 2015, 25, 023107. [Google Scholar]
- Liu, Y. Business Analytics on the Chinese Service Industries: Business Models and Industrial Network Analysis. Ph.D. Thesis, Kyunghee University, Seoul, Korea, 2019. [Google Scholar]
- The Bank of Korea. Input-Output Statistics. In The Executive Summary of the 2015 Input-Output Tables; The Bank of Korea Press: Seoul, Korea, 2019; Available online: https://www.bok.or.kr/portal/bbs/P0000559/view.do?nttId=10050567&menuNo=200690 (accessed on 28 June 2022).
- Jo, S.-S.; Lee, S.-H.; Leem, Y.-T. An analysis on the evolutionary characteristics of ubiquitous city through evolutionary map of ubiquitous city. J. Korean Assoc. Geogr. Inf. Stud. 2015, 18, 75–91. [Google Scholar] [CrossRef]
- Organisation for Economic Co-operation and Development. The Knowledge-Based Economy: A Set of Facts and Figures; Organisation for Economic Co-operation and Development: Paris, France, 1999. [Google Scholar]
- Organisation for Economic Co-operation and Development. Measuring the Information Economy 2002; OECD Publishing: Paris, France, 2002. [Google Scholar]
- Organisation for Economic Co-operation and Development. Oecd Guide to Measuring the Information Society 2011; OECD: Paris, France, 2011. [Google Scholar]
- Stamopoulos, D.; Dimas, P.; Tsakanikas, A. Exploring the structural effects of the ICT sector in the Greek economy: A quantitative approach based on input-output and network analysis. Telecommun. Policy 2022, 46, 102332. [Google Scholar] [CrossRef]
- Hretcanu, C.I. Current trends in the knowledge economy. Ecoforum J. 2015, 4, 170–175. [Google Scholar]
- Ronnie, J.; Neto, J.V.; Quelhas, O.L.G.; de Matos Ferreira, J.J. Knowledge intensive business services (kibs): Bibliometric analysis and their different behaviors in the scientific literature: Topic 16–innovation and services. RAI Rev. Adm. E Inovação 2017, 14, 216–225. [Google Scholar]
Publisher’s Note: MDPI stays neutral with regard to jurisdictional claims in published maps and institutional affiliations. |
© 2022 by the authors. Licensee MDPI, Basel, Switzerland. This article is an open access article distributed under the terms and conditions of the Creative Commons Attribution (CC BY) license (https://creativecommons.org/licenses/by/4.0/).