Article

Experimental Investigation of Cross Laminated Timber Elements with Holes or Notches at In-Plane Beam Loading Conditions

1
Faculty of Civil Engineering and Architecture Osijek, Josip Juraj Strossmayer University of Osijek, Vladimira Preloga 3, 31 000 Osijek, Croatia
2
Faculty of Civil Engineering, University of Zagreb, Fra Andrije Kačića Miošića 26, 10 000 Zagreb, Croatia
*
Author to whom correspondence should be addressed.
Buildings 2022, 12(7), 967; https://doi.org/10.3390/buildings12070967
Submission received: 7 June 2022 / Revised: 3 July 2022 / Accepted: 4 July 2022 / Published: 7 July 2022
(This article belongs to the Special Issue Timber Structures: Latest Developments, Challenges, and Perspectives)

Abstract

:
Environmental and urbanisation challenges have encouraged steady growth of mass timber structures where cross laminated timber (CLT) stands out in applications as full-size wall, floor, or beam elements. Beam elements are used mainly in situations where cross layers have a reinforcing effect on the tensile stress perpendicular to the beam axis, such as when introducing holes or notches, which is common practice in beams, due to engineering, installation, or architectural requirements. This paper presents experimental investigations of CLT beams with holes or notches for comparison and validation of an analytical model provided in the literature. Different sizes of holes and notches as well as different placements of the holes were considered in the experiments. All relevant failure modes were analysed and discussed in detail. Two predominant failure modes were indicated, i.e., bending failure and shear failure in crossing areas (mode III). Results further indicate that reduced lamination widths near the hole, notch, or element edges have a relatively small influence on the beam strength. Parametric studies indicate net shear failure (mode II) and tensile failure perpendicular to the beam axis as the critical failure modes in most of the considered cases, indicating their strong underestimation in design verifications according to the analytical model.

1. Introduction

In an effort to meet the challenges of environmental protection and urbanisation, timber structures have experienced steady growth in the building sector in recent decades. Attention has been focused on solid wood structures, where engineered wood products such as cross laminated timber (CLT) are advantageous due to their mechanical properties, versatility, high degree of prefabrication, and environmental sustainability. Significant research efforts have been invested in recent decades to develop reliable methods and proposals for the structural design of CLT for applications as full-size wall and floor elements for both in- and out-of-plane loading conditions [1,2].
Beam elements are commonly used within CLT wall panels, but also as standalone members in a design situation where the transverse layers have a reinforcing effect in terms of tensile stress perpendicular to the beam axis. Such situations are usually associated with the beam areas around corners of holes and notches that are subjected to high shear and tensile stresses perpendicular to the grain direction. This is even more emphasized in conventional solid timber and glued laminated timber elements, whose load carrying capacity is greatly reduced in such situations and where various strengthening methods are required for such areas. In contrast, CLT elements do not require additional strengthening methods as the tensile forces perpendicular to the beam axis can be transmitted by the transverse layers of the element’s structure.
The stress state in prismatic CLT beams is complex and influenced by many geometry parameters, so that several failure modes (FM) must be considered in the design [3,4], i.e., bending failure, gross shear failure (mode I), net shear failure (mode II), and shear failure in crossing areas (mode III). The introduction of holes or notches in prismatic CLT beams adds additional complexity to the stress state. Experimental tests of CLT beam elements with holes or notches have previously been reported by Bejtka [5], Flaig [6], and Danielsson et al. [7]. The tests were conducted using a four-point bending setup and regardless of the element lay-up or span-to-height ratio, bending at mid-span or at the edge of the hole or notch and shear failure in the crossing areas (mode III) were indicated as the predominant failure modes in most of the tests.
Standardisation of the testing and design of CLT elements is noted as one of the main issues in the ongoing revision process of Eurocode 5 (EC5). However, a consistent design approach for CLT beams with holes or notches is missing and is not included in the draft of the revised version of EC5 (CEN/TC 250/SC5) [8]. The analytical model for CLT beams with holes or notches was previously presented by Flaig [9,10]. The proposed model is generally based on the original model for prismatic CLT beams previously presented by Flaig [6] and Flaig and Blass [4,11] and on the use of stress concentration factors that account for holes or notches in CLT beams. However, the original model of Flaig and Blass [4,11], which was also used in the ongoing revision of EC5 [8] suffers from some drawbacks in terms of assumptions regarding the distributions of internal forces and shear stresses acting in the crossing areas, as pointed out in [12,13,14,15,16]. Recent 3D numerical-FE analyses, as presented by Jeleč et al. [16,17] and Danielsson et al. [18], indicate significant differences in the force and stress predictions in the crossing areas compared with the original model. Some alternative assumptions and model improvements aimed at a more accurate prediction of internal force and stress distribution were therefore presented by Danielsson and Serrano [15] and design proposals by Jeleč et al. [16,17,19,20]. However, these improved models and design proposals have not yet been adapted to consider holes or notches in CLT beam elements.
In this paper, experimental results of prismatic CLT beams with holes or end notches are presented for comparison and validation of the existing analytical model from [9,10]. Different hole or notch sizes and different hole arrangements in CLT beams were considered. The influence of different lamination widths near the beam edges or hole and notch corners is discussed. All relevant failure modes were considered and failure propagation related to global and local behaviour is discussed in detail. Finally, the experimentally determined failure modes are compared with the predictions of the analytical model.

2. Analytical Model

2.1. Background and Limitations
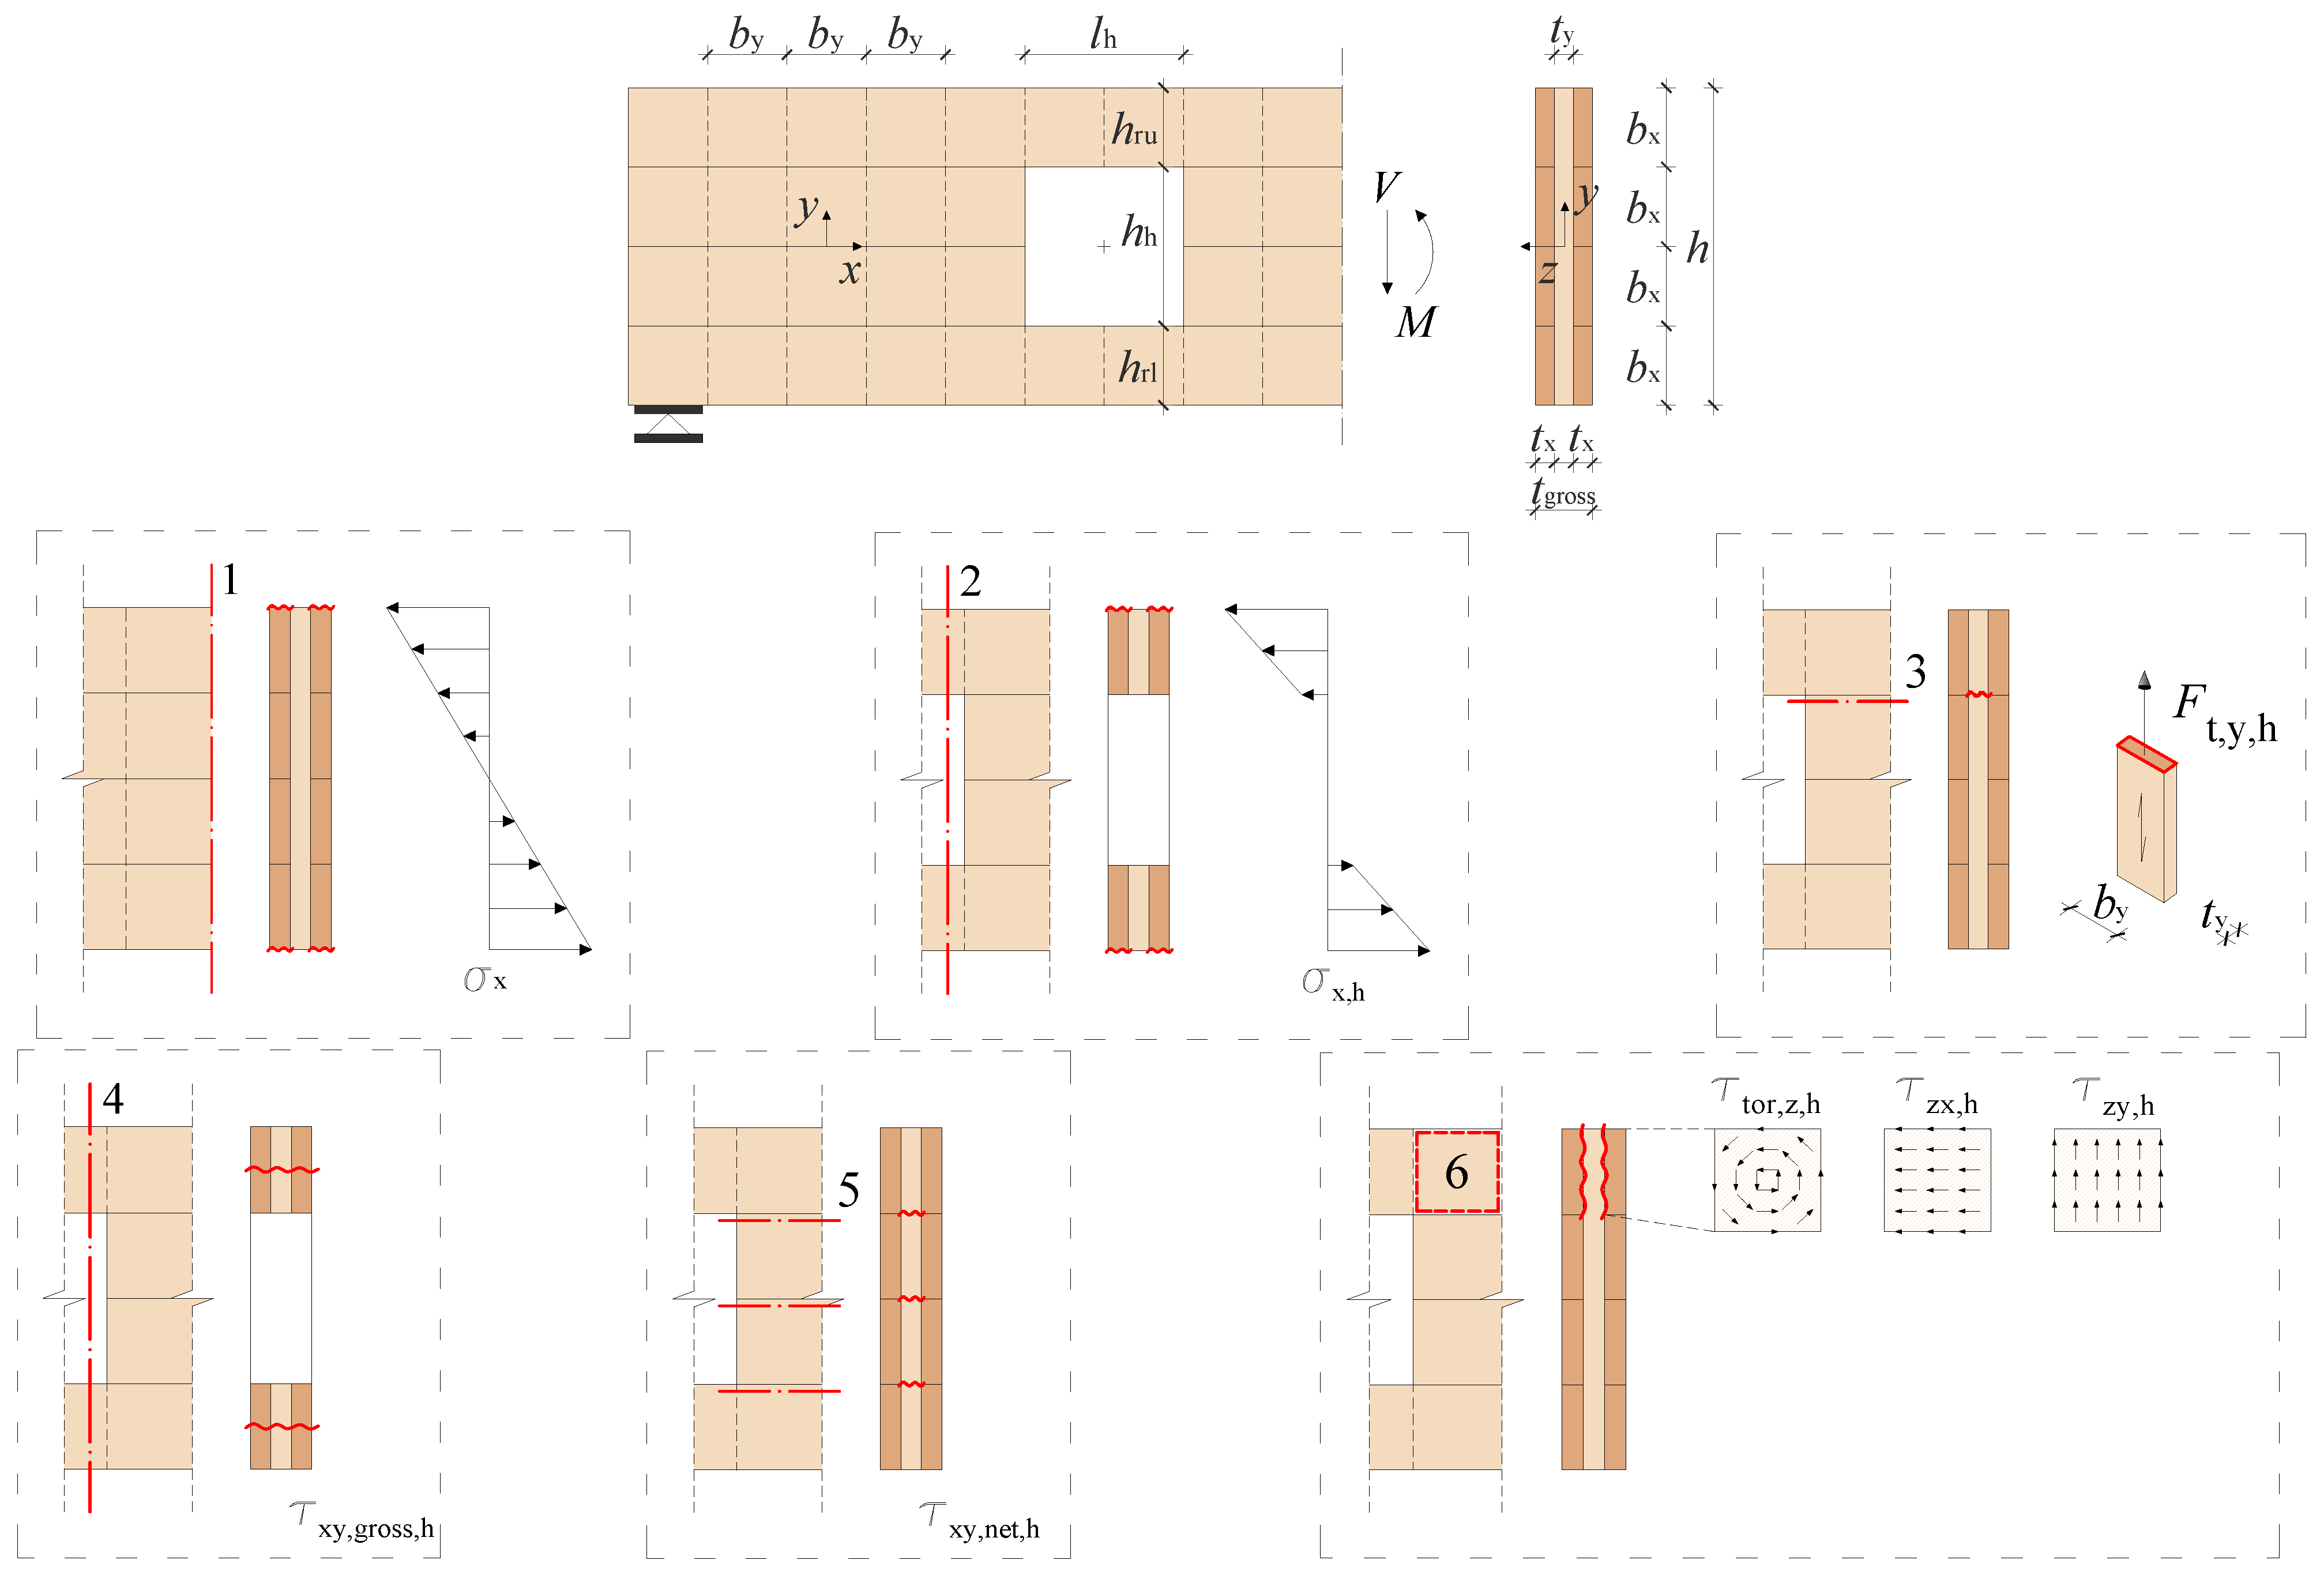
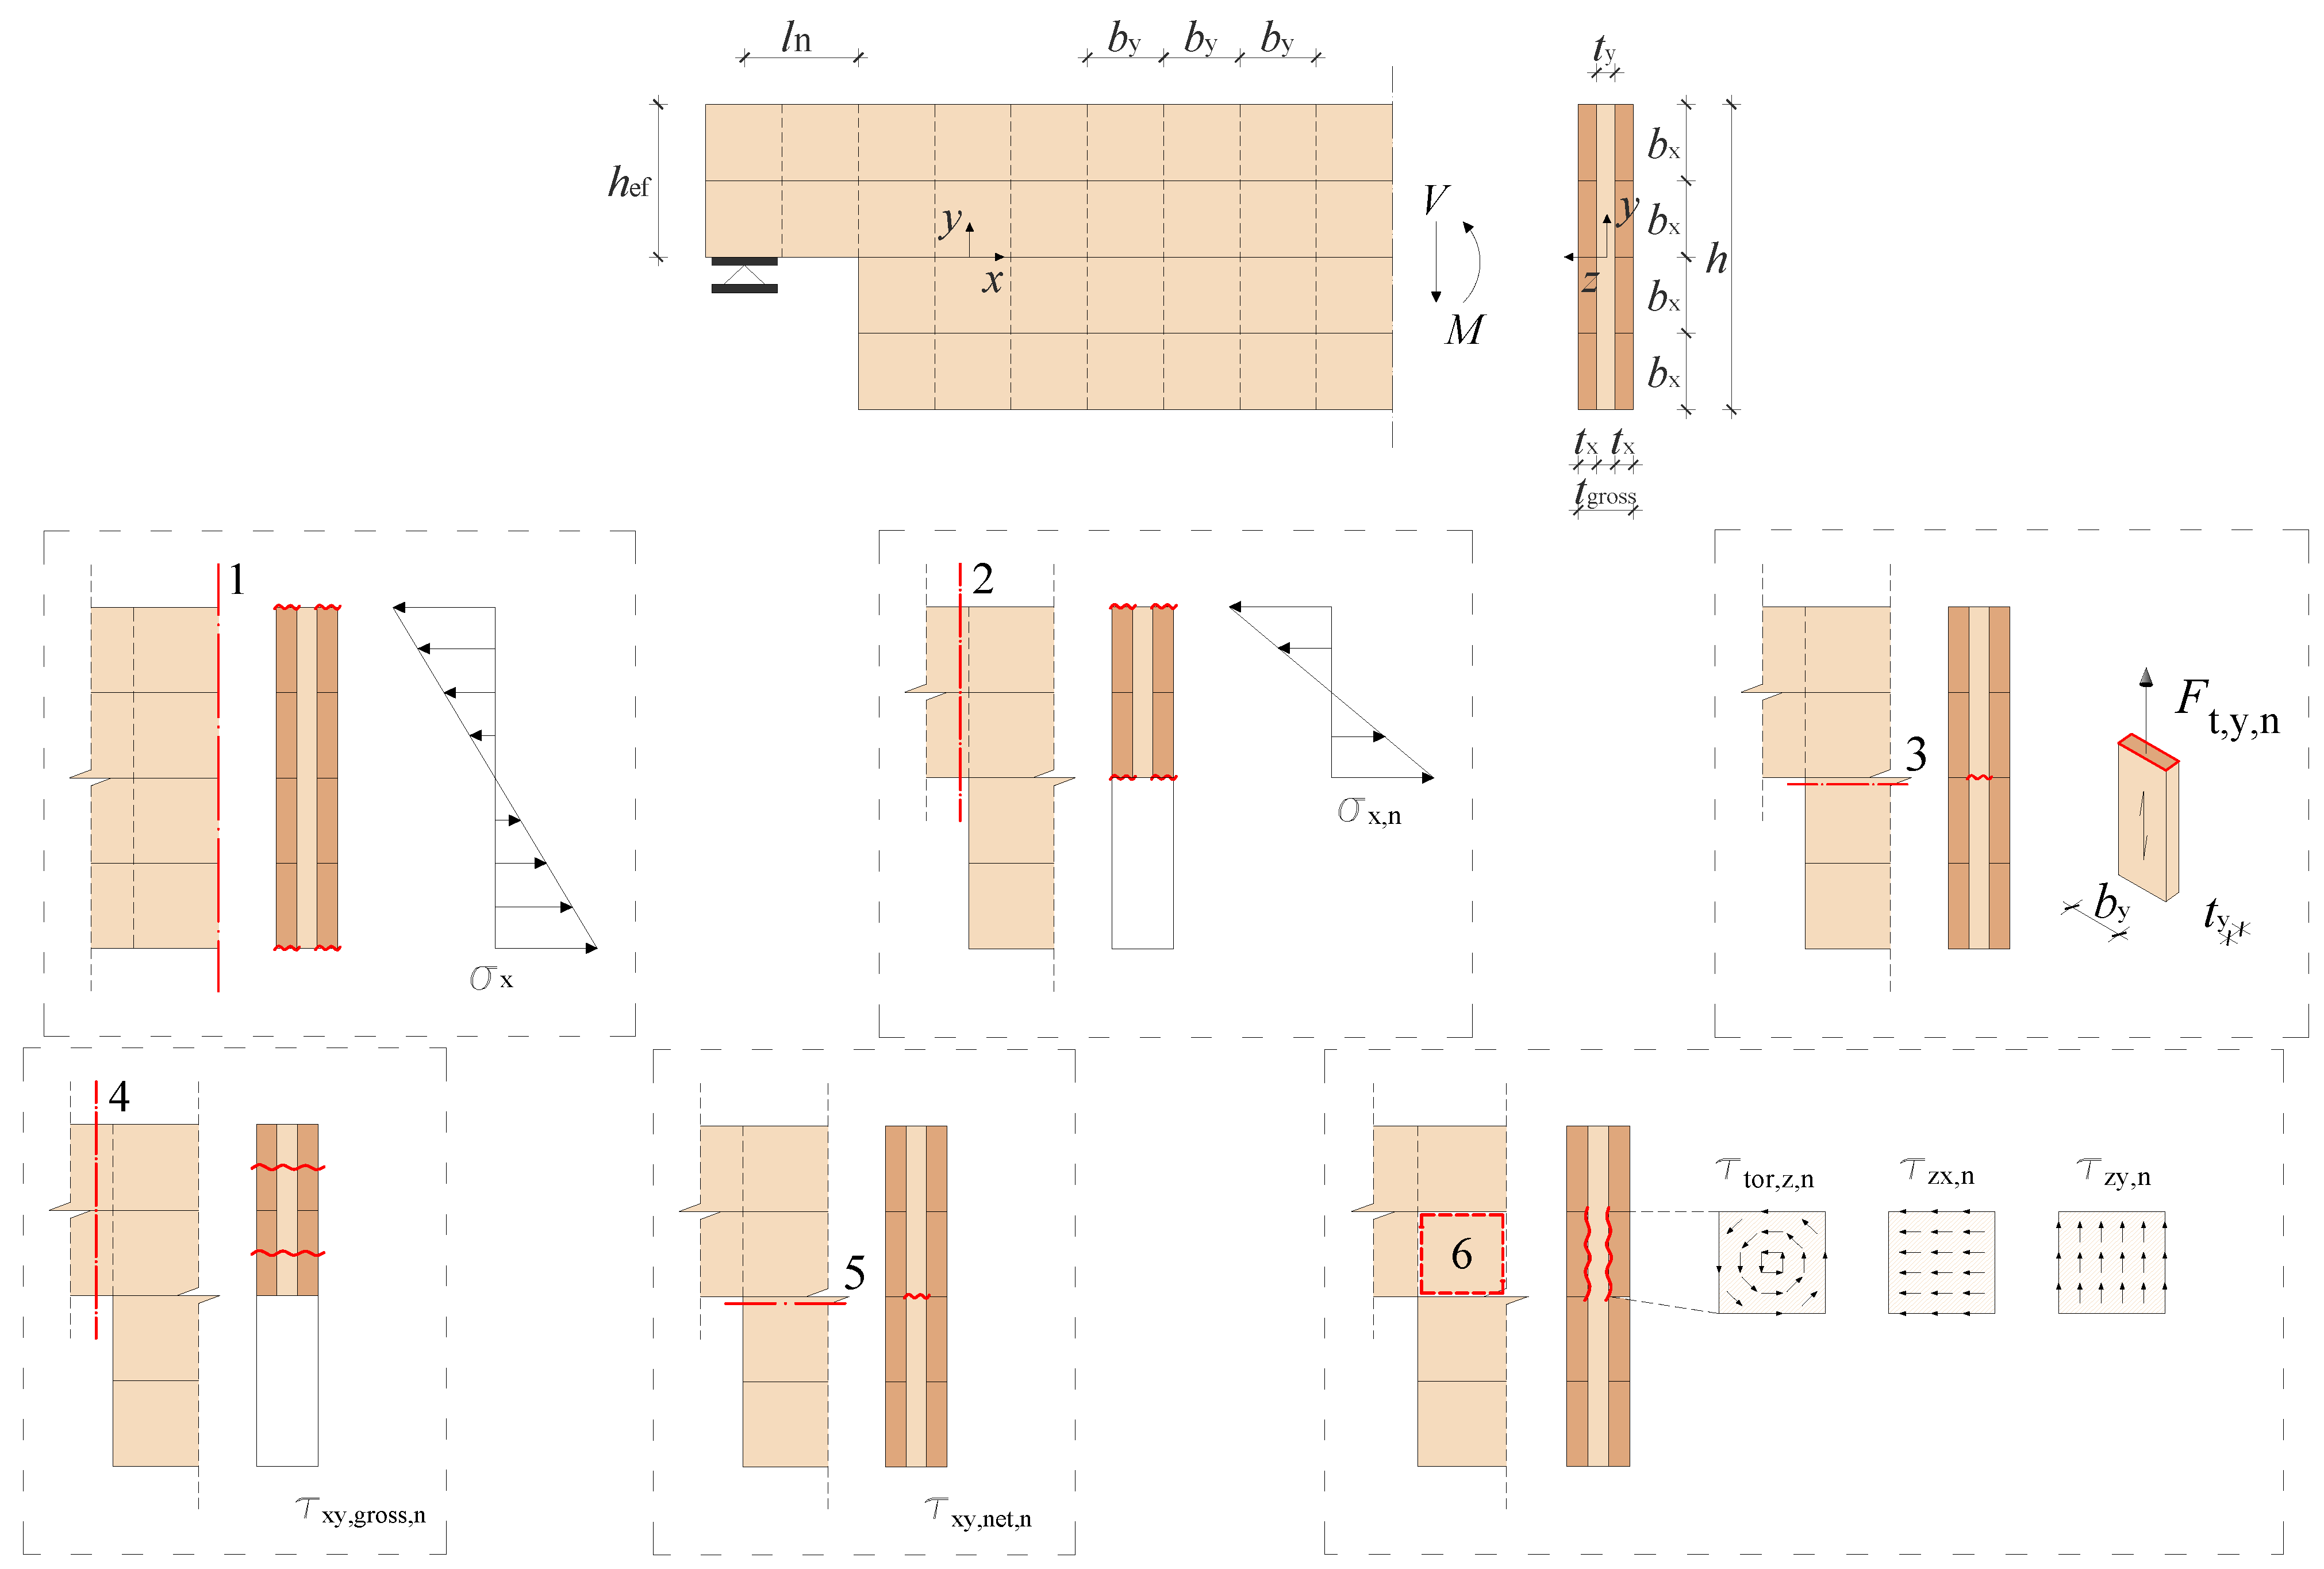
The analytical model for CLT beams with holes or notches, as presented in [9,10], is briefly reviewed below. The approach is generally based on prismatic CLT beams according to the model previously described in [6,11], where stress concentration factors were introduced to account for differences in stress distribution between a prismatic beam and a beam with a hole or notch. These factors were determined by varying different geometry parameters of beams, holes, and notches in 1-D FE analyses; see Figure 1 and Table 1.
The FE model consisted of a network of longitudinal and transverse beam elements of equal width bx = by. The geometries of the beams, holes and notches were based on an integer number of the lamination width b and their edges always coincided with the lamination edge, keeping constant the prismatic shape and the central position of the holes. The ratios between the total thickness of the transverse layers and the gross cross-sectional thickness, tnet,y/tgross, and between the gross cross-sectional thickness and the number of crossing areas in the beam thickness direction, tgross/nCA, were also kept constant. The contact between a longitudinal and a transverse lamination was modelled as pointwise by three springs, assuming that there was no edge-bonding, i.e., no contact between the narrow faces of adjacent laminations within the same layer.

2.2. Failure Modes

Several failure modes must be considered in the design of CLT beams with holes or notches, see numbered sections (1–6) in Figure 2 and Figure 3, as follows: (1) bending, (2) bending at the edge of a hole or notch, (3) tension perpendicular to the beam axis, (4) gross shear failure (mode I), (5) net shear failure (mode II), and (6) shear failure in crossing areas (mode III).
For the failure modes related to bending (1–2), a conventional beam theory is considered by assuming a linear strain distribution in the beam height (y) direction. Due to the low stiffness perpendicular to the grain, the normal stress σx is assumed to be present only in the longitudinal laminations and uniformly distributed in the beam width (z) direction. Failure mode (1) is therefore the same as for a prismatic CLT beam and should be checked at a point where the cross-section is complete with maximum bending moment values; see Figure 2 and Figure 3.
Failure modes (2–3) are more specific and should be verified at the edges of holes or notches; see Figure 2 and Figure 3. For failure mode (2) and the case of the beam with a prismatic hole, the maximum normal stress σx,h should be calculated as the sum of the bending stress of the full cross-section and a contribution from the additional local bending of the parts above and below the hole. For notched beams and failure mode (2), the maximum normal stress σx,n should be calculated based on the effective or reduced beam height at the notch.
The introduction of a hole or notch in a beam also implies the introduction of tensile and compressive forces perpendicular to the beam axis; see Figure 2 and Figure 3. The verification of these forces and the corresponding stresses at the edge of the hole or notch is covered by the failure mode (3). Due to the cross-wise structure of CLT and the high ratio between the stiffness parallel and perpendicular to the grain, it is assumed that the tensile stresses σt,h and σt,n are carried only by the transverse laminations, which represent the tensile stresses parallel to the grain in them.
Such cross-wise composition without edge-bonding leads to heterogeneity, not only in the wood material itself, but also in the geometry of the CLT elements. Three possible shear failure modes are therefore commonly analysed for in-plane loaded CLT elements [3,4]; see Figure 2 and Figure 3 and sections (4–6). Gross shear failure, known as failure mode I (FM I), refers to edge-bonded CLT elements considering a full interaction that allows for pure and equal shear deformation in all layers. Net shear failure, known as FM II, refers to non-edge-bonded CLT elements in which the longitudinal or transverse layers fail in shear along a failure plane that coincides with the gaps between those layers. Both gross and net shear failures include the shear stress τxy (τyx), which represents the shear in the longitudinal and transverse directions for a single lamination. Torsional shear failure, known as FM III, refers to non-edge-bonded CLT elements and the failure of the glued crossing area between a longitudinal and a transverse lamination. Therefore, the shear stress acting in crossing areas can be decomposed into the components (1) shear stress parallel to the beam axis, i.e., τzx; (2) shear stress perpendicular to the beam axis, i.e., τzy; and (3) torsional shear stress over the crossing area, i.e., τtor,z. The stress components τzx and τzy correspond to the longitudinal-transverse shear stress and the rolling shear stress for the glued face of longitudinal lamination and vice versa for transverse lamination. However, according to the results of the FE analysis [9], it was found that for CLT beams with notches, the shear stress parallel to the beam axis τzx is lower than the shear stress perpendicular to the beam axis τzy, so only the shear stress components τtor,z and τzy should be considered for design.
The respective maximum stresses associated with the corresponding failure modes for CLT beams with holes and notches are explained below.

2.3. Stress Calculation

2.3.1. Bending

The maximum normal stress where the bending moment has its maximum may be calculated for beams with holes (Figure 2) or notched beams (Figure 3) according to:
σ x = M W net   where   W net = t net , x h 2 6   with   t net , x = t x
where M is the maximum bending moment, tnet,x is the sum of the longitudinal layer thicknesses and h is the beam height.
For beams with a symmetrically arranged hole in the beam height (y) direction, length of lh and height hh, the maximum normal stress at the edge of the hole (Figure 2) may be calculated as follows:
σ x , h = M h W net , h + M r W net , r
with
W net , h = t net , x ( h 3 h h 3 ) 6 h   and   W net , r = t net , x ( h h h ) 2 24
where Mh is the bending moment at the centre of the hole, Mr = V/2·lh/2 is the additional bending moment of parts above and below the hole.
For notched beams, the maximum normal stress at the notched corner (Figure 3) may be calculated as follows:
σ x , n = M n W n   with   M n = l n V   and   W n = t net , x h ef 2 6
where Mn is the bending moment at the corner of the notch, V is the shear force or the support reaction force, ln is the distance from the support to the notch corner and hef is the effective beam height at the notch.

2.3.2. Tension Perpendicular to Beam Axis

The tensile force perpendicular to the beam axis for beams with holes (Figure 2) and notched beams (Figure 3) may be calculated according to [9,10] in accordance with the German National Annex (NA) to EC5 [21] as follows:
F t , y , h = F t , y , V + F t , y , M = V h h h 4 h ( 3 h h 2 h 2 ) + 0.008 M h h r
and
F t , y , n = 1.3 V n [ 3 ( 1 h ef h ) 2   2 ( 1 h ef h ) 3 ]
where Ft,y,V and Ft,y,M are components from the shear force Vh and bending moment Mh at the edge of the hole, hr = min (hru; hrl) is the minimum residual height of the beam above or below the hole, and Vn is shear force on notched corner or the support reaction force.
The corresponding tensile stress perpendicular to the beam axis may be calculated according to [9,10] in accordance with the German NA to EC5 [21] as follows:
σ t , y , h = k k F t , y , h a r t net , y   where   a r = min { b y ;   0.3 ( h + h h ) }     with   t net , y = t y
and
σ t , y , n = k k F t , y , n l r t net , y   where   l r = min { b y ;   0.5 ( h h ef ) }     with   t net , y = t y
where kk = 2.0 is a factor which considers non-uniform stress distribution and tnet,y is the sum of the transverse layer thicknesses.

2.3.3. Shear Mode I

The maximum shear stress for gross shear failure in beams with holes (Figure 2) and notched beams (Figure 3) may be calculated according to [9,10] as follows:
τ xy , gross , h = 3 2 V ( h h h ) t gross     with   t gross = t net , x + t net , y  
and
τ xy , gross , n = 3 2 V t gross h ef     with   t gross = t net , x + t net , y  
without considering any effect of stress concentration induced by the hole or notch.

2.3.4. Shear Mode II

The maximum shear stress for net shear failure in beams with holes (Figure 2) and notched beams (Figure 3) may be calculated according to [9,10] as follows:
τ xy , net , h = τ xy , net k h 2 k b = 3 2 V t net h k h 2 k b     with   t net = min { t net , x ;   t net , y }
and
τ xy , net , n = τ xy , net k n k b = 3 2 V t net h k n k b     with   t net = min { t net , x ;   t net , y }
with
k b = ( b 150 ) 1 / 3     for   100   mm     b     200   mm
where τxy,net is the maximum net shear stress for a prismatic beam without a hole or notch, kb is the lamination width factor, and where kh2 and kn are the stress concentration factors according to Equations (14) and (15), as follows:
k h 2 = [ 0.103 ( h h l h h 2 m 2 ) + 1.27 ]
and
k n = 0.877 ( h ef h ) k c   and     k c = 1.81 ( c h ) 0.479

2.3.5. Shear Mode III

The maximum torsional shear stress for beams with holes (Figure 2) and notched beams (Figure 3) may be calculated according to [9,10] as follows:
τ tor , z , h = τ tor , z k h 1 k b = 3 V b 2 n CA ( 1 m 1 m 3 ) k h 1 k b
and
τ tor , z , n = τ tor , z k n k b = 3 V b 2 n CA ( 1 m 1 m 3 ) k n k b
where τtor,z is the maximum torsional shear stress for a prismatic beam without a hole or notch, kb is the lamination width factor according to Equation (13), nCA is the number of crossing areas in the beam width direction, m is the number of longitudinal laminations in the beam height direction and kh1 and kn are the stress concentration factors according to Equations (15) and (18), as follows:
k h 1 = [ 1.81 ( l h h h h ( h h h ) ) + 1.14 ]
The maximum shear stress perpendicular to the beam axis for beams with holes (Figure 2) and notched beams (Figure 3) may be calculated according to [9,10] as follows:
τ zy , h = F t , y , h n CA a r h r     with   a r = min { b y ;   0.3 ( h + h h ) }   and   h r = min { h ru ;   h rl }
and
τ zy , n = F t , y , n n CA l r h n     with   l r = min { b y ;   0.5 ( h h ef ) }   and   h n = min { h ef ;   h h ef }
where Ft,y,h and Ft,y,n are the tensile forces perpendicular to the beam axis according to Equations (5) and (6).
The maximum shear stress parallel to the beam axis for beams with holes (Figure 2) may be calculated according to [9,10] as follows:
τ zx , h = τ zx k h 2 k b = 6 V b 2 n CA ( 1 m 2 1 m 3 ) k h 2 k b
where τzx is the maximum shear stress parallel to the beam axis for a prismatic beam without a hole, kh2 is the stress concentration factor according to Equation (14), and kb is the lamination width factor according to Equation (13).

2.4. Design Verification

Each stress component should be checked against the appropriate strength values in design verifications according to relevant failure modes (Figure 2 and Figure 3). Normal stresses due to bending and tensile stresses perpendicular to the beam axis should be verified against the bending strength and tensile strength parallel to the grain, respectively, based on the values for the strength class of the laminations in EN 338 [22]. Shear stresses should be verified against appropriate shear strengths in the design procedure. For gross shear failure (FM I), a shear strength for the lamination strength class in EN 338 [22] with kcr = 1.0 was proposed in [4,11]. A single characteristic value of fv,gross,k = 3.50 MPa was suggested in [3], considering shrinkage cracks by reducing the thickness of exterior layers by 50% when determining tgross. For net shear failure (FM II), the determination of net shear strength is not so straightforward, see [23,24,25], and no values for the strength class of the laminations were provided in EN 338 [22]. Based on the most recent comprehensive experimental study [3], a conservative reference net shear strength of fv,net,k,ref = 5.50 MPa is proposed for layer thicknesses t < 40 mm, while for layer thicknesses 20 < t < 40 mm, the net shear strength is provided as follows:
f v , net , k = f v , net , k , ref min { ( 40 t ) 0.3 ;   1.20 }
For shear failure in crossing areas (FM III), due to shear stresses in two directions, a stress interaction criterion for shear strength verification is required. Based on experimental tests of individual crossing areas, several possible stress interaction criteria were discussed in [4,11] with the most appropriate one being defined as:
τ tor , z f v , tor + τ zx f R     1.0
τ tor , z f v , tor + τ zy f R     1.0
where fv,tor is a torsional shear strength and fR is the rolling shear strength. A compilation of literature-based test results on individual crossing areas was presented in [16,17], indicating mean values of fv,tor,mean = 3.50 N/mm2 and fR,mean = 1.50 N/mm2, where both strength components are seemingly size-independent with a constant ratio fv,tor/fR ≈ 2.25–2.5. A characteristic torsional shear strength of fv,tor,k = 2.50 MPa was proposed in [2] and a rolling shear strength of fR,k = 1.40 MPa for b/t ≥ 4 and fR,k = 0.80 MPa for b/t < 4 was proposed in [26].

3. Experimental Tests

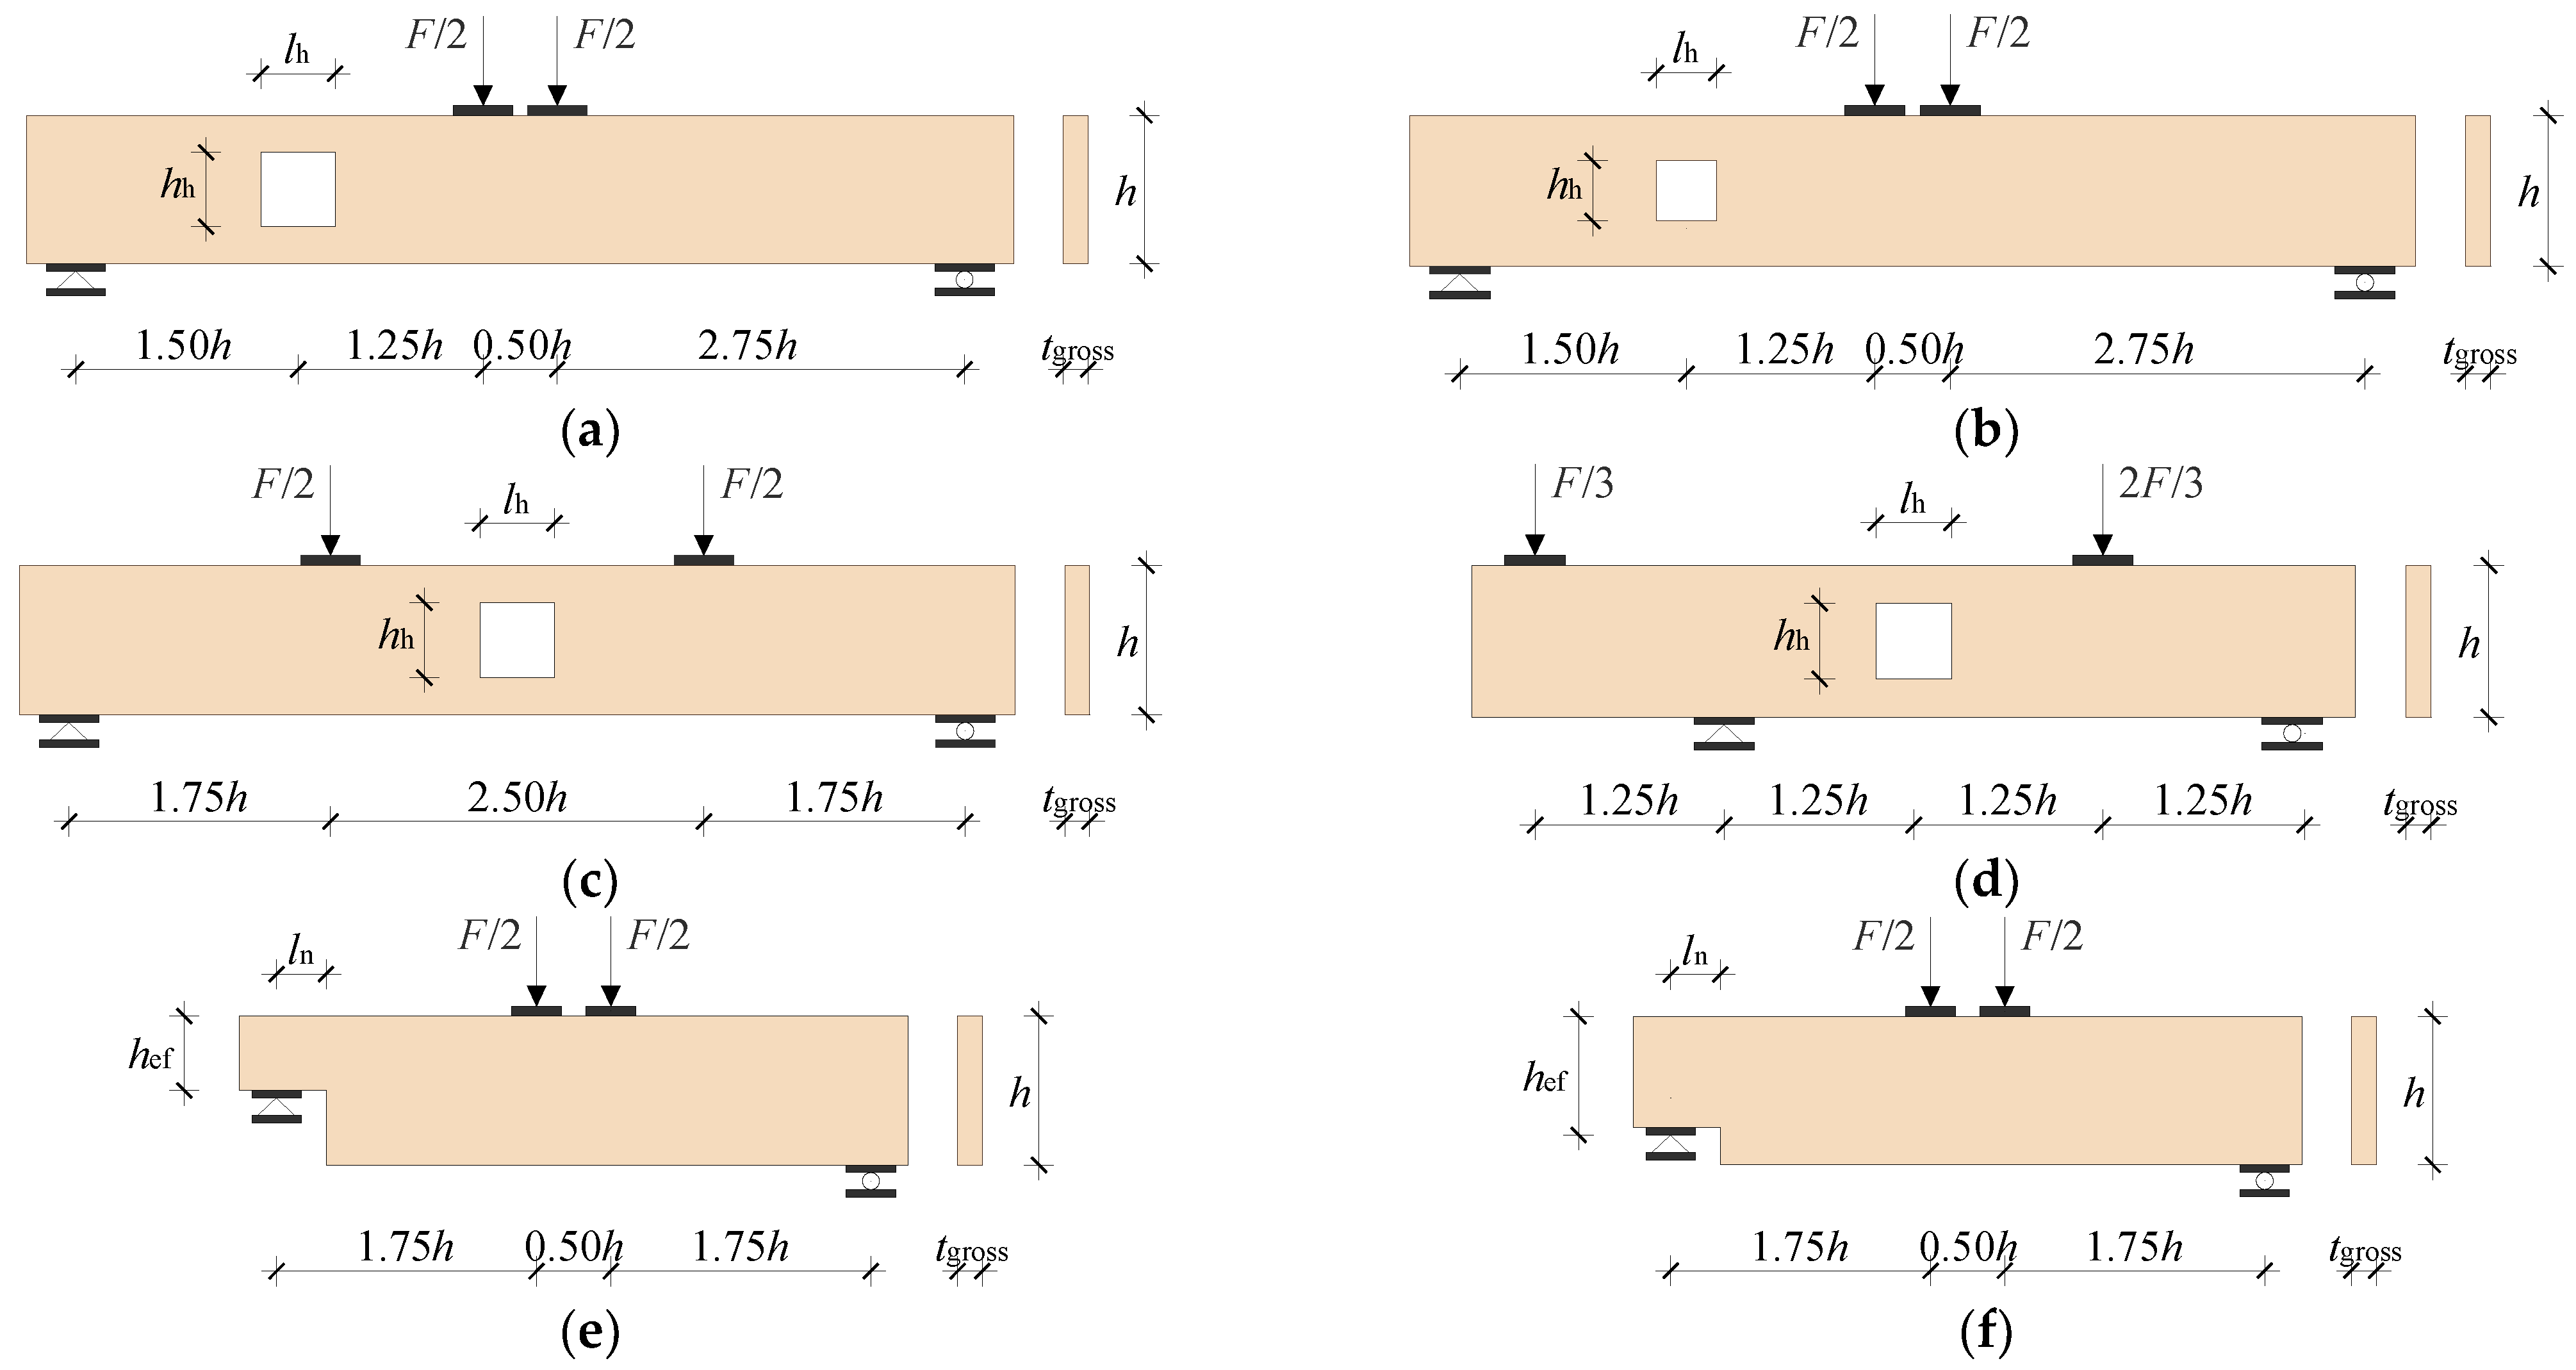
3.1. Test Setups and Materials

The geometry of the test series and test setups of CLT beams with holes and notches are shown in Table 2 and Figure 4. A total of 24 individual tests were carried out, divided into six test series with four nominally equal specimens in each test series. Four test series consisted of CLT beams with holes (H1 to H4) and two test series of notched CLT beams (N1 and N2). The nominal cross-section dimensions were equal for all specimens, with the element layup composed of two longitudinal and one transverse layer.
A square centre-placed hole with a side length of 300 mm was placed in test series H1, H3, and H4, and 240 mm in test series H2. Thus, the hole height to beam height ratio is hh/h = 0.50 in test series H1, H3, and H4, and hh/h = 0.40 in test series H2, which is slightly higher or corresponds to the maximum proposed ratio (hh/h = 0.40) for reinforced glulam and solid wood members in the German and Austrian NA to EC5 [21]. In the test series H1 and H2, the hole was placed at a location subjected to combined shear force and bending moment loading (M/V = 1.50h). In test series H3, the centre of the hole was in a position without shear force and thus in a pure bending condition (M/V = ∞), and in test series H4, the hole was in a position without bending moment and thus in a pure shear condition (M/V = 0). These test series, H3 and H4, represent idealised stress states used only to validate an existing analytical model.
For the notched test series, N1 and N2, a notch with a depth of 300 and 450 mm was used. The ratio of notch depth to beam height was then hef/h = 0.50 in test series N1 and hef/h = 0.75 in test series N2, which corresponds to the maximum suggested ratio (hef/h = 0.50) for reinforced glulam and solid timber beams in the German and Austrian NA to EC5 [21]. Steel plates at supports and load introduction points were used to ensure adequate load distribution. Lateral stability problems were avoided by lateral supports at several locations along the beam for all test specimens.
All beam specimens were cut from larger CLT 3s panels fabricated of equal lamination width of bx = by = 198 mm, without considering the location of individual lamination with respect to beam edges, holes, or notches. The number and position of the laminations within the beam elements hence varied between test specimens and within a single test series. The cross-sectional dimensions of the individual laminations were measured for all beams and small deviations compared with the nominal dimensions were found; see Figure 5 and Table 3.
All test specimens were manufactured by Hasslacher Norica Timber in accordance with the European Technical Assessment ETA 12/0281 [27]. The specimens were manufactured from species specified as European spruce or equivalent softwood, using a melamine-urea-formaldehyde (MUF) adhesive without edge-bonding and with the minimum limitations related to the CLT manufacturer’s quality description, i.e., knots, pitch pockets, initial cracks, and other visual defects. The outer layers consisted of C24 lamination strength class, while the inner layers were up to 30% of C16. Small samples were taken from each specimen, on which the mean moisture content was determined as 11.7, 11.5, 11.7, and 12.2%, and the mean densities as 464, 455, 435, and 465 kg/m3 for the test series with holes, H1 to H4. For the test series with notches, N1 and N2, the mean moisture content was determined to be 11.9 and 12.0% and the mean density 448 and 449 kg/m3, respectively.

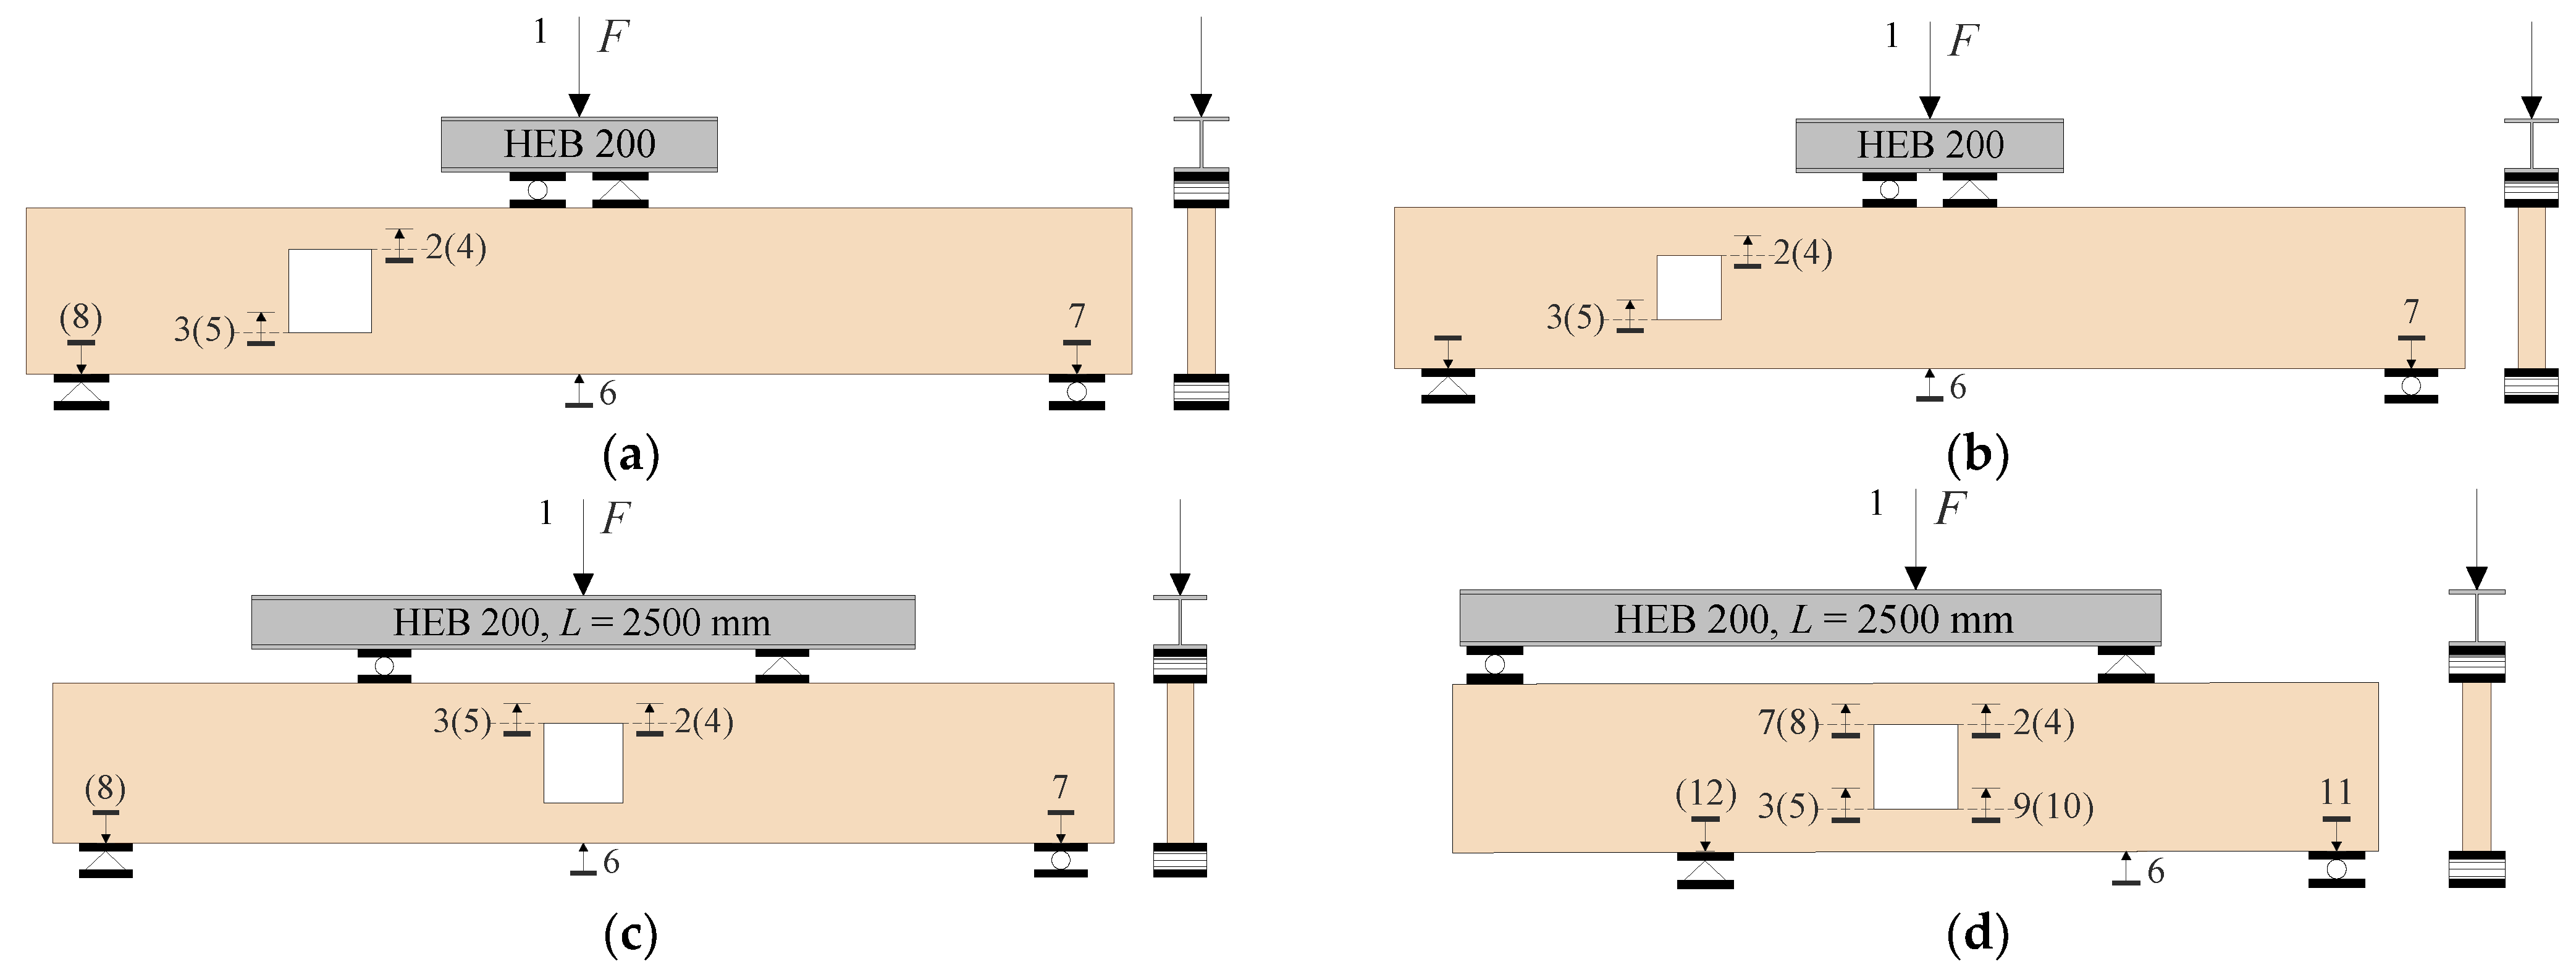
3.2. Test Procedure and Measurements

All static laboratory tests were carried out using a 600 kN Zwick/Roell dynamic hydraulic actuator and the loading was applied in displacement-controlled mode. The displacement rate was 0.01 mm/s for all test series, resulting in a test duration of approximately 15–20 min and allowing careful observations of critical locations where cracks were expected. The positions and labels of displacement measuring devices (LVDTs) are shown schematically in Figure 6, with the labels in brackets referring to the back side of the beam. In addition to the mid-span and the beam supports, the devices were also positioned at the tensile corners where the first cracks were expected to occur; see Figure 7. In the test series H4, the devices were also positioned at the compression corners of the hole. In all test series, the measurement length (vertical distance) was set to 100 mm. The intention was to measure the displacement within a single longitudinal lamination. Therefore, the devices were positioned depending on the reduced lamination width, see Table 3, and the location of gaps near the hole and notch. The devices were positioned at a horizontal distance of 50 mm from the edge of the hole or 15 mm from the notched edge. The horizontal distance between two devices in the notched test series was 70 mm.

4. Test Results

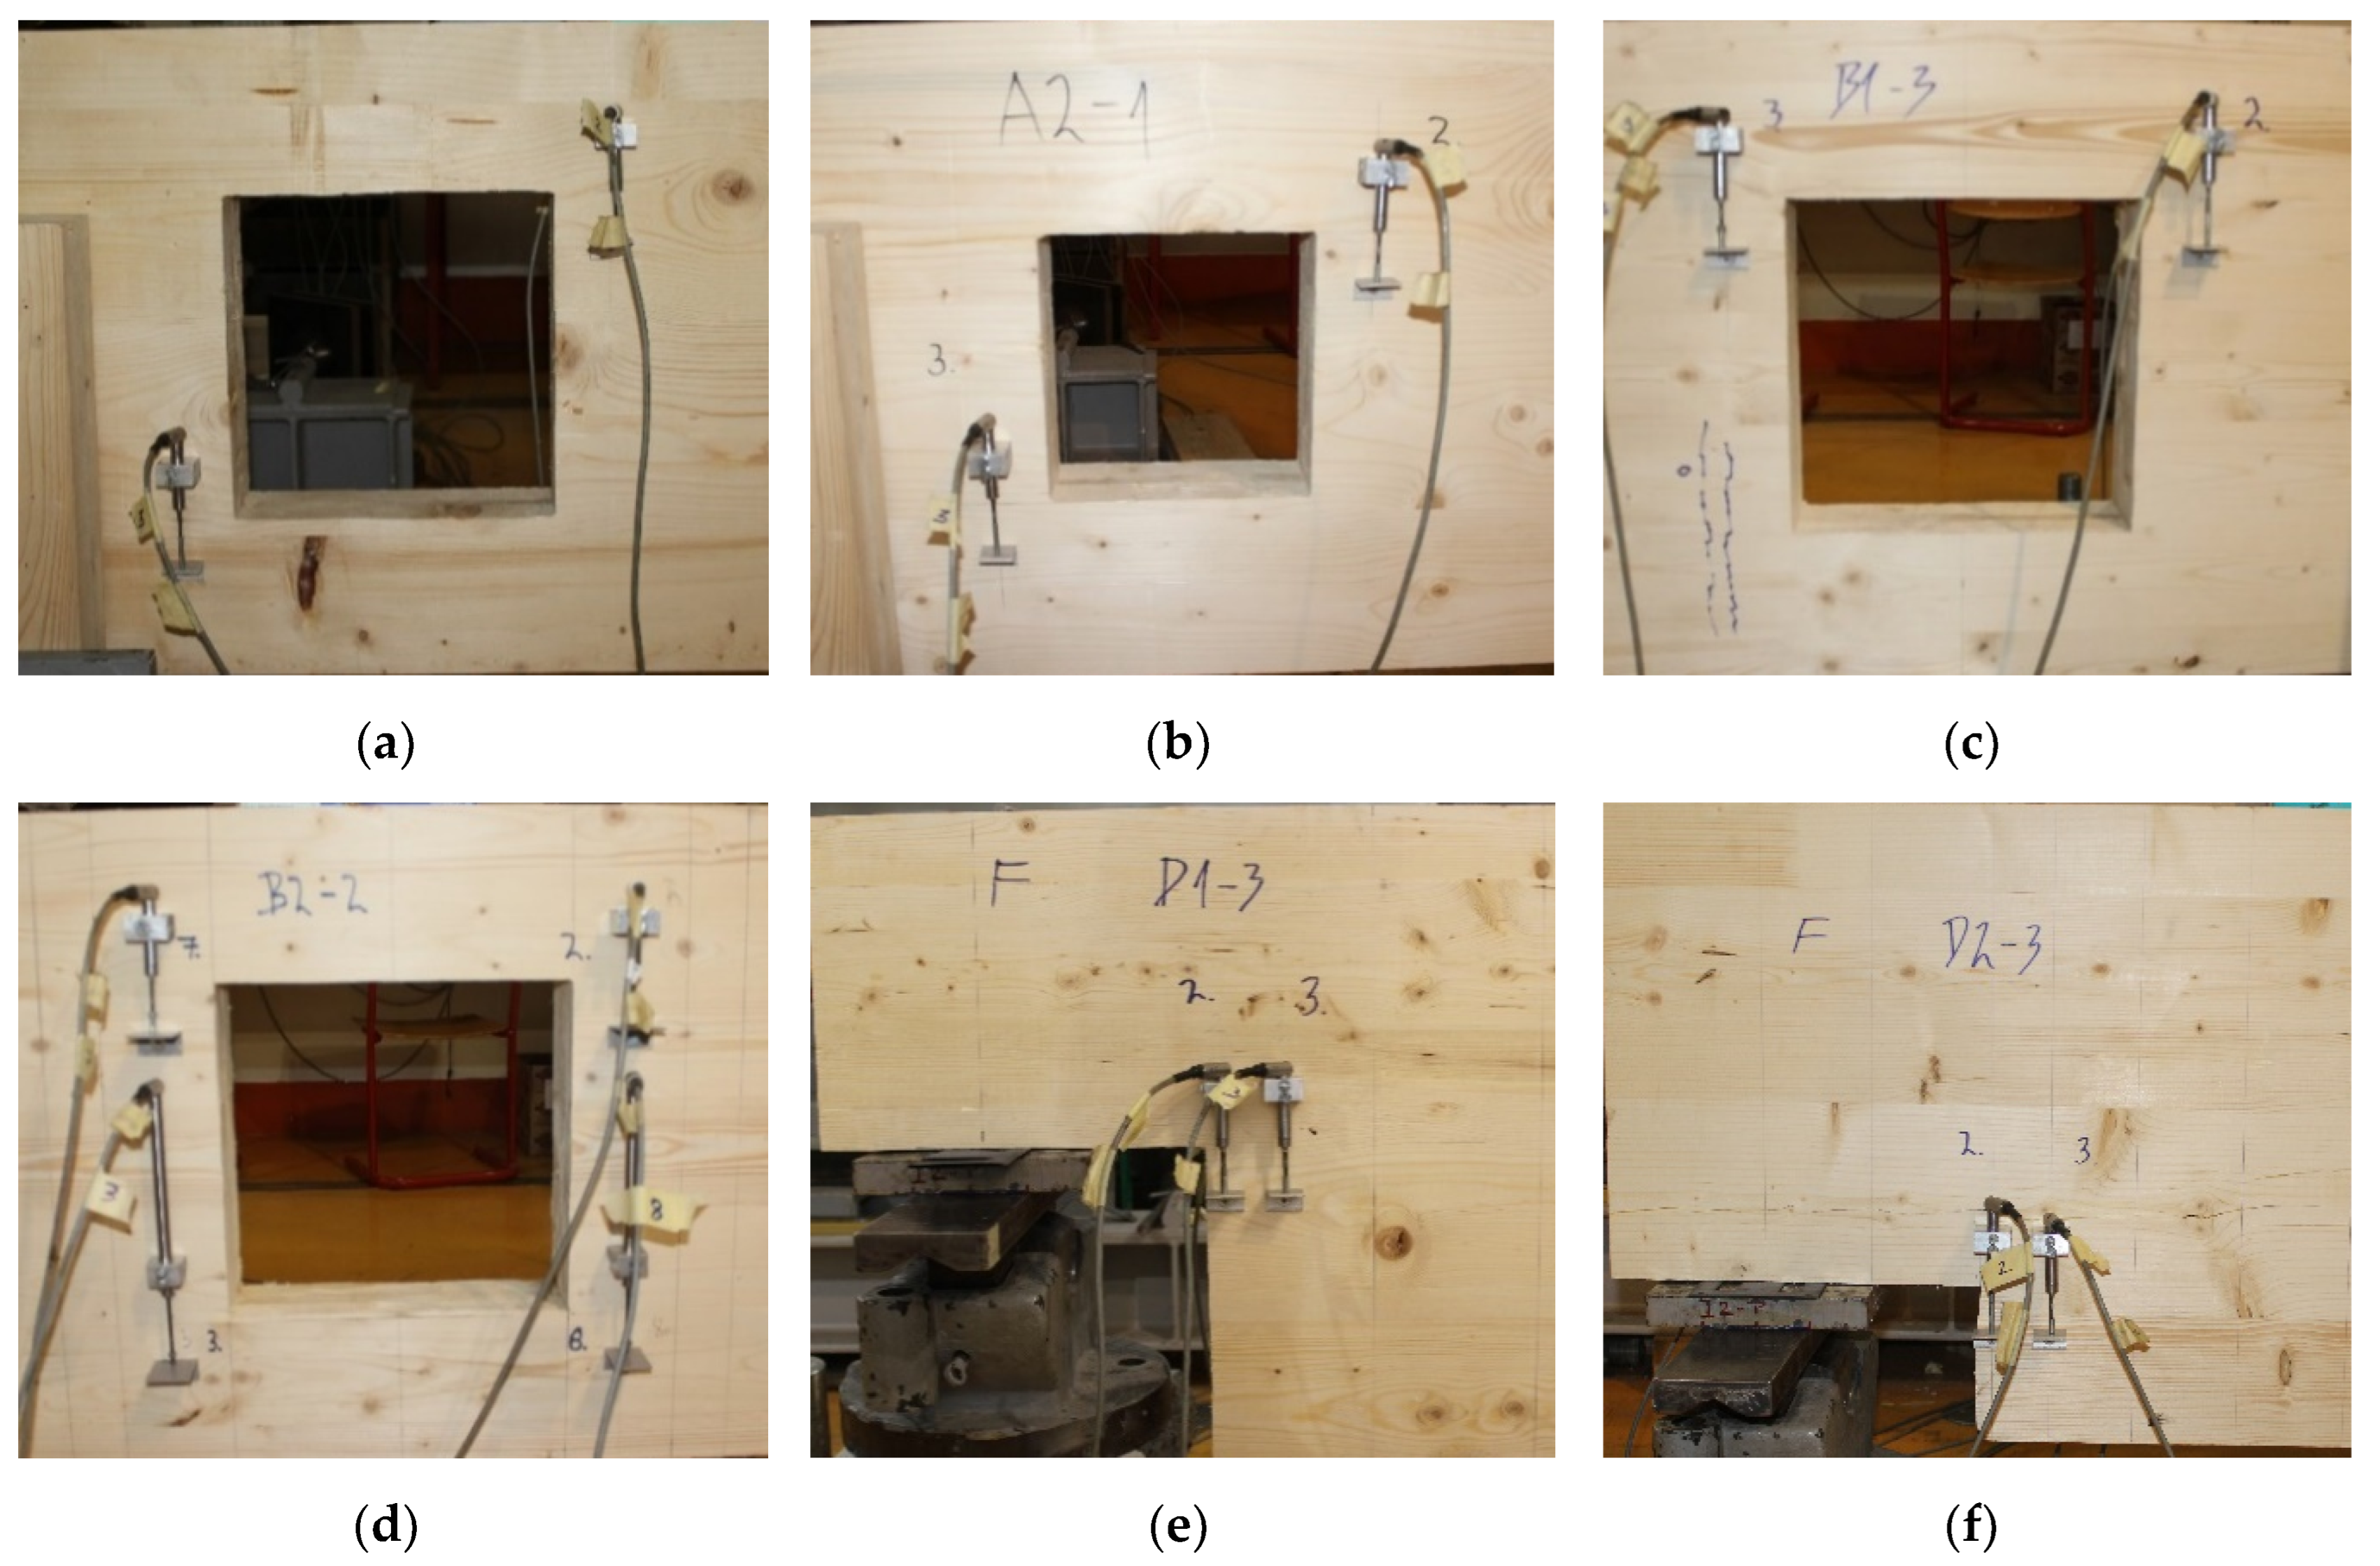
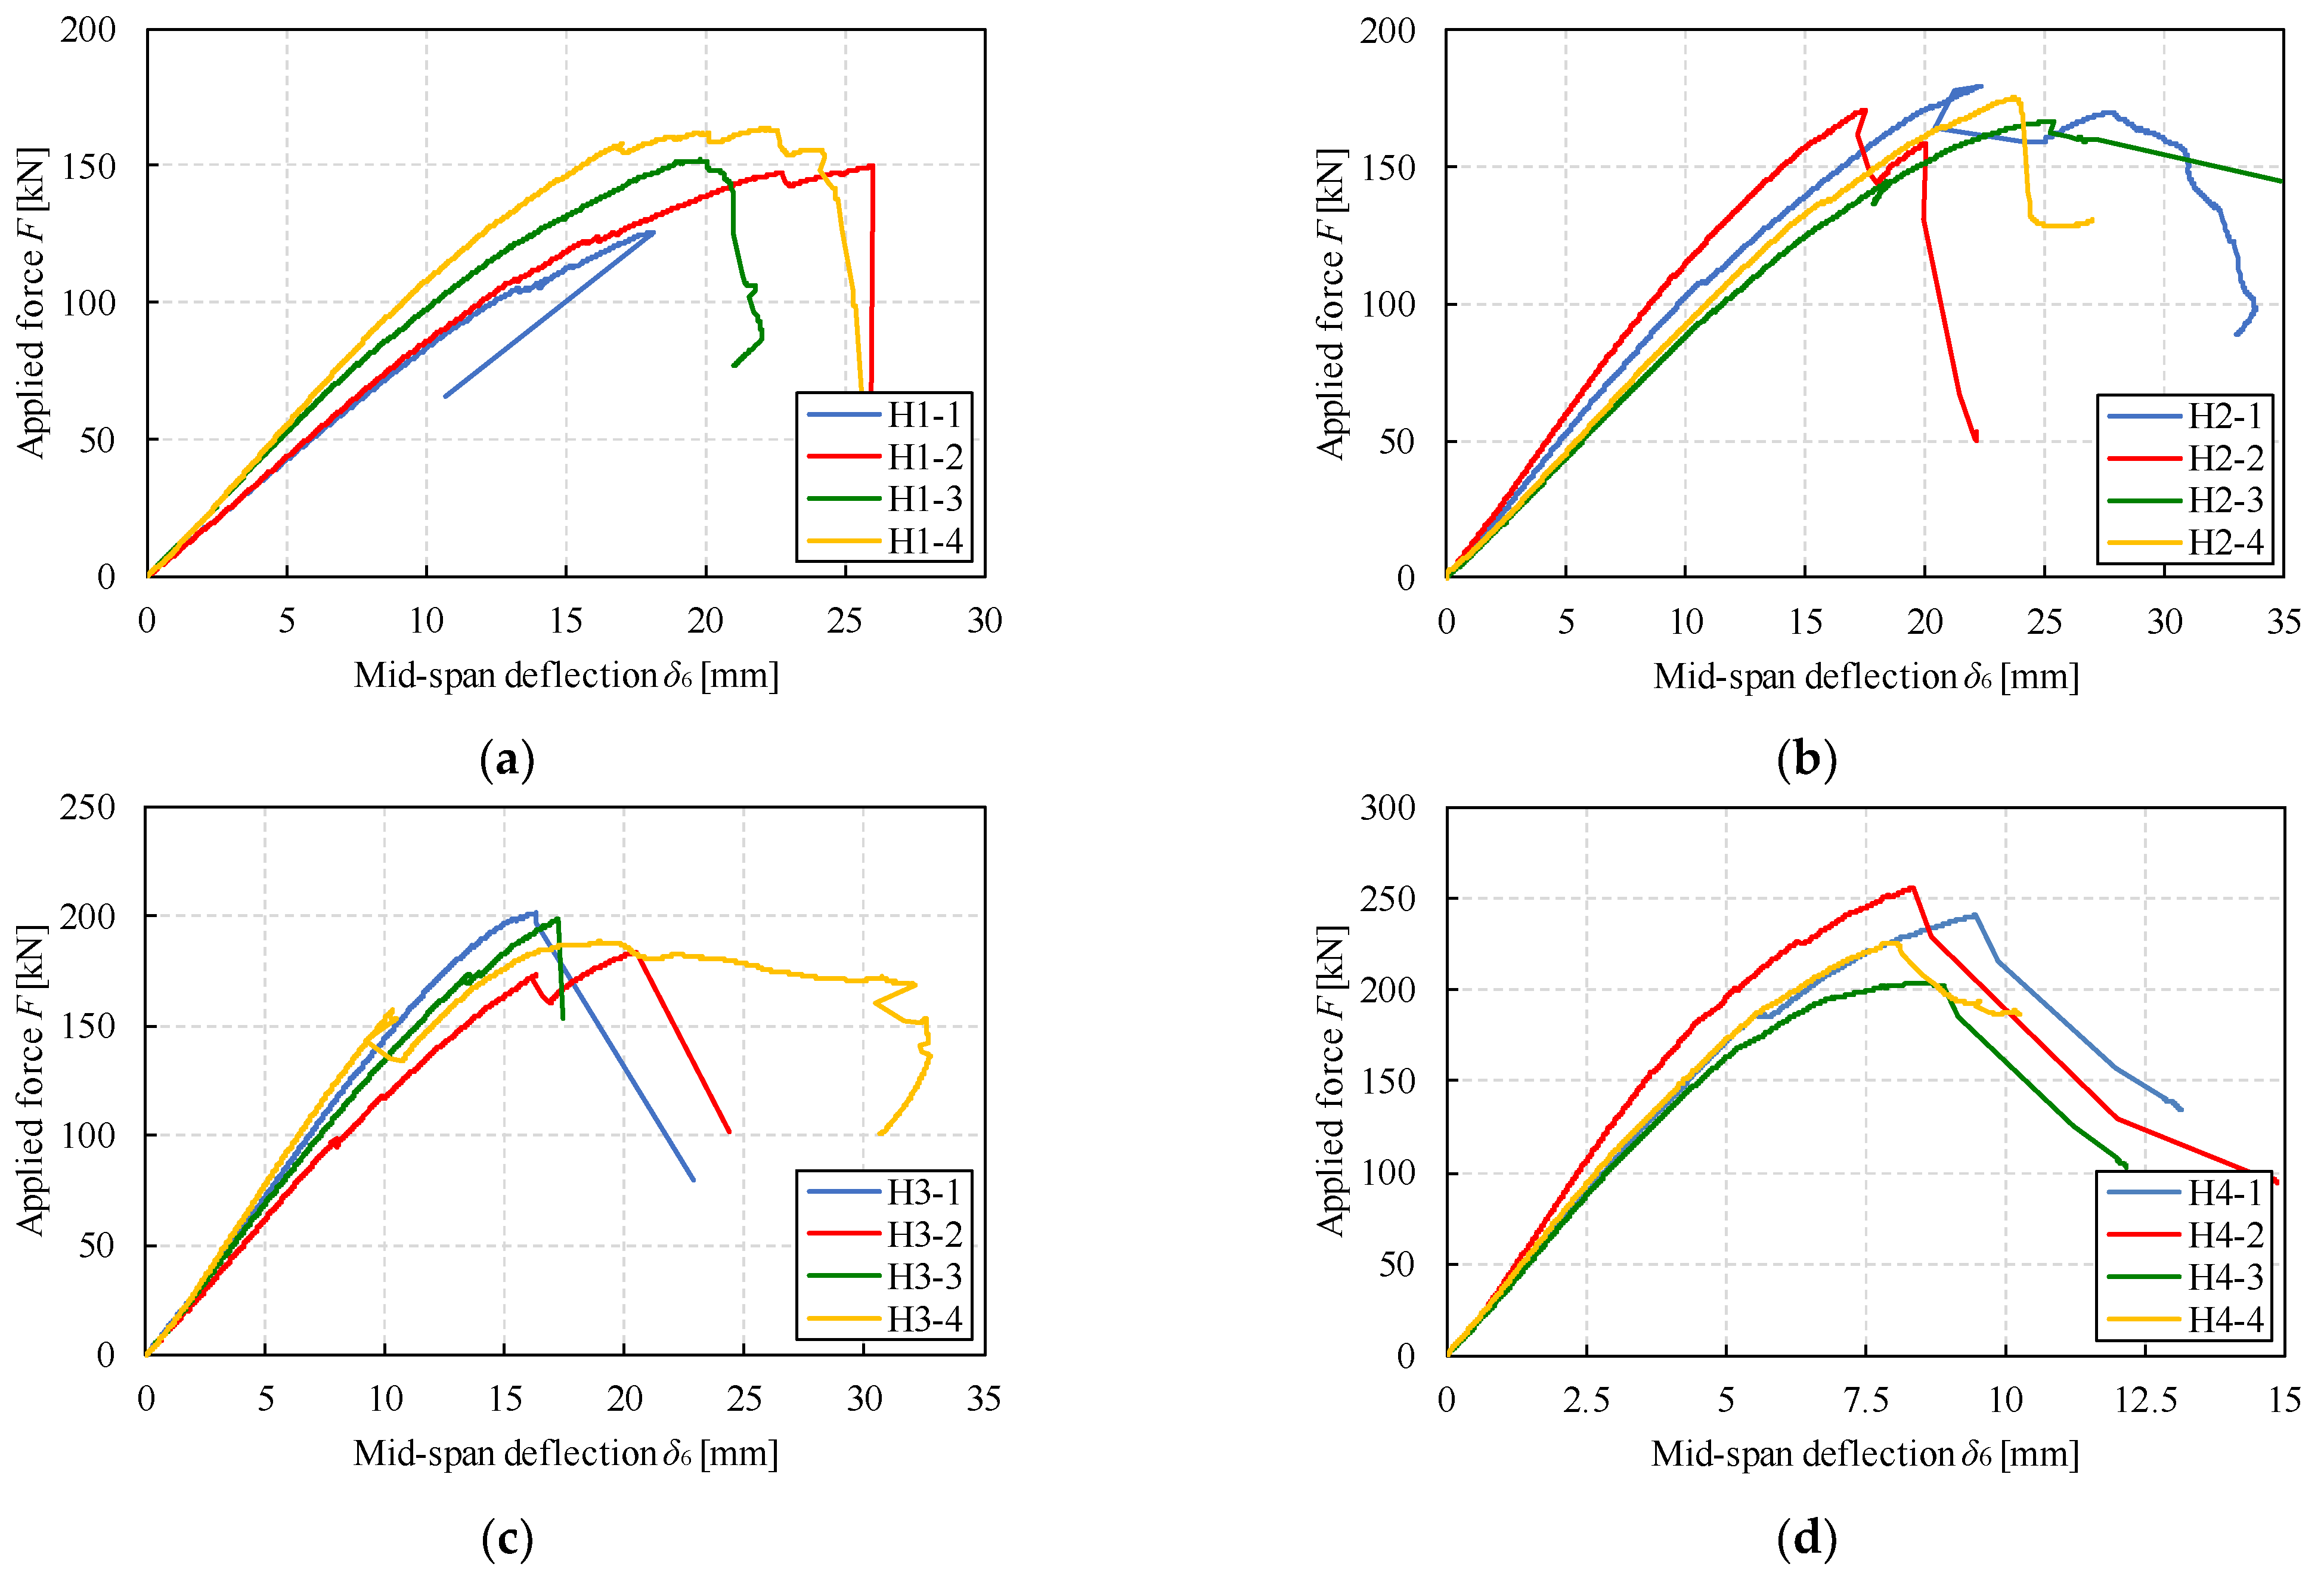
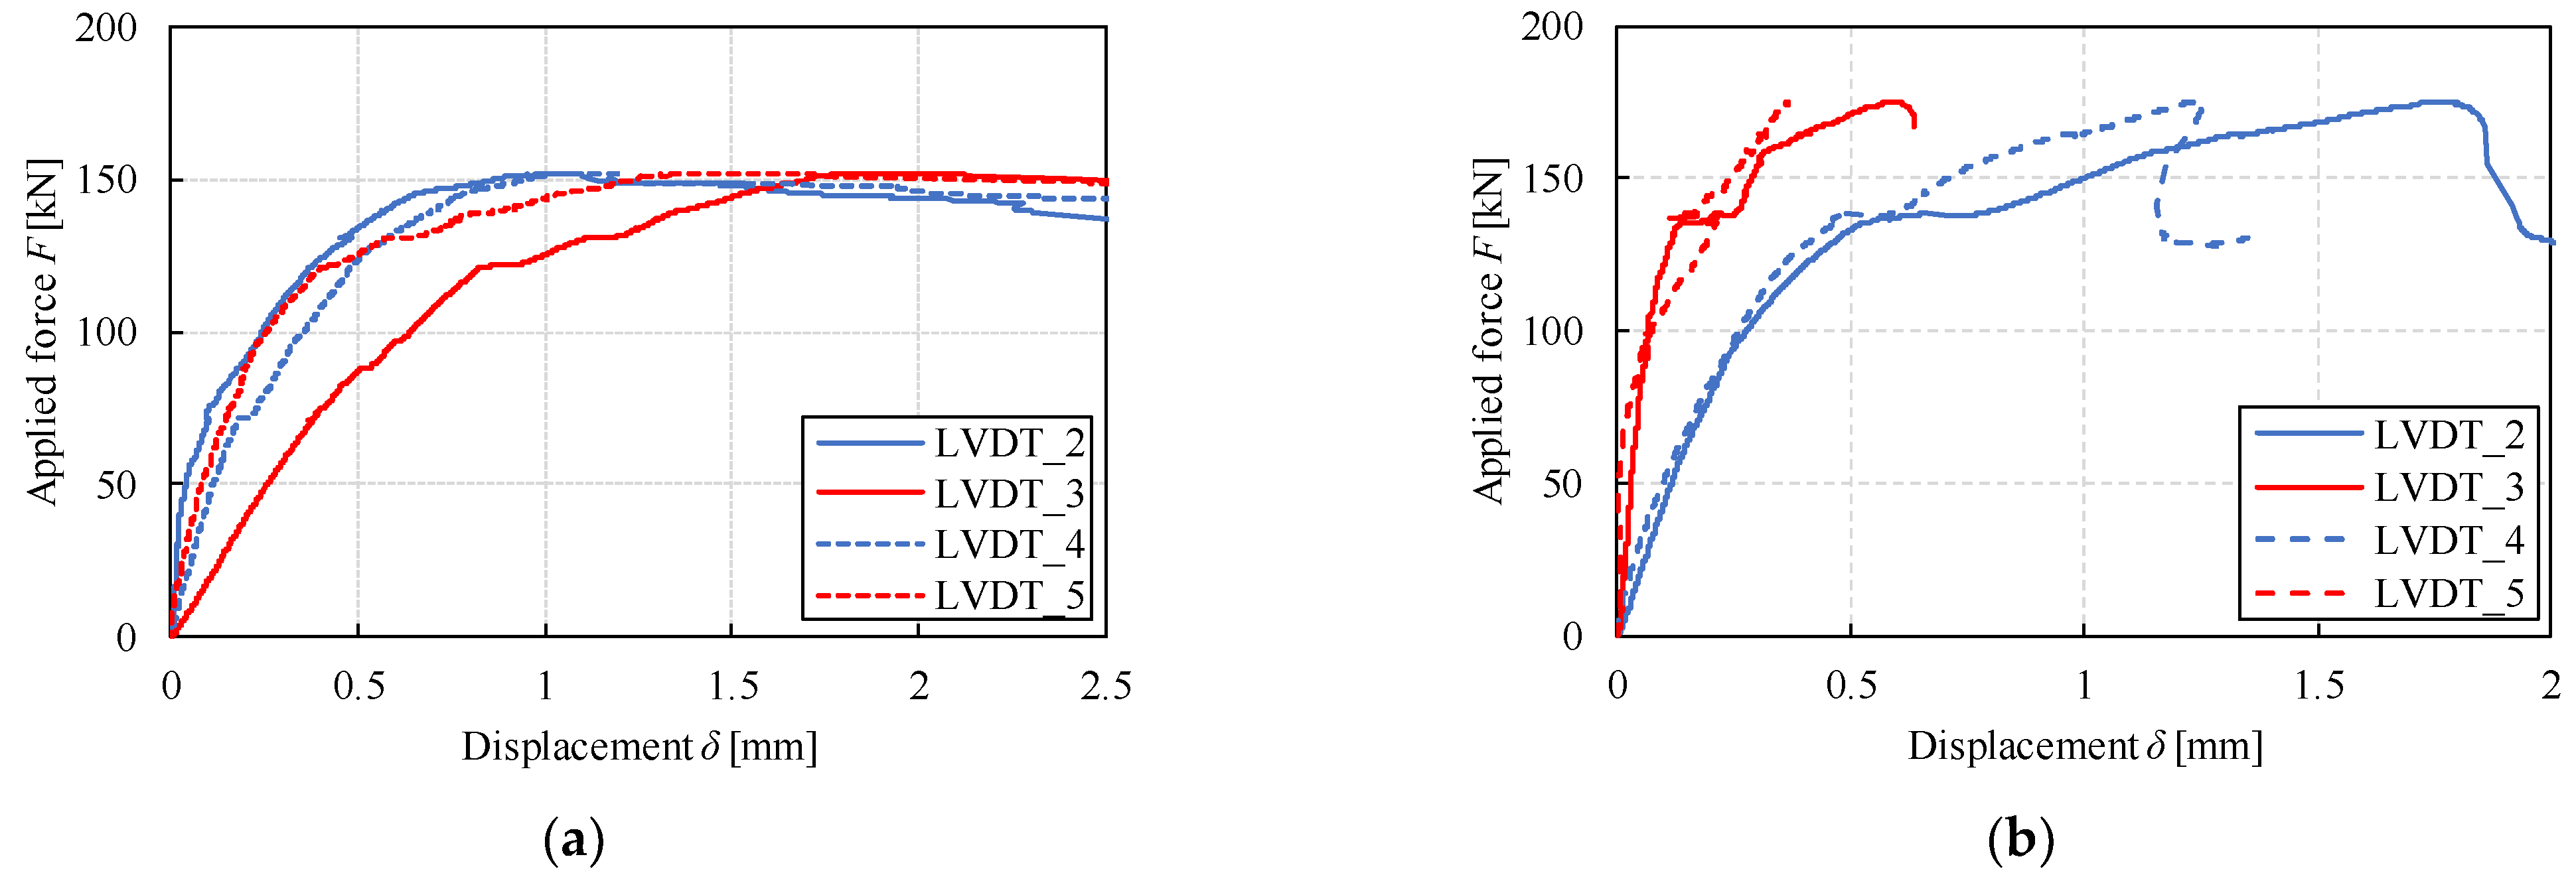
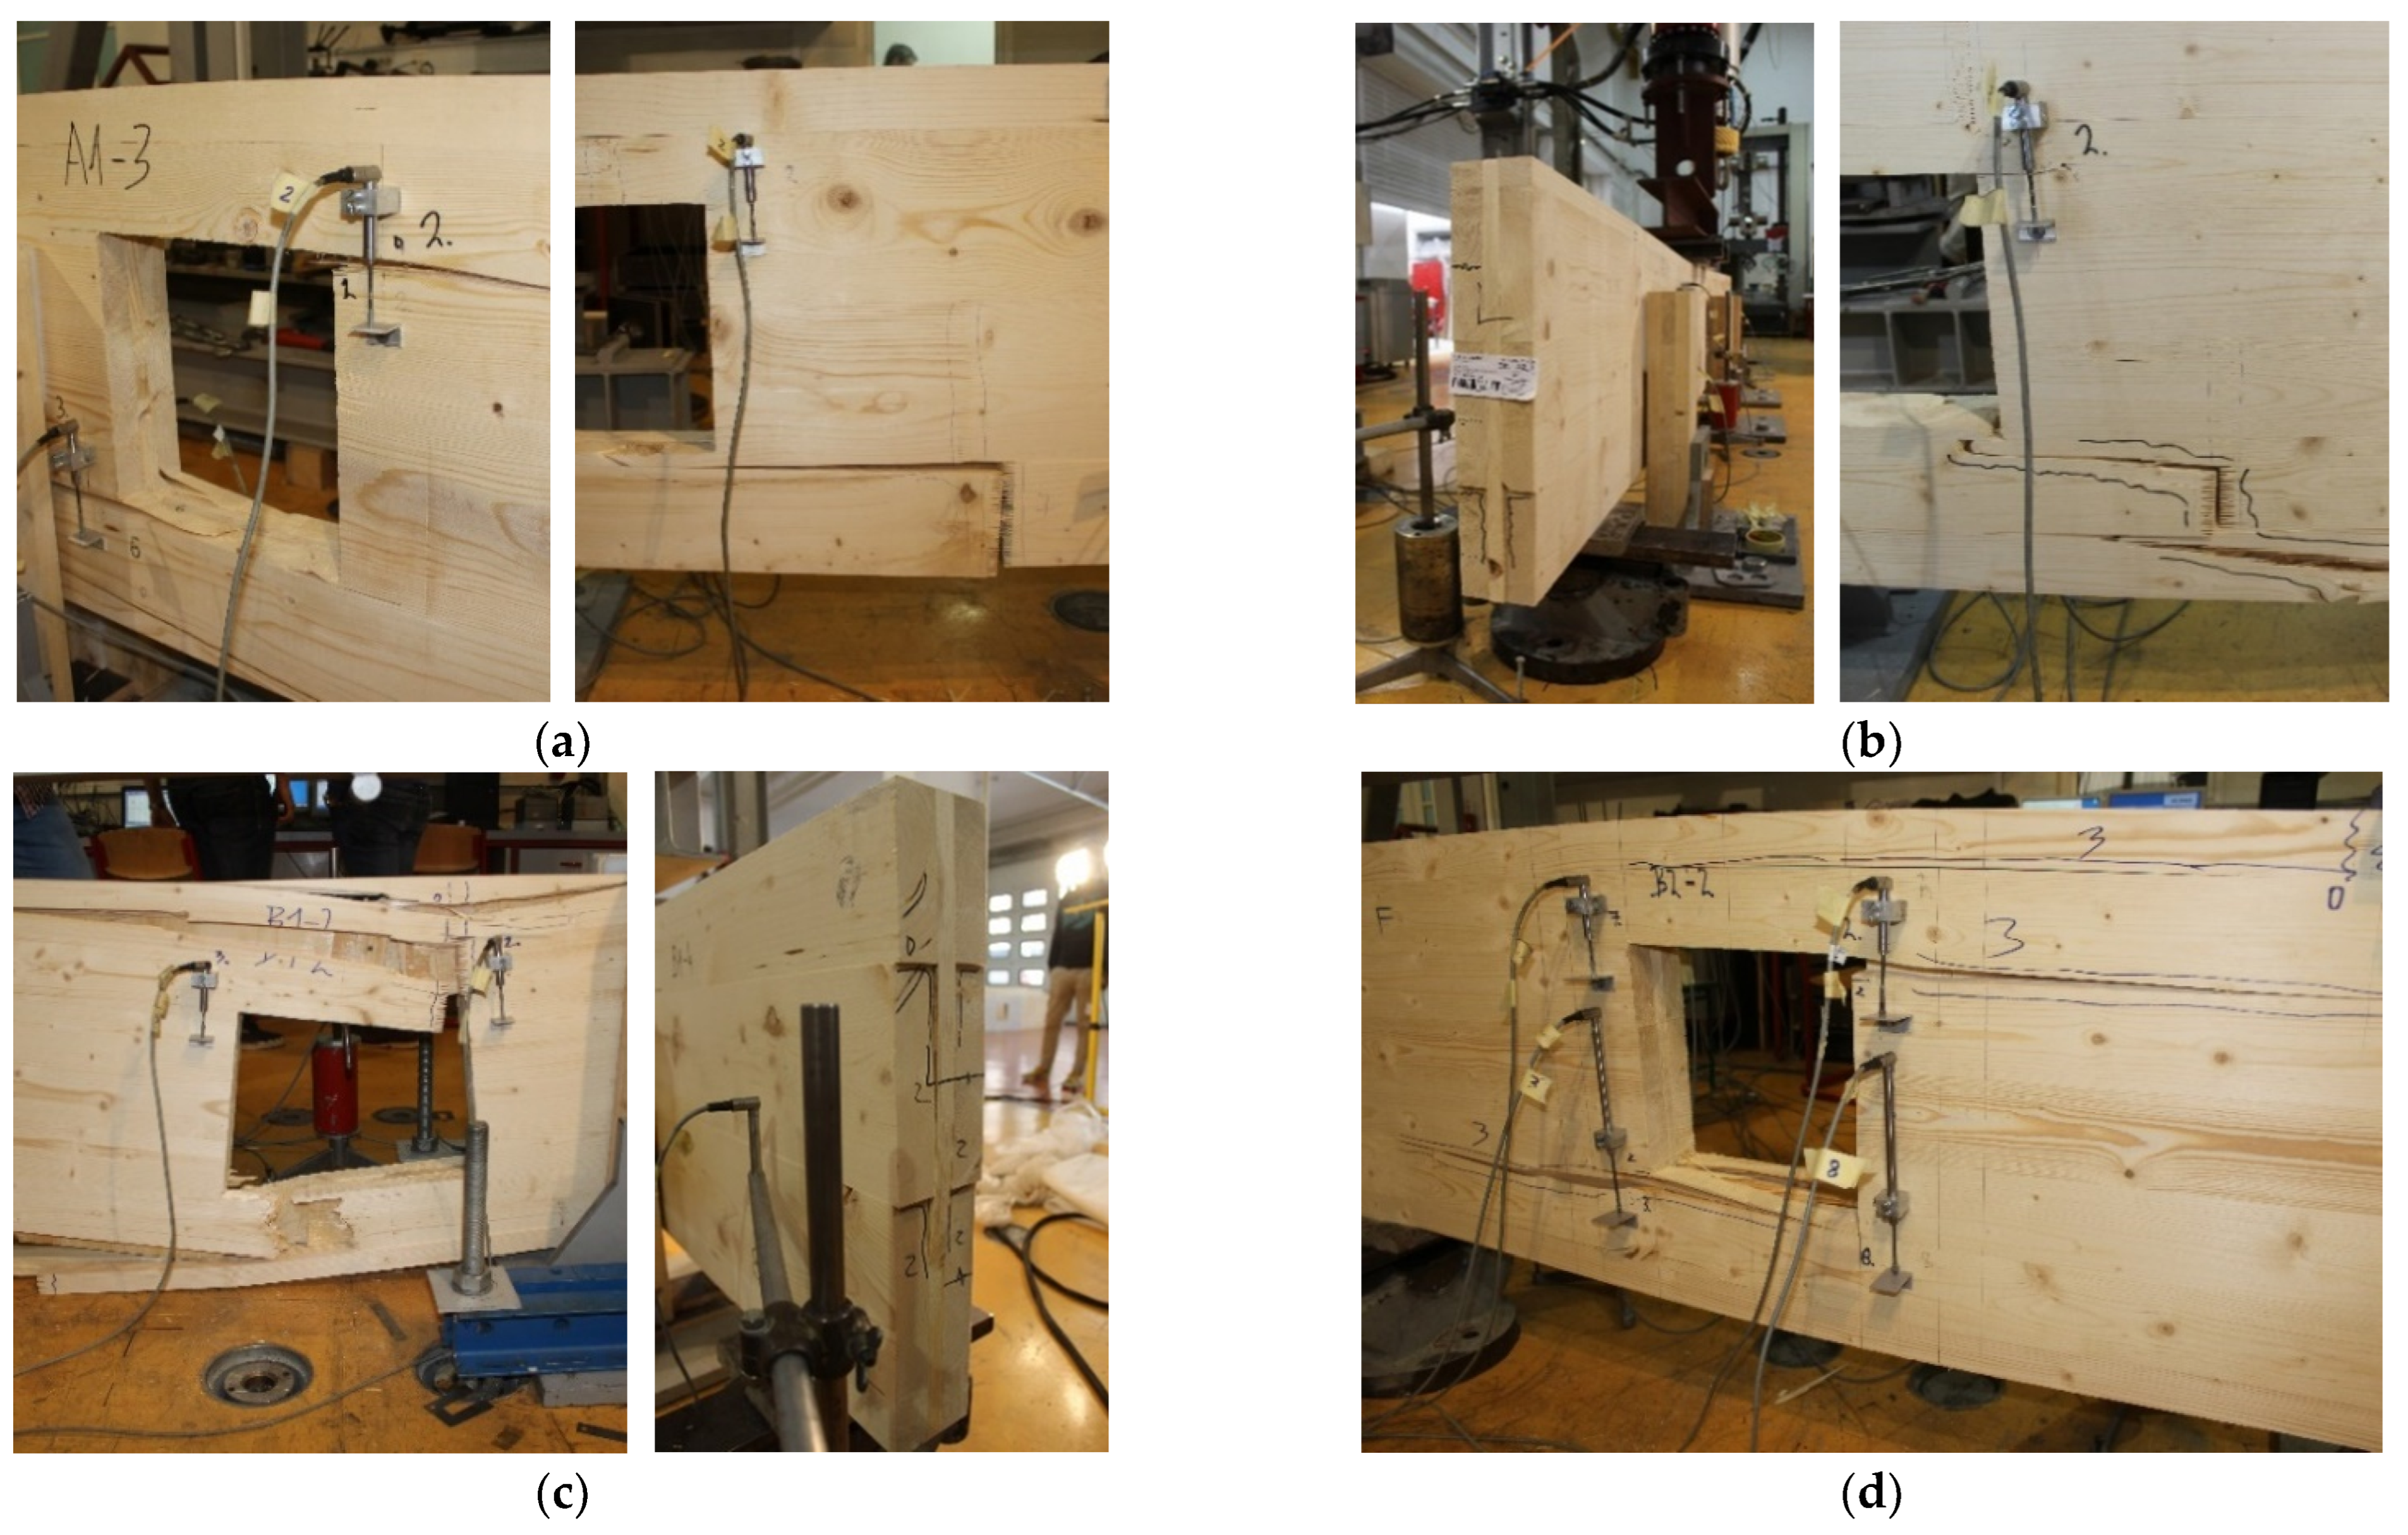
4.1. Beam with a Hole

The results for the test series with holes in terms of maximum load Fmax and corresponding global deflection at maximum load δ6,Fmax are presented in Table 4. The plots of applied load F vs. global deflection δ6 and of applied load F vs. local displacements δ2–5 are shown in Figure 8 and Figure 9, respectively. The global and local displacements were measured as described in Section 3 at the positions shown in Figure 6 and Figure 7. Photos of the fractured specimens are shown in Figure 10.
The failure modes for test series H1 and H2 are categorized as a combination of failure due to bending and shear failure in the crossing areas (mode III). The plots of applied load vs. deflection (Figure 8) show an almost linear relation up to about 80% of the maximum load. Thereafter, the decrease in stiffness indicates initial shear damage in the crossing areas with significant sliding between the laminations and increased beam deflection. At the maximum load, cracking and failure of the longitudinal laminations occurred at finger joints, corresponding to almost pure bending of the individual laminations. The relatively small coefficient of variation (CoV) of 2.8% for test series H2 indicates reliable test results and a small influence of reduced lamination widths near the hole, see Table 3. However, in specimen H1-1, the global failure was initiated by a premature bending failure, resulting in a higher CoV of 9.4% in test series H1.
The failure mode for test series H3 is categorized as failure due to bending, except for specimen H3-4, where a combination of bending and shear in the crossing areas govern the global failure. In this specimen, a decrease in stiffness was observed with significant sliding between laminations and increased beam deflection after reaching the maximum load; see Figure 8. The relatively low CoV of 3.7% again indicates the minor influence of reduced lamination widths near the hole, see Table 3. The global failure of test series H4 was induced by shear stresses in the crossing area (mode III). At maximum load, cracks occurred simultaneously at the two corners of the hole subjected to tensile stress perpendicular to the beam axis; see Figure 10. Cracks also occurred parallel to the grain direction in both longitudinal and transverse laminations, indicating secondary gross shear failure (mode I). A slightly higher CoV of 8.4% results from the lower capacity of specimen H4-3 due to premature shrinkage cracks detected prior to testing. Visual observations indicate that none of the tested series failed with holes, at least not as the primary failure mode due to gross (mode I) and net shear (mode II) or due to tensile stresses perpendicular to the beam axis.

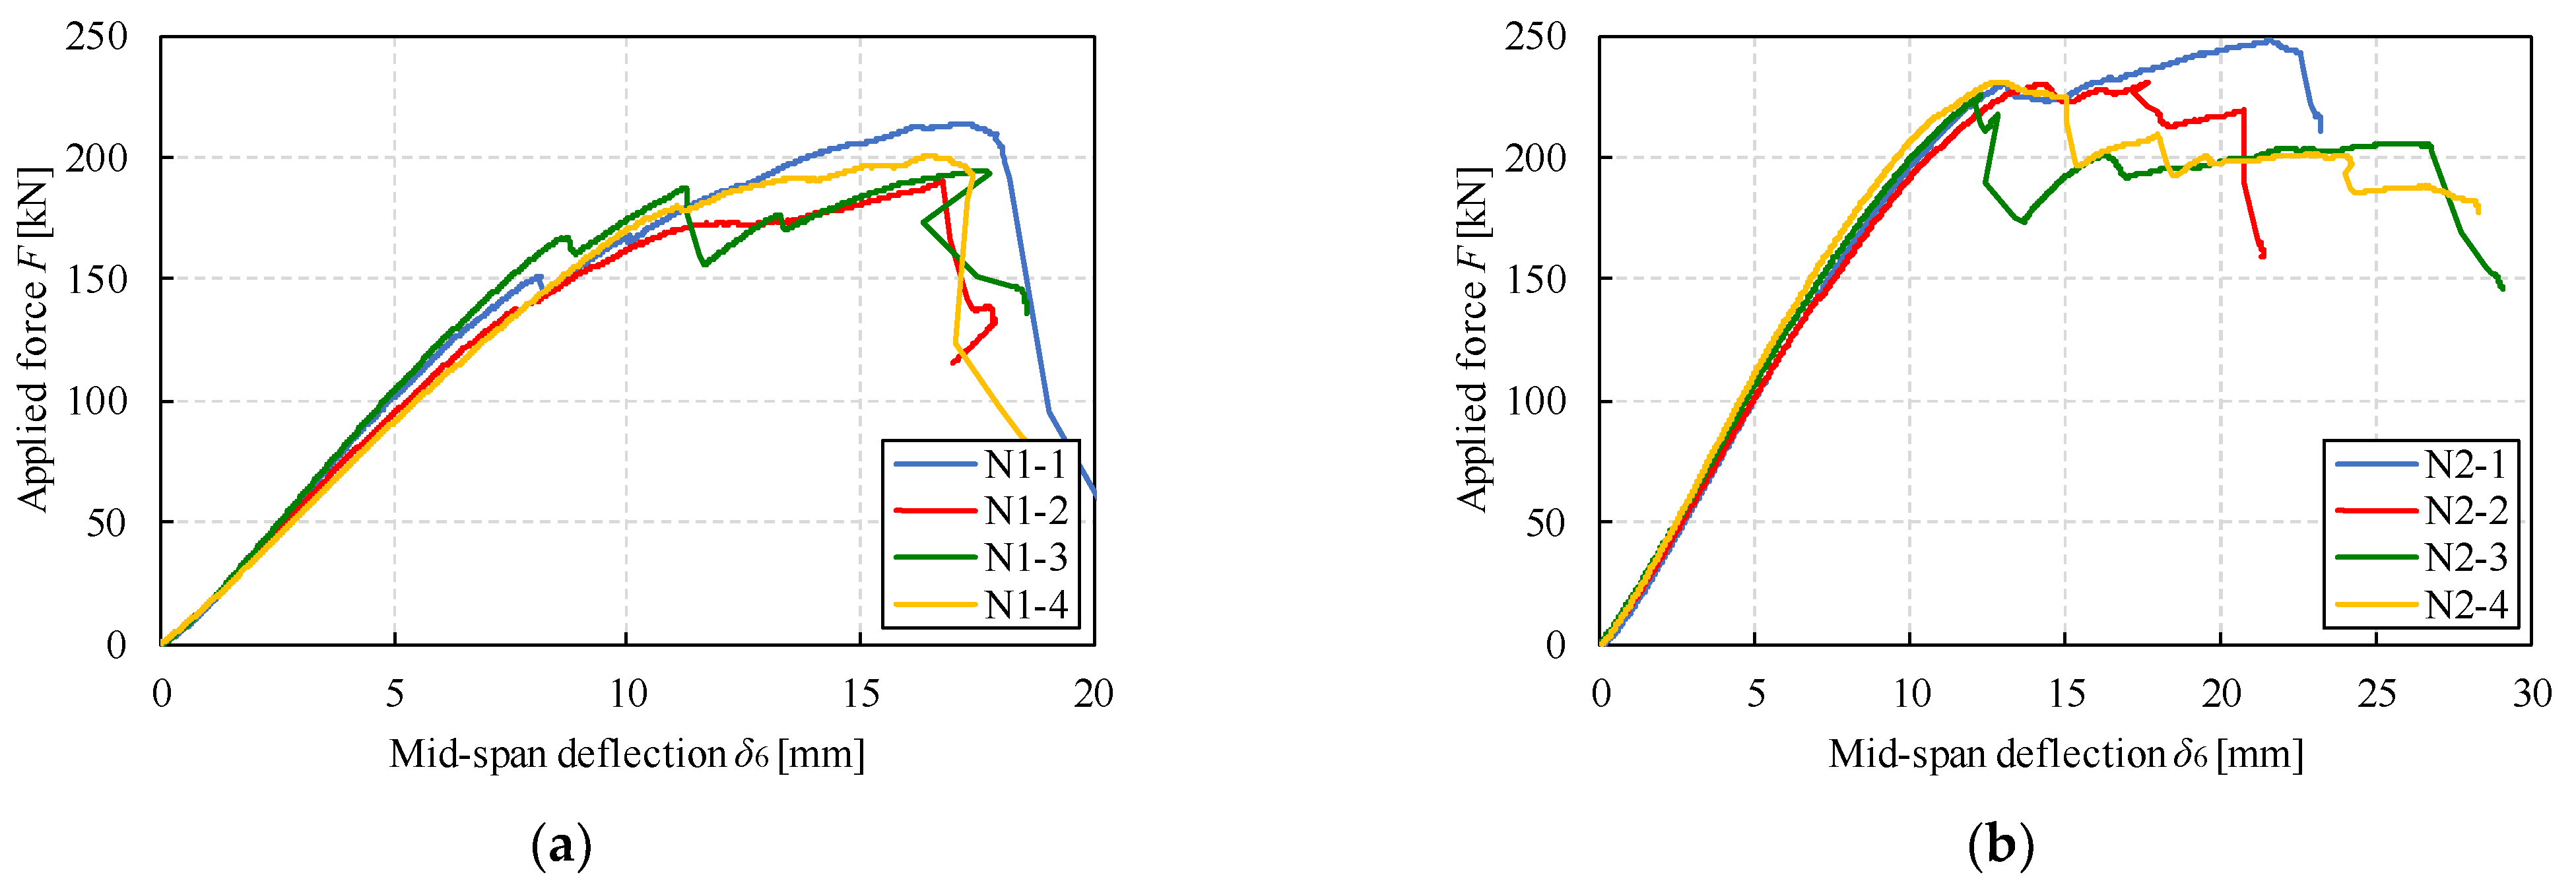
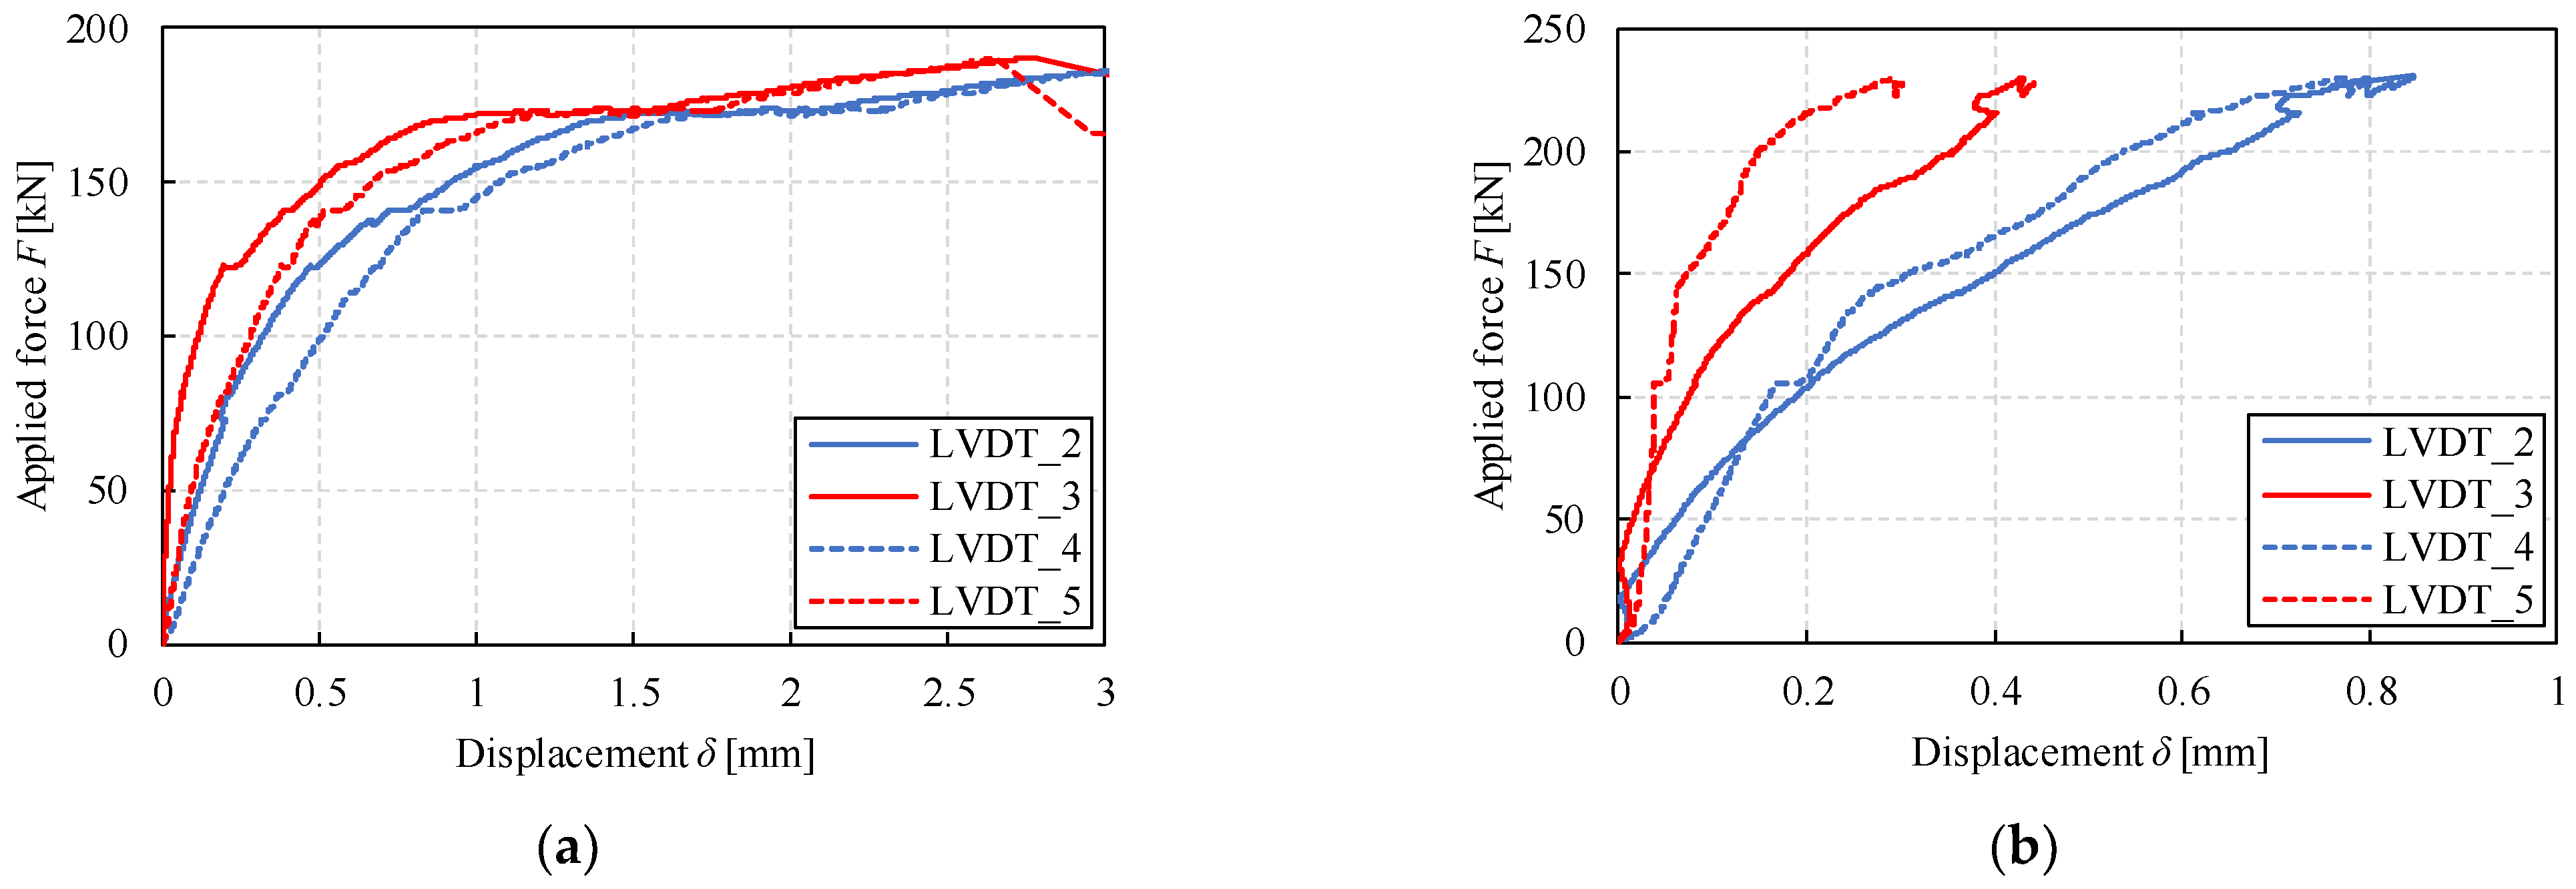
4.2. Beam with an End-Notch

The results for the notched test series in terms of maximum load Fmax and corresponding global deflection at maximum load δ6,Fmax are presented in Table 5. The plots of applied load F vs. global deflection δ6 and of applied load F vs. local displacements δ2–5 are shown in Figure 11 and Figure 12, respectively. The global and local displacements were measured as described in Section 3 at the positions shown in Figure 6 and Figure 7. Photos of the fractured specimens are shown in Figure 13.
As for most test series with holes, the failure modes for both notched test series N1 and N2 are also categorized as a combination of failure due to bending and shear failure in the crossing areas (mode III). The plots of applied load vs. deflection (Figure 11) show a decrease in stiffness with significant sliding between the laminations and increased beam deflection, indicating initial shear damage in the crossing areas. At the final stage after reaching maximum load and shear capacity, cracking and failure of the longitudinal laminations occurred at finger joints at the notch, corresponding to almost pure bending of the individual laminations. However, it is interesting to note that in test series N2, shear failure in the crossing areas also occurred on the non-notched side of the beam, indicating that notch depth of hef/h = 0.75 did not actually reduce the load capacity in this test series. One possible reason for this can be the fact that the stress component perpendicular to the beam axis τzy on the notched side was much lower compared with the stress component parallel to the beam axis τzx on the un-notched side of the beam, as will be discussed more below. The relatively small CoV of 4.5 and 3.6% indicate reliable test results and a small influence of reduced lamination widths near the notch, see Table 3. Visual observations indicate that none of the notched test series failed, at least as a primary failure mode, due to gross (mode I) and net shear (mode II) or due to tensile stresses perpendicular to the beam axis.

5. Discussion

The results in terms of maximum stress values at maximum load are provided in Table 6 and Table 7. The equations from Section 2 are used for the calculation, with the underlined stress values corresponding to the assumed dominant failure mode. The reviewed analytical model from Section 2 is based on the assumption of equal longitudinal lamination width bx causing an integer number of laminations, m = h/bx, in the beam height direction. The experimental results from Section 4 also indicate a small influence of reduced lamination widths near the beam edge and near the hole or notched edge, see Table 3. Therefore, the calculated stress values are based on the assumption of equal longitudinal and transversal lamination widths, i.e., bx = by = 150 mm using nominal geometry dimensions from Table 2.
For most test series where bending was classified as the ultimate mode of failure, the determined values of normal stresses σx correspond with characteristic values for strength class C24 according to EN 338 [22] and are hence somewhat lower than the expected mean values assuming a log-normal distribution and CoV 15% according to probabilistic model code of the Joint Committee on Structural Safety (JCSS) [28]. However, all bending failures were initiated at finger joints or around knots, which can be the reason for lower capacities due to the minimum restrictions related to the quality description of the CLT producer.
As for the tensile stresses parallel to the grain, σt,y,h and σt,y,n, all obtained values are above the characteristic values for strength class C24 according to EN 338 [22]. For all test series with holes (H1 to H4) and notched series N2, the obtained stress values are in agreement with previous tests presented by Flaig [8] and with the expected mean strength values according to JCSS [28], while for notched series N1 they are even significantly higher than the expected mean strength values. However, this failure mode was not observed in the tests, even when a much higher lamination width of by = 150 mm was used in the calculation compared with the actual measured values (see Table 3), indicating the strongly conservative side of Equations (7) and (8).
For the gross shear stresses τxy,gross, which are relevant for shear failure mode I, the determined mean values correspond to the characteristic strength values of strength class C24 according to EN 338 [22] and are thus lower than the expected mean shear strength values according to JCSS [28]. Slightly higher values for test series H4 and N1 indicate possibly secondary gross shear failure, which is consistent with the observed parallel cracks during tests. In the case of net shear stress in the transversal layers τxy,net, which is relevant for shear failure mode II, the calculated values are much higher compared with the proposed characteristic and expected mean strength values in Section 2.4. However, the obtained values are consistent with previous tests on CLT beams, where high net shear stresses were also obtained without obvious failure in shear mode II; see [17,29,30]. These results indicate the strong conservative side of the proposed Equations (11) and (12).
The shear stress components relevant for shear failure mode III, τzx, τzy, and τtor,z, are provided for the most stressed crossing areas, i.e., at the corner of the hole or notch, but also at the outermost crossing areas in beam height direction for the complete cross-section of test series H3, N1, and N2. Calculated stress ratios are presented for all test series in Figure 14 according to the critical stress interaction failure criteria, as higher values between Equations (23) and (24), assuming fv,tor/fR ≈ 2.3 with mean rolling shear strength fR = 1.50 MPa and mean torsional shear strength as fv,tor = 3.50 MPa, see Section 2.4.
Obtained experimental results indicate the conservative side of the analytical model by predicting higher stress ratios and underestimating the shear capacity regarding FM III. However, it should be noted that several simplifications and assumptions were implemented into the model discussed in Section 2 and that it is closely related to the original analytical model for prismatic beams presented in [6,11]. Several previous studies [16,17,18,19,20] indicate that the assumed stress distributions in the beam height and beam width directions according to the original model do not agree with the results of 3D-FE, as mentioned in the introduction. The model reviewed in Section 2 is also based on a 1D-FE analysis, which is quite a simplification compared with the real condition including the geometric and material heterogeneity of the CLT elements. This is particularly evident in test series N2, where the shear failure in the crossing areas also occurred on the non-notched side of the beam, but not in the lowermost crossing area as expected according to the original model [6,11], but in the crossing area near the centre line of the beam according to the improved model [16,17,20]; see Figure 13. The stress distribution in the beam width direction is even more pronounced for prismatic CLT 5s and CLT 7s elements and must be considered accordingly. Improved analytical model and design proposals that take into account the stress distribution in beam height and width direction according to the 3D-FE results were experimentally validated for prismatic CLT beam elements; see [16,17,20]. However, such design proposals have not yet been adapted for CLT beam elements with holes or notches.
The relative comparison between failure modes presented in Section 2.2 in terms of the shear force capacities V is presented by the parametric study shown in Figure 15 and Figure 16 for beams with holes and notched beams, respectively. The strength capacities are compared based on characteristic strength values for each failure mode, see Section 2.4, except for bending in the mid-span, since this failure mode depends on the span of the beam, which is not relevant for the other considered modes. The characteristic strength values were used since they are included in design strength values commonly used in design verification. The results are presented only for CLT 3s elements based on reference geometry of test series H1 and N1, see Table 2, but similar relations are expected also for CLT 5s and 7s elements.
In each graph presented in Figure 15 and Figure 16, only one parameter was varied while all others were kept constant. The presented results show that in most cases the net shear (FM II) and the stress perpendicular to the beam axis are critical, which is not consistent with obtained experimental results or previous test results [5,6,7], where none of the tested series with holes or notches failed, at least not as the primary failure mode, due to these failure modes. These results lead to the same conclusion as in Section 4, that the proposed equations for stress calculations may be overestimated and that the capacities for such failure modes are correspondingly underestimated. However, these conclusions should be further validated using a more comprehensive experimental test database that includes CLT 5s and 7s beam elements.

6. Conclusions and Outlook

Based on the presented experimental investigations of cross laminated timber elements with holes or end-notches at in-plane beam loading conditions, the following conclusions can be drawn:
  • The expected failure modes and the analytical models presented in [9,10] for CLT beams with prismatic holes or end-notches were reviewed;
  • The experimental results on CLT beams with holes or end-notches indicate two predominant failure modes, i.e., bending failure at the holes or notches, which is mostly initiated at the finger joints; and shear failure in the crossing areas (mode III), which is indicated by significant sliding between the adjacent longitudinal laminations in the beam height direction;
  • The experimental results indicate that none of the test series failed, at least as a primary failure mode, due to gross (mode I) and net shear (mode II) or due to tensile stresses perpendicular to the beam axis;
  • Based on the assumed strength values proposed in the literature for shear failure in crossing areas (mode III), i.e., the rolling shear strength fR and torsional shear strength fv,tor, the reviewed analytical model is slightly conservative by underestimating the shear capacity;
  • Experimental results indicate a relatively small influence on the beam strength for reduced longitudinal and transversal lamination widths near the hole or notch edges;
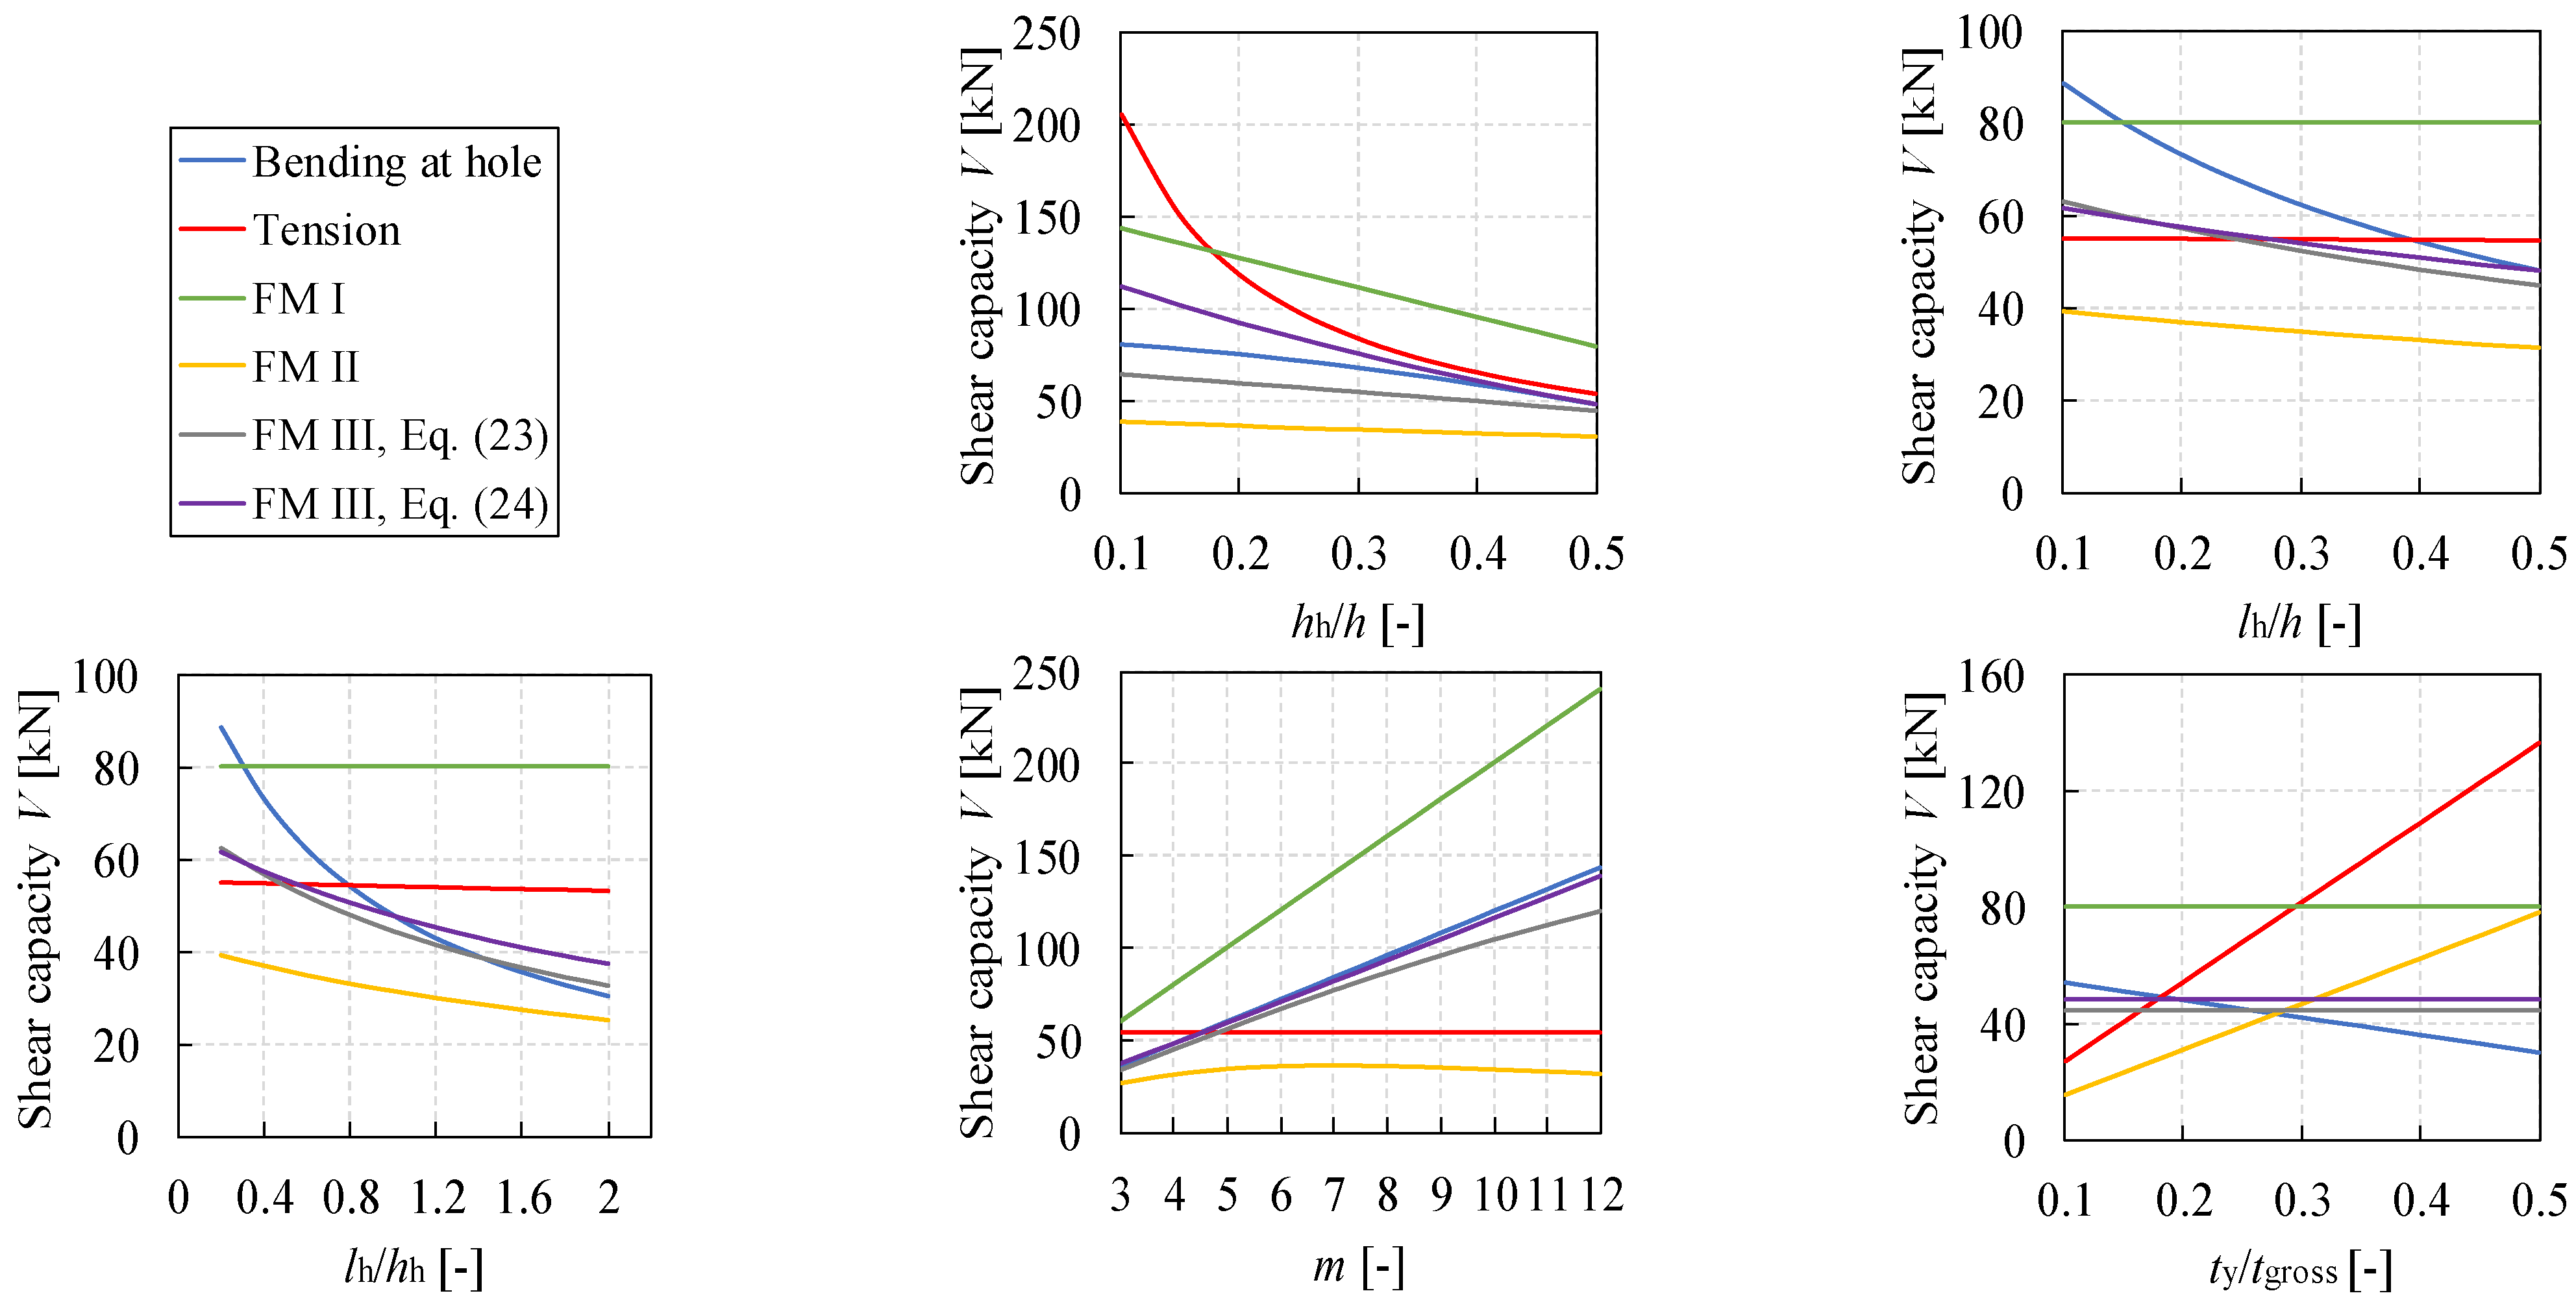
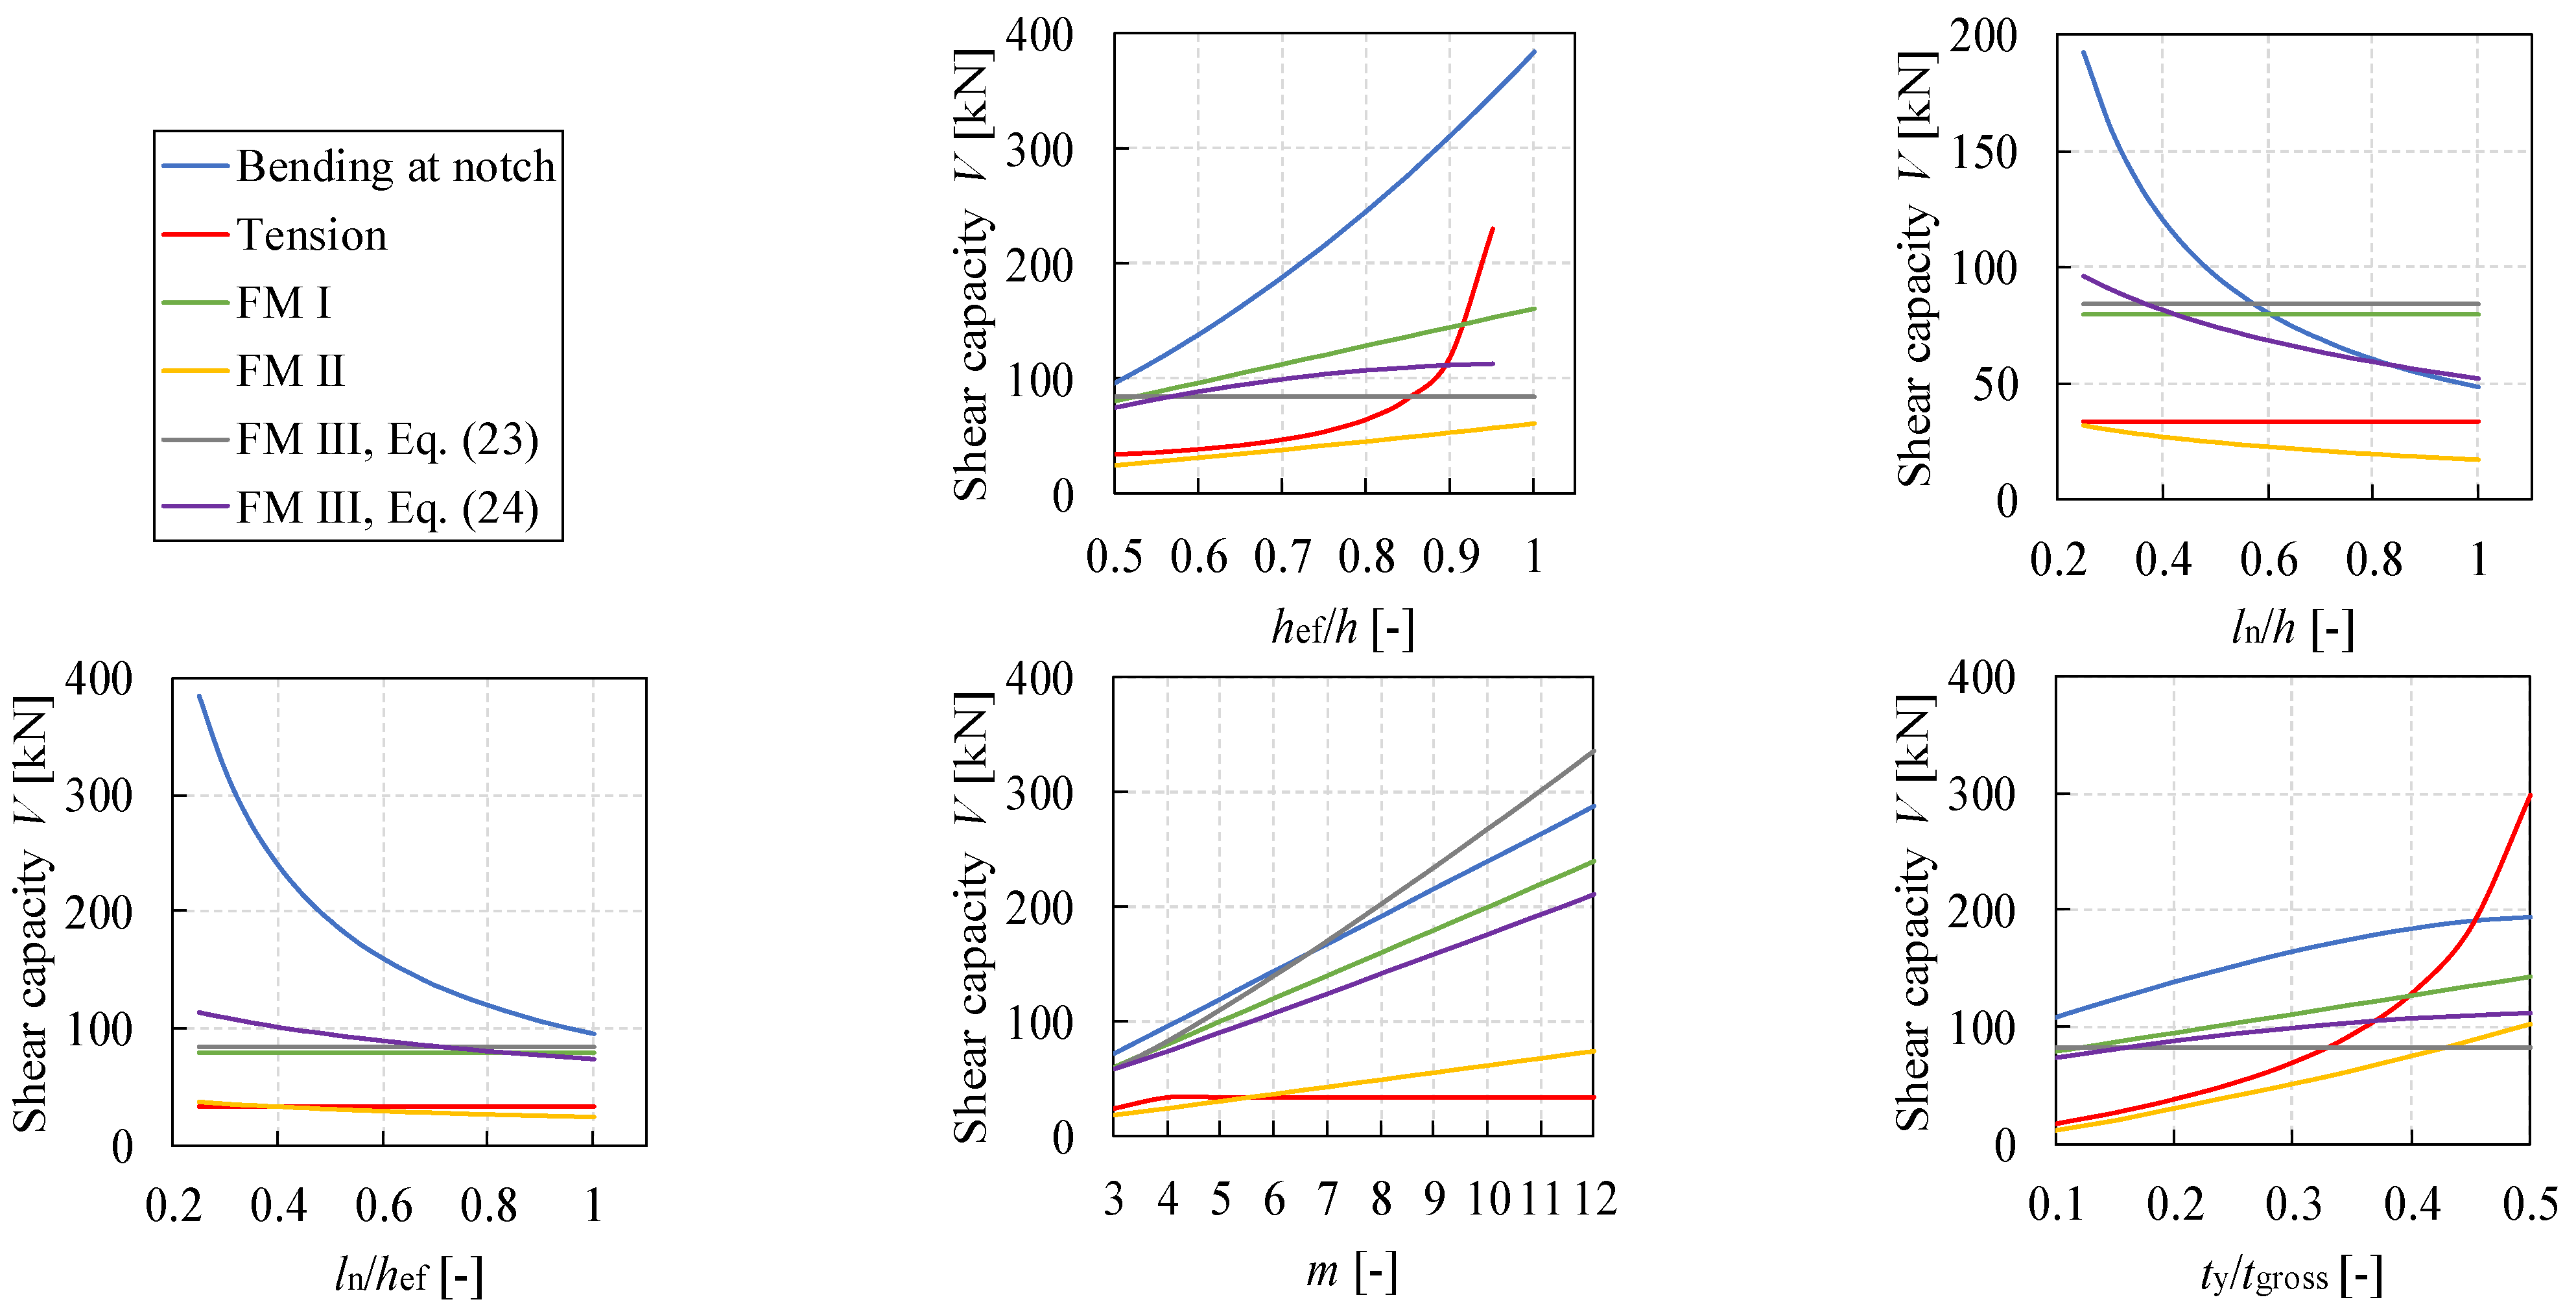
  • Parametric studies show that, in most of the considered cases, net shear (mode II) and tensile failure perpendicular to the beam axis are the critical failure modes in design verification using the analytical model for CLT beams with holes or notches, indicating their strong underestimations;
  • A consistent design approach for CLT beams with holes or notches is missing and not included in the draft of the revised version of EC 5 (CEN/TC 250/SC5) [8]. It is therefore advisable to adapt the design proposals presented in [16,17,20] also for the cases where holes or notches are introduced in CLT beams;
  • Further experimental validation on CLT 5s and 7s beam elements, including also inverted layer orientation with outermost layers oriented transversally, should preferably be conducted.

Author Contributions

M.J.: Conceptualization, Formal analysis, Funding acquisition, Investigation, Methodology, Validation, Visualization, Writing—original draft, Writing—review and editing; D.D.: Investigation, Methodology, Resources, Validation, Writing—review and editing; D.V.: Funding acquisition, Methodology, Validation, Supervision, Writing—review and editing; V.R.: Conceptualization, Funding acquisition, Methodology, Project administration, Supervision, Writing—review and editing. All authors have read and agreed to the published version of the manuscript.

Funding

This research was founded by Faculty of Civil Engineering University of Zagreb and Faculty of Civil Engineering and Architecture Osijek, Josip Juraj Strossmayer University of Osijek.

Institutional Review Board Statement

Not applicable.

Informed Consent Statement

Not applicable.

Data Availability Statement

The data presented in this study are available on request from the corresponding author.

Acknowledgments

The technical support from the laboratory of the Faculty of Civil Engineering University of Zagreb is gratefully acknowledged.

Conflicts of Interest

The authors declare no conflict of interest.

References

  1. Jeleč, M.; Varevac, D.; Rajčić, V. Cross laminated timber (CLT): A state of the art report. Građevinar 2018, 70, 75–95. [Google Scholar]
  2. Brandner, R.; Flatscher, G.; Ringhofer, A.; Schickhofer, G.; Thiel, A. Cross laminated timber (CLT): Overview and development. Eur. J. Wood Wood Prod. 2016, 74, 331–351. [Google Scholar] [CrossRef]
  3. Brandner, R.; Dietsch, P.; Dröscher, J.; Schulte-Wrede, M.; Kreuzinger, H.; Sieder, M. Cross laminated timber (CLT) diaphragms under shear: Test configuration, properties and design. Constrution Build. Mater. 2017, 147, 312–327. [Google Scholar] [CrossRef]
  4. Blass, H.J.; Flaig, M. Stabförmige Bauteile aus Brettsperrholz; KIT: Karlsruhe, Germany, 2012. [Google Scholar]
  5. Bejtka, I. Cross (CLT) and Diagonal (DLT) Laminated Timber as Innovative Material for Beam Elements; KIT: Karlsruhe, Germany, 2011. [Google Scholar]
  6. Flaig, M. Biegeträger aus Brettsperrholz bei Beanspruch in Plattebene. Ph.D. Thesis, KIT, Karlsruhe, Germany, 2013. [Google Scholar]
  7. Danielsson, H.; Jeleč, M.; Serrano, E. Strength and Sitffness of Cross Laminated Timber at In-Plane Beam Loading; Report TVSM-7164; Division of Structural Mechanics, Lund University: Lund, Sweden, 2017. [Google Scholar]
  8. CEN/TC 250/SC5 (2021); Working Draft of Eurocode 5: Design of Timber Structures—Common Rules and Rules for Buildings Part 1-1: General, Version: 2021-10-27, N1489. European Committee for Standardization: Brussels, Belgium, 2021.
  9. Flaig, M. Design of CLT beams with rectangular holes or notches. In Proceedings of the 1st INTER-Meeting, Bath, UK, 1–4 September 2014. [Google Scholar]
  10. Flaig, M. In Plattenebene beanspruchte Biegeträger aus Brettsperrholz—Teil 1: Effektive Festigkeits und Steifigkeitskennwerte für die Schubbemessung. Bautechnik 2015, 92, 741–749. [Google Scholar] [CrossRef]
  11. Flaig, M.; Blass, H.J. Shear strength and shear stiffness of CLT-beams loaded in plane. In Proceedings of the CIB-W18, CIB-W18/46-12-3, Vancouver, BC, Canada, 26–29 August 2013. [Google Scholar]
  12. Jeleč, M.; Rajčić, V.; Danielsson, H.; Serrano, E. Strural analysis of in-plane loaded CLT beams with holes: FE-analysis and parameter studies. In Proceedings of the INTER/49-12-2, Graz, Austria, 16–19 August 2016. [Google Scholar]
  13. Jeleč, M.; Strukar, K.; Rajčić, V. Structural analysis of in-plane loaded CLT beams. Electron. J. Fac. Civ. Eng. Osijek E-GFOS 2017, 8, 20–30. [Google Scholar] [CrossRef]
  14. Danielsson, H.; Serrano, E.; Jeleč, M.; Rajčić, V. In-plane loaded CLT beams—Tests and analysis of element lay-up. In Proceedings of the INTER, INTER/50-12-2, Kyoto, Japan, 28–31 August 2017. [Google Scholar]
  15. Danielsson, H.; Serrano, E. Cross laminated timber at in-plane beam loading—Prediction of shear stresses in crossing areas. Eng. Struct. 2018, 171, 921–927. [Google Scholar] [CrossRef]
  16. Jeleč, M. Shear Resistiance of Cross-Laminated Timber Beam Elements. Ph.D. Thesis, Faculty of Civil Engineering, University of Zagreb, Zagreb, Croatia, 2019. [Google Scholar]
  17. Jeleč, M.; Danielsson, H.; Rajčić, V.; Serrano, E. Experimental and numerical investigations of cross laminated timber at in-plane beam loading conditions. Constr. Build. Mater. 2019, 206, 329–346. [Google Scholar] [CrossRef]
  18. Danielsson, H.; Jeleč, M.; Serrano, E.; Rajčić, V. Cross laminated timber at in-plane beam loading—Comparison of model predictions and FE-analyses. Eng. Struct. 2019, 179, 246–254. [Google Scholar] [CrossRef]
  19. Jeleč, M.; Danielsson, H.; Serrano, E.; Rajčić, V. Cross laminated timber at in-plane beam loading—New analytical model predictions and relation to EC5. In Proceedings of the INTER, INTER/51-12-5, Tallinn, Estonia, 13–16 August 2018. [Google Scholar]
  20. Jeleč, M.; Dokšanović, T.; Draganić, H.; Rajčić, V. Advancement in prediction of shear strength and stiffness of cross laminated timber beams. Eng. Struct. 2021, 238, 112247. [Google Scholar] [CrossRef]
  21. DIN EN 1995-1-1/NA; National Annex—Nationally Determined Parameters—Eurocode 5: Design of Timber Structures—Part 1-1: General—Common Rules and Rules for Buildings. Deutsches Institut für Normung: Berlin, Germany, 2013.
  22. EN 338:2016; Structural Timber—Strength Classes. European Committee for Standardization (CEN): Brussels, Belgium, 2016.
  23. Brandner, R.; Bogensperger, T.; Schickhofer, G. In shear strength of cross laminated timber (CLT): Test configuration, quantification and influencing parameters. In Proceedings of the CIB-W18/46-12-2, Vancouver, BC, Canada, 26–29 August 2013. [Google Scholar]
  24. Brandner, R.; Dietsch, P.; Droscher, J.; Schulte-Wrede, M.; Kreuzinger, H.; Sieder, M.; Schickhofer, G.; Winter, S. Shear properties of cross laminated timber (CLT) under in-plane: Test configuration and experimenal study. In Proceedings of the INTER/49-12-2, Sibenik, Croatia, 24–27 August 2015. [Google Scholar]
  25. Brandner, R.; Dietsch, P.; Droscher, J.; Schulte-Wrede, M.; Sieder, M. Scheibenschub von Brettsperrholz: Verifizierung einer Prüfkonfiguration und Parameterstudie. Bautechnik 2015, 92, 759–769. [Google Scholar] [CrossRef]
  26. Ehrhart, T.; Brandner, R. Rolling shear: Test configurations and properties of some European soft- and hardwood species. Eng. Struct. 2018, 172, 554–572. [Google Scholar] [CrossRef]
  27. Europan Technical Assessment ETA-12/0281 from 19.08.2017; Noritec Holzindustrie GmbH—Cross Laminated Timber (CLT)—Solid Wood Slab Elements to Be Used as Structural Elements in Buildings. Austrian Institute for Construction Engineering: Vienna, Austria, 2017.
  28. JCSS Probabilistic Model Code Part III—Resistance Models, Section 3.05—Timber; Joint Committe on Structural Safety (JCSS): Zurich, Switzerland, 2006; ISBN 978-3-909386-79-6.
  29. Andreolli, M.; Tomasi, R.; Polastri, A. Experimental investigation on in-plane behaviour of cross-laminated timber elements. In Proceedings of the CIB-W18/45-12-4, Växjö, Sweden, 27–30 August 2012. [Google Scholar]
  30. Jöbstl, R.A.; Bogensperger, T.; Schickhofer, G. In plane shear strength of cross laminated timber. In Proceedings of the CIB-W18/41-12-3, St. Andrews, NB, Canada, 24–28 August 2008. [Google Scholar]
Figure 1. The geometry of FE model for a beam with a hole (left) and with an end-notch (right), adapted from [9].
Buildings 12 00967 g001
Figure 2. Geometry and locations of possible failure modes in CLT beam with a hole.
Buildings 12 00967 g002
Figure 3. Geometry and locations of possible failure modes in CLT beam with an end-notch.
Buildings 12 00967 g003
Figure 4. Geometry and test setups for test series with holes (H1 to H4) and notched test series (N1 and N2). (a) Test series H1 (lh = hh = 0.50h; M/V = 1.50h); (b) Test series H2 (lh = hh = 0.40h; M/V = 1.50h); (c) Test series H3 (lh = hh = 0.50h; M/V = ∞); (d) Test series H4 (lh = hh = 0.50h; M/V = 0); (e) Test series N1 (hef/h = 0.50; M/V = ln = 0.33h); (f) and Test series N2 (hef/h = 0.75; M/V = ln = 0.33h).
Buildings 12 00967 g004
Figure 5. The cross-sectional dimensions of individual laminations for test series with holes (left) and notched test series (right).
Buildings 12 00967 g005
Figure 6. Test arrangements and position of measurement devices for all test series. (a) Test series H1; (b) Test series H2; (c) Test series H3; (d) Test series H4; (e) Test series N1; (f) and Test series N2.
Buildings 12 00967 g006aBuildings 12 00967 g006b
Figure 7. Photos of measurement devices for all test series. (a) Test series H1; (b) Test series H2; (c) Test series H3; (d) Test series H4; (e) Test series N1; (f) and Test series N2.
Buildings 12 00967 g007
Figure 8. Applied force F vs. global deflection δ6 for test series with holes. (a) Test series H1; (b) Test series H2; (c) Test series H3; (d) and Test series H4.
Buildings 12 00967 g008
Figure 9. Applied force F vs. local displacements δ2–5 for test series with holes. (a) Test series H1 (H1-3); (b) Test series H2 (H2-4); (c) Test series H3 (H3-1); (d) and Test series H4 (H4-3).
Buildings 12 00967 g009aBuildings 12 00967 g009b
Figure 10. Photos of fractured test series with holes. (a) Test series H1; (b) Test series H2; (c) Test series H3; (d) and Test series H4.
Buildings 12 00967 g010
Figure 11. Applied force F vs. global deflection δ6 for notched test series. (a) Test series N1; (b) and Test series N2.
Buildings 12 00967 g011
Figure 12. Applied force F vs. local displacements δ2–5 for notched test series. (a) Test series N1 (N1-2); (b) and Test series N2 (N2-2).
Buildings 12 00967 g012
Figure 13. Photos of fractured notched test series. (a) Test series N1; (b) and Test series N2.
Buildings 12 00967 g013
Figure 14. Stress ratios for shear failure in crossing areas (FM III) for all test series.
Buildings 12 00967 g014
Figure 15. Parameter study of shear strength capacities for CLT beams with holes.
Buildings 12 00967 g015
Figure 16. Parameter study of shear strength capacities for notched CLT beams.
Buildings 12 00967 g016
Table 1. Varying geometry parameters in FE analyses, adapted from [9].
Varying ParameterBeam with a HoleBeam with an End-Notch
Lamination width (bx = by = b)150 mm150 mm
Beam height (h)≥600 mm; ≤1800 mm≥300 mm; ≤1200 mm
Layup ratio (tnet,y/tgross)0.200.20
Layup ratio (tgross/nCA)50 mm50 mm
Hole length (lh)b; ≤h-
Hole height (hh)b; ≤0.5h-
Aspect ratio of the hole (lh/hh)≥1; ≤4-
Notch depth (hhef)-b; ≤0.5h
Notch length (ln)-b; ≤0.5h
Aspect ratio of the notch (ln/hef)-≤1.0
Table 2. The geometry of test series with holes (H1-H4) and notched test series (N1 and N2).
Test SeriesNumber of Specimenstgross
[mm]
h
[mm]
L
[mm]
hh (hef)
[mm]
lh (ln)
[mm]
M/V
[-]
Layup
[mm]
H1410060033003003001.50h40-20-40
H2410060033002402401.50h40-20-40
H34100600330030030040-20-40
H441006003000300300040-20-40
N1410060024003002000.33h40-20-40
N2410060024004502000.33h40-20-40
Table 3. The cross-sectional dimensions of the individual laminations for all test series.
Test SeriesTest Specimenby *
[mm]
bx,1
[mm]
bx,2
[mm]
bx,3
[mm]
bx,4
[mm]
bx,5
[mm]
bx,6
[mm]
h = Σbx
[mm]
H11121836713116830120599
2121698011818216136601
31215396102198-151600
4113164-1988811040600
H21146381425618414166600
2148521287017028152600
3151122581401009882600
4149138431558511368602
H3131826813017028122600
225165-1988910940601
327150-1981029653599
431136161821188072604
H41104118331651356388602
29657941041352148601
396132181801197970598
41061324914915147104602
N11281481524619860-604
2311301683019870-596
3156619834164134-596
4155519847151150-601
N21289819815444105-599
2331181981346485-599
3168019817226128-604
43510219815048100-598
* Reduced transverse lamination width near the hole or notch. Due to the symmetry of test series H3 and H4, it is the smaller value measured from both sides of the hole.
Table 4. Summary of test results for test series with holes.
Test SeriesH1H2H3H4
Test SpecimensFmax
[kN]
δ6,Fmax
[mm]
Fmax
[kN]
δ6,Fmax
[mm]
Fmax
[kN]
δ6,Fmax
[mm]
Fmax
[kN]
δ6,Fmax
[mm]
1125.417.94179.722.29201.316.30240.59.48
2149.825.99170.917.48183.920.51255.78.34
3152.019.82166.725.36198.717.26203.38.58
4163.722.12175.123.70188.318.98225.37.98
Mean147.7-173.1-193.1-231.2-
CoV9.4%-2.8%-3.7%-8.4%-
Table 5. Summary of test results for notched test series.
Test SeriesN1N2
Test SpecimensFmax
[kN]
δ6,Fmax
[mm]
Fmax
[kN]
δ6,Fmax
[mm]
1213.717.23247.821.56
2189.816.77230.417.61
3194.317.55225.412.23
4200.416.54231.312.99
Mean199.6-233.7-
CoV4.5%-3.6%-
Table 6. Calculated stress values at failure loads for test series with holes.
Failure ModesBendingTensionFM IFM IIFM III
Test SpecimenFmax
[kN]
σx
(1)
[MPa]
σx,h
(2)
[MPa]
σt,y,h
(7)
[MPa]
τxy,gross,h
(9)
[MPa]
τxy,net,h
(11)
[MPa]
τzx,h
(21)
[MPa]
τzy,h
(19)
[MPa]
τtor,z,h
(16)
[MPa]
H1-1125.421.5529.1016.703.1413.180.660.562.00
H1-2149.825.7534.7819.963.7515.750.790.662.39
H1-3152.026.1335.2820.263.8015.980.800.672.43
H1-4163.728.1437.9921.824.0917.210.860.732.61
mean147.725.3434.2819.683.6915.530.770.662.36
H2-1179.730.8932.8819.723.7417.230.860.552.28
H2-2170.929.3831.2818.763.5616.380.820.522.17
H2-3166.728.6530.5018.303.4715.980.800.512.11
H2-4175.130.0932.0419.223.6516.780.840.532.22
mean173.129.7531.6719.003.6116.590.830.532.19
H3-1201.325.1725.173.752.52 *12.58 *0.63 *-1.57 *
H3-2183.922.9922.993.432.30 *11.49 *0.57 *-1.44 *
H3-3198.724.8424.843.712.48 *12.42 *0.62 *-1.55 *
H3-4188.323.5423.543.512.35 *11.77 *0.59 *-1.47 *
mean193.124.1324.133.602.4112.070.60-1.51
H4-1240.512.5320.0418.804.0116.860.840.632.56
H4-2255.713.3221.3119.984.2617.920.900.672.72
H4-3203.310.5916.9415.893.3914.250.710.532.17
H4-4225.311.7318.7817.613.7615.790.790.582.40
mean231.212.0419.2718.073.8516.200.810.602.46
* Values are calculated in the region of constant shear force between beam end support and load introduction point. The equations from Section 2 are denoted in brackets. The underlined stress values corresponding to the assumed dominant failure mode.
Table 7. Calculated stress values at failure loads for notched test series.
Failure ModesBendingTensionFM IFM IIFM IIIFM III
Test SpecimenFmax
[kN]
σx
(1)
[MPa]
σx,n
(4)
[MPa]
σt,y,n
(8)
[MPa]
τxy,gross,n
(10)
[MPa]
τxy,net,n
(12)
[MPa]
τzx
(21)
[MPa]
τtor,z
(17)
[MPa]
τzy,n
(20)
[MPa]
τtor,z,n
(17)
[MPa]
N1-1213.723.3717.8146.315.3424.580.67 *1.67 *0.773.07
N1-2189.820.7615.8241.144.7521.830.59 *1.48 *0.682.73
N1-3194.321.2616.1942.104.8622.350.61 *1.52 *0.702.79
N1-4200.421.9216.7043.435.0123.050.63 *1.57 *0.722.88
mean199.621.8316.6343.254.9922.960.62 *1.56 *0.722.87
N2-1247.827.109.1716.774.1318.480.77 *1.94 *0.562.31
N2-2230.425.208.5315.603.8417.180.72 *1.80 *0.522.15
N2-3225.424.658.3415.263.7616.810.70 *1.76 *0.512.10
N2-4231.325.298.5615.663.8617.250.72 *1.81 *0.522.16
mean233.725.568.6515.823.9017.420.73 *1.83 *0.532.18
* Values are calculated on the non-notched side of the beam without using stress concentration factors. The equations from Section 2 are denoted in brackets. The underlined stress values corresponding to the assumed dominant failure mode.
Publisher’s Note: MDPI stays neutral with regard to jurisdictional claims in published maps and institutional affiliations.

