
Outdoor Cold Stress and Cold Risk for Children during Winter: A Study in China’s Severe Cold Regions

Abstract
:1. Introduction
2. Materials and Methods
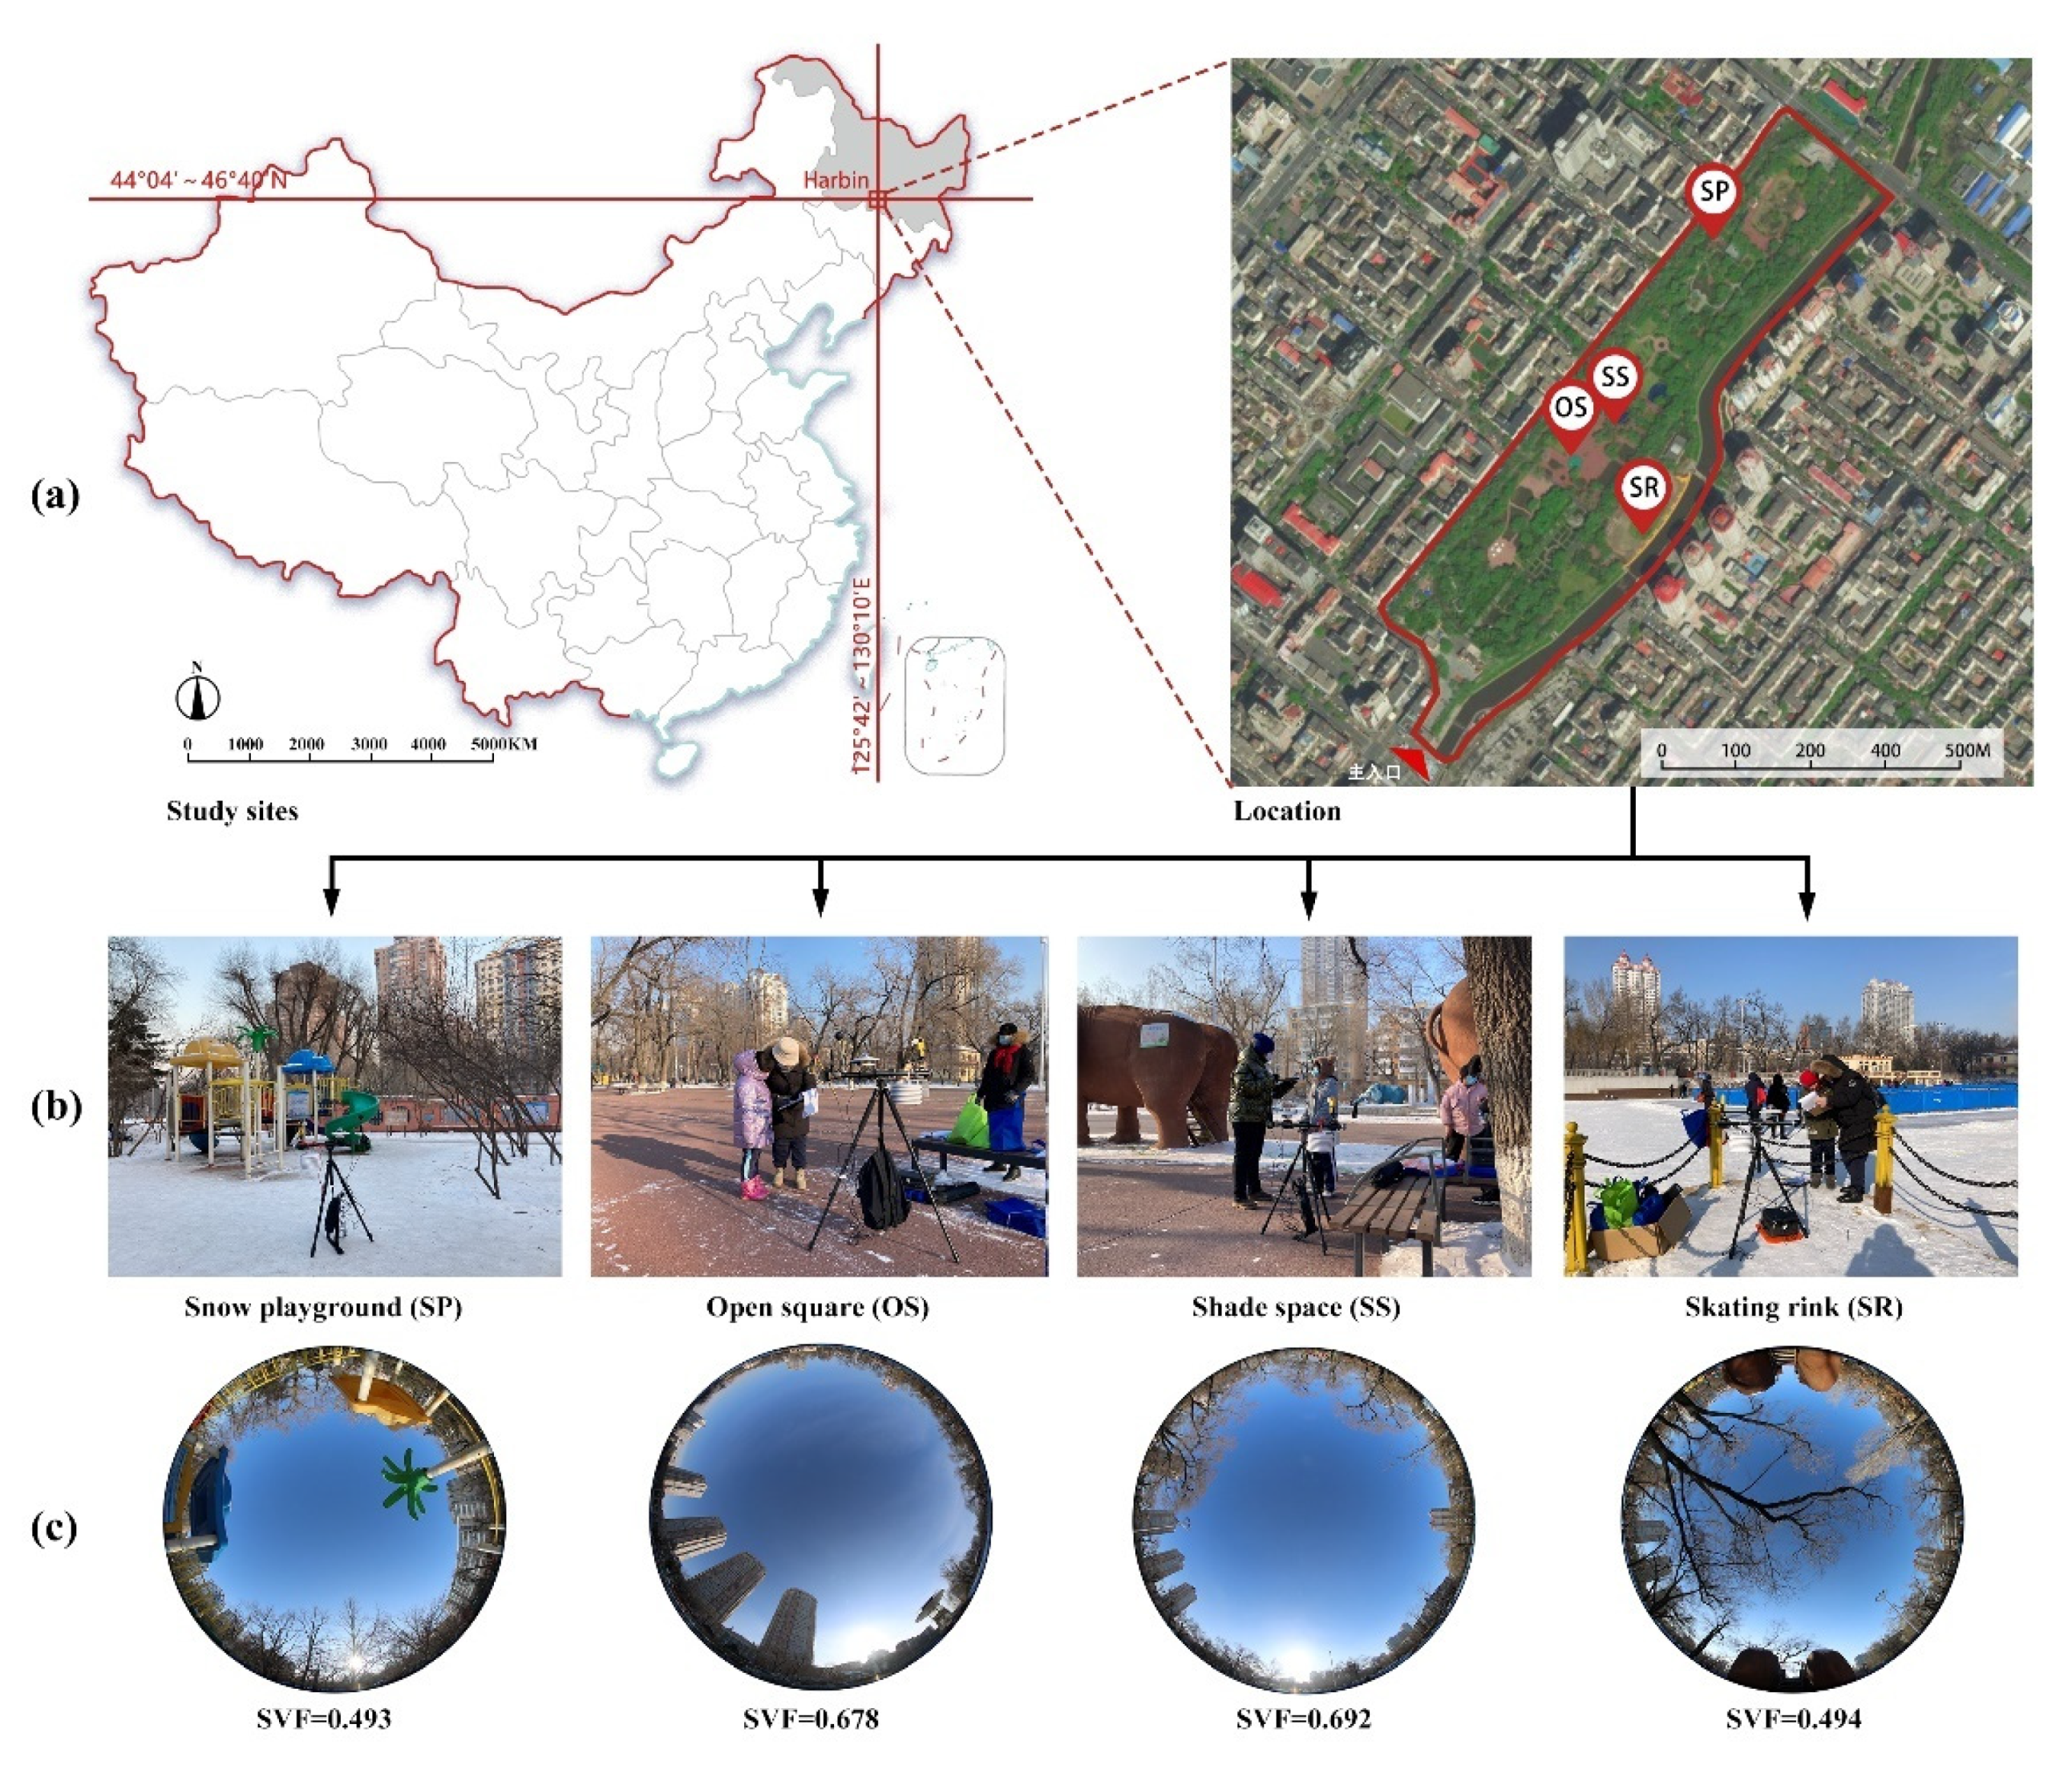
2.1. Study Area
2.2. Experimental Design
2.2.1. Meteorological Measurement and Ts
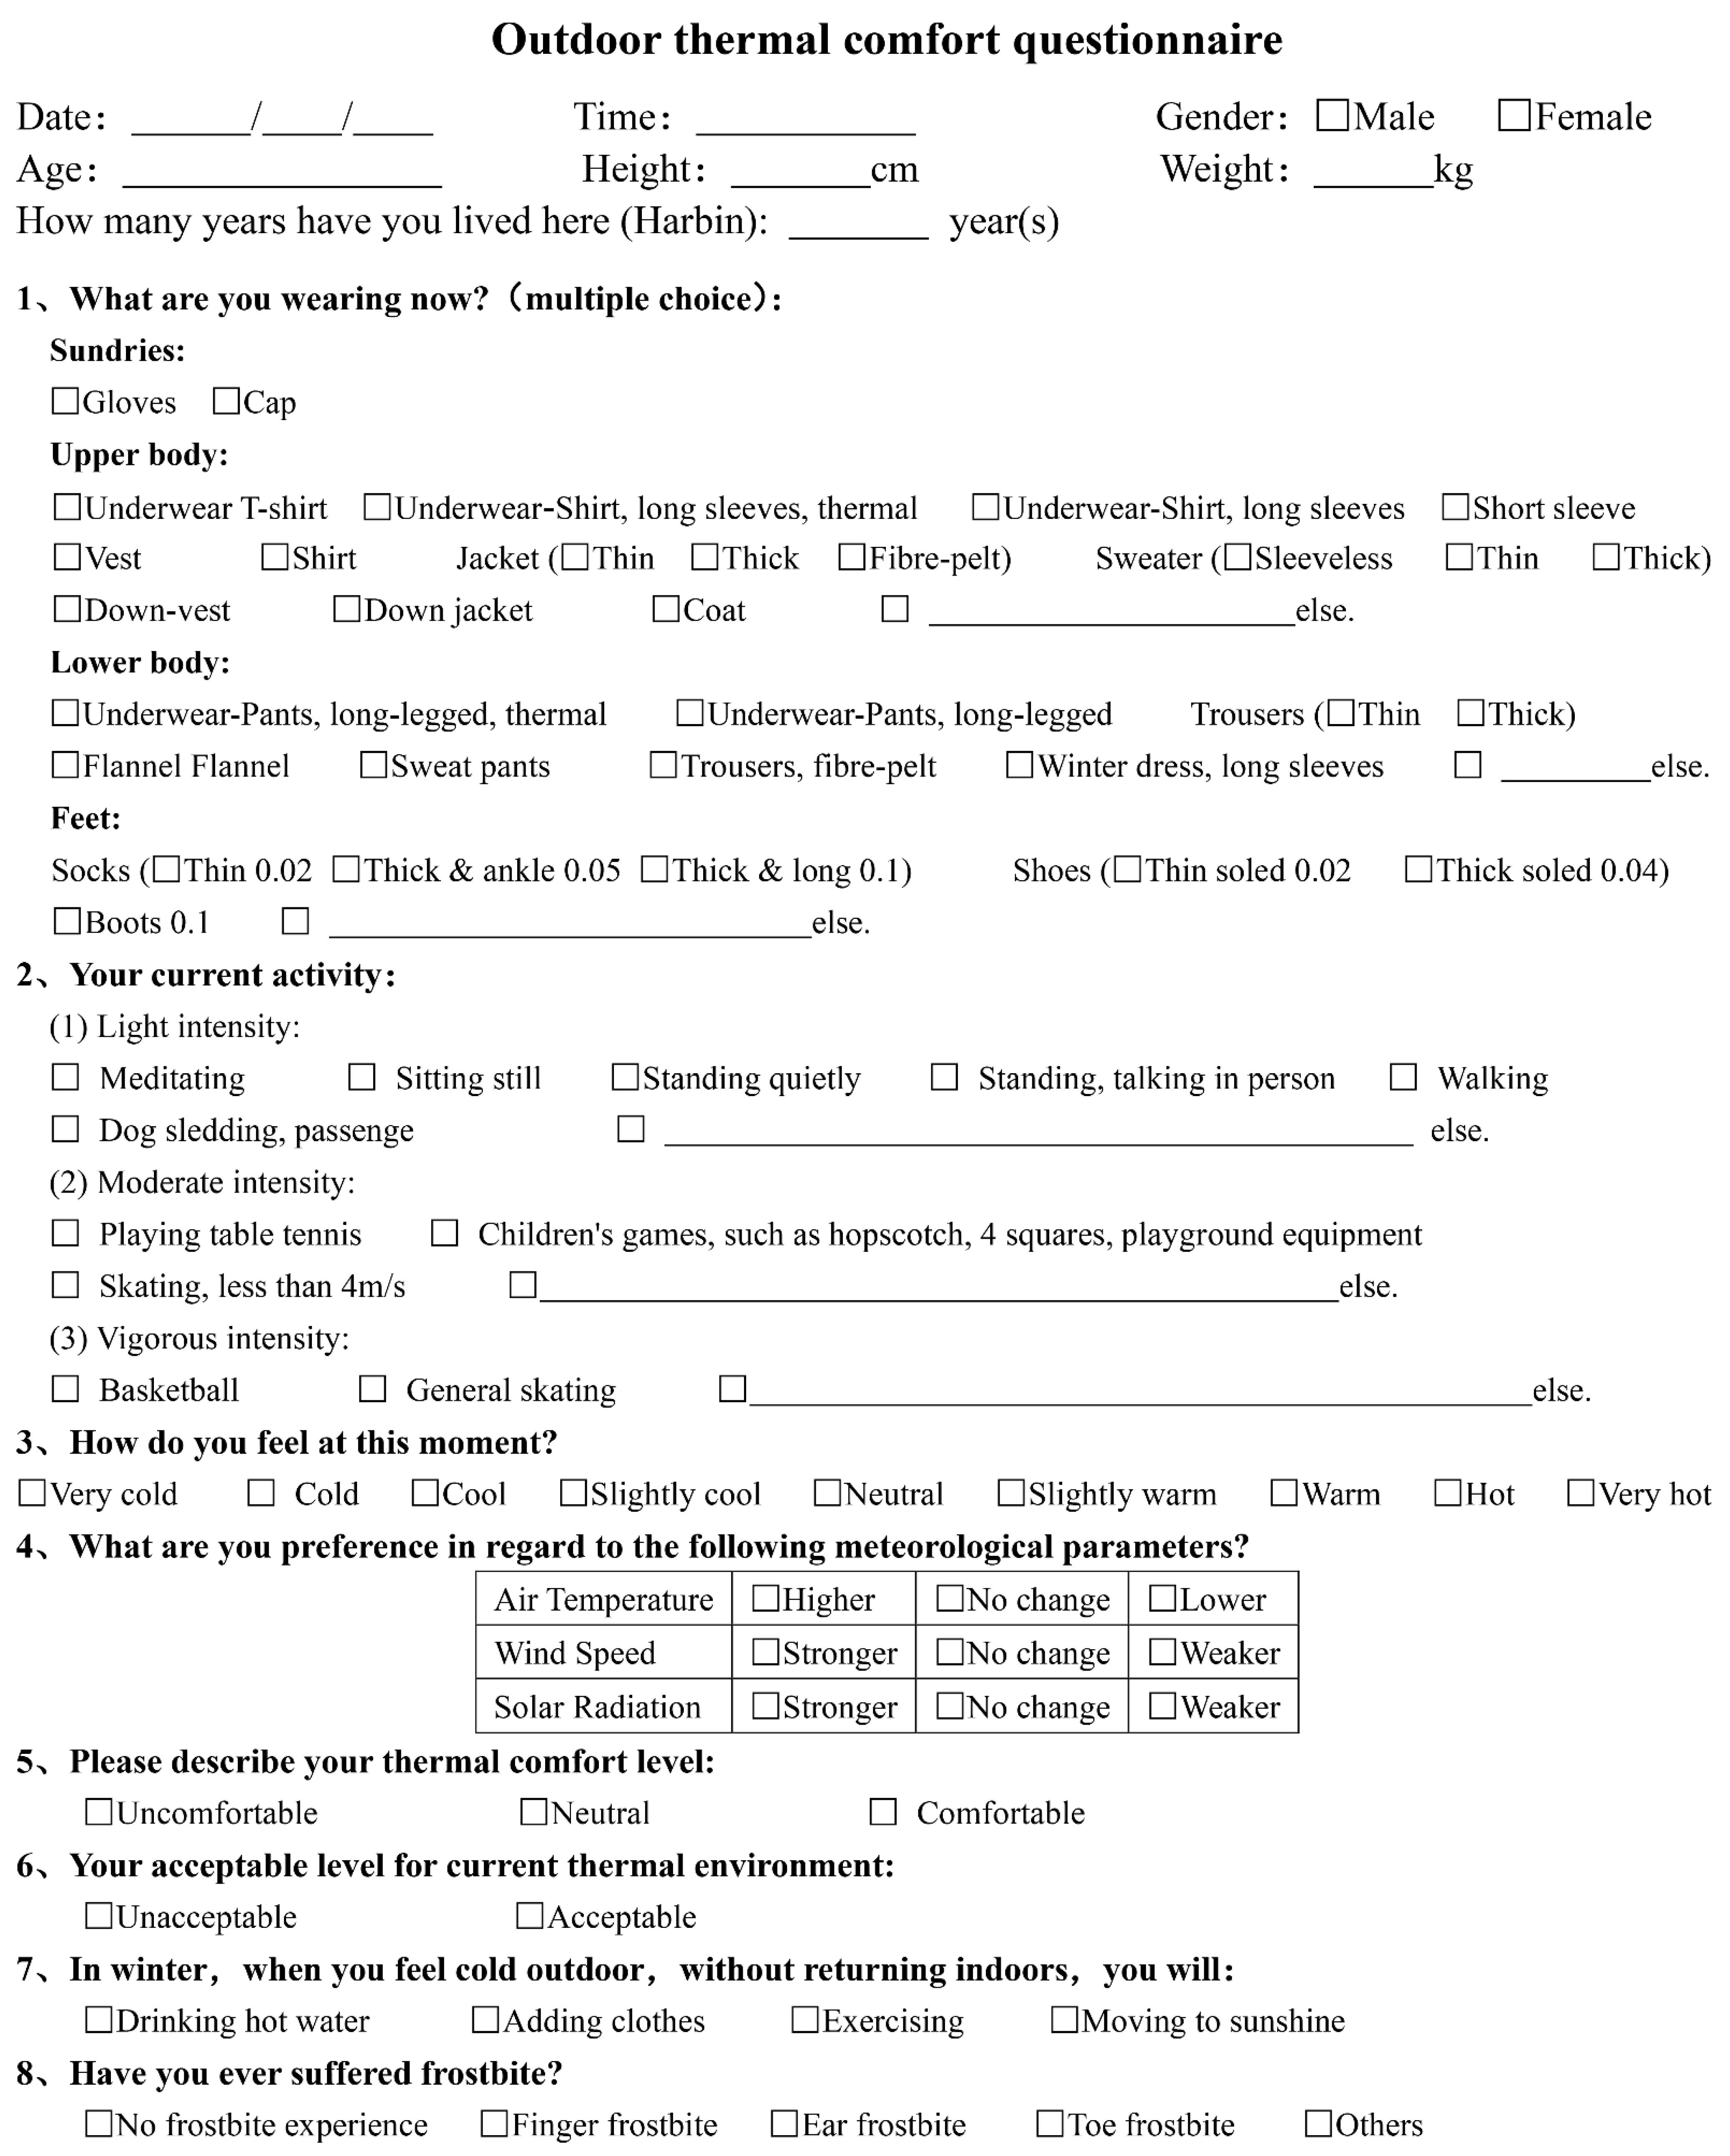
2.2.2. Survey Questionnaire
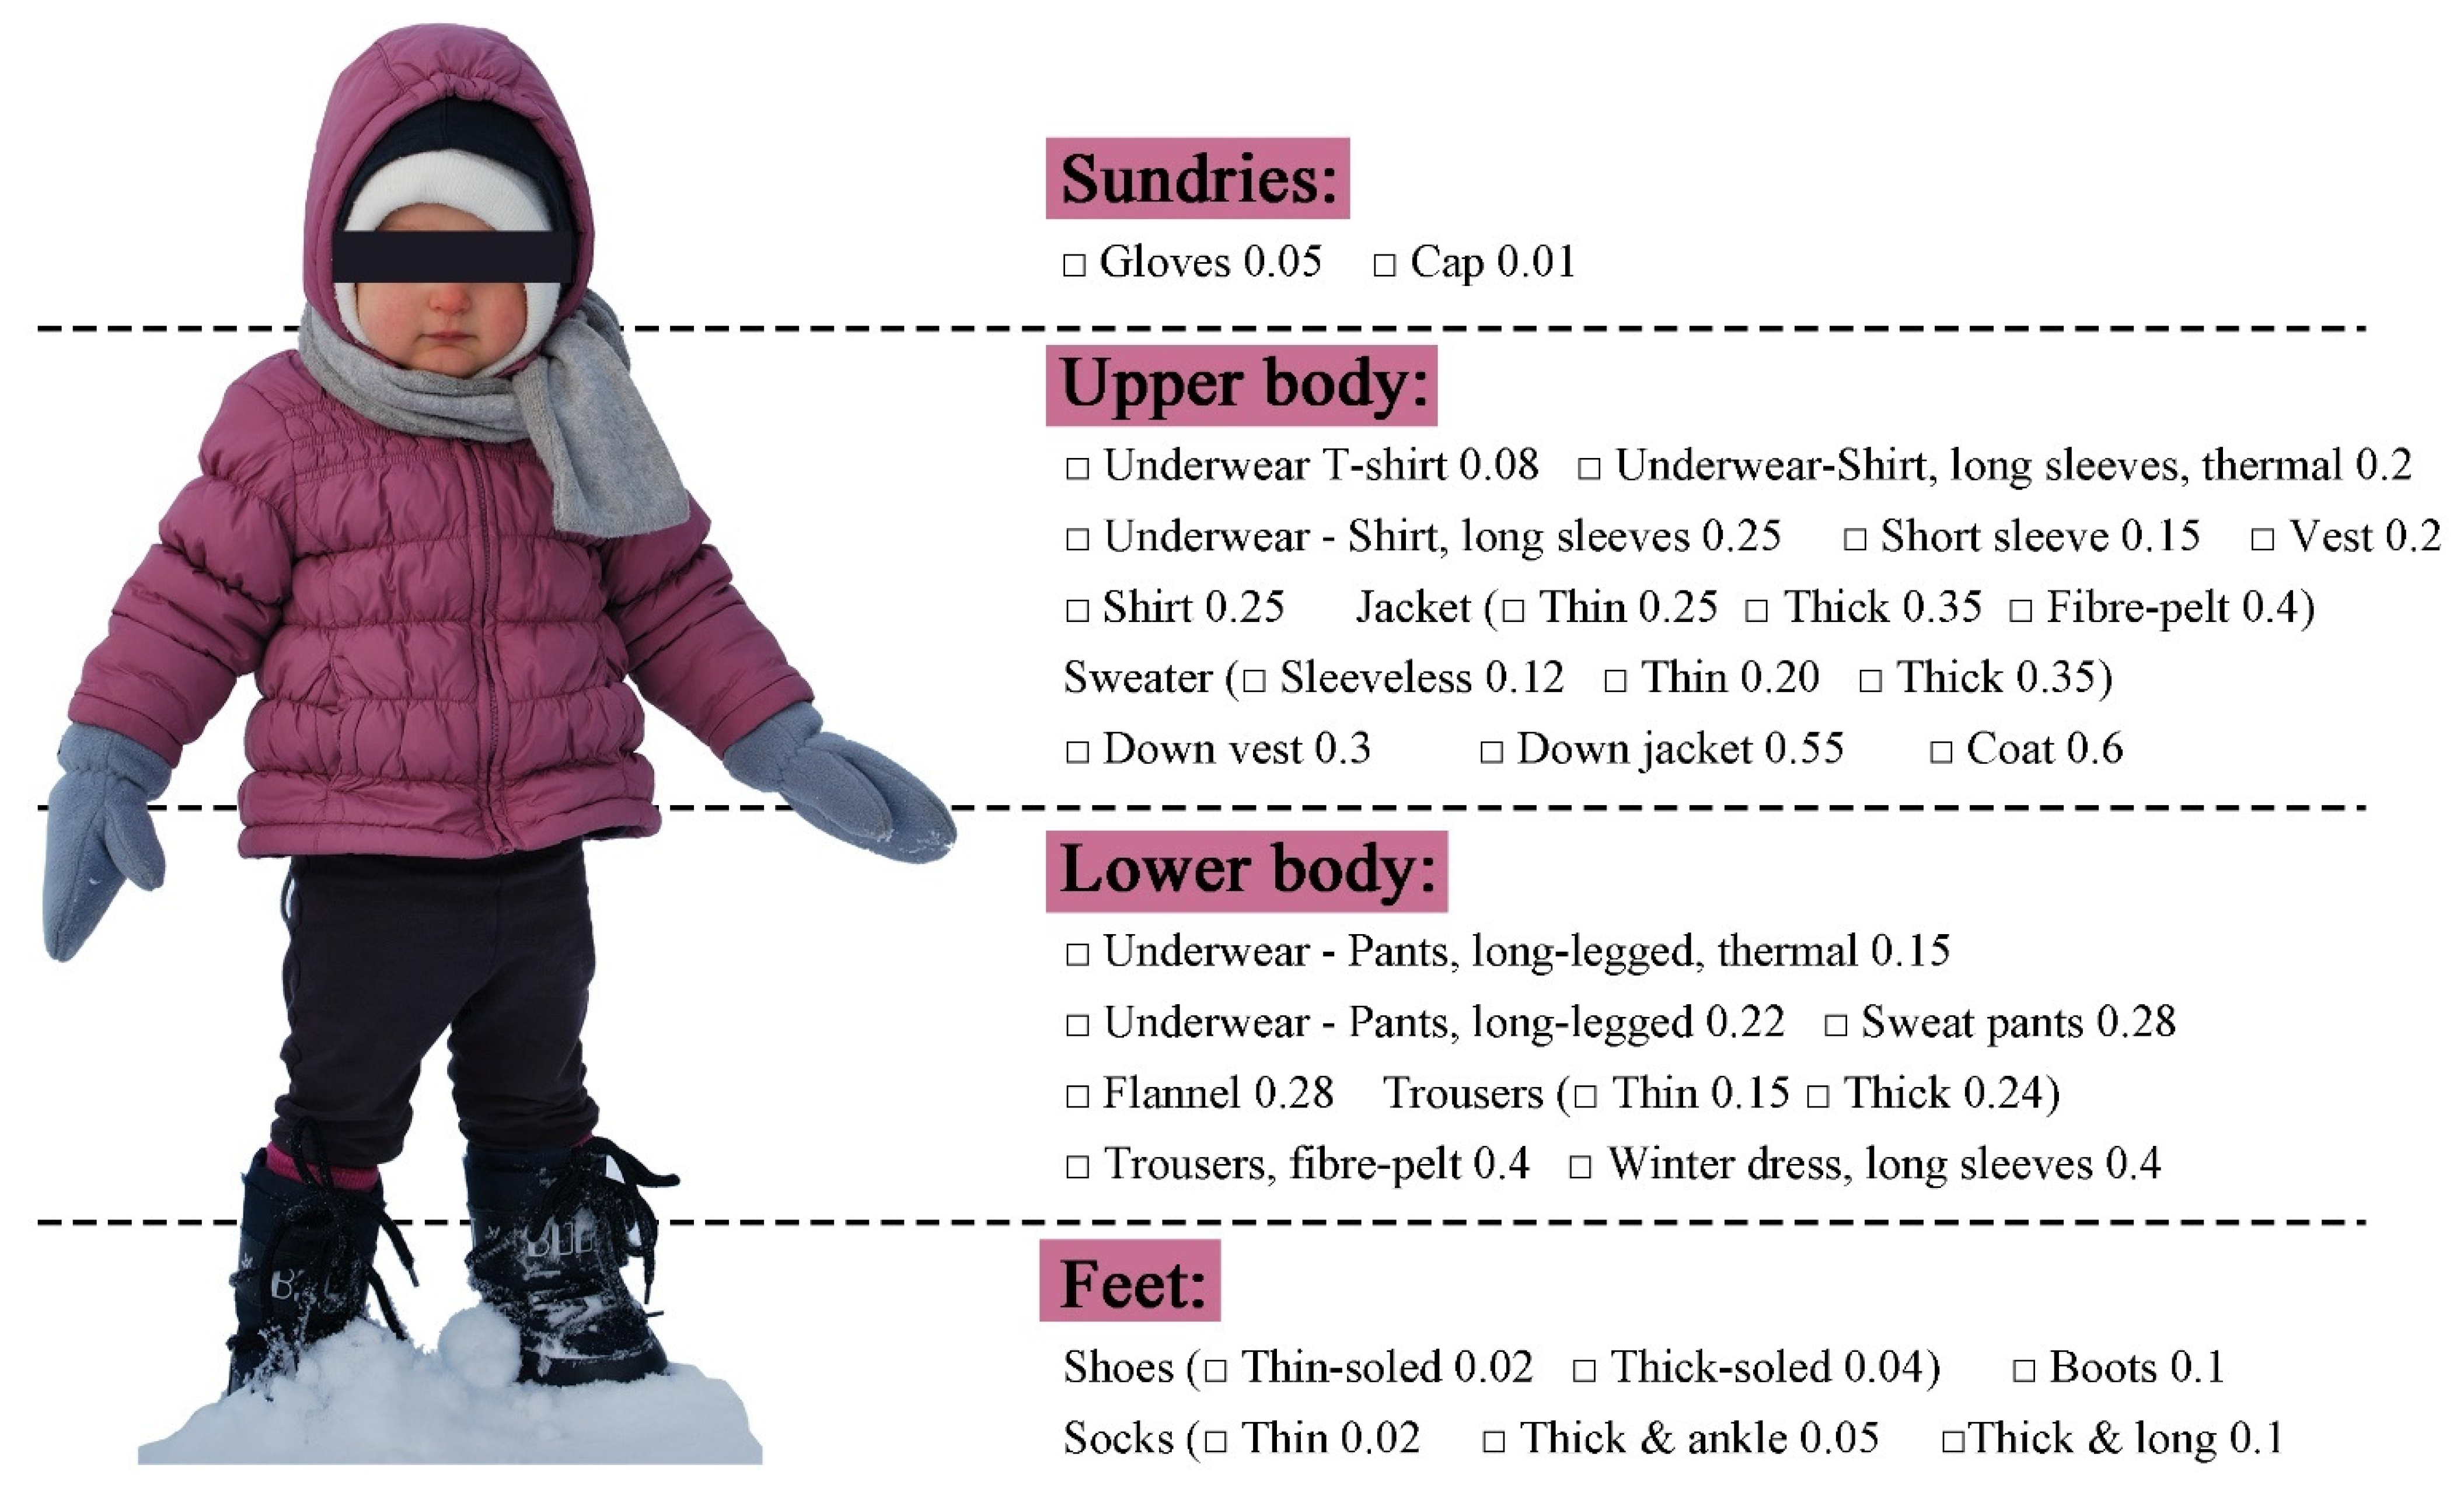
2.3. Metabolic Rate and Clothing Insulation
2.4. Thermal Indices
2.5. Cold Risk Assessment
2.5.1. Whole-Body Cooling Assessment
2.5.2. Local Cooling Assessment
- (1)
- Determination of wind cooling
- (2)
- Contact of bare skin with cold surfaces
3. Results
3.1. Descriptive Analysis
3.1.1. Volunteers’ Attributes
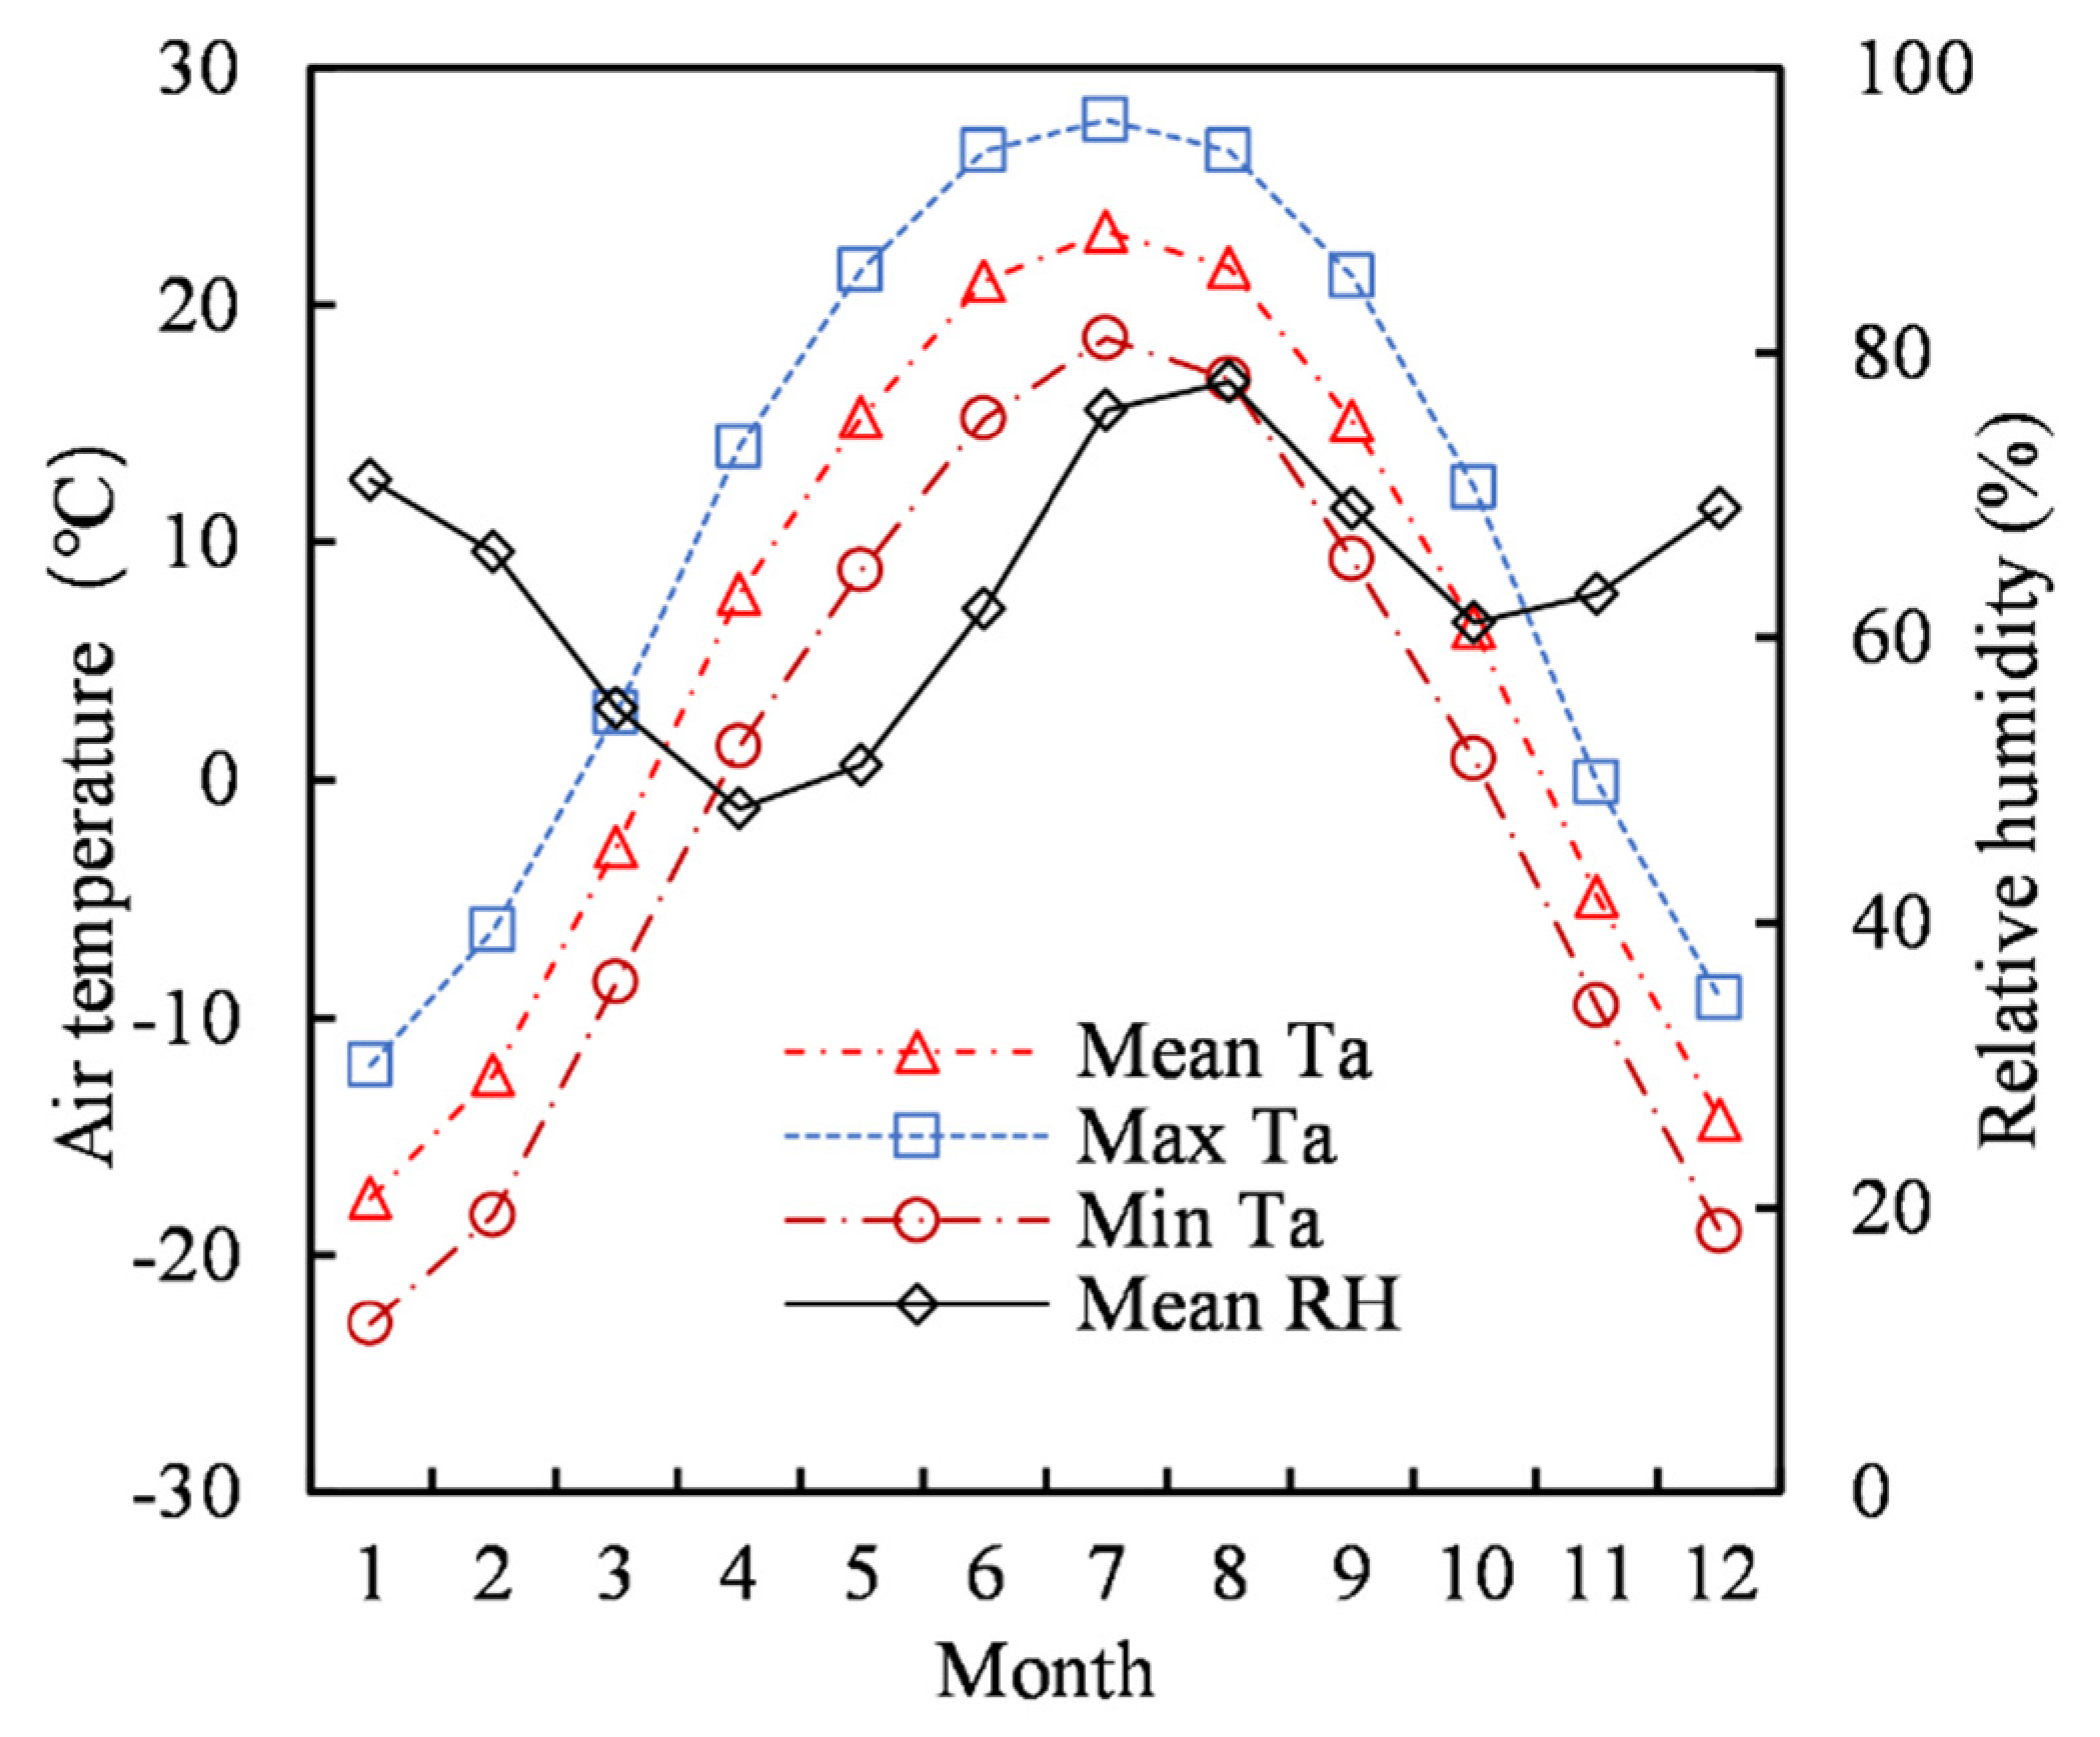
3.1.2. Meteorological Parameters
3.1.3. Meteorological Variables and TSV
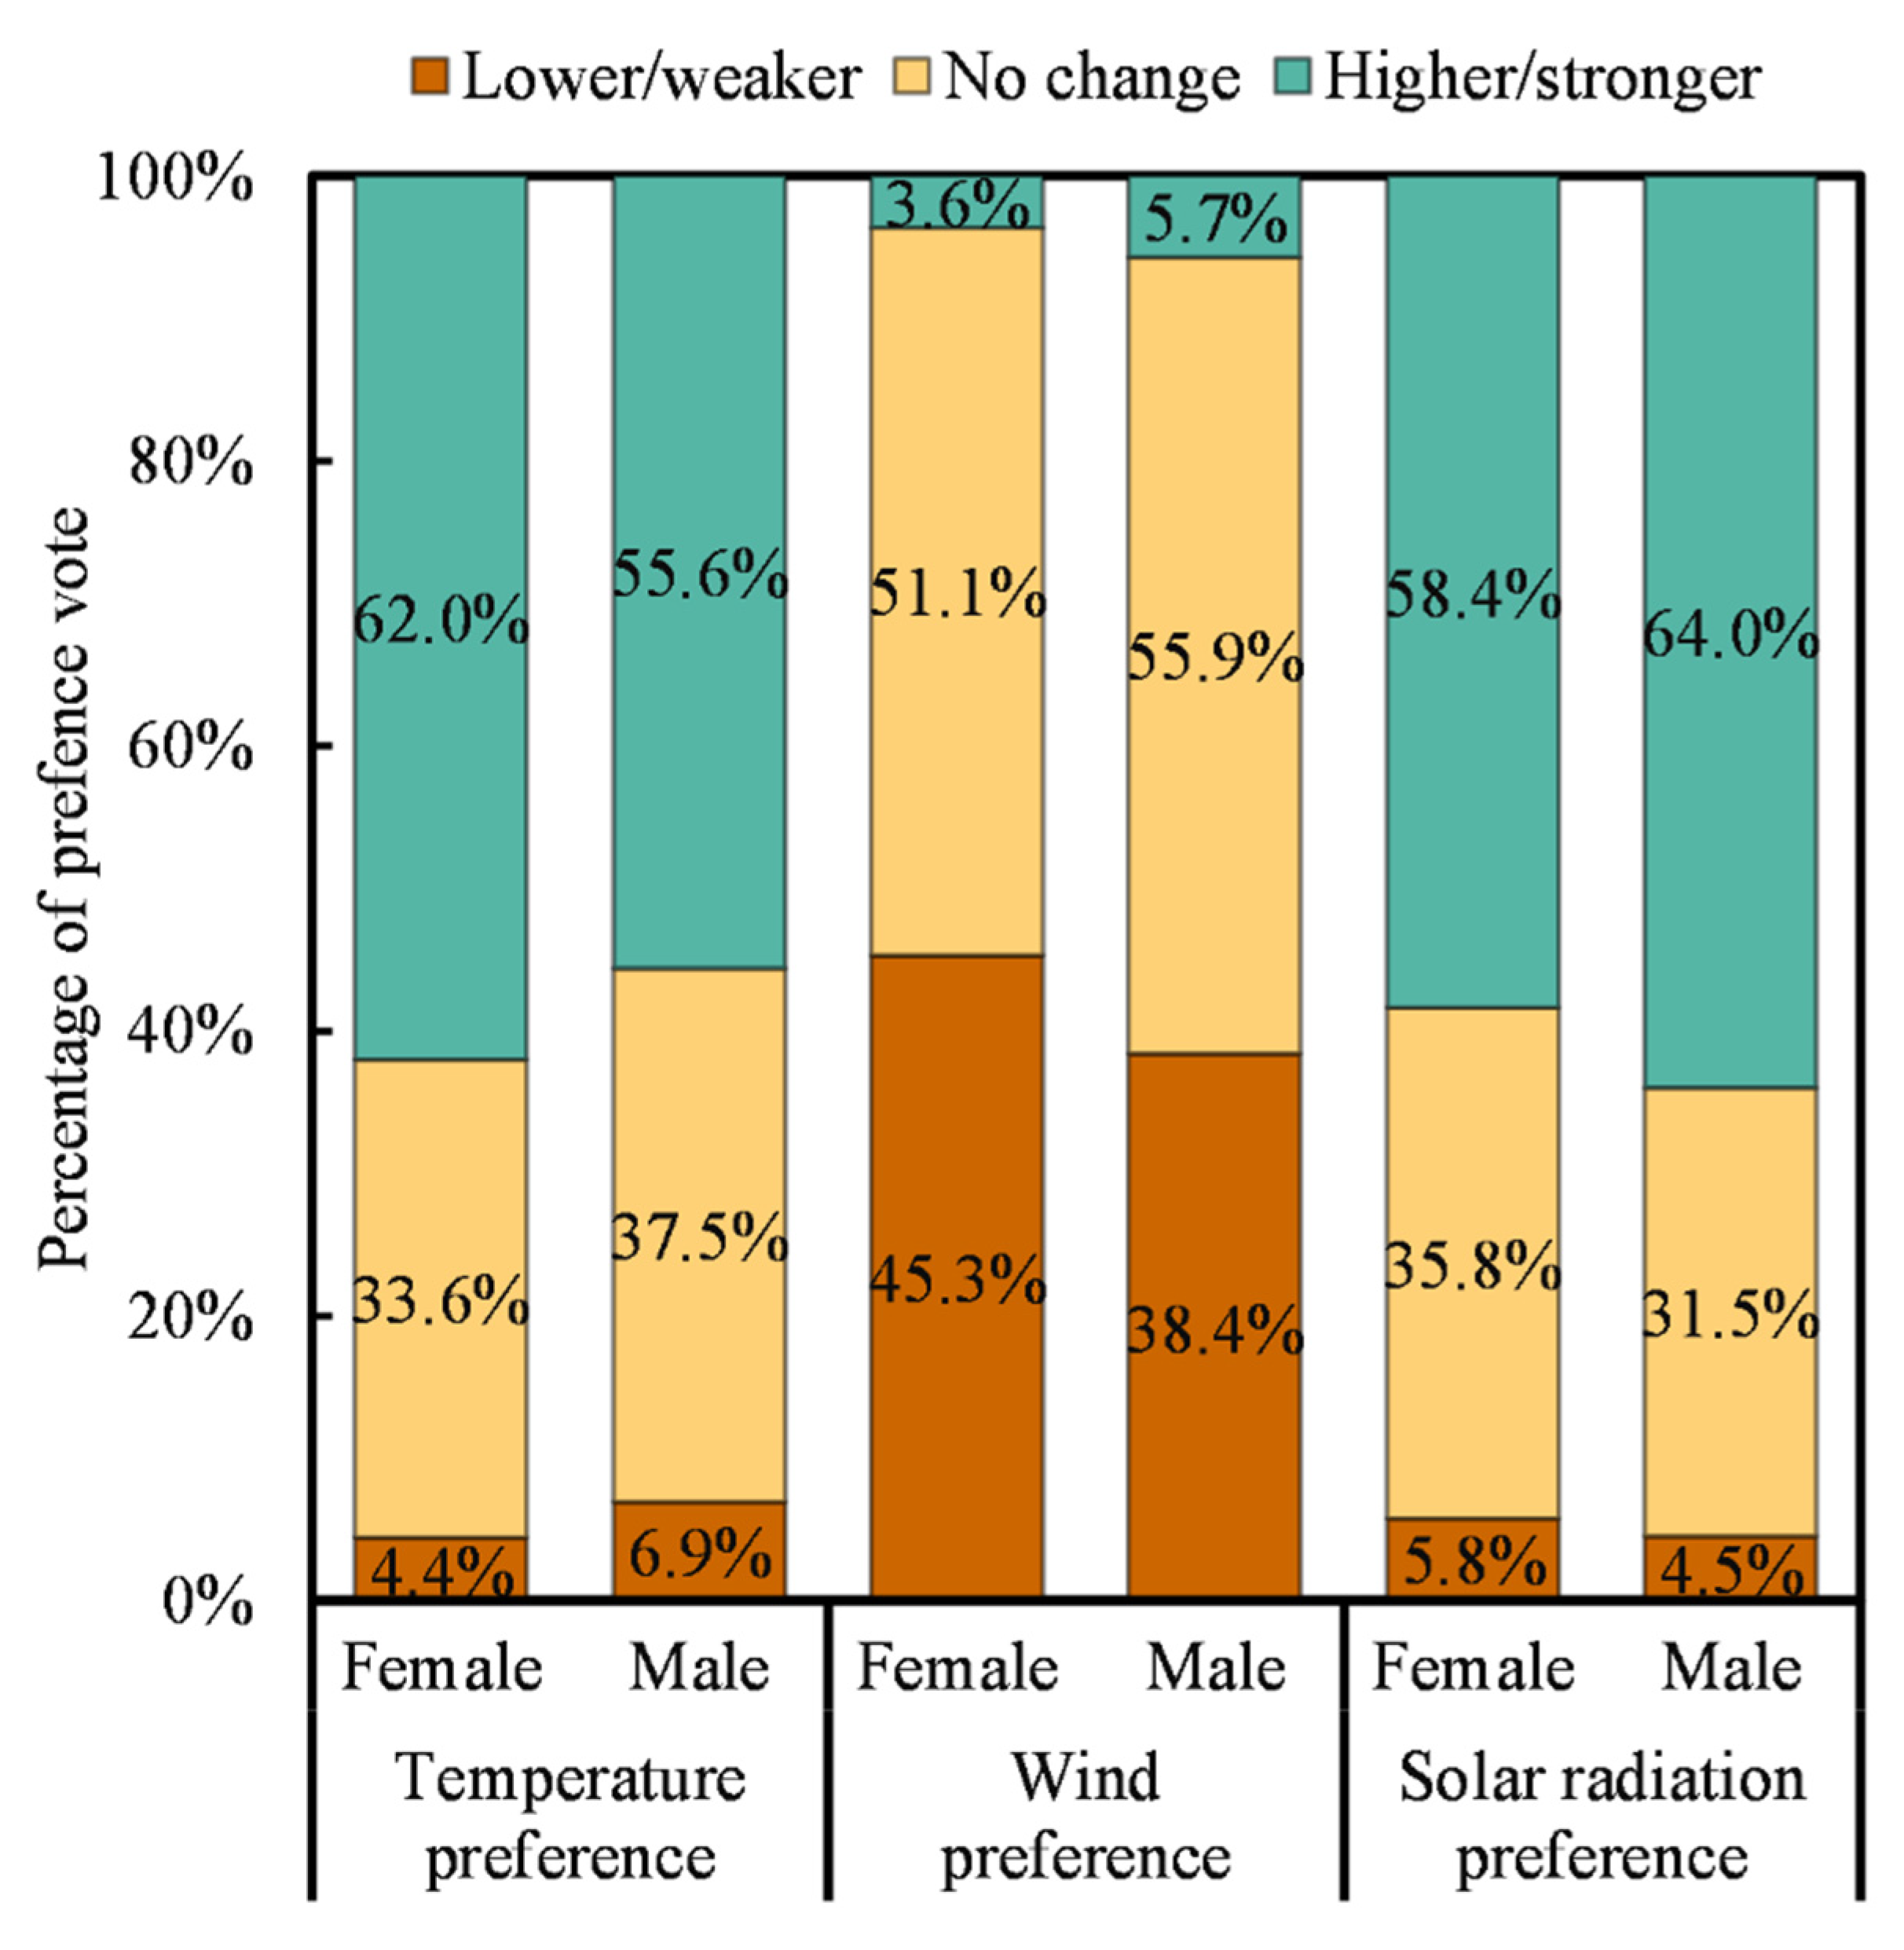
3.1.4. Preference Vote
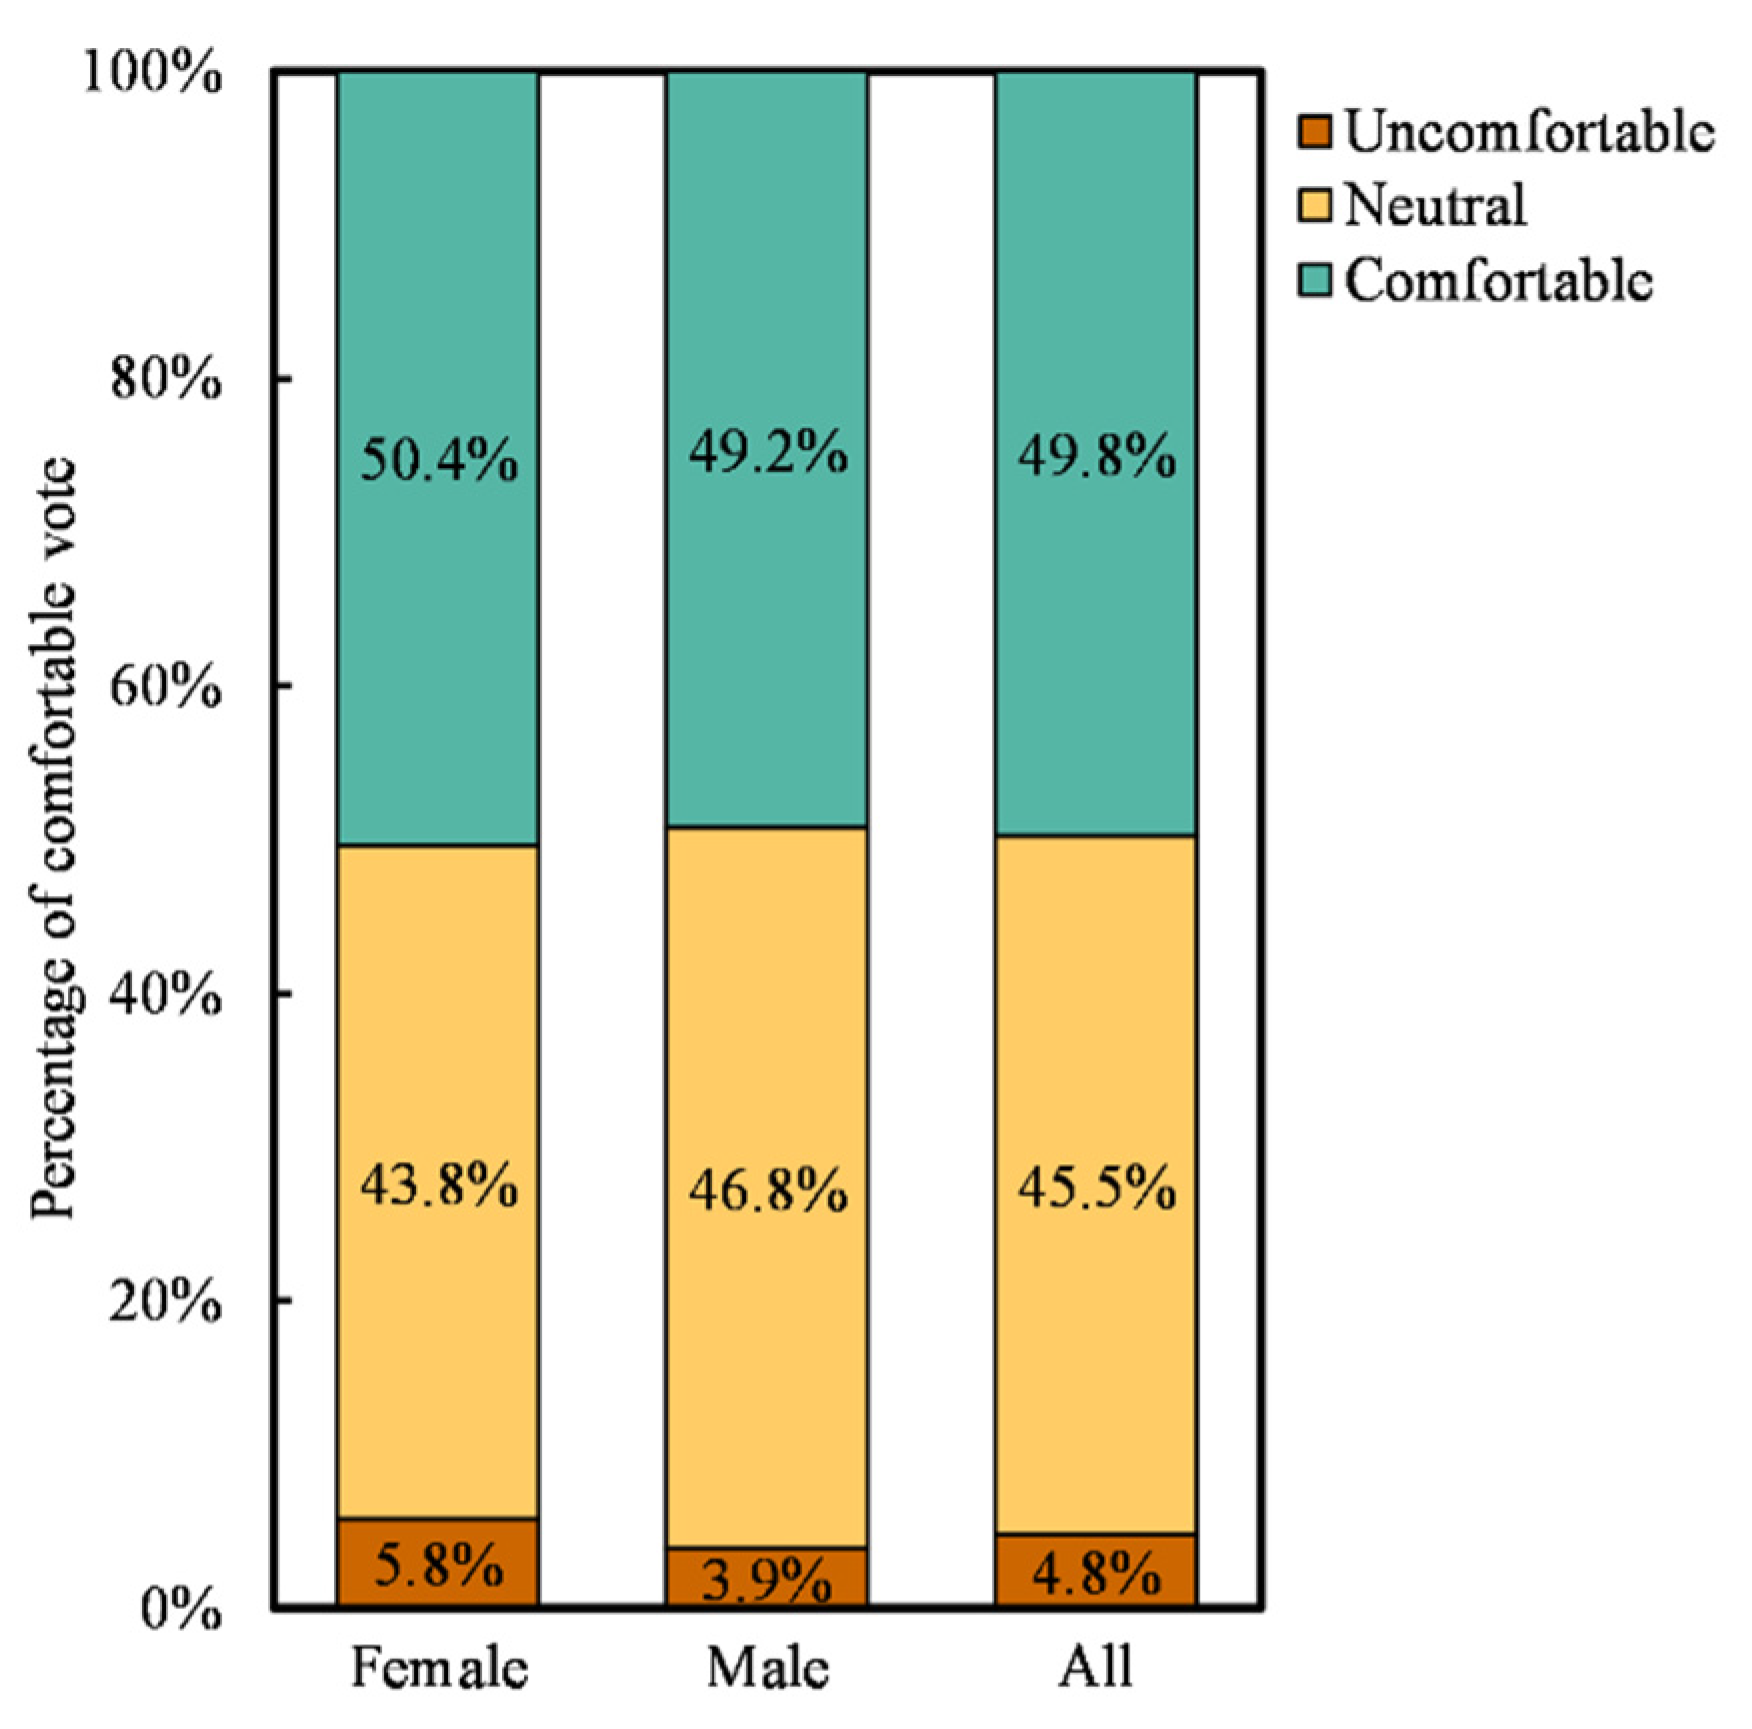
3.1.5. Thermal Comfort Vote (TCV)
3.2. Thermal Benchmarks
3.2.1. Neutral UTCI (NUTCI) and Neutral UTCI Range (NUTCIR)
3.2.2. Thermal Acceptability Range (TAR)
3.3. Thermal Comfort Calendar and Space Attendance
3.3.1. Thermal Comfort Calendar
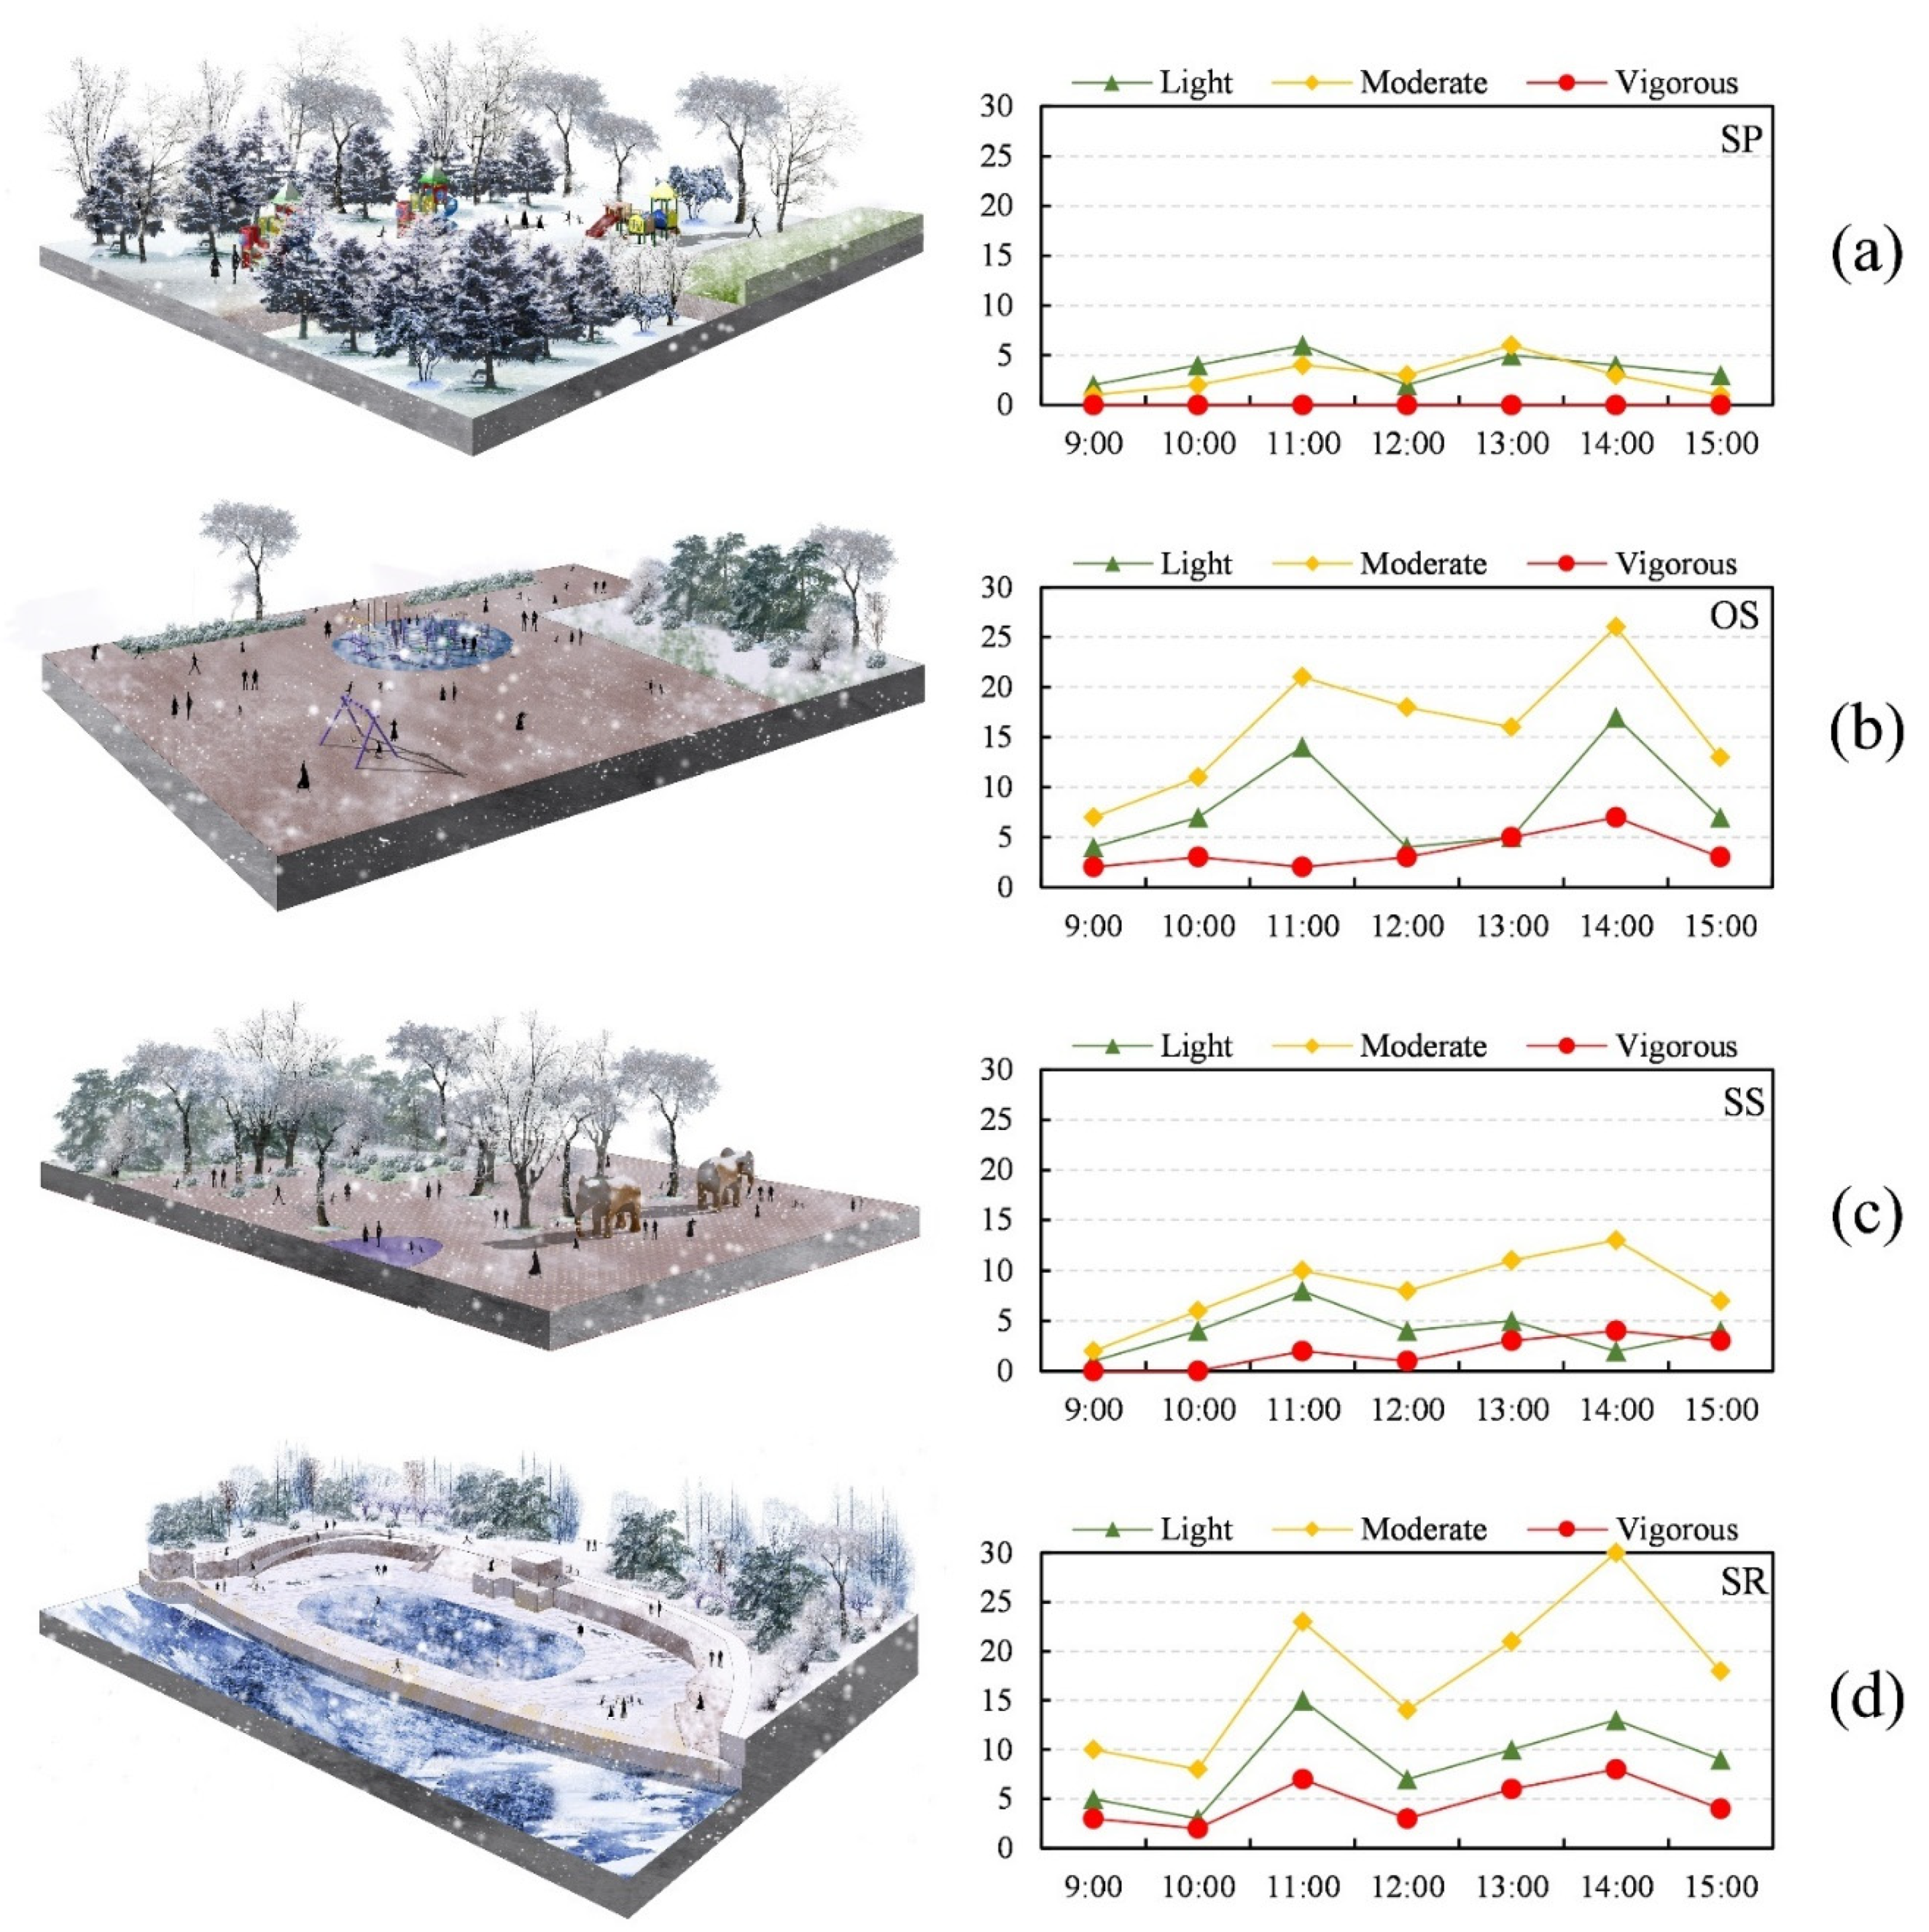
3.3.2. Space Attendance
3.4. Cold Risk Assessment
3.4.1. Frostbite Experience
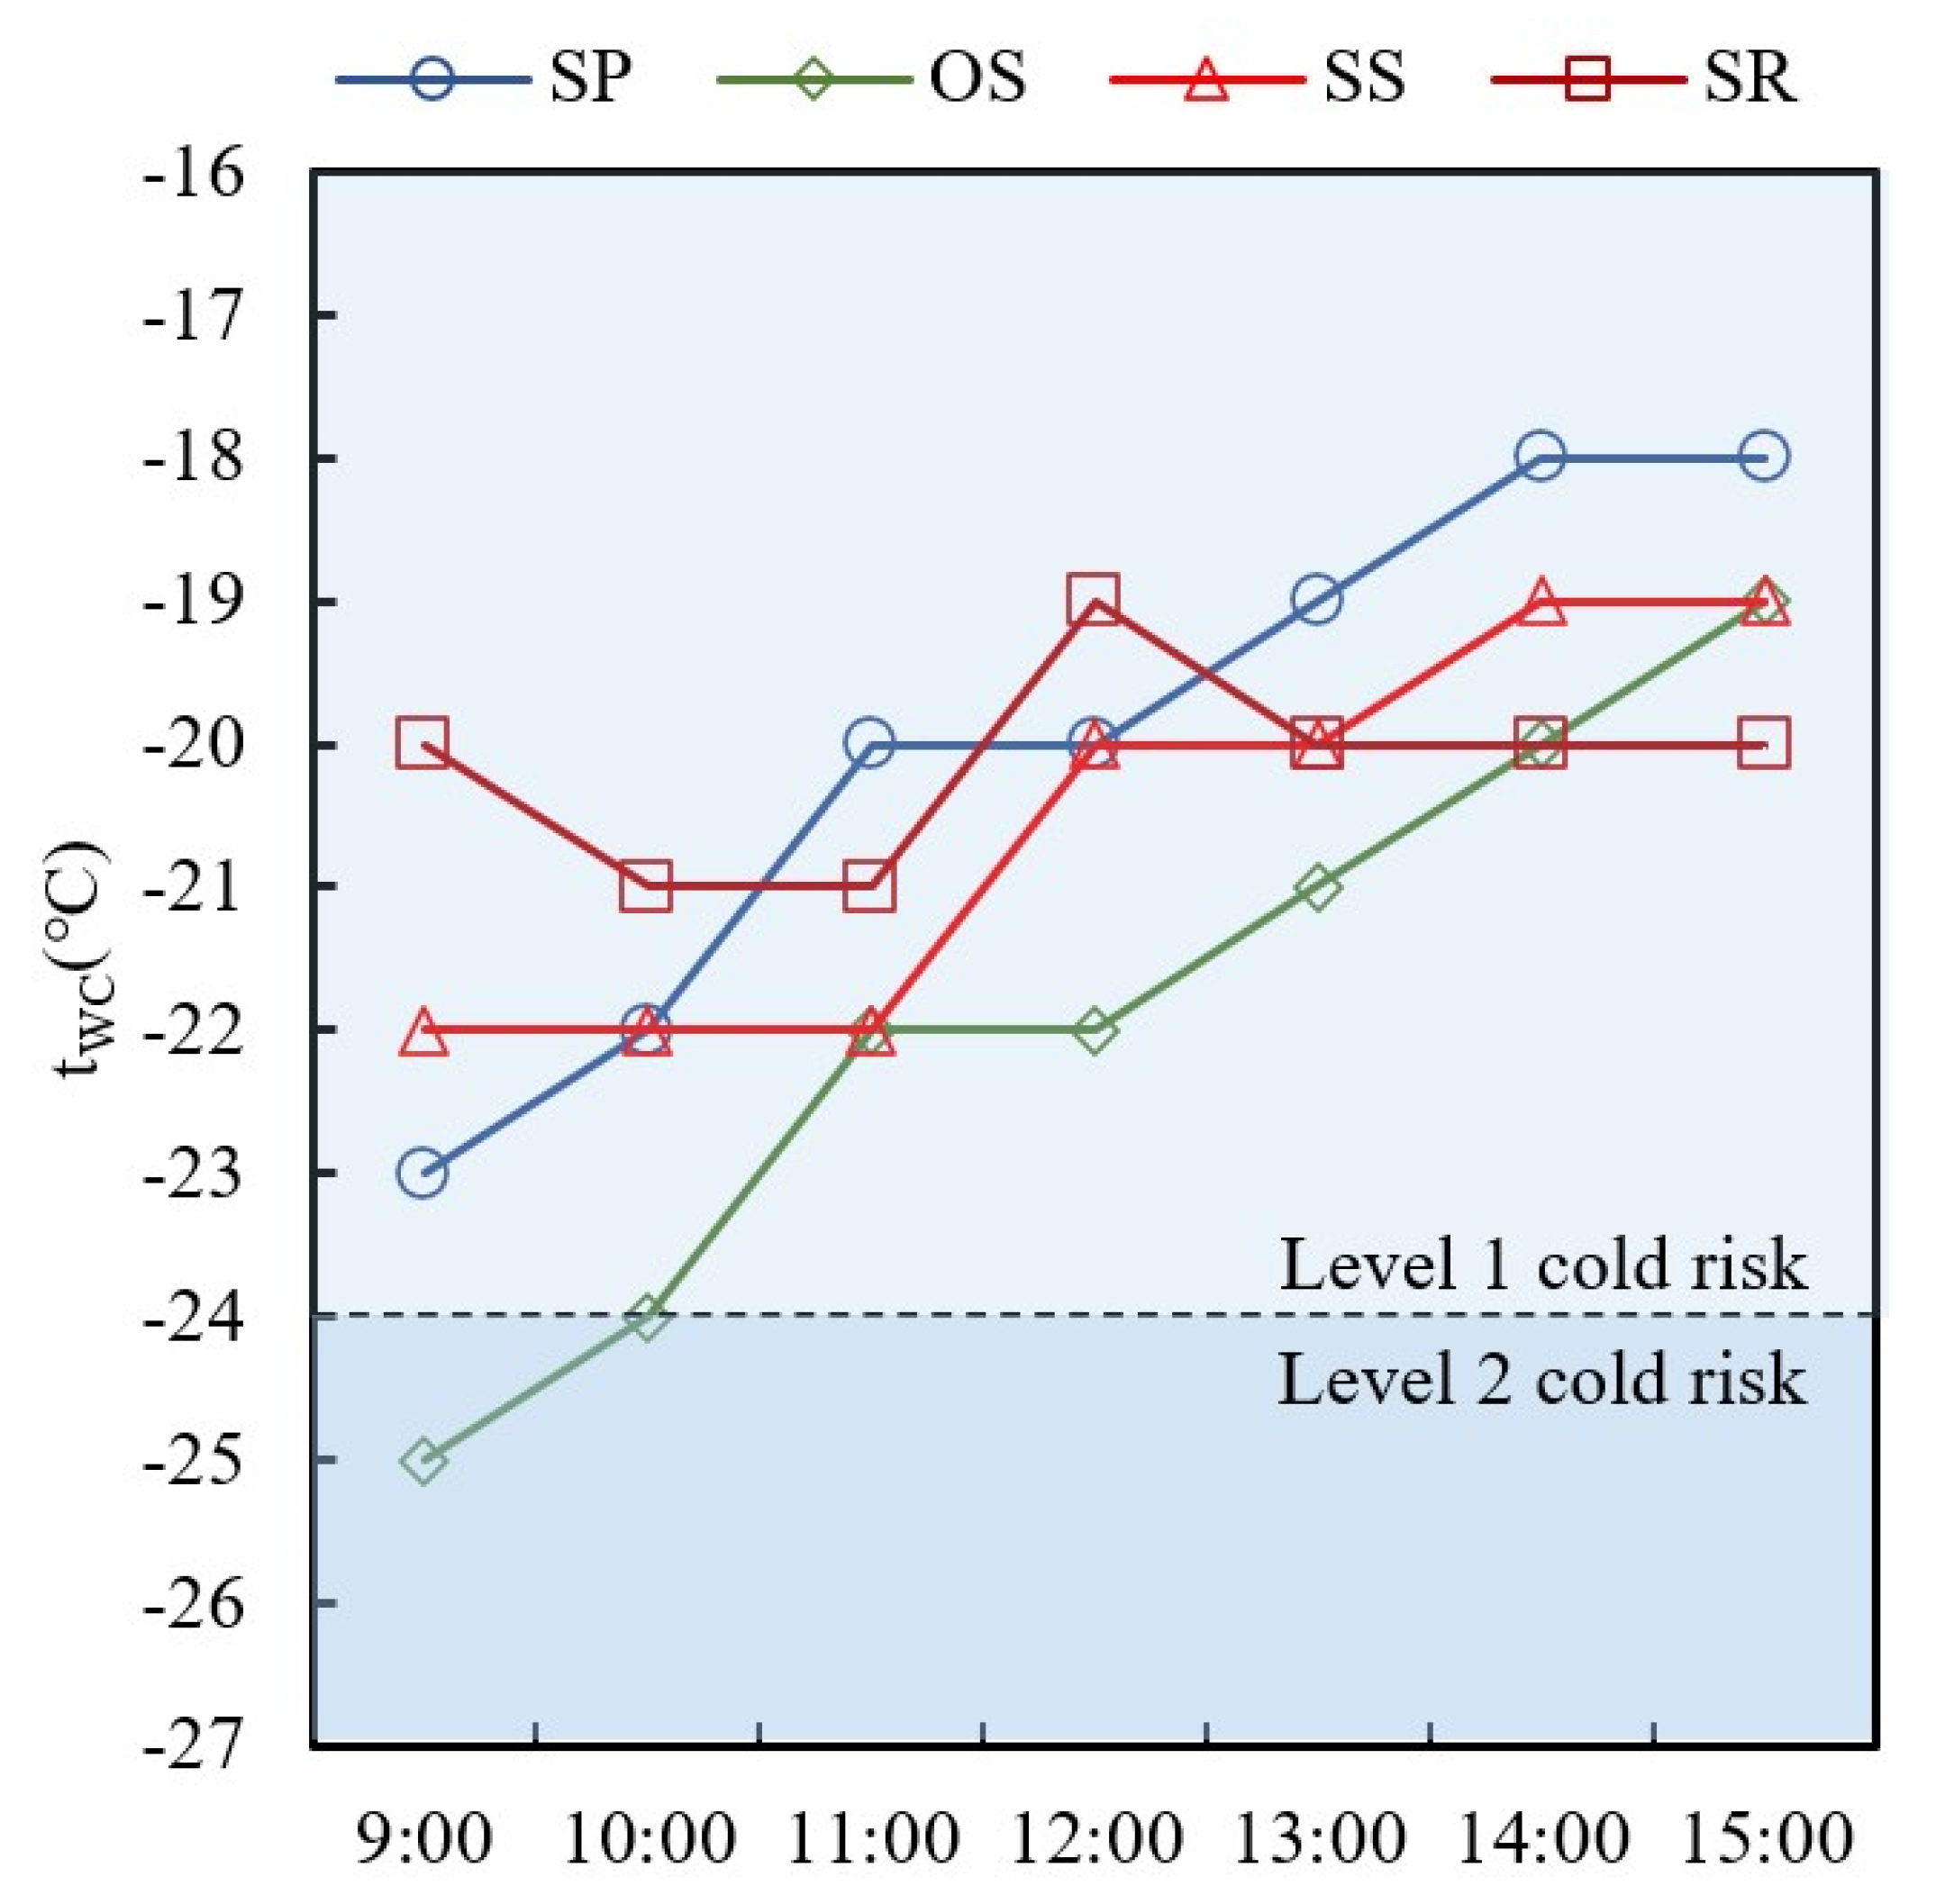
3.4.2. Whole-Body Cooling Assessment
3.4.3. Local Cooling Assessment
- (1)
- Assessment of wind cooling
- (2)
- Assessment for contact with cold surfaces
3.5. Thermal Adaptation Behaviors
4. Discussion
4.1. Thermal Benchmarks
4.1.1. NUTCI
4.1.2. NUTCIR
4.2. Attendance Patterns
4.3. Thermal Environment Safety
4.3.1. Thermal Environment Risk
4.3.2. Cold Risk Prevention
4.4. Limitations and Future Research
5. Conclusions
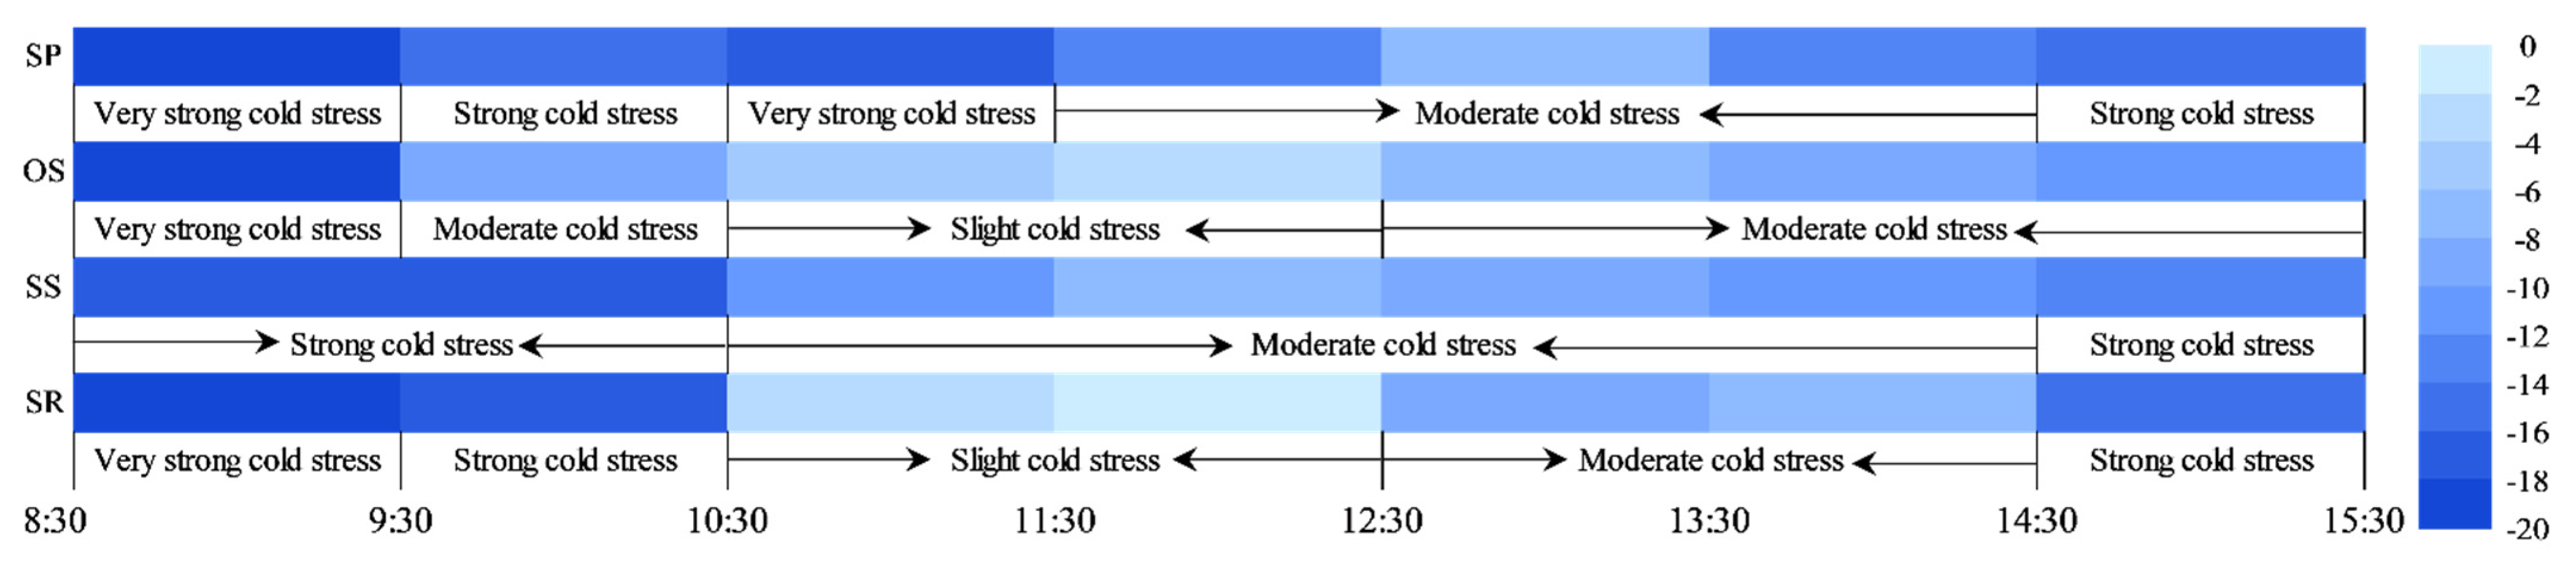
- In winter, the primary meteorological parameters affecting the children’s thermal perception are G, Tg, and Tmrt. Among them, G and Tg are the most important parameters affecting winter thermal sensation in male and female children in China’s severe cold regions. In the TCV, “comfortable” (49.8%), “neutral” (45.5%), and “uncomfortable” (4.8%) demonstrates the strong tolerance of children toward cold climates in China’s severe cold regions.
- In winter, female children exhibit lower NUTCI than male children (6.0 < 7.3 °C). The NUTCI of all children is 6.7 °C. The NUTCIR of female, male, and all children are −1.3–13.4, 0.6–14.1, and 0.5–14.0 °C, respectively. The minimum heat unacceptability ratio is greater than 20%. It indicates that the outdoor environment in the severe cold regions does not have comfortable thermal conditions for children in winter.
- In winter, the average Icl of children engaged in light-intensity activities is less than ICLmin (1.88 < 3.9 clo). These children are at risk of whole-body cooling. The risk at the SP, SS, and SR is always under Level 1 (−24 ≤ tWC ≤ −10 °C). OS has a risk level of Level 2 (tWC ≤ −24 °C) before 10:00 a.m. The children touched wooden seats, plastic slides, and permeable bricks with their fingers, making them prone to the risk of pain. Touching stone bricks, ice surfaces, and slide handrails for more than 10 s may cause numbness and frostbite.
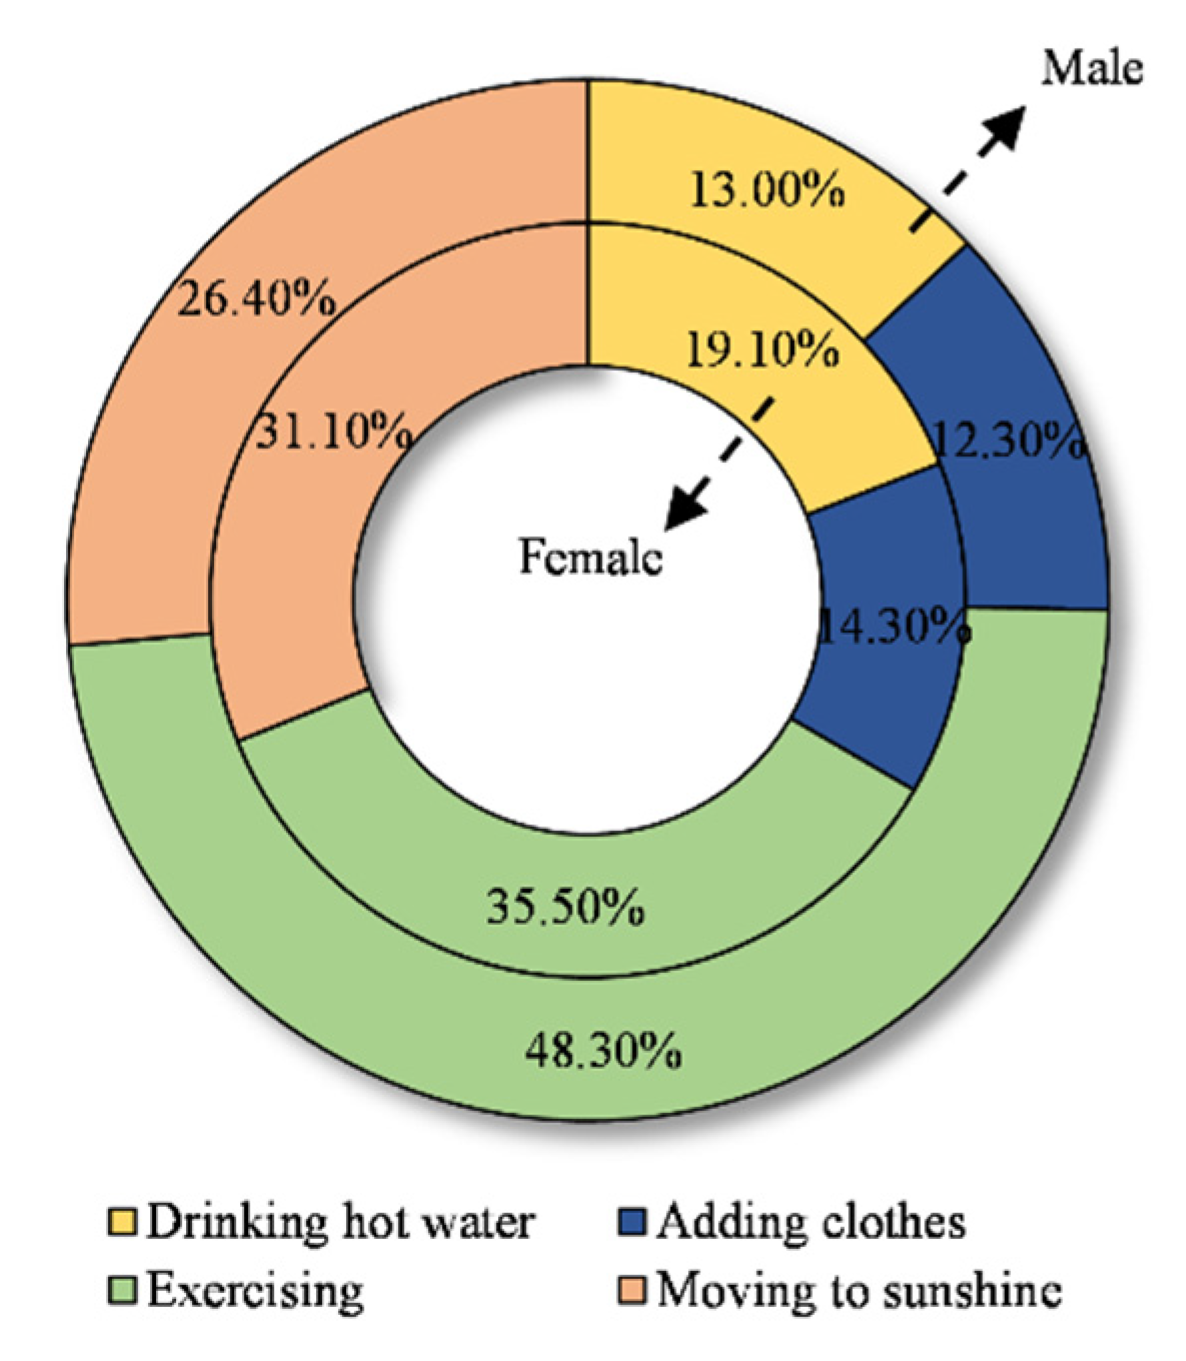
- At-risk subjects in these regions should receive more attention. More than 30% of the subjects experienced frostbite in different parts of the body. Approximately 16.6% had frostbitten ears, 14.8% had frostbitten fingers, and 2.5% had frostbitten toes. In addition, the subjects preferred exercising (PFemale = 35.5% and PMale = 48.3%) and moving to sunshine (PFemale = 31.1% and PMale = 26.4%) for thermal adaptation.
- To ensure that the children have a safer, more comfortable experience with outdoor physical activities in frigid regions, travel strategies based on thermal benchmarks and calendars were proposed. For example, children should exercise in children’s parks between 10:30 and 14:30 and choose the OS and SR with larger SVF and more solar radiation first. Additionally, the corresponding preventive strategies based on the cold risk assessment were proposed. For example, caregivers should assist children in protecting their skin from the cold, such as wearing gloves, scarves, stockings, masks, hats that can cover ears, and controlling the length of outdoor activities, avoiding prolonged exposure to cold wind. Moreover, gloves should be used to touch cold objects and falls should be avoided while outdoors.
Author Contributions
Funding
Institutional Review Board Statement
Informed Consent Statement
Data Availability Statement
Conflicts of Interest
Nomenclature
| SP | Snow playground |
| OS | Open square |
| SS | Shade space |
| SR | Skating rink |
| SVF | Sky view factor |
| TCV | Thermal comfort vote |
| TSV | Thermal sensation vote |
| TAR | Thermal acceptability range |
| MTSV | Mean TSV |
| UTCI | Universal Thermal Climate Index |
| NUTCI | Neutral UTCI |
| NUTCIR | Neutral UTCI range |
| Ta | Air temperature |
| RH | Relative humidity |
| V | Wind speed |
| Tg | Globe temperature |
| Tmrt | Mean radiant temperature |
| G | Solar radiation |
| V10 | Wind speed at 10 m |
| Icl | Clothing thermal resistance |
| IREQ | Required clothing insulation |
| DLE | Duration limited exposure |
| ICL | Required basic clothing insulation |
| PA | Physical activity |
Appendix A
Appendix B

| Activity Intensity | 9:00 | 10:00 | 11:00 | 12:00 | 13:00 | 14:00 | 15:00 | |
|---|---|---|---|---|---|---|---|---|
| Number | Light | |||||||
| Moderate | ||||||||
| Vigorous |
Appendix C
| Classification of Risk | tWC (°C) | Effect |
|---|---|---|
| 1 | −10 to −24 | Uncomfortably cold |
| 2 | −25 to −34 | Very cold, risk of skin freezing |
| 3 | −35 to −59 | Bitterly cold, exposed skin may freeze in 10 min |
| 4 | −60 and colder | Extremely cold, exposed skin may freeze within 2 min |
References
- WHO. Children: New Threats to Health. Available online: https://www.who.int/news-room/fact-sheets/detail/children-new-threats-to-health (accessed on 6 April 2022).
- WHO. Tenfold Increase in Childhood and Adolescent Obesity in Four Decades: New Study by Imperial College London and WHO. Available online: https://www.who.int/news/item/11-10-2017-tenfold-increase-in-childhood-and-adolescent-obesity-in-four-decades-new-study-by-imperial-college-london-and-who (accessed on 6 April 2022).
- Sahoo, K.; Sahoo, B.; Choudhury, A.K.; Sofi, N.Y.; Kumar, R.; Bhadoria, A.S. Childhood obesity: Causes and consequences. J. Fam. Med. Prim. Care 2015, 4, 187–192. [Google Scholar] [CrossRef]
- Myers, A.; Gibbons, C.; Finlayson, G.; Blundell, J. Associations among sedentary and active behaviours, body fat and appetite dysregulation: Investigating the myth of physical inactivity and obesity. Br. J. Sports Med. 2017, 51, 1540. [Google Scholar] [CrossRef] [PubMed]
- Pate, R.R.; Freedson, P.S.; Sallis, J.F.; Taylor, W.C.; Sirard, J.; Trost, S.G.; Dowda, M. Compliance with physical activity guidelines: Prevalence in a population of children and youth. Ann. Epidemiol. 2002, 12, 303–308. [Google Scholar] [CrossRef]
- Ahn, S.; Fedewa, A.L. A meta-analysis of the relationship between children’s physical activity and mental health. J. Pediatr. Psychol. 2011, 36, 385–397. [Google Scholar] [CrossRef]
- Moore, S.A.; Faulkner, G.; Rhodes, R.E.; Brussoni, M.; Chulak-Bozzer, T.; Ferguson, L.J.; Mitra, R.; O’Reilly, N.; Spence, J.C.; Vanderloo, L.M. Impact of the COVID-19 virus outbreak on movement and play behaviours of Canadian children and youth: A national survey. Int. J. Behav. Nutr. Phys. Act. 2020, 17, 85. [Google Scholar] [CrossRef]
- Li, J.; Liu, Y. Study on design strategies for improving outdoor thermal comfort in the cold regions of China. Adv. Mater. Res. 2011, 250–253, 3798–3801. [Google Scholar] [CrossRef]
- Boreham, C.; Riddoch, C. The physical activity, fitness and health of children. J. Sports Sci. 2001, 19, 915–929. [Google Scholar] [CrossRef]
- Biddle, S.J.; Gorely, T.; Stensel, D.J. Health-enhancing physical activity and sedentary behaviour in children and adolescents. J. Sports Sci. 2004, 22, 679–701. [Google Scholar] [CrossRef]
- Niu, J.; Liu, J.; Lee, T.-c.; Lin, Z.; Mak, C.; Tse, K.-T.; Tang, B.-s.; Kwok, K.C.S. A new method to assess spatial variations of outdoor thermal comfort: Onsite monitoring results and implications for precinct planning. Build. Environ. 2015, 91, 263–270. [Google Scholar] [CrossRef]
- World Health Organization. Global Recommendations on Physical Activity for Health; World Health Organization: Geneva, Switzerland, 2010. [Google Scholar]
- Mytton, O.T.; Townsend, N.; Rutter, H.; Foster, C. Green space and physical activity: An observational study using Health Survey for England data. Health Place 2012, 18, 1034–1041. [Google Scholar] [CrossRef]
- Tyrväinen, L.; Ojala, A.; Korpela, K.; Lanki, T.; Tsunetsugu, Y.; Kagawa, T. The influence of urban green environments on stress relief measures: A field experiment. J. Environ. Psychol. 2014, 38, 1–9. [Google Scholar] [CrossRef]
- Vanaken, G.-J.; Danckaerts, M. Impact of green space exposure on children’s and adolescents’ mental health: A systematic review. Int. J. Environ. Res. Public Health 2018, 15, 2668. [Google Scholar] [CrossRef]
- Seltenrich, N. Just what the doctor ordered: Using parks to improve children’s health. Environ. Health Perspect. 2015, 123, A254–A259. [Google Scholar] [CrossRef] [PubMed]
- Maas, J.; Verheij, R.A.; de Vries, S.; Spreeuwenberg, P.; Schellevis, F.G.; Groenewegen, P.P. Morbidity is related to a green living environment. J. Epidemiol. Community Health 2009, 63, 967–973. [Google Scholar] [CrossRef] [PubMed]
- Dadvand, P.; Bartoll, X.; Basagaña, X.; Dalmau-Bueno, A.; Martinez, D.; Ambros, A.; Cirach, M.; Triguero-Mas, M.; Gascon, M.; Borrell, C. Green spaces and general health: Roles of mental health status, social support, and physical activity. Environ. Int. 2016, 91, 161–167. [Google Scholar] [CrossRef] [PubMed]
- Vanos, J.K. Children’s health and vulnerability in outdoor microclimates: A comprehensive review. Environ. Int. 2015, 76, 1–15. [Google Scholar] [CrossRef]
- Sheffield, P.E.; Landrigan, P.J. Global climate change and children’s health: Threats and strategies for prevention. Environ. Health Perspect. 2011, 119, 291–298. [Google Scholar] [CrossRef]
- Yun, H.; Nam, I.; Kim, J.; Yang, J.; Lee, K.; Sohn, J. A field study of thermal comfort for kindergarten children in Korea: An assessment of existing models and preferences of children. Build. Environ. 2014, 75, 182–189. [Google Scholar] [CrossRef]
- Teli, D.; Jentsch, M.F.; James, P.A.B. Naturally ventilated classrooms: An assessment of existing comfort models for predicting the thermal sensation and preference of primary school children. Energy Build. 2012, 53, 166–182. [Google Scholar] [CrossRef]
- Nam, I.; Yang, J.; Lee, D.; Park, E.; Sohn, J.-R. A study on the thermal comfort and clothing insulation characteristics of preschool children in Korea. Build. Environ. 2015, 92, 724–733. [Google Scholar] [CrossRef]
- Cheng, W.; Brown, R.D. An energy budget model for estimating the thermal comfort of children. Int. J. Biometeorol. 2020, 64, 1355–1366. [Google Scholar] [CrossRef] [PubMed]
- Vanos, J.K.; Herdt, A.J.; Lochbaum, M.R. Effects of physical activity and shade on the heat balance and thermal perceptions of children in a playground microclimate. Build. Environ. 2017, 126, 119–131. [Google Scholar] [CrossRef]
- Lam, C.K.C.; Hang, J.; Zhang, D.; Wang, Q.; Ren, M.; Huang, C. Effects of short-term physiological and psychological adaptation on summer thermal comfort of outdoor exercising people in China. Build. Environ. 2021, 198, 107877. [Google Scholar] [CrossRef]
- Montazami, A.; Gaterell, M.; Nicol, F.; Lumley, M.; Thoua, C. Impact of social background and behaviour on children’s thermal comfort. Build. Environ. 2017, 122, 422–434. [Google Scholar] [CrossRef]
- Mahé, E.; Beauchet, A.; de Paula Corrêa, M.; Godin-Beekmann, S.; Haeffelin, M.; Bruant, S.; Fay-Chatelard, F.; Jégou, F.; Saiag, P.; Aegerter, P. Outdoor sports and risk of ultraviolet radiation-related skin lesions in children: Evaluation of risks and prevention. Br. J. Dermatol. 2011, 165, 360–367. [Google Scholar] [CrossRef]
- Kennedy, E.; Olsen, H.; Vanos, J.; Vecellio, D.J.; Desat, M.; Richters, K.; Rutledge, A.; Richardson, G.R.A. Reimagining spaces where children play: Developing guidance for thermally comfortable playgrounds in Canada. Can. J. Public Health. 2021, 112, 706–713. [Google Scholar] [CrossRef]
- Huang, B.; Hong, B.; Tian, Y.; Yuan, T.; Su, M. Outdoor thermal benchmarks and thermal safety for children: A study in China’s cold region. Sci. Total Environ. 2021, 787, 147603. [Google Scholar] [CrossRef]
- Ikäheimo, T.M. Occurrence and Prevention of Frostbites in Children. In Assisting Young Children Caught in Disasters: Multidisciplinary Perspectives and Interventions; Szente, J., Ed.; Springer International Publishing: Cham, Switzerland, 2018; pp. 131–141. [Google Scholar]
- McIntosh, S.E.; Opacic, M.; Freer, L.; Grissom, C.K.; Auerbach, P.S.; Rodway, G.W.; Cochran, A.; Giesbrecht, G.G.; McDevitt, M.; Imray, C.H. Wilderness Medical Society practice guidelines for the prevention and treatment of frostbite: 2014 update. Wilderness Environ. Med. 2014, 25, S43–S54. [Google Scholar] [CrossRef]
- Stocks, J.M.; Taylor, N.A.; Tipton, M.J.; Greenleaf, J.E. Human physiological responses to cold exposure. Aviat. Space Environ. Med. 2004, 75, 444–457. [Google Scholar]
- Szente, J. Assisting Young Children Caught in Disasters; Springer: Berlin/Heidelberg, Germany, 2018. [Google Scholar]
- Holmér, I.; Hassi, J.; Ikäheimo, T.M.; Jaakkola, J.J. Cold stress: Effects on performance and health. Pattys Toxicol. 2001, 1–26. [Google Scholar] [CrossRef]
- Kottek, M.; Grieser, J.; Beck, C.; Rudolf, B.; Rubel, F. World map of the Köppen-Geiger climate classification updated. Meteorol. Z. 2006, 15, 259–263. [Google Scholar] [CrossRef]
- Wang, Z.; Ji, Y.; Ren, J. Thermal adaptation in overheated residential buildings in severe cold area in China. Energy Build. 2017, 146, 322–332. [Google Scholar] [CrossRef]
- Jin, H.; Liu, S.; Kang, J. Gender differences in thermal comfort on pedestrian streets in cold and transitional seasons in severe cold regions in China. Build. Environ. 2020, 168, 106488. [Google Scholar] [CrossRef]
- Sun, C.-Y. A street thermal environment study in summer by the mobile transect technique. Theor. Appl. Climatol. 2011, 106, 433–442. [Google Scholar] [CrossRef]
- Landsberg, H.E. The Urban Climate; Academic Press: Cambridge, MA, USA, 1981. [Google Scholar]
- ASHRAE. ASHRAE Fundamentals Handbook American Society of Heating; Refrigerating and Air-Conditioning Engineers: Peachtree Corners, GA, USA, 2001. [Google Scholar]
- Lee, H.; Mayer, H.; Schindler, D.J.M.Z. Importance of 3-D radiant flux densities for outdoor human thermal comfort on clear-sky summer days in Freiburg, Southwest Germany. Meteorol. Z. 2014, 23, 315–330. [Google Scholar] [CrossRef]
- Johansson, E.; Thorsson, S.; Emmanuel, R.; Krüger, E. Instruments and methods in outdoor thermal comfort studies—The need for standardization. Urban Clim. 2014, 10, 346–366. [Google Scholar] [CrossRef]
- Oliveira, A.V.M.; Raimundo, A.M.; Gaspar, A.R.; Quintela, D.A. Globe temperature and its measurement: Requirements and limitations. Ann. Work. Expo. Health 2019, 63, 743–758. [Google Scholar] [CrossRef]
- UNICEF. Convention on the Rights of the Child; The United Nations: New York, NY, USA, 1989. [Google Scholar]
- Wang, J.; Wang, Z.; de Dear, R.; Luo, M.; Ghahramani, A.; Lin, B.J.E. The uncertainty of subjective thermal comfort measurement. Energy Build. 2018, 181, 38–49. [Google Scholar] [CrossRef]
- Parsons, K.C. The effects of gender, acclimation state, the opportunity to adjust clothing and physical disability on requirements for thermal comfort. Energy Build. 2002, 34, 593–599. [Google Scholar] [CrossRef]
- Amorim, P.R.d.S. Energy expenditure and physical activity patterns in children: Applicability of simultaneous methods. Ph.D. Thesis, Queensland University of Technology, Brisbane, Australia, 2007. [Google Scholar]
- Martinelli, L.; Lin, T.-P.; Matzarakis, A. Assessment of the influence of daily shadings pattern on human thermal comfort and attendance in Rome during summer period. Build. Environ. 2015, 92, 30–38. [Google Scholar] [CrossRef]
- Lin, C.-H.; Lin, T.-P.; Hwang, R.-L. Thermal Comfort for Urban Parks in Subtropics: Understanding Visitor’s Perceptions, Behavior and Attendance. Adv. Meteorol. 2013, 2013, 640473. [Google Scholar] [CrossRef]
- Shooshtarian, S.; Rajagopalan, P.; Wakefield, R. Effect of seasonal changes on usage patterns and behaviours in educational precinct in Melbourne. Urban Clim. 2018, 26, 133–148. [Google Scholar] [CrossRef]
- Havenith, G. Metabolic rate and clothing insulation data of children and adolescents during various school activities. Ergonomics 2007, 50, 1689–1701. [Google Scholar] [CrossRef] [PubMed]
- International Standard Origination. Ergonomics of the Thermal Environment: Estimation of Thermal Insulation and Water Vapour Resistance of a Clothing Ensemble; ISO: Geneva, Switzerland, 2007. [Google Scholar]
- International Standard Origination. Ergonomics of the Thermal Environment Analytical Determination and Interpretation of Thermal Comfort Using Calculation of the PMV and PPD Indices and Local Thermal Comfort Criteria; ISO: Geneva, Switzerland, 2005. [Google Scholar]
- Ainsworth, B.E.; Haskell, W.L.; Herrmann, S.D.; Meckes, N.; Bassett, D.R.; Tudor-Locke, C.; Greer, J.L.; Vezina, J.; Whitt-Glover, M.C.; Leon, A.S. 2011 Compendium of Physical Activities: A second update of codes and MET values. Med. Sci. Sports Exerc. 2011, 43, 1575–1581. [Google Scholar] [CrossRef]
- Jendritzky, G.; de Dear, R.; Havenith, G. UTCI—Why another thermal index? Int. J. Biometeorol. 2012, 56, 421–428. [Google Scholar] [CrossRef]
- Geng, Y.; Hong, B.; Du, M.; Yuan, T.; Wang, Y. Combined effects of visual-acoustic-thermal comfort in campus open spaces: A pilot study in China’s cold region. Build. Environ. 2021, 209, 108658. [Google Scholar] [CrossRef]
- He, X.; An, L.; Hong, B.; Huang, B.; Cui, X. Cross-cultural differences in thermal comfort in campus open spaces: A longitudinal field survey in China’s cold region. Build. Environ. 2020, 172, 106739. [Google Scholar] [CrossRef]
- Xu, M.; Hong, B.; Jiang, R.S.; An, L.; Zhang, T. Outdoor thermal comfort of shaded spaces in an urban park in the cold region of China. Build. Environ. 2019, 155, 408–420. [Google Scholar] [CrossRef]
- Xu, M.; Hong, B.; Mi, J.; Yan, S. Outdoor thermal comfort in an urban park during winter in cold regions of China. Sustain. Cities Soc. 2018, 43, 208–220. [Google Scholar] [CrossRef]
- An, L.; Hong, B.; Cui, X.; Geng, Y.; Ma, X. Outdoor thermal comfort during winter in China’s cold regions: A comparative study. Sci. Total Environ. 2021, 768, 144464. [Google Scholar] [CrossRef]
- Holmér, I. Evaluation of cold workplaces: An overview of standards for assessment of cold stress. Ind. Health 2009, 47, 228–234. [Google Scholar] [CrossRef] [PubMed]
- International Standard Origination. Ergonomics of the Thermal Environment: Determination and Interpretation of Cold Stress When Using Required Clothing Insulation (IREQ) and Local Cooling Effects; ISO: Geneva, Switzerland, 2007. [Google Scholar]
- ISO International Standard 15743; Ergonomics of the Thermal Environment-Cold Workplaces-Risk Assessment and Management. International Standard Organization: Geneva, Switzerland, 2008.
- International Standard Organization. Ergonomics of the Thermal Environment–Methods for the Assessment of Human Responses to Contact with Surfaces–Part 3: Cold Surfaces; ISO: Geneva, Switzerland, 2005. [Google Scholar]
- Liu, W.; Zhang, Y.; Deng, Q. The effects of urban microclimate on outdoor thermal sensation and neutral temperature in hot-summer and cold-winter climate. Energy Build. 2016, 128, 190–197. [Google Scholar] [CrossRef]
- Thermal Environmental Conditions for Human Occupancy. 2017. Available online: https://www.ashrae.org/file%20library/technical%20resources/standards%20and%20guidelines/standards%20addenda/55_2017_d_20200731.pdf (accessed on 10 April 2022).
- Bröde, P.; Fiala, D.; Błażejczyk, K.; Holmér, I.; Jendritzky, G.; Kampmann, B.; Tinz, B.; Havenith, G. Deriving the operational procedure for the Universal Thermal Climate Index (UTCI). Int. J. Biometeorol. 2012, 56, 481–494. [Google Scholar] [CrossRef]
- Mi, J.; Hong, B.; Zhang, T.; Huang, B.; Niu, J. Outdoor thermal benchmarks and their application to climate-responsive designs of residential open spaces in a cold region of China. Build. Environ. 2020, 169, 106592. [Google Scholar] [CrossRef]
- Cheung, P.K.; Jim, C.Y. Determination and application of outdoor thermal benchmarks. Build. Environ. 2017, 123, 333–350. [Google Scholar] [CrossRef]
- Slack, G.A. Thermal conductivity of ice. Phys. Rev. B 1980, 22, 3065. [Google Scholar] [CrossRef]
- Burse, R.L. Sex differences in human thermoregulatory response to heat and cold stress. Hum. Factors 1979, 21, 687–699. [Google Scholar] [CrossRef]
- Zhu, Z.; Liang, J.; Sun, C.; Han, Y.S. Summer outdoor thermal comfort in urban commercial pedestrian streets in severe cold regions of china. Sustainability 2020, 12, 1876. [Google Scholar] [CrossRef]
- Lai, D.; Guo, D.; Hou, Y.; Lin, C.; Chen, Q. Studies of outdoor thermal comfort in northern China. Build. Environ. 2014, 77, 110–118. [Google Scholar] [CrossRef]
- Yang, B.; Olofsson, T.; Nair, G.; Kabanshi, A. Outdoor thermal comfort under subarctic climate of north Sweden—A pilot study in Umea. Sustain. Cities Soc. 2017, 28, 387–397. [Google Scholar] [CrossRef]
- Lin, T.-P.; Tsai, K.-T.; Hwang, R.-L.; Matzarakis, A. Quantification of the effect of thermal indices and sky view factor on park attendance. Landscape Urban Plan. 2012, 107, 137–146. [Google Scholar] [CrossRef]
- Lin, T.-P.; Tsai, K.-T.; Liao, C.-C.; Huang, Y.-C. Effects of thermal comfort and adaptation on park attendance regarding different shading levels and activity types. Build. Environ. 2013, 59, 599–611. [Google Scholar] [CrossRef]
- Mahmoud, S.H.; Gan, T.Y. Long-term impact of rapid urbanization on urban climate and human thermal comfort in hot-arid environment. Build. Environ. 2018, 142, 83–100. [Google Scholar] [CrossRef]
- Ikaheimo, T.M.; Hassi, J. Frostbites in circumpolar areas. Glob. Health Action 2011, 4, 8456. [Google Scholar] [CrossRef]
- Cappaert, T.A.; Stone, J.A.; Castellani, J.W.; Krause, B.A.; Smith, D.; Stephens, B.A. National Athletic Trainers’ Association position statement: Environmental cold injuries. J. Athl. Train. 2008, 43, 640–658. [Google Scholar] [CrossRef]
- Geng, Q.; Holmer, I.; Hartog, D.E.; Havenith, G.; Jay, O.; Malchaire, J.; Piette, A.; Rintamäki, H.; Rissanen, S. Temperature limit values for touching cold surfaces with the fingertip. Ann. Occup. Hyg. 2006, 50, 851–862. [Google Scholar]
- Bar-Or, O. Children’s Responses to Exercise in Cold Climates: Health Implications. Sports Sci. Exch. 1994, 7, 4. [Google Scholar]
- Hassi, J.; Mäkinen, T.M.; Rintamäki, H. Prediction and Prevention of Frostbite; University of Oulu: Oulu, Finland, 2005. [Google Scholar]
- Rintamäki, H. Predisposing factors and prevention of frostbite. Int. J. Circumpol. Health 2000, 59, 114–121. [Google Scholar]
- Lehmuskallio, E.; Lindholm, H.; Koskenvuo, K.; Sarna, S.; Friberg, O.; Viljanen, A. Frostbite of the face and ears: Epidemiological study of risk factors in Finnish conscripts. Br. Med. J. 1995, 311, 1661–1663. [Google Scholar] [CrossRef]


| Instrumentation | Parameter | Range | Accuracy | Picture |
|---|---|---|---|---|
| HOBO onset U23-001 | Ta | −40–70 °C | ±0.21 °C | 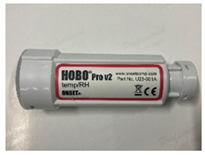 |
| RH | 0–100% | ±2.5% | ||
| Kestrel 5500 | V | 0–40 m/s | 0.1 m/s |  |
| Delta HD 32.2 | Tg | −10–100 °C | ±0.1 °C | 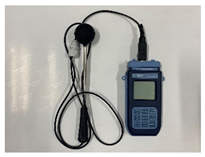 |
| Pyranometer TBQ-2 | G | 0–2000W/m2 | ≤±2% | 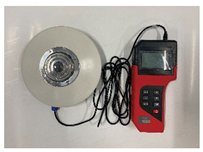 |
| Physical Activities Levels | Activities | Activity Coding | Met Units | Metabolic Rate Corrections (W/m2) |
|---|---|---|---|---|
| Light intensity | Sitting | 07021 | 1.3 | 63.4 |
| <3 Met | Standing | 09050 | 1.8 | 87.8 |
| Walking, very slow | 17151 | 2.0 | 97.6 | |
| Dog sledding, passenger | 19006 | 2.5 | 122.0 | |
| Moderate intensity | Table tennis | 15660 | 4.0 | 195.2 |
| 3–6 Met | Skating, ice, 4 m/s or less | 19020 | 5.5 | 268.4 |
| Children’s games | 15135 | 5.8 | 283.0 | |
| Vigorous intensity | Running | 12029 | 6.0 | 292.8 |
| >6 Met | Skating | 19030 | 7.0 | 341.6 |
| Male | Female | All | ||
|---|---|---|---|---|
| Number | 333 | 274 | 607 | |
| Age (years) | Min | 3 | 3 | 3 |
| Max | 16 | 18 | 18 | |
| Mean ± SD | 9.7 ± 2.6 | 8.9 ± 2.6 | 9.4 ± 2.7 | |
| Height (cm) | Min | 90 | 80 | 80 |
| Max | 185 | 170 | 185 | |
| Mean ± SD | 143.3 ± 16.6 | 137.5 ± 15.9 | 140.7 ± 16.5 | |
| Weight (kg) | Min | 15 | 11 | 11 |
| Max | 90 | 80 | 90 | |
| Mean ± SD | 39.0 ± 13.5 | 32.5 ± 10.9 | 36.1 ± 12.8 | |
| Icl (clo) | Min | 1.09 | 1.17 | 1.09 |
| Max | 2.82 | 2.71 | 2.82 | |
| Mean ± SD | 1.87 ± 0.25 | 1.98 ± 0.23 | 1.92 ± 0.25 | |
| Metabolic rate (W/m2 ) | Min | 48.8 | 48.8 | 48.8 |
| Max | 292.8 | 268.4 | 292.8 | |
| Mean ± SD | 134.8 ± 49.8 | 153.7 ± 55.9 | 143.3 ± 53.4 |
| SP | OS | SS | SR | ||
|---|---|---|---|---|---|
| Ta (°C) | Min | −22.5 | −22.6 | −20.9 | −21.2 |
| Max | −11.3 | −11.8 | −12.4 | −12.5 | |
| Mean ± SD | −16.8 ± 3.2 | −16.9 ± 3.1 | −16.8 ± 1.6 | −16.7 ± 1.7 | |
| RH (%) | Min | 13.4 | 18.2 | 8.6 | 13.9 |
| Max | 66.4 | 66.2 | 63.1 | 63.3 | |
| Mean ± SD | 54.2 ± 7.7 | 54.8 ± 6.5 | 55.6 ± 7.1 | 53.9 ± 7.4 | |
| V(m/s) | Min | 0 | 0 | 0 | 0 |
| Max | 3.4 | 4.4 | 4 | 4.4 | |
| Mean ± SD | 0.8 ± 0.6 | 1.2 ± 0.7 | 0.9 ± 0.6 | 0.9 ± 0.8 | |
| G (W/m2) | Min | 17 | 26 | 31 | 35 |
| Max | 344 | 449 | 415 | 468 | |
| Mean ± SD | 146.5 ± 102.7 | 207.4 ± 116 | 155.3 ± 97.6 | 186.6 ± 127.7 | |
| Tg (°C) | Min | −22.2 | −22.3 | −20.9 | −21.1 |
| Max | 1.2 | −3.4 | −7.7 | −1.3 | |
| Mean ± SD | −12.5 ± 5.5 | −12.2 ± 4.7 | −13.2 ± 3.1 | −11.7 ± 5.2 | |
| Tmrt (°C) | Min | −29.6 | −27.4 | −35.2 | −43.9 |
| Max | 60.7 | 59.9 | 46.5 | 66.9 | |
| Mean ± SD | 2 ± 19.5 | 10.1 ± 18.2 | 2.1 ± 14.4 | 4.6 ± 22.3 |
| Gender | Ta | RH | V | G | Tg | Tmrt | |
|---|---|---|---|---|---|---|---|
| TSV | Male | 0.020 | 0.081 | 0.083 | 0.272 ** | 0.201 ** | 0.238 ** |
| Female | 0.081 | −0.011 | −0.027 | 0.123 * | 0.149 * | 0.138 * | |
| All | 0.053 | 0.044 | 0.030 | 0.200 ** | 0.178 ** | 0.190 ** |
| Thermal Sensation | UTCI (°C) | Modified UTCI (°C) (Female) | Modified UTCI (°C) (Male) | Modified UTCI (°C) (All) |
|---|---|---|---|---|
| Extreme cold stress | <−40 | <−20.8 | <−19.8 | <−20.5 |
| Very strong cold stress | −40 to −27 | −20.8 to −17.5 | −19.8 to −16.6 | −20.5 to −17.1 |
| Strong cold stress | −27 to −13 | −17.5 to −13.4 | −16.6 to −12.5 | −17.1 to −12.8 |
| Moderate cold stress | −13 to 0 | −13.4 to −6.6 | −12.5 to −5.6 | −12.8 to −6.2 |
| Slight cold stress | 0 to 9 | −6.6 to 3.5 | −5.6 to 2.8 | −6.2 to 7.0 |
| No thermal stress | 9 to 26 | - | - | - |
| PAs Levels | Icl | IREQmin | IREQneutral | ICLmin | ICLneutral | DLEmin | DLEneutral |
|---|---|---|---|---|---|---|---|
| Light | 1.88 | 3.2 | 3.5 | 3.5 | 3.9 | 0.7 | 0.6 |
| Moderate | 1.95 | 1.5 | 1.8 | 1.7 | 2.0 | >8 | >8 |
| Vigorous | 1.44 | 0.6 | 0.9 | 0.7 | 1.0 | >8 | >8 |
| ALL | 1.90 | 1.9 | 2.2 | 2.1 | 2.5 | 3.2 | 1.3 |
| Materials | Thermal Conductivity | In the Shade (°C) | In the Sun (°C) | |||||
|---|---|---|---|---|---|---|---|---|
| W/(m·K) | max | ave | min | max | ave | min | ||
| Brick | Brick | 0.63 | −15.9 | −21.3 ± 3.1 | −27.2 | −12.6 | −17.7 ± 2.5 | −24.4 |
| Stone brick | Stone | 0.92 | −17.1 | −22.5 ± 2.6 | −25.9 | −14.1 | −21.1 ± 2.9 | −28.2 |
| Ice | Ice (−15 °C) | 2.4 [71] | −13.4 | −18.3 ± 3.6 | −25.3 | |||
| Chair | Wood | 0.18 | −17.9 | −20.2 ± 1.0 | −22 | −7.4 | −11.4 ± 1.3 | −16.8 |
| Plastic slide | Polyamides | 0.21 | −16.4 | −20.3 ± 2.1 | −25.1 | −10.7 | −15.7 ± 3.6 | −21.8 |
| Slide handrail | Steel | 45.3 | −16.2 | −19.5 ± 1.8 | −23.1 | −14.3 | −17.8 ± 2.5 | −21.7 |
| Contact Period | Cold Risk | Aluminium | Steel | Stone | Nylon | Wood | |
|---|---|---|---|---|---|---|---|
| Finger touching | 10 s | Pain | >5 | >5 | 4 | −6 | −10 |
| Numbness | 3 | −1 | −15 | −40 | ≤−40 | ||
| Frostbite | −7 | −13 | −18 | - | - | ||
| Hand gripping | 100 s | Pain | −4 | −7 | −17 | −33 | ≤−40 |
| City, Country | Climate Zone | Seasons | Population | NUTCI (°C) | Analysis Methods |
|---|---|---|---|---|---|
| Harbin, China (this study) | Dwa | Winter | Children | 6.7 | LR, MTSV vs. UTCI bin (1 °C) |
| Xi’an, China [30] | Cwa/BSk | Winter | Children | 12.2 | LR, MTSV vs. UTCI bin (1 °C) |
| Harbin, China [73] | Dwa | Summer | Mixed ages | 19.3 | LR, MTSV vs. UTCI bin (1 °C) |
| Xi’an, China [58] | BSk/Cwa | Winter | Young adult | 12.0 | LR, MTSV vs. UTCI bin (1 °C) |
| Tianjin, China [74] | Dwa/BSk | All | Mixed ages | 17.5 | LR, MTSV vs. UTCI bin (1 °C) |
| Umeå, Sweden [75] | Dfc | Summer | Mixed ages | 14.4 | LR, MTSV vs. UTCI bin (1 °C) |
| City, Country | Climate Zone | Seasons | Population | NUTCIR (°C) | Analysis Methods |
|---|---|---|---|---|---|
| Harbin, China (This study) | Dwa | Winter | Children | 0.6–14.1 | LR, MTSV vs. UTCI bin (1 °C), TSV = ±0.5 |
| Xi’an, China [30] | BSk/Cwa | Winter | Children | 7.7–16.6 | LR, MTSV vs. UTCI bin (1 °C), TSV = ±0.5 |
| Harbin, China [73] | Dwa | Summer | Mixed ages | 15.6–23.0 | LR, MTSV vs. UTCI bin (1 °C), TSV = ±0.5 |
| Xi’an, China [58] | BSk/Cwa | Winter | Young adult | 9.1–14.9 | LR, MTSV vs. UTCI bin (1 °C), TSV = ±0.5 |
| Tianjin, China [74] | Dwa/BSk | All | Mixed ages | 13.6–21.3 | LR, MTSV vs. UTCI bin (1 °C), TSV = ±0.5 |
| Umeå, Sweden [75] | Dfc | Summer | Mixed ages | 11.5–17.2 | LR, MTSV vs. UTCI bin (1 °C), TSV = ±0.5 |
| Cold Risk Analysis | Prevention Strategies |
|---|---|
| Children with light-intensity activities had Icl less than ICLmin (1.88 clo < 3.9 clo), DLEmin = 0.7 h. The risk of hypothermia increased with gradual exposure. |
|
| The Icl of children with vigorous-intensity activities was greater than ICLneutral (1.44 clo > 1.0 clo), which caused sweating and accelerated the cooling rate of the body. |
|
| Overall, the children’s Icl was less than ICLmin, DLEmin = 3.2 h. |
|
| With tWC less than −24 °C before 10:00 in space OS, children were exposed to Level 2 cooling risk with the risk of skin frostbite. |
|
| The tWC of space SP, SS, SR was always greater than −24 °C and less than −10 °C; so, it was always at the risk of Level 1 cooling, and the skin was exposed to uncomfortable cold. |
|
| The average surface temperature of wooden seats in sunlight (−11.4 °C) was 1.4 °C lower than the pain threshold (−10 °C) for fingers touching wood surfaces. Touching wooden seats and plastic slides might cause pain. |
|
| The average temperature of the stone brick surface under sunlight (−21.1 °C) was 6.1 °C lower than the numbness threshold (−15 °C) of the fingers touching the stone surface, and 3.1 °C lower than the frostbite threshold (−18 °C). Frostbite might occur when fingers touch stone bricks, ice surfaces, and slide handrails. |
|
Publisher’s Note: MDPI stays neutral with regard to jurisdictional claims in published maps and institutional affiliations. |
© 2022 by the authors. Licensee MDPI, Basel, Switzerland. This article is an open access article distributed under the terms and conditions of the Creative Commons Attribution (CC BY) license (https://creativecommons.org/licenses/by/4.0/).
Share and Cite
Shao, L.; He, X.; Tang, Y.; Wu, S. Outdoor Cold Stress and Cold Risk for Children during Winter: A Study in China’s Severe Cold Regions. Buildings 2022, 12, 936. https://doi.org/10.3390/buildings12070936
Shao L, He X, Tang Y, Wu S. Outdoor Cold Stress and Cold Risk for Children during Winter: A Study in China’s Severe Cold Regions. Buildings. 2022; 12(7):936. https://doi.org/10.3390/buildings12070936
Chicago/Turabian StyleShao, Long, Xiaoyun He, Yuexing Tang, and Shenglong Wu. 2022. "Outdoor Cold Stress and Cold Risk for Children during Winter: A Study in China’s Severe Cold Regions" Buildings 12, no. 7: 936. https://doi.org/10.3390/buildings12070936
APA StyleShao, L., He, X., Tang, Y., & Wu, S. (2022). Outdoor Cold Stress and Cold Risk for Children during Winter: A Study in China’s Severe Cold Regions. Buildings, 12(7), 936. https://doi.org/10.3390/buildings12070936