Article

Thermal Environment and Thermal Comfort in University Classrooms during the Heating Season

1
Jangho Architecture College, Northeastern University, Shenyang 110819, China
2
School of Automation Science and Electrical Engineering, Beihang University, Beijing 100191, China
*
Author to whom correspondence should be addressed.
Buildings 2022, 12(7), 912; https://doi.org/10.3390/buildings12070912
Submission received: 10 May 2022 / Revised: 23 June 2022 / Accepted: 27 June 2022 / Published: 28 June 2022
(This article belongs to the Special Issue Indoor Environmental Quality and Occupant Comfort)

Abstract

:
In recent years, there has been increasing concern about the effects of indoor thermal environments on human physical and mental health. This paper aimed to study the current status of the thermal environment and thermal comfort in the classrooms of Northeastern University during the heating season. The indoor thermal environment was analyzed with the use of field measurements, a subjective questionnaire, regression statistics, and the entropy weight method. The results show that personnel population density is an important factor affecting the temperature and relative humidity variations in classrooms. The results also show that the temperature and relative humidity in a lecture state are respectively 4.2 °C and 11.4% higher than those in an idle state. In addition, in university classrooms in Shenyang, the actual thermal neutral temperature is 2.5 °C lower than the predicted value of the Predicted Mean Vote. It was found that increasing indoor relative humidity can effectively improve the overall thermal comfort of subjects. Furthermore, the temperature preference of women was higher than that of men. Therefore, when setting the initial heating temperature, the personnel population density and sufficient indoor relative humidity have been identified as the key factors for improving the thermal environment of the classroom.

1. Introduction

1.1. Overview

As an important part of university space, the classroom is the main place for students’ daily study, and its indoor thermal environment directly affects students’ comfort, physical and mental health, and learning efficiency.
The traditional way of creating a comfortable environment is by controlling the indoor environmental parameters within a specified range according to the relevant standards. However, the people’s comforts are so different that these parameters cannot effectively meet individual states, feelings, and preferences. Additionally, individual comfort claims are not conveyed and feedback is not given during the creation of the thermal environment [1]. Therefore, it is necessary to propose reasonable and effective solutions in a targeted manner [2]. The present study provides a reasonable basis for the further improvement of indoor thermal comfort by summarizing and analyzing the results concerning thermal satisfaction through a subjective survey of student subjects.

1.2. Literature Review

The Predicted Mean Vote (PMV) metric proposed by Fanger has been commonly used in the field of thermal comfort to predict human thermal sensation in a steady-state environment [3]. However, deviations between the PMV and the Actual Mean Vote (AMV) of thermal sensation have been found in actual extensive field survey results [4]. To address these deviations, researchers have further revised and developed thermal adaptation models. For example, the ASHRAE Standard 55-2017 [5] contains the thermal adaptation model established by de Dear [6]. In 2012, China released the Standard GB/T 50785-2012 [7], which introduced a thermal adaptation model for naturally ventilated buildings based on Chinese field survey data. Compared with the steady-state model, the adaptive thermal comfort model can more accurately reflect the thermal sensation and thermal comfort of the human body in an actual building environment. Furthermore, the adaptive thermal comfort model can improve the internal thermal environment of buildings in a targeted way in order to reduce building energy consumption.
To date, the thermal comfort environment of college classrooms in different regions has been extensively studied [8,9,10]. Note that most of these studies have focused on summer or hot-summer and cold-winter regions, while the thermal comfort in college classrooms during the heating season in severe cold regions has been less studied [11,12,13,14,15,16,17]. Jung et al. [18] showed that students prefer a slightly cool indoor environment. Cao et al. [19] showed that in the heating season, the PMV of students in the classroom is lower than the actual thermal feeling. However, it should be noted that there are limited studies on the thermal comfort environment of classrooms as compared with other environments [10]. Kuru et al. [4] found that the thermal comfort of the indoor environment has a great impact on the health and well-being of users. Cognati et al. found that during the heating season in Italy, students prefer a warm environment in university classrooms [20]. Some scholars have also studied the influencing factor of gender. They found that females prefer to feel warmer and accept higher temperatures than males [2]. Wang [21] found that since females wear heavier clothes indoor than males, the neutral temperature of females remains higher than that of males. The results of some studies are listed in Table 1 [14,22,23,24,25,26,27,28]. Note that China has a vast territory, and there are great differences in the average temperature of the coldest month in winter within the same climate area. According to the thermal zoning in China, Shenyang belongs to severe cold zone C. Moreover, the standard temperature set for heating in Shenyang is different. Therefore, the present paper studies the indoor thermal environment of Shenyang during the heating season. To date, there is still a lack of indoor thermal environment standards for educational buildings with high indoor occupant density, which makes it difficult to meet the thermal environment requirements of the classroom by only relying on the existing norms. Hence, the objective of the present study is to find out how to improve the thermal comfort in the classroom so as to make students have a more comfortable learning environment.

2. Methods

2.1. Location and Climate

Shenyang is located in the northeast of China, which has a large temperature difference throughout the year and where winter is cold and dry. According to the Chinese standard GB 50178-1993 [29], Shenyang is a typical city in a severe cold climate zone. Figure 1 shows the temperature map of Shenyang in winter. It is also worth mentioning that the heating time is from November of the current year to March of the following year.
The present study was conducted in the middle of the heating season, in November and December 2021, when the indoor thermal environment parameters were more stable and less affected by the outdoor environment. Note that teaching activities were from 8:30–20:30. Thus, the test period selected was in the middle, from 14:00 to 15:00, because the morning teaching activities could make the thermal environment in the classroom reach a stable state. Therefore, the afternoon measurement was more representative. The selected building was built in 2014. Additionally, the selected classroom was facing north in order to avoid the effects of direct sunlight. The classroom had an octagonal shape and 150 seats, with a floor height of 3.8 m and an area of 128 m2. As shown in Figure 2, the classroom was equipped with heating radiators but without ventilation systems. Table 2 summarizes the thermal properties of the building envelopes. The thermal properties of the building envelopes met the requirements of the Design Standard for Energy Efficiency in public buildings [30].

2.2. Method

It should be noted that in the present study, both the objective evaluation and the subjective evaluation of the environment as well as the adaptability of people to their surroundings are reflected.

2.2.1. Testing Methods of Environmental Parameters

The testing parameters of this study included indoor air temperature, relative humidity, air velocity, and black-bulb temperature. The field test process was carried out using time, area, and situation to obtain reliable and relevant data.
Note that the selected classroom was analyzed in November and December 2021, each with a different number of users but with the same indoor heating temperature and measurement conditions that take into account both idle and full conditions. According to the standard “Ergonomics of Thermal Environment Physical Measurements” (GB/T 40233-2021) [31], the indoor test instruments were placed in three different areas in the front, middle, and back. In addition, four measurement points were arranged horizontally in each area. The final results were averaged and located, as shown Figure 4.
According to the Indoor Air Quality Standard (GB/T 18883-2002) [32], the height of the sampling point should be 1.1 m, which, in principle, is the same as the height of the human respiratory belt. The indoor thermal environment parameters were measured at the same time as the completion of the subjective questionnaires by the subjects in order to ensure that the measured indoor environmental parameters truly reflected the thermal environment conditions of the area at the time. The scheduled lecture time was 60 min with a 10 min break. Additionally, the environmental parameters were recorded by the investigators at 20 min intervals during the lectures. The 20 min interval was selected because the pre-experiment showed that the environmental parameters change significantly within 20 min during the classroom monitoring. Furthermore, the moment after the end of class was taken as an important time node. Thus, a data recording point at 14:50 was added. It is also worth mentioning that the test apparatus in the classroom was set 15 min before the class to ensure the stability of the measured data during the class period. Figure 5 shows pictures of the monitoring equipment used for measuring the indoor environmental parameters. In addition, Table 3 summarizes the specifications of the sensor probes used in this study.

2.2.2. Subjective Questionnaire

An electronic questionnaire was used in the field, and the subjects were 22–24-year-old students in good physical condition, who had fully adapted to the climate of Shenyang and had been informed of the survey in advance. In order to avoid the influence of the outdoor environment on the subjects’ thermal sensation, the questionnaires were administered and filled in only after the subjects had been indoors for more than 20 min. The ASHRAE scale [33] was used in the subjective questionnaire, allowing the students to vote on thermal sensation, thermal comfort, temperature, and relative humidity expectations. Table 4 shows the voting scale for the subjective questionnaire, which can assess students’ preferences. Table 4 also shows the basic information about the subjects such as gender, age, and clothing. A total of 135 questionnaires were distributed, and 133 questionnaires were completed and collected, thus facilitating a subjective evaluation of the thermal and humid environment in the classroom based on the content of the questionnaire.

2.2.3. Entropy Weighting Method

The thermal environment in the classroom is evaluated from two perspectives: in-door temperature and relative humidity using the “entropy weighting method”. The steps for calculating the weights by the “entropy weighting method” are described below.
First, the temperature and relative humidity are standardized as follows:
y ij = x ij m i n x ij m a x ( x ij ) - min ( x ij ) , 0     y ij     1 ,   j = 1 , 2
The standardized matrix of the score is
Y = {yij}m×n
Then, the information entropy (Hj) of the two indexes is calculated as follows:
H j = 1 ln n j   = 1 n P ij ln   ( Pij )
where Pij is the proportion of each item in the total, i is the index, and n is the number of records.
The relationship between information utility value (Ej) and information entropy value (Hj) is expressed as
Ej = 1 − Hj
Note that the information utility value is related to the weight of the two indicators as follows:
Wj = Ej j = 1 n Ej
where W1 and W2 are the temperature and relative humidity, respectively.

3. Results

First, as mentioned before, Shenyang is located in cold region C. Additionally, the selected project was an indoor site and the actual measurement time was from 1 November 2021, the heating start time, to 19 December 2021. After 20 December, the school was closed for examination week, and in January 2022, the school was closed for the winter vacation. Thus, the site environment at the selected time interval represented the heating season for the college classrooms. Second, a comparison of the outdoor temperatures taken during the period of 1 November 2019–19 December 2021 shows that the average outdoor temperature at 14:00–15:00 during this interval was 4.7 °C, and the average outdoor relative humidity was 65.2%, as shown in Figure 6 and Figure 7.
Furthermore, some researchers have also used a three-day time volume for refinement analysis [34,35]. Thus, 7–9 December 2021 was selected for the specific analysis of the indoor environmental parameters because the outdoor temperature and relative humidity for these three days were closer to the average outdoor temperature and relative humidity in previous years and were more stable, with a standard deviation of 0.5 °C and 4.5%, as shown in Figure 8 and Figure 9 and the box is the value of 7–9.
Finally, during the three-day measurement period, the indoor environment of the empty field classroom did not change much, and the trend was relatively consistent. The standard deviation was 1.15 °C for indoor temperature and 0.4% for relative humidity, as shown in Figure 10 and Figure 11.
Note that the data were averaged and analyzed. The indoor environmental parameters in the full-field condition changed in a similar trend, with a standard deviation of 1 °C for indoor temperature and 2.7% for relative humidity, as shown in Figure 12 and Figure 13. Thus, the selected day was the closest to the average, and the distributed questionnaire was selected for a detailed partitioning study (Table 5).
Table 6 shows the different environmental parameters in the classroom under idle and lecture conditions, according to the requirements of the international standard ISO 7726-1998 “Ergonomics of the Thermal Environment-Instruments for Measuring Physical Quantities” [36]. Note that for those subjects engaging in near-sedentary conditions (metabolic rate between 1.0 and 1.3 MET), the operating temperature (Top) can be calculated by using an approximation of the average indoor air velocity and the average radiation temperature. The questionnaire statistics show that the average thermal resistance of students’ indoor clothing in winter is 0.24/m2·K·W−1.

3.1. Analysis of Measurement Indicators (Heating Season and Idle State)

The temperature and relative humidity in the classroom were measured in the idle state. At this stage, the classroom is not used as a place for lecturing but only for students’ independent study. Thus, the occupancy rate was below 5%, and the doors and windows were closed.
The temperature in the front, middle, and back of the classroom during the idle state remained relatively stable (Figure 14), with an average temperature of 19.8, 20.8, and 21.7 °C, respectively. Thus, all three areas meet the Chinese standard (GB50736-2012) [37], which stipulated the standard of 18–24 °C. Note that the back area is higher than the other two areas due to its relative position, and that the air with higher temperature is less dense and moves to the upper part of the space more easily. Thus, the temperature in the back is higher than in the other two areas.
Figure 15 shows that the average relative humidity in the three areas within 60 min was 19.8, 19.5, and 19.3%, respectively. As shown in the figure, the back area has the lowest value because the relative humidity is the ratio of the current humidity to the saturation humidity. Thus, when the temperature rises, the ability of the air to carry moisture increases, and the saturation humidity rises accordingly; meanwhile, the relative humidity falls. Furthermore, during the test period, the difference between the average relative humidity of the three areas is small, not more than 1%, and none of them meet the Chinese standard (GB/T 18883-2002) [32]. In addition, the control range of indoor phase humidity during the winter heating period is 30–60%.

3.2. Analysis of Measurement Indicators (Heating Season and Lecturing)

During the lectures, the classroom occupancy rate was over 90%, the volume per person was close to 3.5 m3/person, the doors and windows were closed, and the classroom door was only opened for 10 min during the class period.
Figure 16 shows that the overall temperature in the classroom during the lectures gradually increases over time. Only a small drop occurred between classes, with the largest drop in the front part. The influencing factors are the break time between classes, the opening of the classroom door, and cooling due to the small-scale ventilation caused by people entering and leaving the classroom. The average temperatures in the classrooms were 24.7 °C (front), 24.8 °C (middle), and 25.4 °C (back) during lectures. The temperature in the back of the classroom was the highest because the test site was a step classroom, which allowed for the heat dissipation of the human body to cause hot air to form and flow up. Moreover, the temperature in the upper space of the classroom was slightly higher than that in the lower space, while the back area had the highest relative position. Therefore, the temperature in the back space was relatively high. Note that all three areas exceeded the indoor temperature control range of 18–24 °C during the winter heating period, as stipulated in the Chinese standard (GB50736-2012) [37]. This shows that the heat released from the crowd in the classroom during the class period is not easily dissipated because of the large number of people. In addition, the design value of the heating space temperature in winter does not consider the influence of the heat generated by the activities of a large number of people during operation. Consequently, the indoor temperature exceeded the code value. Note that people engaging in mental work generally prefer a slightly cooler environment [38]. Thus, reducing the heat in the classroom during lessons can effectively improve human comfort and create a more conducive learning environment. Furthermore, this results in energy savings.
Figure 17 shows that the overall relative humidity in the classroom increased significantly by 11.4% as compared to the idle state. This indicates that the dispersed humidity caused by a large number of people can lead to a more significant increase in the relative humidity of the room. However, the overall relative humidity tended to decrease over time in the classroom, indicating that the increase in temperature increases the rate of saturated water vapor much faster than the increase in absolute humidity, which in turn contributes to the decrease in relative humidity. The average relative humidity for the front area of the classroom was 28.9%, which is below the control range of 30–60% for indoor phase humidity during the heating period in winter, as stipulated in the Indoor Air Quality Standard (GB/T 18883-2002) [32]. The average relative humidity of the middle and back areas were 30.5 and 32.7%, respectively. Note that the water vapor is in the upper part of the space due to its lighter density as compared to the air density. This causes the relative humidity to be the largest in the back area, where the class seating position is relatively high. Although the temperature in the back area of the class is also the highest under this condition, the effect of temperature on the overall regional relative humidity is much less than the effect of water vapor.
The relative humidity in each zone of the classroom basically meets the standard requirements during lectures, but the values are low. Thus, self-regulating, i.e., humidifying the room can be a solution based on the subjective feelings of the students.
Figure 18 shows that all zones within the classroom during lectures do not simultaneously meet the two thermal environment parameters set by the specification. More specifically, nine points meet the standard for relative humidity but exceed the specification for air temperature. This implies that a relative reduction of heat within the classroom can effectively improve the thermal environment, meet the requirements of the standard, and result in energy savings and emission reduction.

3.3. Summary

In the horizontal direction of the field measurements, the temperature difference of each point was less than 0.1 °C, and the relative humidity difference was less than 0.2%. Additionally, there was no obvious difference, mainly because the test site was completed in 2015, the main body of the building and the insulation properties of the doors and windows were good, and the seating positions were far from the classroom boundary. Thus, the cold radiation generated by the doors and windows had less impact on the subjects. Based on this situation, the on-site measurements and analysis mainly used the different height areas in the front, middle, and back as the dependent variables.
The temperature and relative humidity distributions during the idle state remained relatively constant and even, with only minor fluctuations, possibly related to the infiltration of cold air from the doors and windows and the low-temperature radiation from the three side windows. The temperature had a tendency to rise in the classroom and gradually reached a peak, indicating that the population density of people is an effective factor in the room’s temperature. Likewise, individual heat dissipation, when reaching a certain value, affects the temperature change in the whole space. In terms of relative humidity, the comparison between the idle and lecture states shows that the factor more significantly affecting the relative humidity in the room is the body’s own dissipation of moisture. At the end of the class, the temperature tended to drop, and the relative humidity slowly rebounded. This implies that opening the doors does not cause a significant convection of hot and cold air, but it has a significant effect on the reduction of excessive indoor temperatures and the increase in the amount of fresh air in the room to a certain extent.

4. Discussion

Human thermal sensation is influenced by indoor air temperature, average radiant temperature, air flow rate, air humidity, thermal resistance of clothing, and the different metabolic rates of the subjects. During the test period, the classroom doors and windows were tightly closed, and the threshold of the human perception of wind speed was 0.20 m/s (GB/T 28591-2012) [39]. The measured wind speed (≤0.05 m/s) was much smaller than the threshold of human perception of wind speed (Table 5) and also comply with national standards [37]. Thus, the effect of indoor wind speed on the evaluation of the subject’s thermal sensation could be ignored. In addition, the average radiation temperature and the thermal resistance of clothing were basically at constant values in this test. Therefore, this analysis focused on indoor air temperature and indoor relative humidity. A subjective survey was conducted in the classroom on the classroom’s quality of temperature and humidity. Note that the sitting rate in the classroom was over 90%, and the per capita volume was nearly 3.5 m3 per person. The results show that 85% of the classrooms had a sitting rate of over 50% during the class, which means that in most classroom situations, the classroom was not empty. Thus, the impact of the people population density in the classroom on the environment and the impact of indoor density on the environment are representative.

4.1. TSV and TCV

Figure 19 shows that the TCV value corresponds to each TSV voting value. The frequency of voting values between warm and hot was 49.6%, with nearly half of the subjects considering the temperature inside the classroom to be high during the test period. As the test was in the middle of the heating period, the subjects had gradually adapted to the colder climate outside and showed some rejection of the higher heating temperature inside the room under standard heating conditions. At the same time, the subjects felt most comfortable when the thermal sensory poll was thermoneutral. The thermal discomfort of the subjects corresponding to the cold and warm ends of the TSV also reached the peak, indicating that there is a very high correlation between thermal sensation and thermal comfort.

4.2. Comparison of Mean Thermal Sensation Vote (MTSV) and PMV

Some scholars [14] have proposed a linear regression equation for the average indoor thermal sensory vote in winter in severe cold regions versus air temperature; this equation can be expressed as follows:
VMTSV = 0.2402ta − 5.431 R2 = 0.86,
where VMTSV is the average thermal sensation, and ta (°C) is the room temperature.
The significance levels of regression of Equation (6) were calculated as 0.005 by the F-test. This value implies that the linear regression equation is appropriate.
Note that this regression equation does not take into account the effect of human heat dissipation on the room temperature when the people population density is high. Accordingly, this equation is further modified in the present paper.
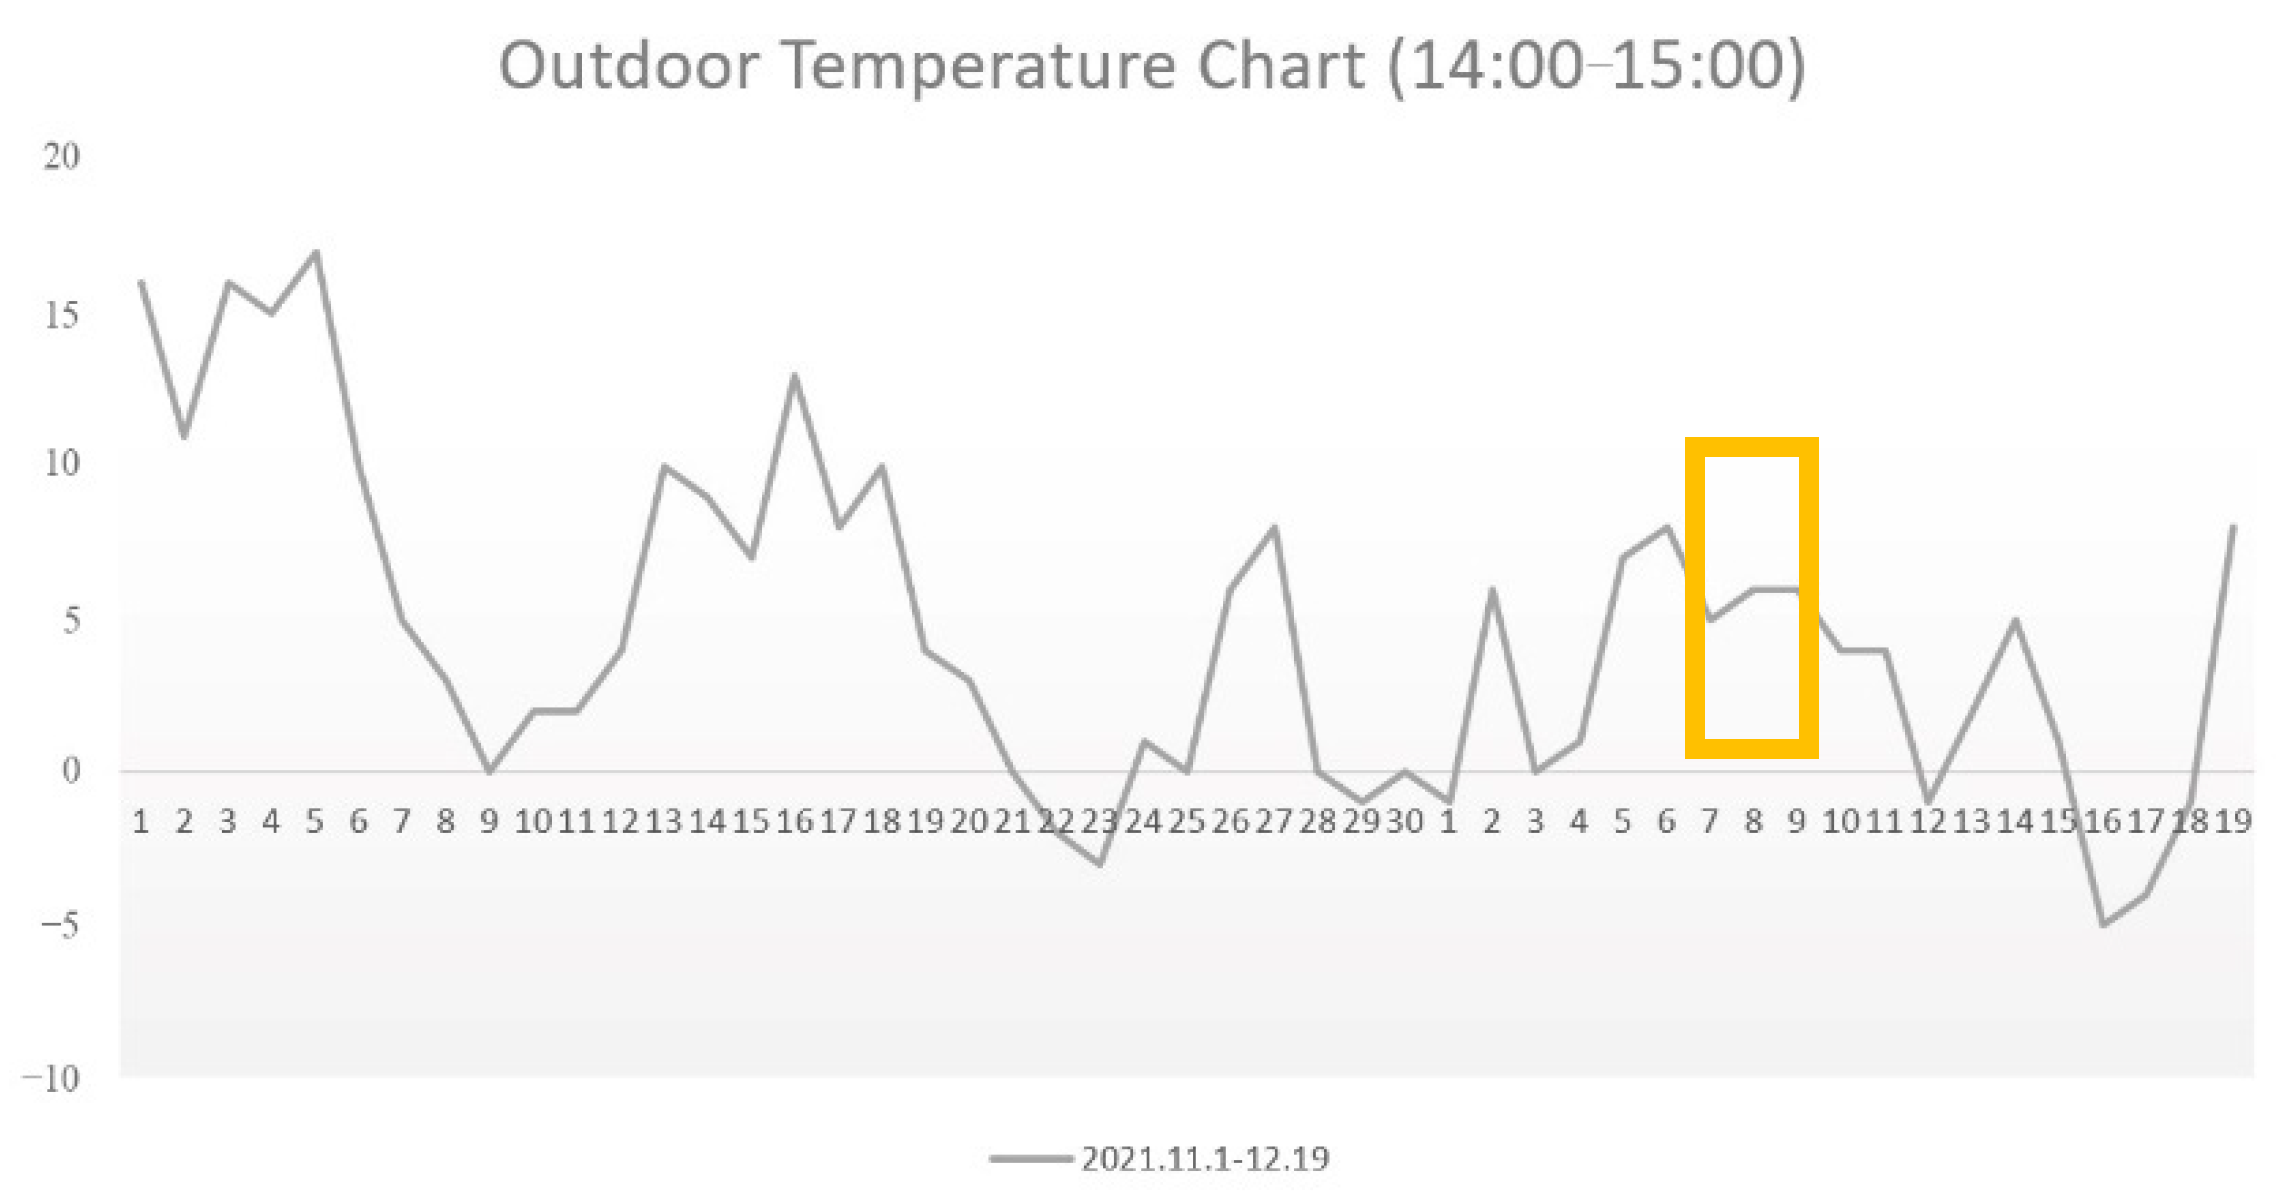
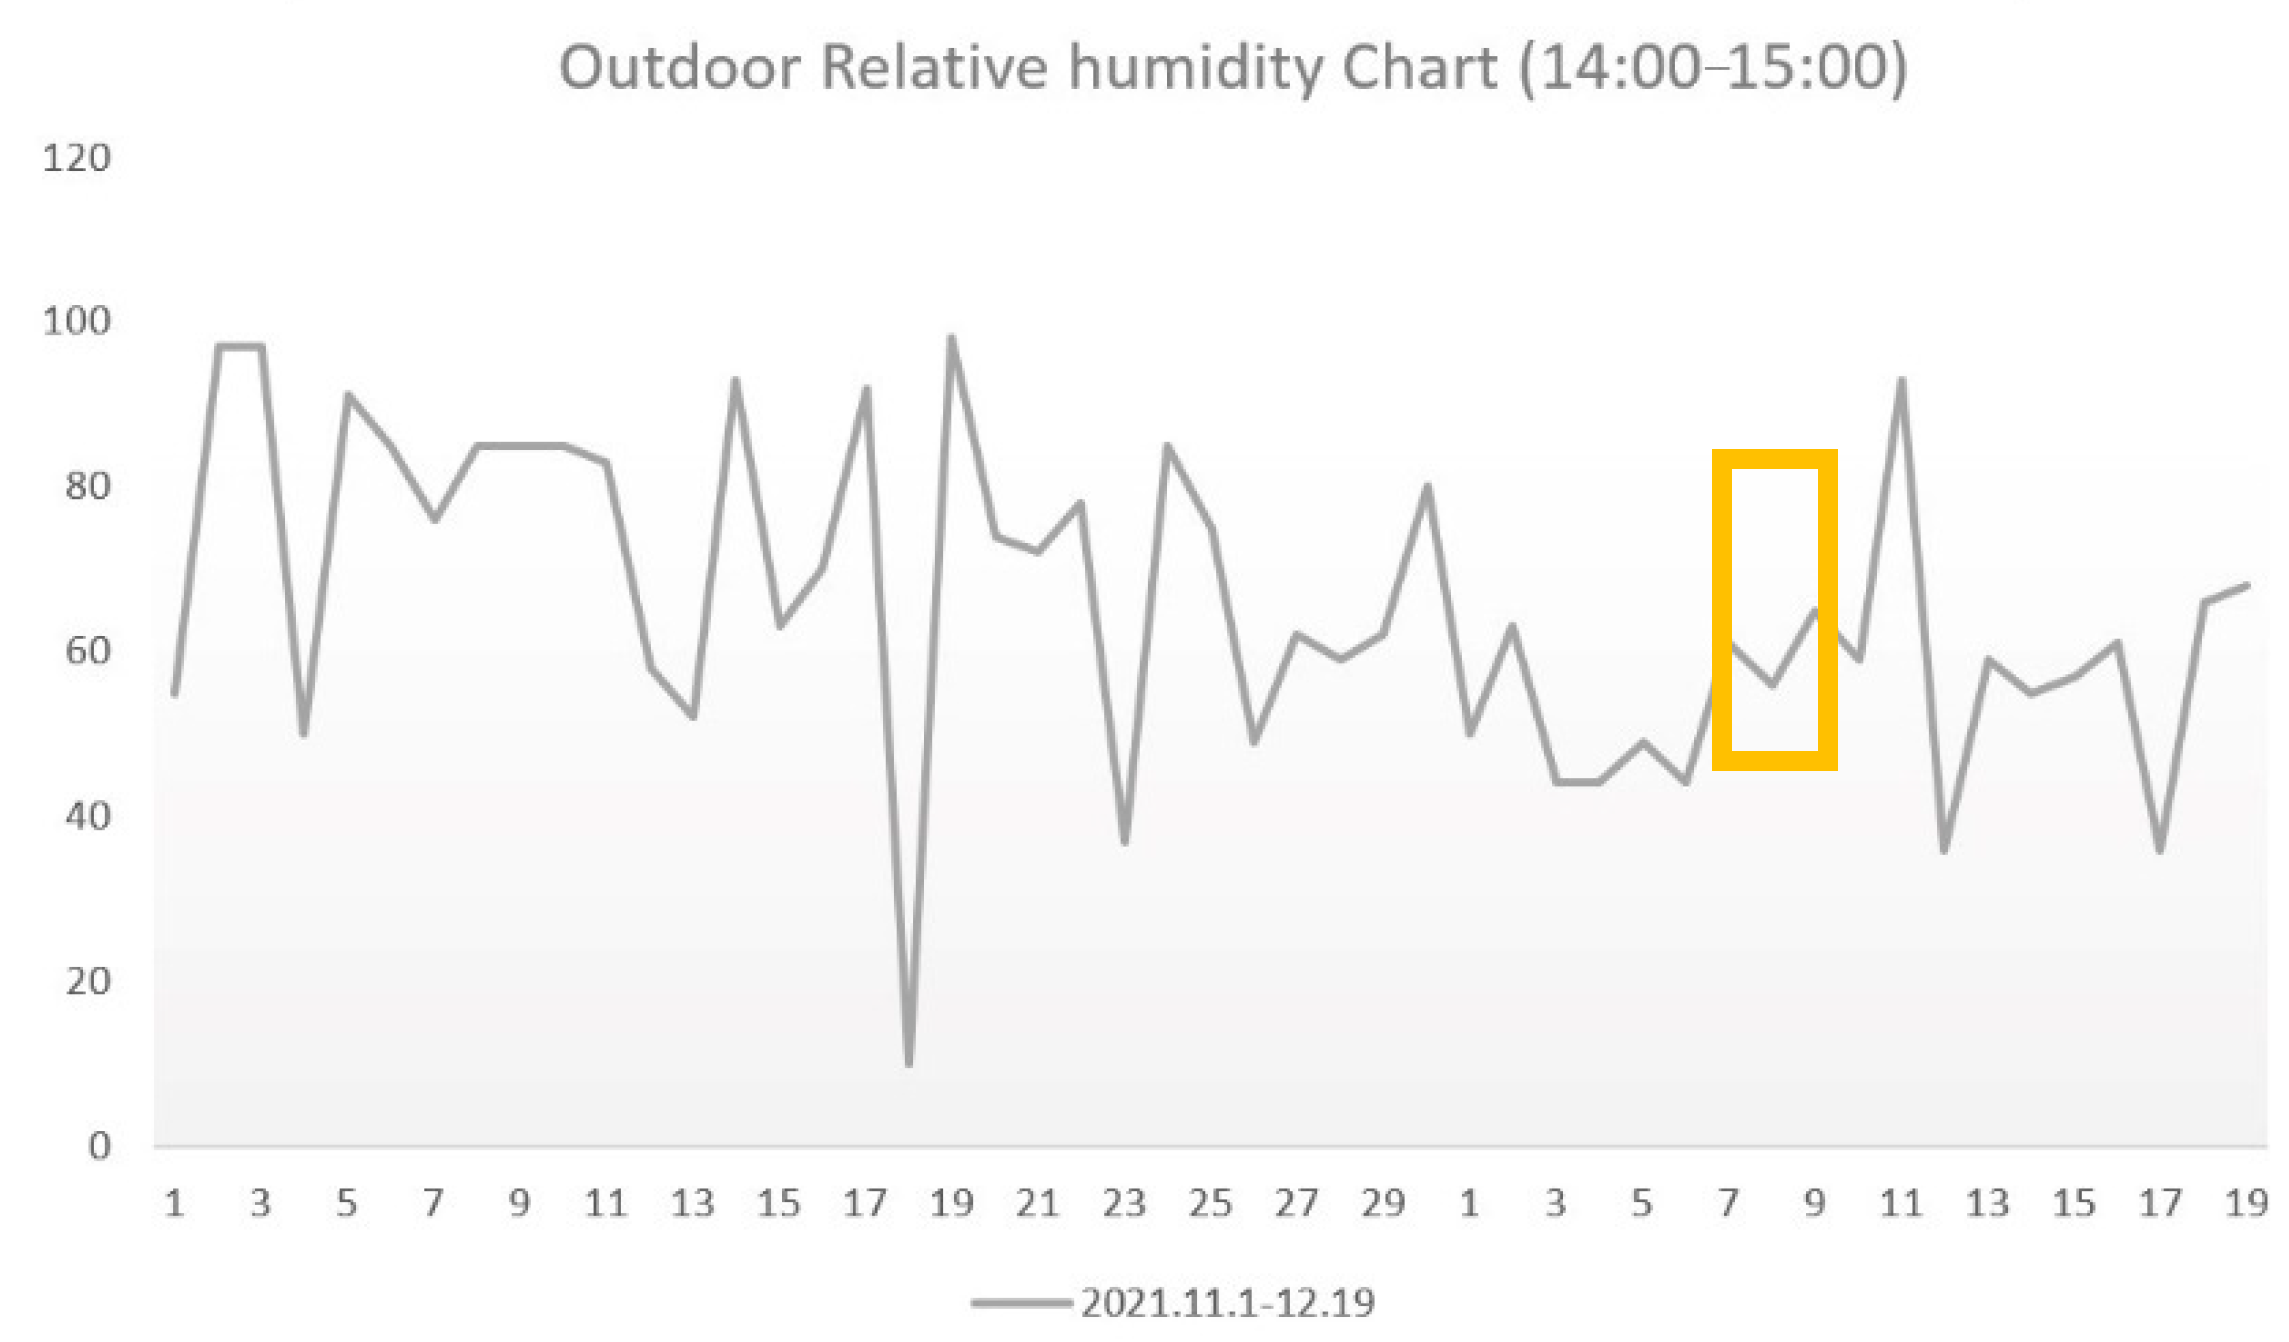
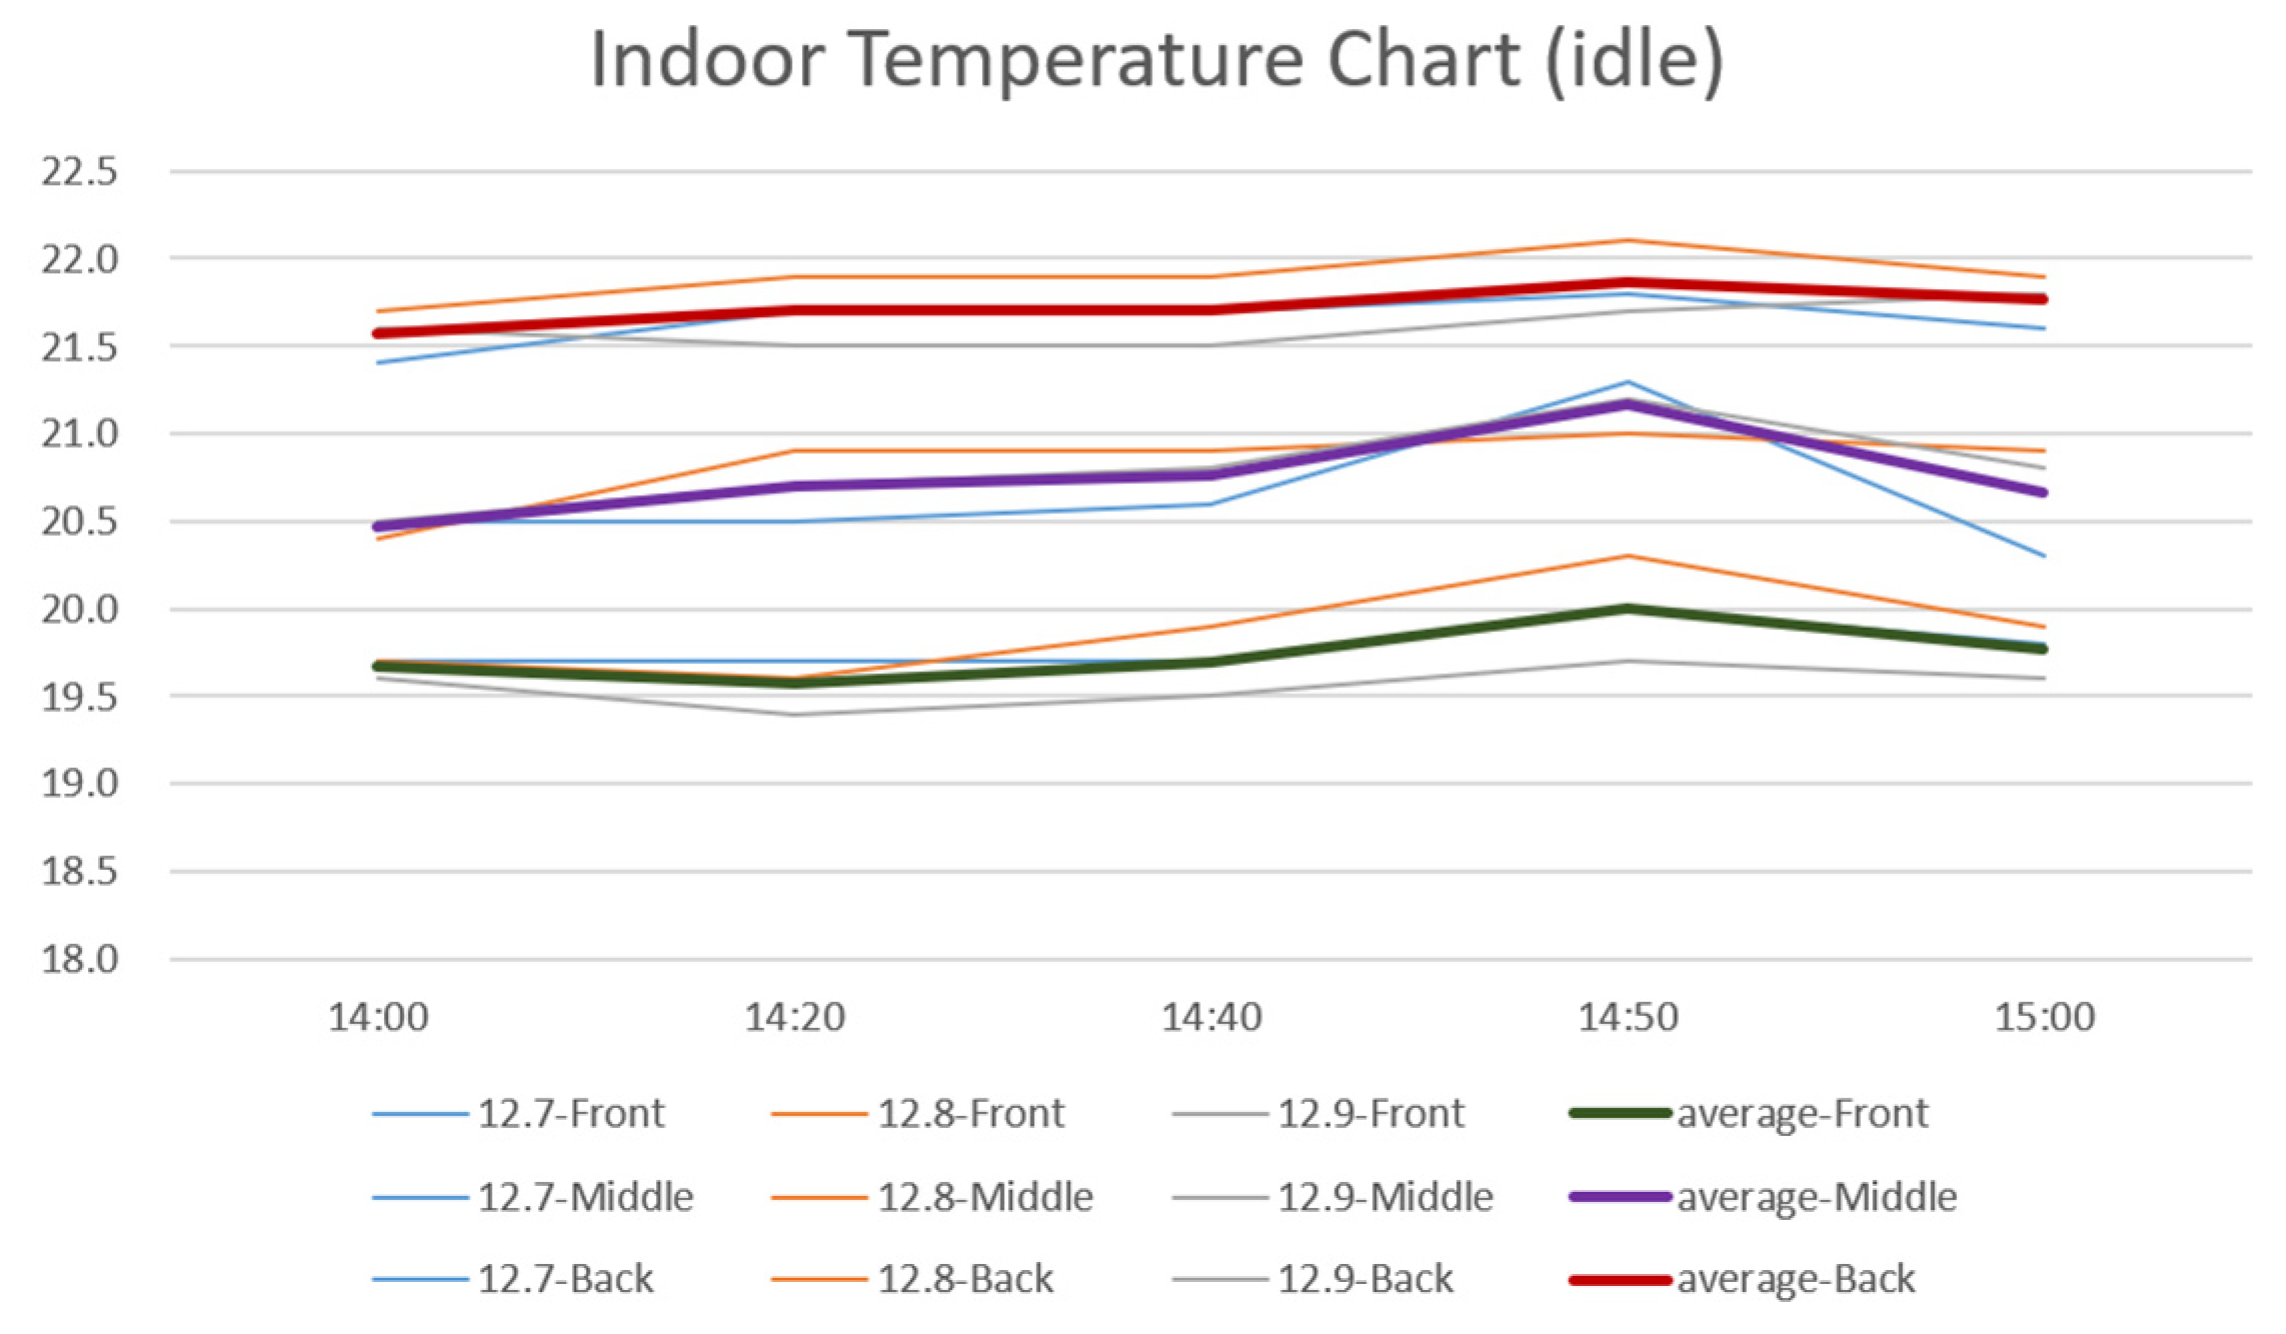
It should be noted that the following relationships were obtained by linear regression using the Bin method (temperature frequency method) for a regression analysis of the indoor air temperature. Note that the indoor temperature, relative humidity, and personnel density did not change much during the three days of 7–9 December, which include the same day that was chosen for the subjective questionnaire, i.e., 7 December. In addition, these parameters only include the data obtained from the 1 h field test measurements. The reason for choosing only this time period is to enable an accurate correspondence between the subjective and objective investigations.
The MTSV of the subjects was calculated as follows:
V′MTSV = 0.3418 ta − 7.3123 R2 = 0.85,
where V′MTSV is the average thermal sensation, and ta (°C) is the room temperature.
The significance levels of regression of Equation (7) were calculated as 0.008 by the F-test. This value implies that the linear regression equation is appropriate.
If VMTSV and V’MTSV are zero, the thermal neutral temperature is calculated as 22.6 °C with Equation (6) and 21.4 °C with Equation (7). It can be seen that when the people population density is high, the thermal neutral temperature is relatively low. Note that when the initial operating heating temperature is set for large classrooms, further consideration should be given to the impact of personnel heat dissipation on the overall thermal environment of the space, in addition to meeting code requirements.
According to ISO standard 7726 [38], in most practical cases where the relative velocity is small (<0.2 m/s) or where the difference between mean radiant and air temperature is small (<4 °C), the operative temperature can be calculated with sufficient approximation as the mean value of air and the mean radiant temperature. Furthermore, the corresponding predicted thermal sensory vote (PMV) values can be calculated by putting the corresponding parameters into the Chinese standard (GB/T 50785-2012) [7]
Using the temperature frequency method, regression curves were obtained between the PMV values and room temperature as follows:
PMV = 0.3008ta − 7.2038 R2 = 0.99,
where PMV is the predicted thermal sensory vote value, and ta (°C) is the room temperature.
The significance levels of regression of Equation (8) were calculated as 0.015 by the F-test. This value implies that the linear regression equation is appropriate.
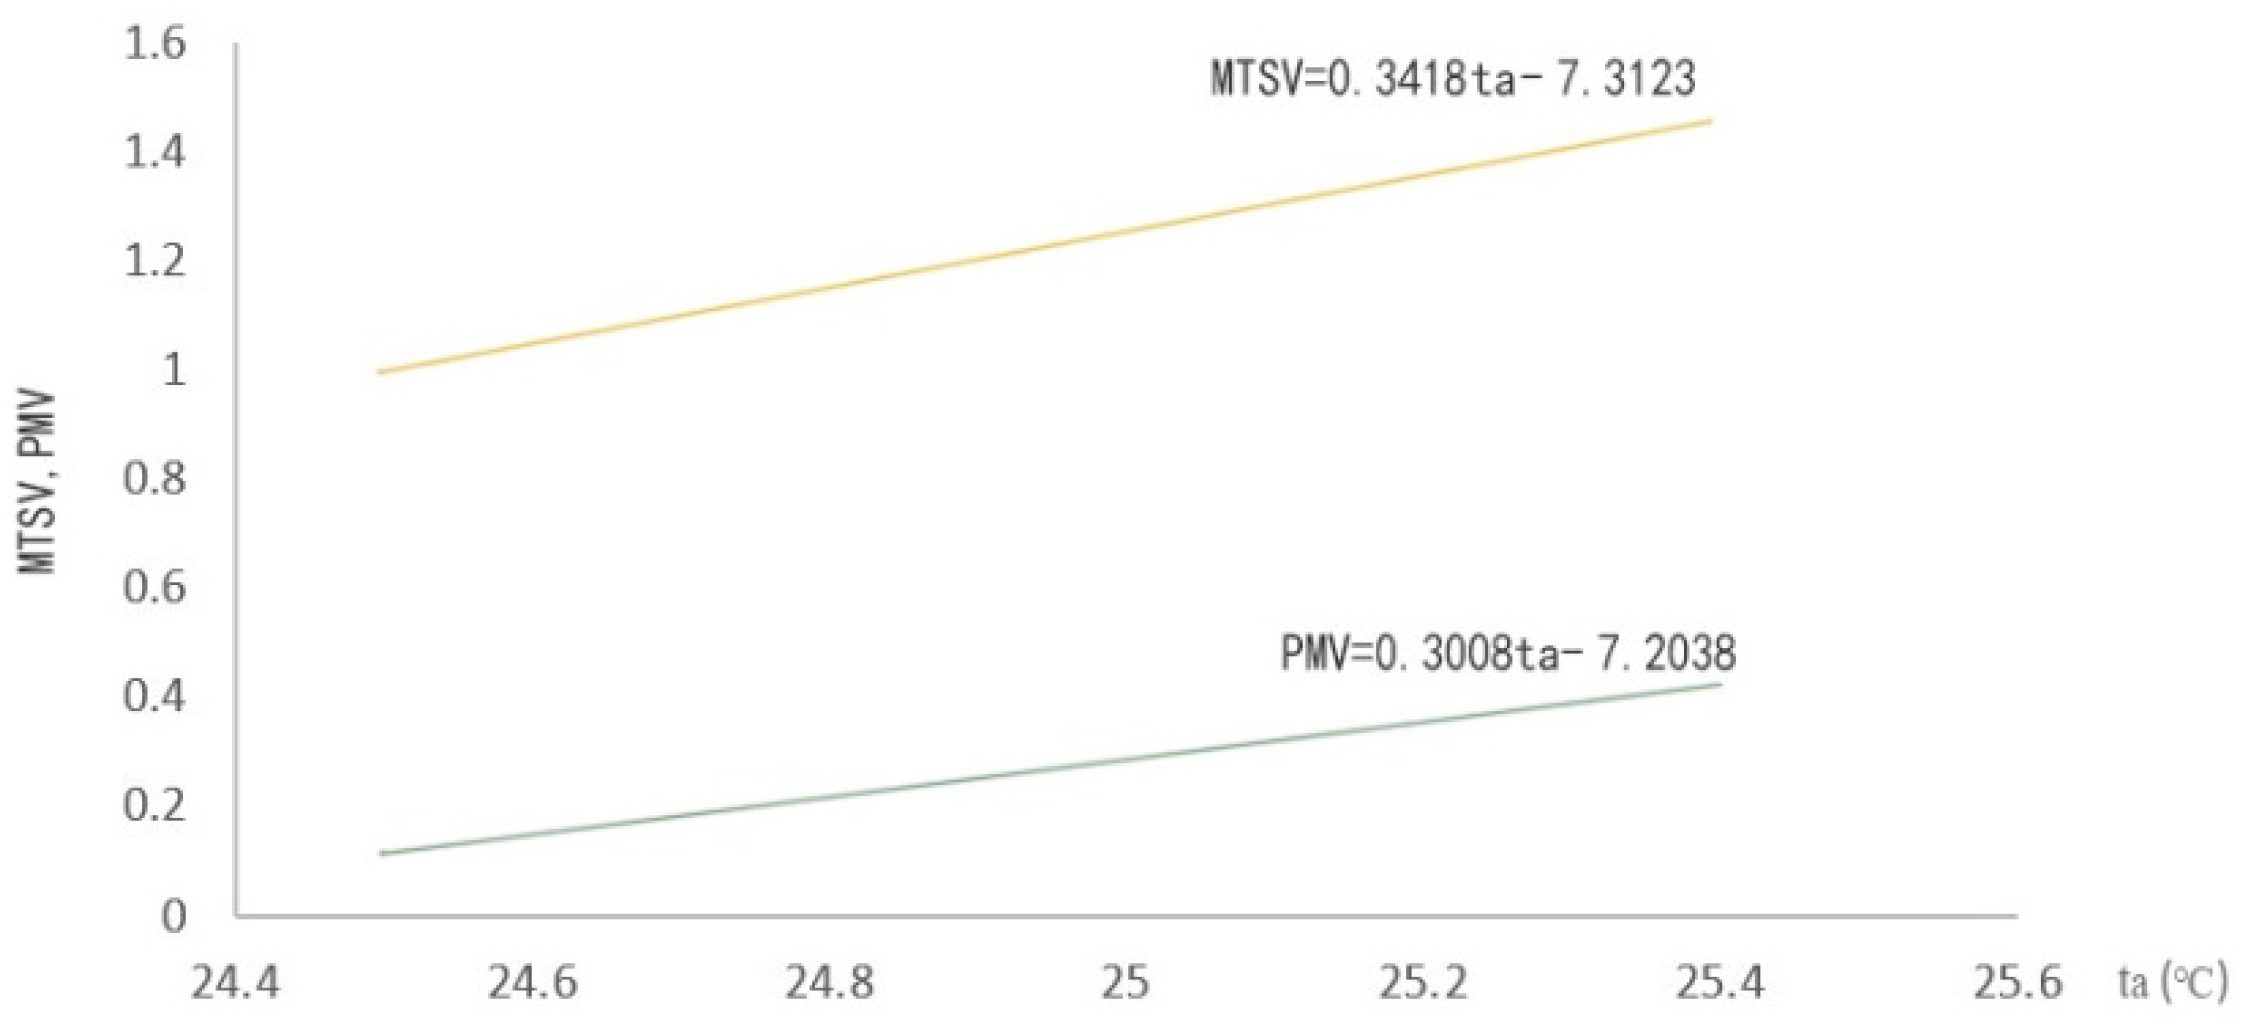
Although the trends of the linear regression curves for the V′MTSV model and the PMV model were generally consistent (Figure 20), the slope of the V′MTSV curve was larger than the PMV curve, indicating that the actual thermal sensation of the subjects was hotter than the predicted thermal sensation for the same room temperature. This implies that 49.6% of the subjects perceived the classroom to be hotter despite the thermally neutral PMV value at this operating condition.
The predicted thermoneutral temperature in Equation (8) was 23.9 °C, which is 2.5 °C higher than the thermoneutral temperature in Equation (7). This implies that the subjects had adapted to the colder outdoor climate at this stage and showed some rejection of the higher indoor heating temperature. It has been suggested in Ref. [40] that prolonged high temperatures can weaken students’ ability to adapt to cold climates, and that the use of thermally neutral temperatures to set indoor heating temperatures can result in significant energy savings and improved thermal comfort.

4.3. Study of Coupled Temperature and Humidity Evaluation Models

The entropy weighting method mentioned in Section 2.2.3 is used to normalize the temperature and relative humidity to obtain the standard matrix, which can be expressed as follows:
0 0 0.14 0.37 1 1 .
According to Equation (3), the information entropy of temperature and relative humidity is Hj = {0.32,0.51}.
According to Equations (4) and (5), the weight values of temperature and relative humidity are 0.58 and 0.42, respectively.
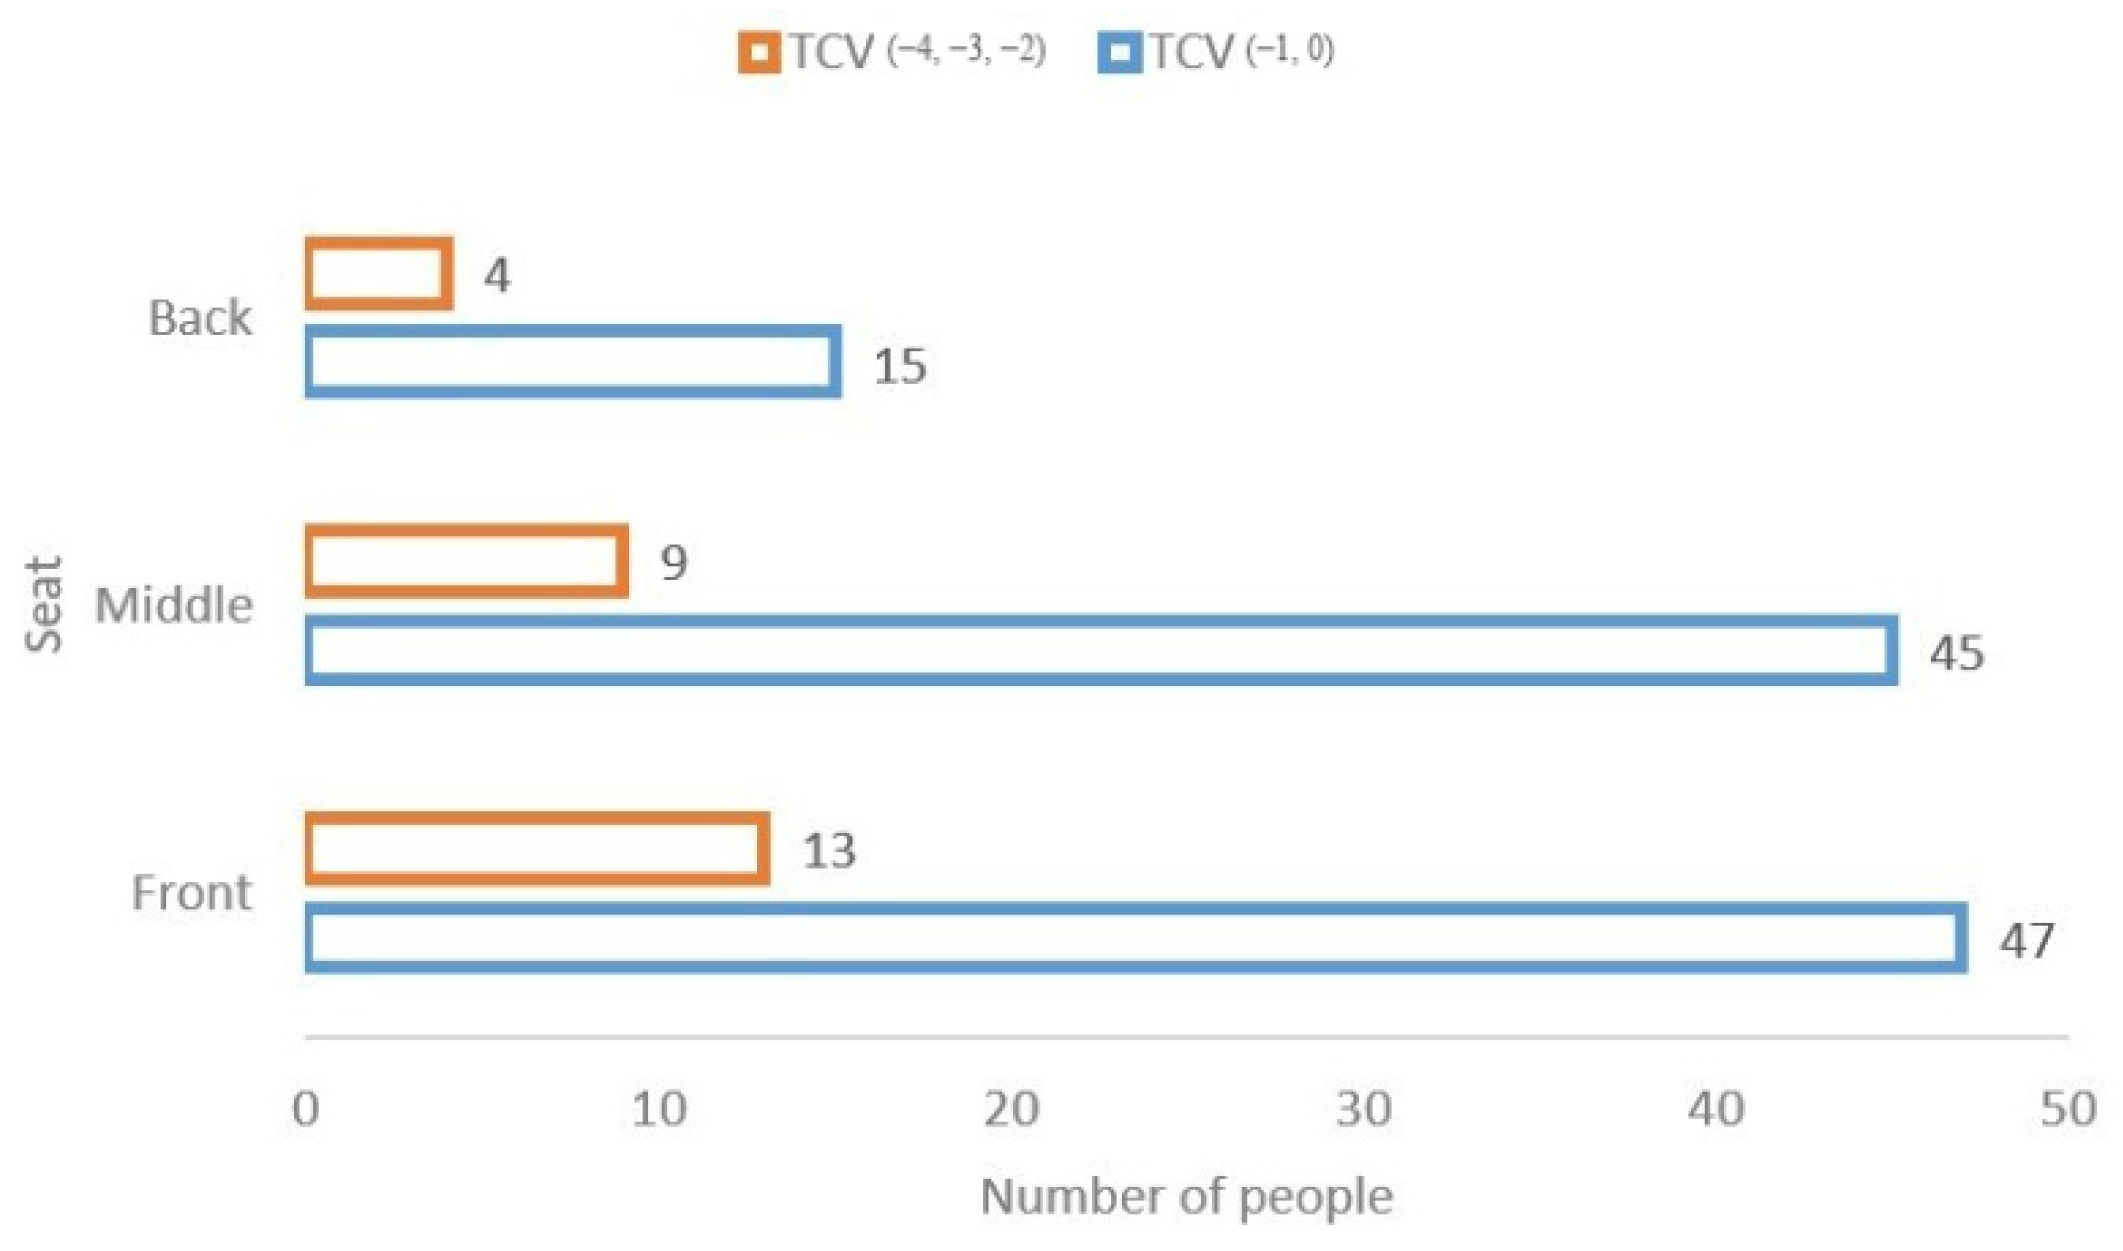
The predicted thermally neutral temperature of 23.9 °C can be calculated with Equation (8). Additionally, the corresponding relative humidity is 28% when PMV is zero. Note that according to the weighting value, the final evaluation score is 25.6 when PMV is zero, while according to the temperature and relative humidity of the front, middle, and rear areas, the evaluation scores are 26.6, 27.2, and 28.5, respectively. This implies that the thermal environment in the front area is the most suitable.
Figure 21 shows that the subjects in the front area had the highest thermal comfort, which is consistent with the final evaluation results of the entropy weighting method. This implies that the entropy weighting method can be used in the subjective analysis of thermal satisfaction.

4.4. Temperature Expectation, Relative Humidity Expectation, and Thermal Comfort

There are six main factors that affect human thermal comfort: human energy metabolic rate, clothing thermal resistance, air temperature, air humidity, airflow velocity, and average radiation temperature. The human energy metabolic rate, clothing thermal resistance, and average radiation temperature varied slightly in this experiment. Thus, our analysis focused on the TCV voting values (from −4 to −2). The results of a precise statistics calculation is plotted in Table 7; it can be seen that 50% of the subjects felt that the room temperature could be lowered and that the relative humidity could be raised in subsequent improvement measures. However, higher relative humidity is not more beneficial, and some studies have shown [41] that relative humidity should not exceed 60% in order to avoid thermal discomfort, which is also in accordance with the relevant national upper limit [32]. Nevertheless, three of the subjects also chose not to change both environmental parameters, which may have been due to psychological reasons as teaching in the indoor environment is not autonomously controllable. Thus, the subjects might have had different degrees of additional thermal sensations, which would have affected the overall thermal comfort, although it is not related to the objective environmental parameters. It is also worth mentioning that some scholars have proved this point [42].

4.5. Gender and Thermal Comfort

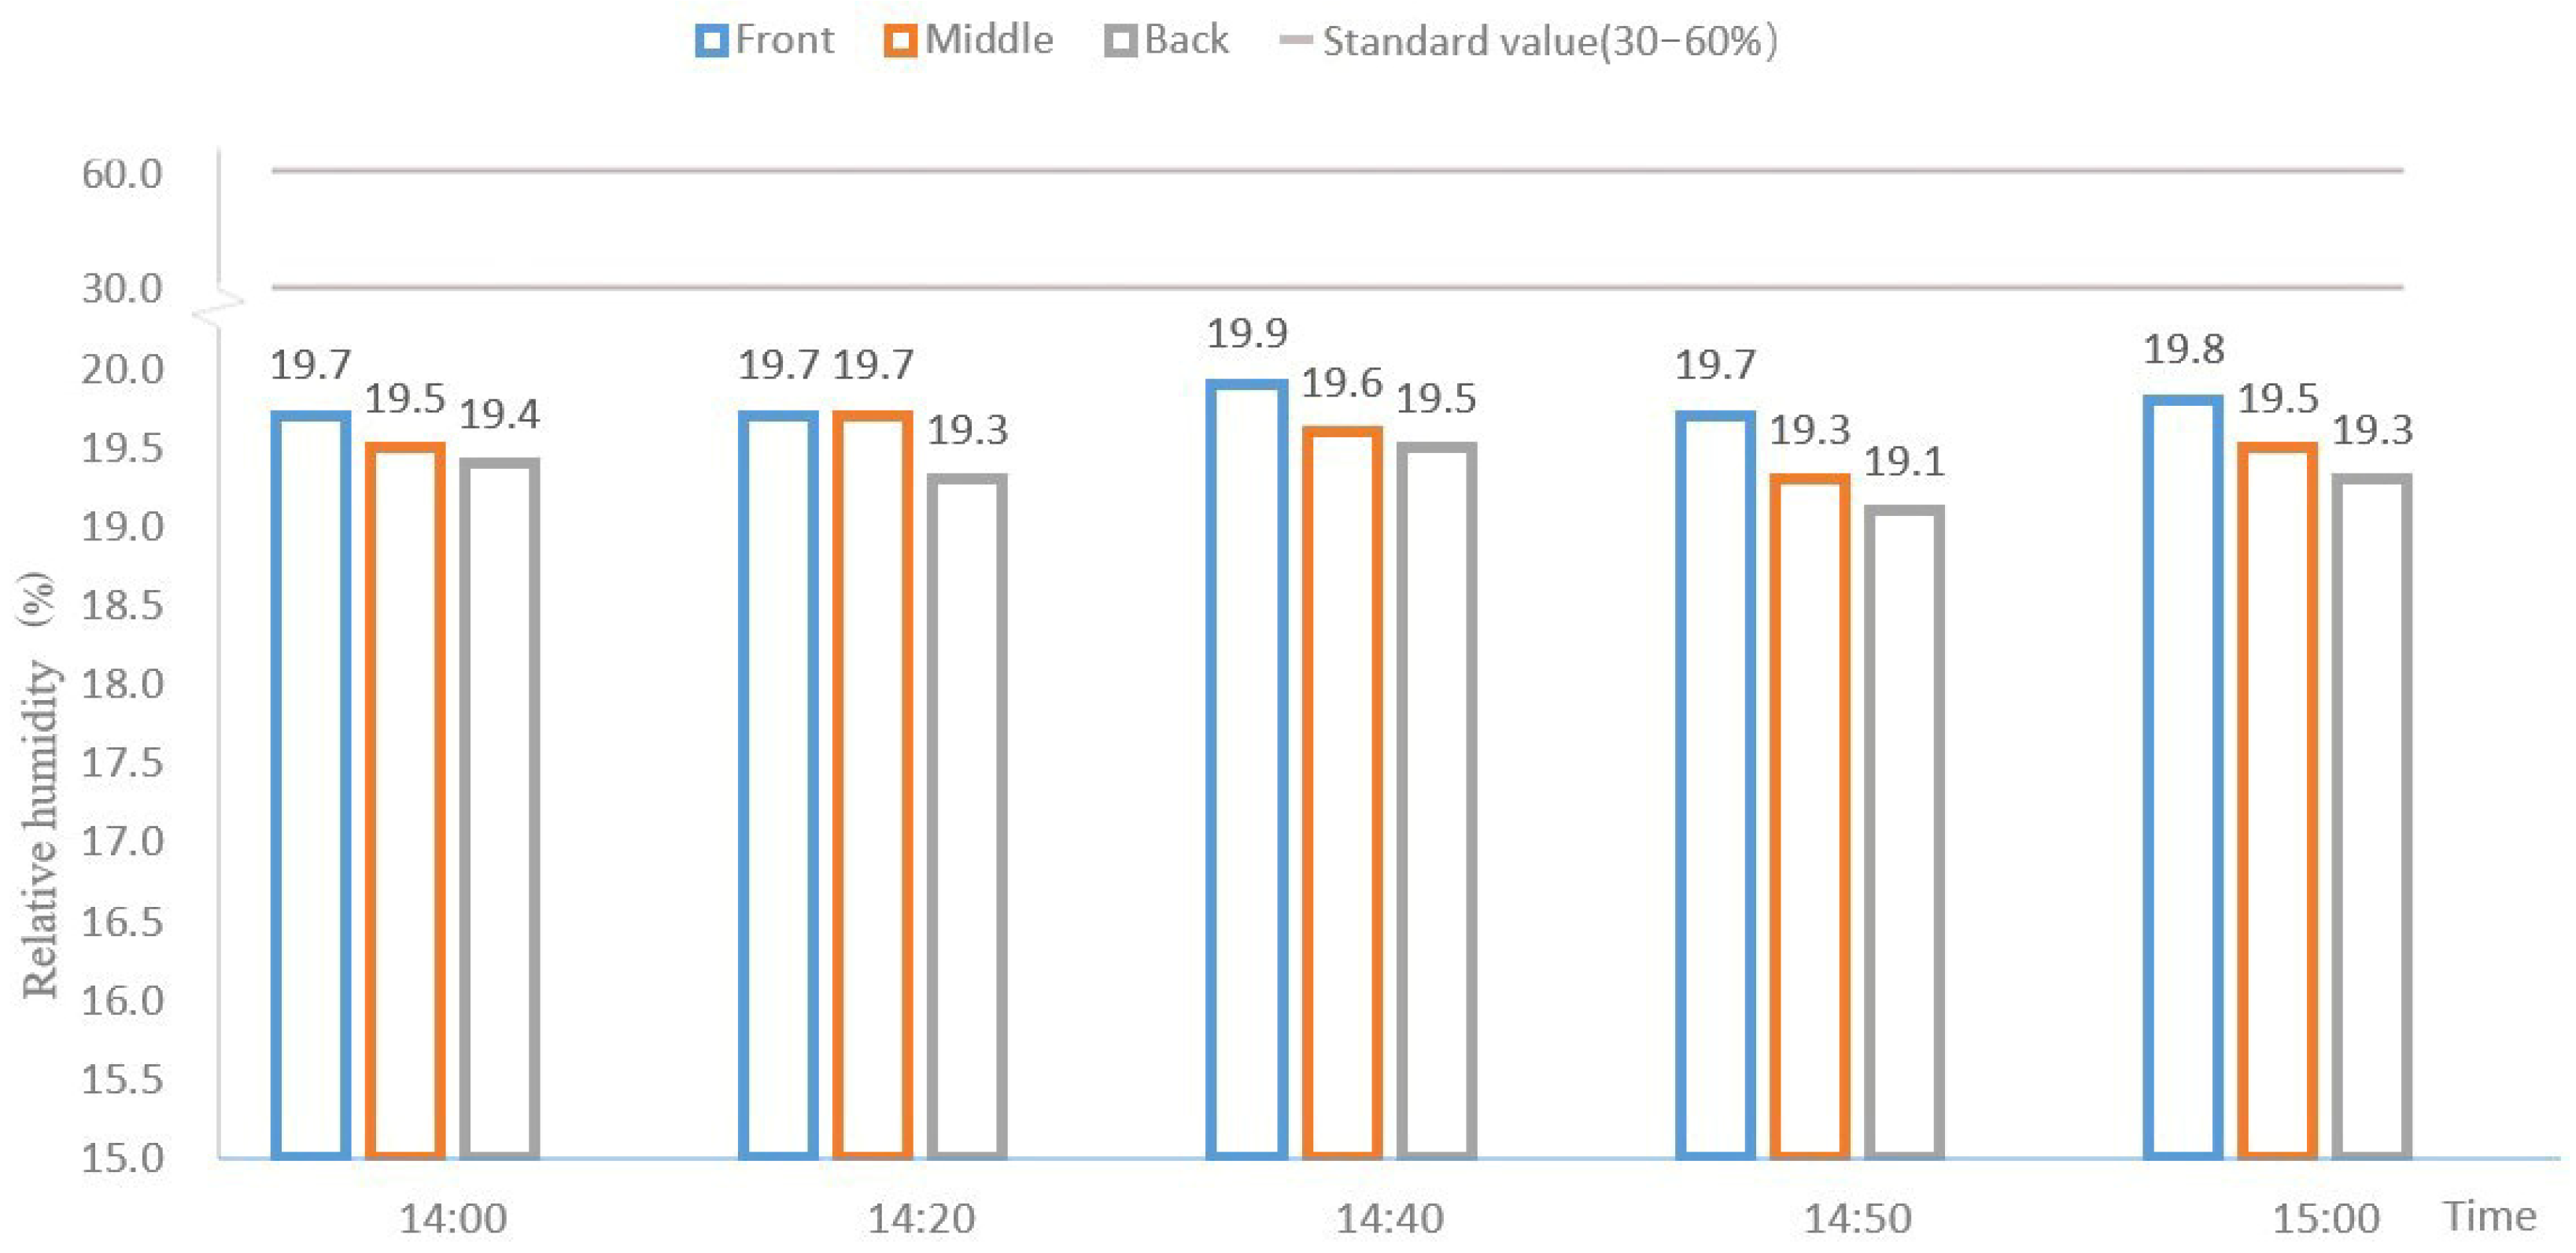
Both temperature and relative humidity are influencing factors of thermal comfort. However, the environmental factor that had a greater impact on thermal comfort was mainly air temperature due to the relatively low sensitivity of humans to humidity, which fluctuates within a range of ±15% [
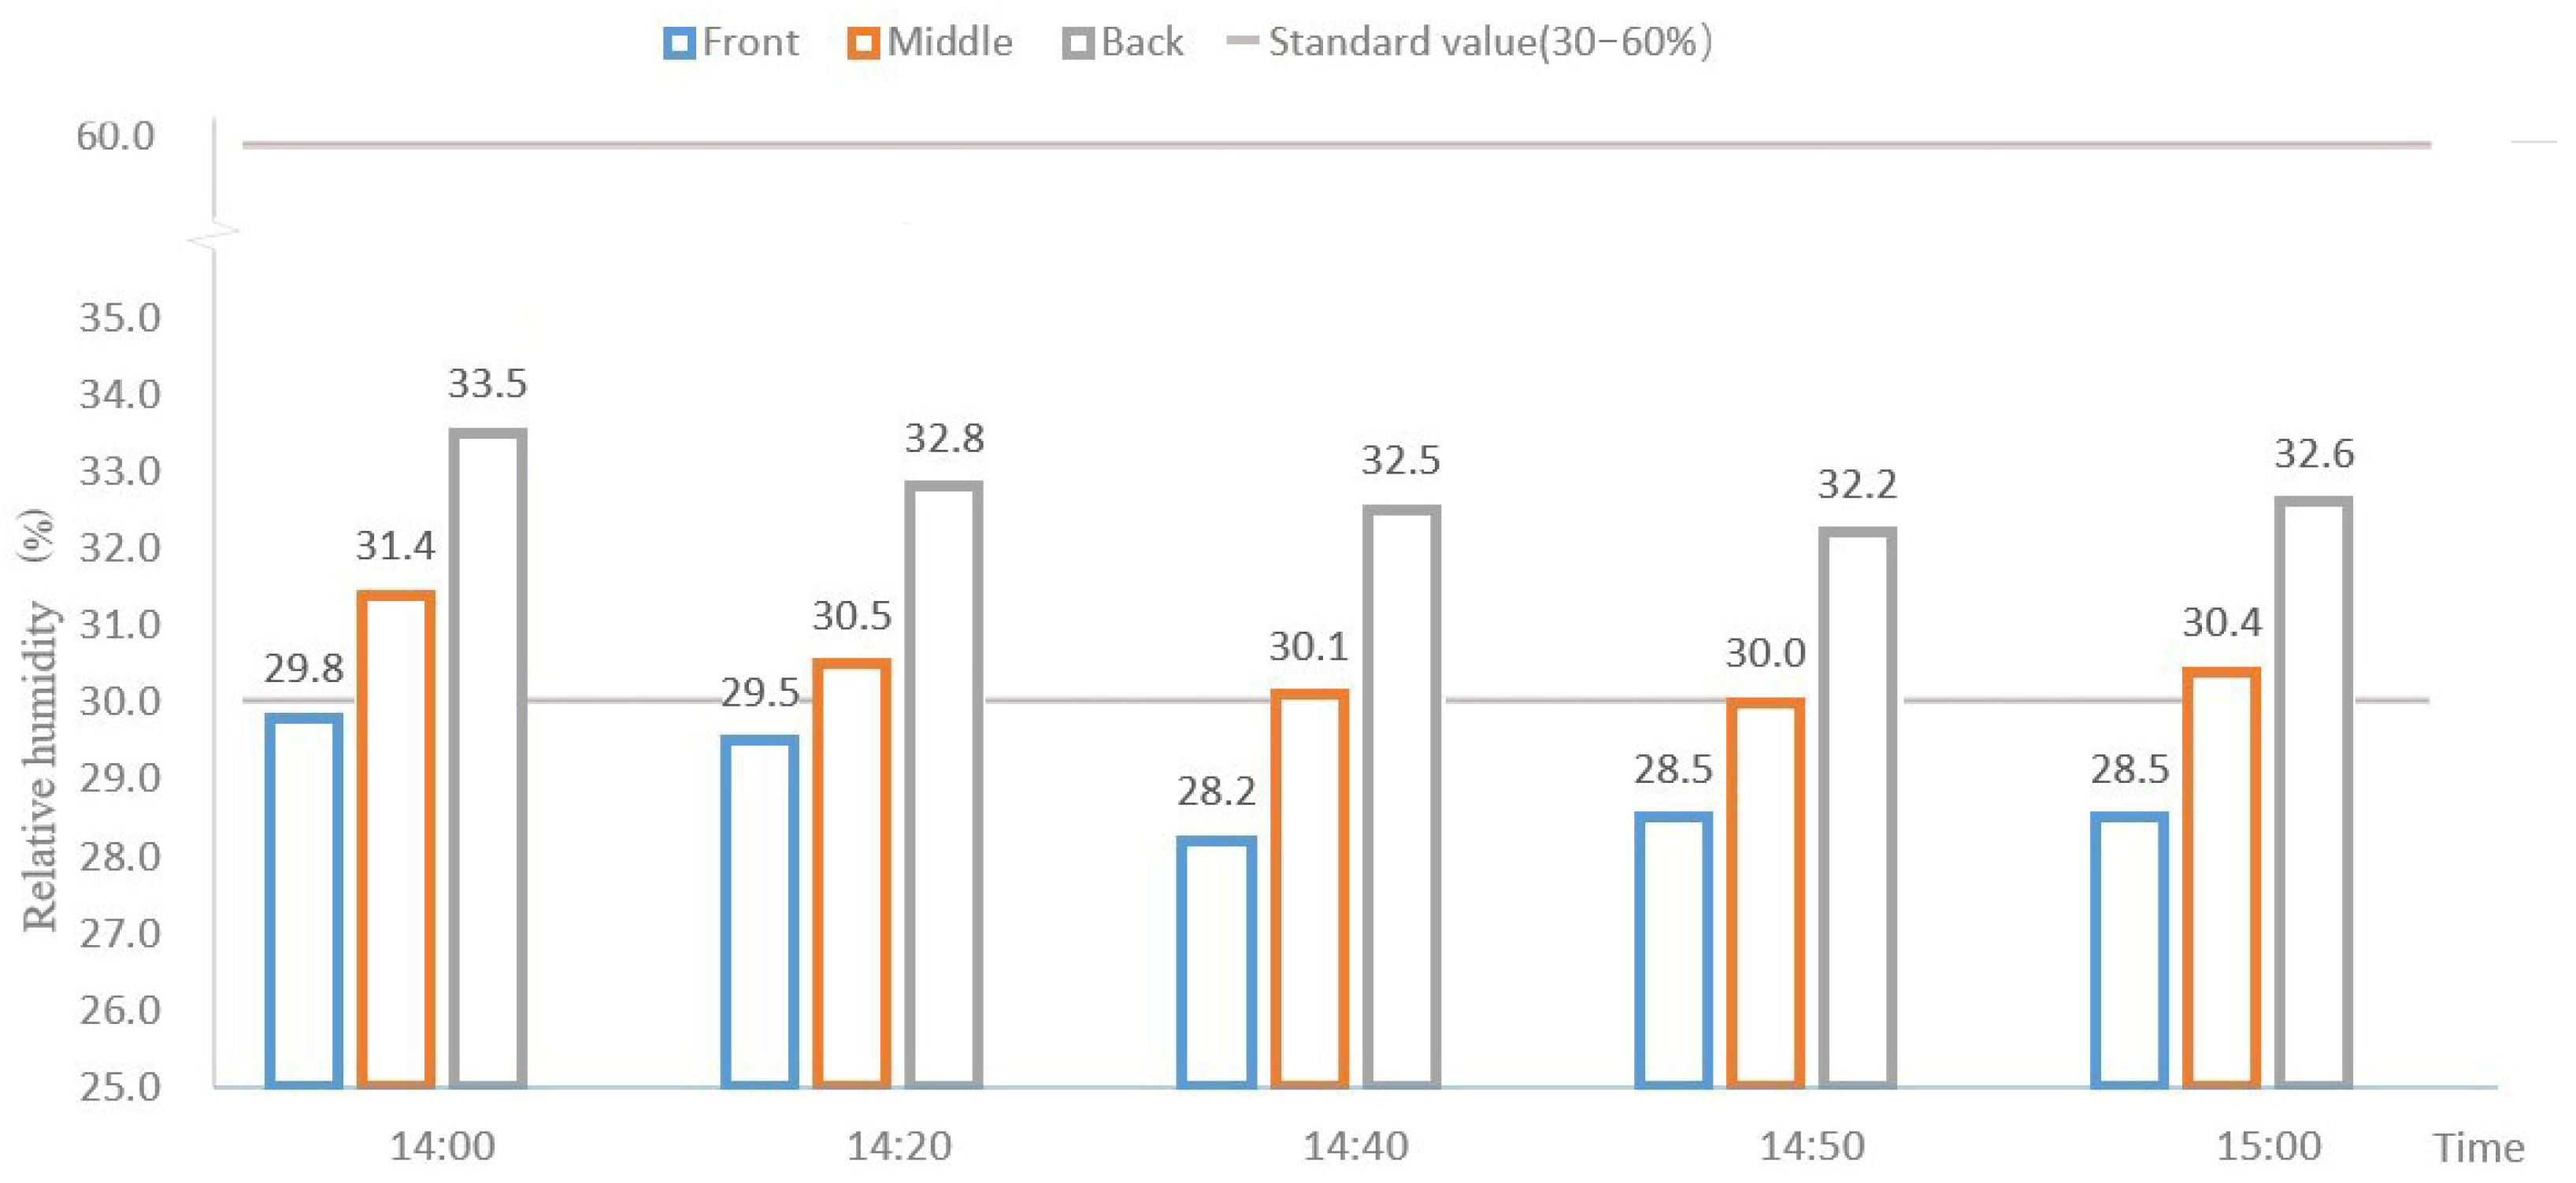
43]. Furthermore, the relative humidity in the classroom during this test was generally low and relatively stable.
Information about the students’ sex is summarized in Table 8. As can be seen in 
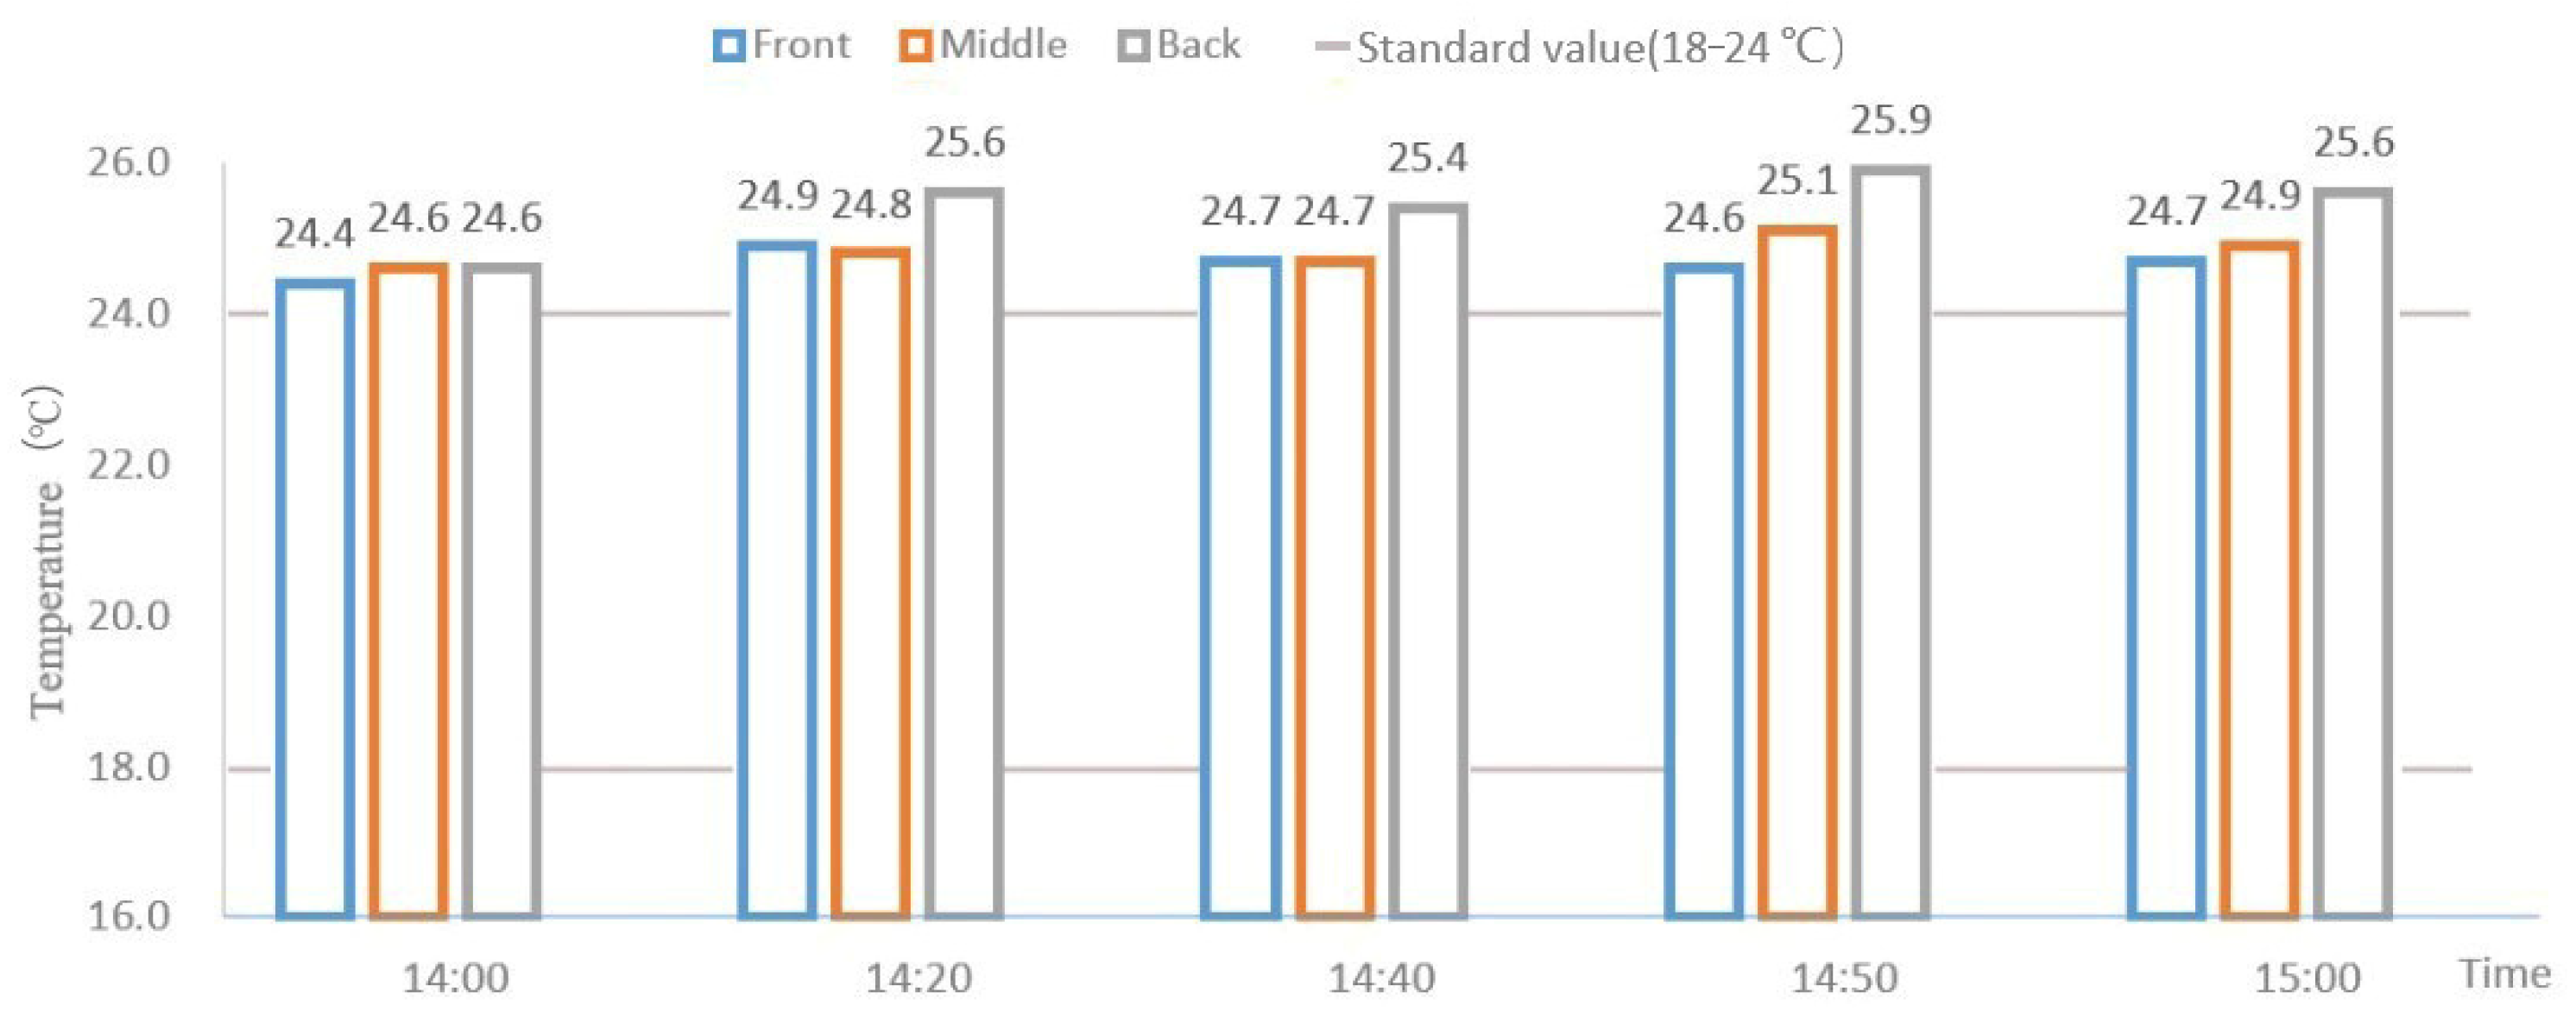
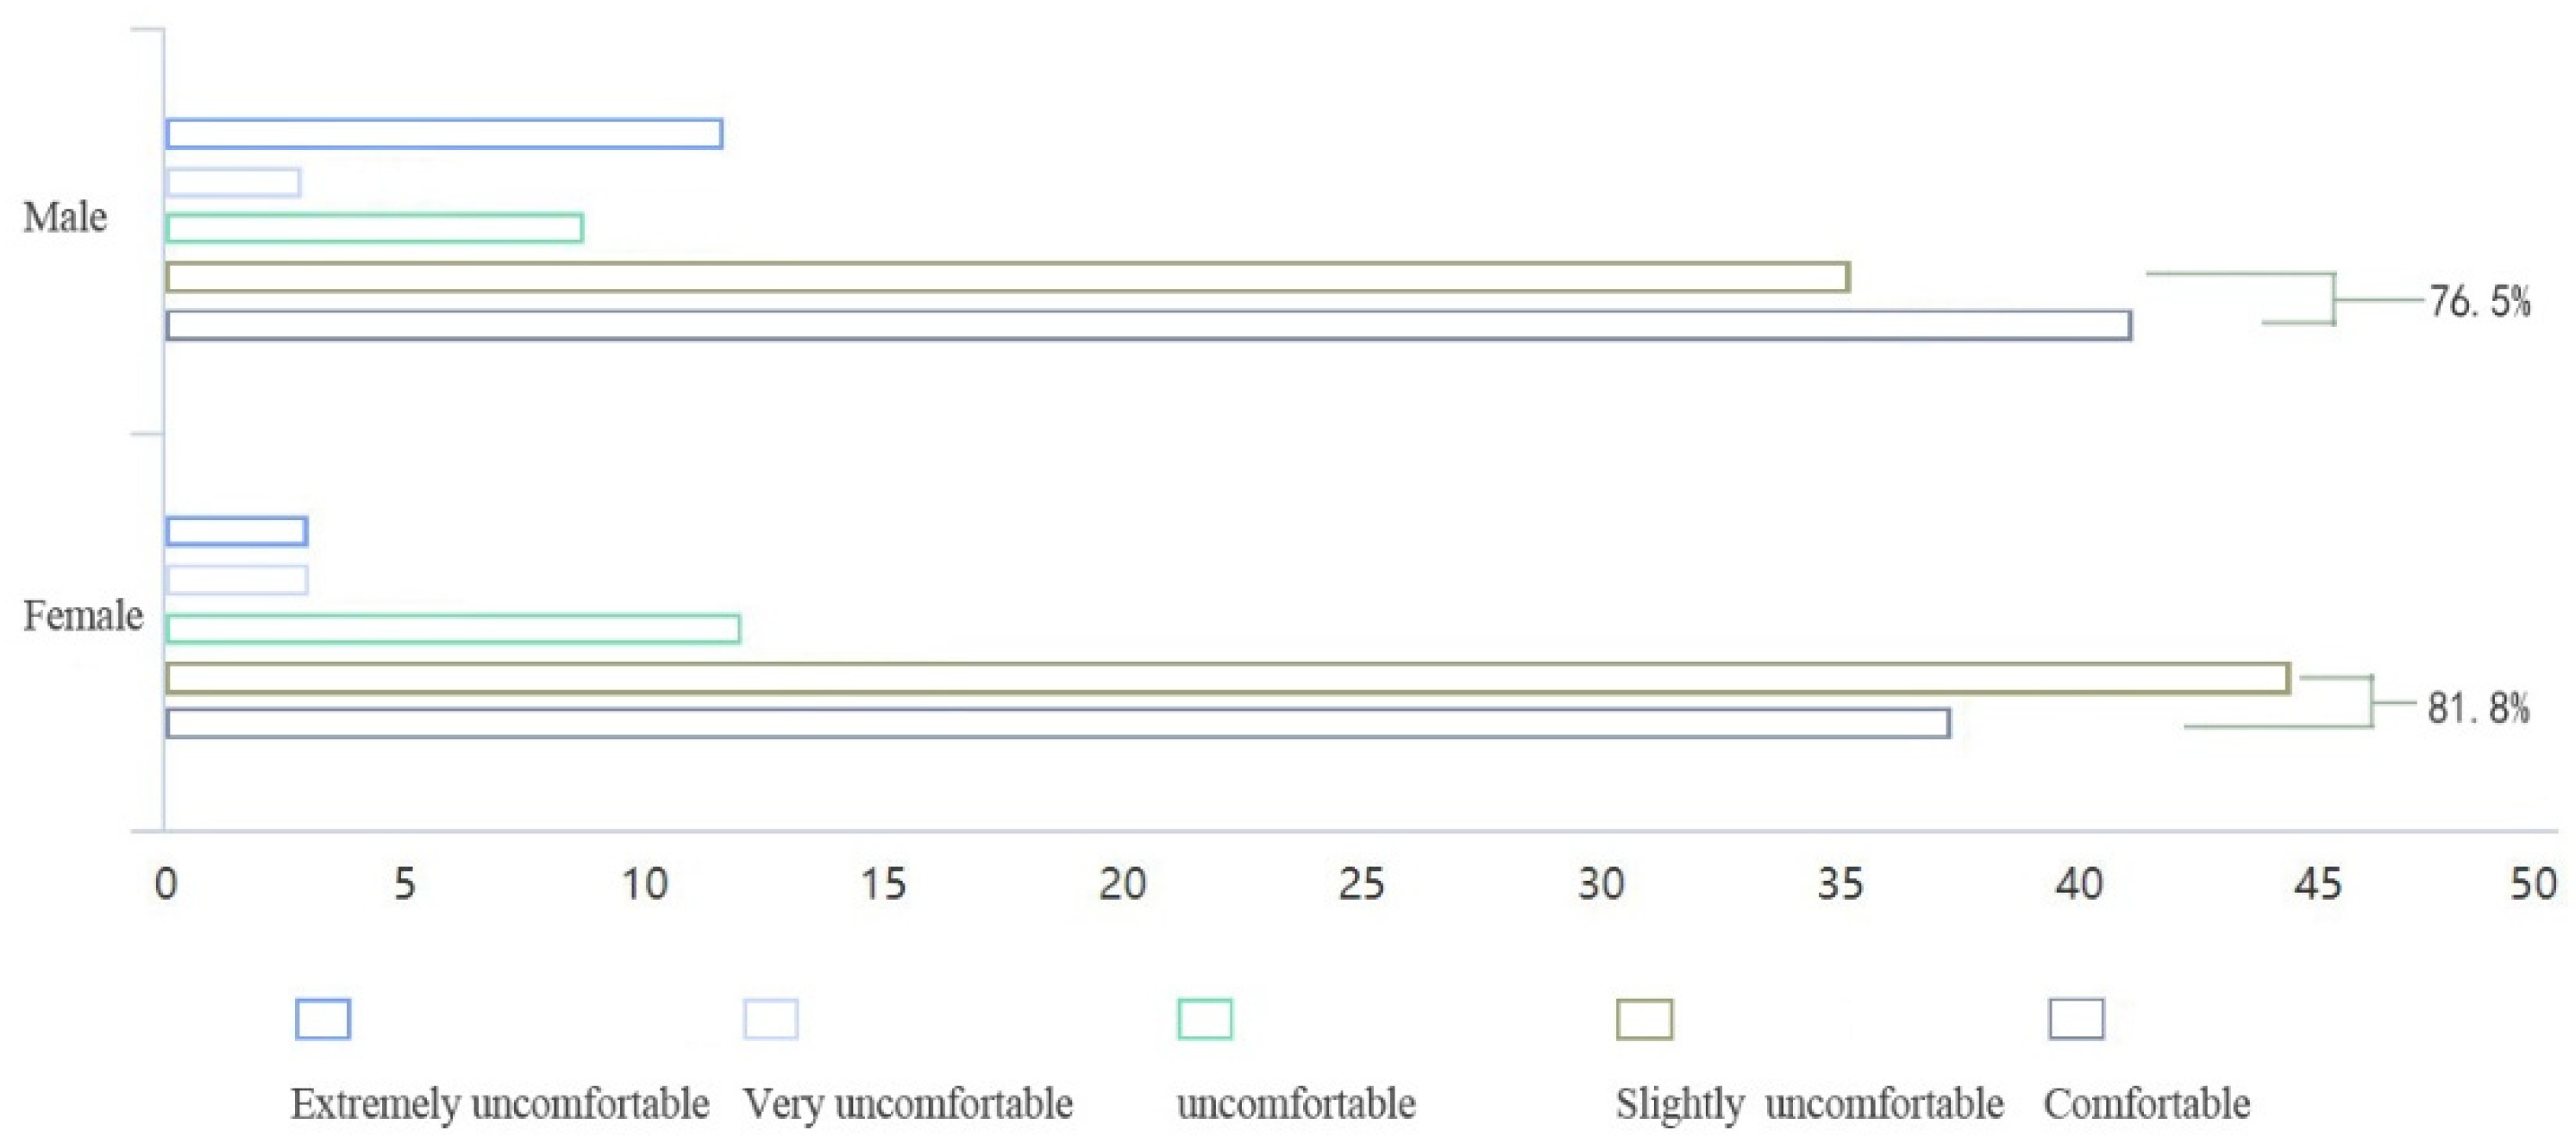
Figure 22, in terms of gender influence, 81.8% of females and 76.5% of males voted for thermal comfort concentrated between −1 and zero. The average temperature in the classroom in the previous field test was 24.9 °C, indicating that at room temperatures above the prescribed value of 24 °C [39], thermal comfort values were higher for females than for males in the same thermal environmental conditions. It should be noted that some studies on the same severe cold climate zone used a linear relationship between AMV (actual mean vote) and room temperature for different gender groups [44]. These studies calculated the thermal neutral temperature of male and female subjects as 21.6 and 22 °C, respectively. Through the field measurements, the present study also proves that women prefer a warmer environment.

4.6. Summary

Note that the majority of subjects in this test considered the room temperature to be high, and the thermally neutral temperature was calculated as relatively low. However, when the people population density was high, the majority of subjects were satisfied with the current state of the air temperature in the classroom, indicating a certain level of thermal tolerance. When the two types of expectations were counted, more subjects wanted the temperature to remain the same and the relative humidity to increase, indicating a stronger desire to improve the dry environment in the classroom. In terms of gender, the thermal comfort values for females were relatively higher than those for males in classroom conditions, indicating women’s preference for a warmer indoor environment. Note that the entropy weighting method can also be used as a supplementary verification tool in the subjective analysis of the thermal environment.

4.7. Limitations

First, the test time set in the experiment was in the afternoon. Thus, the present study did not cover indoor thermal environment conditions in the morning and evening. Second, the present study focused on a certain type of young people and did not cover the whole age group. In the future, it would be possible to further study the personnel density thresholds corresponding to the appropriate temperature and relative humidity in the classroom. Additionally, the test site chosen was north-facing in order to avoid the effects of sunlight exposure, which is relatively simple. The air quality in the classroom, which would have affected the overall comfort level in the classroom, was also not studied. Finally, in the context of the 2019 coronavirus pandemic, the impact of wearing masks on thermal comfort and the indoor environment should be considered. However, there was no epidemic in the Shenyang campus during the test time of this project, and the students were not wearing masks. Therefore, further research can be carried out to address these limitations.

5. Conclusions

This study aimed at analyzing the characteristics of the indoor thermal environment and personnel activities in university classrooms in Shenyang. Through objective and subjective analyses, combined with the auxiliary analysis of relevant linear equations and the entropy weight method, the following conclusions can be drawn:
  • Through actual measurement and analyses under two scenarios, it was found that the size of the personnel density during lectures is an important factor affecting the change of indoor temperature and relative humidity. Furthermore, the individual’s own heat dissipation and moisture dissipation have some influence on the overall thermal environment.
  • PMV overestimates the thermal neutral temperature of students, while the thermal neutral temperature of the subjects was calculated as relatively low. Therefore, when the density of the indoor personnel population is large, we can consider reducing the amount of indoor heating appropriately to enhance thermal comfort and save energy at the same time.
  • Women are more satisfied in a relatively warm environment, with women voting 5.3% higher than men with regard to thermal comfort.
  • The entropy method can be introduced into the subjective analysis of the thermal environment.
  • Thermal comfort can be improved by improving indoor relative humidity. Opening doors can slow down the thermal discomfort, and it does not cause a significant convection phenomenon with hot and cold air. Clothing storage areas can be set up in classrooms to allow students to add or remove clothing and to provide storage.

Author Contributions

Conceptualization, J.Z., P.L. and M.M.; methodology, J.Z., P.L. and M.M.; software, P.L. and M.M.; validation, P.L. and M.M.; formal analysis, J.Z., P.L. and M.M.; investigation, J.Z. and P.L.; resources, M.M.; data curation, J.Z., P.L. and M.M.; writing—original draft preparation, P.L.; writing—review and editing, J.Z. and P.L.; visualization, P.L. and M.M.; supervision, J.Z., P.L. and M.M. All authors have read and agreed to the published version of the manuscript.

Funding

This research received no external funding.

Institutional Review Board Statement

The study was conducted in accordance with the Declaration of Helsinki, and approved by the Ethics Committee of School of Architecture, Northeastern University.

Informed Consent Statement

Informed consent was obtained from all subjects involved in the study.

Data Availability Statement

Data are not publicly available due to restrictions regarding the privacy of the participants.

Acknowledgments

We are grateful to Northeastern University for providing the equipment used in this study.

Conflicts of Interest

The authors declare no conflict of interest.

References

  1. Cao, B.; Zhu, Y.; Hou, Y.; Wu, Y.; Li, S.; Liu, S. Ergonomics in built environments: Prospects of human thermal comfort research. Chin. Sci. Bull. 2022, 67, 1757–1770. [Google Scholar] [CrossRef]
  2. Wang, Z.; de Dear, R.; Luo, M.; Lin, B.; He, Y.; Ghahramani, A.; Zhu, Y. Individual difference in thermal comfort: A literature review. Build. Environ. 2018, 138, 181–193. [Google Scholar] [CrossRef]
  3. Fanger, P.O. Thermal Comfort-Analysis and Application in Environment Engineering; Danish Technology Press: Copenhagen, Denmark, 1970. [Google Scholar]
  4. Kuru, M.; Calis, G. Understanding the Relationship between Indoor Environmental Parameters and Thermal Sensation of users Via Statistical Analysis. Procedia Eng. 2017, 196, 808–815. [Google Scholar] [CrossRef]
  5. ASHRAE Standard 55-2017; Thermal Environmental Conditions for Human Occupancy. ASHRAE: Atlanta, GA, USA, 2017.
  6. De Dear, R.; Brager, G.S. Developing an adaptive model of thermal comfort and preference. ASHRAE Trans. 1998, 1, 145–167. [Google Scholar]
  7. GB/T 50785-2012; Evaluation Standard for Indoor Thermal and Humid Environment in Civil Buildings. China Mohan Huapai Art Seminar: Beijing, China, 2012.
  8. De Dear, R.; Kim, J.; Candido, C.; Deuble, M. Adaptive thermal comfort in Australian school classrooms. Build. Res. Inform. 2015, 43, 383–398. [Google Scholar] [CrossRef]
  9. Zomorodian, Z.S.; Tahsildoost, M.; Hafezi, M. Thermal comfort in educational buildings: A review article. Renew. Sustain. Energy Rev. 2016, 59, 895–906. [Google Scholar] [CrossRef]
  10. Singh, M.K.; Ooka, R.; Rijal, H.B.; Kumar, S.; Kumar, A.; Mahapatra, S. Progress in thermal comfort studies in classrooms over last 50 years and way forward. Energy Build. 2019, 188–189, 149–174. [Google Scholar] [CrossRef]
  11. Haverinen-Shaughnessy, U.; Moschandreas, D.J.; Shaughnessy, R.J. Association between substandard classroom ventilation rates and students’ academic achievement. Indoor Air 2011, 21, 121–131. [Google Scholar] [CrossRef]
  12. Lee, S.C.; Chang, M. Indoor air quality investigations at five classrooms. Indoor Air 1996, 9, 134–138. [Google Scholar] [CrossRef]
  13. Wang, Z.; Li, A.; Ren, J.; He, Y. Thermal adaptation and thermal environment in university classrooms and offices in Harbin. Energy Build. 2014, 77, 192–196. [Google Scholar] [CrossRef]
  14. Wang, Z.; Zhang, X.; Ning, H.; Ji, Y. Human thermal comfort and thermal adaptability in Harbin. J. Harbin Inst. Technol. 2012, 8, 48–52. [Google Scholar]
  15. Sui, X.; Liu, Q.; Li, M.; Liu, J. Analysis on indoor air quality of university classrooms in Xi’an city during heating season. Energy Conserv. 2019, 38, 153–158. [Google Scholar] [CrossRef]
  16. Jiang, J.; Li, W.; Di, Y.H.; Qin, S.L.; Yun, X.X. Evaluation of indoor air quality of teaching buildings in colleges and universities in cold regions. J. Xi’an Polytech. Univ. 2021, 35, 1–8. [Google Scholar] [CrossRef]
  17. Yan, X.; Lei, Y.; Jing, S.; Yin, H. Research of winter indoor thermal environment and thermal comfort of classrooms in colleges and universities in cold regions. J. Huaqiao Univ. 2022, 2, 198–205. [Google Scholar]
  18. Jung, G.J.; Song, S.K.; Ahn, Y.C.; Oh, G.S.; Bin Im, Y. Experimental research on thermal comfort in the university classroom of regular semesters in Korea. J. Mech. Sci. Technol. 2011, 25, 503–512. [Google Scholar] [CrossRef]
  19. Cao, B.; Zhu, Y.; Ouyang, Q.; Zhou, X.; Huang, L. Field study of human thermal comfort and thermal adaptability during the summer and winter in Beijing. Energy Build. 2011, 43, 1051–1056. [Google Scholar] [CrossRef]
  20. Corgnati, S.P.; Filippi, M.; Viazzo, S. Perception of the thermal environment in high school and university classrooms: Subjective preferences and thermal comfort. Build. Environ. 2007, 42, 951–959. [Google Scholar] [CrossRef]
  21. Wang, Z. A field study of the thermal comfort in residential buildings in Harbin. Build. Environ. 2006, 41, 1034–1039. [Google Scholar] [CrossRef]
  22. de Dear, R.J.; Auliciems, A. Validation of the Predicted Mean Vote model of thermal comfort in six Australian field studies. ASHRAE Trans. 1985, 91, 452–468. [Google Scholar]
  23. Goto, T.; Mitamura, T.; Yoshino, H.; Tamura, A.; Inomata, E. Long-term field survey on thermal adaptation in office buildings in Japan. Build. Environ. 2007, 42, 3944–3954. [Google Scholar] [CrossRef]
  24. Kim, J.T.; Lim, J.H.; Cho, S.H.; Yun, G.Y. Development of the adaptive PMV model for improving prediction performances. Energy Build. 2015, 98, 100–105. [Google Scholar] [CrossRef]
  25. Ning, H.; Wang, Z.; Zhang, X.; Ji, Y. Adaptive thermal comfort in university dormitories in the severe cold area of China. Energy Build. 2016, 99, 161–169. [Google Scholar] [CrossRef]
  26. Fang, Z.; Zhang, S.; Cheng, Y.; Fong, A.M.; Oladokun, M.O.; Lin, Z.; Wu, H. Field study on adaptive thermal comfort in typical air conditioned classrooms. Energy Build. 2018, 133, 73–82. [Google Scholar] [CrossRef] [Green Version]
  27. Liu, J.; Yang, X.; Jiang, Q.; Qiu, J.; Liu, Y. Occupants’ thermal comfort and perceived air quality in natural ventilated classrooms during cold days. Build. Environ. 2019, 158, 73–82. [Google Scholar] [CrossRef]
  28. Buonocore, C.; De Vecchi, R.; Scalco, V.; Lamberts, R. Thermal preference and comfort assessment in air-conditioned and naturally-ventilated university classroom under hot and humid conditions in Brazil. Energy Build. 2020, 211, 109783. [Google Scholar] [CrossRef]
  29. GB50178-93; Building Climate Zoning Standards. MOC: Beijing, China, 1993.
  30. GB50189-2015; Design Standard for Energy Efficiency of Public Buildings. MOC: Beijing, China, 2015.
  31. GB/T40233-2021; Instruments for the Measurement of Physical Quantities in the Ergonomics of Thermal Environments. State Administration of Market Supervision: Beijing, China, 2021.
  32. GB/T18883-2002; Indoor Air Quality Standard. State Administration of Market Supervision: Beijing, China, 2002.
  33. Berglund, L.G. Thermal acceptability. ASHRAE Trans. 1979, 85, 825–834. [Google Scholar]
  34. Jing, S.; Lei, Y.; Wang, H.; Song, C.; Yan, X. Thermal comfort and energy-saving potential in university classrooms during the heating season. Energy Build. 2019, 202, 109390. [Google Scholar] [CrossRef]
  35. Guoqiang, Z. Study on the Thermal Environment of University Classroom in Severe Cold Region: Taking Harbin Institute of Technology as an Example; Harbin Institute of Technology: Harbin, China, 2020. [Google Scholar]
  36. ISO 7726-1998; Ergonomics of the Thermal Environment-Instruments for Measuring Physical Quantities. International Organization for Standardization: Geneva, Switzerland, 1998.
  37. GB50736-2012; Design Code for Heating Ventilation and Air Conditioning of Civil Buildings. China Mohan Huapai Art Seminar: Beijing, China, 2012.
  38. Kosonen, R.; Tan, F. Assessment of productivity loss in air-conditioned buildings using PMV index. Energy Build. 2004, 36, 987–993. [Google Scholar] [CrossRef]
  39. GB/T 28591-2012; Wind Scale. State Administration of Market Supervision: Beijing, China, 2012.
  40. Wang, Z.; Ning, H.; Zhang, X.; Ji, Y. Human thermal adaptation based on university students in China’s severe cold area. Sci. Technol. Built Environ. 2017, 23, 413–420. [Google Scholar] [CrossRef]
  41. Miao, P. Humidity effect on comfort. Contam. Control. Air-Cond. Technol. 2003, 4, 13–16. [Google Scholar]
  42. Yu, J.; Ouyang, Q.; Zhu, Y.; Shen, H.; Cao, G.; Cui, W. A comparison of the thermal adaptability of people accustomed to air-conditioned environments and naturally ventilated environments. Indoor Air 2012, 22, 110–118. [Google Scholar] [CrossRef] [PubMed]
  43. Ji, W.; Cao, B.; Zhu, Y. Indoor thermal and humidity environment and thermal adaptation in different heating periods of North China. Heat. Vent. Air Cond. 2019, 49, 103–107. [Google Scholar]
  44. Haoran, N. Research on Human Thermal Comfort and Thermal Adaptation in Heating Building Environments in Severe Cold Area. Ph.D. Thesis, Harbin Institute of Technology, Harbin, China, 2017. [Google Scholar]
Figure 1. Winter temperature map of Shenyang for 2021 (data source: https://zh.weatherspark.com/ accessed on 1 February 2022).
Buildings 12 00912 g001
Figure 2. The studied classroom. (a) Floor plan of the location of the studied classroom, (b) interior view of the classroom, (c) heating radiator.
Buildings 12 00912 g002
Figure 3. Wall structure.
Buildings 12 00912 g003
Figure 4. Location plan of the measuring points.
Buildings 12 00912 g004
Figure 5. Test instruments: (a) Hot-wire anemometer, (b) temperature and humidity meter, (c) black globe thermometer.
Buildings 12 00912 g005
Figure 6. Outdoor temperature change from 14:00 to 15:00 on 1 November 2019–19 December 2021.
Buildings 12 00912 g006
Figure 7. Outdoor relative humidity variation from 14:00 to 15:00 on 1 November 2019–19 December 2021.
Buildings 12 00912 g007
Figure 8. Outdoor temperature change from 14:00 to 15:00 on 1 November–19 December 2021.
Buildings 12 00912 g008
Figure 9. Outdoor relative humidity variation from 14:00 to 15:00 on 1 November–19 December 2021.
Buildings 12 00912 g009
Figure 10. Temperature variation in the classroom (idle).
Buildings 12 00912 g010
Figure 11. Relative humidity variation in the classroom (idle).
Buildings 12 00912 g011
Figure 12. Temperature variation in the classroom (lecture state).
Buildings 12 00912 g012
Figure 13. Relative humidity variation in the classroom (lecture state).
Buildings 12 00912 g013
Figure 14. Temperature change in the idle state.
Buildings 12 00912 g014
Figure 15. Relative humidity change in the idle state.
Buildings 12 00912 g015
Figure 16. Temperature change during lectures.
Buildings 12 00912 g016
Figure 17. Relative humidity change during lectures.
Buildings 12 00912 g017
Figure 18. Thermal environment parameters of two kinds of heat exposure during lectures.
Buildings 12 00912 g018
Figure 19. Relationship between TSV and TCV during lectures.
Buildings 12 00912 g019
Figure 20. MTSV and PMV fitting curves.
Buildings 12 00912 g020
Figure 21. Relationship between TCV and seat area.
Buildings 12 00912 g021
Figure 22. Relationship between gender and thermal comfort.
Buildings 12 00912 g022
Table 1. Research on human thermal comfort and adaptation in different regions.
Survey TimeResearcherSurvey LocationArchitectural EnvironmentNeutral Temperature/°C
1984de Dear [22]AustraliaOffice buildings24.2
2003–2005Goto [23]JapanOffice buildings26.0
2010–2011ZJ Wang [14]ChinaEducational buildingsSpring: 21.7
Winter: 22.6
2011Kim [24]South KoreaOffice buildings23.5
2016Ning [25]ChinaEducational buildings19.7–23.2
2018Fang [26]ChinaEducational buildings24
2019Liu [27]ChinaEducational buildings20.6
2020Carolina [28]BrazilEducational buildings23–24
Table 2. Thermal properties of building envelopes.
EnvelopeMaterialHeat Transfer Coefficient (W/m2·K)
WallFigure 30.29
WindowHollow glass (air thickness 12 mm)2.41
Table 3. Specifications of sensors for measuring indoor climatic parameters.
ParameterSensorMeasurement RangeAccuracy
Air temperatureTemperature and humidity meter−20~85 °C±0.3 °C
Relative humidity0~100%±1.5%
Global temperatureBlack globe thermometer5~120 °C±0.5 °C
Air velocityHot-wire anemometer0.3~30 m/s±3%
Table 4. Scales used to measure subjective response to environmental variables.
ScaleThermal Sensation Vote (TSV)Thermal Comfort Vote (TCV)Temperature/Relative Humidity ExpectationWind Speed Perception
3hot--
2warm--
1slightly warm-reduceslightly perception
0neutralcomfortableunchangedno perception
−1slightly coolslightly uncomfortablerise-
−2cooluncomfortable-
−3coldvery uncomfortable-
−4-extremely uncomfortable-
Table 5. Summary of the indoor physical environment.
NumberTimeTa/°CTg/°CRH/%V/m·s−1
1 (idle)7 December 2021, 14:00–15:0020.820.219.60.02
2 (idle)8 December 2021, 14:00–15:0020.520.119.70.03
3 (idle)9 December 2021, 14:00–15:0020.820.719.30.01
4 (lecture)7 December 2021, 14:00–15:0024.925.630.90.02
5 (lecture)8 December 2021, 14:00–15:0023.626.230.40.02
6 (lecture)9 December 2021, 14:00–15:0024.325.730.60.02
Table 6. Indoor environment parameters.
Parameterta(i)/°CRH(i)/%Tg(i)/°CV(i)/m·s−1Top(i)/°CRcl/m2·K·W−1
max(idle)21.919.924.60.0323.3-
min(idle)19.619.120.70.0120.1-
average(idle)20.719.522.70.0221.7-
standard deviation(idle)1.150.41.950.001.55-
max(lecture)25.933.529.50.0227.70.32
min(lecture)23.928.223.10.0223.50.16
average(lecture)24.930.826.30.0225.60.24
standard deviation(lecture)12.73.20.002.10.08
Table 7. Relationship between TCV, temperature, and relative humidity expectation.
Extremely Uncomfortable (7 People)Very Uncomfortable (4 People)UNCOMFORTABLE (15 People)
T(h), RH(un) 1
T(h), RH(h)1 1
T(h), RH(l)1 2
T(l), RH(un) 1
T(l), RH(h)436
T(l), RH(l)1 1
T(un), RH(un) 3
T(un), RH(h) 1
T(un), RH(l)
total7415
T-temperature, RH-relative humidity, (h)-higher, (un)-unchanged
Table 8. Summary of the students’ sex in the field survey.
Subjects Number%
Total 133
Sexmale3425.6%
female9974.4%
Publisher’s Note: MDPI stays neutral with regard to jurisdictional claims in published maps and institutional affiliations.

