Article

Effect of Posidonia oceanica Fibers Addition on the Thermal and Acoustic Properties of Cement Paste

by
Omrane Benjeddou
1,*,
Malek Jedidi
2,3,
Mohamed Amine Khadimallah
1,4,
Gobinath Ravindran
5,* and
Jayaprakash Sridhar
6
1
Civil Engineering Department, College of Engineering, Prince Sattam bin Abdulaziz University, Alkharj 16273, Saudi Arabia
2
Department of Civil Engineering, Higher Institute of Technological Studies of Sfax, Sfax 3099, Tunisia
3
Civil Engineering Laboratory, National Engineering School of Tunis, University of Tunis El Manar, Tunis 1068, Tunisia
4
Laboratory of Systems and Applied Mechanics, Polytechnic School of Tunisia, University of Carthage, Tunis 1054, Tunisia
5
Civil Engineering Department, SR University, Warangal 506371, Telangana, India
6
Department of Civil Engineering, GMR Institute of Technology, Rajam 532127, Andhra Pradesh, India
*
Authors to whom correspondence should be addressed.
Buildings 2022, 12(7), 909; https://doi.org/10.3390/buildings12070909
Submission received: 4 May 2022 / Revised: 8 June 2022 / Accepted: 16 June 2022 / Published: 27 June 2022
(This article belongs to the Special Issue Acoustics of Buildings)

Abstract

:
The present work focused on the experimental study of the mechanical, thermal and acoustic properties of cement composite reinforced using Posidonia oceanica (PO) fibers. For this purpose, parallelepipedic specimens of dimensions 270 mm × 270 mm × 40 mm and cubic specimens of dimensions 150 mm × 150 mm × 150 mm were prepared with a water-to-cement ratio of 0.50 by varying the volume of fibers (Vf) from 0% to 20%. Properties such as compressive strength, thermal conductivity, thermal diffusivity, standardized level difference and sound transmission class were examined. The compressive strength of the specimens was determined using the rebound hammer test, while the thermal measurements were performed with the steady-state box method. The results showed that the addition of PO fibers improved the compressive strength of the mixtures and produced a maximum value of 33.60 MPa for a 10% volume of fiber content. Thermal conductivity and thermal diffusivity decreased significantly with the addition of fibers for all the mixtures. The experimental investigation also showed that the sound transmission class of PO-fiber-reinforced cementitious composites decreased as the fiber volume increased due to an increase in air voids in the mixtures.

1. Introduction

The Mediterranean Sea is one of the areas in the world where the phenomenon of marine litter is the most important environmental problem (about 80% of which is plastic litter); the accumulation of this waste along coastal areas compromises the integrity of coastal ecosystems and represents a problem for economic activities (fishing, tourism, etc.). On the other hand, the deposits of PO, which represent a natural resource found on the beaches of the Mediterranean, can determine criticalities in tourism if they are not properly managed [1].
Posidonia oceanica is found as small balls on the sea bed carried by waves. These balls can be effective natural fibers for enhancing the properties of concrete [2].
Life cycle analysis shows that when Posidonia fibers are used as insulation, their environmental impact is very low. Today, many insulation materials are derived from crude oil, while there is growing market potential for renewable resources in Europe. The use of PO fibers represents an alternative solution to petroleum-derived products and, at the same time, guarantees energy-efficient insulation of buildings [3].
In view of their ecological interest, it is guaranteed that these natural fibers will meet with growing success in the years to come. Compared with other natural fibers, seaweed clusters have an undeniable advantage, as they are not produced using agricultural or forestry processes and, therefore, will not compete with the food industry for use of available land. In addition, the materials produced from Mediterranean Posidonia are suitable for both thermal and acoustic insulation, are resistant to fire and mold, and therefore, do not require any chemical treatment [4]. Natural fibers can be used as insulating materials in construction for environmental and economic reasons given their low cost, their biodegradability and their availability [5].
Cementitious materials are generally considered quasi-brittle materials with low tensile strength and low toughness, which leads to cracking in concrete structures. Reinforcement of cementitious matrices with fibers is an effective and commonly used method for controlling cracking in the material [6,7]. Many researchers have studied the effect of the incorporation of fibers on the properties of composites of cement. In the work of Korjenic et al. [8], a comparison between the bending behavior of cement paste alone and that reinforced with 16% hemp fibers was made. The results showed that the material became more ductile with the addition of fibers. Reis [9] showed in his study that reinforcing concrete with natural coconut fibers and sugar cane fibers increases the flexural strength by 25% and 3.5%, respectively. Nevertheless, a decrease in flexural strength was observed with banana fibers. Comak et al. [10] studied the mechanical properties of a mortar reinforced with several fractions of hemp fibers; they noticed a 17% increase in flexural strength for the 3% mass fraction of hemp fibers. Allegue et al. [11] studied the effect of incorporating Posidonia fibers on the mechanical properties of cement. Three-point bending and compression tests were carried out by varying the water-to-cement ratio and the level of fiber reinforcement. The authors observed an improvement in the mechanical characteristics of composites reinforced with Posidonia fibers compared with conventional cementitious materials. Indeed, the specimens tested presented a lower density, a better flexural strength and a higher ductility.
An experimental study was carried out by Hamdaoui et al. [12] on natural PO fibers for use as thermal insulation material in Mediterranean construction. The results of the tests carried out on twenty samples of untreated fibers gave an average thermal conductivity value of 0.049 W·m−1·K−1 and an average thermal diffusivity of 0.92 ×10⁻⁶ m2·s−1. These values are close to conventional insulation materials. Concrete composites with PO fibers ranging from 5% to 10% have higher compressive strengths; the strength properties decrease with a further increase in the volume fraction of fibers due to agglomeration [13]. The mechanical properties of chemically treated jute and bamboo fibers increase for fiber addition up to 1.5% when compared with concrete without fibers [14].
An experimental study was conducted by Jedidi et al. [15] to evaluate the mechanical and thermophysical properties of a mixture of plaster and PO fibers. Parallelepipedal and prismatic specimens were prepared by varying the percentage of fibers from 0% to 20%. The mechanical (compressive strength, flexural strength) and physical (thermal conductivity and thermal diffusivity) properties were studied. The density of the different test samples was determined for fiber percentages ranging from 0% to 20%. From the results, the authors noticed an improvement in compressive and flexural strength for the different fiber-reinforced blends. A considerable reduction in thermal conductivity and thermal diffusivity was noticed for the different mixtures. The authors also noticed that the optimal mechanical properties are reached for a fiber percentage ranging from 5 to 10% by volume.
Hamdaoui et al. [13] studied the thermal and mechanical properties of a hardened cement paste reinforced with PO fibers with volume fractions varying from 0% to 20%. The thermal conductivity, the tensile and compressive strength, and the variation in tenacity as a function of the volume fraction of the fibers and the geometric characteristics of the samples were estimated using the simplified models developed. The authors observed an improvement in the insulating properties of the material with the addition of PO fibers. The thermal conductivity was reduced by 22% (from 0.0718 W·m−1·K−1 to 0.559 W·m−1·K−1) with the addition of 20% of fibers compared with the control cement paste. For fiber volume fractions between 5 and 10%, an increase in flexural and compressive strength was observed through a simplified model and SEM observations. The authors also developed simplified analytical models to predict the thermal conductivity, tensile and compressive strengths, and fracture toughness. These models were validated with experimental data.
In building systems, materials are widely used for their acoustic properties. They can be used to reduce the transmission of airborne noise, minimize impact noise or improve the acoustic correction of a room. Research is required to determine the acoustic performance of a material and, therefore, know its appropriate implementation (placed in a partition, glued to a wall in an apparent way, underlay glued under tiling or laid under screed).
The objective of this study was to understand the influence of PO fibers on the mechanical properties of concrete. The volume fraction of PO fibers considered for this study varied from 0% to 20%. Moreover, the thermal and acoustics tests were conducted to evaluate the thermal conductivity, thermal diffusivity, standardized level difference and sound transmission class.

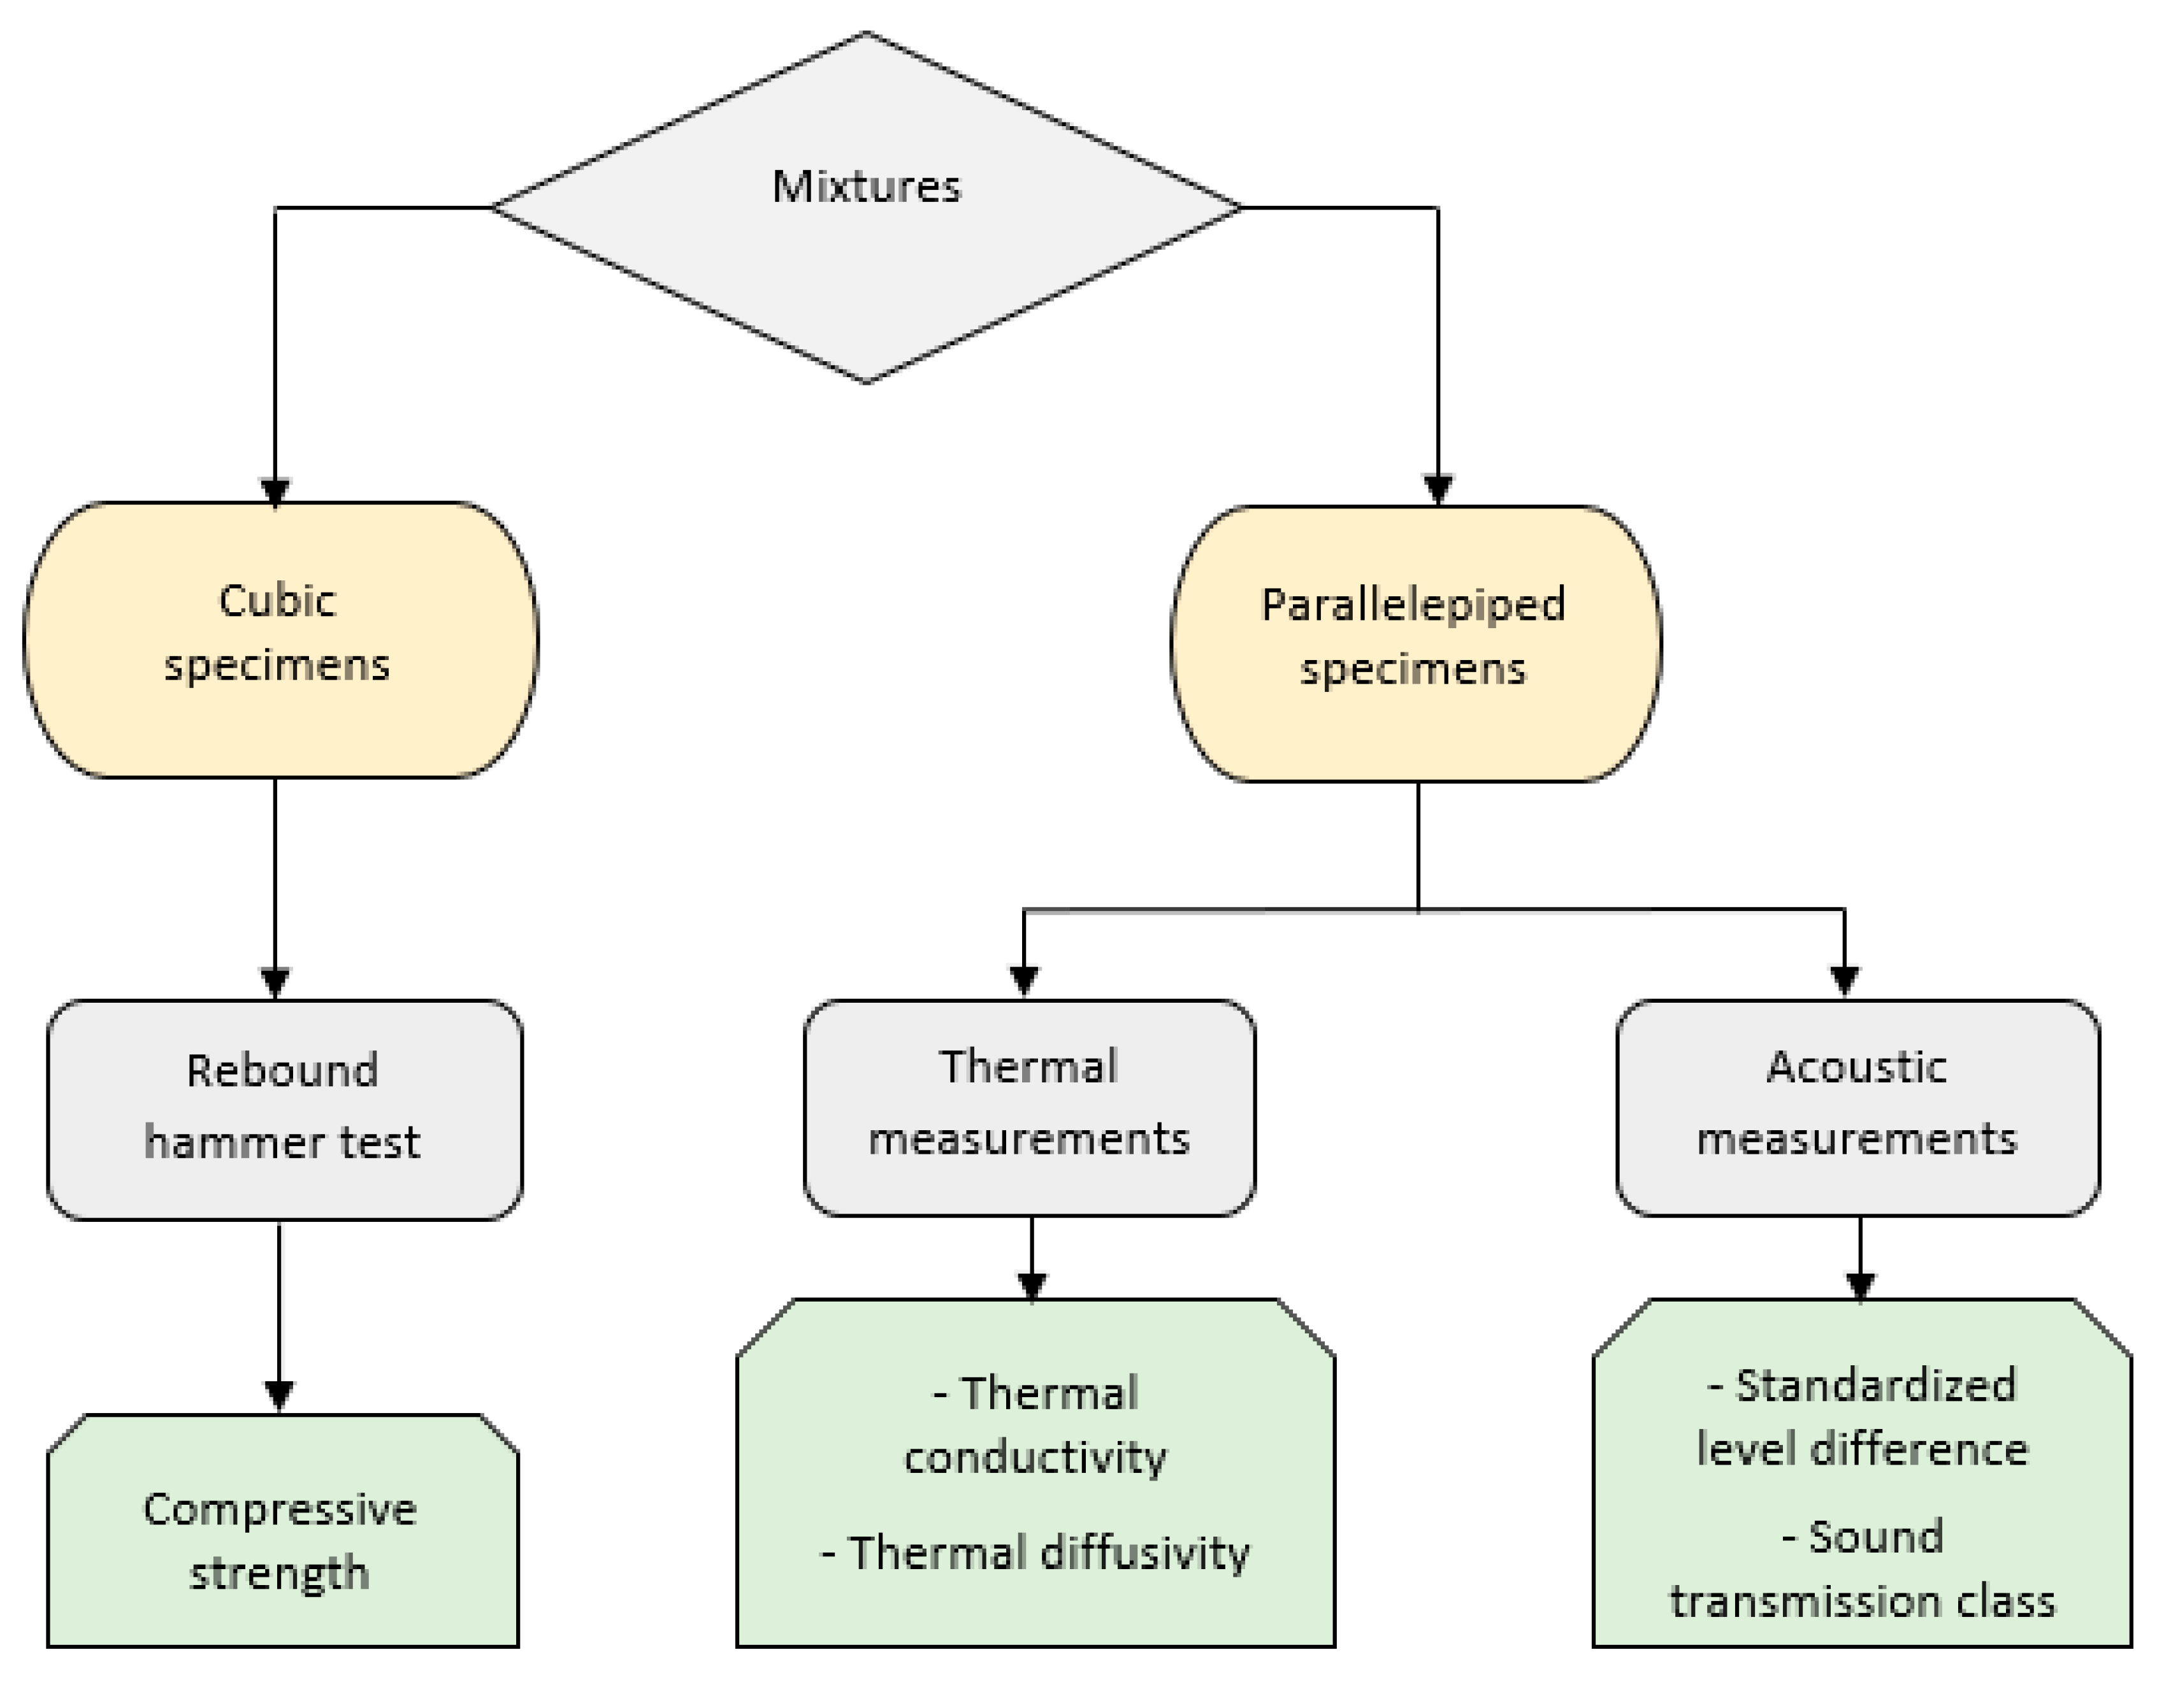
2. Experimental Program

Fiber-reinforced concrete mixes were prepared by varying the volume fractions of fibers (Vf): 0%, 5%, 10%, 15% and 20%. The mixing was carried out mechanically at low speed with clean equipment. The cement powder was initially mixed dry with the PO fibers until a homogeneous mixture was obtained. Then, water was poured slowly into the mixture with a water/cement (W/C) ratio equal to 0.50 and the mixing continued for two minutes until the mixture was homogenized. The molds were carefully cleaned of all impurities and a layer of liquid oil was applied to the interior surfaces of the molds to facilitate demolding (Figure 1).
Parallelepipedic specimens of dimensions 270 mm × 270 mm × 40 mm were prepared for the thermal and acoustic tests, while cubic specimens of dimensions 150 mm × 150 mm × 150 mm were prepared for the Schmidt rebound hammer test. For each test, three samples were prepared to take an average value. After 24 h, the samples were carefully removed from their molds and stored in the laboratory at room temperature of 20 ± 2 °C. Figure 2 shows the flow chart of the experimental study.

3. Materials and Methods

3.1. Materials

3.1.1. Cement

The cement used in this study was CEMI 42.5N, in conformity with European standard EN 197-1:2000. The cement was of the Artificial Portland type without addition, resulting from the fine grinding of Portland clinker (95% at least), limestone filler (5% at most) and gypsum in appropriate proportions. The main physical and mechanical characteristics of the cement, as well as the chemical composition, are indicated in Table 1. The measurement of the compressive strength at 28 days was carried out on prismatic specimens of dimensions 40 × 40 × 160 mm3 according to EN 196-1 [16].

3.1.2. Posidonia oceanica Fibers

Posidonia oceanica (PO) is an underwater plant found on beaches in the form of balls, which are agglomerates of fibers (Figure 3a). They were mechanically ground to extract the fibers (Figure 3b). Then, these fibers were thoroughly washed with distilled water in order to remove sand, impurities and other waste. The lean fibers were dried in an oven at a temperature of 40 °C for 24 h and stored under normal conditions.
The physical characteristics of the fibers used are given in Table 2.
PO fibers can be considered as natural composites consisting essentially of cellulose fibrils (48.40%) that are held together by a matrix composed mainly of lignin (23.12%) and hemicellulose (18.90%). A raw Posidonia fiber comprises several fibrils that are partially linked together by a weak pectin and lignin interphase [12]. The Posidonia fibers used in this study had an average diameter of 80 ± 5 µm and a length of about 10 mm. The tensile stress was about 5 MPa. According to the observations of Taoukil et al. [17], PO fibers have a rough surface due to the presence of lignin, pectin, wax and vegetable oils that coat the fiber surface.

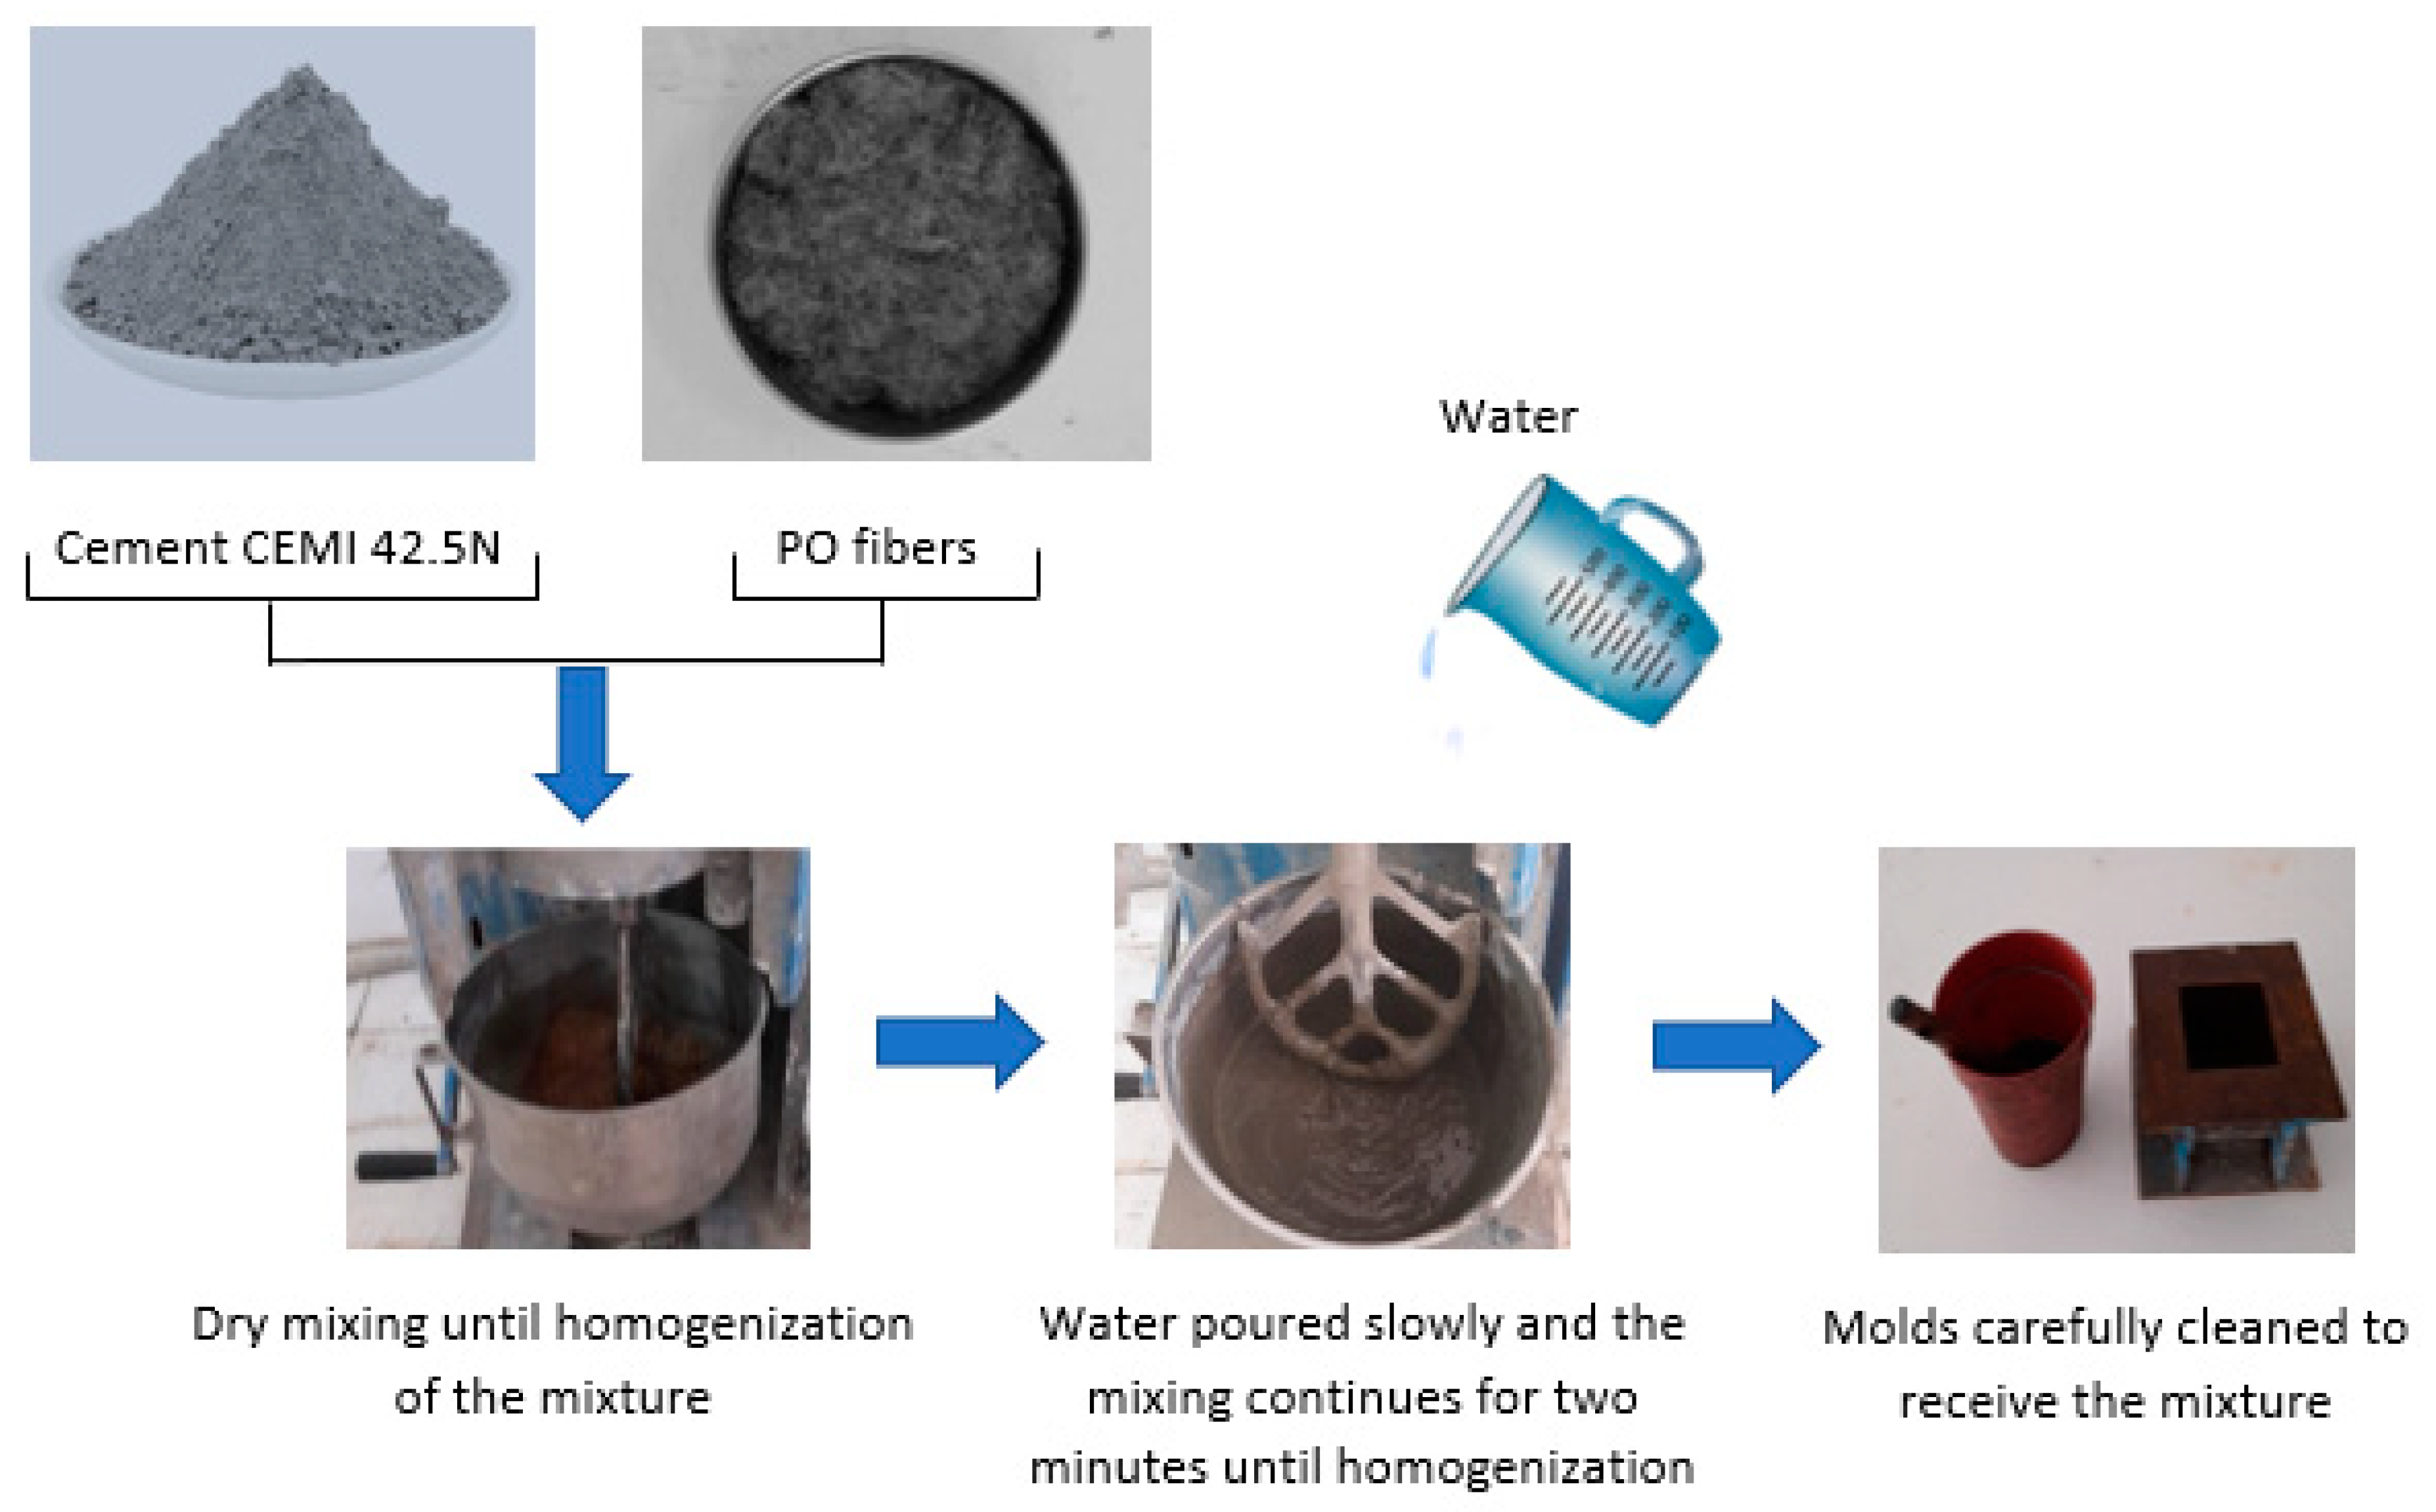
3.2. Experimental Tests

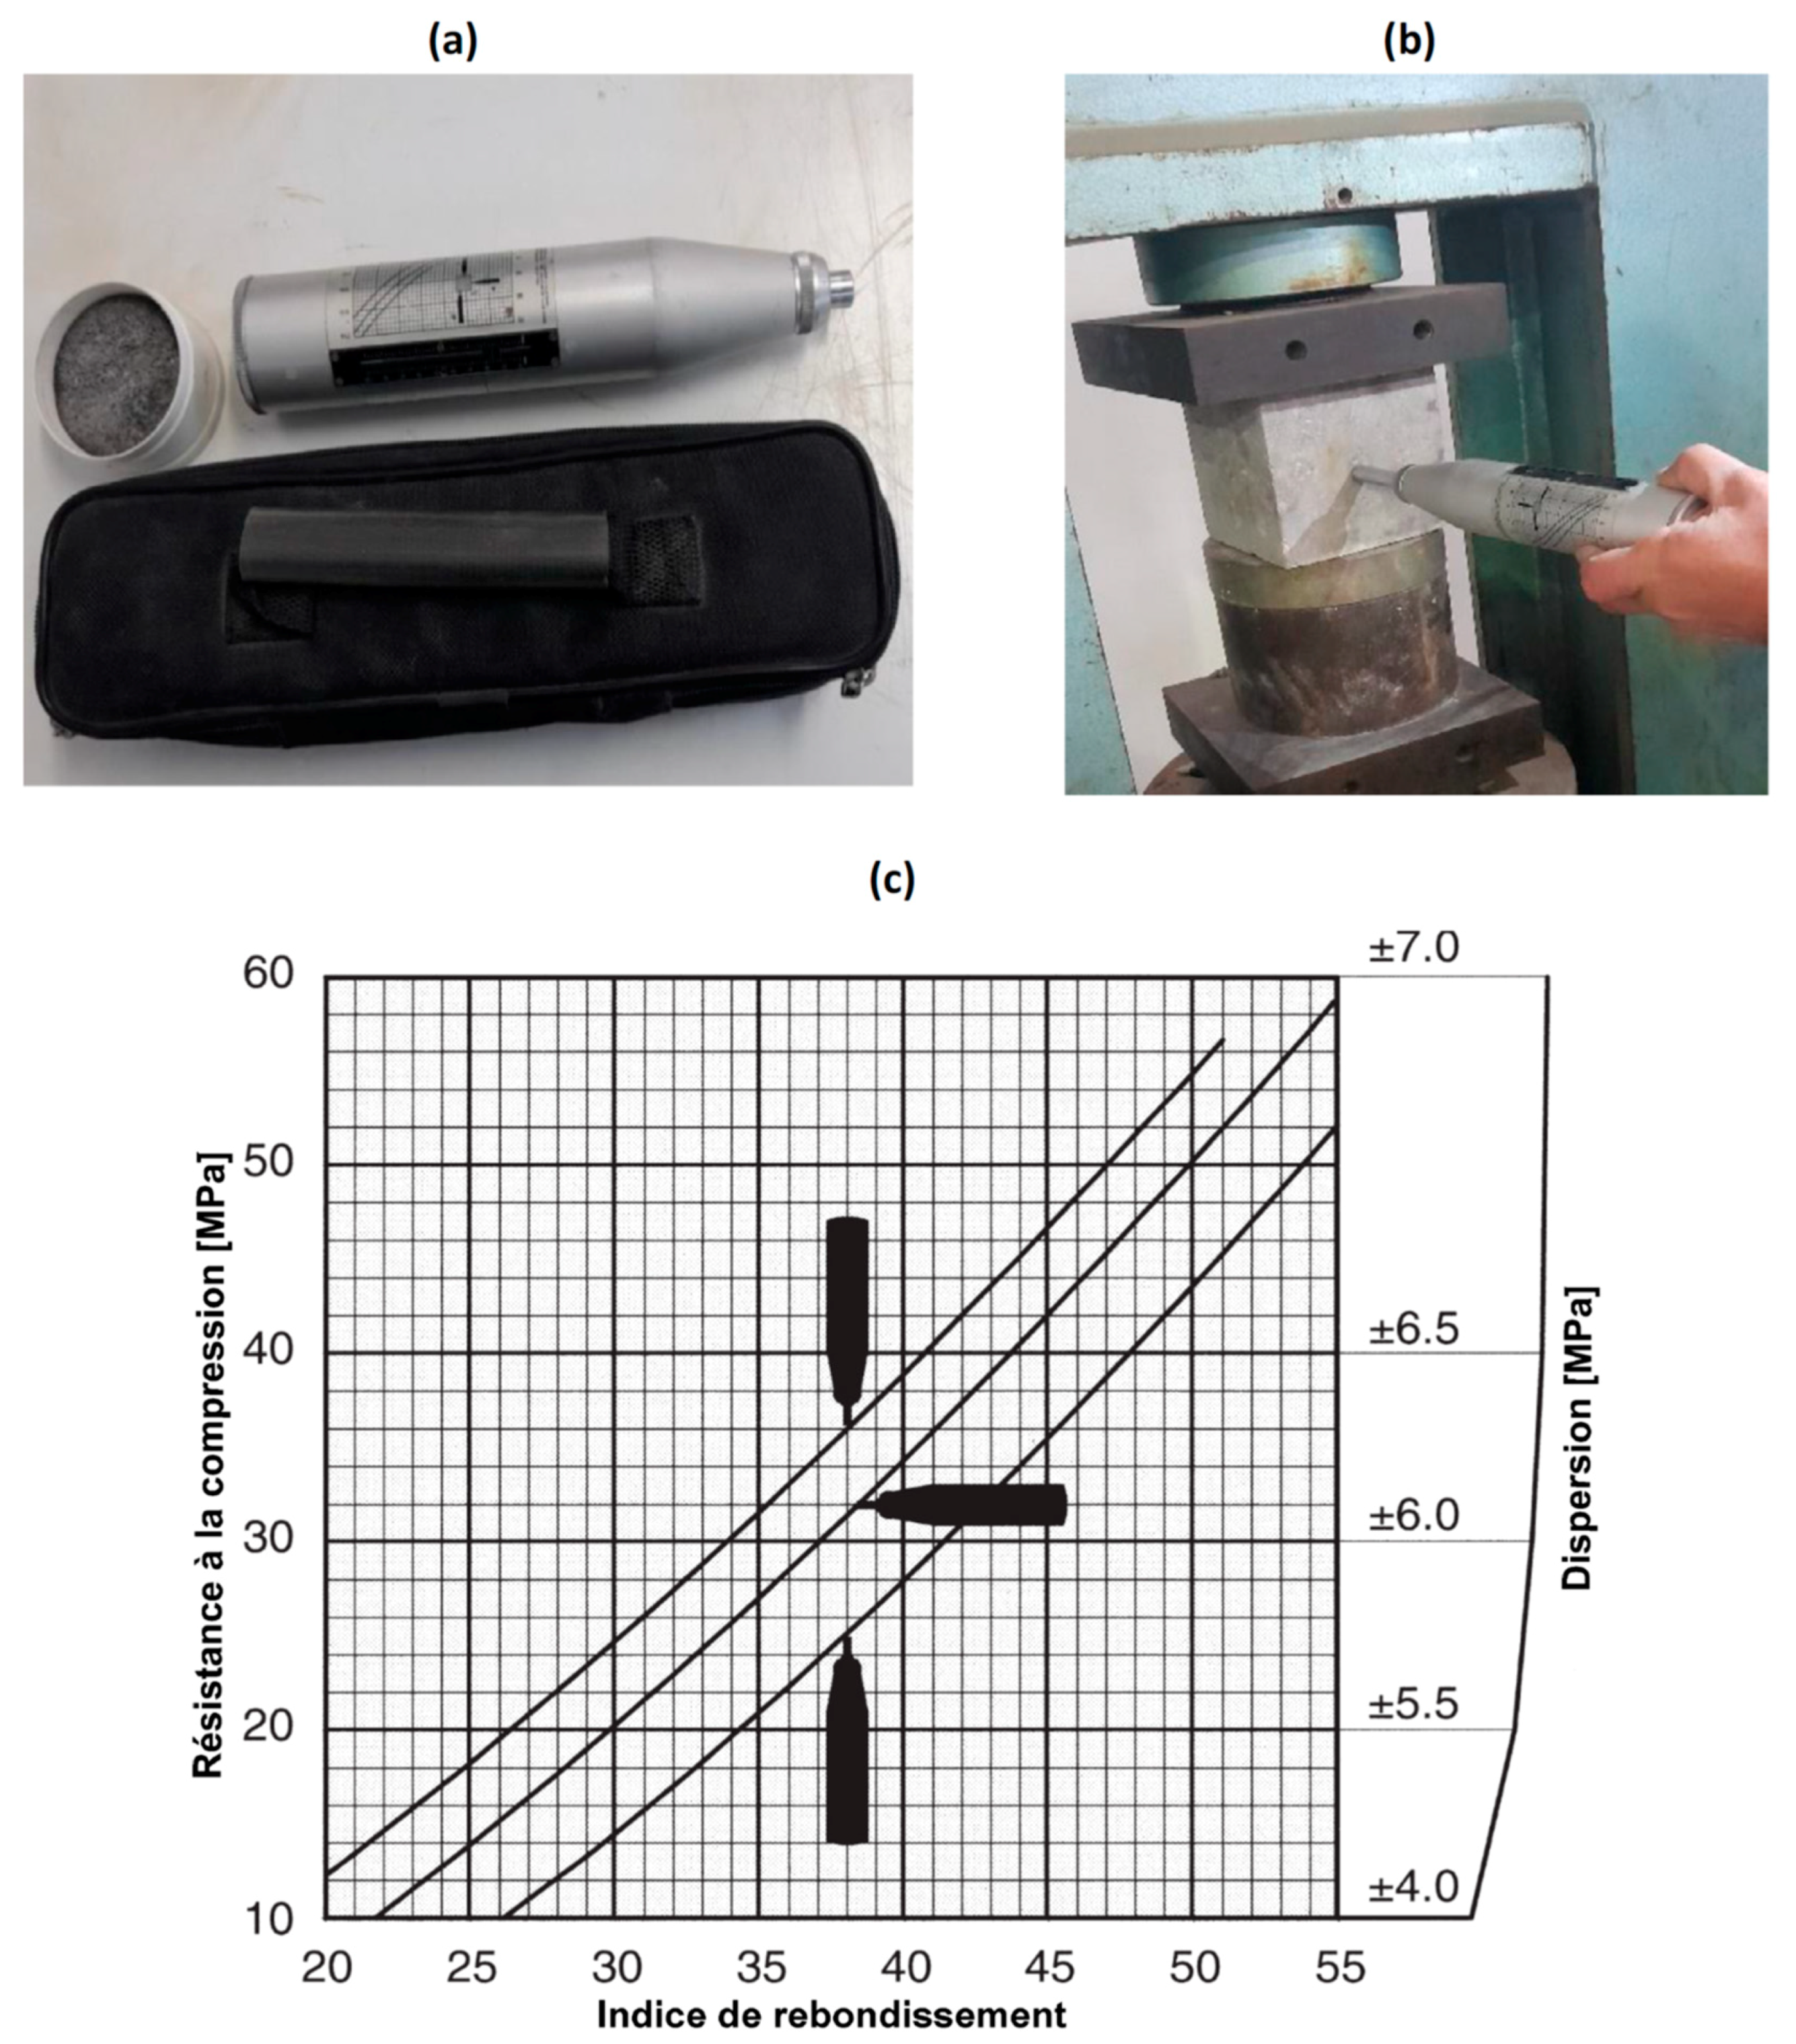
3.2.1. Schmidt Rebound Hammer Test

The Schmidt rebound hammer test makes it possible to test the homogeneity of the concrete in situ and to obtain a rapid estimate of the compressive strength of the concrete of a structure without taking samples of hardened concrete viacore drilling. The principle of this test is to project a mass onto the concrete surface to determine the rebound value RN and translate it into the compressive strength value of the material tested using the chart (Figure 4c) provided with the device [18].
The rebound hammer test was carried out on cubic specimens of dimensions 150 × 150 × 150 mm according to the requirements of EN 12504-2 [19] and EN 12309-3 [20]. During the test, the Schmidt rebound hammer must be perpendicular to the surface of the specimen to be tested. Nine measurements were made on each surface. If the surface is rough, it should be rubbed smooth with a carborundum stone (Figure 4a). The distance between two measurement points should be at least 30 mm and no point should be less than 30 mm from one of the edges of the surface to be tested. The RN rebound value found was the median of the nine measurements.

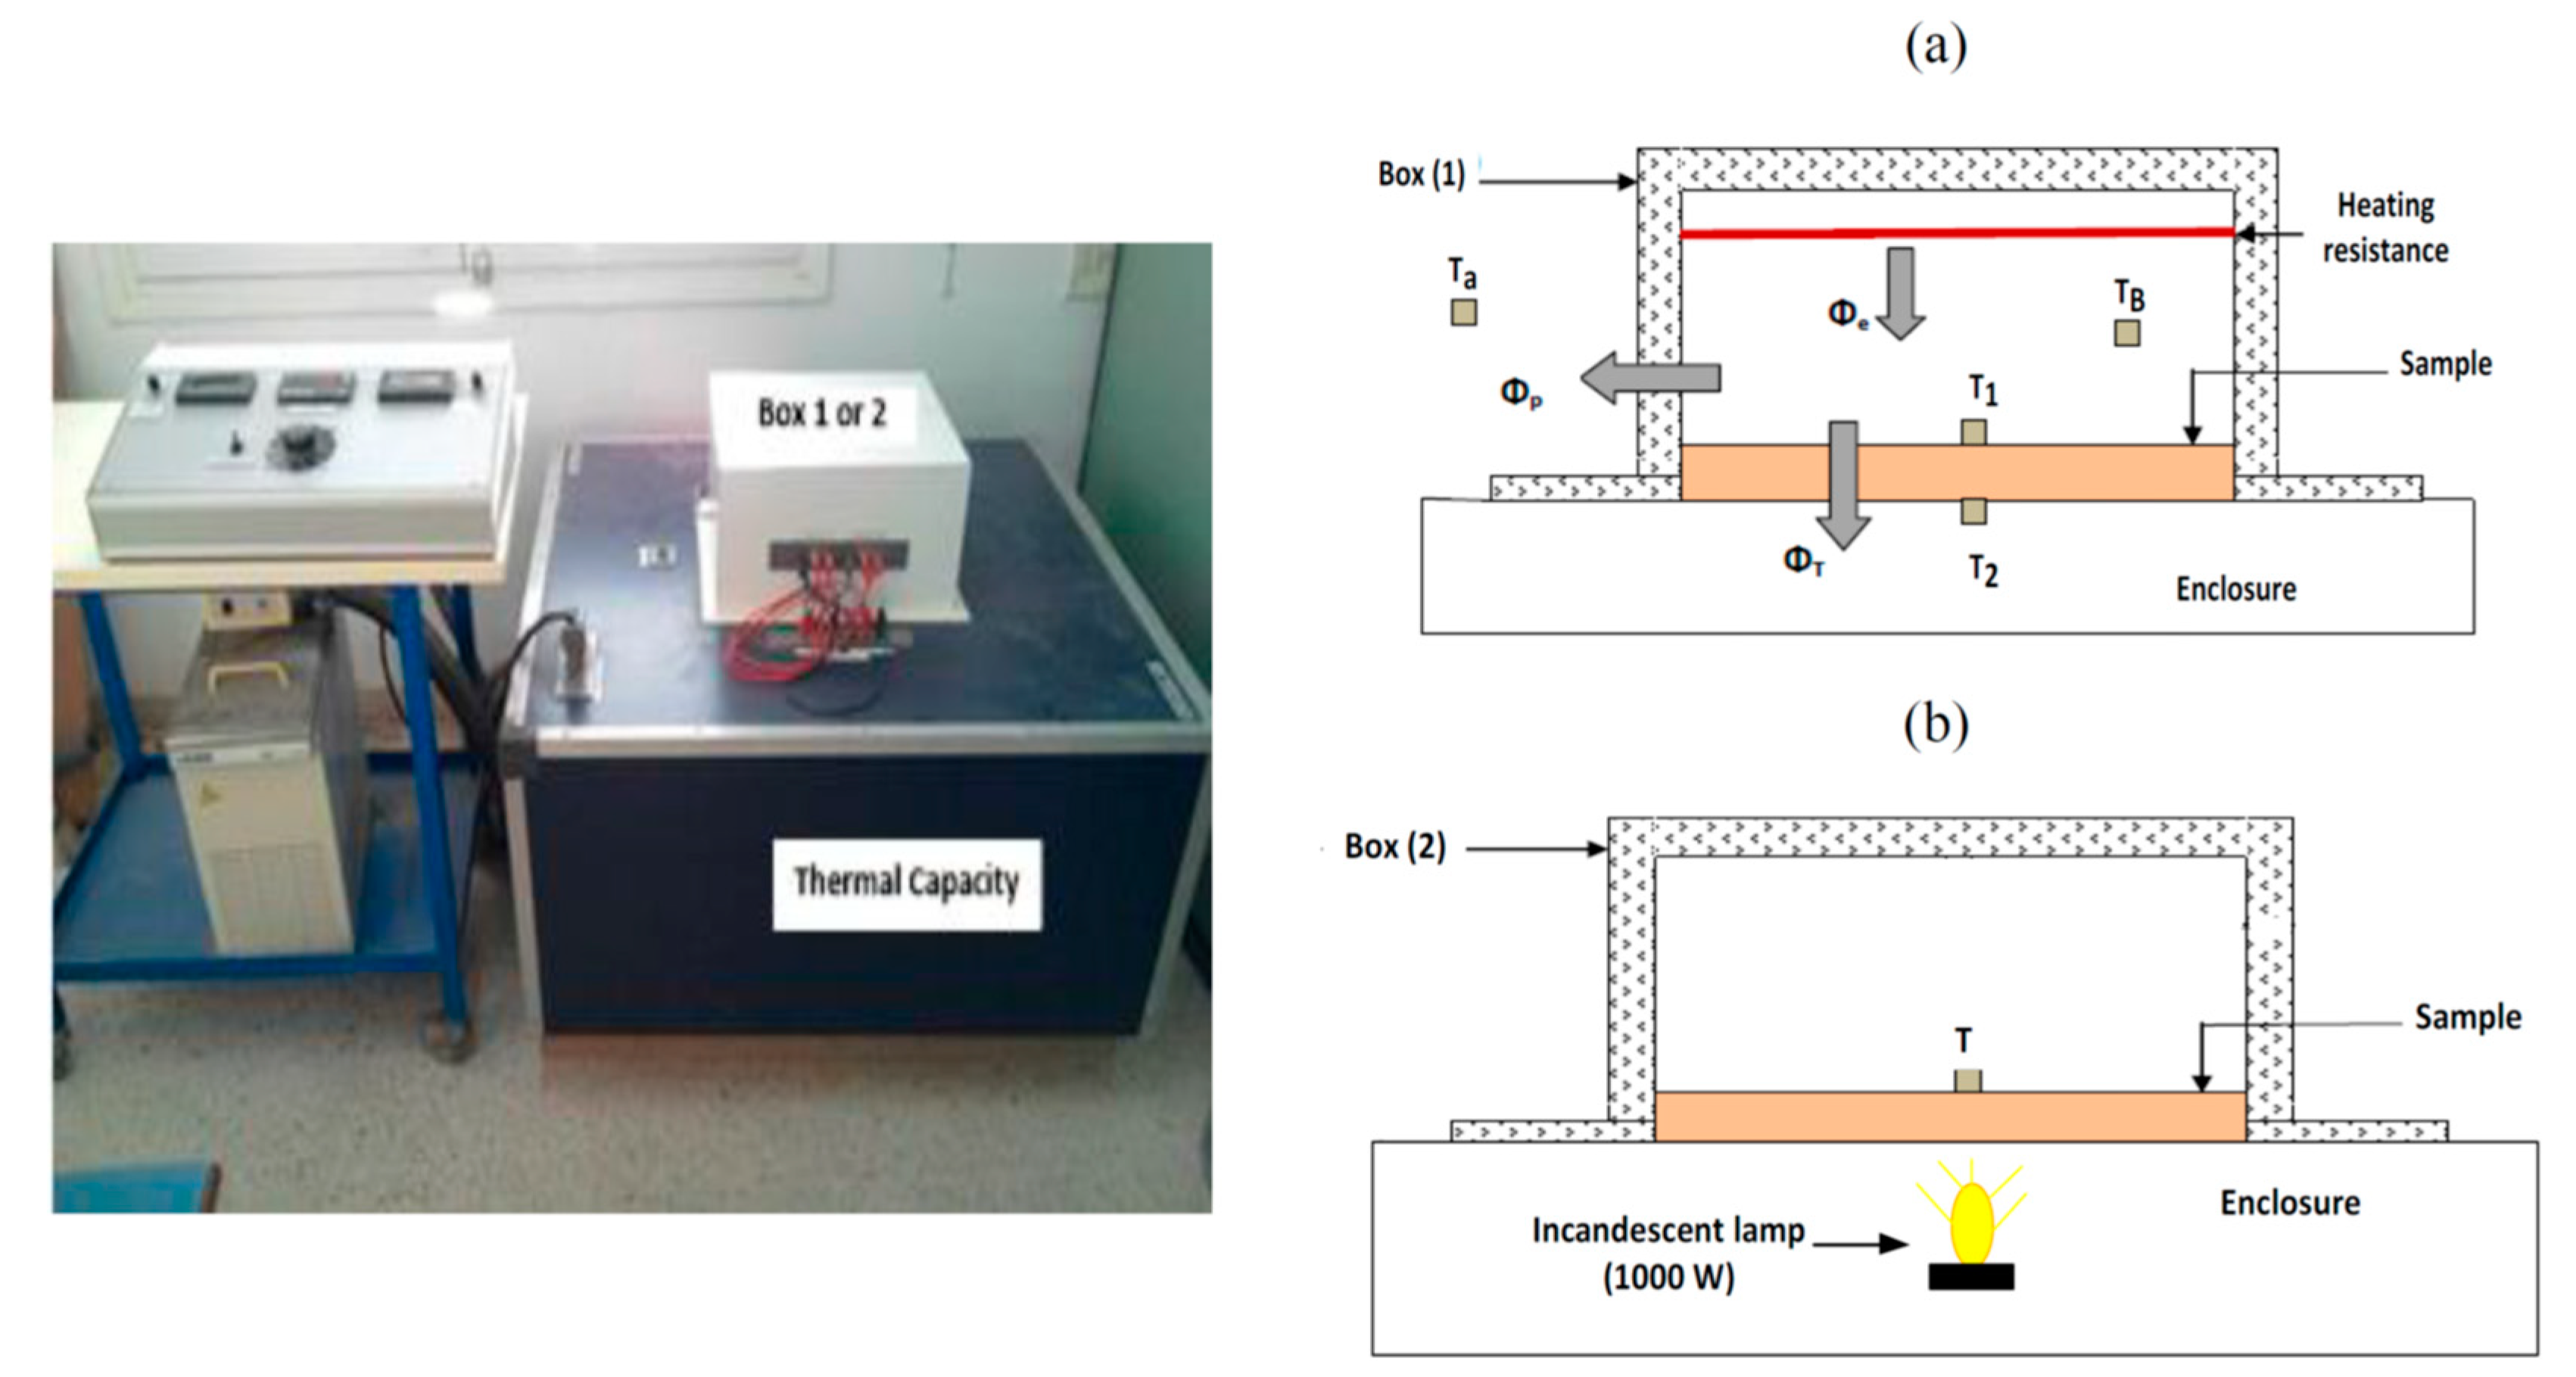
3.2.2. Thermal Conductivity Test

The thermal conductivity measurements were carried out using the box method in accordance with the requirements of EN ISO 8990 [21]. This technique has the advantage of guaranteeing good repeatability for large specimens, as well as a cost of execution time and acceptable measurement uncertainties. The device was used to measure the thermal conductivity of materials with a surface area of 270 mm × 270 mm and thickness of up to 50 mm at temperatures ranging from −30 °C to 90 °C and for conductivities ranging from 0.002 W·m−1·K−1 to 2 W·m−1·K−1 (Figure 5).
When the regime is steady, the thermal conductivity can be evaluated usingthe following formula (Equation (1)) [20]:
λ exp = e S · ( T 1 T 2 ) [ V 2 R C · ( T B T a ) ]
where T1 − T2: difference of temperature between the hot side and the cold side of the sample (K), TB − Ta: difference of temperature between the inside and the outside of the box (K), S: sample section (m2), e: sample thickness (m), V: potential difference (V), R: resistance (Ω) and C: coefficient of box losses (W K−1).

3.2.3. Thermal Diffusivity Measurement

The thermal diffusivity was measured using the same device as that used for the measurement of the thermal conductivity. A 1000 W incandescent lamp was placed on the upper face of box (2) in place of the heating resistor (Figure 5b). To homogenize the flux on the irradiated face of the sample, the box was fitted with reflective internal faces.
The measurement of thermal diffusivity consists of emitting a heat flux on one side of the sample for a few seconds using the lamp, then evaluating the variation in temperature of the non-irradiated side of the sample [22]. The thermal diffusivity can be determined according to the Degiovanni model based on the partial time method [23] using the following equation:
α = α 1 / 2 + α 2 / 3 + α 1 / 3 3
where
α 1 / 2 = e 2 [ 0.761 t 5 / 6 0.926 t 1 / 2 ( t 5 / 6 ) 2 ]
α 2 / 3 = e 2 [ 1.150 t 5 / 6 1.250 t 2 / 3 ( t 5 / 6 ) 2 ]
α 1 / 3 = e 2 [ 0.617 t 5 / 6 0.862 t 1 / 3 ( t 5 / 6 ) 2 ]
where ti/j: the time corresponding to the ratio i/j of the maximum temperature (s).

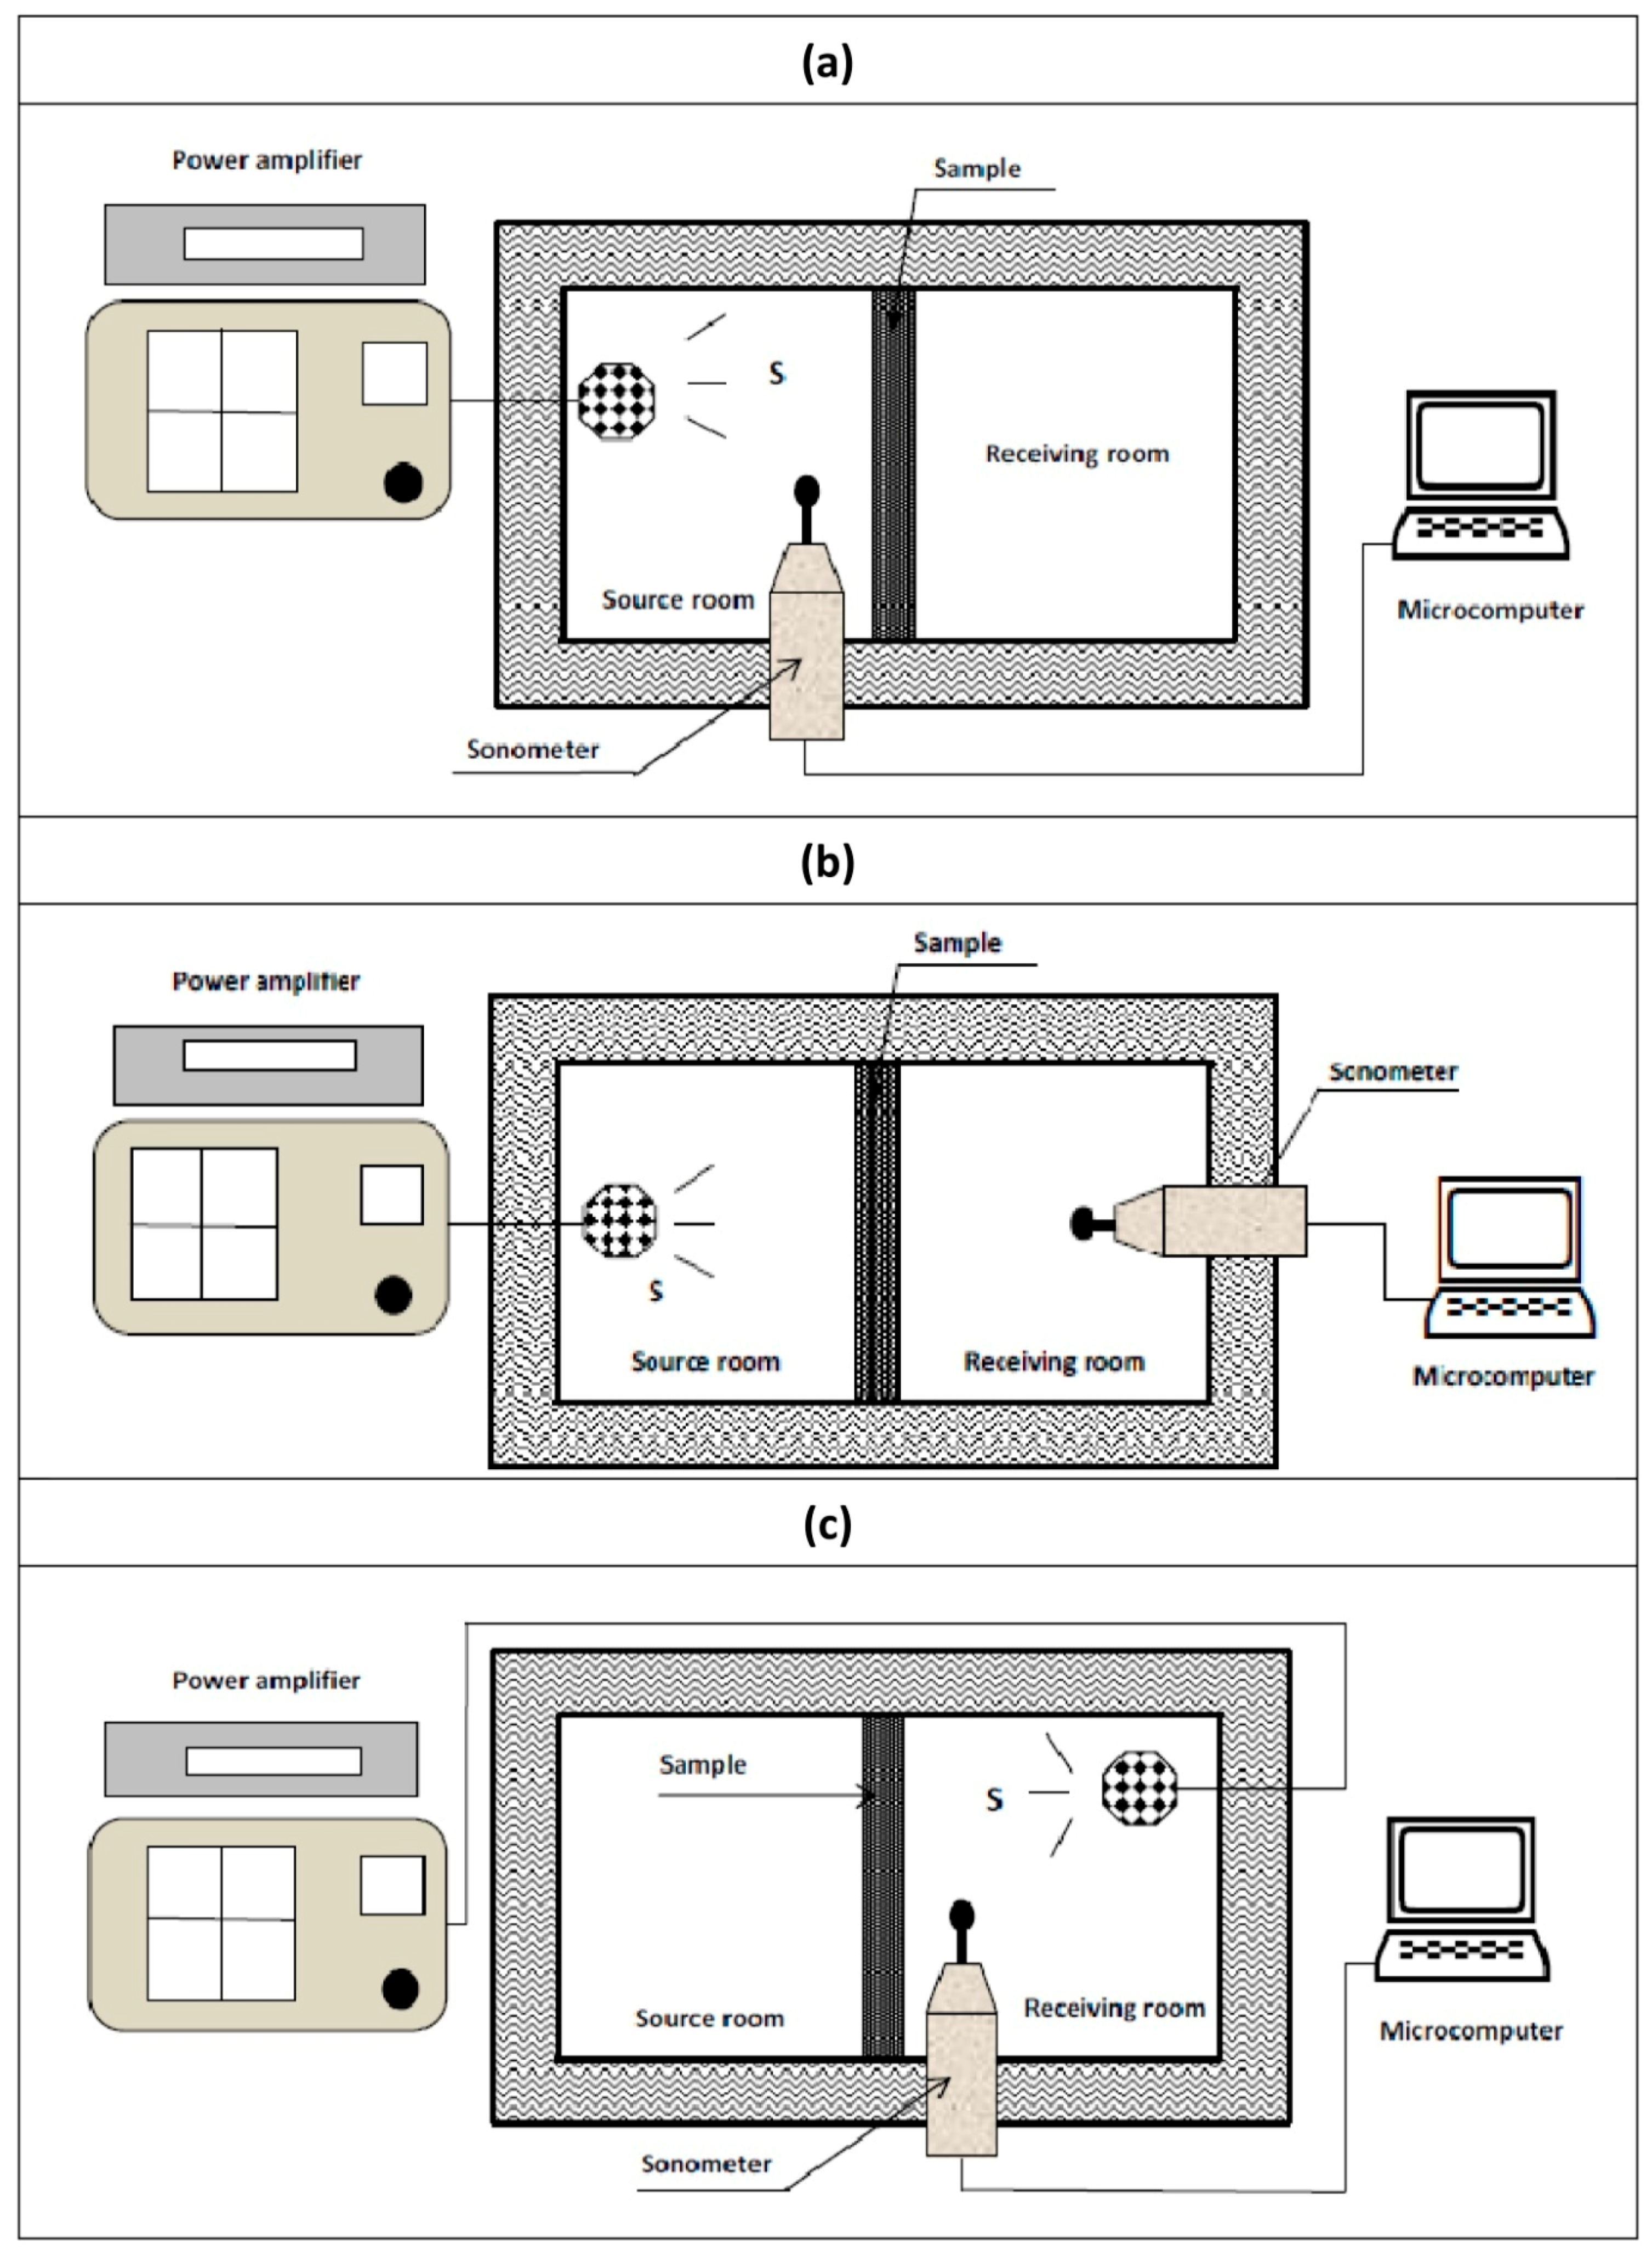
3.2.4. Measurement of Acoustic Properties

Level Difference

The sound insulation between two rooms corresponds to the arithmetic difference between the sound pressure level L1 in the emission room and the sound pressure level L2 in the reception room. This quality is denoted by D and calculated using the following formula (Equation (6)):
D = L 1 L 2
where L1 is the emission sound pressure level in the source room in decibels (dB) and L2 is the reception sound pressure level in decibels (dB).

Standardized Level Difference

Difference between the spatially and temporally averaged sound pressure levels produced in two rooms by one or more sound sources located in one of the two rooms and corresponding to a reference value of the reverberation time in the receiving room. The standardized level difference is evaluated using the following formula (Equation (7)):
D n T = D + 10 log T r 60 T 0
where D is the level difference (dB), Tr is the reverberation time in the receiving room (s) and T0 is the reference reverberation time equal to 0.5 s.
The measurement of standardized level difference was carried out with the following equipment:
  • An acoustic enclosure in which the sample was placed to separate between the source room and the reception room.
  • A sound source (S) placed in the source room and connected to a power amplifier.
  • A sonometer installed in the receiving room to measure the sound pressure levels inside the box. The values were displayed directly on a microcomputer connected to the sound level meter.
The average sound pressure level L1 was determined by placing the sonometer and the sound source (S) in the source room (Figure 6a). Then, a measurement of the average sound pressure level L2 was carried out by moving the sound level meter in the reception room (Figure 6b). Finally, the reverberation time Tr was determined by bringing the source back into the receiving room (Figure 6c).
The reverberation time Tr is the time required for the sound pressure level to decrease by 60 dB after a sound source has suddenly stopped. Tr measurements can be performed with octave band resolution or with a one-third octave band resolution. The frequency range must cover at least 125 Hz to 4000 Hz in octave bands, or 100 Hz to 5000 Hz in one-third octave bands.
The sonometer used in our study measured the reverberation time Tr30. We could deduce the reverberation time Tr60 using the following equation (Equation (8)):
T r 60 = 2 × T r 30 .

4. Results and Discussion
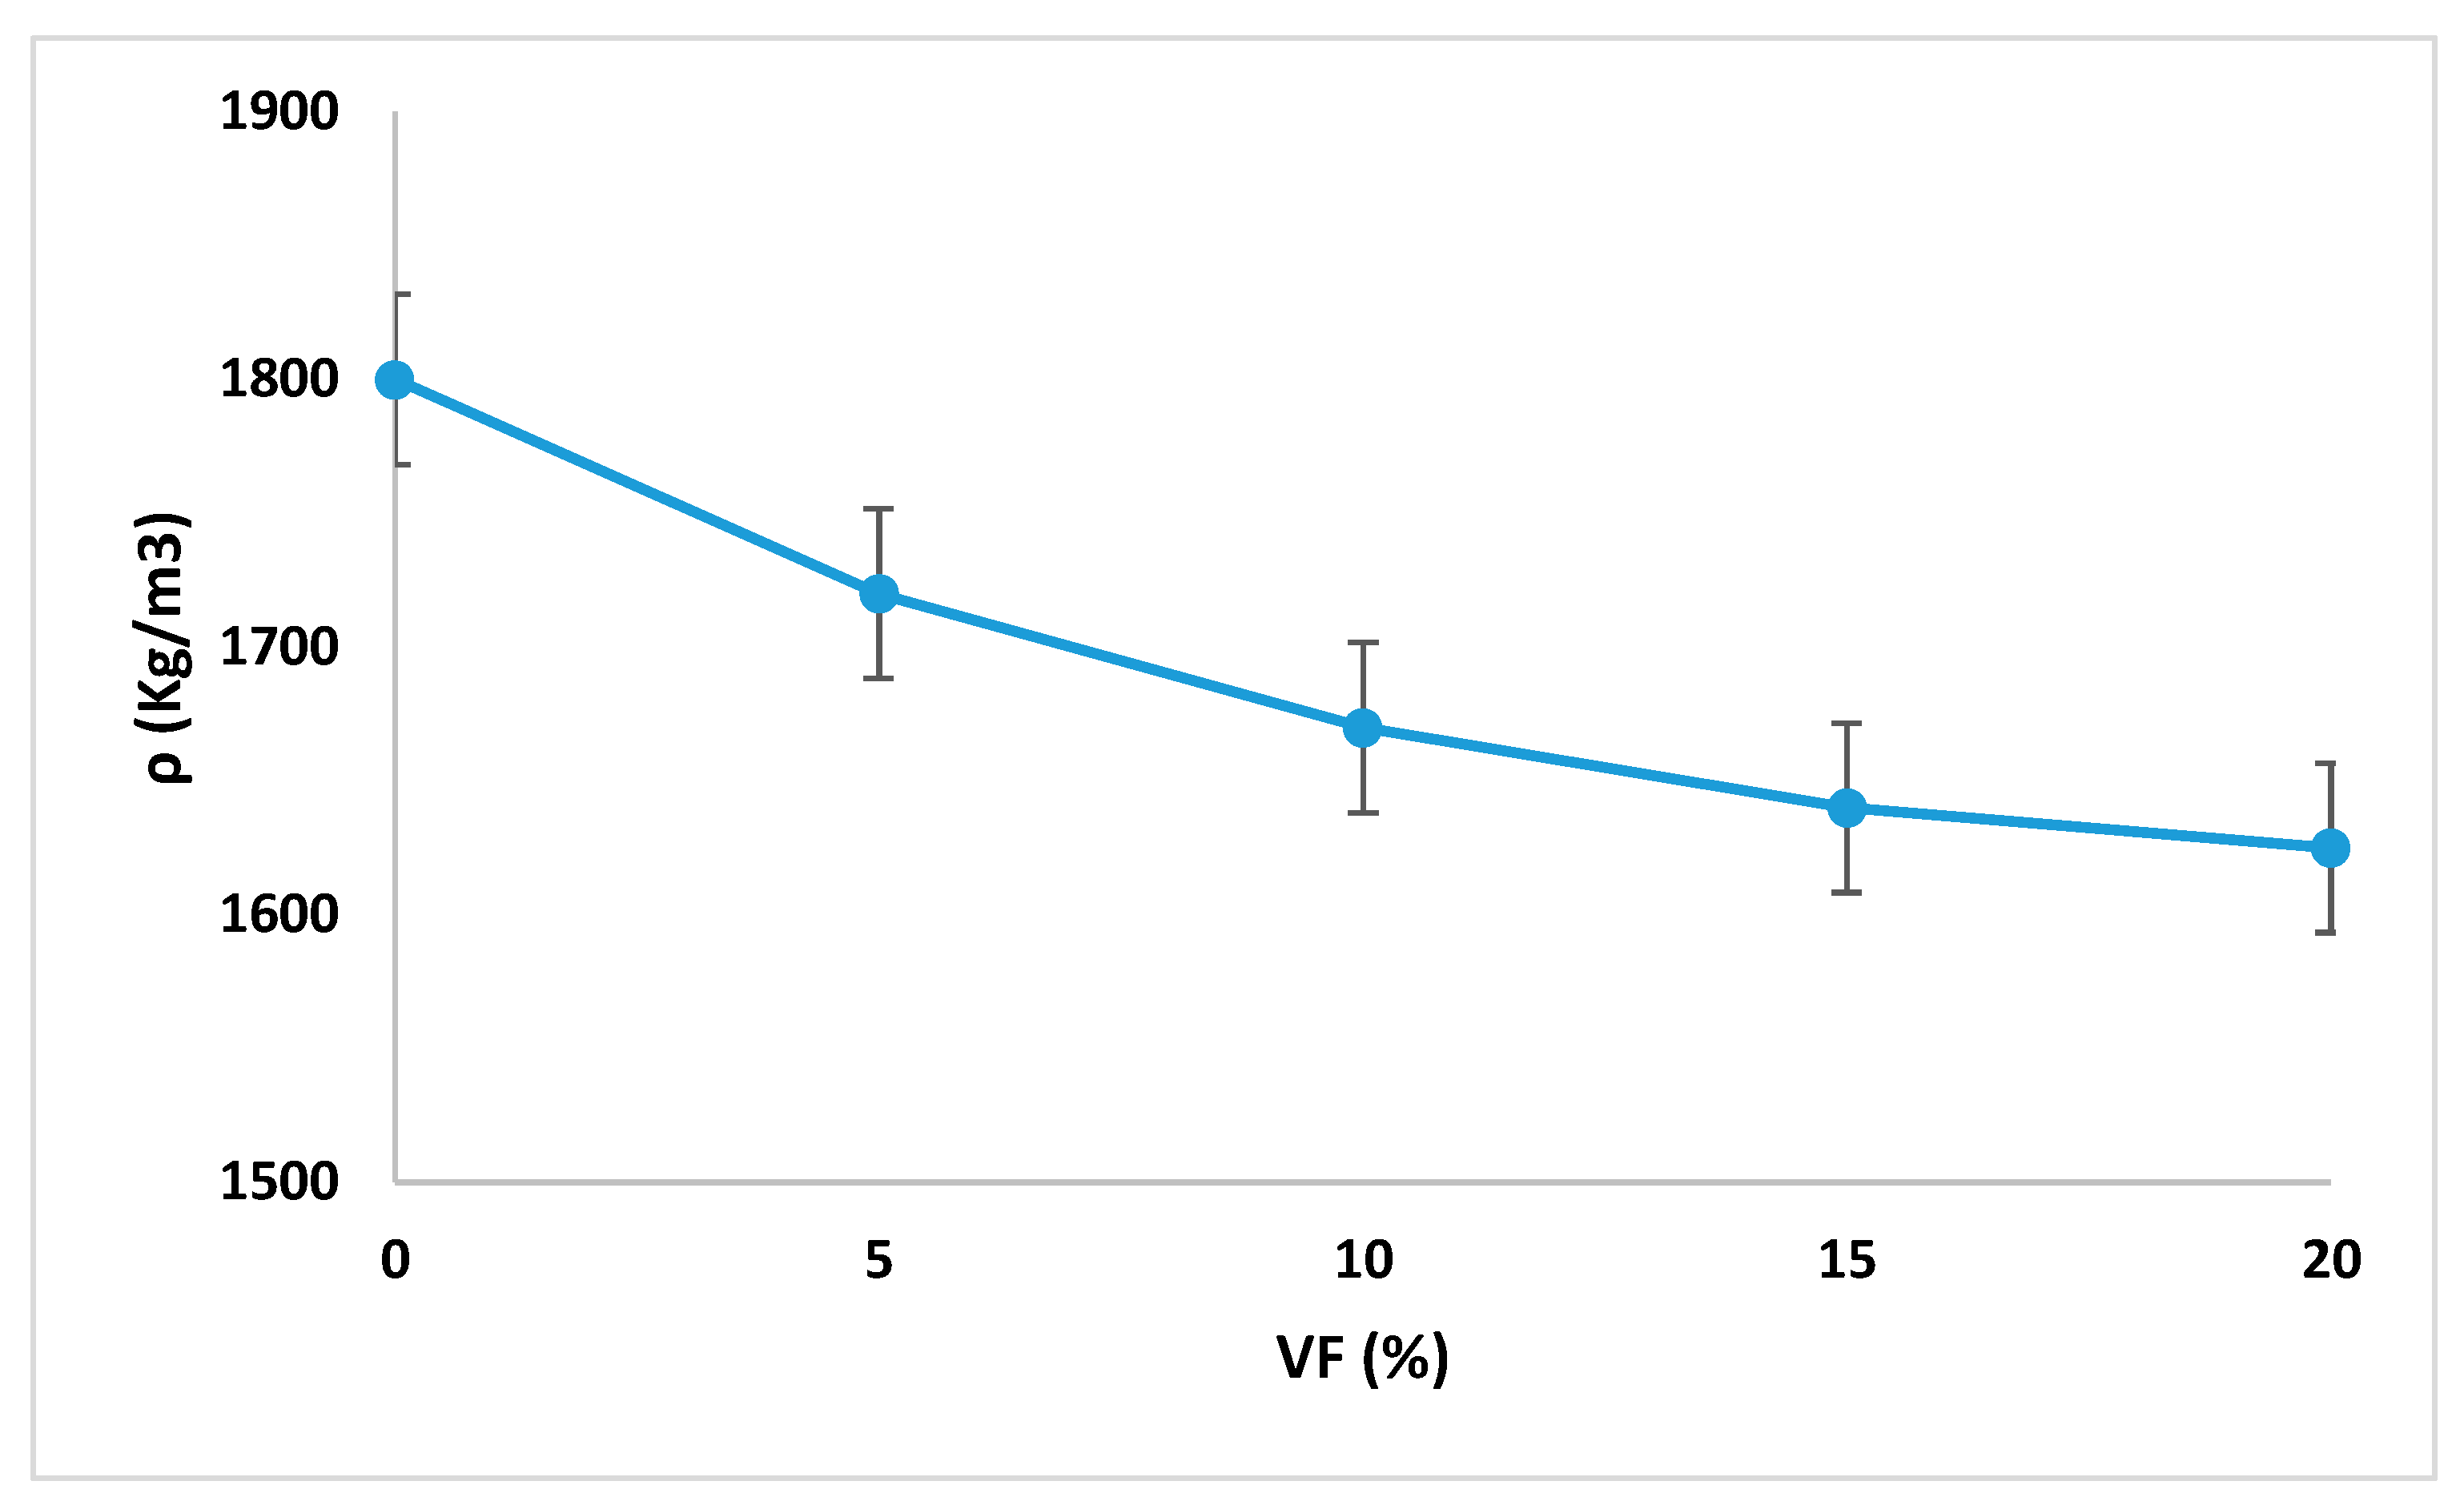
4.1. Density

Figure 7 shows the variation in density of the different mixtures. According to the investigation, it was noted that the density decreased from 1800 kg/m−3 to 1625 kg/m−3 for the volume fractions of fibers (Vf) ranging from 0% to 20%, which corresponded to a reduction of about 10%. This reduction was due to the low density of the fibers (350 kg/m−3) compared with that of the cement paste and the appearance of air bubbles using the fibers during mixing.
Generally, for a volume Vc of the composite material containing a volume Vf of the fiber and a volume Vm of the matrix, the evolution of the density ρc of the composite as a function of the density ρf of the fiber can be defined by the following relation:
ρ c = ρ f V f + ρ m V m ρ c = ρ f V f + ( 1 V f ) ρ m
According to the results of Figure 7, it is noted that all the samples containing fibers satisfied Equation (1). In addition, the density obtained for Vf = 0 was lower than the mass of the sample without fiber. It was clear that the incorporation of fibers in the cementitious matrix considerably increased its porosity.
Allegue et al. [11] studied the effect of the water-to-cement (W/C) ratio and reinforcement using PO fibers on the mechanical properties of cement. They noted that the addition of a large amount of PO in the cementitious matrix considerably decreased the density of the different composites. This decrease was due to the low density of fibers compared with that of cement paste.

4.2. Schmidt Rebound Hammer Test

Figure 8 presents the results of the mean values of the compressive strength (Rc) determined on the cubic specimens of dimensions 150 mm × 150 mm × 150 mm at the ages of 7 and 28 days using the Schmidt rebound hammer test for a fiber content ranging from 0 to 20% by volume. According to the results, it can be seen that the addition of PO fibers improved the compressive strength of the mixtures and reached a maximum value of 33.60 MPa for 10% volume of fiber content. Beyond this value, a slight decrease in compressive strength was observed with increasing fiber volume up to 20%. This behavior was due to an increase in the porosity of the mixtures, and therefore, a reduction in fiber-matrix cohesion.
It is also noted that the addition of fibers had an effect on the setting properties of concrete. Indeed, after 7 days, the compressive strength had barely reached 70% of the final strength.

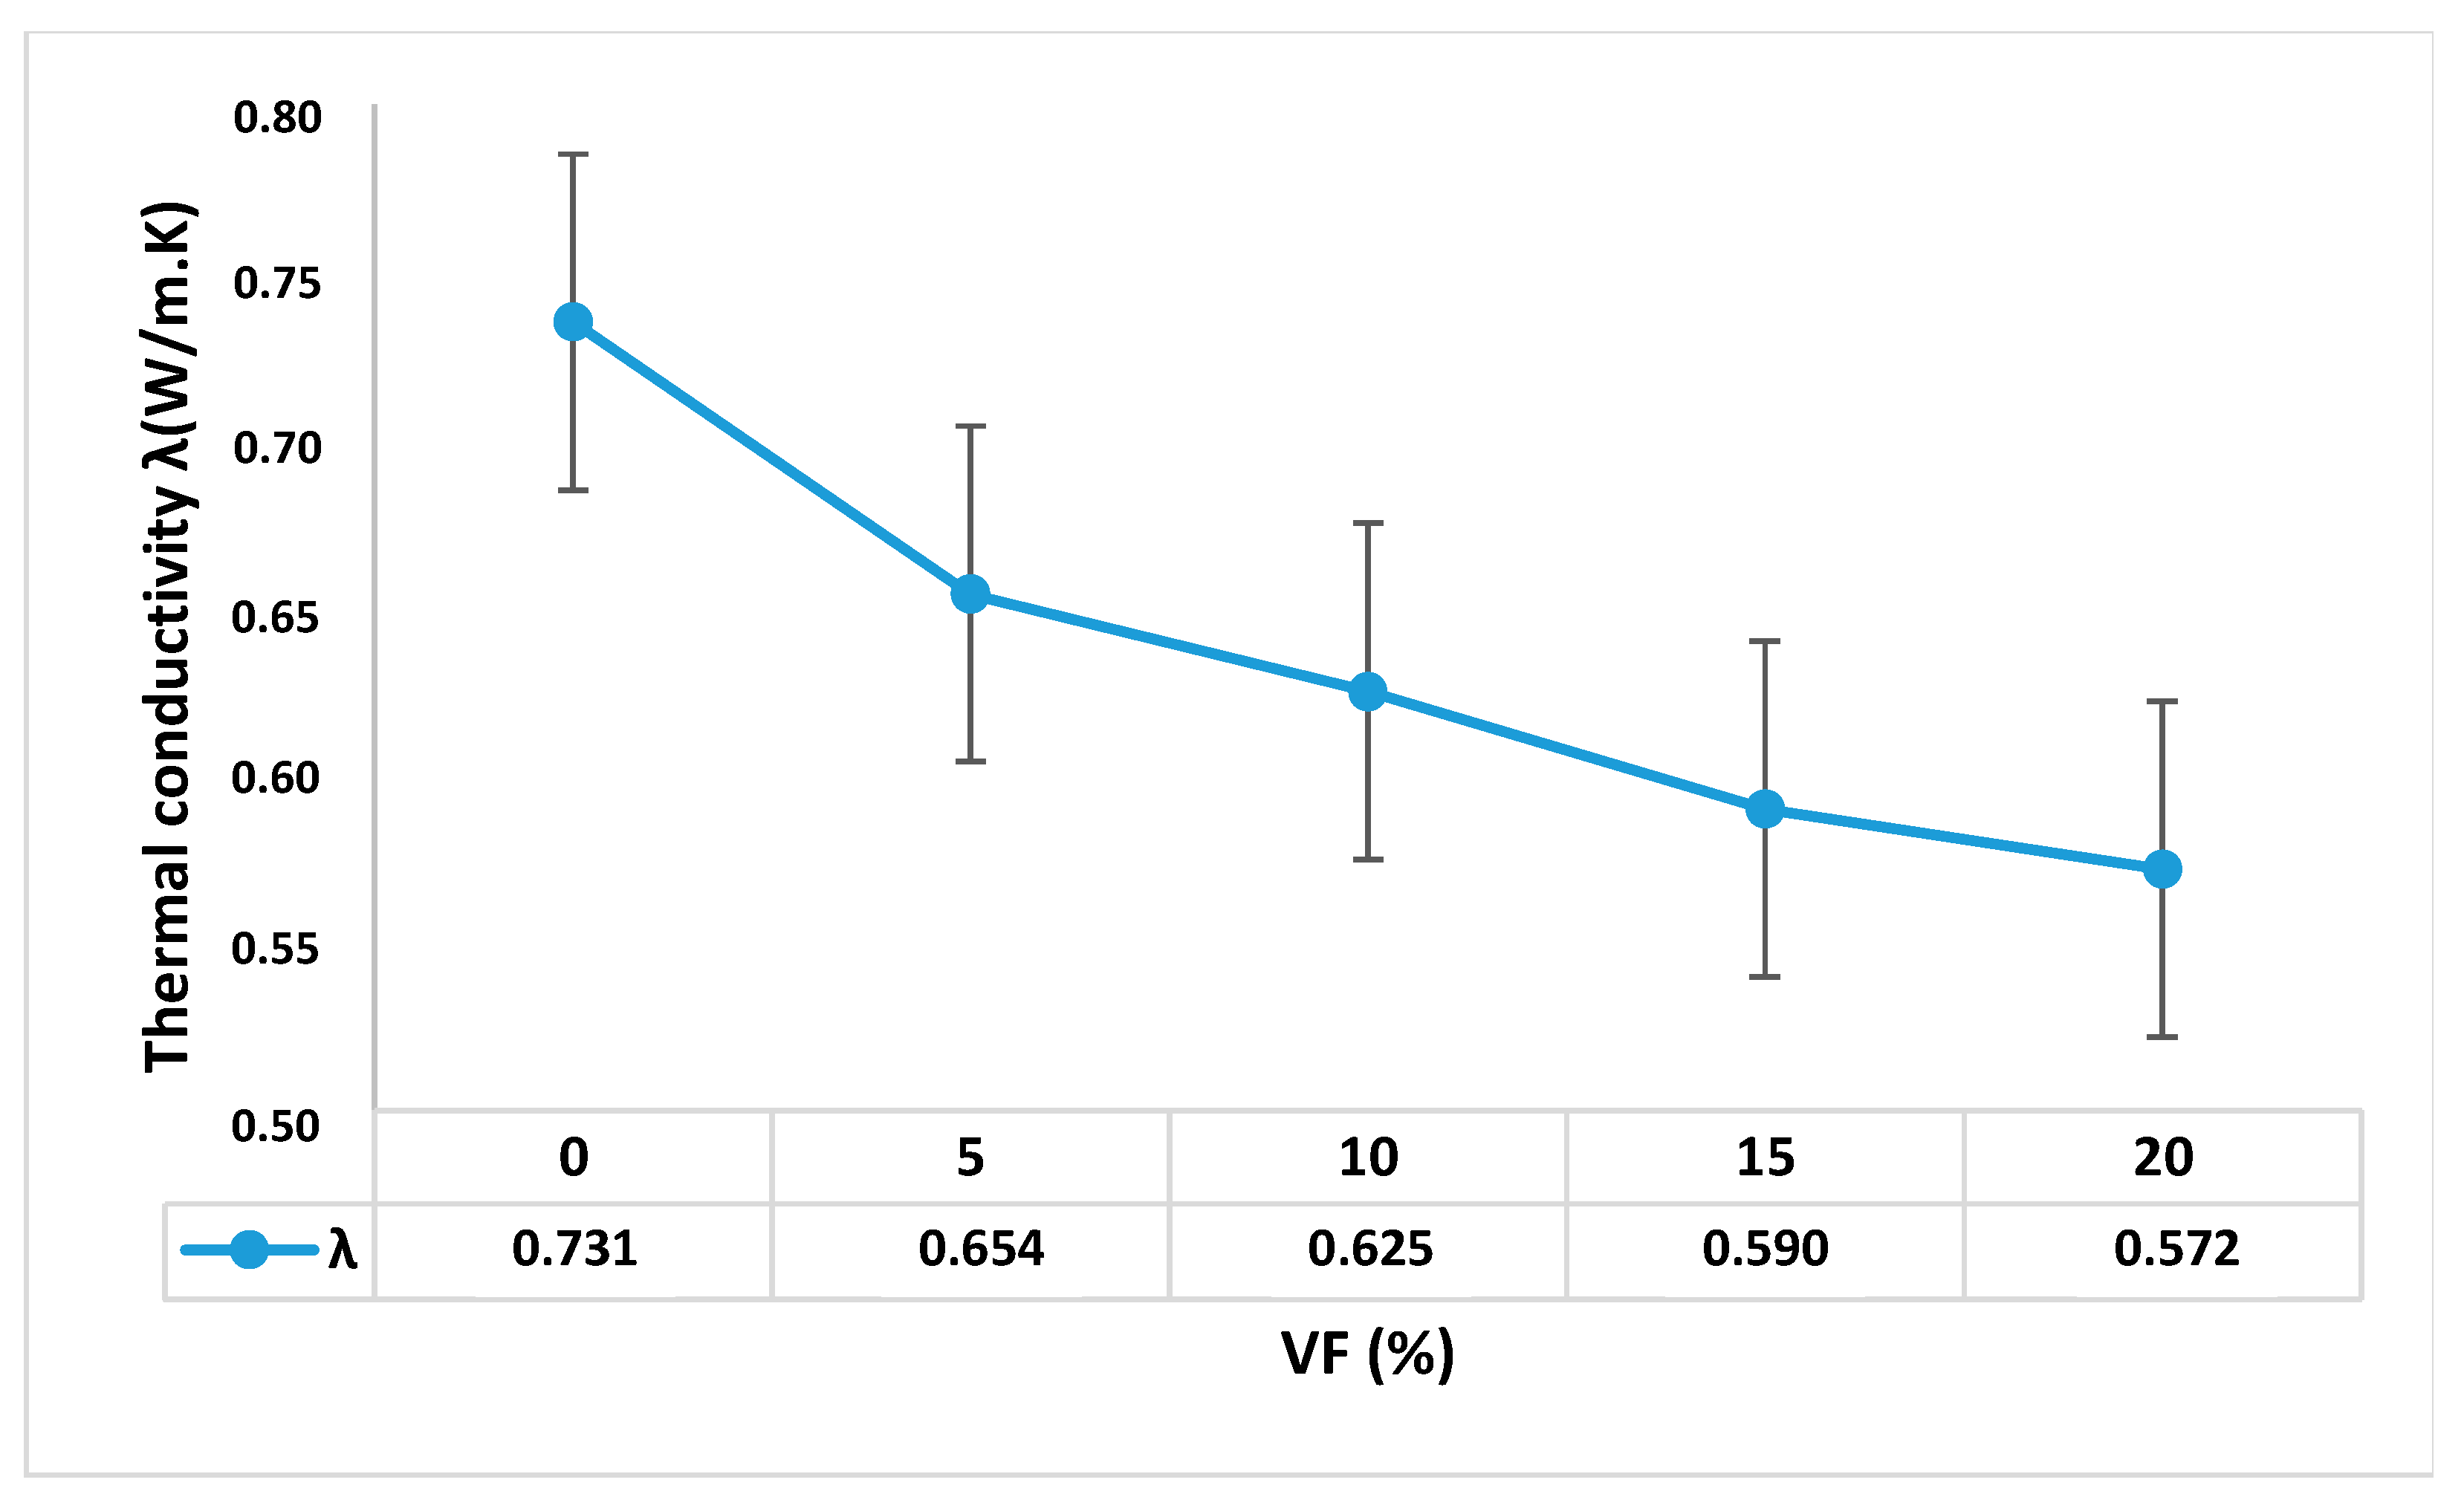
4.3. Thermal Conductivity

The thermal conductivity was experimentally determined using the parallelepipedic specimens of dimensions 270 × 270 mm × 40 mm3 at the age of 28 days. Figure 9 presents the results of the thermal conductivity measurements obtained experimentally using the box method.
The results indicated that the incorporation of PO fibers considerably reduced the thermal conductivity of different mixtures from 0.735 W·m−1·K1 to 0.572 W·m−1·K−1. For the replacement percentages of 5%, 10%, 15% and 20%, the reductions in thermal conductivity were 11%, 15%, 19.7% and 22.17% compared with the control samples (0% fibers). This decrease can be explained by the creation of numerous interfaces that thermally acted as successive contact resistances, thus modifying the microstructure of the mixtures. In addition, the PO fibers also limited the heat flow because the thermal conductivity of the fibers was much lower than that of cement.
It was also noted that the creation of air voids in the mixtures presented an obstacle in front of the transmission of heat since the thermal conductivity of cement (0.735 W·m−1·K−1) is much higher than that of air (0.025 W·m−1·K−1).
Bederina et al. [24] studied the effect of adding wood fibers on the thermal conductivity of concrete with two types of sand. They noted that adding 100 kg/m3 of wood reduced the thermal conductivity from 1.2 W·m−1·K−1 to 0.55 W·m−1·K−1 for the first type of sand and from 1.3 W·m−1·K−1 to 0.65 W·m−1·K−1 for the second type of sand, a reduction of about 50%.
Taoukil et al. [17] also studied the effect of incorporating wood with mass fractions from 0 to 30% in a cement mortar on the thermal conductivity of five mixtures with different water contents. They noticed that the addition of wood considerably decreased the thermal conductivity of the composites. Indeed, the thermal conductivity at saturation was two to three times higher than in the dry state.

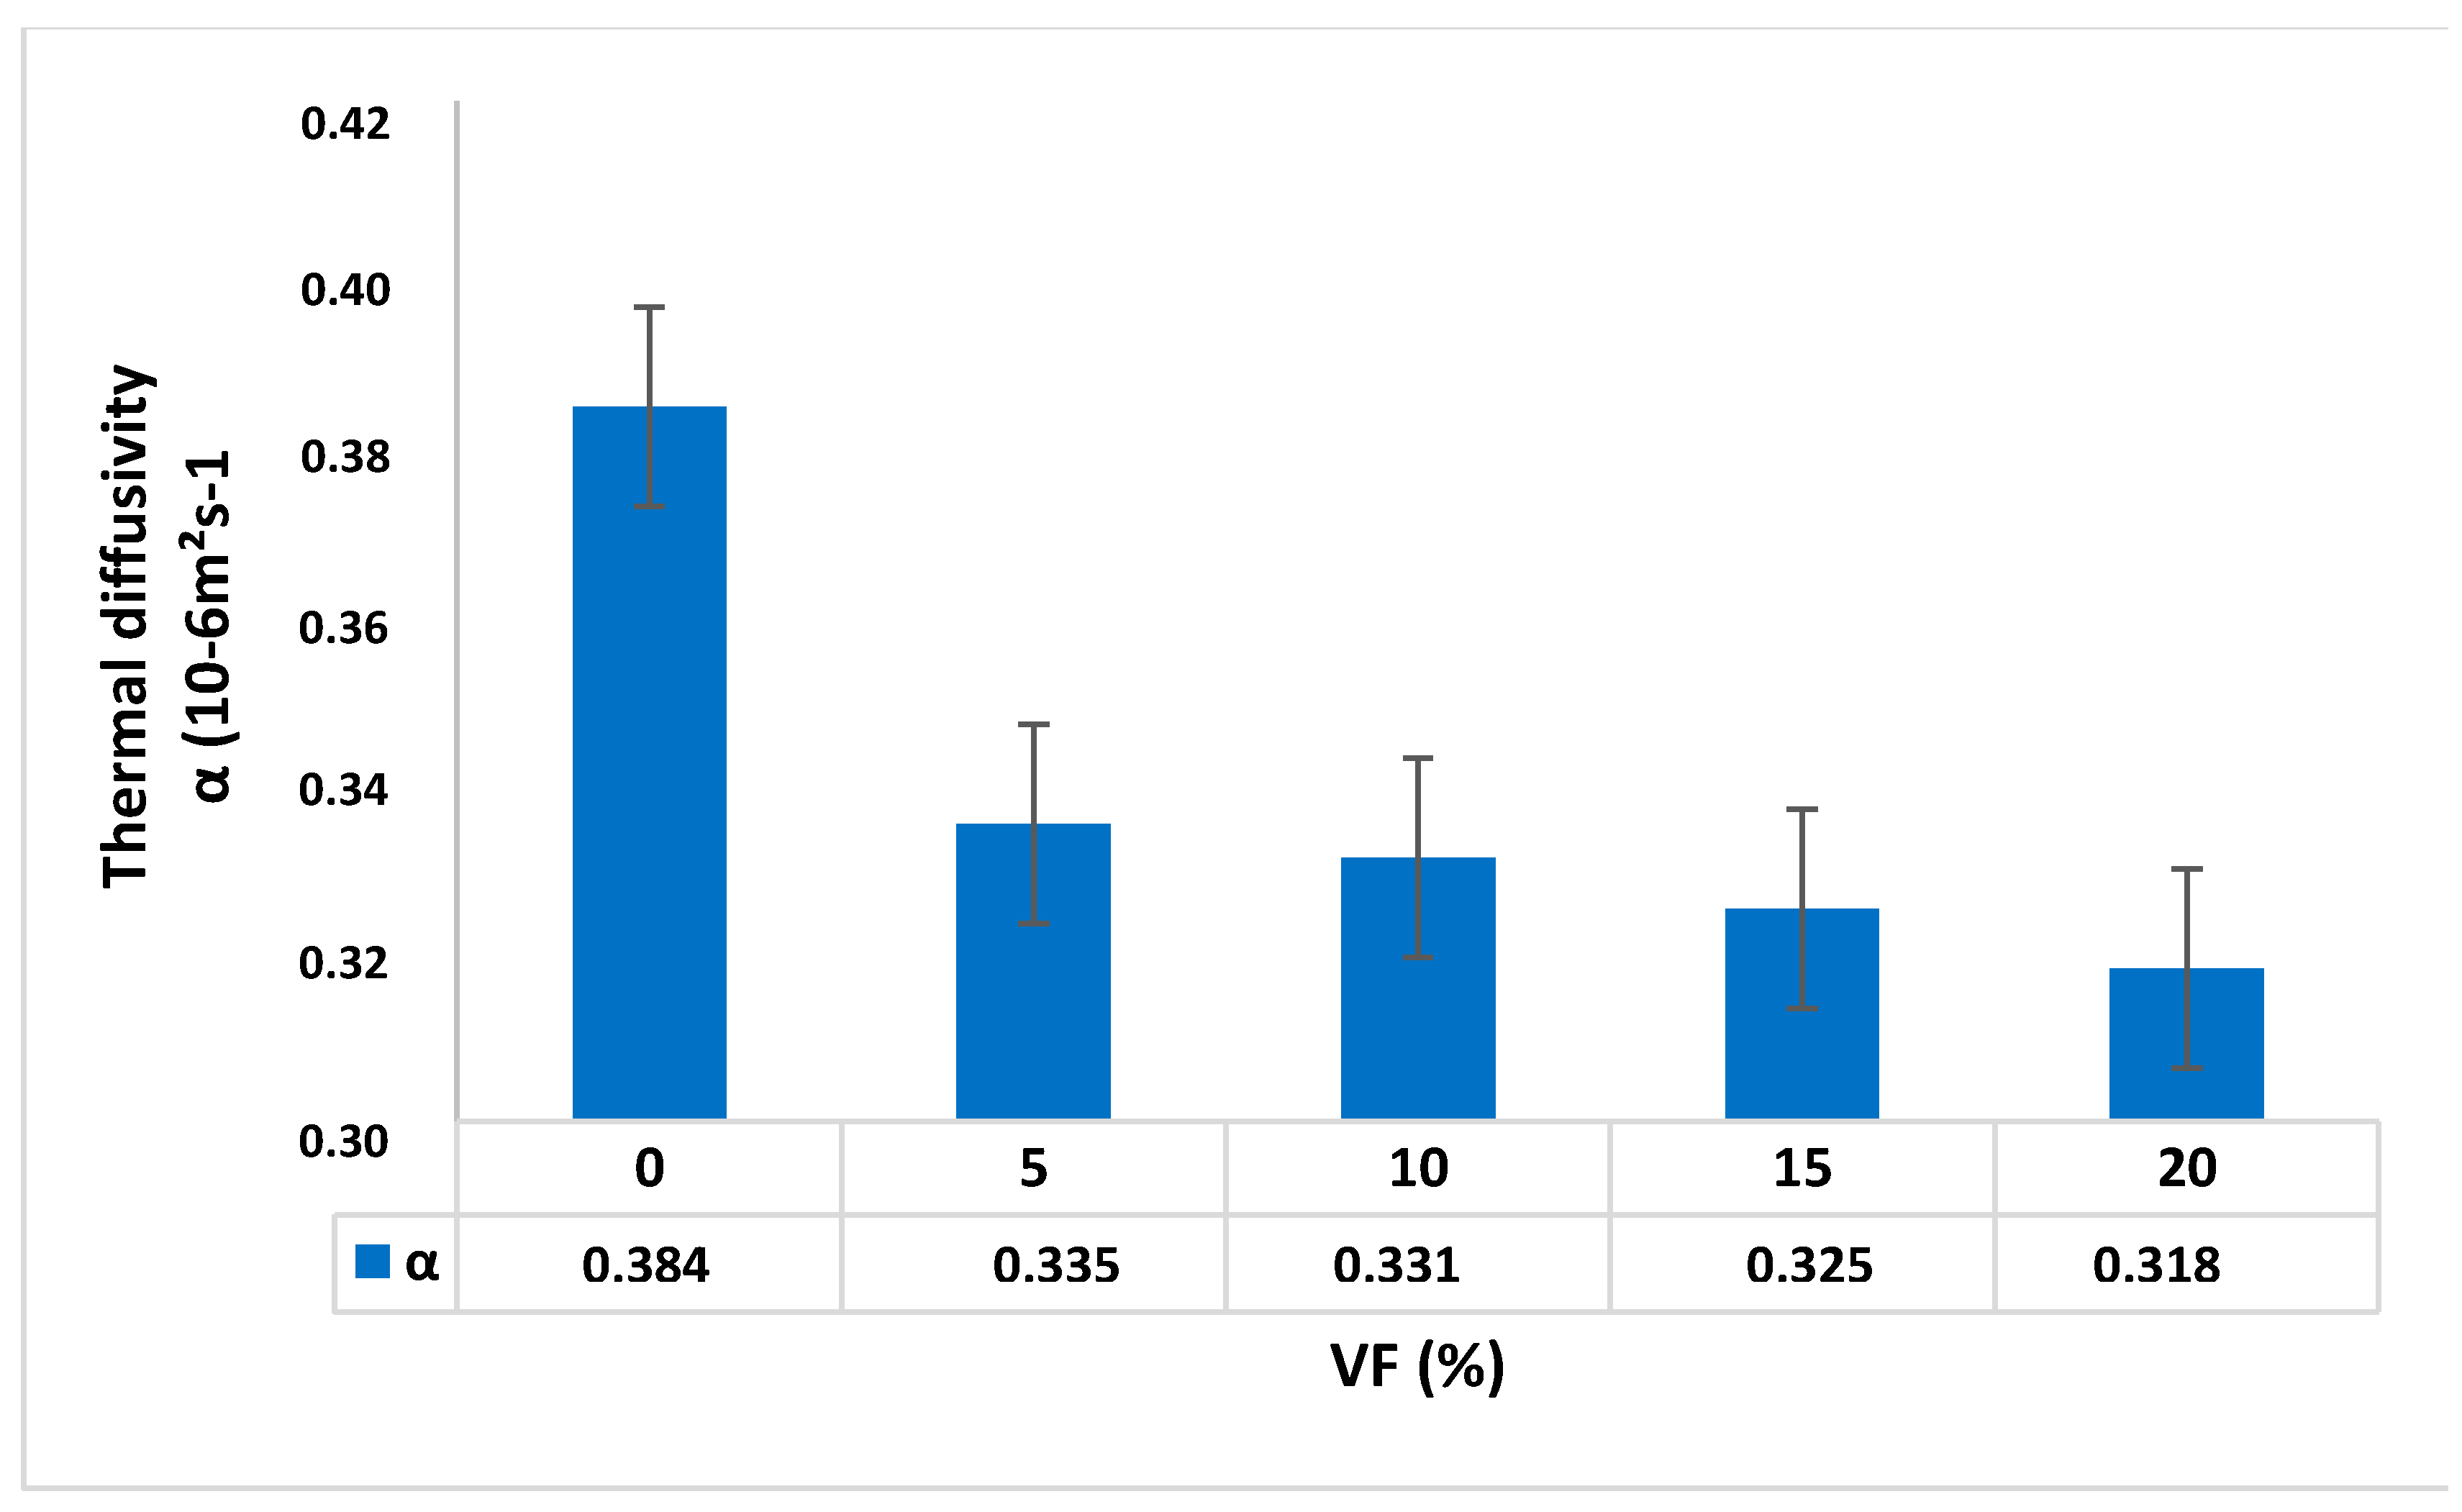
4.4. Thermal Diffusivity

Thermal diffusivity is a specific property of materials characterizing non-constant heat conduction. This value describes how quickly a material reacts to a change in temperature. The thermal diffusivity was determined experimentally on the parallelpipedic specimens of dimensions 270 × 270 mm × 40 mm at the age of 28 days. Figure 10 presents the results of the thermal diffusivity measurements obtained experimentally using the box method with respect to the volume fraction of the fiber.
According to the results, it was noticed that the thermal diffusivity of the composites decreased slightly with the addition of fibers in the cementitious matrix. It varied from 0.384 × 10⁻⁶ m2·s−1 (0% fibers) to 0.318 × 10⁻⁶ m2·s−1 (20% fibers), i.e., a total reduction of 17.20%. Indeed, a significant decrease of 12% was observed from the incorporation of 5% of fibers; then, a very small variation in thermal diffusivity (about 2%) was observed for the volume fractions of fibers of 10, 15 and 20%.

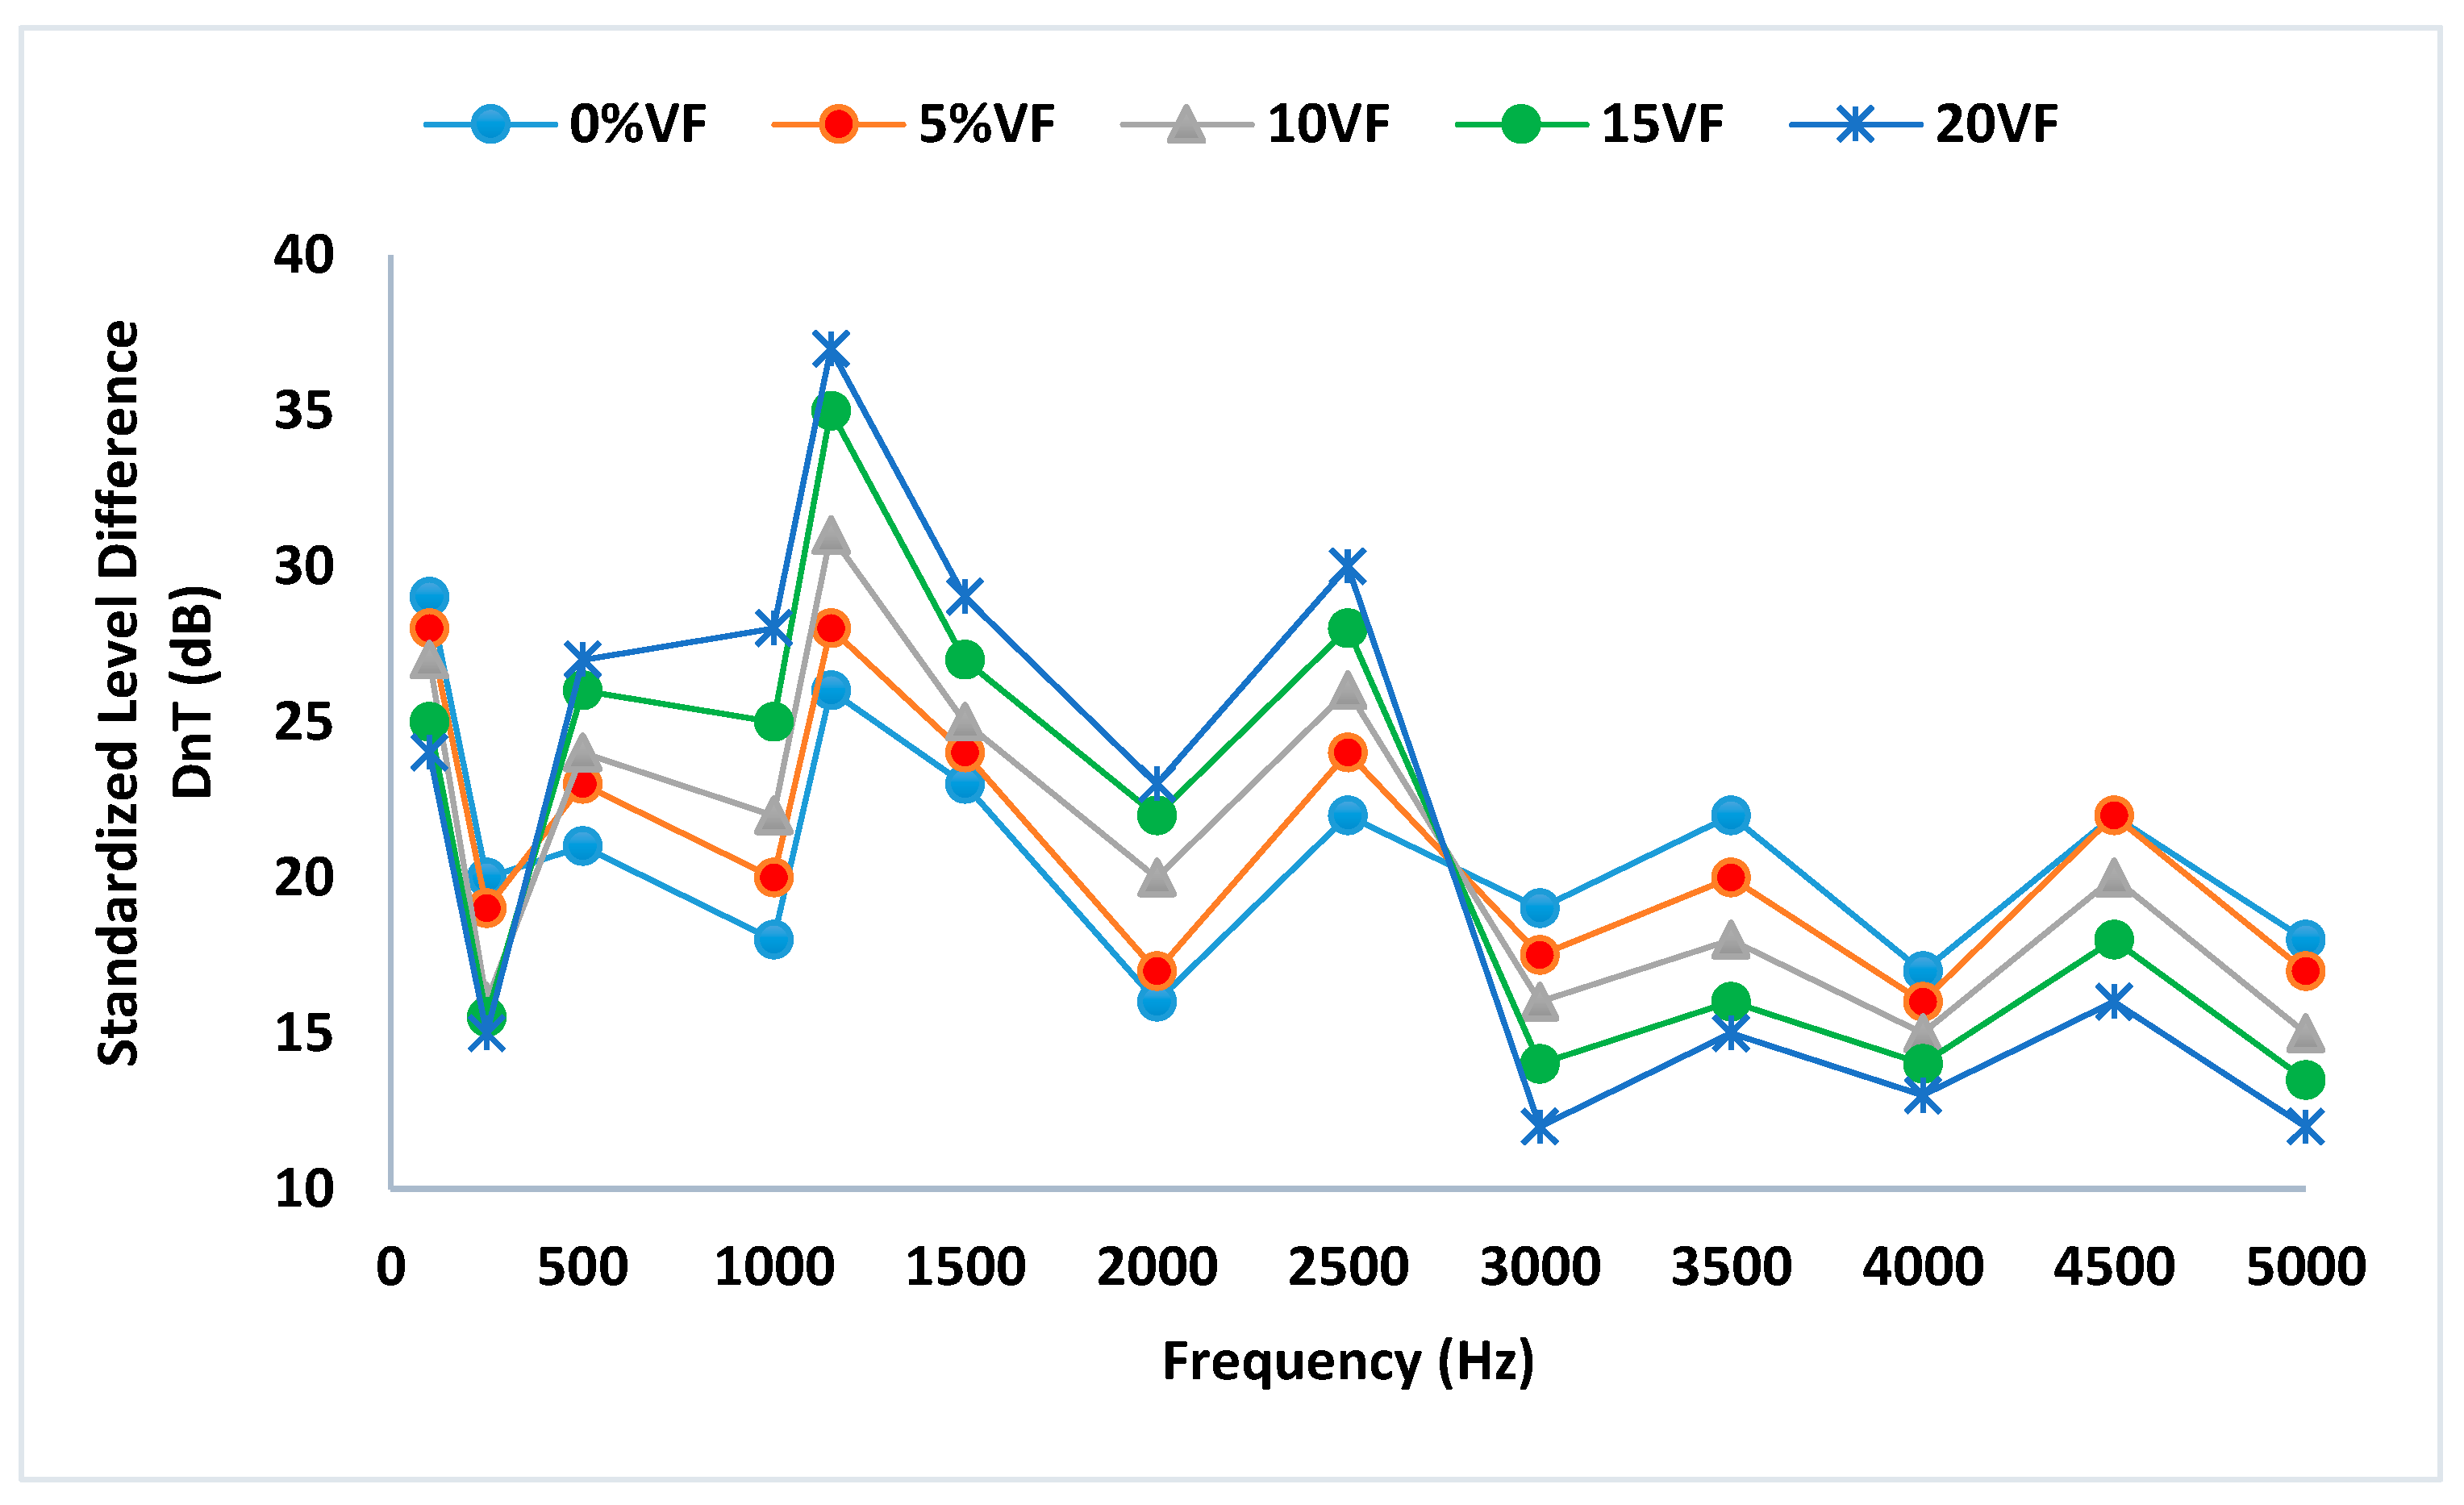
4.5. Standardized Level Difference

The variation of the standardized level difference (DnT) with respect to the frequency for the different mixtures is given in Figure 11. An increase in the values of DnT was noted for the frequency ranges of 400 to 1000 Hz and 1600 to 2500 Hz. For the other frequencies, the values of DnT decreased, especially for high frequencies that exceeded 3000 Hz. This result was expected since the improvement was a function of the existence of the communicating pores and the increase in the mass of the mixtures. According to the results of Figure 6, we also noted that the addition of PO fibers seemed to have a positive effect on the DnT of the mixtures, especially for the one made using 20% by volume of fibers and whose value could reach 37 dB.

4.6. Sound Transmission Class

The sound transmission class (STC) is defined by the notation procedure set forth in ASTM E413-87 [25]. It measures a structure’s ability to resist or reduce sound transmission for frequencies ranging from 125 to 4000 Hz.
The higher the STC rating of a structure, the less sound that passes through the structure. Lower STC ratings generally mean that the structure blocks sound transmission poorly.
The variation of STC of the mixtures according to the content of PO fibers is presented in Figure 12. It could be seen that the STC of PO fiber reinforced cementitious composites decreased as the fiber volume increased due to an increase in air voids in the mixtures. Indeed, the STC values decreased from 31.5 to 30.5 for the volume fractions of fibers ranging from 0% to 20%, which corresponded to a reduction of about 3%.
Table 3 gives the noise control level according to the STC rating for speech heard through a wall or floor. Since the determined values of STC of the mixtures were greater than 30 dB, the resulting material can provide loud speech that was audible as a murmur but unintelligible.
The classifications of STC are not cumulative. Indeed, the realization of drywall with a gauge STC equal to 20 installed on insulation with an STC equal to 10 does not automatically produce a wall with a sound transmission class of 30. On the other hand, these gauges measure the performance of the entire structure after its complete assembly.

5. Conclusions

The present paper presents the results of an experimental study of the effect of Posidonia oceanica fibers on the thermal and acoustic properties of cement paste. The compressive strength of fiber-reinforced concrete was determined using the Schmidt rebound hammer test. Thereafter, the thermal conductivity and the thermal diffusivity of the mixtures were determined using the box method. From the results obtained during this study, the following points were identified:
Posidonia fibers could be used as a reinforcement material in cementitious composites for a W/C ratio = 0.5.
The incorporation of Posidonia fibers decreased the density of mixtures from 1800 kg/m3 to 1625 kg/m3 for the volume fractions of fibers ranging from 0% to 20%, which corresponded to a reduction of about 10%.
The optimal mechanical properties of mixtures were found when a 5–10% volume fraction of Posidonia fibers was used.
The addition of Posidonia fibers in the cement matrix decreased the thermal conductivity and the thermal diffusivity of mixtures. This reduction improved the thermal insulation of the material.
The addition of PO fibers seemed to have a positive effect on the standardized level difference of the mixtures, especially when a 20% volume fraction of Posidonia fibers was used.
In this experimental study, PO fibers were studied in their raw state. Further experimental research is recommended to study the effect of fiber treatment on the properties of cementitious composites. It is also important to mention that the measurements were made in the laboratory and that they do not take into account the real conditions of temperature and humidity of buildings. This point should be taken up in future studies.

Author Contributions

Investigation, M.J.; writing—original draft preparation, M.J.; writing—review and editing, M.J., O.B., J.S. and G.R.; supervision, G.R. and M.A.K. All authors read and agreed to the published version of the manuscript.

Funding

This project was supported by the Deanship of Scientific Research at Prince Sattam Bin Abdulaziz University under the research project # 2022-01-20220.

Informed Consent Statement

Not applicable.

Data Availability Statement

No data, models or code were generated or used during the study.

Conflicts of Interest

The authors declare no conflict of interest.

Nomenclature

POPosidonia oceanica
RWater/cement ratio
VfFractions of fibers
RCCompression strength, MPa
DLevel difference, dB
CPMass heat capacity, J·kg−1·K−1
DnTStandardized level difference, dB
λThermal conductivity, W·m−1·K−1
TrReverberation time, s
αThermal diffusivity, m2·s−1
STCSound transmission class
ρDensity, g·cm−3

References

  1. Borum, J.; Duarte, C.M.; Krause-Jensen, D.; Greve, T.M. Europeans Seagrasses: An Introduction to Monitoring and Management; The M&MS Project; The University of California: Los Angeles, CA, USA, 2004. [Google Scholar]
  2. Boudouresque, C.F.; Bernard, G.; Bonhomme, P.; Rogeau, E.; de Saint Martin, T.; Boudouresque, C.F. Protection and Conservation of Posidonia oceanica Meadows; RAMOGE & RAC/SPA: Tunis, Tunisia, 2012; pp. 1–202. [Google Scholar]
  3. Ofori, G.; Briffett, C.; Gang, G.; Ranasinghe, M. Impact of ISO 14,000 on construction enterprises in Singapore. Constr. Manag. Econ. 2000, 18, 935–947. [Google Scholar] [CrossRef]
  4. Aditya, L.; Indra Mahlia, T.M.; Rismanchi, B.; Ng, H.M.; Hasan, M.H.; Metselaar, H.S.C.; Muraza, O.; Aditiya, H.B. A review on insulation materials for energy conservation in buildings. Renew. Sustain. Energy Rev. 2017, 73, 1352–1365. [Google Scholar] [CrossRef]
  5. VarunTeja, K.; Meena, T. Performance of Ternary Blended Concrete and Binary Concrete Made with Perlite Powder at Elevated Temperatures. JordanJ. Civ. Eng. 2020, 14, 198–209. [Google Scholar]
  6. Chafei, C.; Khadraoui, F.; Boutouil, M.; Gomnia, M. Effect of flax fiber streatments on the rheological and the machanical behavior of a cement composite. Constr. Build. Mater. 2015, 79, 229–235. [Google Scholar]
  7. Fantilli, A.; Chiaia, B.; Gorino, A. Fiber volume fraction and ductility index of concrete beams. Cem. Concr. Compos. 2016, 65, 139–149. [Google Scholar] [CrossRef]
  8. Korjenic, A.; Petranek, V.; Zach, J.; Hroudova, J. Development and performance evaluation of natural thermal-insulation materials composed of renewable resources. Energy Build. 2011, 43, 2518–2523. [Google Scholar] [CrossRef]
  9. Reis, J.M.L. Fracture and flexural characterization of natural fiber-reinforced polymer concrete. Constr. Build. Mater. 2006, 20, 673–678. [Google Scholar] [CrossRef]
  10. Comak, B.; Bideci, A.; Bideci, O.S. Effects of hempfibers on characteristics of cement based mortar. Constr. Build. Mater. 2018, 169, 794–799. [Google Scholar] [CrossRef]
  11. Allegue, L.; Zidi, M.; Sghaier, S. Mechanical properties of Posidonia oceanica fibersre in forced cement. J. Compos. Mater. 2015, 49, 1–9. [Google Scholar] [CrossRef]
  12. Hamdaoui, O.; Ibos, L.; Mazioud, A.; Safi, M.; Limam, O. Thermophysi calcharacterization of Posidonia oceanica marine fibers intended to beused as an insulation material in Mediterranean buildings. Constr. Build. Mater. 2018, 180, 68–76. [Google Scholar] [CrossRef]
  13. Hamdaoui, O.; Limam, O.; Ibos, L.; Mazioud, A. Thermal and mechanical properties of hardened cement paste reinforced with Posidonia oceanica natural fibers. Constr. Build. Mater. 2021, 269, 121339. [Google Scholar] [CrossRef]
  14. Sridhar, J.; Gobinath, R.; Kırgız, M.S. Comparative study for efficacy of chemically treated jute fiber and bamboo fiber on the properties of reinforced concrete beams. J. Nat. Fibers 2022, 19, 1–12. [Google Scholar] [CrossRef]
  15. Jedidi, M.; Abroug, A. Valorization of Posidonia oceanica Balls for the Manufacture of an Insulating and Ecological Material. Jordan J. Civ. Eng. 2020, 14, 417–430. [Google Scholar]
  16. EN 196-1; Methods of Testingcement—Part 1: Determination of Strength. iTeh Standards: Etobicoke, ON, Canada, 2016.
  17. Taoukil, D.; Sick, F.; Mimet, A.; Ezbakhe, H.; Ajzoul, T. Moisture content influence on the thermal conductivity and diffusivity of wood-concrete composite. Constr. Build. Mater. 2013, 48, 104–115. [Google Scholar] [CrossRef]
  18. Kuqo, A.; Boci, I.; Vito, S.; Vishkulli, S. Mechanical properties of lightweight concrete composed with Posidonia oceanica fibres. Zast. Mater. 2018, 59, 519–523. [Google Scholar] [CrossRef]
  19. British Standards Institution EN 12504-2; Testing concrete in Structures, Non-Destructive Testing. Determination of Reboundnumber. BSI: London, UK, 2012.
  20. British Standards Institution EN 12309-3; Testing hardning concrete-Part 3: Compression Strength of Test Specimens. BSI: London, UK, 2003.
  21. European Standard EN ISO 8990; Thermal Insulation-Determination of Steady-State Thermal Transmission Properties-Calibrated and Guarded Hot Box. BSI: London, UK, 1996.
  22. Kellati, N.; El Bouardi, A.; Ajzoul, T.; Ezbakhe, H. Etude de Propriétés Thermophysiques et Acoustiques du Liège Compact et Granulaire; Revue des Energies Renouvelables CER’07: Oujda, Maroc, 2000; pp. 241–244. [Google Scholar]
  23. Degiovanni, A. Thermal conduction in multilayer slab withinternal sources using a quadripolar method. Int. J. Heat Mass Transf. 1988, 31, 553–557. [Google Scholar] [CrossRef]
  24. Bederina, M.; Marmoret, L.; Mezreb, K.; Khenfer, M.M.; Bali, A.; Queneudec, M. Effect of the addition of wood shavings on thermal conductivity of sand concretes: Experimantalstudy and modelling. Constr. Build. Mater. 2007, 21, 662–668. [Google Scholar] [CrossRef]
  25. ASTM E413 2016 Edition; Classification for Rating Sound Insulation. ASTM: West Conshohocken, PA, USA, 1 April 2016.
Figure 1. Flow chart of the preparation steps of the mixtures.
Buildings 12 00909 g001
Figure 2. Flow chart for the different experimental tests carried out on the concrete specimens.
Buildings 12 00909 g002
Figure 3. (a) Bundles of PO leaves; (b) PO balls; (c) Posidonia oceanica fibers.
Buildings 12 00909 g003
Figure 4. Schmidt rebound hammer test. (a) Schmidt rebound hammer. (b) Carborundum stone. (c) Chart for determining the compressive strength as a function of RN.
Buildings 12 00909 g004
Figure 5. Box method device. (a) Thermal conductivity measurement. (b) Thermal diffusivity measurement.
Buildings 12 00909 g005
Figure 6. Measurement device: (a) measurement of L1 in the source room, (b) measurement of L2 in the receiving room and (c) measurement of the reverberation time Tr60.
Buildings 12 00909 g006
Figure 7. Effect of PO fibers on the density of the mixtures.
Buildings 12 00909 g007
Figure 8. Effect of PO fibers on the compressive strength of the mixtures.
Buildings 12 00909 g008
Figure 9. Effect of PO fibers on the thermal conductivity of the mixtures.
Buildings 12 00909 g009
Figure 10. Effect of PO fibers on the thermal diffusivity of the mixtures.
Buildings 12 00909 g010
Figure 11. Effect of PO fibers on the standardized level difference of the mixtures.
Buildings 12 00909 g011
Figure 12. Effect of PO fibers on the sound transmission class of the mixtures.
Buildings 12 00909 g012
Table 1. Chemical, physical and mechanical properties of cement.
Chemical Compounds
Insoluble residue (IR) ≤5%
Sulfur trioxide (SO3) ≤3.5%
Magnesium oxide (MgO) ≤5%
Chloride (Cl) ≤0.1%
Soundness (mm) ≤10
Initial setting time (mn) ≥60
Physical Properties
Absolute density (g/cm3)3.13Absolute density (g/cm3)
Blaine specific surface (cm2/g)3100Blaine specific surface (cm2/g)
Mechanical Property
True class (MPa)44True class (MPa)
Table 2. Physical properties of Posidonia oceanica fibers.
PropertiesValues
Thermal conductivity λ (W·m−1·K−1)0.04–0.07
Mass heat capacity CP (J·kg−1·K−1)2500
Density ρ (g·cm−3)0.35
Table 3. STC ratings and noise reduction.
STC RatingSpeech Heard through Wall or FloorNoise Control Level
25Normal speech understandablePoor
30Loud speech understandableMarginal
40Loud speech audible as a murmur but unintelligibleGood
50Loud speech barely audible Very good
>55Loud speech not heardExcellent
Publisher’s Note: MDPI stays neutral with regard to jurisdictional claims in published maps and institutional affiliations.

