Article

Factors Affecting Workplace Well-Being: Building Construction Projects

1
Department of Civil Engineering, Universitas Muhammadiyah Aceh, Banda Aceh 23245, Indonesia
2
Faculty of Built Environment, University of Malaya, Kuala Lumpur 50603, Malaysia
3
Faculty of Civil Engineering Technology, Universiti Malaysia Pahang, Gambang 26300, Malaysia
4
Unaizah College of Engineering, Qassim University, Buraydah 52571, Saudi Arabia
5
General Educational Development, Daffodil International University, Dhaka 1341, Bangladesh
*
Authors to whom correspondence should be addressed.
Buildings 2022, 12(7), 910; https://doi.org/10.3390/buildings12070910
Submission received: 7 May 2022 / Revised: 10 June 2022 / Accepted: 12 June 2022 / Published: 28 June 2022
(This article belongs to the Section Construction Management, and Computers & Digitization)

Abstract

:
This study explores the factors affecting workplace well-being in building construction projects. The objectives of this study are (1) to investigate the critical factors for workplace well-being in building construction projects, (2) to compare the critical factors between large enterprises (LEs) and small-medium enterprises (SMEs), and (3) to compare the critical factors between high-rise building construction projects and non-high-rise building construction projects. Data from 21 semi-structured interviews with construction industry professionals in Malaysia and a systematic literature review were used to develop a potential list of factors. Then, the factors were used to create a survey that was distributed to industry professionals. Data from 205 valid responses were analyzed using mean score ranking, normalization, the Kruskal–Wallis test, and overlap analysis. Fourteen critical factors were determined, including salary package, working hours, project progress, planning of the project, workers’ welfare, relationship between top management and employees, timeline of salary payment, working environment, employee work monitoring, communication between workers, insurance for construction worker, general safety and health monitoring, collaboration between top management and employee, and project leadership. This study contributes to the body of knowledge by identifying the critical factors for improving workplace well-being. The study findings allow researchers and practitioners to develop strategies to promote workplace well-being in building construction projects.

1. Introduction

Well-being encompasses both physical and mental health, leading to more comprehensive approaches to illness prevention and health promotion [1]. Lower levels of happiness have been linked to an increased risk of disease, illness, and injury, as well as impaired immune function, delayed recovery, and shorter lifespans [2,3,4,5]. Furthermore, those with low levels of happiness are less productive at work and less likely to give back to their communities [6,7]. Workloads that are demanding, deadlines that are tight, long working hours, financial concerns, and isolation are the factors that contribute to high levels of stress among construction workers. According to prior work on construction workers in the United States, 16% of those interviewed met the criteria for substantial mental distress [8]. Prior work in Australia found that construction workers have poorer mental health than the general population [9]. These prior works revealed that construction workers face difficulties in achieving workplace well-being. Therefore, in order to secure the well-being of construction workers, organizations must identify ways to promote well-being in order to avoid negative consequences such as lower productivity and project failure.
The construction industry has the second-highest suicide rate [10]. Approximately 20–25% of construction workers suffer from mental health problems [11]. Seventy-three percent of construction employees believe their employer does not give enough help regarding mental health. Although prior works proved that mental health issues exist in the construction industry, construction workers still receive little to no help in terms of mental health because the focus appears to be only on their physical well-being. Organizations have always placed a greater emphasis on physical safety than on mental health. Although the Health and Safety at Work Act of 1974 and the Management of Health and Safety at Work Regulations of 1999 mandated that employers should manage mental health and physical safety, the focus was frequently on the short term. Employers often focus on mitigating injuries and death rather than finding ways to reduce stress in workers due to long working hours or excessive workloads. Although the number of deaths on construction sites has declined from 200 to 40 in the last 60 years, the number of suicides linked to mental problems such as depression, anxiety, and stress has remained constant at around 280 each year [12]. These statistics demonstrate the severity of the problem. Creating not only physically but also psychologically secure workplaces can assist construction workers to achieve a good work–life balance, leading to better well-being [13]. Therefore, industry stakeholders need to start focusing on mental aspects of well-being as well as physical aspects of well-being.
There have been a growing number of works related to improving the mental aspect of construction workers. In ref. [14], the authors investigated 49 mental stressors in the construction industry, which could be classified into five main categories: namely, organizational stressors, task stressors, personal stressors, physical stressors, and gender-related stressors. In ref. [15], the authors suggest some strategies for improving the well-being of construction workers, including group activities in proper spaces, self-help programs and guides, volunteering, health screenings, and site-specific briefings with suitable visual aids. In ref. [16], the authors revealed the top-three factors leading to mental health issues were work pressure, emotional and physical demands, and bullying and harassment. In addition, the work revealed that the support of supervisors and communication among co-workers are effective strategies for alleviating the rate of mental health issues and their negative impacts. While existing work has provided a useful base, it is evident that prior works have not considered investigating factors affecting workplace well-being in building construction projects. To establish a healthy workplace as well as to maintain workplace well-being, employers need to be responsible for supporting employees as well as providing a workplace that promotes positive health and well-being. Addressing and managing potential health risks effectively allows employers to promote, teach, and encourage positive health practices that benefit both employees and the workplace [17]. Creating and maintaining a positive health and well-being culture is vital to building a healthy and thriving industry. Therefore, there is a need to investigate the factors affecting workplace well-being in building construction projects.
This study uses Malaysia as a case study to determine the factors affecting workplace well-being in building construction projects. The objectives are to identify the critical factors for workplace well-being in building construction projects, to compare the critical factors between large enterprises (LEs) and small-medium enterprises (SMEs), and to compare the critical factors between high-rise building construction projects and non-high-rise building construction projects. Semi-structured interviews with construction industry professionals and a systematic literature review of journal articles were conducted to develop a list of potential factors. Then, based on the list, a questionnaire was developed and distributed to Malaysian construction industry professionals. Mean score ranking, normalization, the Kruskal–Wallis test, and overlap analysis were used to analyze the data. The study addresses a list of critical factors for workplace well-being factors that can help to improve workplace well-being. In addition, significant differences in criticality between LEs and SMEs as well as between high-rise and non-high-rise are also noted. These findings contribute to the body of knowledge in the construction management domains and deepen the existing understanding of the critical factors for workplace well-being.

2. Background

2.1. Well-Being in Construction Industry

Workplace well-being encompasses all aspects of working life, from the physical environment’s quality and safety to how workers feel about their jobs, their working environment, the workplace climate, and work organization [18]. Construction companies must not only keep track of their workers’ safety performance but also measure their psychological well-being. Employers have a responsibility to support employees and offer an environment that promotes positive health and well-being in order to preserve a healthy workplace and, to the extent possible, workplace well-being. Addressing and managing health risks effectively allows companies to promote, teach, and encourage positive health practices that benefit both employees and the workplace [17]. Employers have a responsibility to establish and maintain a positive health and well-being culture in order to build a healthy and productive industry. However, this might be more difficult in construction work than white-collar industries due to the organizational structure and poor working conditions (noise, dirt, natural lighting and ventilation), especially in terms of maintaining good mental and physical health and well-being [19]. Apparently, working in the construction industry caused 70% of construction professionals to experience stress, anxiety, or despair [20]. Furthermore, approximately 20–25% of construction employees had mental health concerns.
Some researchers have conducted prior works related to well-being in the construction industry. For instance, ref. [21] investigated the mediating effect of work–home interference in the relationship between job characteristics (job demands and job resources) and work-related well-being. The findings reveal that job demands and job resources were both directly and indirectly associated with burnout through negative work–home interference. Similarly, through positive work–home interference, job resources were partially associated with work engagement, both directly and indirectly. In ref. [15], the authors examined strategies to improve mental health and well-being within the UK construction industry. The work revealed that the construction industry has significant mental health issues, which are difficult to address due to the related stigma. Group activities in appropriate venues, self-help programs and guides, volunteering, health examinations, and site-specific briefings with appropriate visual aids were among the suggested strategies to enhance workplace well-being. In ref. [22], the authors developed a framework for investigating the phenomenon of well-being within the UK construction industry. The work discovered that the construction industry’s culture of long working hours and fragmentation are associated to poor employee well-being. In ref. [23], the authors investigated the impact that rotation work has on mental and physical outcomes in rotation workers in the resources and construction sectors. According to the work, rotation work is linked to a number of negative health behaviors and consequences, including sleep issues, smoking, alcohol intake, and overweight/obesity.

2.2. Mental Health of Construcrion Workers

Several factors can contribute to developing mental health problems in the construction industry. Long working hours might have a negative impact on overall well-being since construction workers are more stressed due to project deadlines [24]. Depending on the nature of the construction firms and the complexity of the construction project, construction workers might work an average of 60 hours a week [25]. In some cases, construction workers have gone above and beyond the regular working hours in order to accomplish client goals [26]. Construction work is physically demanding, and workplace injuries and disabilities are common. Dealing with injuries and pain can put a tremendous strain on our mental well-being. Construction workers who have experienced pain and injuries due to their work have much greater levels of depression, anxiety, and stress [27]. Project overload is defined as a circumstance in which the project demands exceed an individual’s ability to handle the project [28]. Work–life balance can be affected by excessive project overload, which leads to occupational stress [29]. Due to demanding time constraints and the structure of a construction project, project managers are frequently overburdened [30]. This finding is backed up by other work that found the workload to be one of the leading causes of stress in construction projects [30,31].
Some researchers have also investigated strategies to enhance workplace well-being in the construction industry. For example, ref. [15] recommended some strategies such as conducting group activities in proper places, implementing self-help programs and guides, volunteering, conducting health screenings, and site-specific briefings with suitable visual aids. In addition, the work suggested that management should pay more attention to the thoughts and feelings of workers to enhance their engagement with the workplace and help them to achieve work–life balance while always maintaining a safe working environment. In addition, ref. [32] developed a job stress scale for construction workers. Furthermore, ref. [33] aimed to find out the effect of a group of rational emotive behavior therapy on stress management among skilled construction workers in the construction industry in Nigeria. The result revealed that the group therapy significantly improved stress and work-related irrational beliefs scores of the skilled construction workers.

2.3. Knowledge Gaps

This subsection summarizes the gaps that exist in the current body of knowledge to establish the rationale for conducting this study. Previous works have conducted research related to well-being in the construction industry, such as factors affecting mental aspects of well-being and strategies to improve workplace well-being. However, the current body of knowledge lack insights into the critical analysis of the factors affecting workplace well-being. In other words, the critical factors affecting workplace well-being in building construction projects have not been comprehensively explored. To address this gap, the critical factors affecting workplace well-being among contractors are highlighted in this study.

3. Methodology

3.1. Survey Development

Questionnaire surveys use random sampling to obtain quantitative data in a systematic manner [34]. This technique is often used in the field of construction management to obtain expert opinions [35,36]. Figure 1 shows the framework of this study.

3.1.1. Systematic Literature Review

A list of potential factors affecting workplace well-being was developed by conducting a systematic literature review (SLR) using the Preferred Reporting Items for Systematic Review and Meta-Analyses (PRISMA) method. The PRISMA method was considered significant in several prior works in the construction management field [14,37]. The first search utilized the “title/abstract/keyword” feature in the Scopus database using the terms “construction workers” OR “workers well-being” OR “Construction” OR “well-being” OR “Construction Project”. The scope is narrowed to the business and economics body of knowledge by limiting the subject areas to “business, management and accounting” and “economics, econometrics and finance”. Consequently, 229 articles were found. All of the chosen articles are peer-reviewed publications from reputable journals. Exclusion criteria include conference papers and thesis dissertations due to inadequate quality. Furthermore, articles that are not related to factors affecting workplace well-being in building construction were excluded after examining their abstract and full content. Finally, 21 articles were identified for further investigation.

3.1.2. Interview

In addition to the SLR, 21 semi-structured interviews with industry professionals were conducted over the phone to gather factors affecting workplace well-being in building construction projects. This step is a common technique used in prior construction management works to elicit additional variables [38,39]. When interviewing industry personnel, interview forms are used. The interviews were conducted in order to find additional factors that affect workplace well-being that are not currently reported. The interviewees were industry professionals with at least five years of experience in the construction industry. They also needed to be in senior or managerial positions to guarantee the reliability of the interview results. The interview began with an introduction that outlined the interview’s purpose and the discussion’s topic. The interview questions were then asked. Additional questions were asked in response to the responses of the interviewees. The follow-up questions were asked to get a better understanding of the information provided by the interviewees and to ensure the statements were accurately understood. In some cases, the interviewer rephrased the question and gave some time for the interviewees to respond if they were unable to react or elaborate on the questions asked. The interviewer expressed gratitude to the interviewees at the end of the session. A summary was prepared after each interview and sent to the respondent for validation. Then, using the thematic analysis technique described in ref. [40], the interview data were analyzed to generate a list of factors affecting workplace well-being.

3.1.3. Survey Design

To develop the survey, factors from the semi-structured interviews and SLR with similar meanings were merged, resulting in 19 factors (Table 1). On the front page, the objective of the study as well as contact details were displayed. The survey followed in two sections. The first section included questions about respondents’ backgrounds and organizations, which was essential for assessing the respondent’s reliability. The second part of the survey consisted of the 19 identified factors affecting workplace well-being. Respondents were asked to rank the criticality of the factors affecting workplace well-being on a five-point Likert scale with 1 = not critical, 2 = less critical, 3 = neutral, 4 = critical, 5 = extremely critical. The five-point Likert scale is popular for its short length [41,42] and ability to provide clear information [43]. At the end of the survey, respondents were given spaces to describe and rank any additional factors affecting workplace well-being. Appendix A presents the final form of the survey.

3.1.4. Pilot Test

A pilot test can detect any problems with the survey’s design and instrumentation [65]. Furthermore, the feedback from the pilot test is critical in refining the survey’s quality and establishing the amount of time it will take to complete it [66]. Therefore, a pilot test was conducted with two professors and two industry professionals with more than 10 years of experience in the domain of construction management. The objective of the pilot test is to eliminate ambiguous phrases and ensure the proper use of technical jargon. The survey form was given to the pilot test participants, who were requested to express their opinions on each of the survey items. After the fourth participant, the authors found that the information retrieved had reached data saturation. In ref. [67], the authors described data saturation as the tie when a researcher assumes further data collection would result in identical outcomes. Finally, based on the comments from the pilot test, the survey was finalized.

3.2. Data Collection

All industry professionals with experience in the Malaysian construction industry were the target population for this study. Because the individuals in the target population could not be listed or clearly identified (i.e., no sampling frame), the nonprobability sampling approach was utilized in this study [68]. The snowball sampling technique was employed to reach the target population since it allowed for data collection from industry experts via referrals and social media [69]. The first respondent was determined by approaching industry professionals who were working in the construction industry. After that, respondents were asked to suggest other construction professionals that they deemed appropriate for the survey. Two weeks following the initial contact, two follow-ups were sent to the target populations to boost the survey success rate. The survey was distributed starting from November 2021 until January 2022. Finally, a total of 205 valid responses were obtained.
Table 2 presents the respondents’ background information. Respondents were categorized by the type of organization, their years of experience, the size of their organization, and the type of project they were working on. All of the respondents were construction industry professionals, such as quantity surveyors, architects, engineers, and project managers with adequate knowledge in the construction industry. Based on Table 2, more than 80% of the respondents can be regarded as experts in the construction industry with at least two years of experience in construction projects, indicating that they have a great deal of experience in the field. The distribution of respondents with less than two years of working experience was approximately only 14.6%. In addition, 24.4% of the respondents were from small–medium enterprises and 75.6% from large enterprises. While 53.2% of the respondents were involved in non-high-rise building construction projects, 46.8% were involved in high-rise building construction projects. Most respondents were contractors (72.2%), followed by consultants (21%) and clients (6.8%).

4. Data Analysis

4.1. Data Reliability

Reliability analysis was performed before the analysis was conducted to assess the reliability and consistency of the survey. Cronbach’s alpha (α) is a common technique for determining the average correlation or internal consistency among variables in a questionnaire survey. α ranges from 0 to 1, where 0 indicates the survey has no research instrument reliability; on the other hand, 1 indicates that the survey has an internal consistency of reliability for all variables [70]. The α value must not be less than 0.70 in order to determine that the scale is reliable [71]. The 19 factors had an overall α value of 0.981, indicating that the measurement using the five-point Likert scale was reliable at the 5% level of significance. Thus, the collected data are appropriate for analysis.
Then, the two standard deviation method was used to screen the data to identify any outliers. Outliers are data that vary significantly and can drastically affect the results. The two standard deviation method includes calculating the intervals of two standard deviations. Outliers were defined as variables with mean values that were outside of the two standard deviation intervals. For this study, the means, standard deviations, and two standard deviation intervals of the factors were calculated. From the calculation, “workload” WF9 (mean = 3.644) was outside the two standard deviation intervals (3.232 and 3.603) and is considered an outlier. To put this another way, while the factor exists, most industry professionals do not perceive it in the same way. As a result, WF9 was eliminated from further analysis.

4.2. Mean Ranking Technique with Normalization Method

First, the mean ranking technique was used to determine the relative ranking of the factors. The mean value and standard deviation of the data were calculated. In ref. [72], the authors suggested that a smaller standard deviation indicates smaller differences between responses, and hence a mean that is more likely to be valid. Thus, if two or more factors have the same mean, the factor with the lowest standard deviation is ranked highest. After that, the critical factors were identified by using the normalization method. The method involves calculating the normalized mean values. Critical factors are those factors with normalized mean values of more than 0.60 [73]. In addition, the normalized mean values were calculated to identify the critical factor for each group, such as SME and LE as well as high-rise and non-high-rise. Many prior works use this normalization technique to determine critical factors, such as critical success factors for affordable housing [74] and key decision criteria for construction readiness of highway projects [41].

4.3. Kruskal–Wallis Test

Disagreements can exist between different organization sizes (SME and LE), different types of projects (high-rise construction and non-high-rise construction), and different respondent groups (contractor, client, and consultant). Thus, to investigate the significant differences in the ranking factors among different organization sizes, types of projects, and respondent groups, the Kruskal–Wallis test was conducted. The Kruskal–Wallis test was conducted to verify if there were significant differences among the respondents. According to ref. [75], a significant difference is established when the asymptotic significance value is lower than 0.05. Nevertheless, the Kruskal–Wallis test does not specify where the significant differences in perception lie between groups. Hence, the Mann–Whitney U statistic test was conducted as a post-hoc analysis. Conducting several Mann–Whitney U tests inflates Type-1 error; hence, the Bonferroni technique was used to recalculate the alpha value to check for this inflation. The Bonferroni technique is given as α/k, where k = number of group comparisons and α = 0.05 (5% significance test value) [76]. Hence, if the p-value of the Mann–Whitney U test is less than the calculated alpha value, then the p-value is considered significant.

4.4. Overlap Analysis

Finally, overlap analysis was employed to identify overlapping and unique critical factors between groups. The overlap analysis is a decision-making method that makes a comparison between two or more groups to identify similarities and differences [77]. Previous works have used this method to determine overlapping factors, such as the impacts of pandemic on construction organizations [78] and decision criteria for construction readiness assessment in highway projects [79]. The method uses circles to portray a group of people with overlapping edges. The overlap is formed by factors that overlap in at least two groups, whereas the non-overlapping part is formed by factors that are unique to a group. For instance, in this study, the critical factors between SMEs and LEs were compared to determine the overlapping critical factors for both organization sizes and the unique critical factors for SMEs and LEs. In addition, the critical factors between high-rise and non-high-rise were compared to identify the overlapping critical factors for both project types and the unique critical factors for high-rise and non-high-rise building projects.

5. Results

5.1. Results of Mean Ranking Analysis

Table 3 presents the results of the mean ranking analysis of the factors affecting workplace well-being in building construction projects. The results indicate that the mean of the factors ranges from 3.24 to 3.52. The critical factors are the factors with normalized mean values not less than 0.60. The results indicate that 14 of the factors have normalized values of more than 0.60 and are therefore deemed as the critical factors affecting workplace well-being. Salary package (WF14) is the critical factor with the highest mean value. The other critical factors are working hours (WF19), project progress (WF6), planning of the project (WF13), workers’ welfare (WF12), relationship between top management and employees (WF16), timeline of salary payment (WF15), working environment (WF18), employee work monitoring (WF3), communication between workers (WF1), insurance for construction workers (WF10), general safety and health monitoring (WF2), collaboration between top management and employee (WF5), and project leadership (WF11).

5.2. Results of Kruskal–Wallis Test

Table 3 also shows the Kruskal–Wallis test results between organization sizes (SME and LE). Eleven factors—namely, planning of the project (WF13), workers’ welfare (WF12), the relationship between top management and employees (WF16), working environment (WF18), employee work monitoring (WF3), communication between workers (WF1) insurance for construction worker (WF10), project leadership (WF11), worker facilities (WF4), transportation facilities for construction workers (WF17), and food at the rest area (WF7)—are significantly different in terms of the differences on their rankings among SME and LE. Contrastingly, seven factors had p-values above 0.05; hence, they did not show a statistically significant difference.
Table 4 shows the Kruskal–Wallis test results for construction project types (high-rise and non-high-rise). One factor—collaboration between top management and employee (WF5)—is significantly different in terms of the differences in rankings among high-rise building projects and non-high-rise building projects. Other factors had p-values above 0.05; hence, they did not show a statistically significant difference.
Table 5 shows the Kruskal–Wallis test results for organization type. Six factors—namely, salary package (WF14), working hours (WF19), timeline of salary payment (WF15), general safety and health monitoring (WF2), working environment (WF18), and comfort at the rest area (WF8)—are significantly different in terms of the differences on their rankings among stakeholders. Contrastingly, 12 factors had p-values above 0.05; hence, they did not show a statistically significant difference.
The Kruskal–Wallis test results only showed the factors that received significantly different perceptions from contractors, clients, and consultants. The results did not establish where the significant differences lay between the organization types. Thus, a post-hoc test—the Mann–Whitney U test—was further conducted on the factors affecting workplace well-being. The study utilized a recalculated alpha value of 0.0167 (0.05/3). The results of the Mann–Whitney U test are also presented in Table 5. The results show that there is a significant difference in the ranking of all six factors between contractors and consultants because the significance values obtained are smaller than the significance test value of 0.0167. However, there are no significant differences in the ranking of factors between contractors and consultants, or between clients and consultants, because their p-values exceed 0.0167.

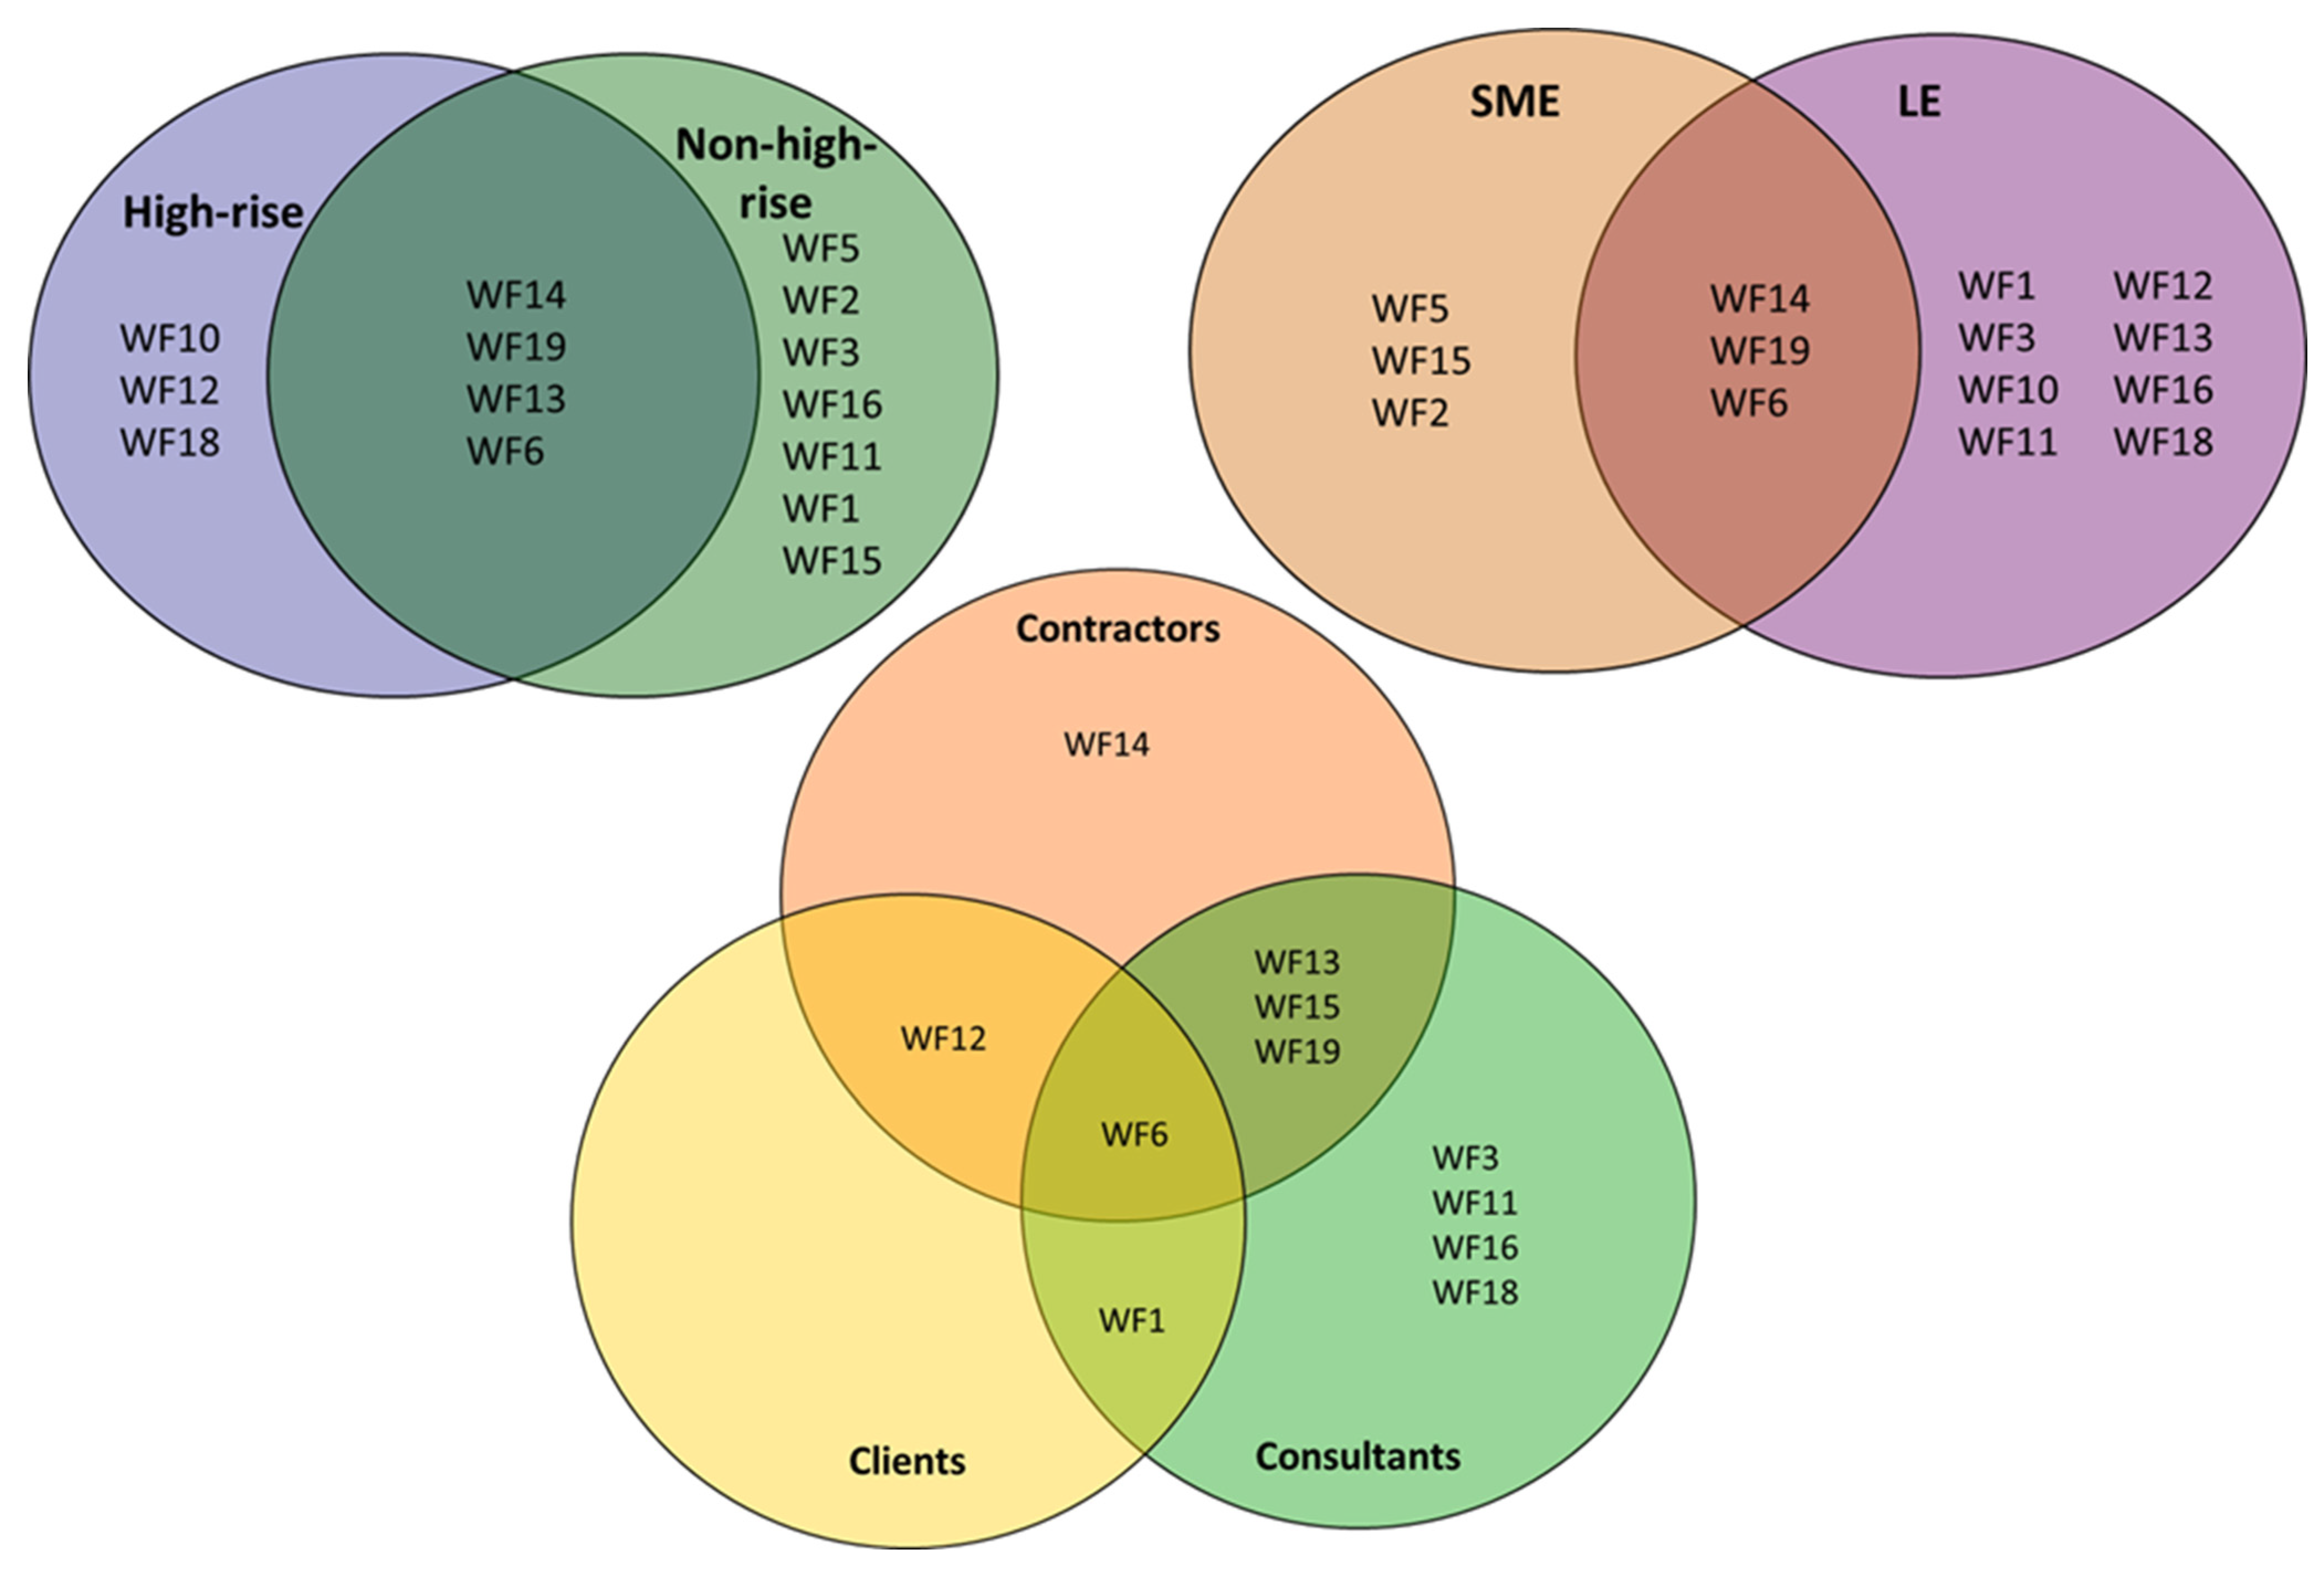
5.3. Results of Overlap Analysis

Table 3, Table 4 and Table 5 and Figure 2 present the analysis results for different organization sizes (SMEs and LEs), types (clients, contractors, and consultants), and construction project types (high-rise building construction and non-high-rise building construction). Factors with normalized mean values of more than 0.60 for each group are identified as the group’s critical factors. The overlapping critical factors between SMEs and LEs (figure) are WF14, WF19, and WF6. The unique critical factors for SMEs are WF5, WF15, and WF2. Conversely, there are eight unique critical factors for LE: WF1, WF3, WF10, WF11, WF12, WF13, WF16, and WF18.
The overlapping critical factor between clients, consultants, and contractors is WF6. The overlapping critical factor for contractors and clients is WF12. The overlapping critical factors for consultants and contractors are WF13, WF15, and WF19. The overlapping critical factor for clients and consultants is WF1. The unique critical factor for contractors is WF14.
On the other hand, the overlapping critical factors between high-rise and non-high-rise projects are WF14, WF19, WF13, and WF6. High-rise building construction has unique critical factors: WF10, WF12, and WF18. In comparison, non-high-rise building construction has unique critical factors: WF5, WF2, WF3, WF16, WF11, WF1, and WF15.

6. Discussions

6.1. Project Progress (WF6)

WF6 is a single unique critical factor for contractors, clients, and consultants. Construction projects frequently do not go as planned, when materials are delivered late or damaged, projects are delayed by severe weather, and change orders push schedules back even more. Construction workers bear the brunt of the stress when projects fall behind schedule. Clients expect contractors to complete projects on time and within budget. Delays, after all, cost money. Subcontractors are frequently used by contractors who are required to meet tight schedules in order for them to complete the task on time. Unrealistic expectations lead to unrealistic work schedules, which raises the pressure on workers to move quicker, potentially resulting in injury. Workers are frequently requested to work overtime in order to get back on track. Productivity will decrease as the number of hours worked per week increases and/or as project duration increases [80]. In addition, working long hours can lead to health problems and an increased risk of accidents due to fatigue [81]. When time is limited, safety, as well as workers’ physical and mental well-being, suffers. Thus, it is critical to understand the signs and symptoms of a low level of well-being and its potential impact on individual worker safety and health, as well as the safety of co-workers.

6.2. Workers’ Welfare (WF12)

WF12 is a single unique critical factor for contractors and clients. Welfare is a basic necessity for workers and is required by the law. In ref. [82], the authors state that it is the responsibility of principal contractors and employers to provide appropriate welfare facilities. Neglecting employee well-being will not only result in difficulties such as more absenteeism, lower productivity, and higher staff turnover but will also make the employer partially responsible for any employee welfare issues. This means that the employer will not only be responsible for the costs of replacing team members as workers take time off for health and well-being purposes, but the organization may also be responsible for additional expenditures related to workers’ compensation claims. Workers’ welfare is vital not just for the employees but also for the organization as a whole. Promoting workers’ welfare initiatives is beneficial for stress reduction and the development of a healthy work environment in which people and organizational performance can flourish.

6.3. Planning of the Project (WF13)

WF13 is one of the critical factors for contractors and consultants. Construction workers might be stressed by inadequate project planning, such as unclear job roles and unrealistic timelines that are beyond their abilities. Project role ambiguity refers to a lack of clarity in an individual’s job responsibilities because of project complexity, inadequate project information, and the lack of a deadline for finishing construction projects [31]. In addition to tight time constraints and ambiguous role responsibilities, construction workers may experience burnout, especially in large construction projects [83]. To overcome role ambiguity in construction projects with different teams of contractors and subcontractors, construction project organizations require robust information management and effective job allocation [84].

6.4. Timeline of Salary Payment (WF15)

WF15 is one of the critical factors for contractors and consultants. Late and unfair payments have a devastating effect on the construction industry [85]. In a BESA survey, 66% of respondents reported that they received payments late (five days or more beyond the agreed date) on a frequent or very frequent basis. A further 64% claimed that these practices had caused them to lose sleep, and 51% said it had affected their mental health, of which 72% said they were stressed and one-third said they had anxiety, severe anger, depression, or insomnia due to the stress. Late payment results in employees missing out on paying their mortgage or rent, as well as other important expenses, including utilities and loan repayments. This can have a negative impact on employee morale, induce workplace conflict, and even force employees to seek alternative jobs. Contractors also suffer from anxiety and depression due to cash flow difficulties because of late payments. With the negative impacts of late payment spilling over into personal finances and health, it is no surprise that this can sometimes affect relationships outside of work as well.

6.5. Working Hours (WF19)

WF19 is one of the critical factors for contractors and consultants. High work hours and long working weeks are a major source of stress for workers, and they can have a negative impact on their mental health [86]. Construction professionals are required to work nonstandard work schedules, particularly on weekends, resulting in work–family conflicts and job-related psychological injuries [87]. The unpredictable nature of the construction industry can negatively impact workers’ work–life balance and well-being. Some of the uncontrollable factors that create uncertainty and stress in construction projects are the need for extra work, longer or changed hours, resource reallocation, work halts or restarts, and weather. If construction workers refuse to work longer hours when required, it might jeopardize their job security and livelihood, as well as placing them at the bottom of their employer’s priority list. As a result, long hours and overtime are expected by construction workers, which may negatively impact their mental health. In order to promote and enhance psychological well-being, the construction industry as a whole may need to reevaluate how it maintains work–life balance for construction workers.

6.6. Salary Package (WF14)

WF14 is a single unique critical factor affecting workplace well-being for contractors. According to the well-being survey by the American Psychological Association in 2017, low pay remains the leading cause of workplace stress [88]. Construction employees receive inadequate pay, which contributes to stress. Low salaries cause stress and strain, preventing construction workers from fulfilling their basic necessities. Furthermore, they are unable to educate and feed their children. They experience stress and anxiety, which leads to alcohol intake. Besides providing greater access to mental health resources, the most meaningful way employers can support workers is through increased payment. One in three workers said if they could have just one extra work benefit, they would want more money [89].

7. Conclusions

This study uses Malaysia as a case study to investigate the factors affecting workplace well-being in building construction projects. The objectives of this study are to identify the critical factors for workplace well-being, to compare the critical factors between LEs and SMEs, and to compare the critical factors between high-rise building construction projects and non-high-rise building construction projects. Data from 21 semi-structured interviews with industry professionals and a systematic literature review of published articles are combined, providing 19 potential factors that affect workplace well-being. Then, 205 instances of survey data completed by the industry professionals were analyzed using mean ranking analysis, normalization, agreement analysis, and overlap analysis. The analyses reveal 14 critical factors for workplace well-being out of the 19 potential factors. The critical factors include salary package, working hours, project progress, planning of the project, workers’ welfare, relationship between top management and employees, timeline of salary payment, working environment, employee work monitoring, communication between workers, insurance for construction worker, general safety and health monitoring, collaboration between top management and employee, and project leadership. The study addresses the factors affecting workplace well-being in building construction projects. In addition to providing additional insights into the workplace well-being of construction workers, researchers and practitioners can benefit from this study into promoting workplace well-being. The study’s main theoretical contribution is that it provides a better understanding of the factors that influence workplace well-being. Most previous works only focus on physical safety rather than mental aspects of construction workers. Addressing and managing health risks effectively allows employers to promote, teach, and encourage healthy lifestyles that benefit both employees and the workplace.
Despite the importance of the findings, the study has some limitations that should be addressed in future research. To start with, the results are highly reliant on the local situation in each country. Thus, the findings should be applied to other countries with caution and appropriate alterations. A wider scope of data collection across many countries and places can allow for comparisons and insights into the impact of applying the results and their applicability. Second, because the data used in this study are obtained from surveys by industry professionals on building projects, the factors are related to building projects only. Thus, the authors encourage future researchers to replicate this study for other types of projects, such as highways and other types of infrastructure. Third, in this study, the survey was distributed to construction professionals such as project managers, quantity surveyors, architects, and engineers, not hands-on construction workers. A construction worker is a laborer employed on a construction site to perform various practical tasks that require physical strength. Thus, future scholars can conduct similar research using hands-on construction workers as the target population. There might be new and different factors that affect construction workers. Fourth, future researchers should study the factors that affect workplace well-being in building construction projects using more advanced statistical analytic approaches, such as sensitivity analysis and structural equation modeling. Creating a causal relationship between the factors will assist in the understanding of each factor. However, the findings of this study still provide useful information about the factors that influence workplace well-being in construction projects. Future work could include developing roadmaps based on the study’s findings while adjusting them to local needs.

Author Contributions

Conceptualization, A.R.R., A.R.A. and R.A.R.; methodology, A.R.R., A.R.A. and R.A.R.; validation, R.A.R. and S.A.; formal analysis, A.R.R.; investigation, A.R.R.; resources, A.R.R., R.A.R. and S.A.; data curation, A.R.A. and R.A.R.; writing—original draft preparation, A.R.R.; writing—review and editing, H.A.R., R.A.R. and S.A.; visualization, A.R.R.; supervision, R.A.R.; project administration, R.A.R. and S.A.; funding acquisition, R.A.R. and S.A. All authors have read and agreed to the published version of the manuscript.

Funding

This study was funded by Universiti Malaysia Pahang [PDU213001-1]. The publication fee was funded by the Deanship of Scientific Research, Qassim University.

Institutional Review Board Statement

Ethical review and approval were waived for this study, due to the study involving anonymous data collection.

Informed Consent Statement

Informed consent was obtained from all subjects involved in the study.

Data Availability Statement

The data presented in this study are available on request from the corresponding author. The data are not publicly available due to some data being proprietary or confidential in nature. Therefore, the data may only be provided with restrictions (e.g., anonymized data).

Acknowledgments

This study was funded by Universiti Malaysia Pahang [PDU213001-1]. The researchers would like to thank the Deanship of Scientific Research, Qassim University for funding the publication of this study. The authors are also grateful to the editors and the anonymous reviewers for their insightful comments, which helped improve this paper’s quality.

Conflicts of Interest

The authors declare no conflict of interest. The funders had no role in the design of the study; in the collection, analyses, or interpretation of data; in the writing of the manuscript, or in the decision to publish the results.

Appendix A. The Questionnaire Survey Used in This Study

Factors affecting workplace well-being in building construction projects.

Appendix A.1. Respondent’s Profile

Instruction: Please provide the following information.
Your type of organization:
  • Client (e.g., government, developers)
  • Consultant
  • Contractor
  • Others: __________
Years of experience in the construction industry:
  • Less than 2 years
  • 2–5 years
  • 6–9 years
  • More than 10 years
Types of projects involved:
  • High-rise building construction
  • Non-high-rise building construction
Organization sizes:
  • Small-medium enterprises
  • Large enterprises

Appendix A.2. Factors Affecting Workplace Well-Being in Building Construction Projects

Table A1. Please rate the criticality of the following factors that are affecting workplace well-being in building construction projects.
FactorsCriticality
Factors affecting workplace well-being in random order using online survey platformNot CriticalSlightly
Critical
Moderately CriticalCriticalNot Critical
Not CriticalSlightly
Critical
Moderately CriticalCriticalNot Critical
Not CriticalSlightly
Critical
Moderately CriticalCriticalNot Critical
Not CriticalSlightly
Critical
Moderately CriticalCriticalNot Critical
Not CriticalSlightly
Critical
Moderately CriticalCriticalNot Critical
Table A2. Please indicate and rate any additional factors affecting workplace well-being in building construction projects.
Additional FactorsCriticality
Additional factors to be added by survey respondentsNot CriticalSlightly
Critical
Moderately CriticalCriticalNot Critical
Not CriticalSlightly
Critical
Moderately CriticalCriticalNot Critical
Not CriticalSlightly
Critical
Moderately CriticalCriticalNot Critical

References

  1. Dunn, H.L. High Level Wellness; R.W. Beatty, Ltd.: Arlington, VA, USA, 1973. [Google Scholar]
  2. Pressman, S.D.; Cohen, S. Does positive affect influence health? Psychol. Bull. 2005, 131, 925. [Google Scholar] [CrossRef] [PubMed]
  3. Ostir, G.V.; Markides, K.S.; Black, S.A.; Goodwin, J.S. Emotional well-being predicts subsequent functional independence and survival. J. Am. Geriatr. Soc. 2000, 48, 473–478. [Google Scholar] [CrossRef] [PubMed]
  4. Ostir, G.V.; Markides, K.S.; Peek, M.K.; Goodwin, J.S. The association between emotional well-being and the incidence of stroke in older adults. Psychosom. Med. 2001, 63, 210–215. [Google Scholar] [CrossRef] [PubMed]
  5. LFredrickson, B.; Levenson, R.W. Positive emotions speed recovery from the cardiovascular sequelae of negative emotions. Cogn. Emot. 1998, 12, 191–220. [Google Scholar] [CrossRef] [Green Version]
  6. Frey, B.S.; Stutzer, A. What can economists learn from happiness research? J. Econ. Lit. 2002, 40, 402–435. [Google Scholar] [CrossRef]
  7. Tov, W.; Diener, E. The Well-Being of Nations: Linking Together Trust, Cooperation, and Democracy. In The Science of Well-Being; Springer: Dordrecht, The Netherlands, 2009; pp. 155–173. [Google Scholar]
  8. Jebelli, H.; Choi, B.; Lee, S. Application of wearable biosensors to construction sites. I: Assessing workers’ stress. J. Constr. Eng. Manag. 2019, 145, 04019079. [Google Scholar] [CrossRef]
  9. Lingard, H.; Turner, M. Improving the health of male, blue collar construction workers: A social ecological perspective. Constr. Manag. Econ. 2015, 33, 18–34. [Google Scholar] [CrossRef]
  10. Centers for Disease Control and Prevention. 2016. Available online: https://www.cdc.gov/mmwr/volumes/69/wr/mm6903a1.htm#:~:text=The%20five%20major%20industry%20groups,3)%20Other%20Services%20(e.g.%2C (accessed on 28 April 2022).
  11. Holistic Healthcare Group. 2020. Available online: https://theholistichealthcaregroup.com/2020/02/mental-health-in-the-construction-industry/ (accessed on 4 May 2022).
  12. Sanderson, R. Mental Health Focus: What is the Construction Industry Helpline? 2017. Available online: https://www.shponline.co.uk/what-is-the-construction-industry-helpline-bill-hill-explains/ (accessed on 4 May 2022).
  13. Turner, M.; Lingard, H. Work-life fit: Identification of demand and resource typologies within a systems framework. Constr. Manag. Econ. 2016, 34, 377–392. [Google Scholar] [CrossRef]
  14. Tijani, B.; Jin, X.; Osei-Kyei, R. A systematic review of mental stressors in the construction industry. Int. J. Build. Pathol. Adapt. 2020, 39, 433–460. [Google Scholar] [CrossRef]
  15. Campbell, M.A.; Gunning, J.G. Strategies to improve mental health and well-being within the UK construction industry. Proc. Inst. Civ. Eng. Manag. Procure. Law 2020, 173, 64–74. [Google Scholar] [CrossRef]
  16. Rouhanizadeh, B.; Kermanshachi, S. Causes of the Mental Health Challenges in Construction Workers and Their Impact on Labor Productivity. In Tran-SET 2021; American Society of Civil Engineers: Reston, VA, USA, 2021; pp. 16–26. [Google Scholar]
  17. Kumar, S.; Preetha, G.S. Health promotion: An effective tool for global health. Indian J. Community Med. Off. Publ. Indian Assoc. Prev. Soc. Med. 2012, 37, 5. [Google Scholar] [CrossRef] [PubMed]
  18. International Labour Organization (ILO). 2022. Available online: https://www.ilo.org/safework/areasofwork/workplace-health-promotion-and-well-being/WCMS_118396/lang--en/index.htm (accessed on 2 May 2022).
  19. Eaves, S.; Gyi, D.E.; Gibb, A.G. Building healthy construction workers: Their views on health, wellbeing and better workplace design. Appl. Ergon. 2016, 54, 10–18. [Google Scholar] [CrossRef] [PubMed] [Green Version]
  20. Chartered Institute of Building. 2006. Available online: https://www.ciob.org/sites/default/files/CIOB%20research%20-%20Occupational%20Stress%20in%20the%20Construction%20Industry%202006_0.pdf (accessed on 1 May 2022).
  21. Mostert, K.; Peeters, M.; Rost, I. Work-home interference and the relationship with job characteristics and well-being: A South African study among employees in the construction industry. Stress Health 2011, 27, e238–e251. [Google Scholar] [CrossRef]
  22. Sang, K.J.; Dainty, A.R.; Ison, S.G. The impact of the structure and culture of the construction industry on employee well-being: Directions for future research. In Proceedings of the 20th Annual ARCOM Conference, Edinburgh, UK, 1–3 September 2004; pp. 1–3. [Google Scholar]
  23. Asare, B.Y.A.; Kwasnicka, D.; Powell, D.; Robinson, S. Health and well-being of rotation workers in the mining, offshore oil and gas, and construction industry: A systematic review. BMJ Glob. Health 2021, 6, e005112. [Google Scholar] [CrossRef]
  24. Bryson, R.; Duncan, A. Mental Health in the Construction Industry Scoping Study; BRANZ: Jugeford, New Zealand, 2018; pp. 1–27. [Google Scholar]
  25. Love, P.E.D.; Edwards, D.J.; Irani, Z. Work stress, support, and mental health in construction. J. Constr. Eng. Manag. 2010, 136, 650–658. [Google Scholar] [CrossRef]
  26. Lingard, H.; Francis, V. Managing Work-Life Balance in Construction; Spon: Abingdon, UK, 2009. [Google Scholar]
  27. Turner, M.; Lingard, H. Examining the interaction between bodily pain and mental health of construction workers. Constr. Manag. Econ. 2020, 38, 1009–1023. [Google Scholar] [CrossRef]
  28. Zika-Viktorsson, A.; Sundstr€om, P.; Engwall, M. Project overload: An exploratory study of work and management in multi-project settings. Int. J. Proj. Manag. 2006, 24, 385–394. [Google Scholar] [CrossRef]
  29. Bowen, P.; Govender, R.; Edwards, P.; Cattell, K. Work-related contact, work-life conflict, psychological distress and sleep problems experienced by construction professionals: An integrated explanatory model. Constr. Manag. Econ. 2018, 36, 153–174. [Google Scholar] [CrossRef]
  30. Bowen, P.; Edwards, P.; Lingard, H.; Cattell, K. Occupational stress and job demand, control and support factors among construction project consultants. Int. J. Proj. Manag. 2014, 32, 1273–1284. [Google Scholar] [CrossRef]
  31. Leung, M.Y.; Chan, I.Y.S. Exploring stressors of Hong Kong expatriate construction professionals in Mainland China: Focus group study. J. Constr. Eng. Manag. 2012, 138, 78–88. [Google Scholar] [CrossRef]
  32. Wu, X.; Li, Y.; Yao, Y.; Luo, X.; He, X.; Yin, W. Development of construction workers job stress scale to study and the relationship between job stress and safety behavior: An empirical study in Beijing. Int. J. Environ. Res. Public Health 2018, 15, 2409. [Google Scholar] [CrossRef] [PubMed] [Green Version]
  33. Iremeka, F.U.; Okeke, S.A.; Agu, P.U.; Isilebo, N.C.; Aneke, M.; Ezepue, E.I.; Ezenwaji, I.O.; Ezenwaji, C.O.; Edikpa, E.; Chukwu, C.J.; et al. Intervention for stress management among skilled construction workers. Medicine 2021, 100, e26621. [Google Scholar] [CrossRef] [PubMed]
  34. Krosnick, J.A. Questionnaire design. In The Palgrave Handbook of Survey Research; Palgrave Macmillan: Cham, Switzerland, 2018; pp. 439–455. [Google Scholar]
  35. Zhang, L.; Liu, Q.; Wu, X.; Skibniewski, M.J. Perceiving interactions on construction safety behaviors: Workers’ perspective. J. Manag. Eng. 2016, 32, 04016012. [Google Scholar] [CrossRef]
  36. Lam, E.W.M.; Chan, A.P.C.; Chan, D.W.M.; Oladinrin, T.O. Analysis of the effectiveness of instructional strategies for construction management students. J. Prof. Issues Eng. Educ. Pract. 2016, 142, 04016001. [Google Scholar] [CrossRef]
  37. Radzi, A.R.; Rahman, R.A.; Doh, S.I. Decision making in highway construction: A systematic review and future directions. J. Eng. Des. Technol. 2021. [Google Scholar] [CrossRef]
  38. Radzi, A.R.; Rahman, R.A.; Almutairi, S. Modeling COVID-19 Impacts and Response Strategies in the Construction Industry: PLS–SEM Approach. Int. J. Environ. Res. Public Health 2022, 19, 5326. [Google Scholar] [CrossRef]
  39. Badraddin, A.K.; Radzi, A.R.; Almutairi, S.; Rahman, R.A. Critical Success Factors for Concrete Recycling in Construction Projects. Sustainability 2022, 14, 3102. [Google Scholar] [CrossRef]
  40. Braun, V.; Clarke, V. Using thematic analysis in psychology. Qual. Res. Psychol. 2006, 3, 77–101. [Google Scholar] [CrossRef] [Green Version]
  41. Radzi, A.R.; Rahman, R.A.; Doh, S.I.; Esa, M. Construction Readiness for Highway Projects: Key Decision Criteria. J. Constr. Eng. Manag. 2022, 148, 04021196. [Google Scholar] [CrossRef]
  42. Munianday, P.; Radzi, A.R.; Esa, M.; Rahman, R.A. Optimal strategies for improving organizational BIM capabilities: PLS-SEM approach. J. Manag. Eng. 2022, 38, 04022015. [Google Scholar] [CrossRef]
  43. Zhang, X.; Shen, L.; Wu, Y. Green strategy for gaining competitive advantage in housing development: A China study. J. Clean. Prod. 2011, 19, 157–167. [Google Scholar] [CrossRef]
  44. Rach, V.; Osakwe, I.; Medvedieva, O.; Rossoshanska, O.; Borulko, N. Method for configuring the composition of a project team based on the criteria of subjective well-being. Bocmoчнo-Eвponeйcкuй Жypнaл Пepeдoвых Texнoлoгий 2019, 2, 48–59. [Google Scholar]
  45. Jacobsen, H.B.; Caban-Martinez, A.; Onyebeke, L.C.; Sorensen, G.; Dennerlein, J.T.; Reme, S.E. Construction workers struggle with a high prevalence of mental distress and this is associated with their pain and injuries. J. Occup. Environ. Med./Am. Coll. Occup. Environ. Med. 2013, 55, 1197. [Google Scholar] [CrossRef] [PubMed] [Green Version]
  46. Erlanger, T.E.; Sayasone, S.; Krieger, G.R.; Kaul, S.; Sananikhom, P.; Tanner, M.; Odermatt, P.; Utzinger, J. Baseline health situation of communities affected by the Nam Theun 2 hydroelectric project in central Lao PDR and indicators for monitoring. Int. J. Environ. Health Res. 2008, 18, 223–242. [Google Scholar] [CrossRef]
  47. Pretorius, F.I.H.; Taylor, R.G. Conflict and individual coping behaviour in informal matrix organizations within the construction industry. Constr. Manag. Econ. 1986, 4, 87–104. [Google Scholar] [CrossRef]
  48. Dodanwala, T.C.; Shrestha, P. Work-family conflict and job satisfaction among construction professionals: The mediating role of emotional exhaustion. Horizon 2021, 29, 62–75. [Google Scholar] [CrossRef]
  49. Sadeghi, H.; Mohandes, S.R.; Hosseini, M.R.; Banihashemi, S.; Mahdiyar, A.; Abdullah, A. Developing an ensemble predictive safety risk assessment model: Case of Malaysian construction projects. Int. J. Environ. Res. Public Health 2020, 17, 8395. [Google Scholar] [CrossRef]
  50. Chen, Y.; Zhang, F.; Wang, Y.; Zheng, J. Work-family conflict, emotional responses, workplace deviance, and well-being among construction professionals: A sequential mediation model. Int. J. Environ. Res. Public Health 2020, 17, 6883. [Google Scholar] [CrossRef]
  51. Anger, W.K.; Kyler-Yano, J.; Vaughn, K.; Wipfli, B.; Olson, R.; Blanco, M. Total Worker Health® intervention for construction workers alters safety, health, well-being measures. J. Occup. Environ. Med. 2018, 60, 700–709. [Google Scholar] [CrossRef]
  52. Umar, T.; Egbu, C.; Honnurvali, M.S.; Saidani, M.; Al-Bayati, A.J. Briefing: Status of occupational safety and health in GCC construction. Proc. Inst. Civ. Eng. Manag. Procure. Law 2019, 172, 137–141. [Google Scholar] [CrossRef]
  53. Loudoun, R.; Townsend, K. Implementing health promotion programs in the Australian construction industry: Levers and agents for change. Eng. Constr. Archit. Manag. 2017, 24. [Google Scholar] [CrossRef]
  54. Wu, C.; Wang, F.; Zou, P.X.; Fang, D. How safety leadership works among owners, contractors and subcontractors in construction projects. Int. J. Proj. Manag. 2016, 34, 789–805. [Google Scholar] [CrossRef]
  55. Gatti, U.; Migliaccio, G.; Bogus, S.M.; Priyadarshini, S.; Scharrer, A. Using workforce’s physiological strain monitoring to enhance social sustainability of construction. J. Archit. Eng. 2013, 19, 179–185. [Google Scholar] [CrossRef]
  56. McCabe, B.; Loughlin, C.; Munteanu, R.; Tucker, S.; Lam, A. Individual safety and health outcomes in the construction industry. Can. J. Civ. Eng. 2008, 35, 1455–1467. [Google Scholar] [CrossRef] [Green Version]
  57. Mohandes, S.R.; Zhang, X. Developing a Holistic Occupational Health and Safety risk assessment model: An application to a case of sustainable construction project. J. Clean. Prod. 2021, 291, 125934. [Google Scholar] [CrossRef]
  58. Carvajal-Arango, D.; Vasquez-Hernandez, A.; Botero-Botero, L.F. Assessment of subjective workplace well-being of construction workers: A bottom-up approach. J. Build. Eng. 2021, 36, 102154. [Google Scholar] [CrossRef]
  59. He, C.; McCabe, B.; Jia, G.; Sun, J. Effects of safety climate and safety behavior on safety outcomes between supervisors and construction workers. J. Constr. Eng. Manag. 2020, 146, 04019092. [Google Scholar] [CrossRef]
  60. Ofori, G. Leadership for future construction industry: Agenda for authentic leadership. Int. J. Proj. Manag. 2008, 26, 620–630. [Google Scholar]
  61. Ju, L.; Zhao, W.; Wu, C.; Li, H.; Ning, X. Abusive supervisors and employee work-to-family conflict in Chinese construction projects: How does family support help? Constr. Manag. Econ. 2020, 38, 1158–1178. [Google Scholar] [CrossRef]
  62. Turner, M.; Mariani, A. Managing the work-family interface: Experience of construction project managers. Int. J. Manag. Proj. Bus. 2016, 9, 243–258. [Google Scholar] [CrossRef]
  63. Chih, Y.Y.; Kiazad, K.; Cheng, D.; Lajom, J.A.L.; Restubog, S.L.D. Feeling positive and productive: Role of supervisor-worker relationship in predicting construction workers’ performance in the Philippines. J. Constr. Eng. Manag. 2017, 143, 04017049. [Google Scholar] [CrossRef]
  64. Bowen, P.; Edwards, P.; Lingard, H.; Cattell, K. Predictive modeling of workplace stress among construction professionals. J. Constr. Eng. Manag. 2014, 140, 04013055. [Google Scholar] [CrossRef]
  65. Cooper, D.R.; Schindler, P. Business Research Methods, 8th ed.; McGraw-Hill: New York, NY, USA, 2003. [Google Scholar]
  66. Fellow, R.; Liu, A. Research Methods for Construction, 2nd ed.; Blackwell: Oxford, UK, 2003. [Google Scholar]
  67. Faulkner, S.L.; Trotter, S.P. Theoretical saturation. Int. Encycl. Commun. Res. Methods 2017, 1–2. [Google Scholar]
  68. Zhao, X.; Hwang, B.G.; Pheng Low, S.; Wu, P. Reducing hindrances to enterprise risk management implementation in construction firms. J. Constr. Eng. Manag. 2015, 141, 04014083. [Google Scholar] [CrossRef]
  69. Mao, C.; Shen, Q.; Pan, W.; Ye, K. Major barriers to off-site construction: The developer’s perspective in China. J. Manag. Eng. 2015, 31, 04014043. [Google Scholar] [CrossRef]
  70. Santos, J.R.A. Cronbach’s alpha: A tool for assessing the reliability of scales. J. Ext. 1999, 37, 1e5. [Google Scholar]
  71. Nunnally, J.C. Psychometric Theory; McGraw-Hill: New York, NY, USA, 1978. [Google Scholar]
  72. Staplehurst, J.; Ragsdell, G. Knowledge sharing in SMEs: A comparison of two case study organisations. J. Knowl. Manag. Pract. 2010, 11, 1–16. [Google Scholar]
  73. Xie, L.L.; Xia, B.; Hu, Y.; Shan, M.; Le, Y.; Chan, A.P. Public participation performance in public construction projects of South China: A case study of the Guangzhou Games venues construction. Int. J. Proj. Manag. 2017, 35, 1391–1401. [Google Scholar] [CrossRef]
  74. Adabre, M.A.; Chan, A.P.; Darko, A.; Osei-Kyei, R.; Abidoye, R.; Adjei-Kumi, T. Critical barriers to sustainability attainment in affordable housing: International construction professionals’ perspective. J. Clean. Prod. 2020, 253, 119995. [Google Scholar] [CrossRef]
  75. Siegel, S.; Castellan, N.J. Nonparametric statistics for the behavioral sciences., 2nd ed.; McGraw Hill: New York, NY, USA, 1988. [Google Scholar]
  76. Corder, G.W.; Foreman, D.I. Nonparametric Statistics: A Step-by-Step Approach, 2nd ed.; John Wiley & Sons: Hoboken, NJ, USA, 2014. [Google Scholar]
  77. Heberle, H.; Meirelles, G.V.; da Silva, F.R.; Telles, G.P.; Minghim, R. InteractiVenn: A webbased tool for the analysis of sets through venn diagrams. BMC Bioinform. 2015, 16, 169. [Google Scholar] [CrossRef]
  78. King, S.S.; Rahman, R.A.; Fauzi, M.A.; Haron, A.T. Critical analysis of pandemic impact on AEC organizations: The COVID-19 case. J. Eng. Des. Technol. 2021, 20, 358–383. [Google Scholar] [CrossRef]
  79. Radzi, A.R.; Rahman, R.A.; Doh, S.I.; Esa, M. A comparative study on the readiness parameters of highway construction projects. IOP Conf. Ser. Earth Environ. Sci. 2021, 641, 012008. [Google Scholar] [CrossRef]
  80. Hanna, A.S.; Taylor, C.S.; Sullivan, K.T. Impact of extended overtime on construction labor productivity. J. Constr. Eng. Manag. 2005, 131, 734–739. [Google Scholar] [CrossRef]
  81. Dong, X. Long workhours, work scheduling and work-related injuries among construction workers in the United States. Scand. J. Work. Environ. Health 2005, 31, 329–335. [Google Scholar] [CrossRef] [Green Version]
  82. Health and Safety Executive. Summary of Duties under Construction (Design and Management) Regulations 2015 (CDM 2015) HSE, Liverpool, UK. 2019. Available online: http://www.hse.gov.uk/construction/cdm/2015/summary.htm (accessed on 27 April 2022).
  83. Leung, M.Y.; Chan, Y.S.; Chong, A.M.L. Chinese values and stressors of construction professionals in Hong Kong. J. Constr. Eng. Manag. 2010, 136, 1289–1298. [Google Scholar] [CrossRef]
  84. Jepson, J.M.; Kirytopoulos, K.; London, K. Exploring project managers’ perception of stress when working in increasingly complex construction projects. Constr. Econ. Build. 2017, 17, 47–67. [Google Scholar] [CrossRef] [Green Version]
  85. Building Engineering Services Association. 2019. Available online: https://www.pbctoday.co.uk/news/planning-construction-news/late-payment-issues-solving/68682/ (accessed on 29 April 2022).
  86. Langdon, R.R.; Sawang, S. Construction workers’ well-being: What leads to depression, anxiety, and stress? J. Constr. Eng. Manag. 2018, 144, 04017100. [Google Scholar] [CrossRef] [Green Version]
  87. Lingard, H.; Francis, V.; Turner, M. The rhythms of project life: A longitudinal analysis of work hours and work-life experiences in construction. Constr. Manag. Econ. 2010, 28, 1085–1098. [Google Scholar] [CrossRef]
  88. American Psychological Association. 2017. Available online: https://www.apa.org/news/press/releases/stress/2017/state-nation.pdf (accessed on 4 April 2022).
  89. American Psychological Association. 2022. Available online: https://www.apa.org/pubs/reports/work-well-being/compounding-pressure-2021.html (accessed on 4 April 2022).
Figure 1. Study framework.
Buildings 12 00910 g001
Figure 2. Results of overlap analysis.
Buildings 12 00910 g002
Table 1. Factors affecting workplace well-being from the interviews and literature review.
CodeFactors Affecting Workplace Well-BeingSources
WF1Communication between workersInterview, [44,45,46,47,48,49,50]
WF2General safety and health monitoringInterview, [46,50,51,52,53,54,55,56,57,58,59]
WF3Employee work monitoring[49,58]
WF4Worker facilitiesInterview, [46]
WF5Collaboration between top management and employeeInterview
WF6Project progressInterview, [50,55,57]
WF7Food at the rest area[51]
WF8Comfort at the rest area[51]
WF9WorkloadInterview, [47,56,58,60]
WF10Insurance for construction workerInterview
WF11Project leadership[56,57,59,60,61]
WF12Workers’ welfareInterview, [48]
WF13Planning of the projectInterview
WF14Salary packageInterview, [62]
WF15Timeline of salary paymentInterview, [62]
WF16Relationship between top management and employees[56,59,61,63]
WF17Transportation facilities for construction workersInterview, [46]
WF18Working environment[50,53,58]
WF19Working hoursInterview, [48,49,50,56,58,61,64]
Table 2. Respondents profile.
CharacteristicsCategoriesFrequencyPercent (%)
Type of organizationContractor14872.2
Client146.8
Consultant4321.0
Years of experience in construction industryLess than 2 years3014.6
2–5 years9244.9
6–9 years4120.0
More than 10 years4220.5
Organization sizesSmall-medium enterprises5024.4
Large enterprises15575.6
Types of projects involvedHigh-rise construction9646.8
Non-high-rise construction10953.2
Table 3. Results of mean ranking analysis and Kruskal–Wallis test according to organization sizes.
CodeAll RespondentsLESMEK-W Test
MeanSDRankNVMeanSDNVMeanSDNV
WF143.5171.22711.000 a3.5811.2370.857 a3.3201.1861.000 a0.152
WF193.4981.26320.930 a3.5741.2430.833 a3.2601.3060.857 a0.127
WF63.4881.26330.895 a3.5741.2270.833 a3.2201.3450.762 a0.097
WF133.4631.25440.807 a3.5811.2110.857 a3.1001.3290.4760.017 *
WF123.4591.18650.789 a3.6191.1181.000 a2.9601.2610.1430.001 *
WF163.4291.23360.684 a3.5351.2130.690 a3.1001.2490.4760.031 *
WF153.4241.29170.667 a3.4841.2710.5003.2401.3490.810 a0.223
WF183.4201.20480.649 a3.5481.1520.738 a3.0201.2860.2860.007 *
WF33.4151.23290.632 a3.5351.2020.690 a3.0401.2610.3330.014 *
WF13.4151.291100.632 a3.5481.2440.738 a3.0001.3550.2380.009 *
WF103.4101.200110.614 a3.5421.1580.714 a3.0001.2450.2380.012 *
WF23.4101.236120.614 a3.4901.2130.5243.1601.2830.619 a0.097
WF53.4101.236130.614 a3.4521.2440.3813.2801.2130.905 a0.316
WF113.4101.313140.614 a3.5231.2760.643 a3.0601.3760.3810.042 *
WF43.3121.245150.2633.4321.2170.3102.9401.2680.0950.013 *
WF83.2881.155160.1753.3811.1180.1193.0001.2290.2380.052
WF173.2831.191170.1583.3941.1650.1672.9401.2190.0950.020 *
WF73.2391.123180.0003.3481.1020.0002.9001.1290.0000.014 *
Notes: SD = standard deviation; NV = normalization value = (mean—minimum mean)/(maximum mean—minimum mean); a = critical factors; K-W test = Kruskal–Wallis test; * = significant at 5% (0.05).
Table 4. Results of mean ranking analysis and Kruskal–Wallis test according to project types.
CodeHigh-RiseNon-High-RiseK–W Test
MeanSDNVMeanSDNV
WF123.4481.1321.000 a3.4681.2370.5000.814
WF63.4171.2700.903 a3.5501.2580.765 a0.384
WF143.3961.2940.839 a3.6241.1611.000 a0.247
WF103.3751.2250.774 a3.4401.1820.4120.839
WF193.3541.2480.710 a3.6241.2681.000 a0.108
WF183.3331.1580.645 a3.4951.2440.5880.312
WF133.3331.3110.645 a3.5781.1960.853 a0.177
WF33.3131.2250.5813.5051.2370.618 a0.228
WF153.3131.3240.5813.5231.2590.676 a0.275
WF163.3021.2490.5483.5411.2140.735 a0.169
WF23.3021.2580.5483.5051.2140.618 a0.215
WF113.3021.3150.5483.5051.3100.618 a0.229
WF13.2921.2890.5163.5231.2880.676 a0.154
WF53.2291.2270.3233.5691.2280.824 a0.044 *
WF43.2191.2580.2903.3941.2320.2650.303
WF83.1771.1520.1613.3851.1540.2350.190
WF73.1561.1080.0973.3121.1360.0000.232
WF173.1251.1360.0003.4221.2270.3530.057
Notes: SD = standard deviation; NV = normalization value = (mean—minimum mean)/(maximum mean—minimum mean); a = critical factors; K–W test = Kruskal–Wallis test; * = significant at 5% (0.05).
Table 5. Results of mean ranking analysis and Kruskal–Wallis test according to organization type.
CodeContractorClientConsultantK–W TestMann–Whitney
MeanSDNVMeanSDNVMeanSDNV
WF143.6281.1801.000 a2.6431.5500.4293.4191.1800.5560.039 *Cont–Cli
WF193.5611.1910.787 a2.5711.5550.2863.5811.3140.944 a0.046 *Cont–Cli
WF123.5471.1450.745 a2.7861.3690.714 a3.3721.2150.4440.070-
WF63.5471.2080.745 a2.7861.4770.714 a3.5121.3340.778 a0.135-
WF153.5141.2370.638 a2.4291.5550.0003.4421.2780.611 a0.023 *Cont–Cli
WF133.5071.2040.617 a2.5711.5550.2863.6051.2371.000 a0.037-
WF23.5001.1030.5962.5711.5050.2863.3721.4800.4440.048 *Cont–Cli
WF103.5001.1340.5962.6431.5980.4293.3491.2130.3890.091-
WF53.4931.1750.5742.5711.5550.2863.3951.2560.5000.059-
WF163.4931.1750.5742.5711.6040.2863.4881.2220.722 a0.080-
WF183.4861.1160.5532.5001.5570.1433.4881.2790.722 a0.032 *Cont–Cli
WF33.4531.1680.4472.7141.4900.5713.5121.3160.778 a0.117-
WF113.4531.2530.4472.7141.5410.5713.4881.4040.722 a0.162-
WF13.4321.2790.3832.9291.3851.000 a3.5121.2980.778 a0.364-
WF83.3991.0990.2772.4291.3990.0003.1861.1600.0000.019 *Cont–Cli
WF43.3991.1770.2772.6431.2770.4293.2331.4110.1110.076-
WF73.3111.1060.0002.5711.2840.2863.2091.0810.0560.064-
WF173.3111.1420.0002.7141.3260.5713.3721.2910.4440.203-
Notes: SD = standard deviation; NV = normalization value = (mean—minimum mean)/(maximum mean—minimum mean); a = critical factors; K–W test = Kruskal-Wallis test; * = significant at 5% (0.05); Cont–cli = Contractor–Client.
Publisher’s Note: MDPI stays neutral with regard to jurisdictional claims in published maps and institutional affiliations.

