Article

Combined Greening Strategies for Improved Results on Carbon-Neutral Urban Policies

by
Javier Orozco-Messana
1,*,
Milagro Iborra-Lucas
2 and
Raimon Calabuig-Moreno
1
1
Institute for Materials Technology, Universitat Politecnica de Valencia, 46022 Valencia, Spain
2
Built Environment Department, Universitat Politecnica de Valencia, 46022 Valencia, Spain
*
Author to whom correspondence should be addressed.
Buildings 2022, 12(7), 894; https://doi.org/10.3390/buildings12070894
Submission received: 3 June 2022 / Revised: 16 June 2022 / Accepted: 20 June 2022 / Published: 24 June 2022
(This article belongs to the Section Building Energy, Physics, Environment, and Systems)

Abstract

:
Starting from historical environmental records of the Benicalap neighbourhood in Valencia, this paper presents an energy model contributing to the assessment of carbon-neutral city policies for several nature-based solution (NBS) pilots extended to the neighbourhood level and combined with building façade renovation proposals. Accurate monitoring of several NBS pilot strategies was studied to validate a computational-fluid-dynamic (CFD) microclimate flux (both storage heat flux and latent heat flux) model, allowing a joint understanding of humidity and heat dynamics for the pilots under study. When expanded at a neighbourhood level, the combined effect of NBSs and energy dynamics (from buildings and vegetation) on neighbourhood microclimates is used to assess the optimal combination of urban renovation policies for energy efficiency and consequently carbon footprint reduction.

1. Introduction

The United Nations (UN) sustainable development goal 11 on “Making cities and human settlements inclusive, safe, resilient and sustainable” [1] is becoming the greatest challenge for the implementation of the European Green Deal [2]. Cities are the key driving element for achieving the UN Glasgow climate pact of carbon neutrality by 2050, as developed by the key outcomes of the COP26 conference [3]. Although cities occupy only 4% of the EU’s land area, they hold 75% of EU citizens, while consuming over 65% of the world’s energy with an impact on the world’s carbon footprint of higher than 70% [3].
The covenant of EU mayors adopted on November 2021 the “100 Climate-Neutral and Smart Cities” initiative [4] urging EU cities to take action on fast and effective carbon reduction policies.
Urban development policies have ignored climate effects and the accumulated elimination of green surfaces together with the huge concentration of urban thermal storage continuously fed by urban heat emissions, which have consistently boosted the urban heat-island effect (HIE) [5]. Although smart cities present a comprehensive historical record of relevant variables for these decision-making processes, few tools are available for facilitating the combined assessment of sustainability policies at the neighbourhood level.
Urban Green Rating Systems (UGRSs) are the most widely accepted proposal from the scientific community, although with a very fragmented approach, as can be seen in Figure 1 (obtained using the VOS viewer v.1.6.18 [6] software on a full bibliography analysis through the Dimensions bibliographic database [7]). The most advanced green rating systems have been developed in the US with a holistic approach to the problem. One of the most relevant analyses on current systems has been developed by Elena Lucci [8], who concludes on the interdisciplinary nature of urban sustainability for long-term environmental impact. The heritage component calls for transdisciplinary actions based on a carbon reduction strategy compatible with a participative social approach for delivering a comprehensive approach.
Although UGRSs are excellent for assessing existing implementations, they have limited scope for evaluating a future evolution of ratings on specific urban development plans whose impact on all rated dimensions is very difficult to simulate.
Urban heritage environments pose an additional challenge that is becoming increasingly relevant for old cities wishing to advance Sustainable Development Goal SDG 11 [1]. The need to protect heritage at the urban level requires a widened perspective where a neighbourhood focus contributes to an enhanced cost-effectiveness of urban policies [8]. City planning becomes more efficient when designed from a synergetic approach, avoiding the constraints emanating from building-based approaches [9].
Following the detailed analysis of UGRSs performed by Lucci et al. [8], none of the current systems ensure a sustainable urban development respectful to historical city morphology. This paper introduces a blended approach based on a comprehensive Life Cycle baseline (established from the neighbourhood carbon footprint), evaluating the climate neutrality layer and including the influence of NBSs and traffic and proposing strategies for building refurbishment that complies with existing city heritage preservation policies.
NBSs are an excellent approach to urban climate resilience [10]. However, their effect can be enhanced by tuning climate variables with the buildings’ response to them for a joint contribution to the neighbourhood energy balance [11]. Joint impact assessment of urban development strategies should consider the combined contribution on climate mitigation from street-level physical climate parameters and their influence at the micro level on building performance. A joint balance on moisture content, latent heat, thermal storage dynamics, and operational energy building requirements can optimise latent heat fluxes from evaporation and transpiration as well as thermal energy dynamics [12].
In the proposed strategy for urban heritage preservation policies, NBSs must be combined with heritage-compliant strategies, such as new materials for façades (phase change materials) that maintain the heritage requirements while contributing notably to climate mitigation strategies. Therefore, the carbon-footprint evolution of the combination (street climate model + energy assessment of the heritage compliant urban policy) will render a comprehensive approach to the problem.
The main physical climate variables are wind, temperature (air and black bulb), and humidity. Together, they configure a complex scenario for modelling urban environments at the street level. They must also incorporate radiant and convective heat loss for completely evaluating street microclimates through a simplified CFD balance [13].
Cities develop a distinctive, human-driven environment where vegetation and natural materials are replaced by buildings and service elements that render unique microclimates. The first analysis of urban environments was performed by Luke Howard in his book “the Climate of London” [14]. In this volume, urban microclimates are evaluated and presented in detail, showing higher temperatures than their rural equivalents. Their ability to store and retain more heat was identified for the first time. This phenomenon was defined for the first time by Manley [15] in 1958 as the Heat Island Effect (HIE). HIE is related to local humidity and temperature evolutions controlled by the urban materials’ physical ability to store and release heat and humidity. The range of associated effects is driven by convection exchanges at the surface level, which can be controlled by vegetation for better living conditions [16]. Meteorological evolution can be used to ensure efficient building energy demands [17] with a well-engineered built environment.
This paper implements the full process described for the Benicalap neighbourhood in Valencia (Spain) starting from a heritage analysis of the neighbourhood; combined NBSs/traffic interventions are simulated at a neighbourhood level (from pilot evidence), and a refurbishment strategy is simulated for obtaining the carbon-footprint evolution for the joint neighbourhood model.
Under the H2020 Grow-Green (EC grant 730283) project, climate records were used as input for the street CFD model developed for a reshaped street morphology, implementing the selected NBSs pilots at neighbourhood level (after verification of the model for each NBS from pilot impact using detailed climate monitoring). Building interaction is then evaluated jointly (as boundary conditions) through the LCA balance of the final carbon footprint for the relevant façade refurbishment solutions obtained (according to heritage constraints) using a digital model of the neighbourhood.

2. Materials and Methods

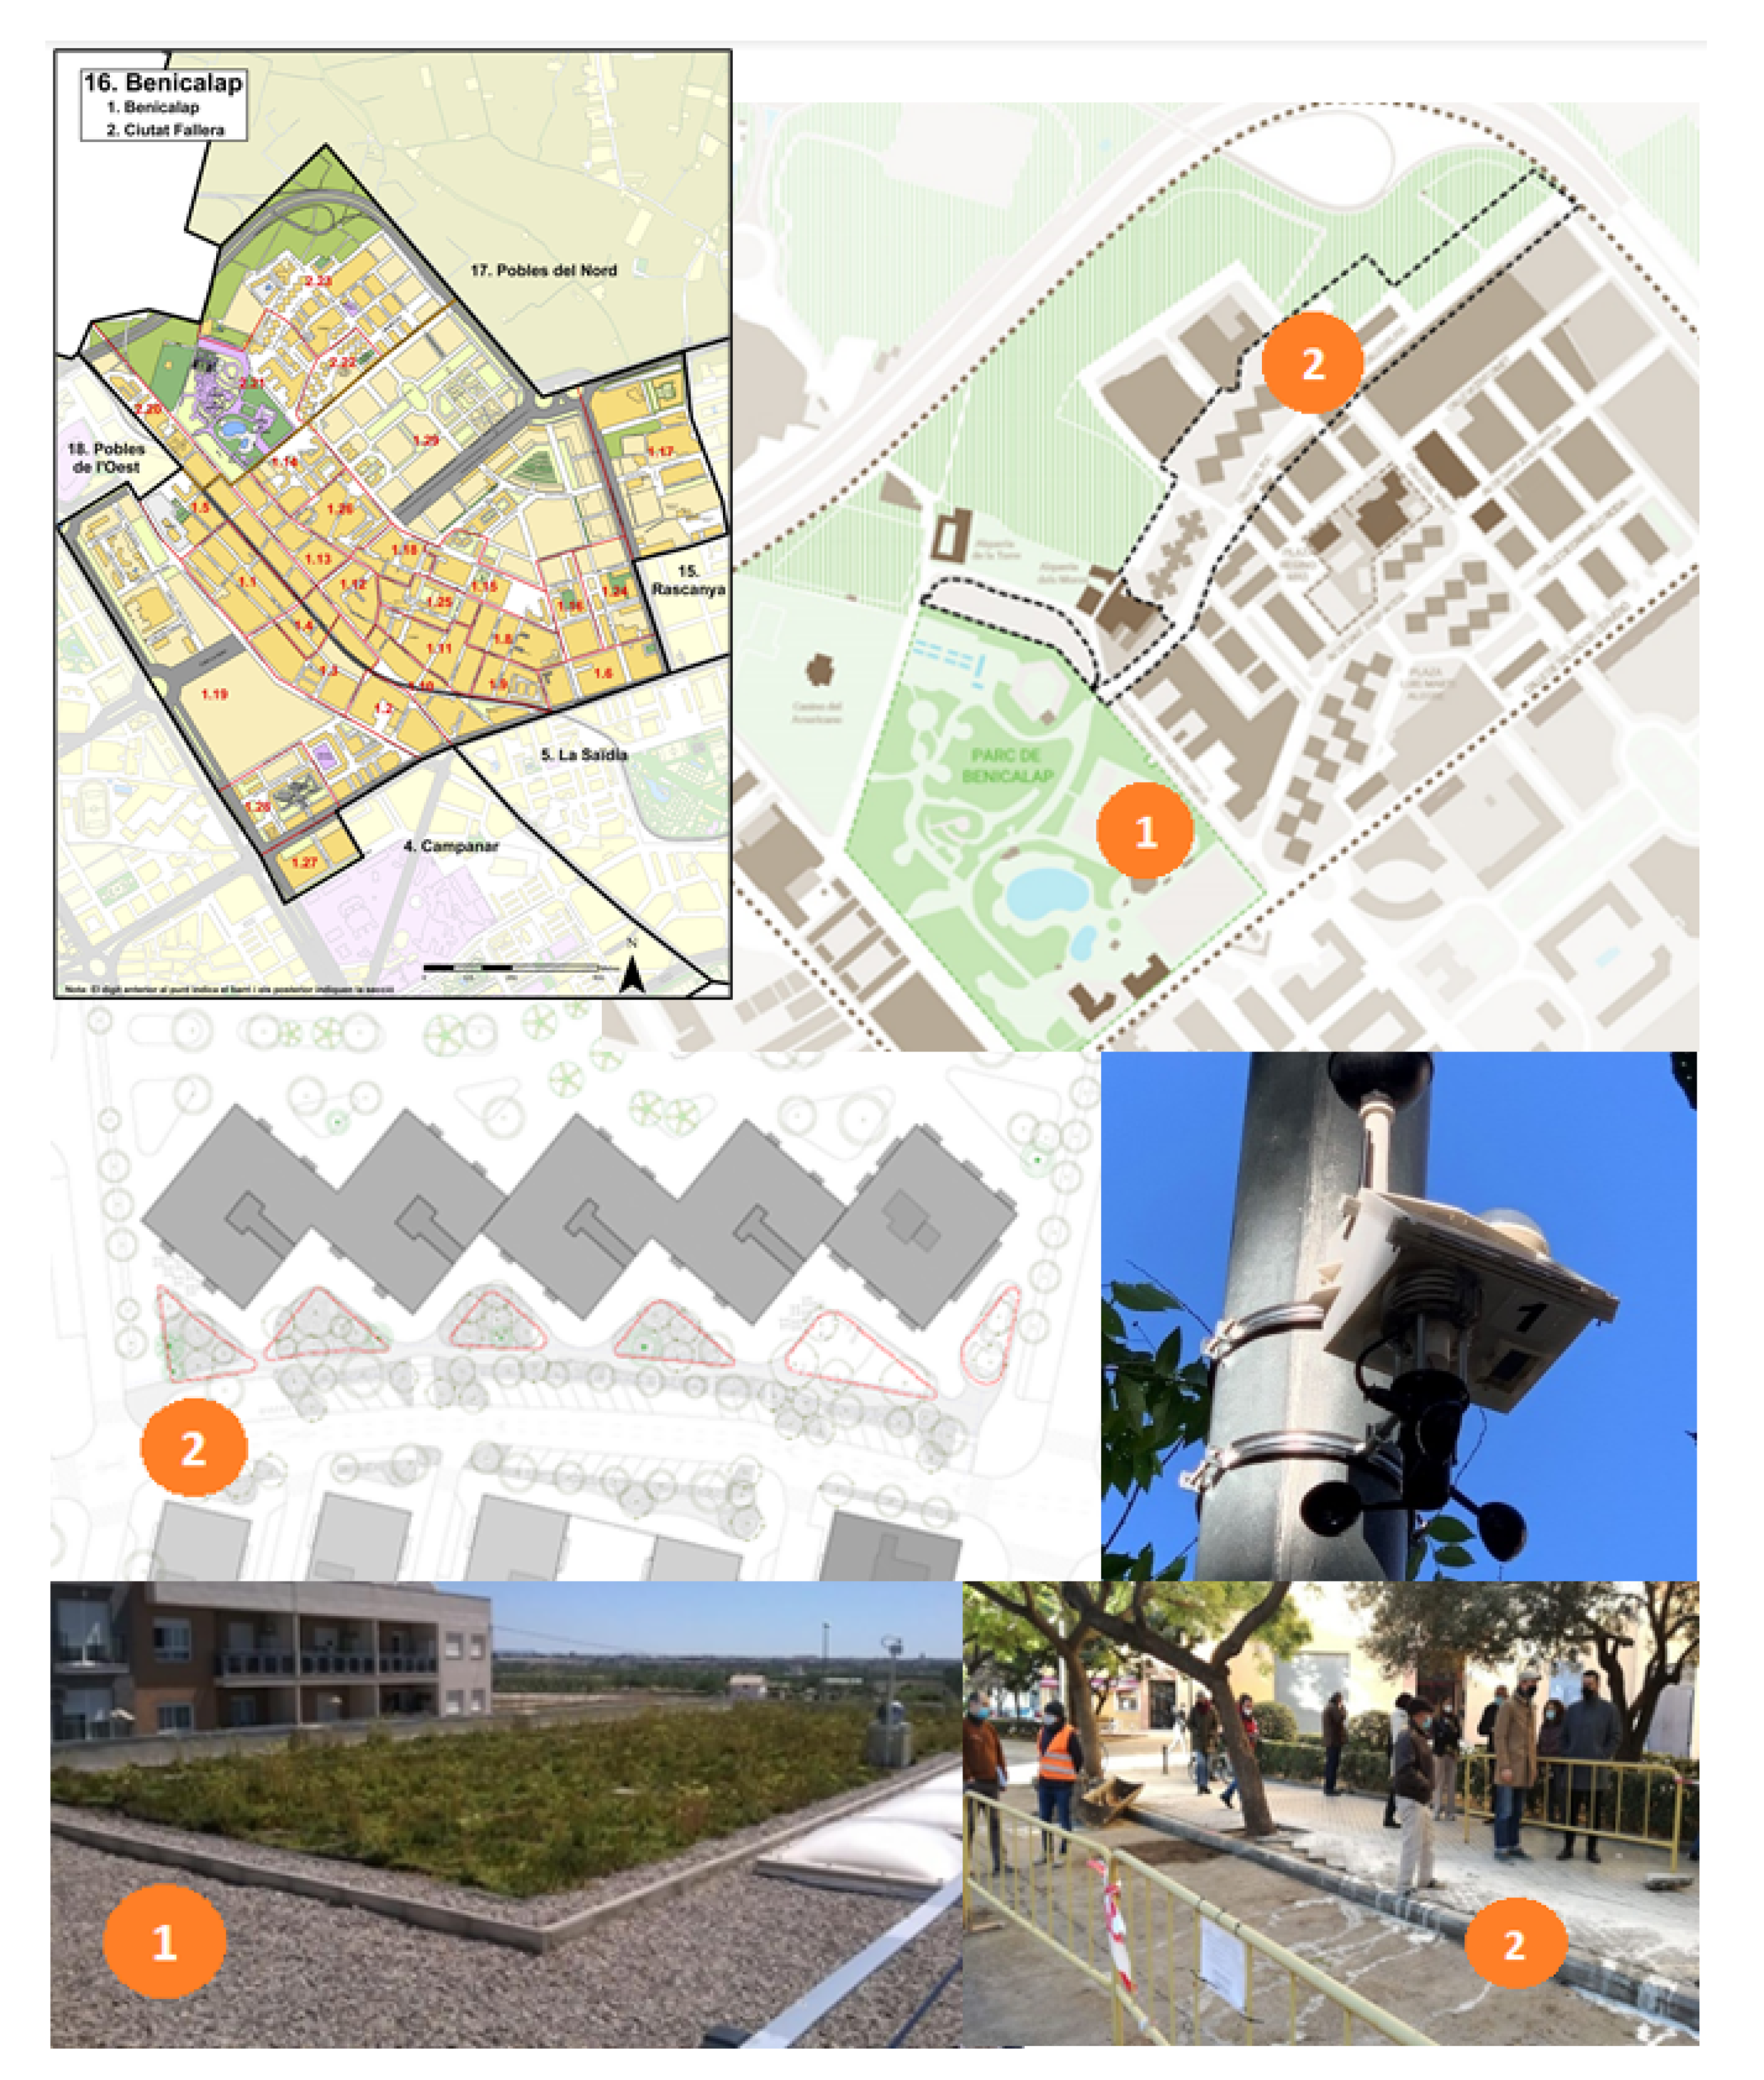
2.1. Benicalap Neighbourhood Model

The proposed neighbourhood scenario corresponds to the Benicalap district in the city of Valencia. The model, or digital twin, of the physical neighbourhood starts with the cadastral digital information which is developed into a digital entity using the ArcGIS Pro 2.9 software from ESRI (Redlands, CA, USA) and following the process developed by the authors of [18]. This model has been adapted to include all building-related parameters (according to their heritage status) for a simplified LCA analysis [19,20], which is required for predicting building energy performance from environmental conditions.
The proposed approach provides adequate results driven by detailed street physical parameters obtained from hourly climatic information of the neighbourhood. This information provides the necessary input parameters to the “digital twin” of the neighbourhood for determining street thermal variations from wind, latent heat (from NBSs), and heat from traffic, thanks to the CFD simulation. Simplified 3D building models allow an accurate radiation input to buildings through supporting metadata, established in ISO 19115:2003 [21] standard and further implemented by the EU directive “Infrastructure for Spatial Information in the European Community” (INSPIRE) [22]. The last step simulates home energy requirements using the City Energy Analyst (CEA, E.T.H. Zürich, Switzerland) [23]. The digital twin facilitates an automated virtual testbed, handling all steps from monitoring to virtual modelling of real interactions using metadata and software routines, and the actual neighbourhood digital twin is built using the procedure described in [18].

2.2. Grow-Green Pilots

The relevant Grow-Green pilots for building the Benicalap Digital Twin include the following (see Figure 2 for detail): a green roof ecosystem and blue/green corridor.
Pilots are described in Figure 2, as well as their location within the intervention area. Monitoring of the selected KPIs (Table 1) was performed through one monitoring station (also in Figure 2) per pilot located in the geometrical centre of the intervention area. Data monitoring started once the pilot intervention was finished and followed for one full year. Raw data for the pilots (and parallel locations for baseline definition) were used for developing and validating the CFD models to be used later. Monitoring data for the pilots correspond to 2019 and the pre-greening info dates back to 2017.
Data monitoring from the NBSs pilots and its management require additional measures described below:
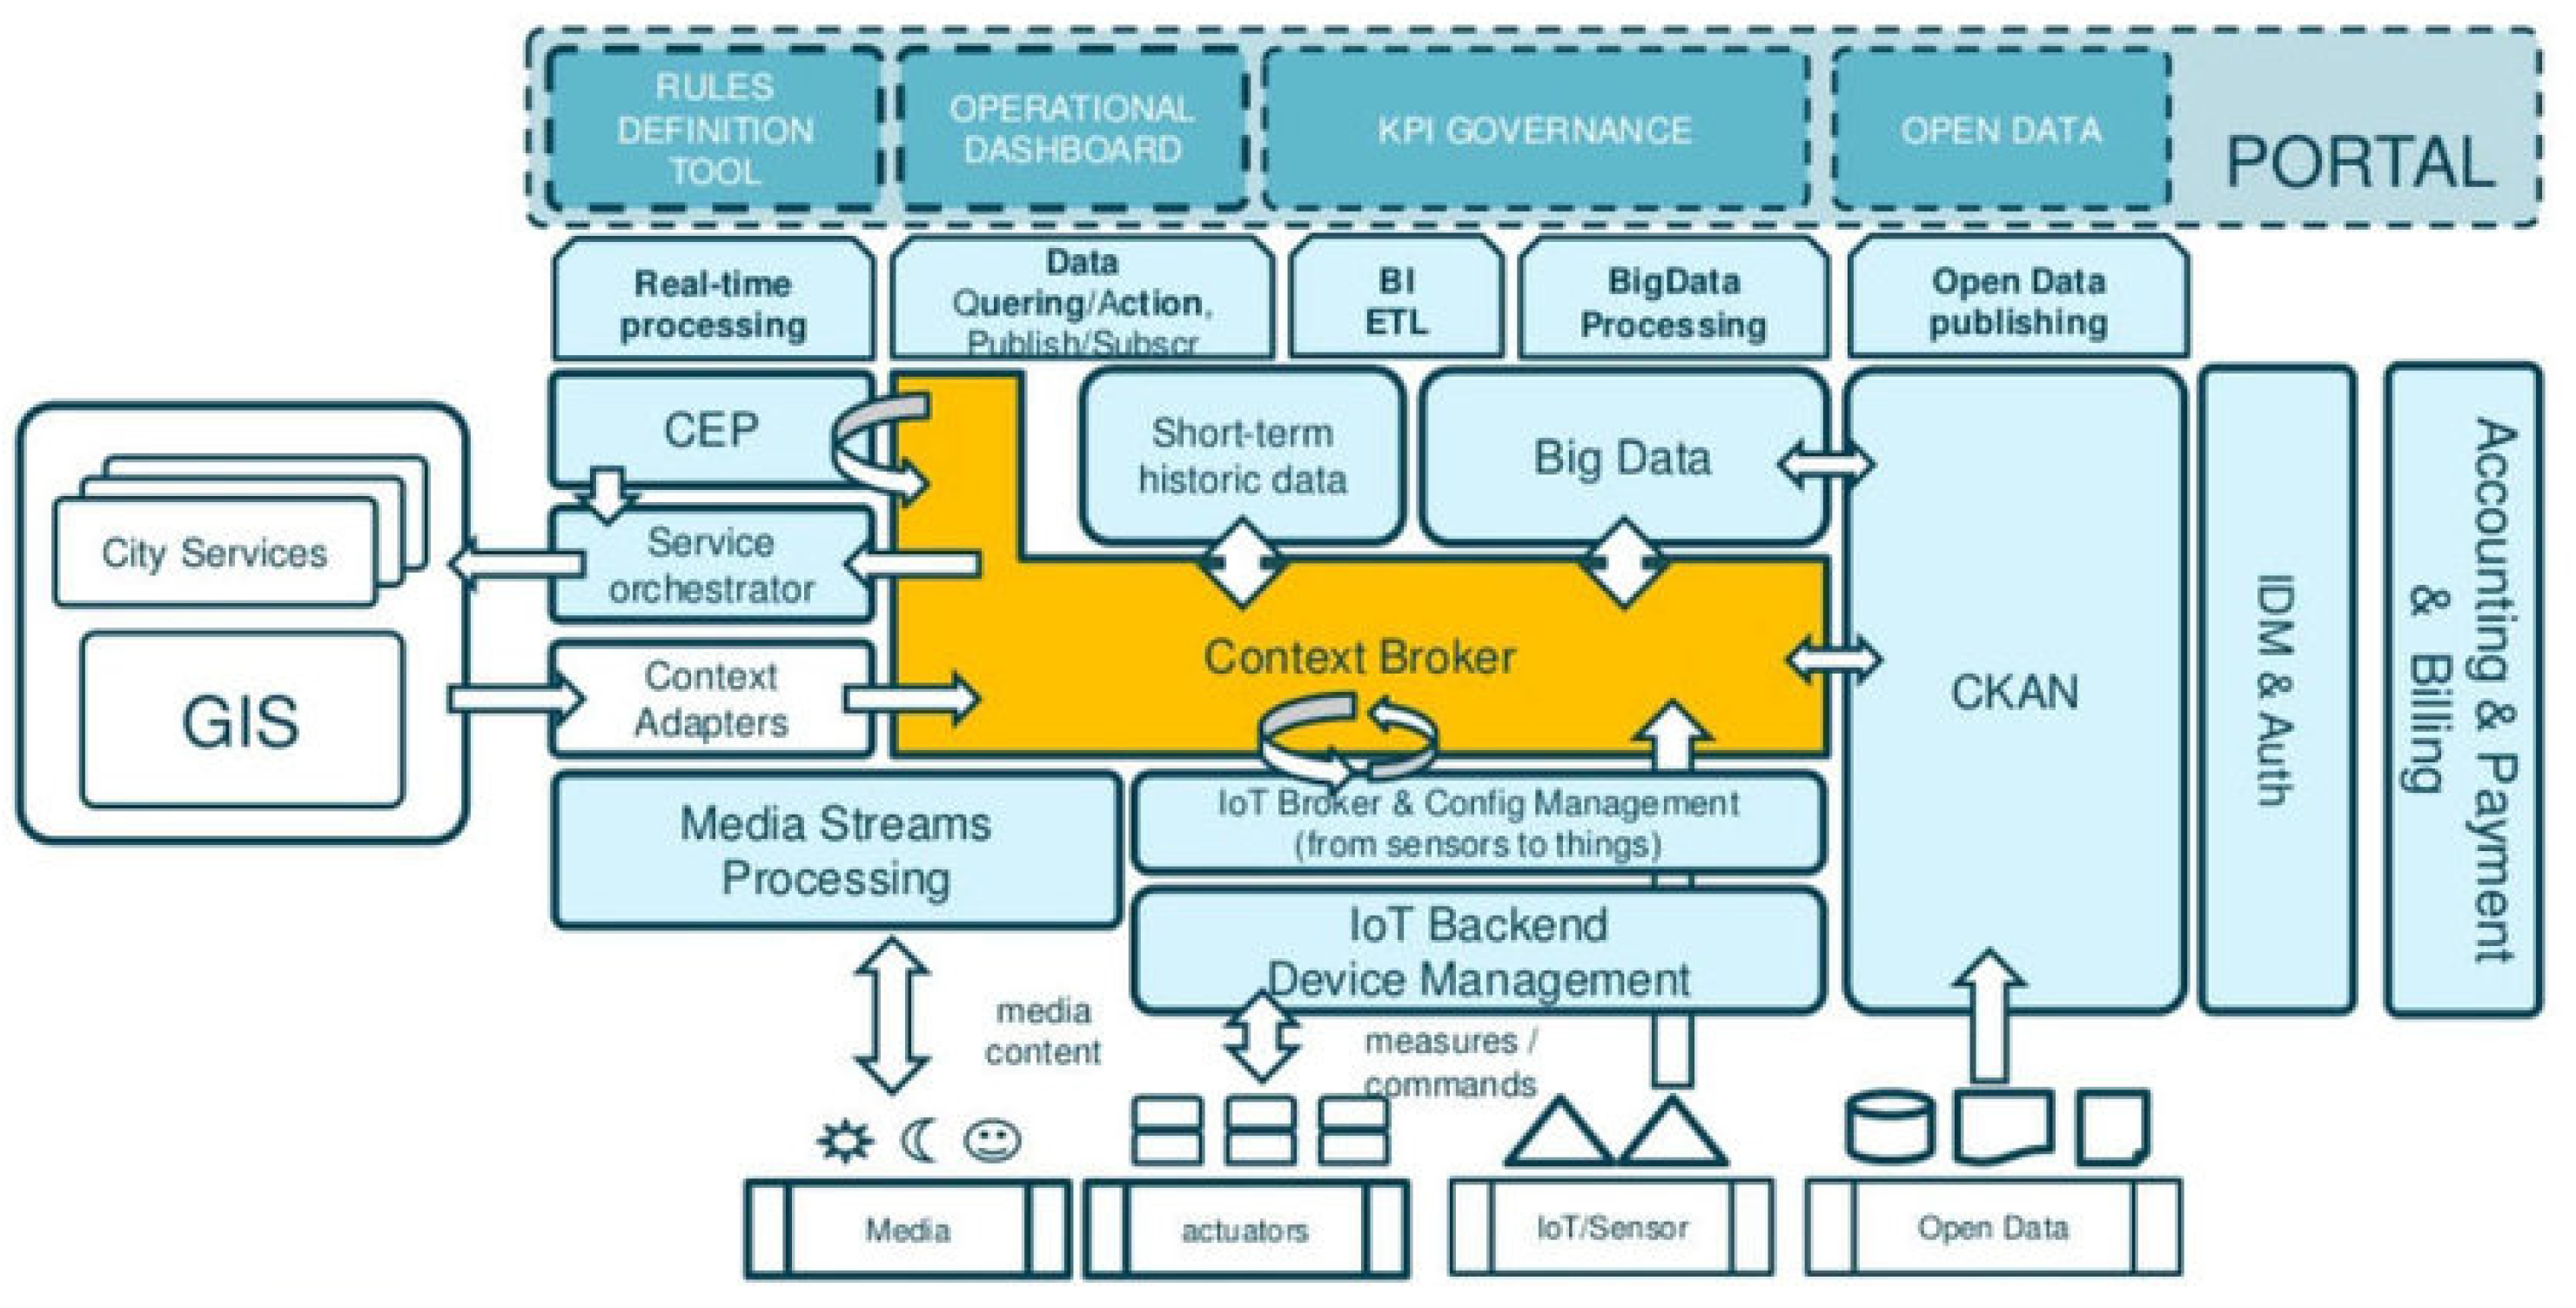
  • Open Data standards following the “Open cities” platform developed by the Fraunhofer Institut in Fokus [24]. This platform supports the Open Data lifecycle process.
  • Fiware foundation [25] open standards used for device communication and data gathering. This open standard provides an enhanced OpenStack-based cloud environment for the Internet of Things devices on real-time applications while incorporating geolocalisation.
  • Monitoring data support the metadata INSPIRE Directive [22] proposed as the coding standard of geolocalised data for the open display of relevant information from the project. This will allow the joint publication of relevant NBSs data at the EU-NBS Think-Nature cluster [26].
  • The selection of relevant Key Performance Indicators (KPIs) for the Valencia pilots was performed according to the interoperability requirements agreed upon for all EU NBSs projects and is developed in Table 1. The details on relevant technical information on KPIs are also given in Table 1.

2.3. Valencia Open Data Platform

The Valencia Open Data platform [18] follows the ISO standard specification ISO/IEC 20802-2:2016 [27] under a simple architecture (Figure 3) running under Oracle (platform-neutral), supporting all city datasets including the research data output from city projects, while fulfilling the EU data policies and joint repositories [28].
Figure 2 presents the reference infrastructure model and high-level technical specification for all data referenced in this paper, including its main components and connection points to other tools and systems. The reference architecture meets the technical and user requirements established throughout NBS pilot implementations of the H2020 Grow-Green project, addressing technology and user requirements and integrating monitored data onto the Benicalap Digital Twin. The reference architecture considers platform-neutral components, which provide a solution, simultaneously integrating all pilots, linking them to the architecture components of the Link Open Data chain.
Data monitoring on pilots at a neighbourhood level was stored and managed through the Valencia Open Data platform. Variables for the Digital Twin are linked dynamically to the corresponding values of the Valencia Open Data platform, ensuring a model design that can be repeated for any neighbourhood with an equivalent structure for impact assessment. Therefore, the Digital Twin model is generic in its possible implementation.
Although the full set of data is very wide, for the purpose of this research, only the hourly neighbourhood data records (for 2019 as detailed in Section 3.1) are considered. Pilot data records are used for training the CFD model, while stations away from NBS pilot influence are used as street initial conditions for the simulation of the full-scale deployment of NBSs. This data set serves as the climate baseline.

2.4. Façade Solutions and Building Model

Each building is modelled according to its envelope surface (cadastral surface and height). Considering the building typology evaluated from the cadastral info (construction year) and the Episcope/TABULA tool [29] heat-exchange conditions (thermal conductivity, thermal capacity, and windows) are established for each building in the neighbourhood and included in the Digital Twin for evaluating energy transfer in each individual building prior to refurbishment.
Through a careful state-of-the-art analysis [30,31,32] the overall reduction in energy consumption for buildings in urban environments, through better façade solutions, can achieve energy savings of 20 to 55%. Cumulative impact amounts to a possible carbon footprint reduction that could reach up to 12% of an average city [33].
The proposed refurbishing strategy concentrates on façades (adding a Phase Change Material, or PCM, layer) and windows (including radiation shields and double glass). For defining the simplified building solutions to be considered in our research, the following conceptual requirements have been used:
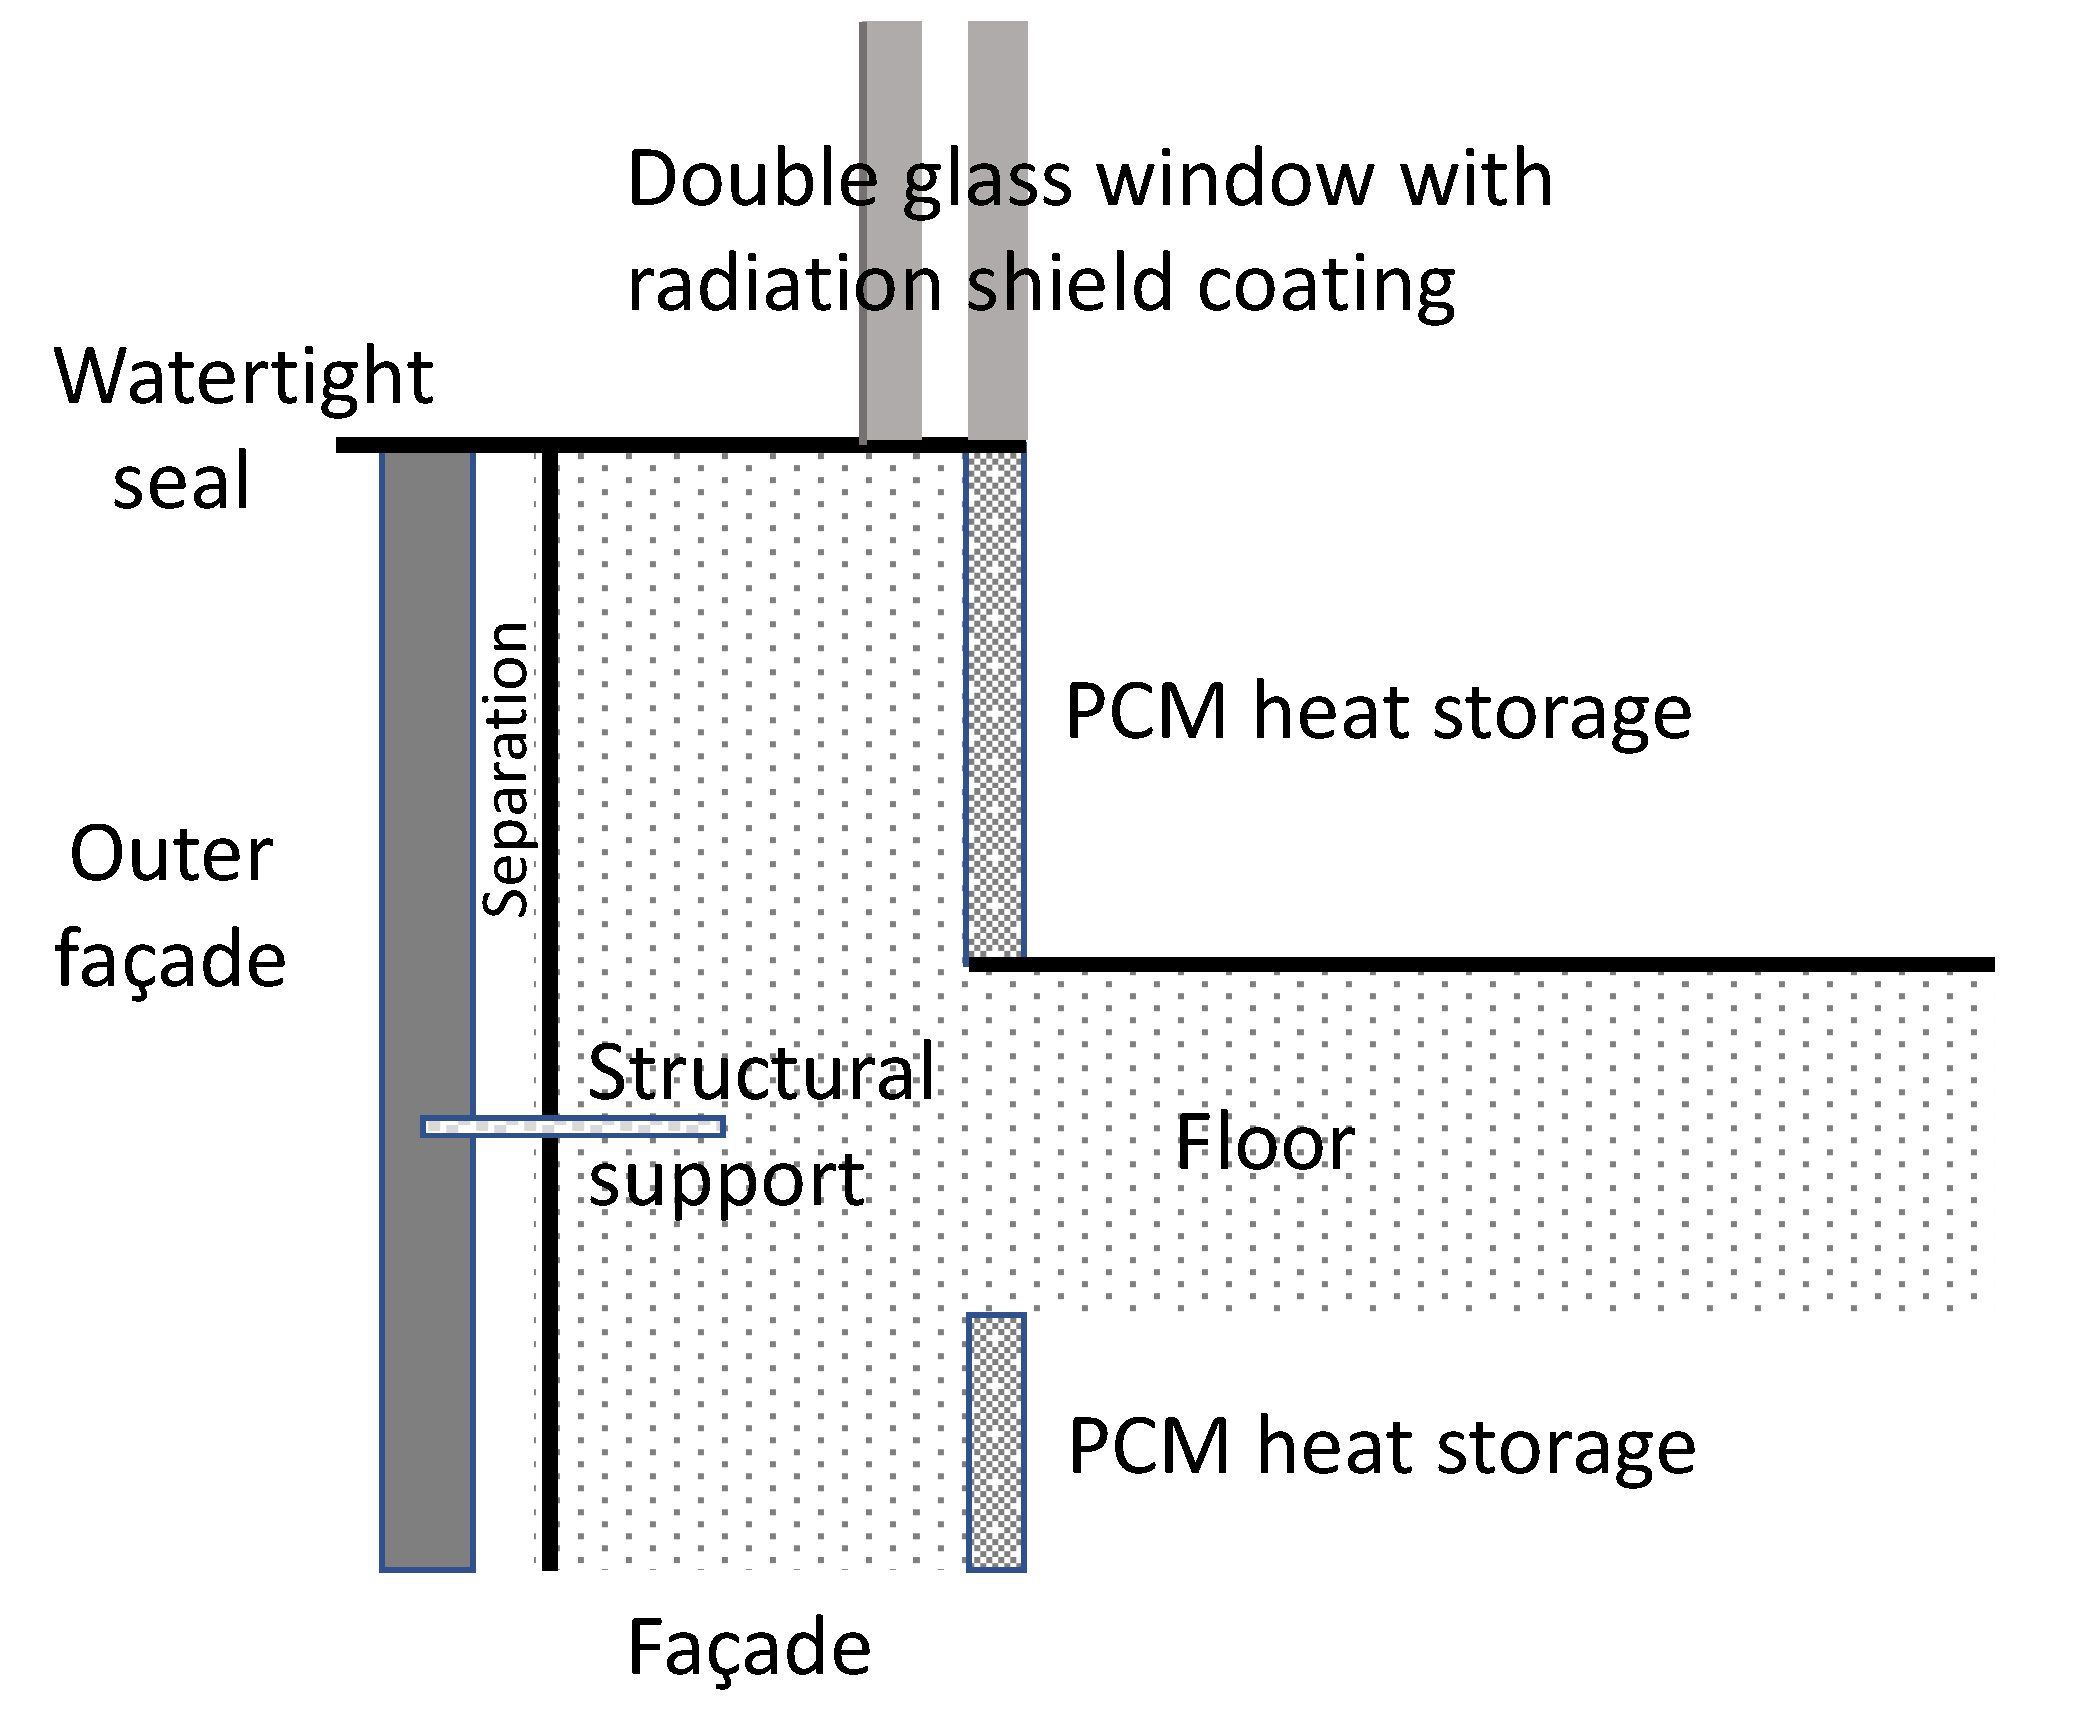
  • Interventions on the existing building stock follow modular designs separately addressing 3 action fields:
    Windows: multiple layers including radiation reflective coatings.
    External add-on skins facilitating passive skin ventilation, humidity barriers, and radiation heat reflectors.
    Internal layers tuned to balance energy flows through thermal storage.
  • Specific solutions address not only energy efficiency, but also overall sustainable designs evaluated through a comprehensive Life Cycle Assessment (LCA).
  • The selected design approach for building solutions follows market-dominant elements following multilayered sandwich solutions, supported by simple multipurpose fastening elements.
  • Standard approaches are selected with an emphasis on quality for meeting a minimum 50-year building life cycle.
The schematic design of the proposed retrofitting solution is presented in Figure 3 below with most relevant design parameters. For the evaluation of retrofitting policies, 3 different alternatives for Phase Change Materials are considered in Section 3.2 with the same support shown in Figure 4. These materials have been selected from the dominant market products [34]: organic paraffin, tetrahydrofuran clathrate hydrate, and caprylic acid with lauric acid (9:1 eutectic).

3. Modelling Outputs and Discussion

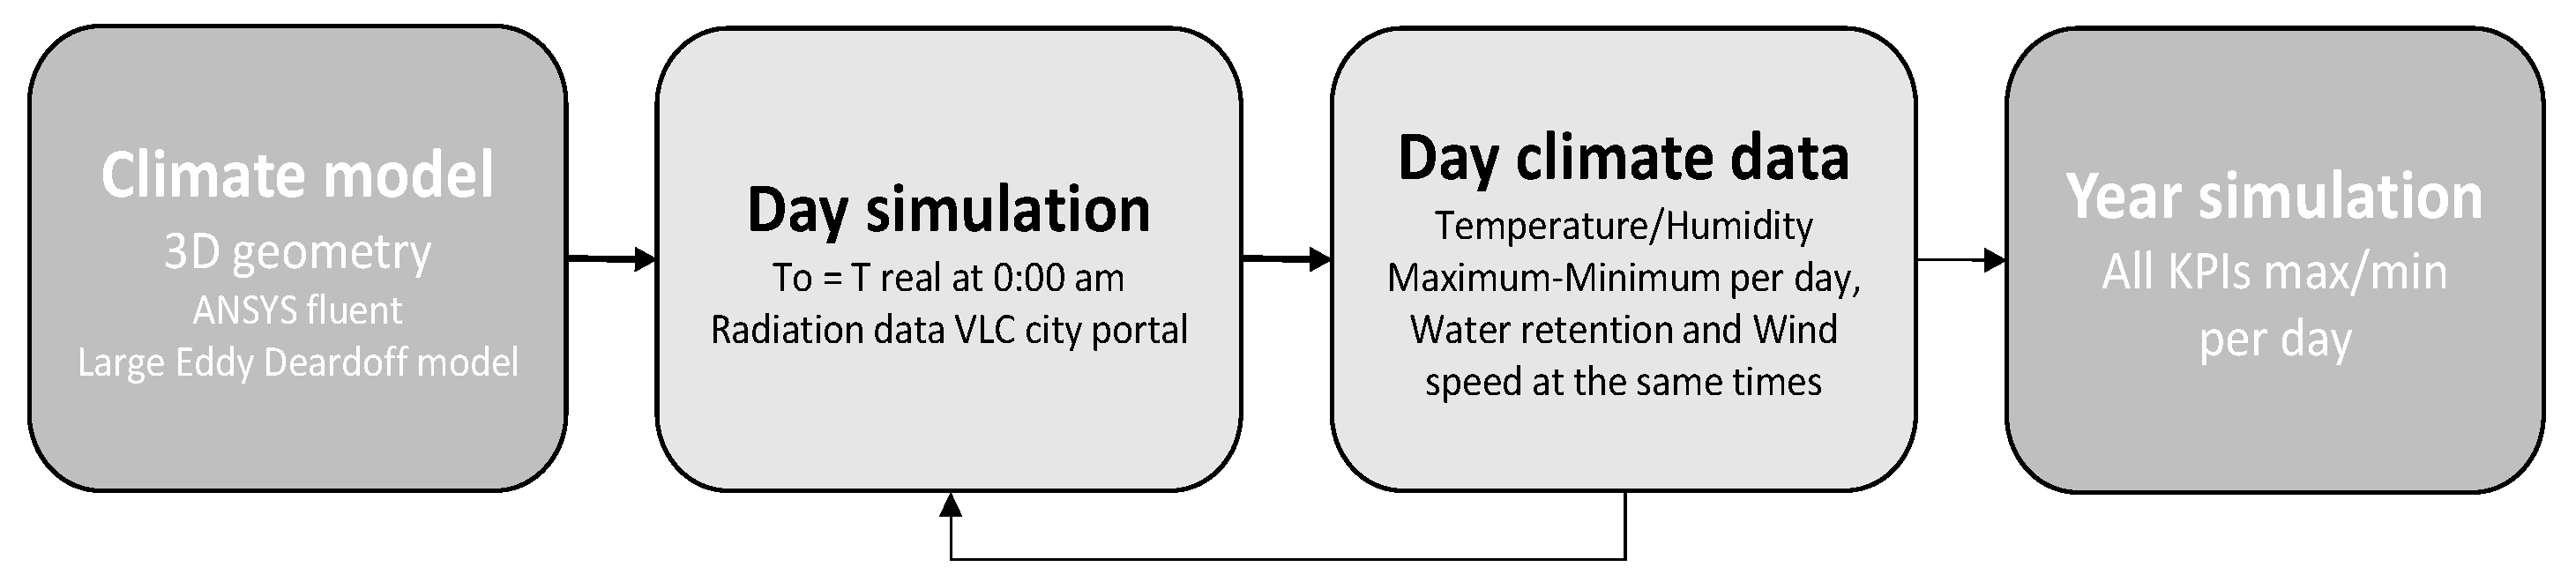
3.1. CFD Microclimate Model

For selecting the CFD model best suiting the Benicalap neighbourhood, the extensive review provided by Toparlar et al. [9] is followed. Since the neighbourhood is distributed as a random grid of multiple street canyons connecting open green spaces, the governing equations considered follow the Large Eddy Simulations (LES) approach, solved numerically using the Deardoff sub-grid scale model approach [35].
The domain considered for the CFD model is enclosed in a rectangle aligned with the dominant street direction and circumscribing the limits of the neighbourhood (1200 × 1400 m, as presented in Figure 2). The horizontal grid interval is 12 m in the x direction and 14 m in the y direction, and the horizontal grid dimension is 100 × 100. As for the perpendicular grid, 50 non-uniform layers are considered. Layers closer to the surface are 3 m thick up to the 25th layer, increasing with a 1.1 expansion ratio from the 26th layer to the 35th layer, and from here to the 50th layer a uniform thickness of 7.78 m is considered. The grid density selected follows the optimal performance according to [36].
The physical parameters to be obtained from the climate model were previously presented in Table 1. The routine was selected from the Ansys Fluent (Ansys Inc., Canonsburg, PA, USA) software used and run using as input pre-greening temperature data together with the NBSs implemented (trees, green roofs, water reservoirs), and hourly radiation information is taken from the VLC open data repository [37]. The geometries for each Benicalap street pilot are obtained from the pilot area 3D models imported from the ArcGIS neighbourhood model. The CFD simulation results add to the given climate conditions, latent heat and airflow impacts, for thermal variations.
Once our climate model for each pilot area is established, the initial values for each day are selected from hourly average values from the pre-greening monitored data at 0:00 a.m. The climate model is then run for the whole day keeping daily extreme temperatures together with the other KPIs (from Table 1) at the time when the extreme temperatures are reached. This process is repeated for each pilot through the 365 days of the year (2019) after the pilots are built obtaining a table for one years’ worth of daily simulated extreme temperature and related KPIs (see Figure 5 for more details).
Simulation results show relevant changes depending on the specific point considered. To avoid local variations in the CFD model, all values are averaged for each climate variable per street. This allows a simpler calculation later for energy requirements without a relevant impact on accuracy [35]. The average simulated results per street are then compared to the real monitoring data after greening for the two pilot areas (see Figure 6 for error evolution for real and simulated values in Plaza Regino Mas). Results on the deviations show a Gaussian distribution for both pilots on the 365 days evaluated. Results of the statistical distributions per KPI and pilot are presented in Table 2.
The results show a good performance of the model (less than 5% error), and the climate model is therefore validated. The simulation outputs for the climate model include not only the validation KPIs (temperature/humidity, water retention and wind speed), but also radiation, convection energy exchange conditions, and latent heat energy, which will be needed to evaluate the energy balance for Benicalap.
Together with the digital twin of Benicalap, the climate model allows the performance assessment of the proposed interventions on the Benicalap neighbourhood considering the streets and buildings: deployment of NBSs (pilots) 1 (on all public buildings) and 2 (on every street), together with any refurbishment strategies.

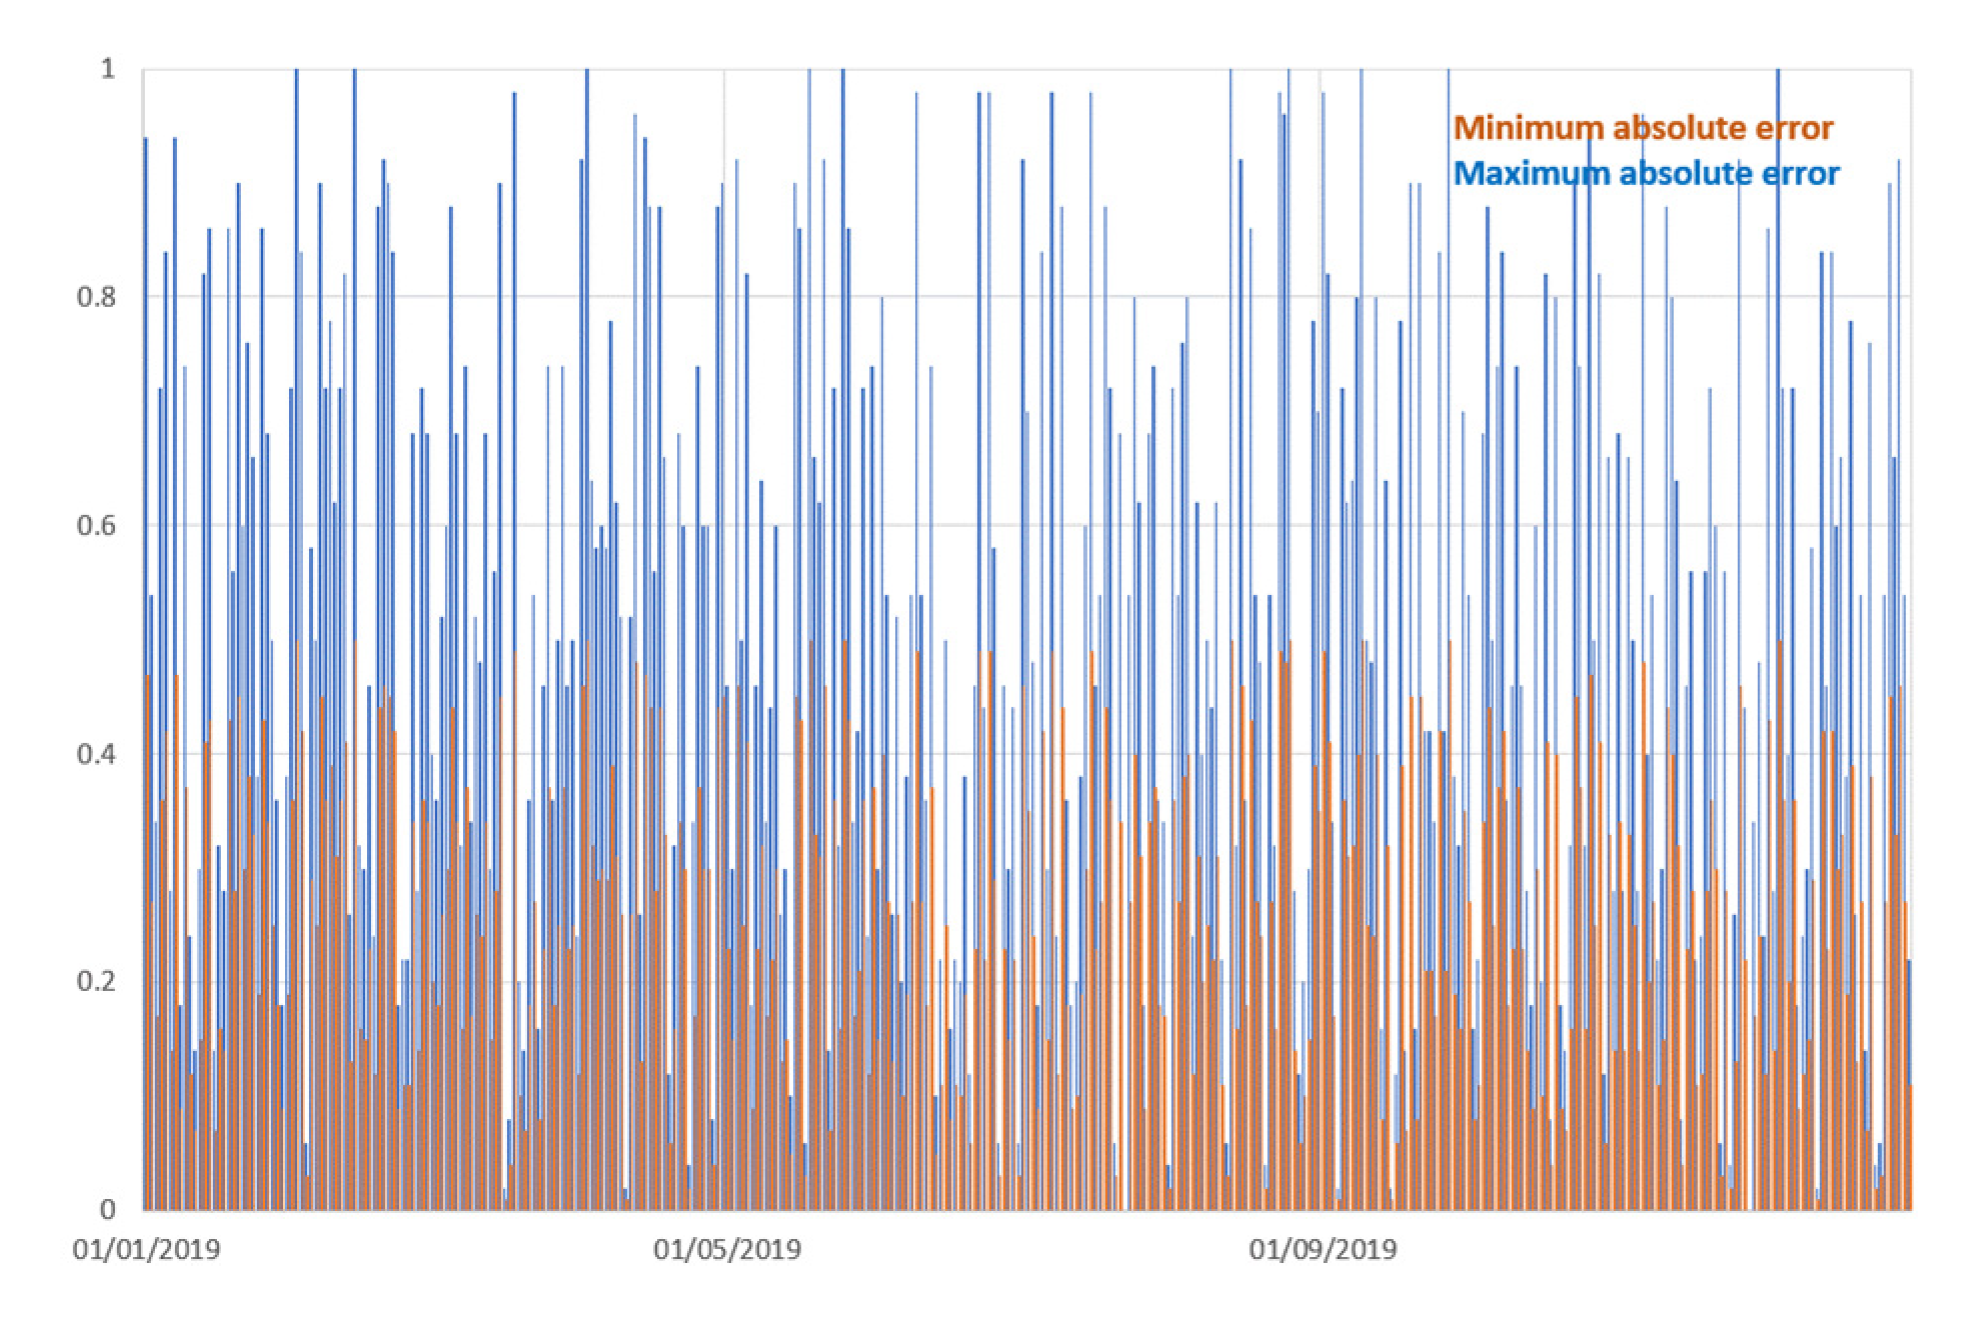
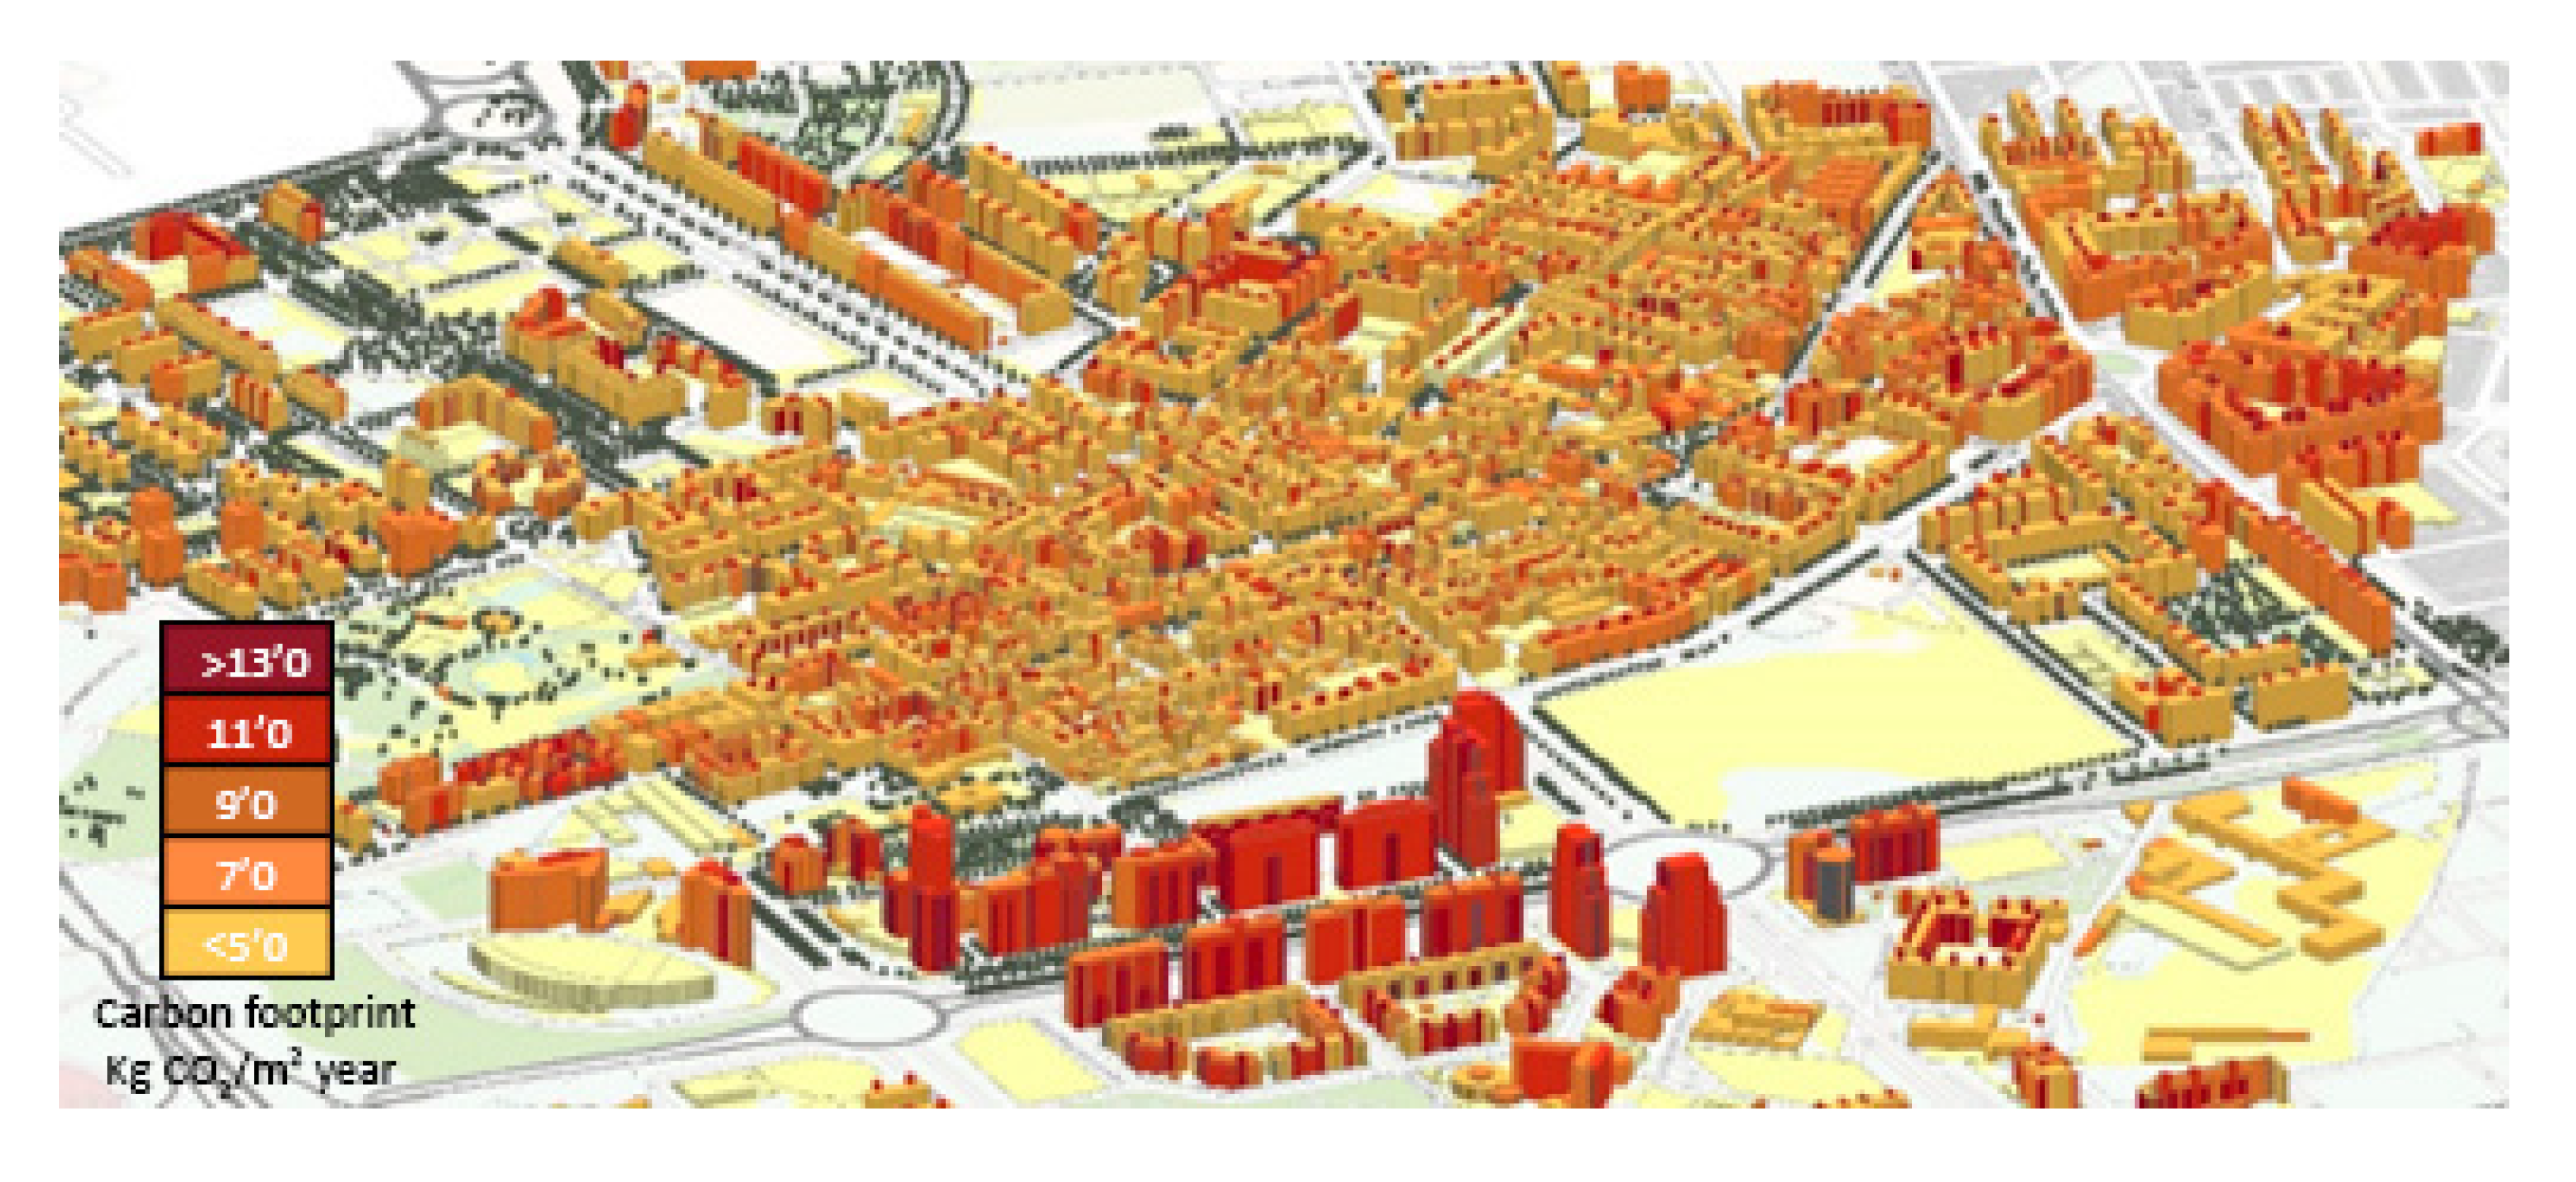
3.2. Neighbourhood Impact Assessment

As described in Section 2.4, the neighbourhood digital model is built on ArcGIS, starting from geometry modelling for later embedding building typologies (taken from Tabula/Episcope [29]) and the corresponding materials’ relevant LCA data (density, raw materials carbon footprint, thermal conductivity, specific heat capacity, labour, and average price) structured as building units (as structured in IVE’s construction database [38]).
Integrated in the same model (digital twin), the weather conditions (temperature/humidity, water retention, wind speed, radiation, convection energy exchange conditions, and latent heat energy) are geolocated to an average value per street serving as outdoor stable weather conditions per hour in the reference year (2019 in our case).
Individual building carbon footprints incorporate the energy requirements for home temperature regulation (using the most common equipment per building typology), plus fixed carbon footprint components (lighting, home activities). Both are added and averaged for the building envelopes in order to provide the yearly carbon footprint. Weather conditions are set to the real (first) and simulated street values (according to the green infrastructure model). By comparing results, it is possible to assess the possible impact on the carbon footprint of the proposed building retrofit policy in the neighbourhood, which is the key result of our research.
The last process incorporated into the model concerns building energy requirements from the CFD climate model baseline. This task is performed through CEA [23] routines coded in Python (v.3.9.10, Python software foundation, Wilmington, DE, USA) implementation of the proposed building adaption strategies and is explained in Section 2.4. CEA evaluates all heat exchanges through building envelopes (radiation, convection, and conduction).
CEA is selected due to its excellent acceptance and accuracy for the energy exchange evaluations, including finally the related CO2 footprint for building construction and use [20]. The Benicalap digital twin described here obtains the overall energy performance balance and associated carbon footprint for all the buildings in the neighbourhood under normal occupancy conditions and using the average climate adaption measures evaluated in [38]. All industrial buildings are only considered in the model with the fixed energy consumptions evaluated in [35].
Our Benicalap digital twin output graphically presents the CO2 footprint for private energy consumption, also including the embedded CO2 footprint from the construction phase. Starting with the real neighbourhood information on its current situation, the results consider the expected impact of green infrastructure and traffic on the average street temperature as described before.
Each building is assessed independently according to its typology, and the calculated balance is delivered to the neighbourhood’s integrated digital model. The graphical results for the neighbourhood, without greening or building refurbishments, can be seen in Figure 7, showing the spatial variations in building carbon footprint distribution.
The last step includes the combination of NBS infrastructure together with heat storage capabilities (through PCM sandwich solutions) already introduced in Section 2.4. Details on the commercial materials to be evaluated as alternative solutions for the whole neighbourhood façade renovation are presented in Table 3.
Each of these materials are introduced on the façades of all residential buildings on the Benicalap digital twin and evaluated for their carbon footprint. The PCMs help in maintaining low energy consumption while shielding from extreme outer temperatures.
The simulations are configured and run obtaining the results on Table 4 which will be developed in Section 4.

4. Results

The LCA evaluation is performed according to the ISO 14040:2006. After obtaining the results of the yearly simulation, it can be easily observed that the savings are very relevant for the low level of investment required for the interventions. These results are developed at neighbourhood level, although separate analyses can be performed per building typology, aggregating each individual building’s carbon footprint. The proposed methodology is very efficient providing excellent results compared to current alternative carbon footprint evaluations in buildings [42].
NBS green connectivity and roof installations provide not only a very relevant 5% energy consumption reduction, but also additional impact on water savings, avoidance of run-off water, and biodiversity protection.
PCM solutions provide combined (with NBSs) savings ranging from 10 to 20% of technical problems related to encapsulation and durability for organic materials, but the inorganic solutions, when tuned in their heat storage capacity to the requirements (thickness can be easily adapted), can ensure a costless operation and energy savings (beyond the carbon footprint reduction benefits) that are very relevant to household economies.
As identified by prior research [43], Building Energy Simulation has been extensively used during the design stage of modern buildings. The accuracy of the results depends on accurate monitoring together with historic climate records, along with oversimplification of the building types together with statistical variations on real implementations. Simulation error [44] ranges from 9 to 27% in different environments. The proposed digital twin has been tested to obtain simulation errors smaller than 9%.
The building renovation wave, which is very active around Green Deal policies, has already incorporated similar solutions, which will render synergetic joint performance.
Results go beyond the climate-neutral policies, and these building elements can be easily recycled, bringing down the carbon footprint by also allowing an easy combination with air circulation technologies to obtain additional benefits from natural conditions.

5. Conclusions

This paper has developed an easy and accurate climate model to be used for evaluating energy performance at the city level. The proposed model has been implemented together with a joint digital twin for a neighbourhood allowing future developments for the impact assessment of urban policies.
The building models also allow wide flexibility in building solution modelling, which will facilitate the performance analysis of new designs and architectural proposals. Urban development must be guided with technical evidence on combined effects for an adequate sustainability strategy.
PCM performance opens many relevant synergy strategies with traditional climate-guided building designs and more advanced renewable energy integration on buildings.
As a final summary, the combined deployment of the proposed techniques also allows relevant applications to many industrial processes.

Author Contributions

Conceptualization, J.O.-M.; research design, J.O.-M. and M.I.-L.; methodology, J.O.-M. and R.C.-M.; experimental results and analysis, M.I.-L.; conclusions, J.O.-M. All authors have read and agreed to the published version of the manuscript.

Funding

This research was co-funded by the European Commission through the H2020 project “Green Cities for Climate and Water Resilience, Sustainable Economic Growth, Healthy Citizens and Environments (GROW GREEN)” Grant Agreement: 730283.

Institutional Review Board Statement

Not applicable.

Informed Consent Statement

Not applicable.

Data Availability Statement

Data presented in this article are available on request from the corresponding author.

Conflicts of Interest

The authors declare no conflict of interest.

References

  1. Available online: https://unstats.un.org/sdgs/report/2016/goal-11/ (accessed on 13 March 2022).
  2. Available online: https://ec.europa.eu/info/research-and-innovation/funding/funding-opportunities/funding-programmes-and-open-calls/horizon-europe/eu-missions-horizon-europe/climate-neutral-and-smart-cities_en#:~:text=Cities%20play%20a%20pivotal%20role,70%25%20of%20global%20CO2%20emissions (accessed on 13 March 2022).
  3. Available online: https://unfccc.int/process-and-meetings/the-paris-agreement/the-glasgow-climate-pact-key-outcomes-from-cop26 (accessed on 13 March 2022).
  4. Available online: https://www.eumayors.eu/news-and-events/news/1897-100-climate-neutral-and-smart-cities-a-kit-to-get-ready-for-the-call-for-expression-of-interests.html (accessed on 13 March 2022).
  5. Chrysoulakis, N.; Somarakis, G.; Stagakis, S.; Mitraka, Z.; Wong, M.-S.; Ho, H.-C. Monitoring and Evaluating Nature-Based Solutions Implementation in Urban Areas by Means of Earth Observation. Remote Sens. 2021, 13, 1503. [Google Scholar] [CrossRef]
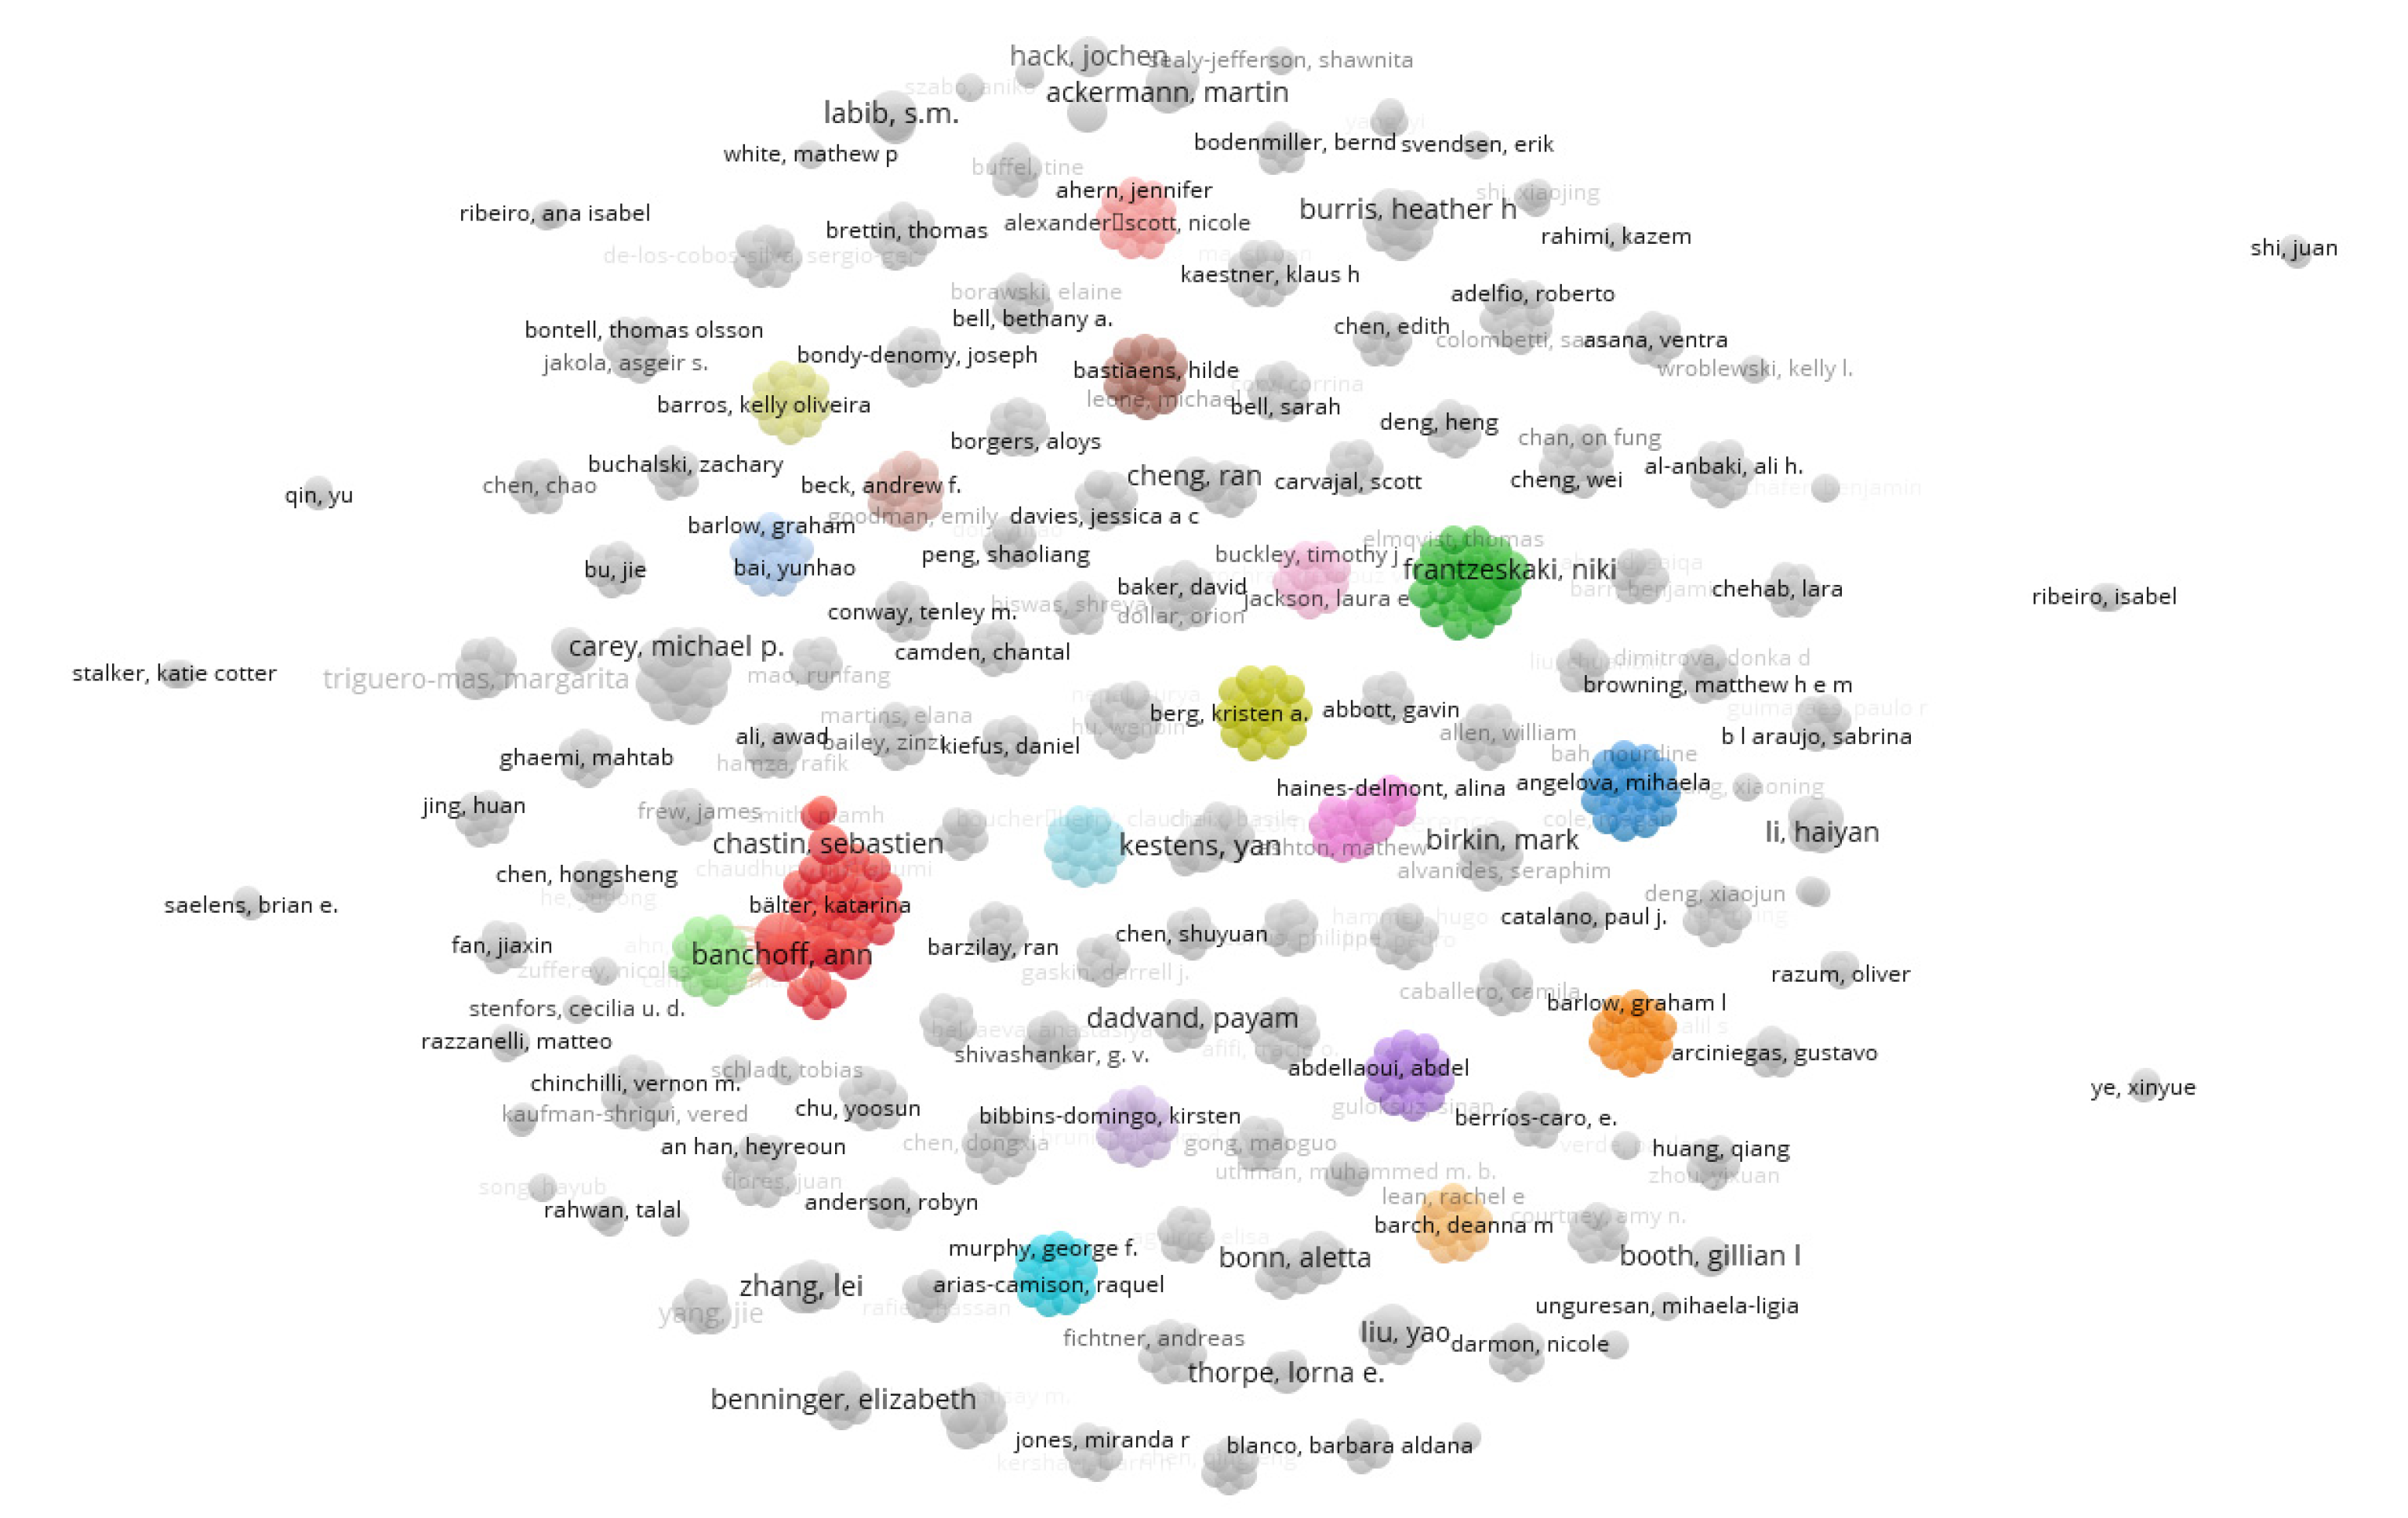
  6. Developed by Ness van Jan Eck and Ludo Waltman Supported by the Centre for Science and Technology Studies at Leiden University (Nederland). Available online: https://www.vosviewer.com/ (accessed on 1 June 2022).
  7. Available online: https://app.dimensions.ai/discover/publication (accessed on 1 June 2022).
  8. Lucchi, E.; Buda, A. Urban green rating systems: Insights for balancing sustainable principles and heritage conservation for neighbourhood and cities renovation planning. Renew. Sustain. Energy Rev. 2022, 161, 112324. [Google Scholar] [CrossRef]
  9. Huang, B.; Xing, K.; Ness, D.; Liao, L.; Huang, K.; Xie, P.; Huang, J. Rethinking carbon–neutral built environment: Urban dynamics and scenario analysis. Energy Build. 2022, 255, 111672. [Google Scholar] [CrossRef]
  10. Raymond, C.M.; Breil, M.; Nita, M.R.; Kabisch, N.; de Bel, M.; Enzi, V.; Frantzeskaki, N.; Geneletti, G.; Lovinger, L.; Cardinaletti, M.; et al. An Impact Evaluation Framework to Support Planning and Evaluation of Nature-Based Solutions Projects. In Report Prepared by the EKLIPSE Expert Working Group on Nature-Based Solutions to Promote Climate Resilience in Urban Areas; Centre for Ecology and Hydrology: Lancaster, UK, 2017. [Google Scholar]
  11. Latasa, I.; Laurenz, A.; Sádaba, J. Urban Green Infrastructure as a Strategy to Address Urban Energy Efficiency and Sustainability. A Case Study of Milagrosa. Sustainability 2022, 14, 28. [Google Scholar] [CrossRef]
  12. Asaeda, T.; Thanh, V.; Wake, A. Heat storage of pavement and its effect on the lower atmosphere. Atmos. Environ. 1996, 30, 413–427. [Google Scholar] [CrossRef]
  13. Toparlar, Y.; Blocken, B.; Maiheu, B.; van Heijst, C.J.F. A review on the CFD analysis of urban microclimate. Renew. Sustain. Energy Rev. 2017, 80, 1613–1640. [Google Scholar] [CrossRef]
  14. Howard, L. The Climate of London; W. Phillips: London, UK, 1820; Volume 2. [Google Scholar]
  15. Manley, G. On the frequency of snowfall in metropolitan England. Q. J. R. Meteorol. Soc. 1958, 84, 70–72. [Google Scholar] [CrossRef]
  16. Yuan, J.; Masuko, S.; Shimazaki, Y.; Yamanaka, T.; Kobayashi, T. Evaluation of outdoor thermal comfort under different building external-wall-surface with different reflective directional properties using CFD analysis and model experiment. Build. Environ. 2022, 207, 108478. [Google Scholar] [CrossRef]
  17. Xu, P.; Huang, Y.J.; Miller, N.; Schlegel, N.; Shen, P. Impacts of climate change on building heating and cooling energy patterns in California. Energy 2012, 44, 792–804. [Google Scholar] [CrossRef]
  18. Orozco-Messana, J.; Iborra-Lucas, M.; Calabuig-Moreno, R. Neighbourhood Modelling for Urban Sustainability Assessment. Sustainability 2021, 13, 4654. [Google Scholar] [CrossRef]
  19. Schrotter, G.; Hürzeler, C. The Digital Twin of the City of Zurich for Urban Planning. J. Photogramm. Remote Sens. Geoinf. Sci. 2020, 88, 99–112. [Google Scholar] [CrossRef] [Green Version]
  20. Calabuig-Moreno, R.; Temes-Cordovez, R.; Orozco-Messana, J. Neighbourhood Digital Modelling of Energy Consumption for Carbon Footprint Assessment. In Sustainability in Energy and Buildings 2021. Smart Innovation, Systems and Technologies; Littlewood, J.R., Howlett, R.J., Jain, L.C., Eds.; Springer: Singapore, 2021; Volume 263. [Google Scholar] [CrossRef]
  21. Available online: https://www.iso.org/standard/26020.html (accessed on 4 April 2022).
  22. Available online: https://inspire.ec.europa.eu/inspire-directive/2 (accessed on 6 April 2022).
  23. Available online: https://www.cityenergyanalyst.com/ (accessed on 6 April 2022).
  24. Available online: https://www.fokus.fraunhofer.de/ (accessed on 25 March 2022).
  25. Available online: https://www.fiware.org/about-us/smart-cities/ (accessed on 1 April 2022).
  26. Available online: https://www.think-nature.eu/ (accessed on 14 March 2022).
  27. Available online: https://www.valencia.es/dadesobertes/en/ (accessed on 14 March 2022).
  28. Available online: https://www.iso.org/standard/69209.html (accessed on 20 March 2022).
  29. TABULA Webtool on EU Building Typologies. Available online: https://episcope.eu/building-typology/tabula-webtool/ (accessed on 9 April 2022).
  30. Li, Y.; Chen, L. Investigation of European modular façade system utilizing renewable energy. Int. J. Low-Carbon Technol. 2022, 17, 279–299. [Google Scholar] [CrossRef]
  31. Available online: https://ec.europa.eu/commission/presscorner/detail/en/IP_21_6683 (accessed on 4 April 2022).
  32. Ascione, F.; Bianco, N.; Iovane, T.; Mastellone, M.; Mauro, G.M. The evolution of building energy retrofit via double-skin and responsive façades: A review. Sol. Energy 2021, 224, 703–717. [Google Scholar] [CrossRef]
  33. Available online: https://setis.ec.europa.eu/implementing-actions/energy-efficiency-buildings_en (accessed on 14 March 2022).
  34. Zsembinszki, G.; Fernández, A.G.; Cabeza, L.F. Selection of the Appropriate Phase Change Material for Two Innovative Compact Energy Storage Systems in Residential Buildings. Appl. Sci. 2020, 10, 2116. [Google Scholar] [CrossRef] [Green Version]
  35. Deardorff, J.W. Stratocumulus-capped mixed layers derived from a three-dimensional model. Bound-Layer Meteorol. 1980, 18, 495–527. [Google Scholar] [CrossRef]
  36. Baik, J.J.; Park, S.B.; Kim, J.J. Urban Flow and Dispersion Simulation Using a CFD Model Coupled to a Mesoscale Model. J. Appl. Meteorol. Climatol. 2009, 48, 1667–1681. [Google Scholar] [CrossRef]
  37. Available online: https://dadesobertes.gva.es/es/dataset/med-cont-atmos-md-2019 (accessed on 9 April 2022).
  38. BDC IVE. Available online: https://bdc.f-ive.es/BDC21/1 (accessed on 9 April 2022).
  39. Rubitherm RT-PCM. Available online: https://www.rubitherm.eu/en/index.php/productcategory/organische-pcm-rt (accessed on 9 April 2022).
  40. Shengli, T.; Dong, Z.; Deyan, X. Experimental study of caprylic acid/lauric acid molecular alloys used as low-temperature phase change materials in energy storage. Energy Conserv. 2005, 6, 45–47. [Google Scholar]
  41. Jankowski, N.R.; McCluskey, F.P. A review of phase change materials for vehicle component thermal buffering. Appl. Energy 2014, 113, 1525–1561. [Google Scholar] [CrossRef]
  42. Fenner, A.E.; Kibert, C.J.; Woo, J.; Morque, S.; Razkenari, M.; Hakim, H.; Lu, X. The carbon footprint of buildings: A review of methodologies and applications. Renew. Sustain. Energy Rev. 2018, 94, 1142–1152. [Google Scholar] [CrossRef]
  43. Harish, V.S.K.V.; Kumar, A. A review on modeling and simulation of building energy systems. Renew. Sustain. Energy Rev. 2016, 56, 1272–1292. [Google Scholar] [CrossRef]
  44. Eggimann, S.; Vulic, N.; Rüdisüli, M.; Mutschler, R.; Orehounig, K.; Sulzer, M. Spatiotemporal upscaling errors of building stock clustering for energy demand simulation. Energy Build. 2022, 258, 111844. [Google Scholar] [CrossRef]
Figure 1. Author document references clustered network (Dimensions and VOS viewer).
Buildings 12 00894 g001
Figure 2. Benicalap neighbourhood location, monitoring station and NBS pilots. Green roof ecosystem (1), Blue/Green corridor (2).
Buildings 12 00894 g002
Figure 3. Valencia Open Data conceptual architecture.
Buildings 12 00894 g003
Figure 4. Conceptual façade modular retrofit section.
Buildings 12 00894 g004
Figure 5. Climate model development process.
Buildings 12 00894 g005
Figure 6. Daily error evolution for simulation on “Plaza Regino Mas”.
Buildings 12 00894 g006
Figure 7. Graphical presentation of neighbourhood CO2 footprint per building.
Buildings 12 00894 g007
Table 1. KPIs for Valencia NBS pilots.
KPIPolicyResponsible Service
(All Links Accessed on 22 June 2022)
Temperature (°C)
Humidity (% RH)
Radiant black-bulb temperature (°C)
Climate adaption
(hourly records)
http://climate-adapt.eea.europa.eu/
Water retention (L/day)NWRM platform
(daily records)
http://www.nwrm.eu/
Top wind speed (m/s)Oppla NBS platform
(hourly records)
https://oppla.eu/nbs/case-studies
Table 2. Error distributions for the climate variables on NBSs pilots.
PilotKPIError (KPIe) Distribution
Green roof (1)Temperature (°C)
Humidity (% RH)
Radiant black-bulb temperature (°C)
ΔT (av.) = 1.1, σ = 0.2
ΔH (av.) = 2.8, σ = 0.5
ΔRT (av.) = 0.9, σ = 0.1
Water retention (L/day)ΔWater retention (av.) = 0.5, σ = 0.02
Wind speed (m/s)ΔWind speed (av.) = 2.3, σ = 0.4
Blue/green corridor (2)Temperature (°C)
Humidity (% RH)
Radiant black-bulb temperature (°C)
ΔT (av.) = 1.5, σ = 0.3
ΔH (av.) = 2.6, σ = 0.4
ΔRT (av.) = 1.1, σ = 0.1
Water retention (L/day)ΔWater retention (av.) = 0.9, σ = 0.01
Top wind speed (m/s)ΔWind speed (av.) = 2.9, σ = 0.6
Table 3. PCMs to be assessed on Benicalap neighbourhood.
Name
Composition
ReferenceMelting
Temperature (°C)
Phase Change
Enthalpy
(Kj/Kg)
Thermal
Conductivity (W/m K)
Density
(Kg/m3)
Type
RT54HC[39]53–542000.20800Organic
paraffin
Caprylic + lauric acid (9:1 by mol)[40]3.81510.20835Organic
eutectic
Tetrahydrofuran clathrate hydrate[41]4.42550.15912Inorganic
Table 4. Carbon footprints after LCA in Benicalap neighbourhood.
SimulationCO2 Footprint
Embedded
(Tn CO2/year)
CO2 Footprint
Usage
(Tn CO2/year)
Total
CO2 Footprint
(Tn CO2/year)
Savings
(%)
Current state38.1273.4311.50.0
NBSs40.1256.2296.34.9
NBSs + paraffin43.7221.1264.815.0
NBSs + eutectic42.8232.0274.811.7
NBSs + inorganic41.5216.7258.217.1
Publisher’s Note: MDPI stays neutral with regard to jurisdictional claims in published maps and institutional affiliations.

