
Thermal Perception in Naturally Ventilated University Buildings in Spain during the Cold Season

 ,
,  ,
,  and
and 
Abstract
:1. Introduction
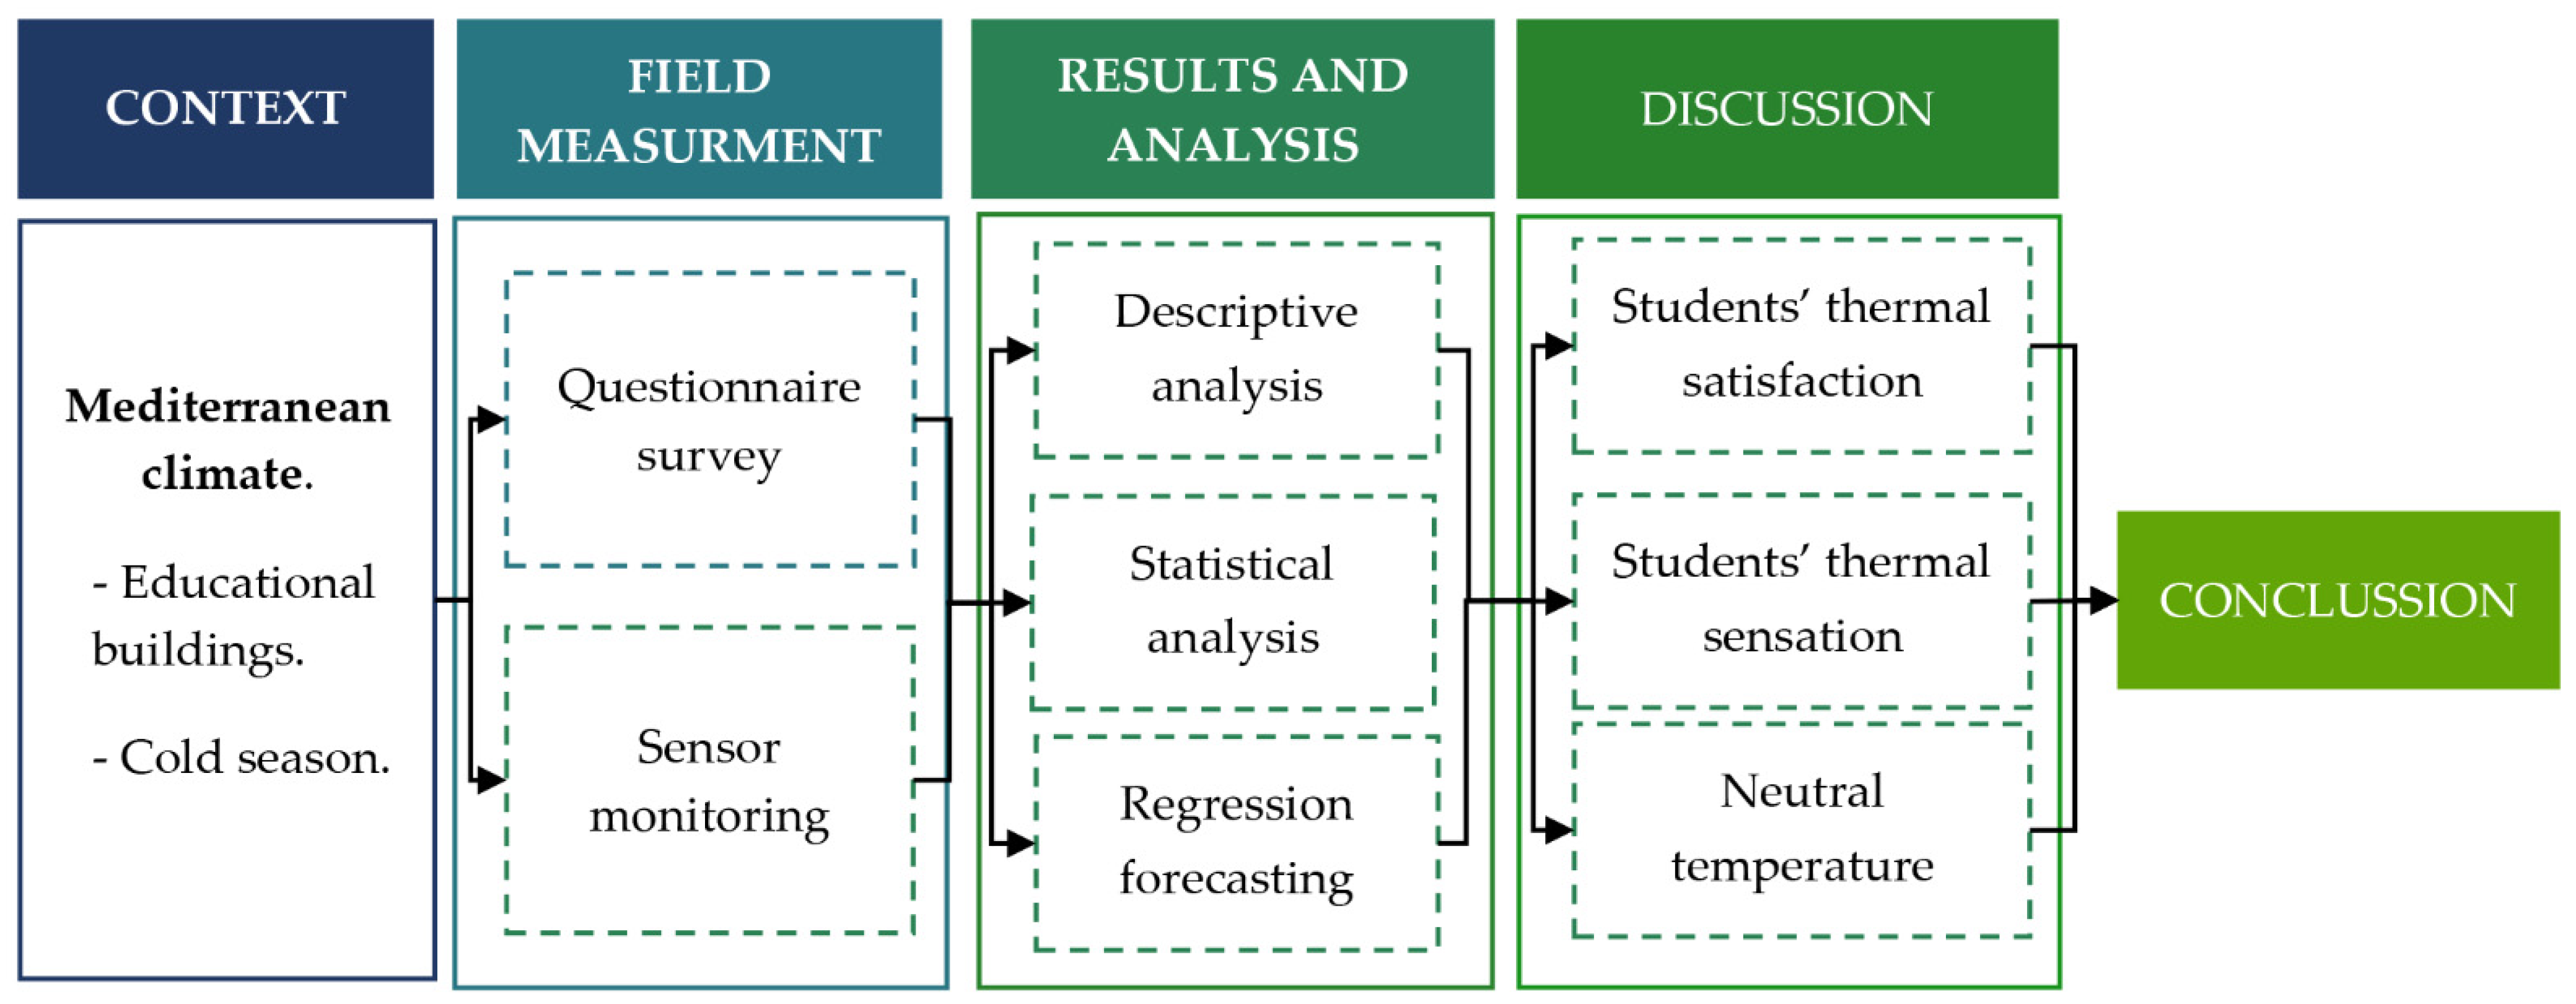
2. Materials and Methods
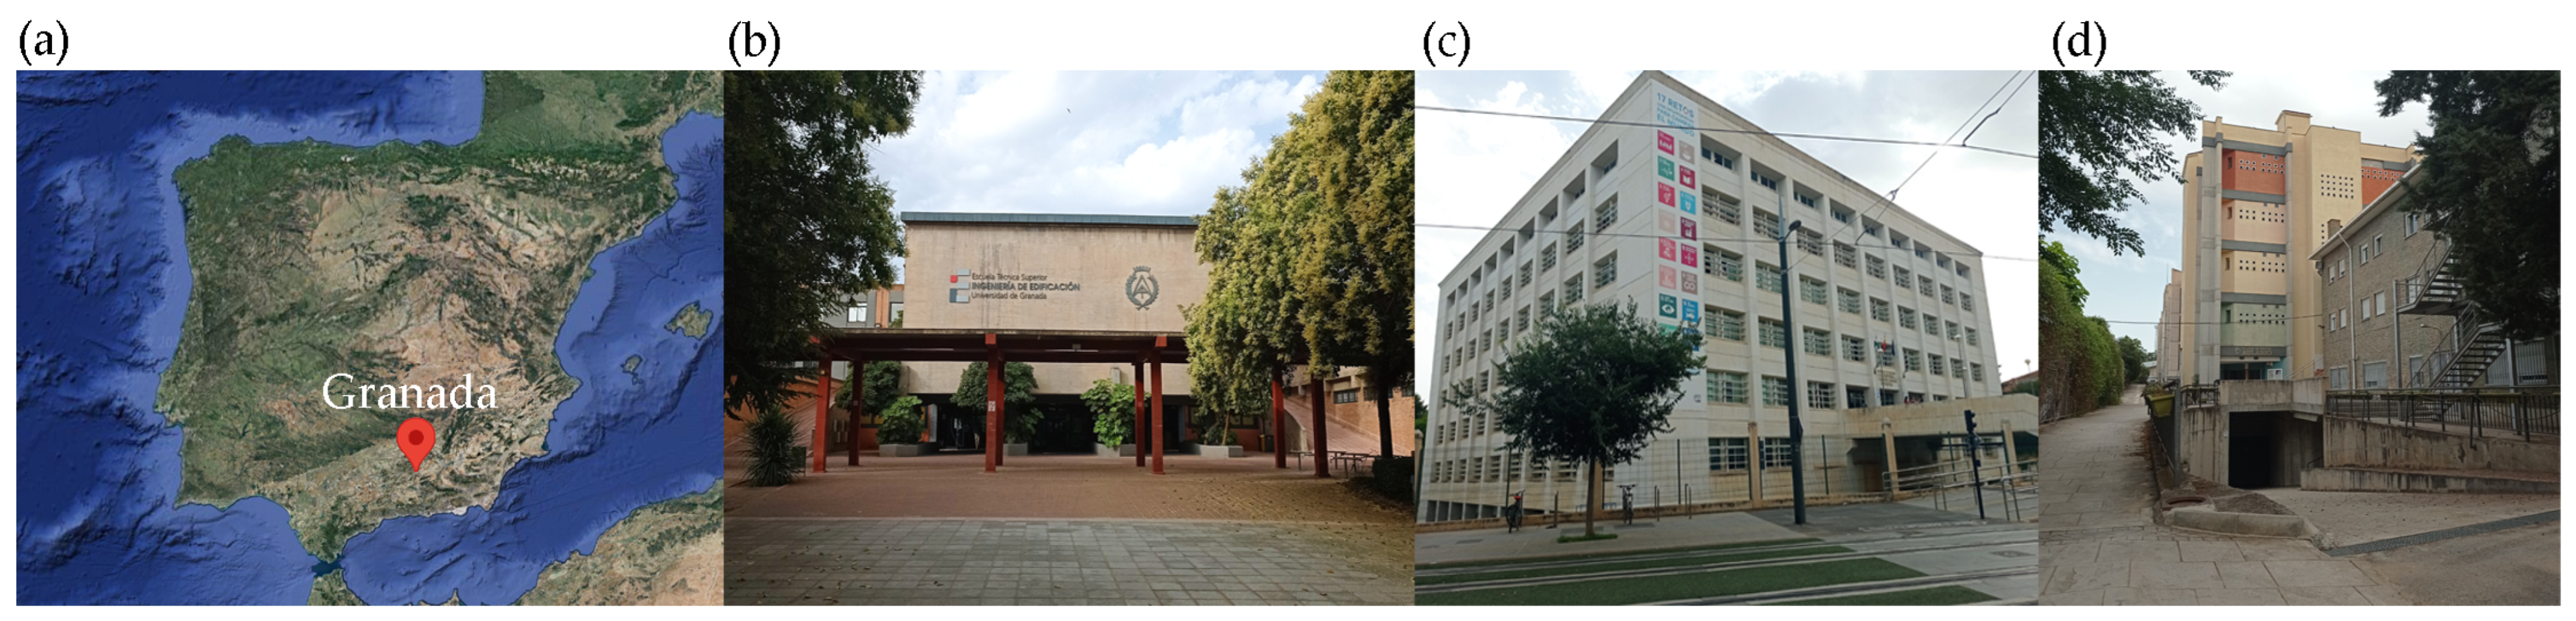
2.1. Descriptions of the Buildings and Classrooms
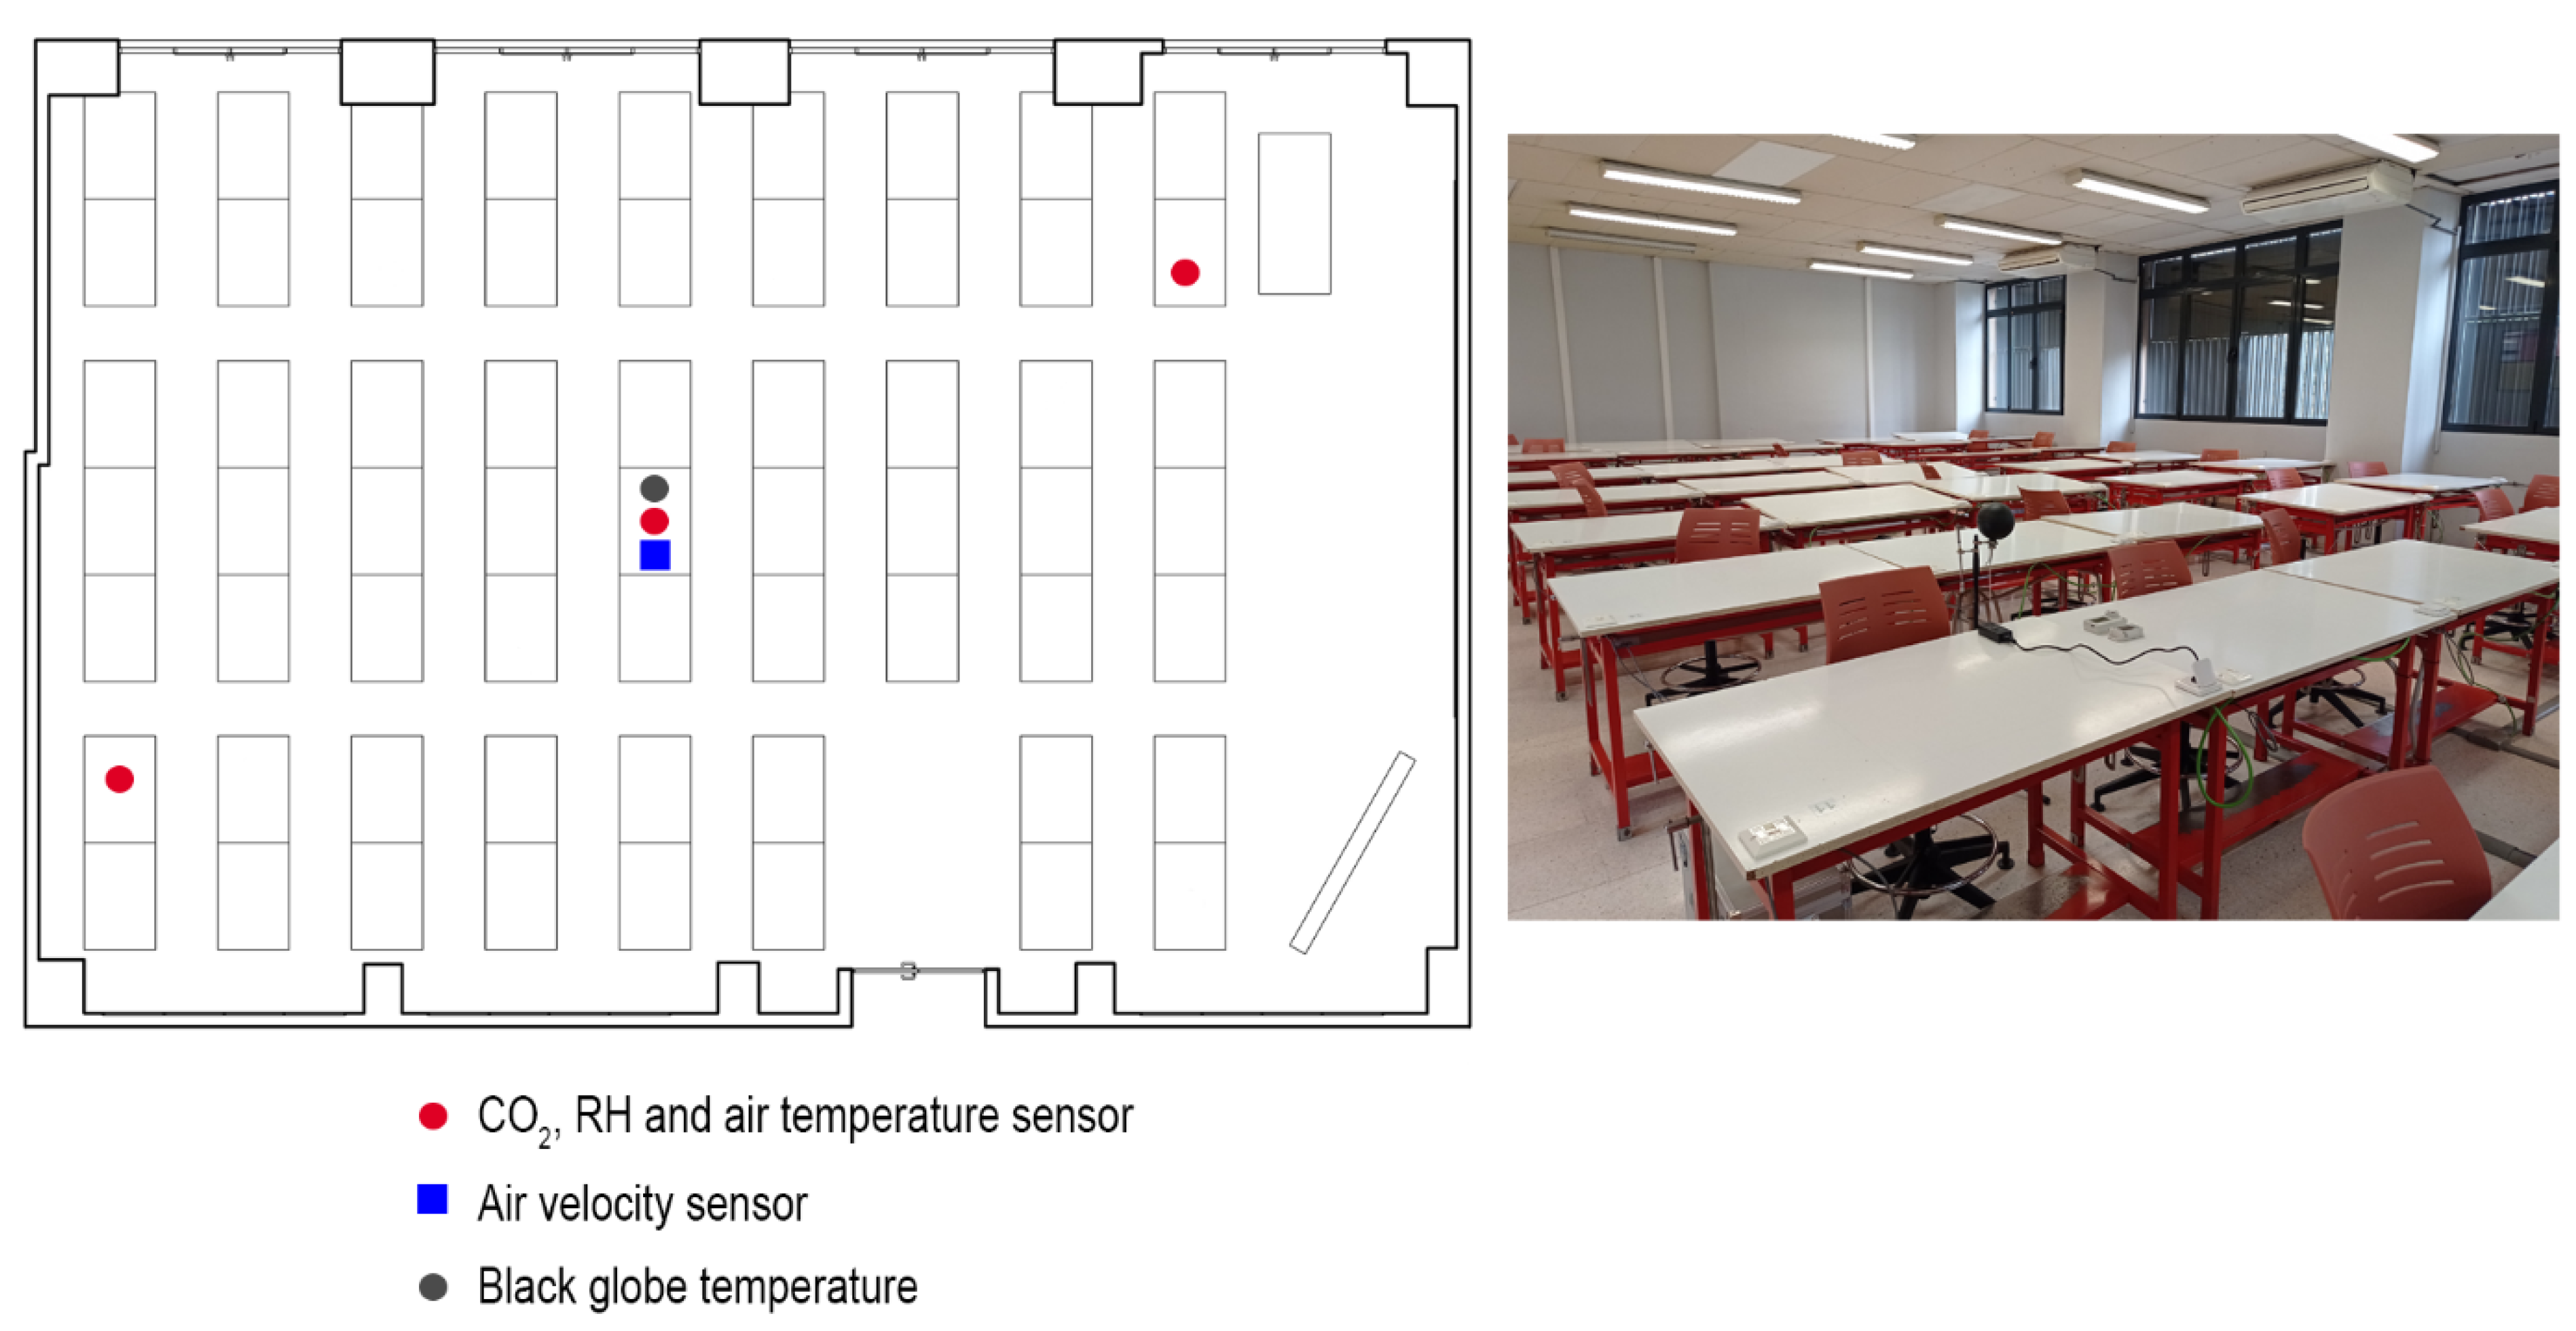
2.2. Enviromental Evaluation
2.3. Thermal Perception Survey
3. Results
3.1. Indoor and Outdoor Environments
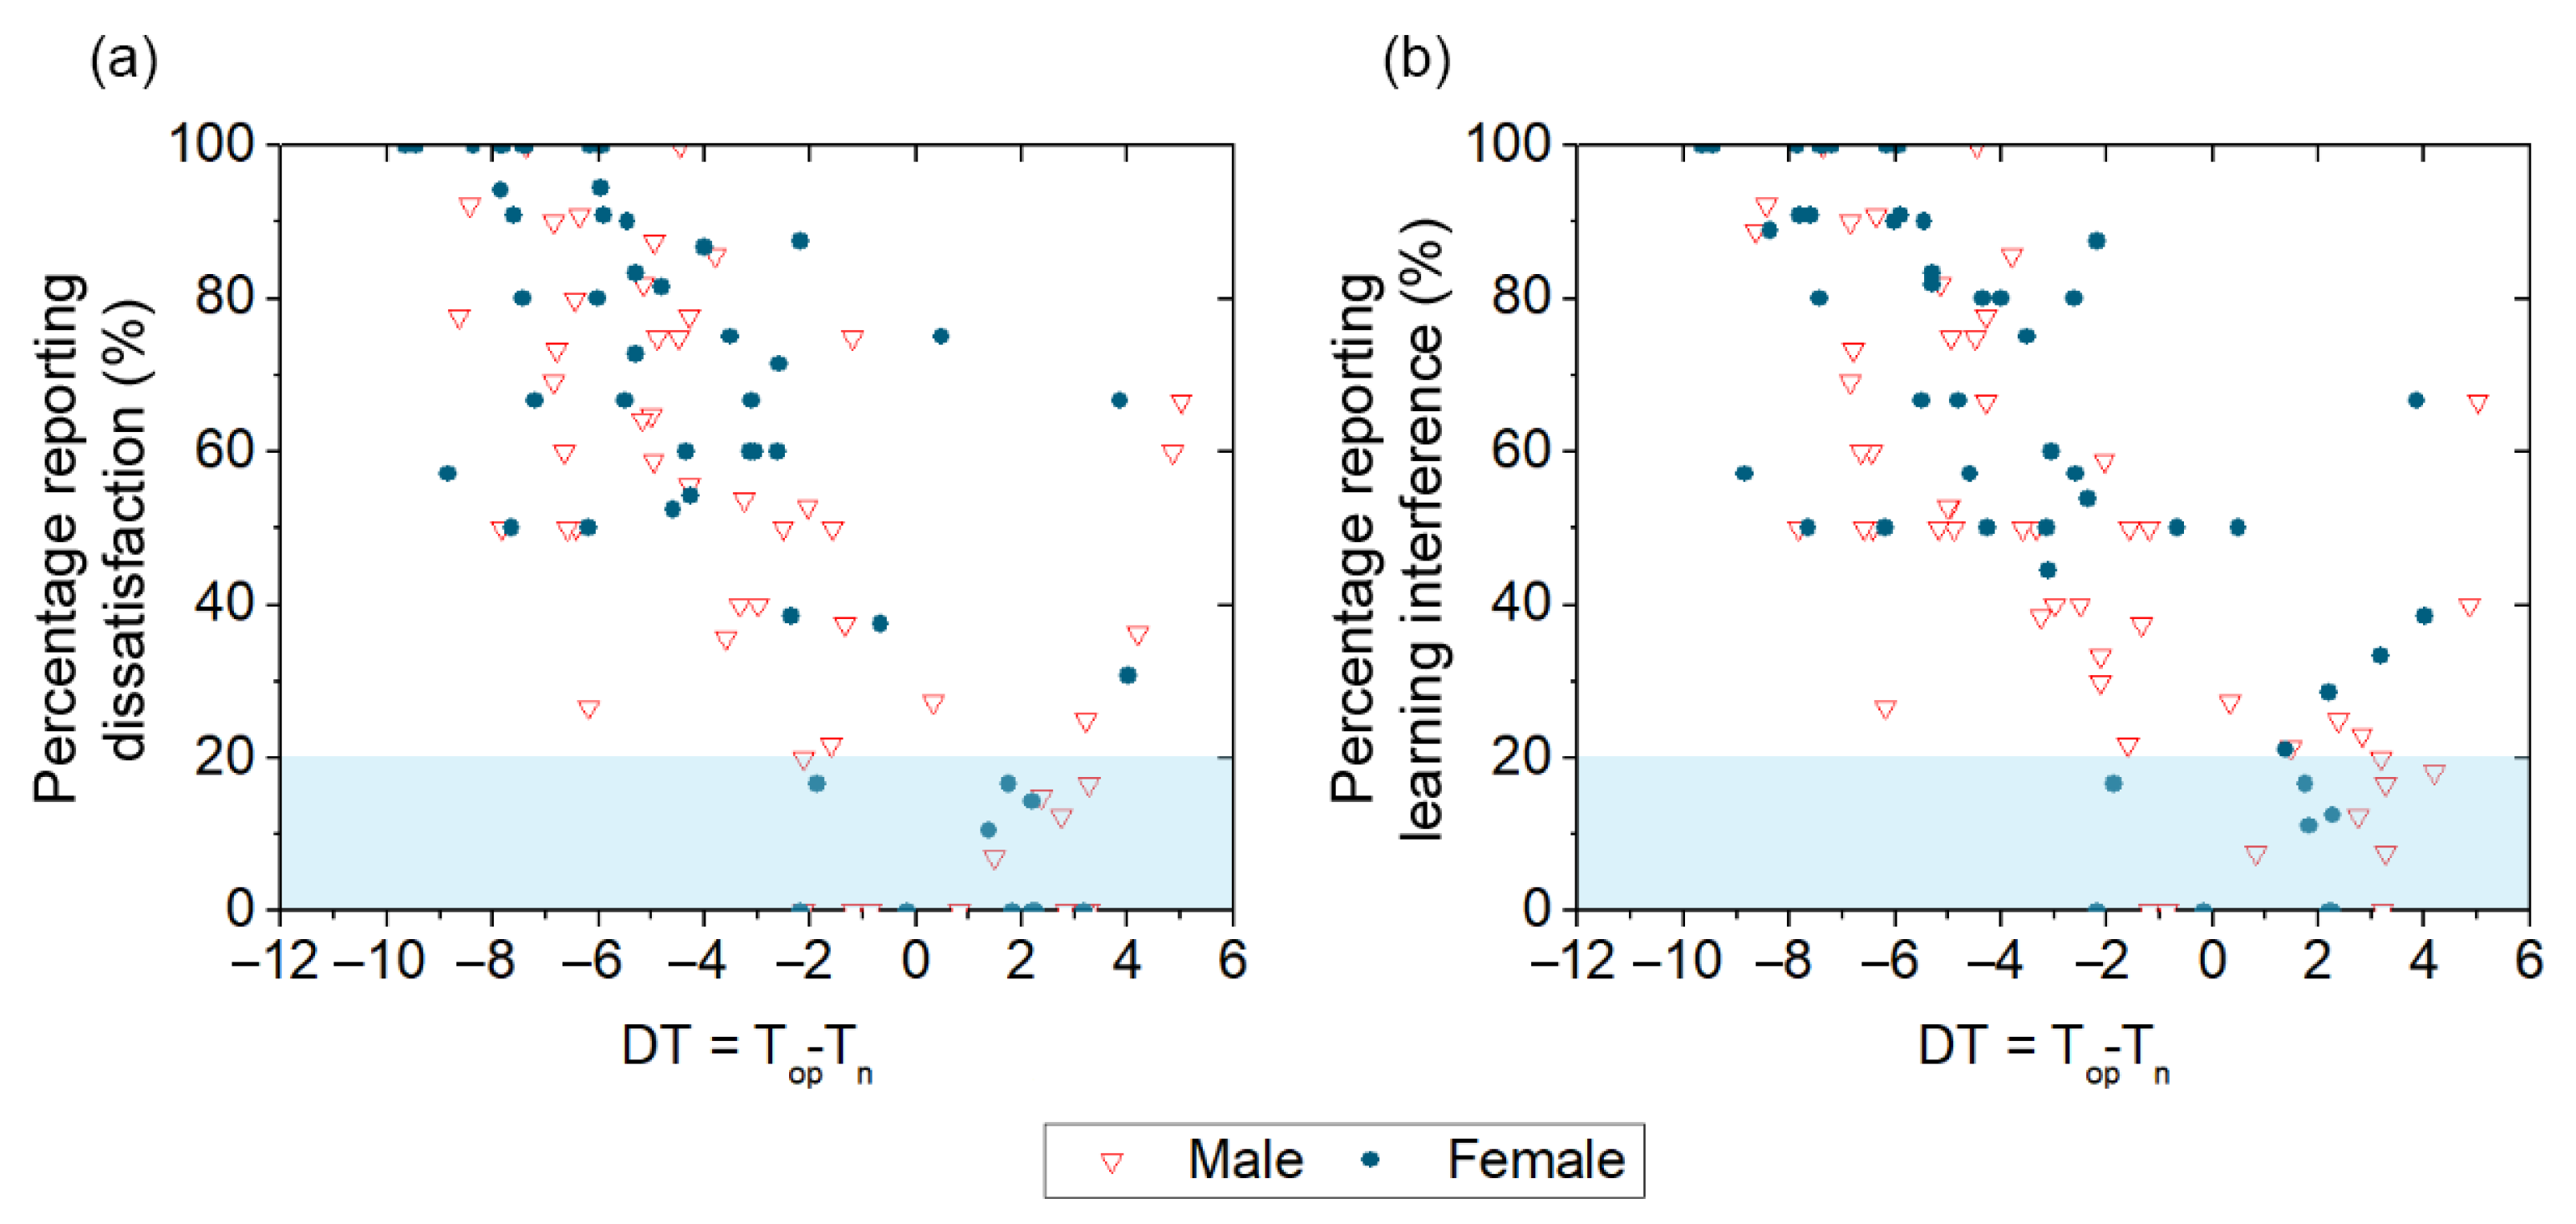
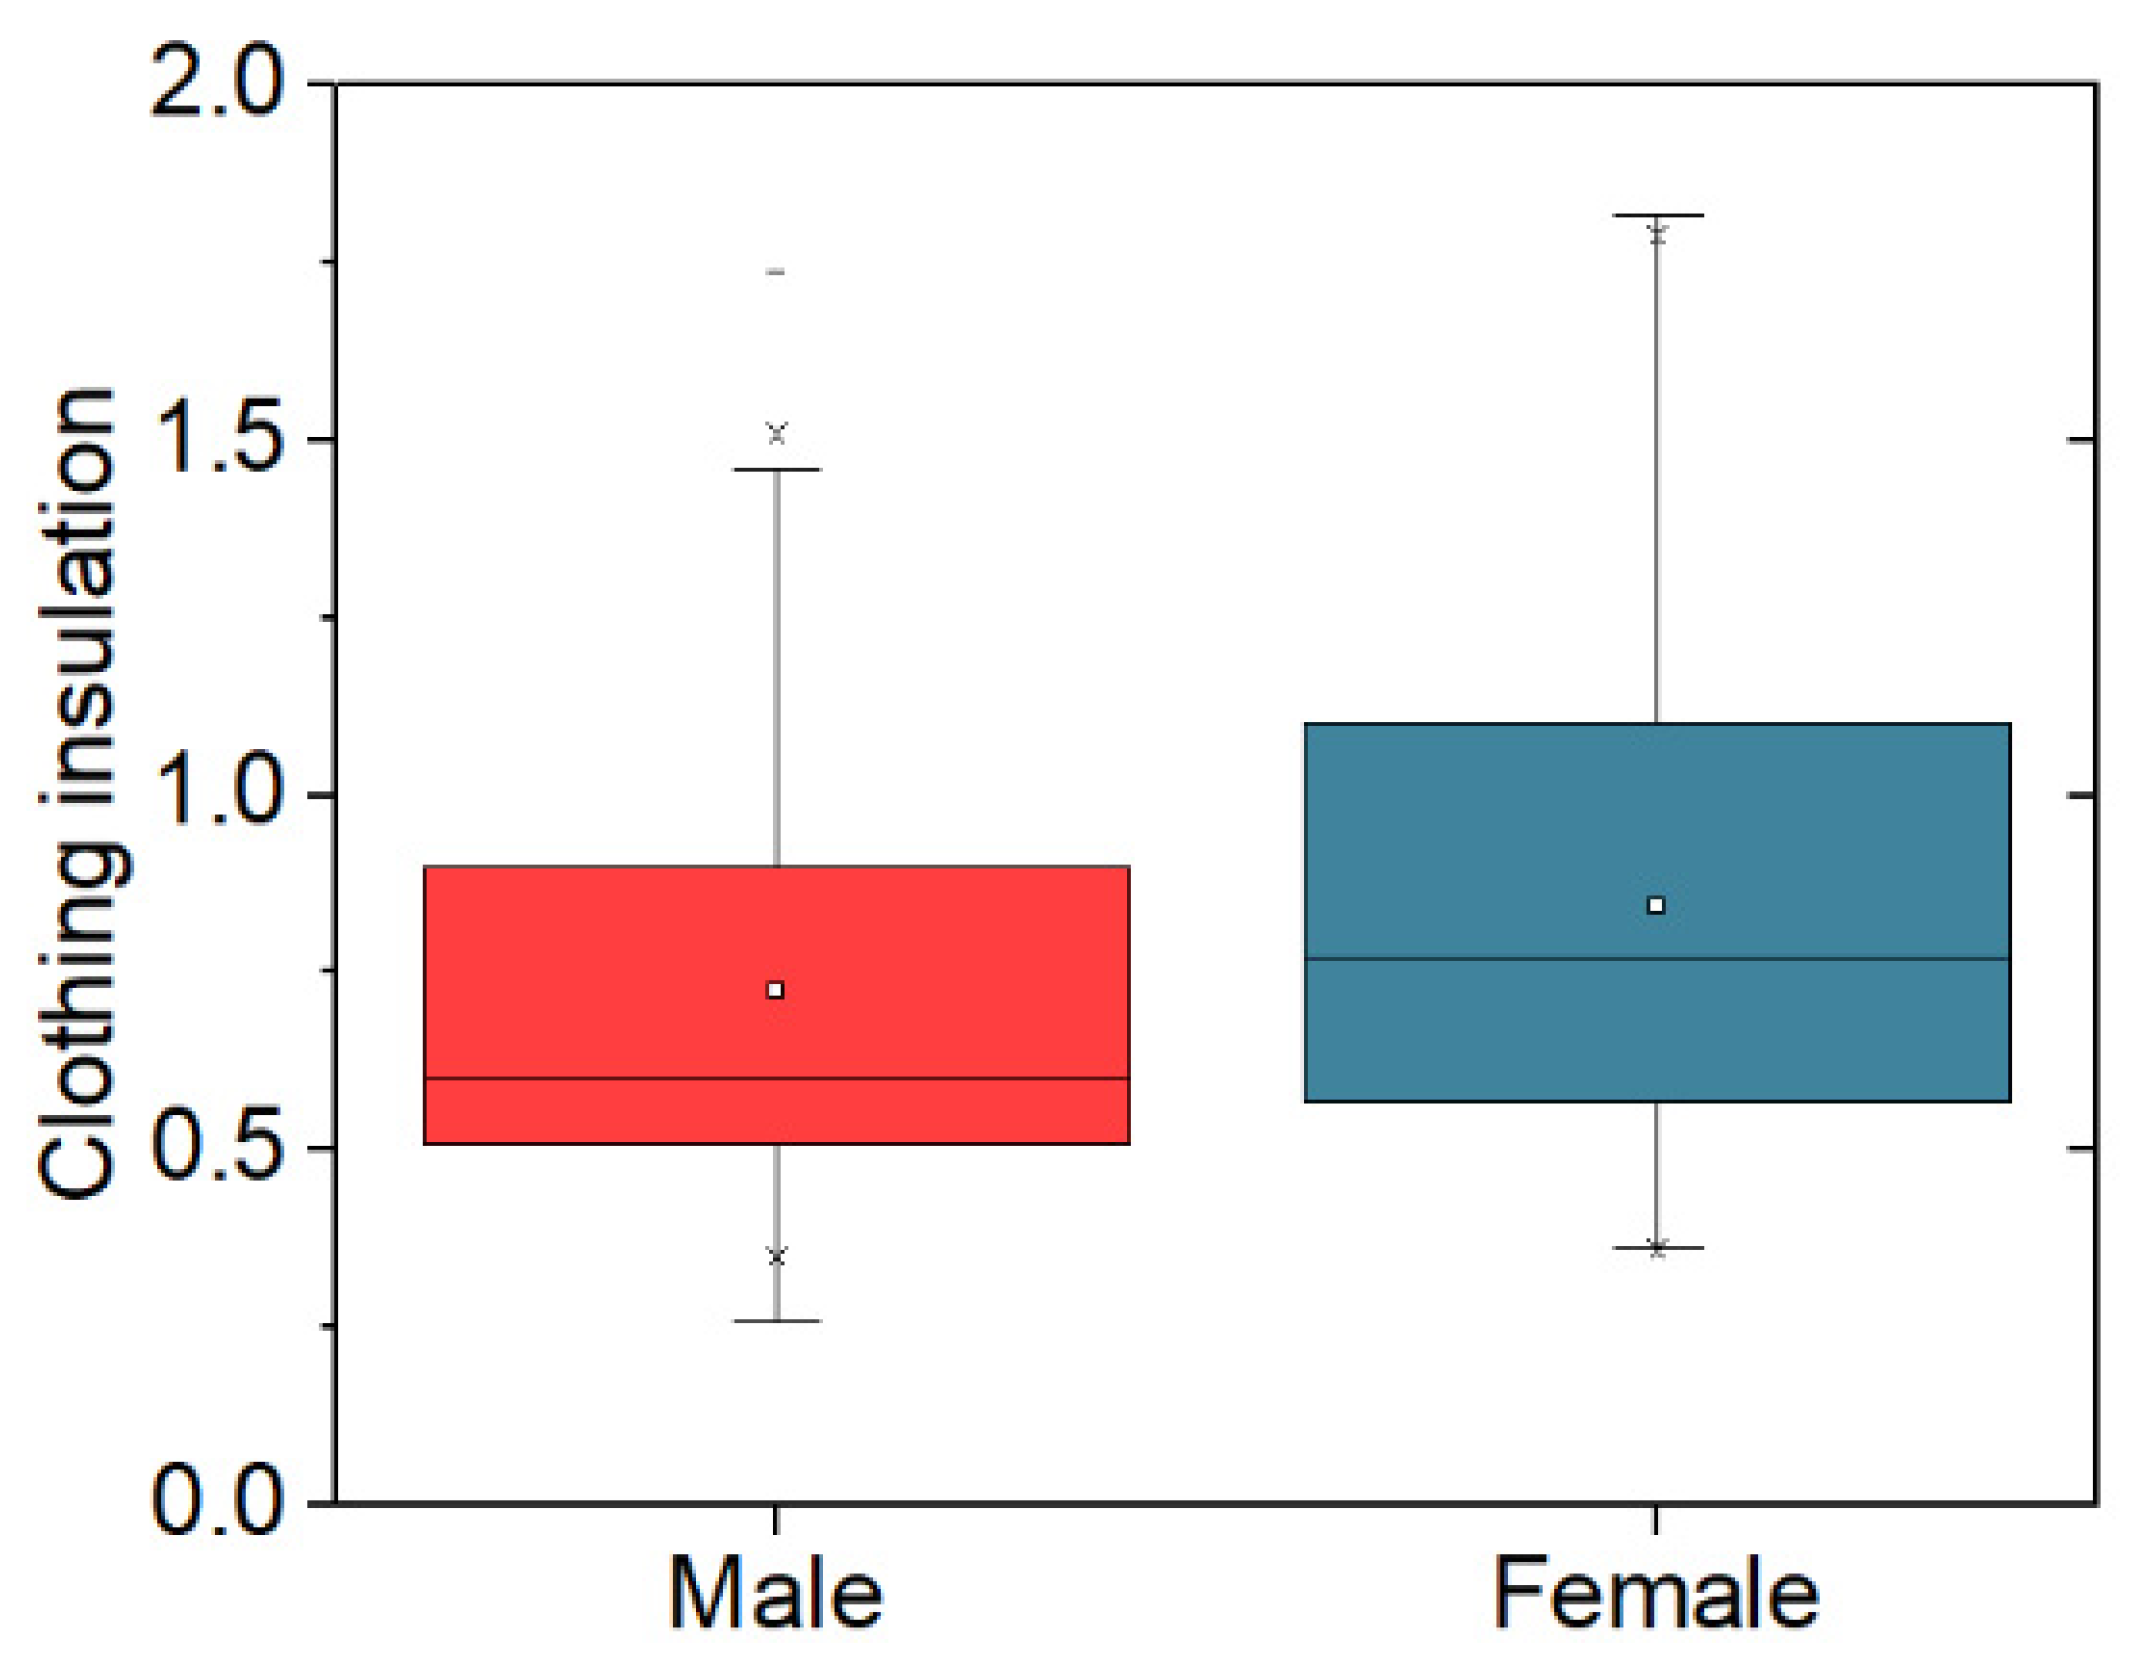
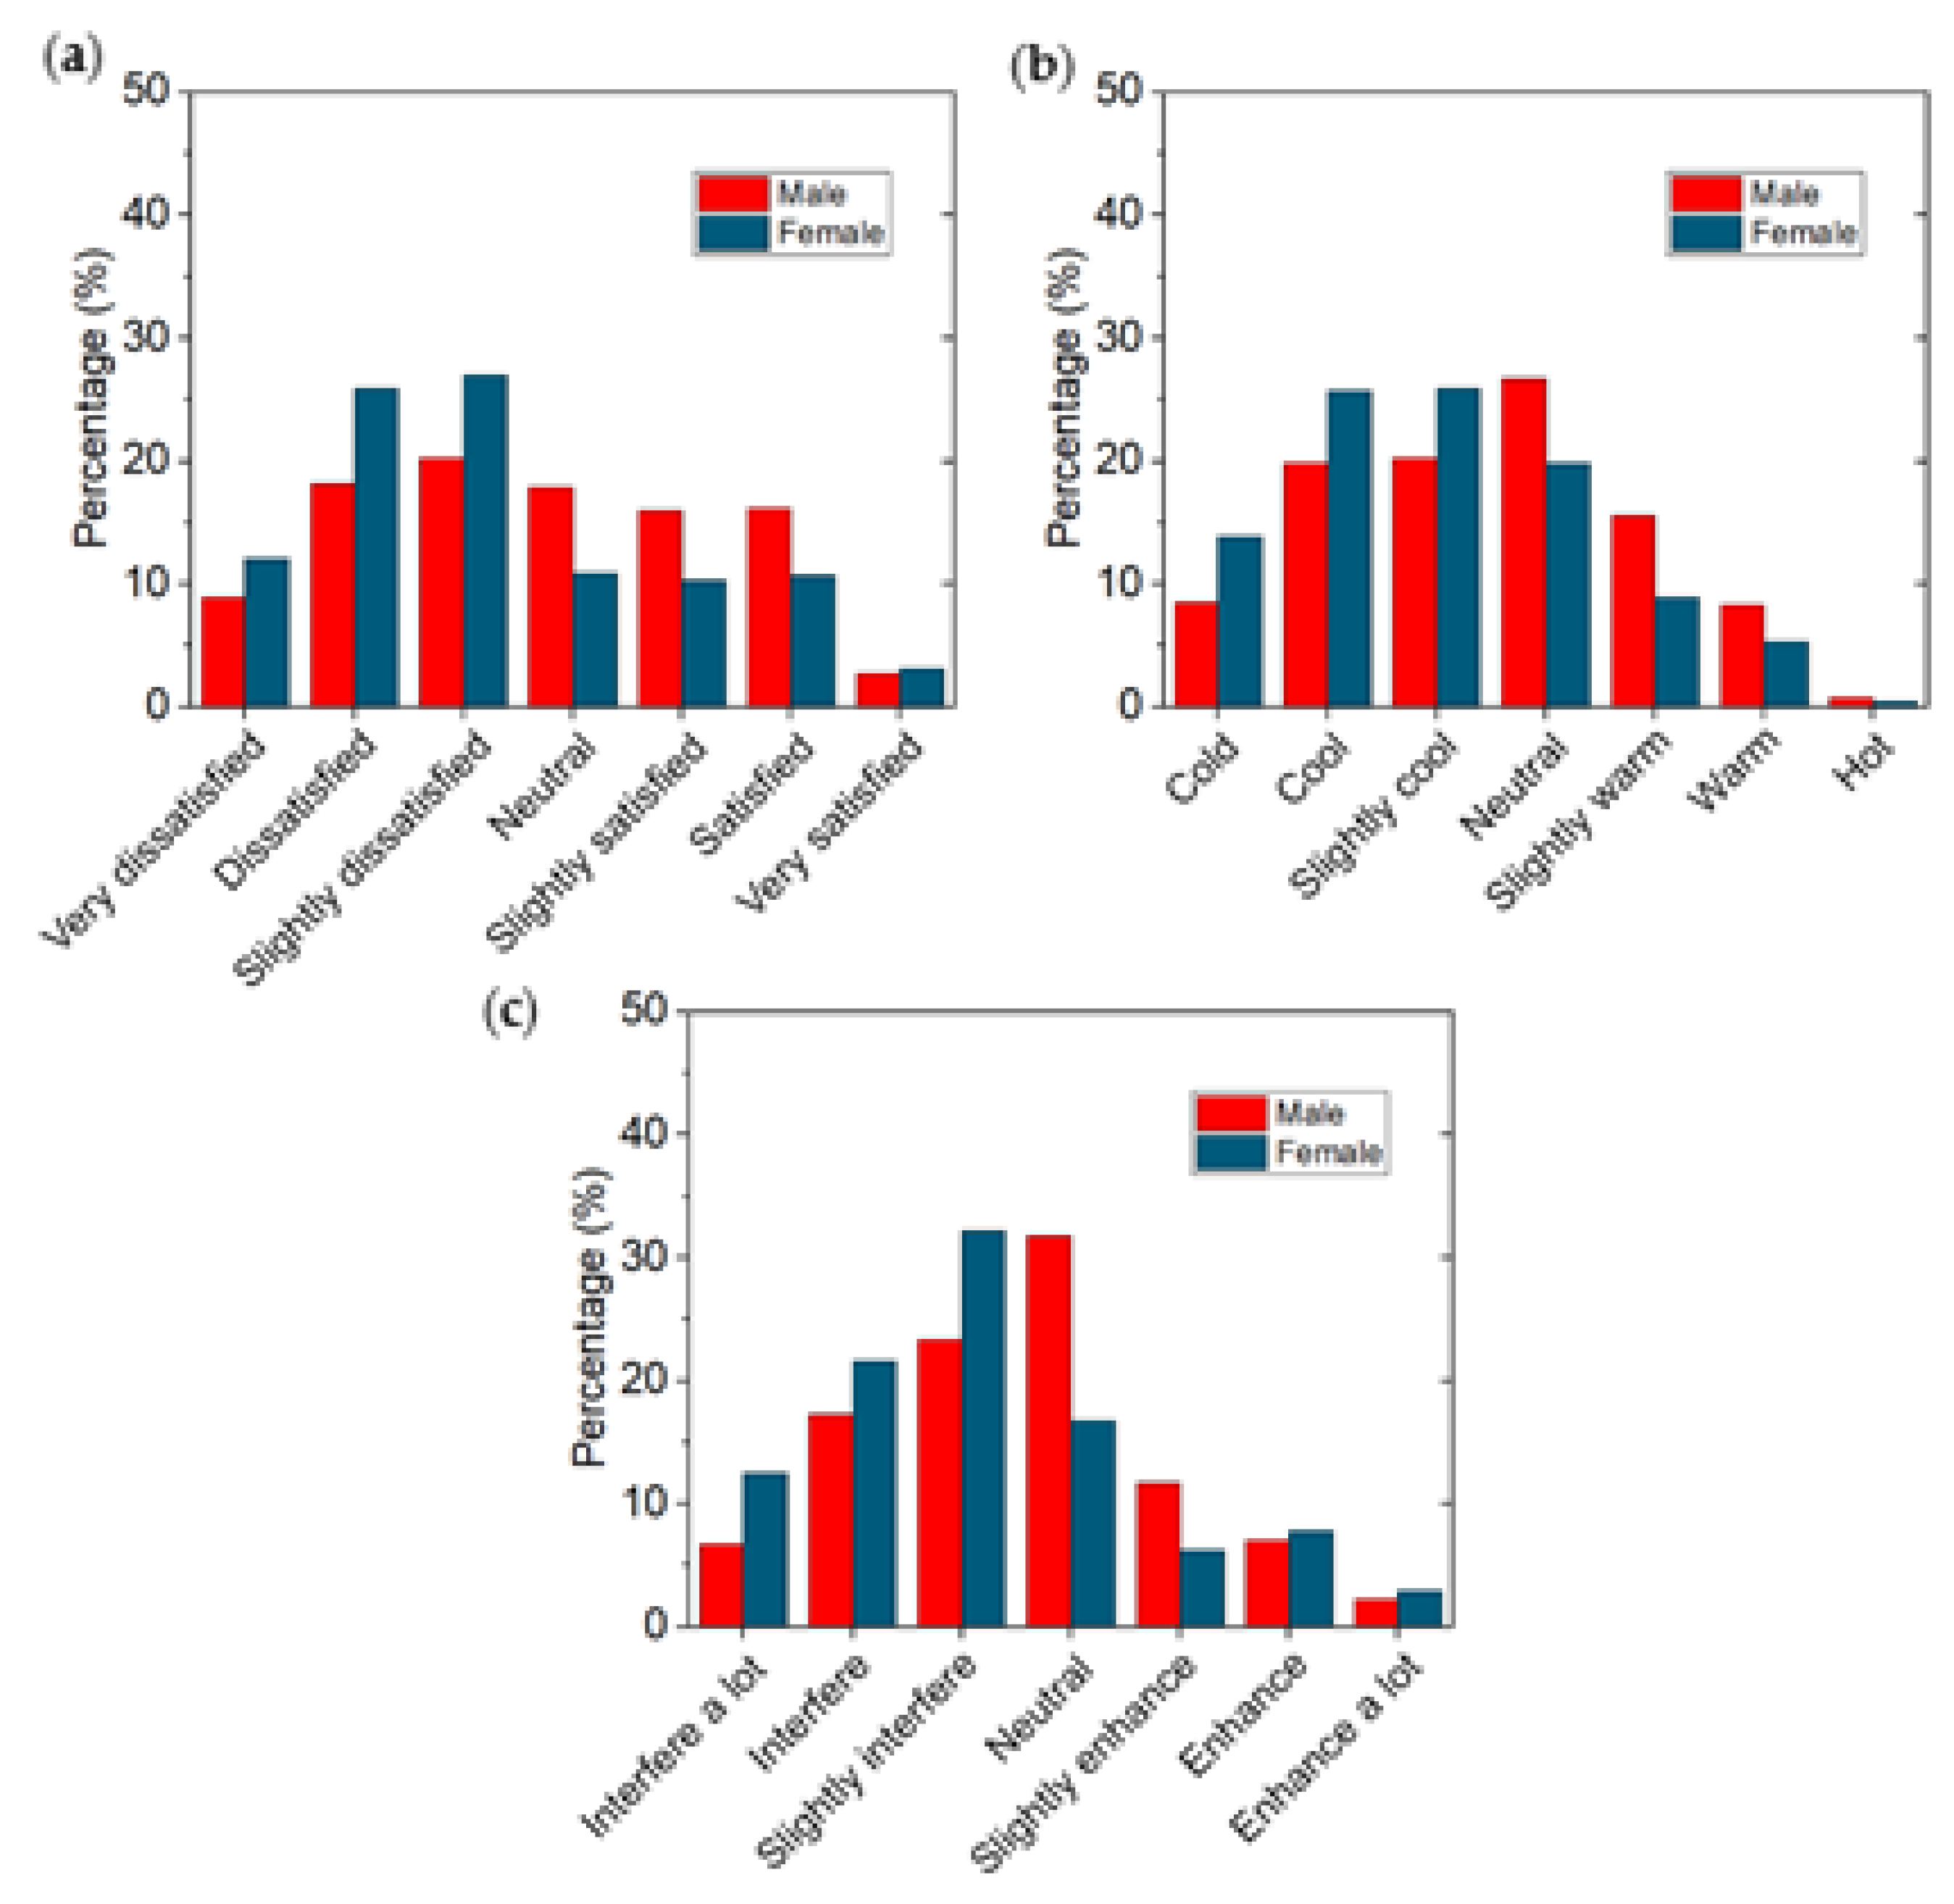
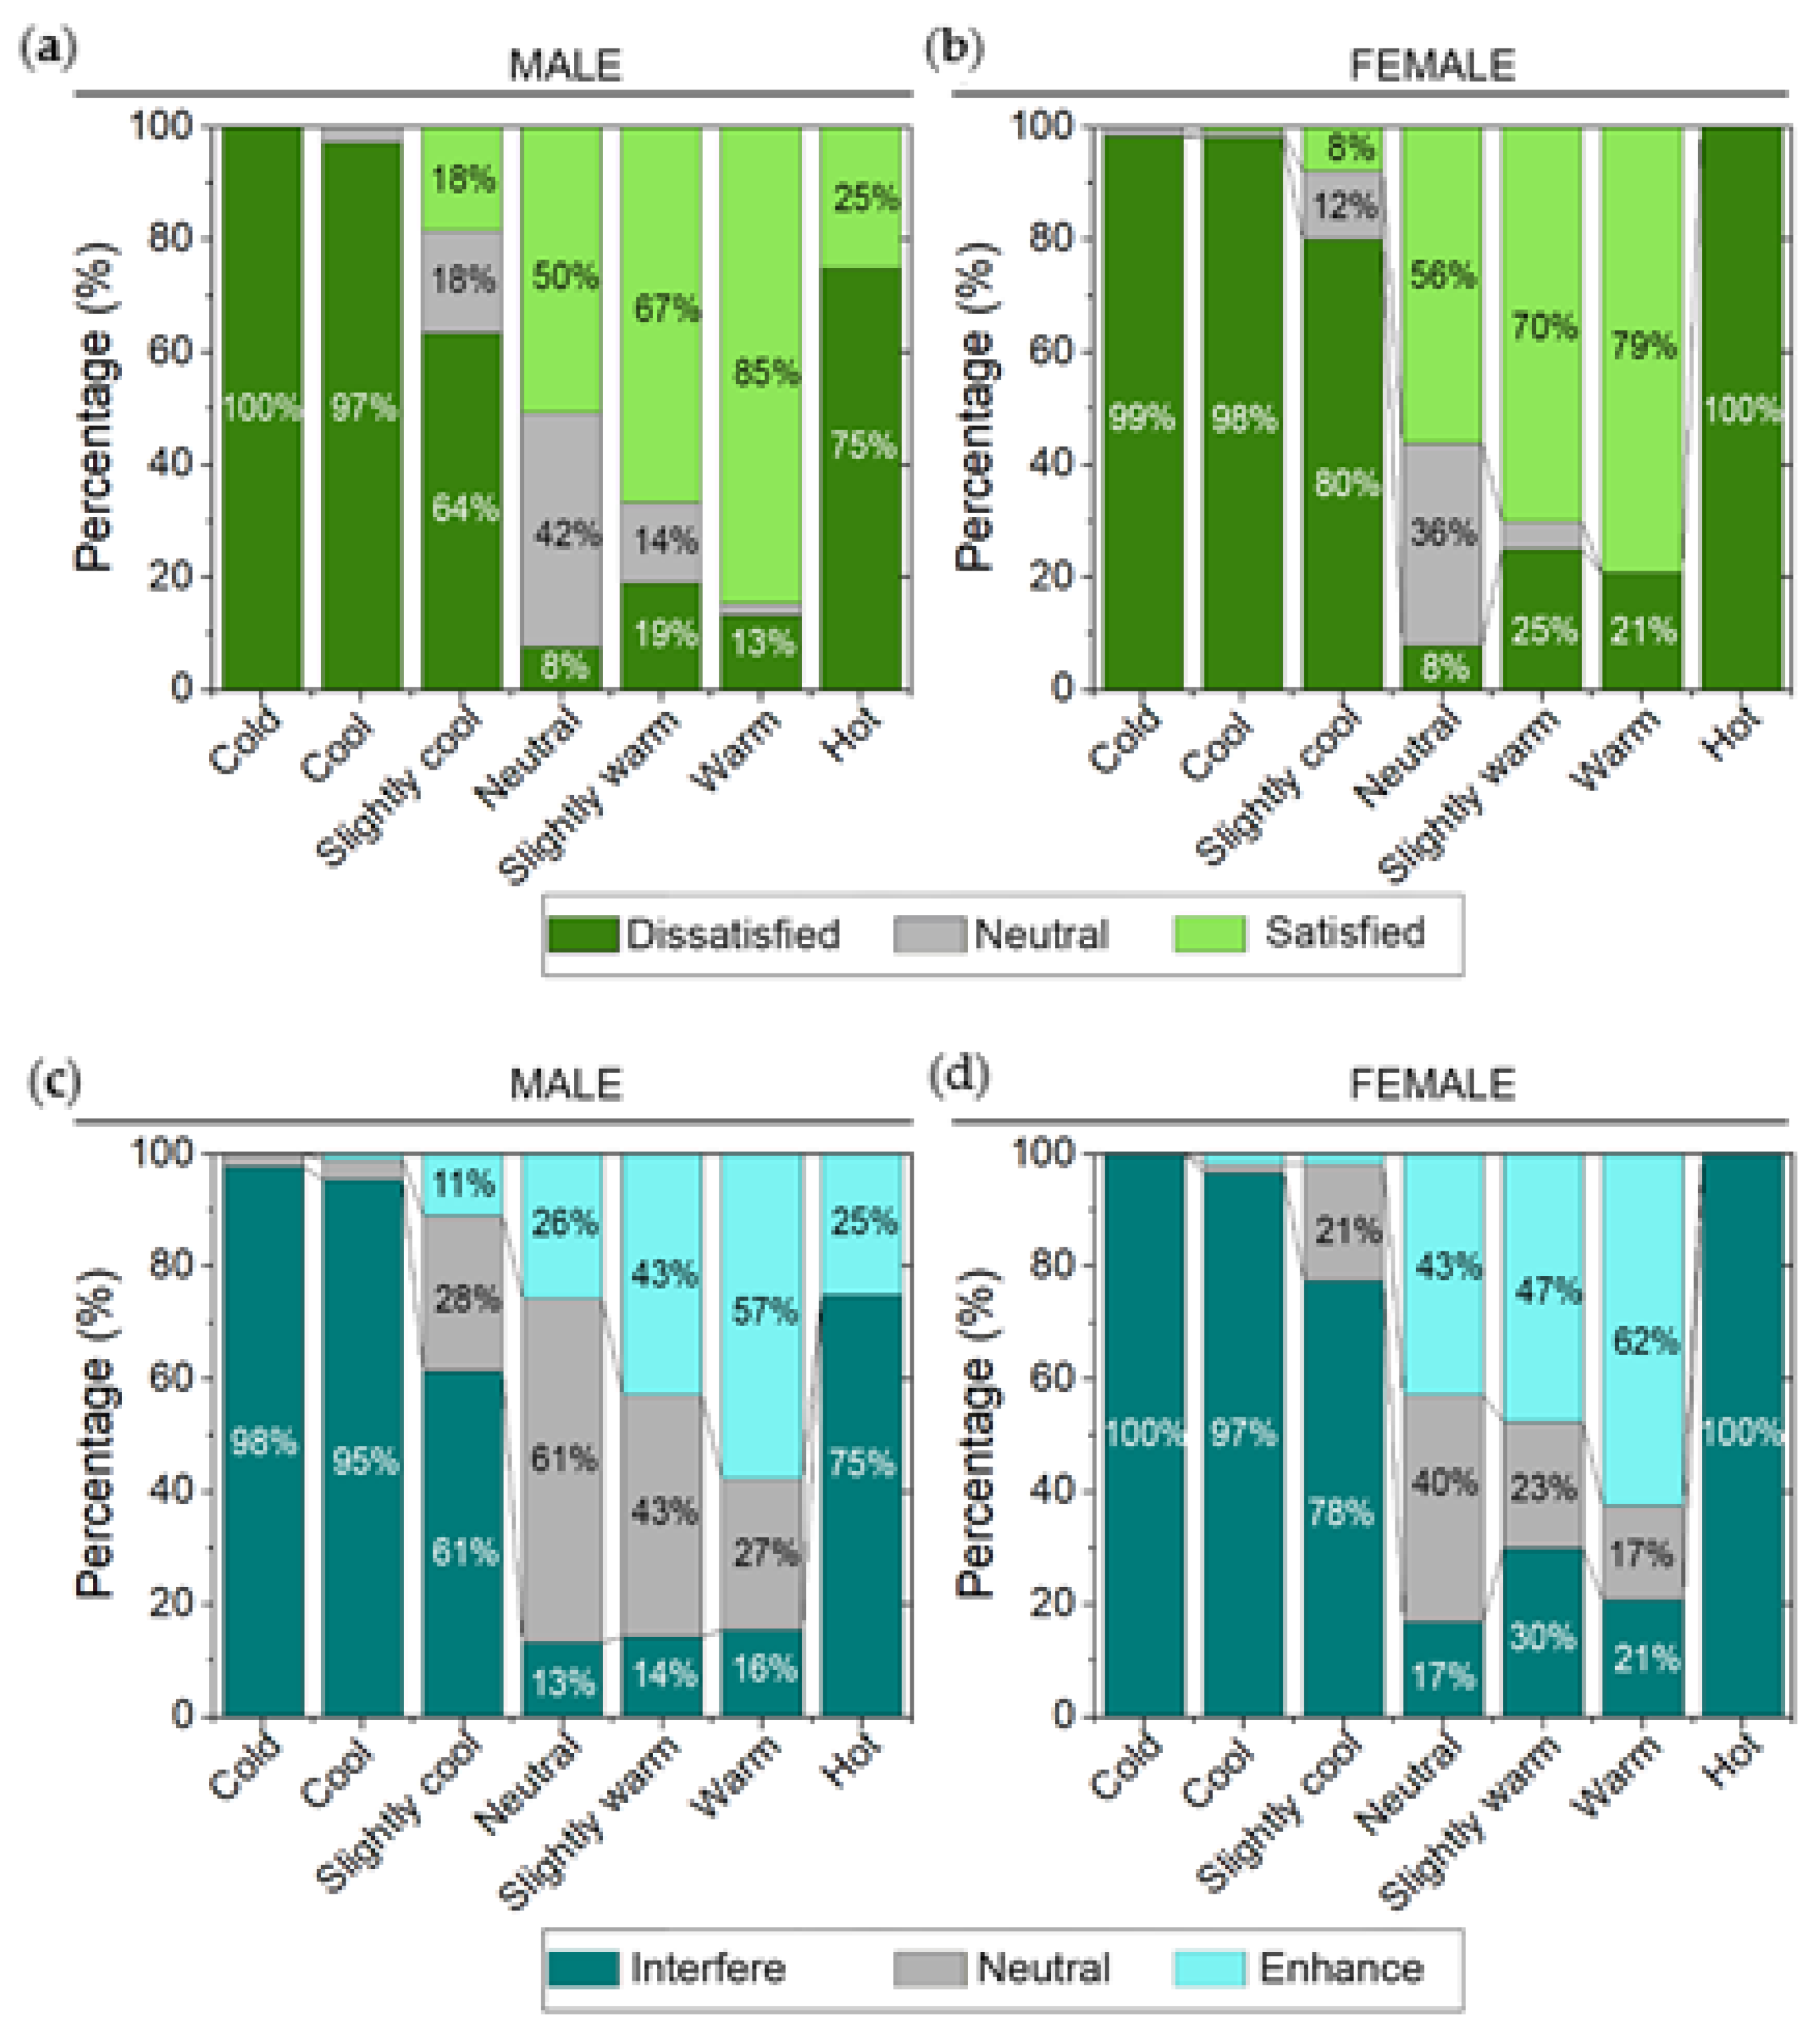
3.2. Students’ Thermal Perceptions
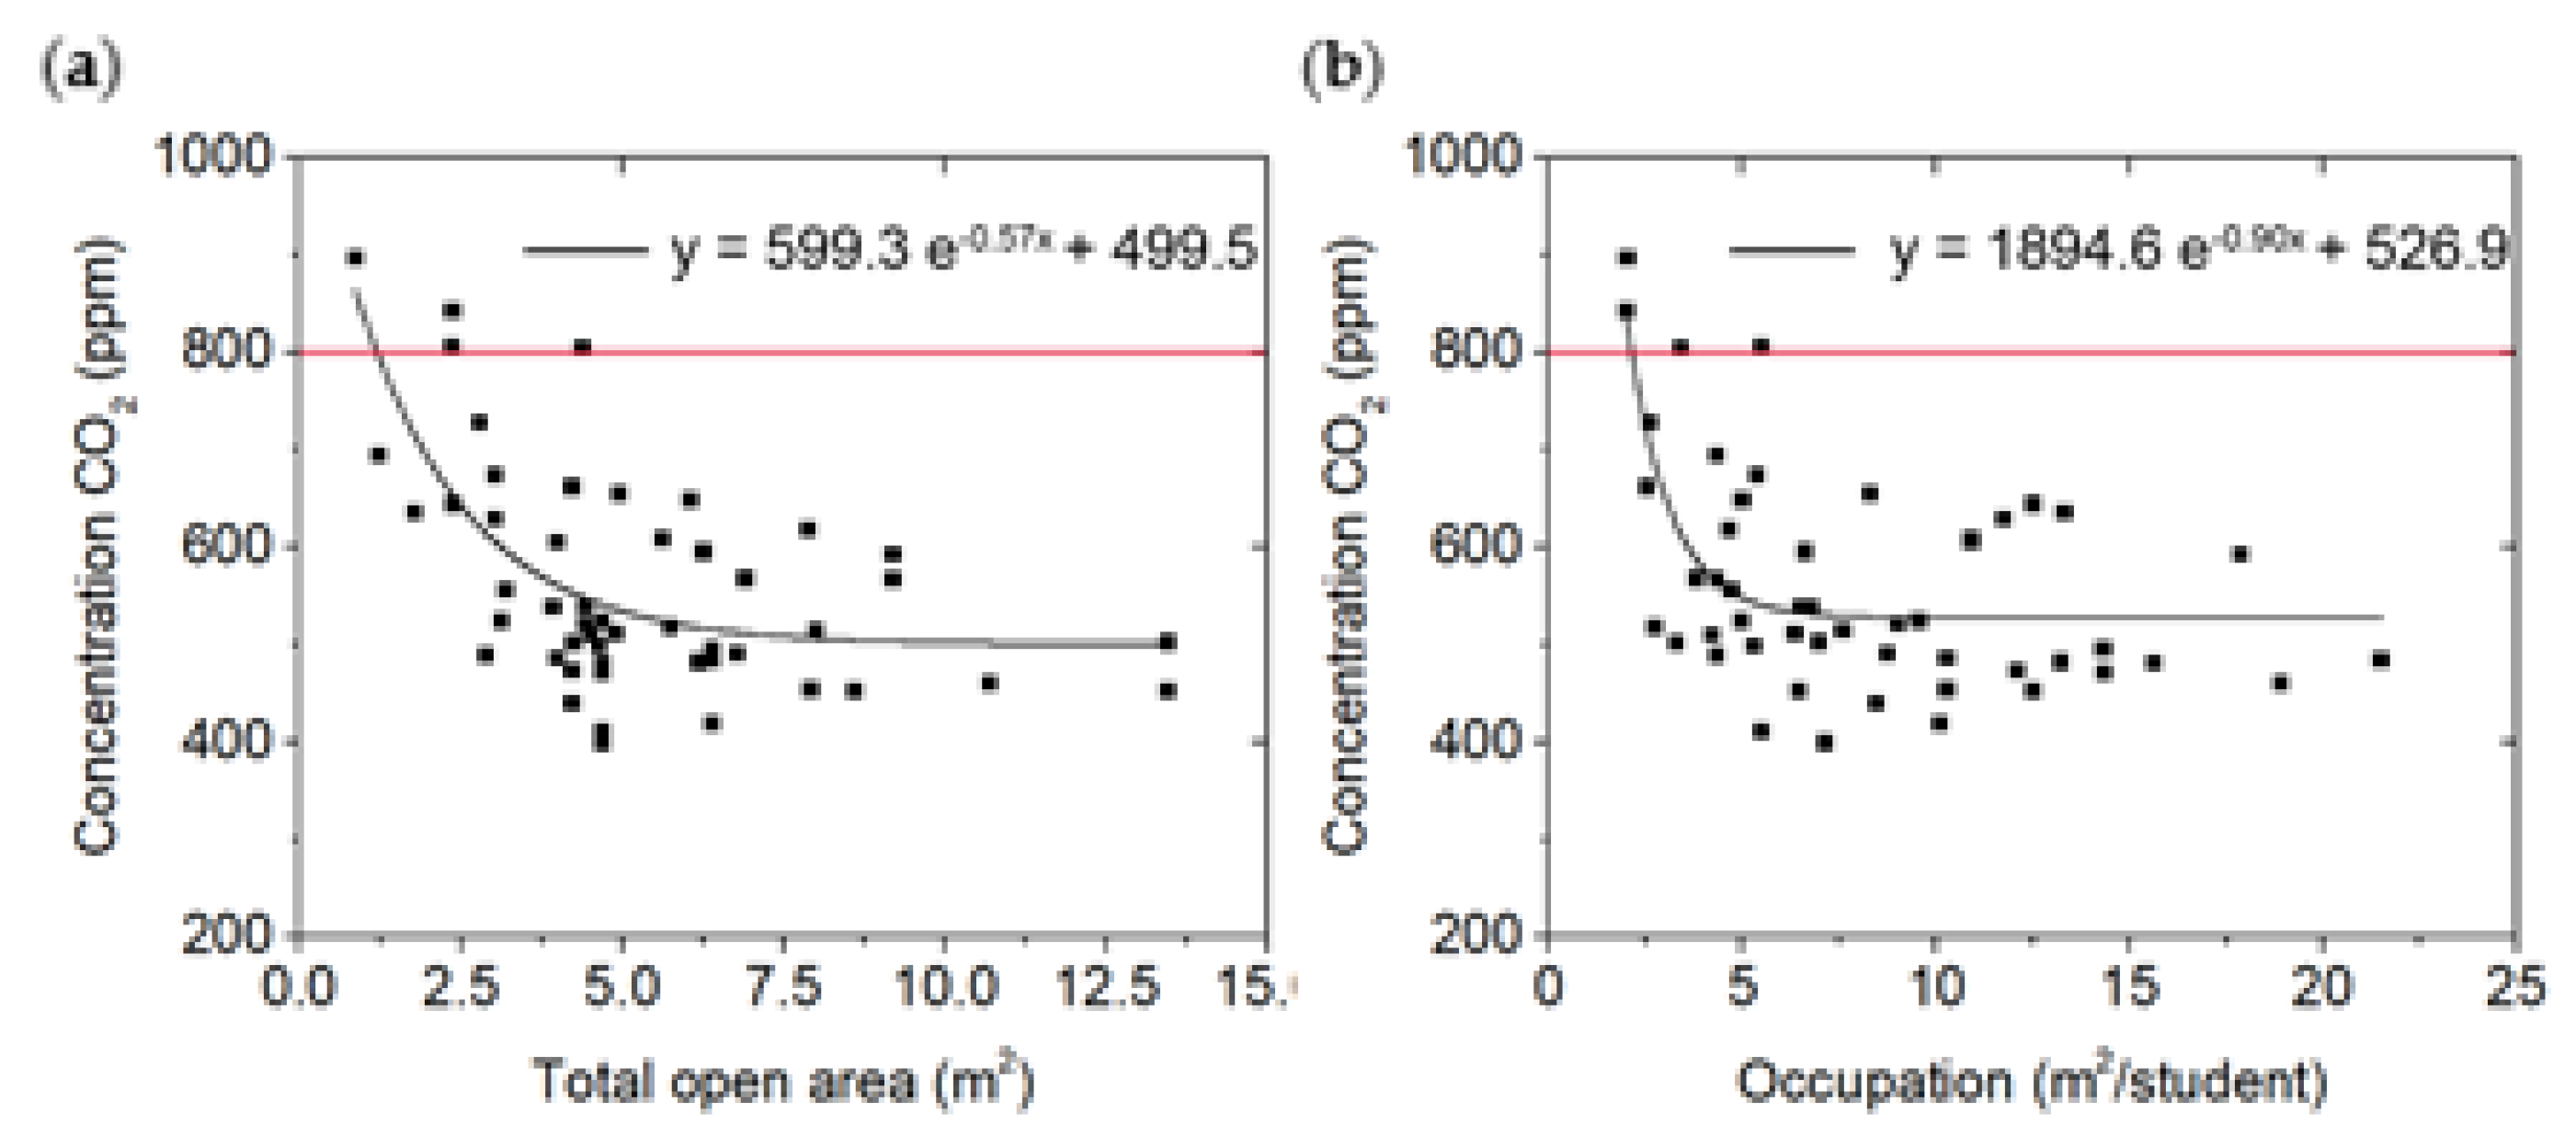
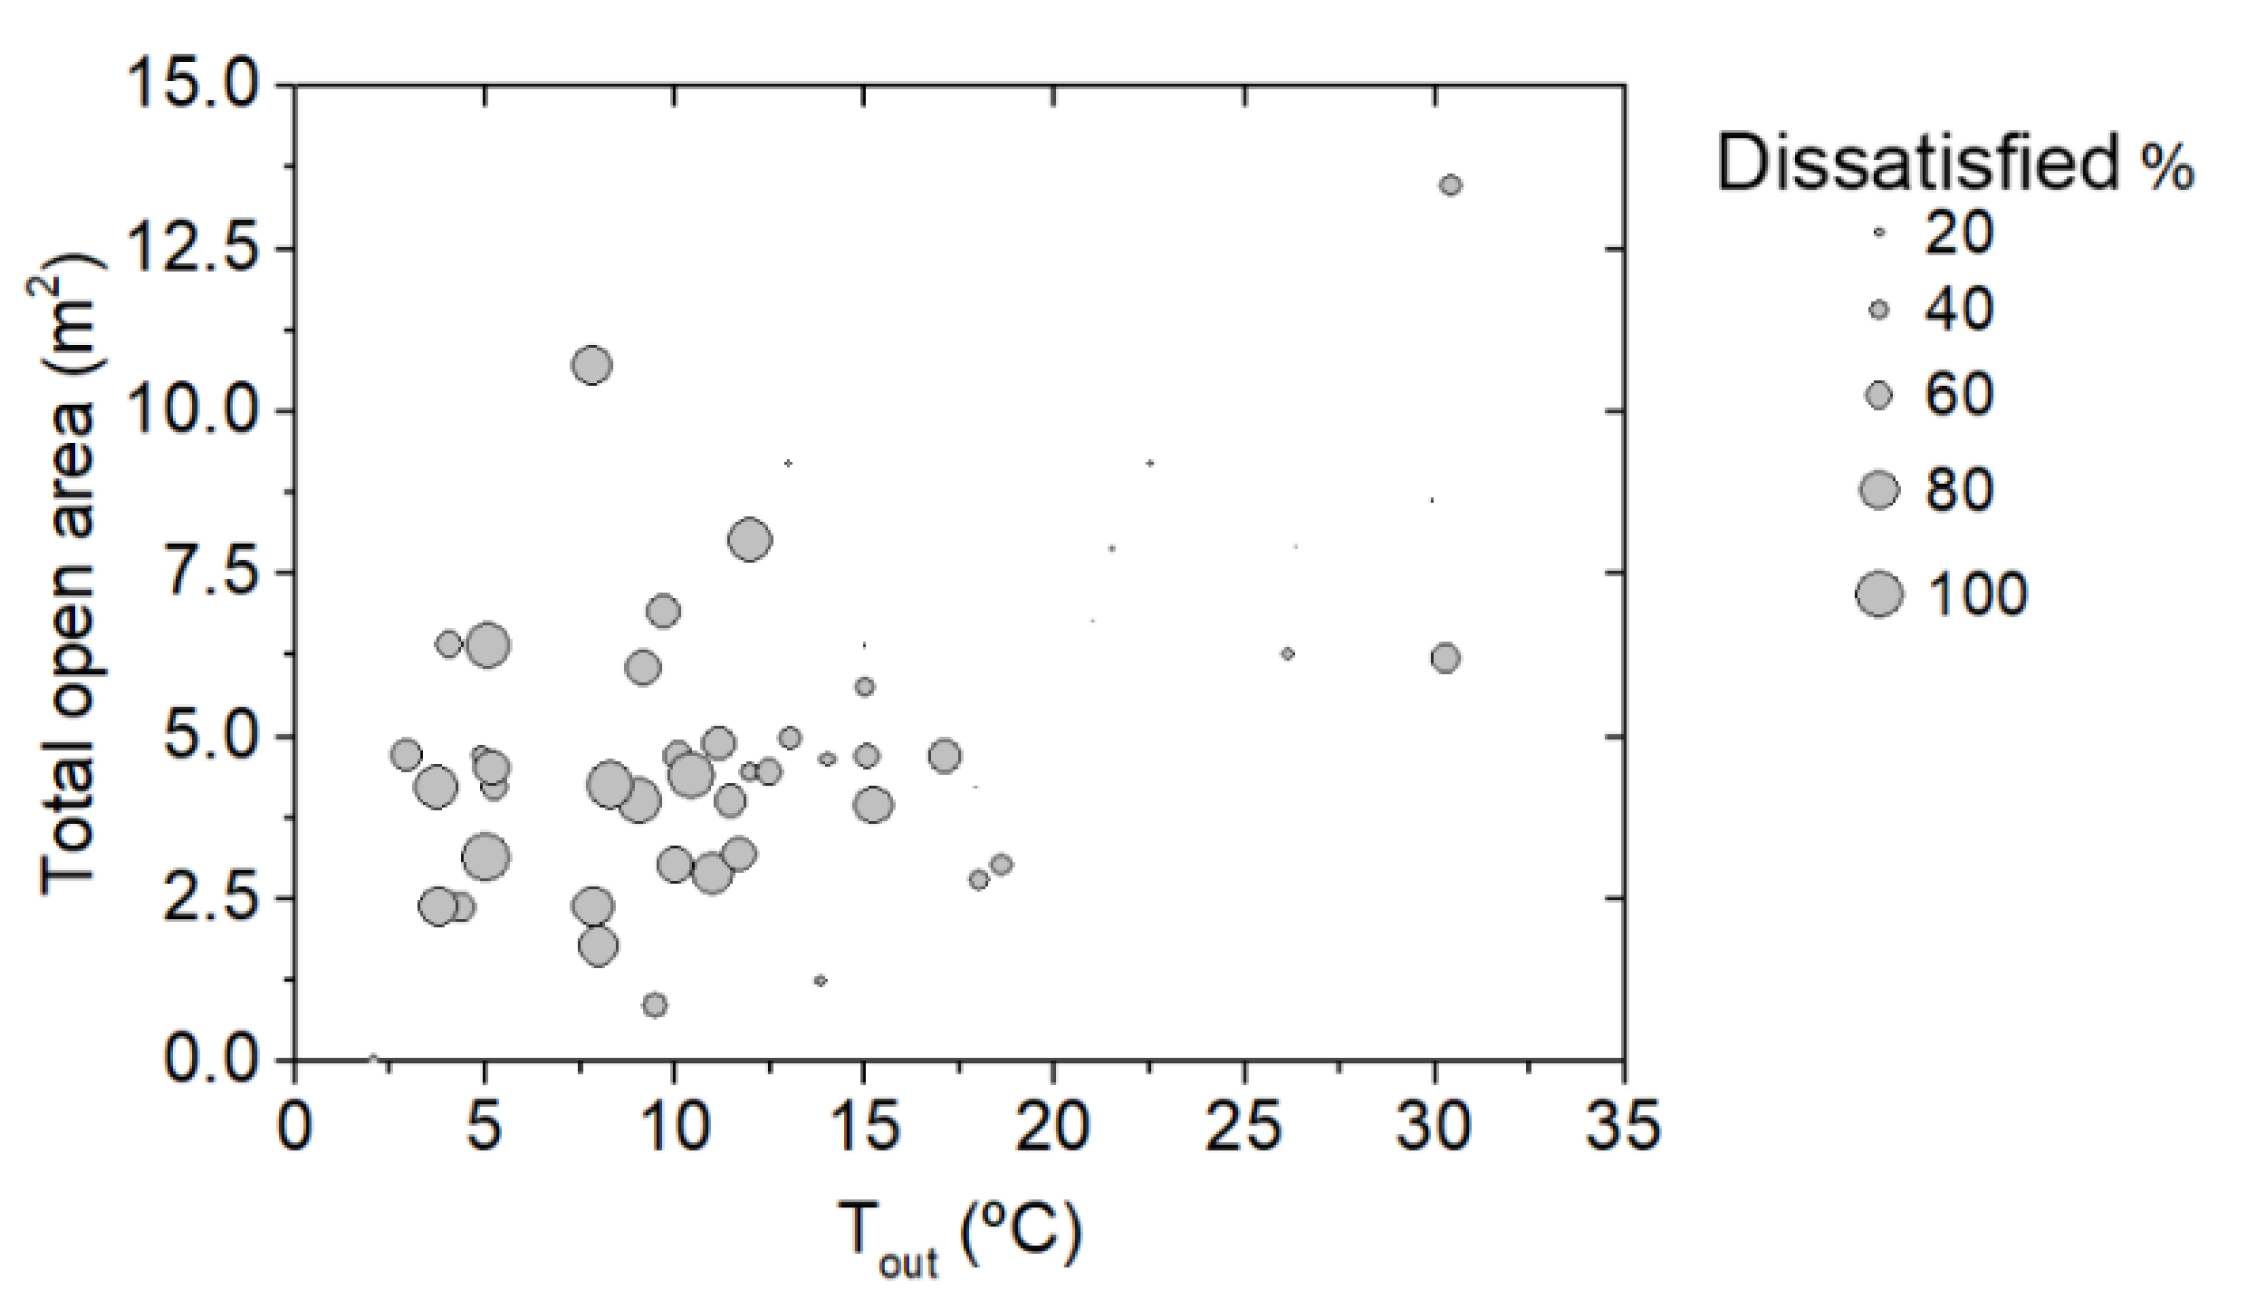
3.3. Continuous Natural Ventilation and the Indoor Thermal and Air Quality Environment
4. Discussion
5. Limitations
6. Conclusions
Author Contributions
Funding
Institutional Review Board Statement
Informed Consent Statement
Data Availability Statement
Acknowledgments
Conflicts of Interest
References
- Bortolini, R.; Forcada, N. Association between building characteristics and indoor environmental quality through post-occupancy evaluation. Energies 2021, 14, 1659. [Google Scholar] [CrossRef]
- Lai, J.H.; Man, C.S. Developing a performance evaluation scheme for engineering facilities in commercial buildings: State-of-the-art review. Int. J. Strateg. Prop. Manag. 2017, 21, 41–57. [Google Scholar] [CrossRef] [Green Version]
- Vijayan, D.S.; Sivasuriyan, A.; Patchamuthu, P. Thermal performance of energy-efficient buildings for sustainable development. Environ. Sci. Pollut. Res. 2021, 1–13. [Google Scholar] [CrossRef] [PubMed]
- Heinzerling, D.; Schiavon, S.; Webster, T.; Arens, E. Indoor environmental quality assessment models: A literature review and a proposed weighting and classification scheme. Build. Environ. 2013, 70, 210–222. [Google Scholar] [CrossRef] [Green Version]
- Almeida, R.M.; Ramos, N.M.; De Freitas, V.P. Thermal comfort models and pupils’ perception in free-running school buildings of a mild climate country. Energy Build. 2016, 111, 64–75. [Google Scholar] [CrossRef]
- Barrett, P.; Davies, F.; Zhang, Y.; Barrett, L. The impact of classroom design on pupils’ learning: Final results of a holistic, multi-level analysis. Build. Environ. 2015, 89, 118–133. [Google Scholar] [CrossRef] [Green Version]
- Corgnati, S.P.; Filippi, M.; Viazzo, S. Perception of the thermal environment in high school and university classrooms: Subjective preferences and thermal comfort. Build. Environ. 2007, 42, 951–959. [Google Scholar] [CrossRef]
- Baloch, R.M.; Maesano, C.N.; Christoffersen, J.; Banerjee, S.; Gabriel, M.; Csobod, É.; de Oliveira Fernandes, E.; Annesi-Maesano, I.; Szuppinger, P.; Prokai, R. Indoor air pollution, physical and comfort parameters related to schoolchildren’s health: Data from the European SINPHONIE study. Sci. Total Environ. 2020, 739, 139870. [Google Scholar] [CrossRef]
- Chithra, V.; Nagendra, S.S. Indoor air quality investigations in a naturally ventilated school building located close to an urban roadway in Chennai, India. Build. Environ. 2012, 54, 159–167. [Google Scholar] [CrossRef]
- World Health Organization (WHO). Europe, School Environment: Policies and Current Status. 2015, p. 82. Available online: http://www.euro.who.int/en/health-topics/environment-and-health/air-quality/publications/2015/the-school-environment-policies-and-current-status (accessed on 30 October 2021).
- Mendell, M.J.; Heath, G.A. Do indoor pollutants and thermal conditions in schools influence student performance? A critical review of the literature. Indoor Air 2005, 15, 27–52. [Google Scholar] [CrossRef]
- Standard 55-2013; American Society of Heating, Refrigerating and Air-Conditioning Engineers (ASHRAE). Thermal Environmental Conditions for Human Occupancy: Atlanta, Georgia, 2013.
- UNE-CEN/TR 16798-2:2019; Energy Performance of Buildings—Ventilation for Buildings—Part 2: Interpretation of the Requirements in EN 16798-1—Indoor Environmental Input Parameters for Design and Assessment of Energy Performance of Buildings Addressing Indoor Air Quality, Thermal ENVIRONMENT, Lighting and Acoustics (Module M1-6). UNE: Armidale, Australia, 2019.
- Jowkar, M.; Rijal, H.B.; Montazami, A.; Brusey, J.; Temeljotov-Salaj, A. The influence of acclimatization, age and gender-related differences on thermal perception in university buildings: Case studies in Scotland and England. Build. Environ. 2020, 179, 106933. [Google Scholar] [CrossRef]
- Stazi, F.; Naspi, F.; Ulpiani, G.; Di Perna, C. Indoor air quality and thermal comfort optimization in classrooms developing an automatic system for windows opening and closing. Energy Build. 2017, 139, 732–746. [Google Scholar] [CrossRef]
- Duarte, R.; da Glória Gomes, M.; Rodrigues, A.M. Classroom ventilation with manual opening of windows: Findings from a two-year-long experimental study of a Portuguese secondary school. Build. Environ. 2017, 124, 118–129. [Google Scholar] [CrossRef] [Green Version]
- Heracleous, C.; Michael, A. Experimental assessment of the impact of natural ventilation on indoor air quality and thermal comfort conditions of educational buildings in the Eastern Mediterranean region during the heating period. J. Build. Eng. 2019, 26, 100917. [Google Scholar] [CrossRef]
- Papadopoulos, G.; Tolis, E.I.; Panaras, G. IEQ assessment in free-running university classrooms. Sci. Technol. Built Environ. 2022, 1–20. [Google Scholar] [CrossRef]
- Korsavi, S.S.; Montazami, A.; Mumovic, D. Ventilation rates in naturally ventilated primary schools in the UK; Contextual, Occupant and Building-related (COB) factors. Build. Environ. 2020, 181, 107061. [Google Scholar] [CrossRef]
- Korsavi, S.S.; Montazami, A.; Mumovic, D. Indoor air quality (IAQ) in naturally-ventilated primary schools in the UK: Occupant-related factors. Build. Environ. 2020, 180, 106992. [Google Scholar] [CrossRef]
- Kim, J.; de Dear, R. Thermal comfort expectations and adaptive behavioural characteristics of primary and secondary school students. Build. Environ. 2018, 127, 13–22. [Google Scholar] [CrossRef]
- Hamzah, B.; Gou, Z.; Mulyadi, R.; Amin, S. Thermal comfort analyses of secondary school students in the tropics. Buildings 2018, 8, 56. [Google Scholar] [CrossRef] [Green Version]
- Liu, Y.; Jiang, J.; Wang, D.; Liu, J. The indoor thermal environment of rural school classrooms in Northwestern China. Indoor Built Environ. 2017, 26, 662–679. [Google Scholar] [CrossRef]
- Singh, M.K.; Ooka, R.; Rijal, H.B.; Kumar, S.; Kumar, A.; Mahapatra, S. Progress in thermal comfort studies in classrooms over last 50 years and way forward. Energy Build. 2019, 188, 149–174. [Google Scholar] [CrossRef]
- Jing, S.; Lei, Y.; Wang, H.; Song, C.; Yan, X. Thermal comfort and energy-saving potential in university classrooms during the heating season. Energy Build. 2019, 202, 109390. [Google Scholar] [CrossRef]
- Ozarisoy, B.; Altan, H. Regression forecasting of ‘neutral’adaptive thermal comfort: A field study investigation in the south-eastern Mediterranean climate of Cyprus. Build. Environ. 2021, 202, 108013. [Google Scholar] [CrossRef]
- REHVA, COVID19 Guidance. How to Operate HVAC and Other Building Service Systems to Prevent the Spread of the Coronavirus (SARS-CoV-2) Disease (COVID-19) in Workplaces Version 4.1. Available online: https://www.rehva.eu/fileadmin/user_upload/REHVA_COVID-19_guidance_document_V4.1_15042021.pdf (accessed on 20 May 2022).
- Ministry of Health of the Spanish Government. Evaluación del Riesgo de la Transmisión de SARS-CoV-2 Mediante Aerosoles. Medidas de Prevención y Recomendaciones. Ministerio de Sanidad. Gobierno de España. Available online: https://www.sanidad.gob.es/profesionales/saludPublica/ccayes/alertasActual/nCov/documentos/COVID19_Aerosoles.pdf. (accessed on 2 March 2022).
- Aguilar, A.J.; María, L.; Costa, N.; Arezes, P.; Martínez-Aires, M.D.; Ruiz, D.P. Assessment of ventilation rates inside educational buildings in Southwestern Europe: Analysis of implemented strategic measures. J. Build. Eng. 2022, 51, 104204. [Google Scholar] [CrossRef]
- de la Hoz-Torres, M.L.; Aguilar, A.J.; Ruiz, D.P.; Martínez-Aires, M.D. Analysis of Impact of Natural Ventilation Strategies in Ventilation Rates and Indoor Environmental Acoustics Using Sensor Measurement Data in Educational Buildings. Sensors 2021, 21, 6122. [Google Scholar] [CrossRef]
- Villanueva, F.; Notario, A.; Cabañas, B.; Martín, P.; Salgado, S.; Gabriel, M.F. Assessment of CO2 and aerosol (PM2.5, PM10, UFP) concentrations during the reopening of schools in the COVID-19 pandemic: The case of a metropolitan area in Central-Southern Spain. Environ. Res. 2021, 197, 111092. [Google Scholar] [CrossRef]
- Miranda, M.; Romero, P.; Valero-Amaro, V.; Arranz, J.; Montero, I. Ventilation conditions and their influence on thermal comfort in examination classrooms in times of COVID-19. A case study in a Spanish area with Mediterranean climate. Int. J. Hyg. Environ. Health 2022, 240, 113910. [Google Scholar] [CrossRef]
- Nicol, F.; Humphreys, M.; Roaf, S. Adaptive Thermal Comfort: Principles and Practice; Routledge: London, UK, 2012. [Google Scholar]
- Jowkar, M.; Montazami, A. Thermal Comfort in the UK Higher Educational Buildings: The Influence of Thermal History on Students’ Thermal Comfort. In Proceedings of the Windsor Conference, Rethinking Comfort, Windsor, UK, 12–15 April 2018; pp. 12–15. [Google Scholar]
- Enescu, D. A review of thermal comfort models and indicators for indoor environments. Renew. Sustain. Energy Rev. 2017, 79, 1353–1379. [Google Scholar] [CrossRef]
- State Meteorological Agency (AEMET). Available online: http://www.aemet.es (accessed on 25 May 2022).
- University of Granada (UGR). Annex Statistical Data UGR 2021. 2021. Available online: https://secretariageneral.ugr.es/pages/memorias/academica/20202021/estadistica/_doc/01/%21 (accessed on 26 May 2022).
- ISO 7730:2005; Ergonomics of the Thermal Environment—Analytical Determination and Interpretation of Thermal Comfort using Calculation of the PMV and PPD Indices and Local Thermal Comfort Criteria. International Organisation for Standardization: Geneva, Switzerland, 2005; p. 7730.
- Schiavon, S.; Lee, K.H. Dynamic predictive clothing insulation models based on outdoor air and indoor operative temperatures. Build. Environ. 2013, 59, 250–260. [Google Scholar] [CrossRef] [Green Version]
- Ministry of Industry, Energy and Tourism. Reglamento de Instalaciones Termicas En Los Edificios. Versión Consolidada. 2013. Available online: https://energia.gob.es/desarrollo/EficienciaEnergetica/RITE/Reglamento/RDecreto-1027-2007-Consolidado-9092013.pdf (accessed on 20 May 2022).
- Monge-Barrio, A.; Bes-Rastrollo, M.; Dorregaray-Oyaregui, S.; González-Martínez, P.; Martin-Calvo, N.; López-Hernández, D.; Arriazu-Ramos, A.; Sánchez-Ostiz, A. Encouraging natural ventilation to improve indoor environmental conditions at schools. Case studies in the north of Spain before and during COVID. Energy Build. 2022, 254, 111567. [Google Scholar] [CrossRef]
- Huang, B.; Hong, B.; Tian, Y.; Yuan, T.; Su, M. Outdoor thermal benchmarks and thermal safety for children: A study in China’s cold region. Sci. Total Environ. 2021, 787, 147603. [Google Scholar] [CrossRef]


| Building | Finishing Materials | Type of Windows | Average Area (m2) | No. of Surveyed Rooms | Ave. Occupancy Ratio (m2/person) |
|---|---|---|---|---|---|
| 1 | Wall: Gypsum plaster | Aluminium glazed windows (tilt and turn) | 144 ± 44 | 6 | 2.0 ± 0.6 |
| Floor: Terrazzo | |||||
| Ceiling: Registrable suspended ceiling | |||||
| 2 | Wall: Gypsum plaster | Aluminium glazed windows (sliding) | 173 ± 53 | 8 | 1.7 ± 0.9 |
| Floor: Terrazzo | |||||
| Ceiling: Registrable suspended ceiling | |||||
| 3 | Wall: Gypsum plaster | Aluminium glazed windows (tilt and turn) | 92 ± 12 | 10 | 1.2 ± 0.2 |
| Floor: Terrazzo | |||||
| Ceiling: Registrable suspended ceiling |
| Sensor | Model | Parameter | Range | Accuracy |
|---|---|---|---|---|
| CO2 analyser HOBO® | MX1102 | CO2 concentration | 0 to 5.000 ppm | ±50 ppm ±5% reading accuracy |
| AHLBORN air temperature sensor | FHAD 46-C41A | Air temperature meter | −20 to +80 °C | Typical ±0.2 K at 5 to 60 °C maximum ±0.4 K at 5 to 60 °C maximum ±0.7 K at −20 to +80 °C |
| AHLBORN RH sensor | FHAD 46-C41A | RH | 0 to 98% RH | ±2.0% RH in the range 10–90% RH ±4.0% RH in the range 5–98% RH |
| Delta OHM hotwire air speed transmitter | HD403TS2 | Air speed | 0.1–5 m/s | ±0.2 m/s + 3% f.s. |
| AHLBORN black ball thermometer | FPA805GTS | Mean radiant temperature | −50 to 200 °C | 0.1 °C |
| Index | Level | Scale |
|---|---|---|
| TSaV | Very dissatisfied, dissatisfied, slightly dissatisfied, neutral, slightly satisfied, satisfied, very satisfied | (−3), (−2), (−1), (0), (1), (2), (3) |
| TSV | Cold, cool, slightly cool, neutral, slightly warm, warm, hot | (−3), (−2), (−1), (0), (1), (2), (3) |
| TIP | Interfere a lot, interfere, slightly interfere, neutral, slightly enhance, enhance, enhance a lot | (−3), (−2), (−1), (0), (1), (2), (3) |
| Type | Outdoor | Indoor | |||||
|---|---|---|---|---|---|---|---|
| Air Temperature (°C) | RH (%) | Air Velocity (m/s) | Operative Temperature (Top) (°C) | RH (%) | Air Velocity (m/s) | CO2 Concentration (ppm) | |
| Average | 13.1 | 58.4 | 5.07 | 20.6 | 37.9 | 0.03 | 566.4 |
| STD * | 7.5 | 21.2 | 5.48 | 3.9 | 7.3 | 0.04 | 118.2 |
| Max | 30.4 | 94.0 | 23.00 | 28.2 | 50.1 | 0.19 | 897.3 |
| Min | 2.1 | 16.0 | <0.01 | 14.6 | 19.6 | <0.01 | 410.0 |
| Variable | Number of Respondents, N (%) | |
|---|---|---|
| Gender | Male | 539 (54%) |
| Female | 450 (46%) | |
| Age | n/a | 31 (3%) |
| 18–24 | 829 (84%) | |
| 25–30 | 107 (11%) | |
| +30 | 22 (2%) | |
| Type of mask | FFP2 | 163 (16%) |
| Surgical | 742 (75%) | |
| Cloth | 60 (6%) | |
| n/a | 24 (2%) | |
| Fitting | p-Value | R2 | |
|---|---|---|---|
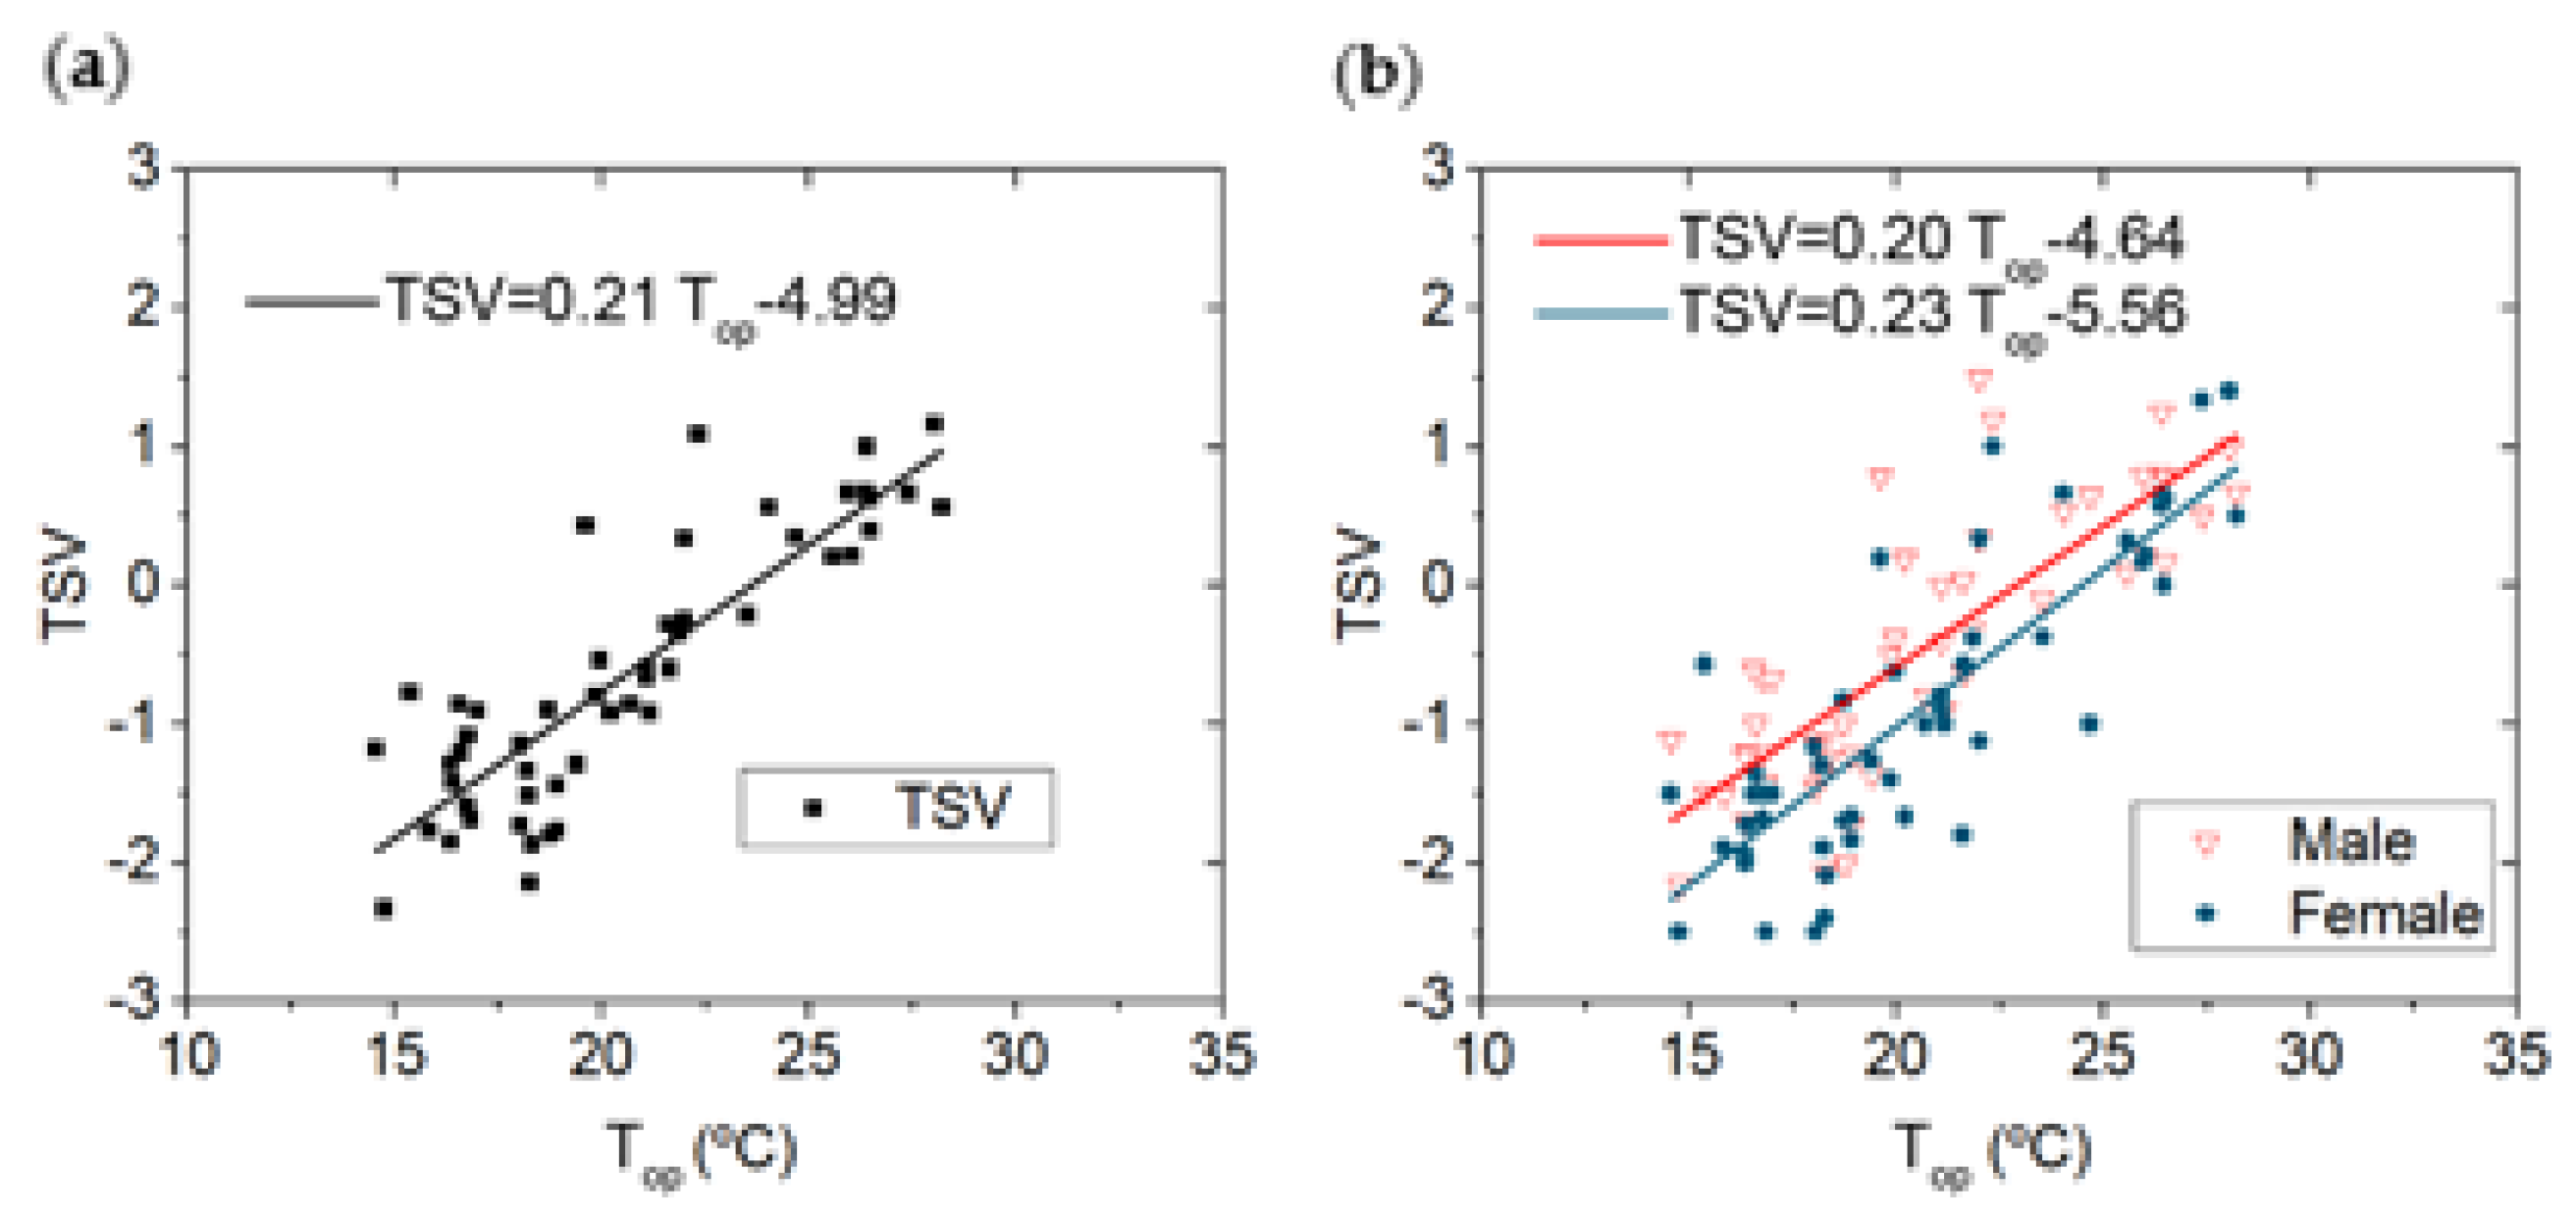
| Total | TSV = 0.21 top − 4.99 | p < 0.001 | 0.74 |
| Male | TSV = 0.20 top − 4.64 | p < 0.001 | 0.65 |
| Female | TSV = 0.23 top − 5.56 | p < 0.001 | 0.68 |
| Variables | Fitting | p-Value | R2 |
|---|---|---|---|
| CO2 concentration/total open area (m2) | CO2 = 599.3 e−0.57x + 499.5 | p < 0.001 | 0.42 |
| CO2 concentration (ppm)/occupation (m2/student) | CO2 = 1894.6 e−0.90x +526.9 | p < 0.001 | 0.40 |
Publisher’s Note: MDPI stays neutral with regard to jurisdictional claims in published maps and institutional affiliations. |
© 2022 by the authors. Licensee MDPI, Basel, Switzerland. This article is an open access article distributed under the terms and conditions of the Creative Commons Attribution (CC BY) license (https://creativecommons.org/licenses/by/4.0/).
Share and Cite
Aguilar, A.J.; de la Hoz-Torres, M.L.; Martínez-Aires, M.D.; Ruiz, D.P. Thermal Perception in Naturally Ventilated University Buildings in Spain during the Cold Season. Buildings 2022, 12, 890. https://doi.org/10.3390/buildings12070890
Aguilar AJ, de la Hoz-Torres ML, Martínez-Aires MD, Ruiz DP. Thermal Perception in Naturally Ventilated University Buildings in Spain during the Cold Season. Buildings. 2022; 12(7):890. https://doi.org/10.3390/buildings12070890
Chicago/Turabian StyleAguilar, Antonio J., María L. de la Hoz-Torres, María Dolores Martínez-Aires, and Diego P. Ruiz. 2022. "Thermal Perception in Naturally Ventilated University Buildings in Spain during the Cold Season" Buildings 12, no. 7: 890. https://doi.org/10.3390/buildings12070890
APA StyleAguilar, A. J., de la Hoz-Torres, M. L., Martínez-Aires, M. D., & Ruiz, D. P. (2022). Thermal Perception in Naturally Ventilated University Buildings in Spain during the Cold Season. Buildings, 12(7), 890. https://doi.org/10.3390/buildings12070890