
Characteristics, Progress and Trends of Urban Microclimate Research: A Systematic Literature Review and Bibliometric Analysis


Abstract
:1. Introduction
2. Data and Methods
3. Results
3.1. Current Status of Urban Microclimate Research
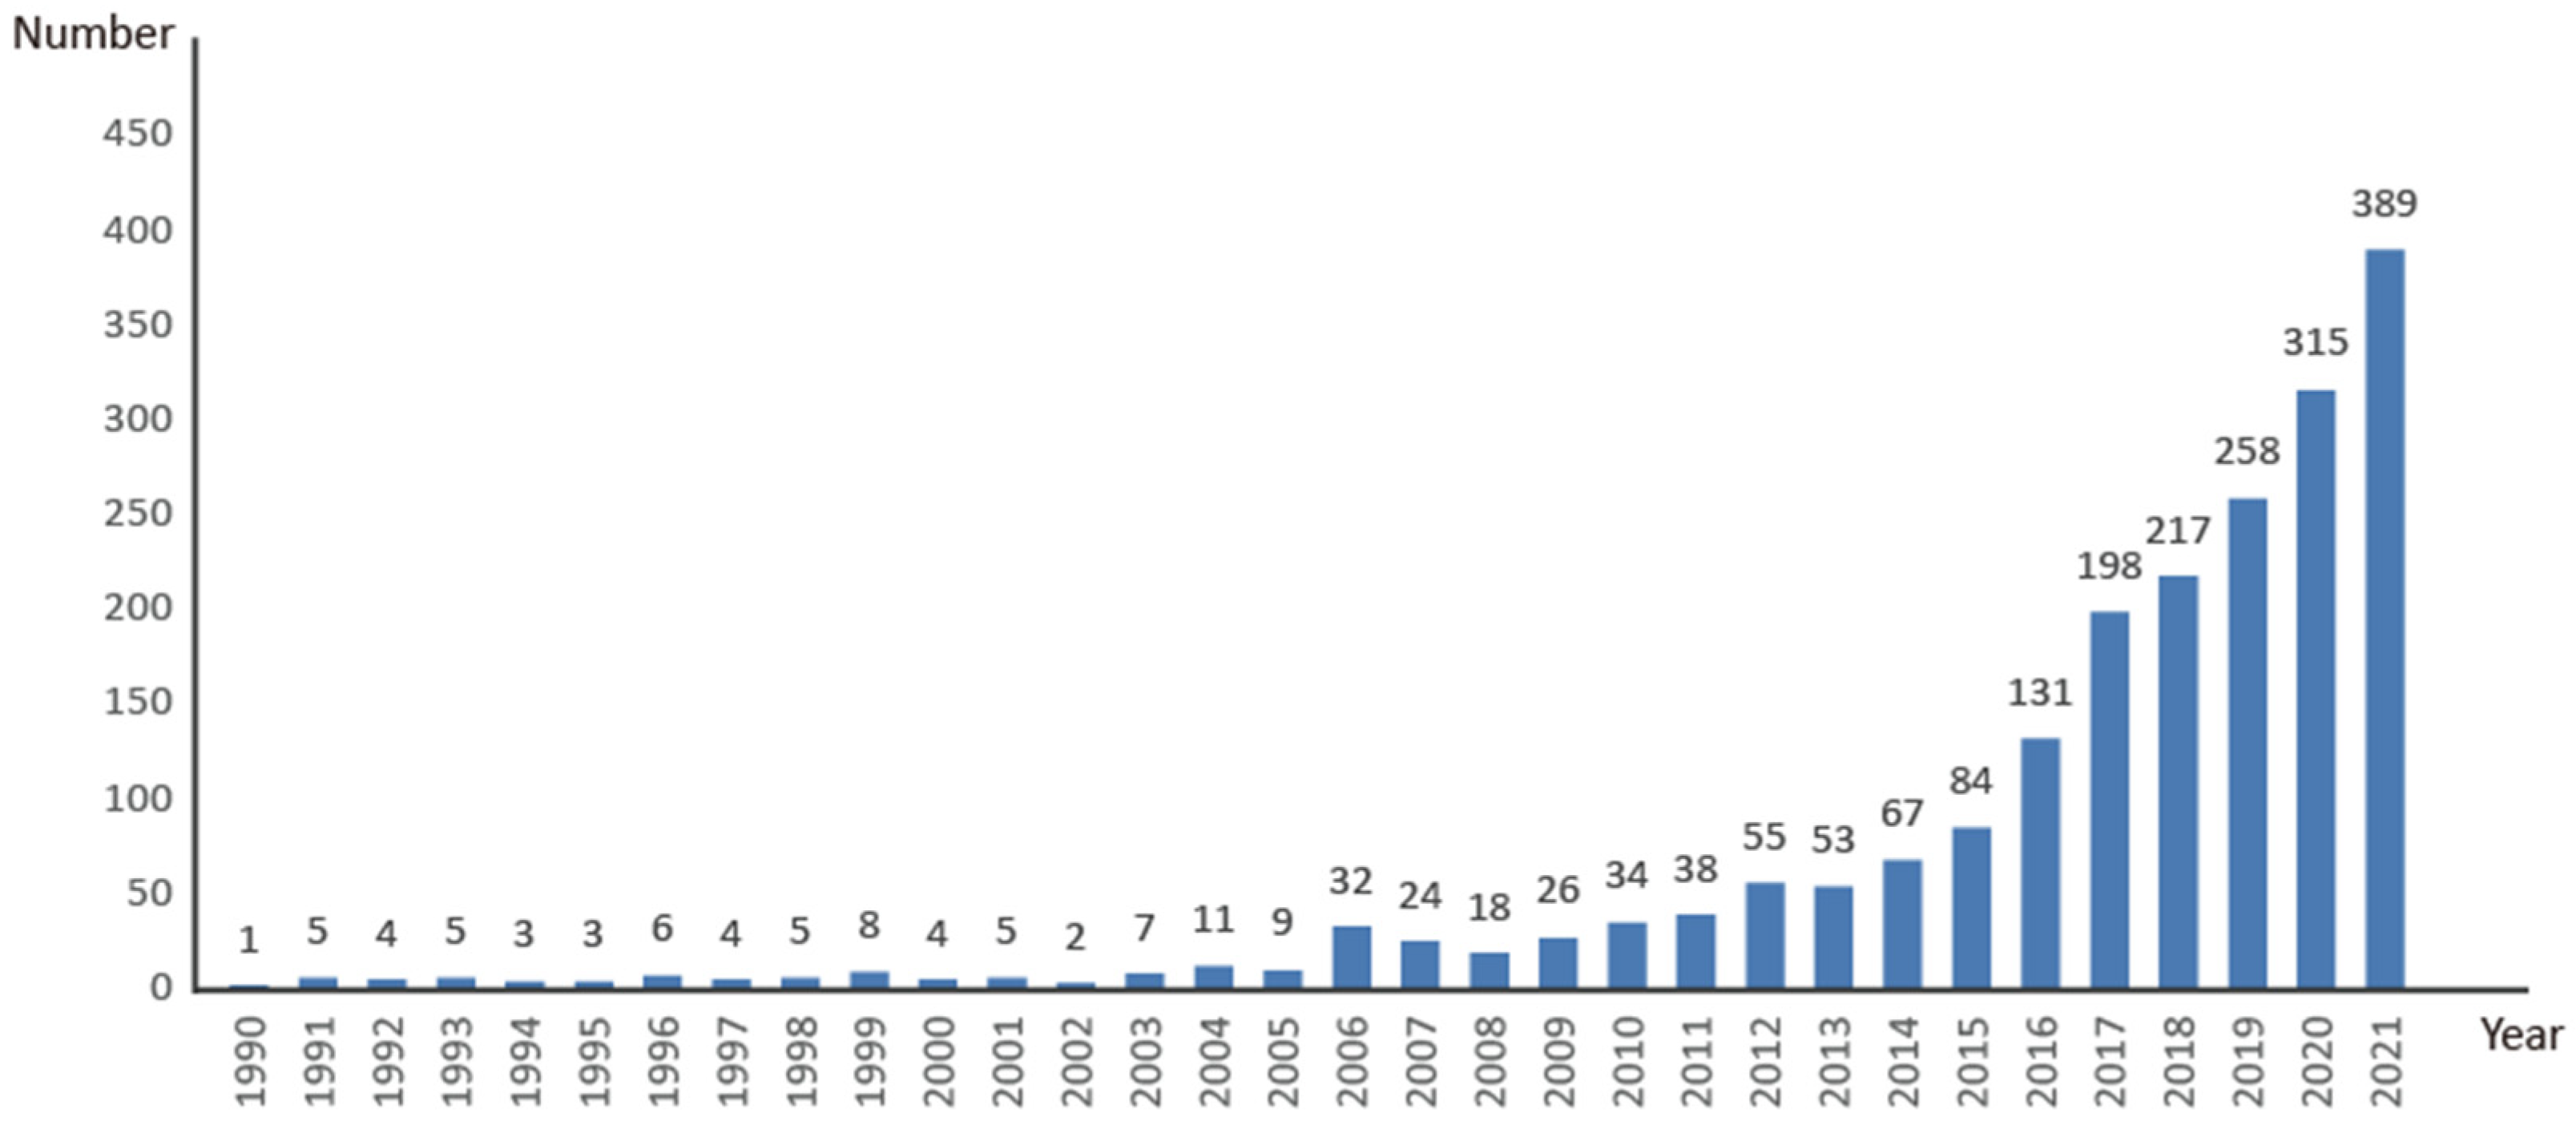
3.1.1. Research Scale and Impact Analysis
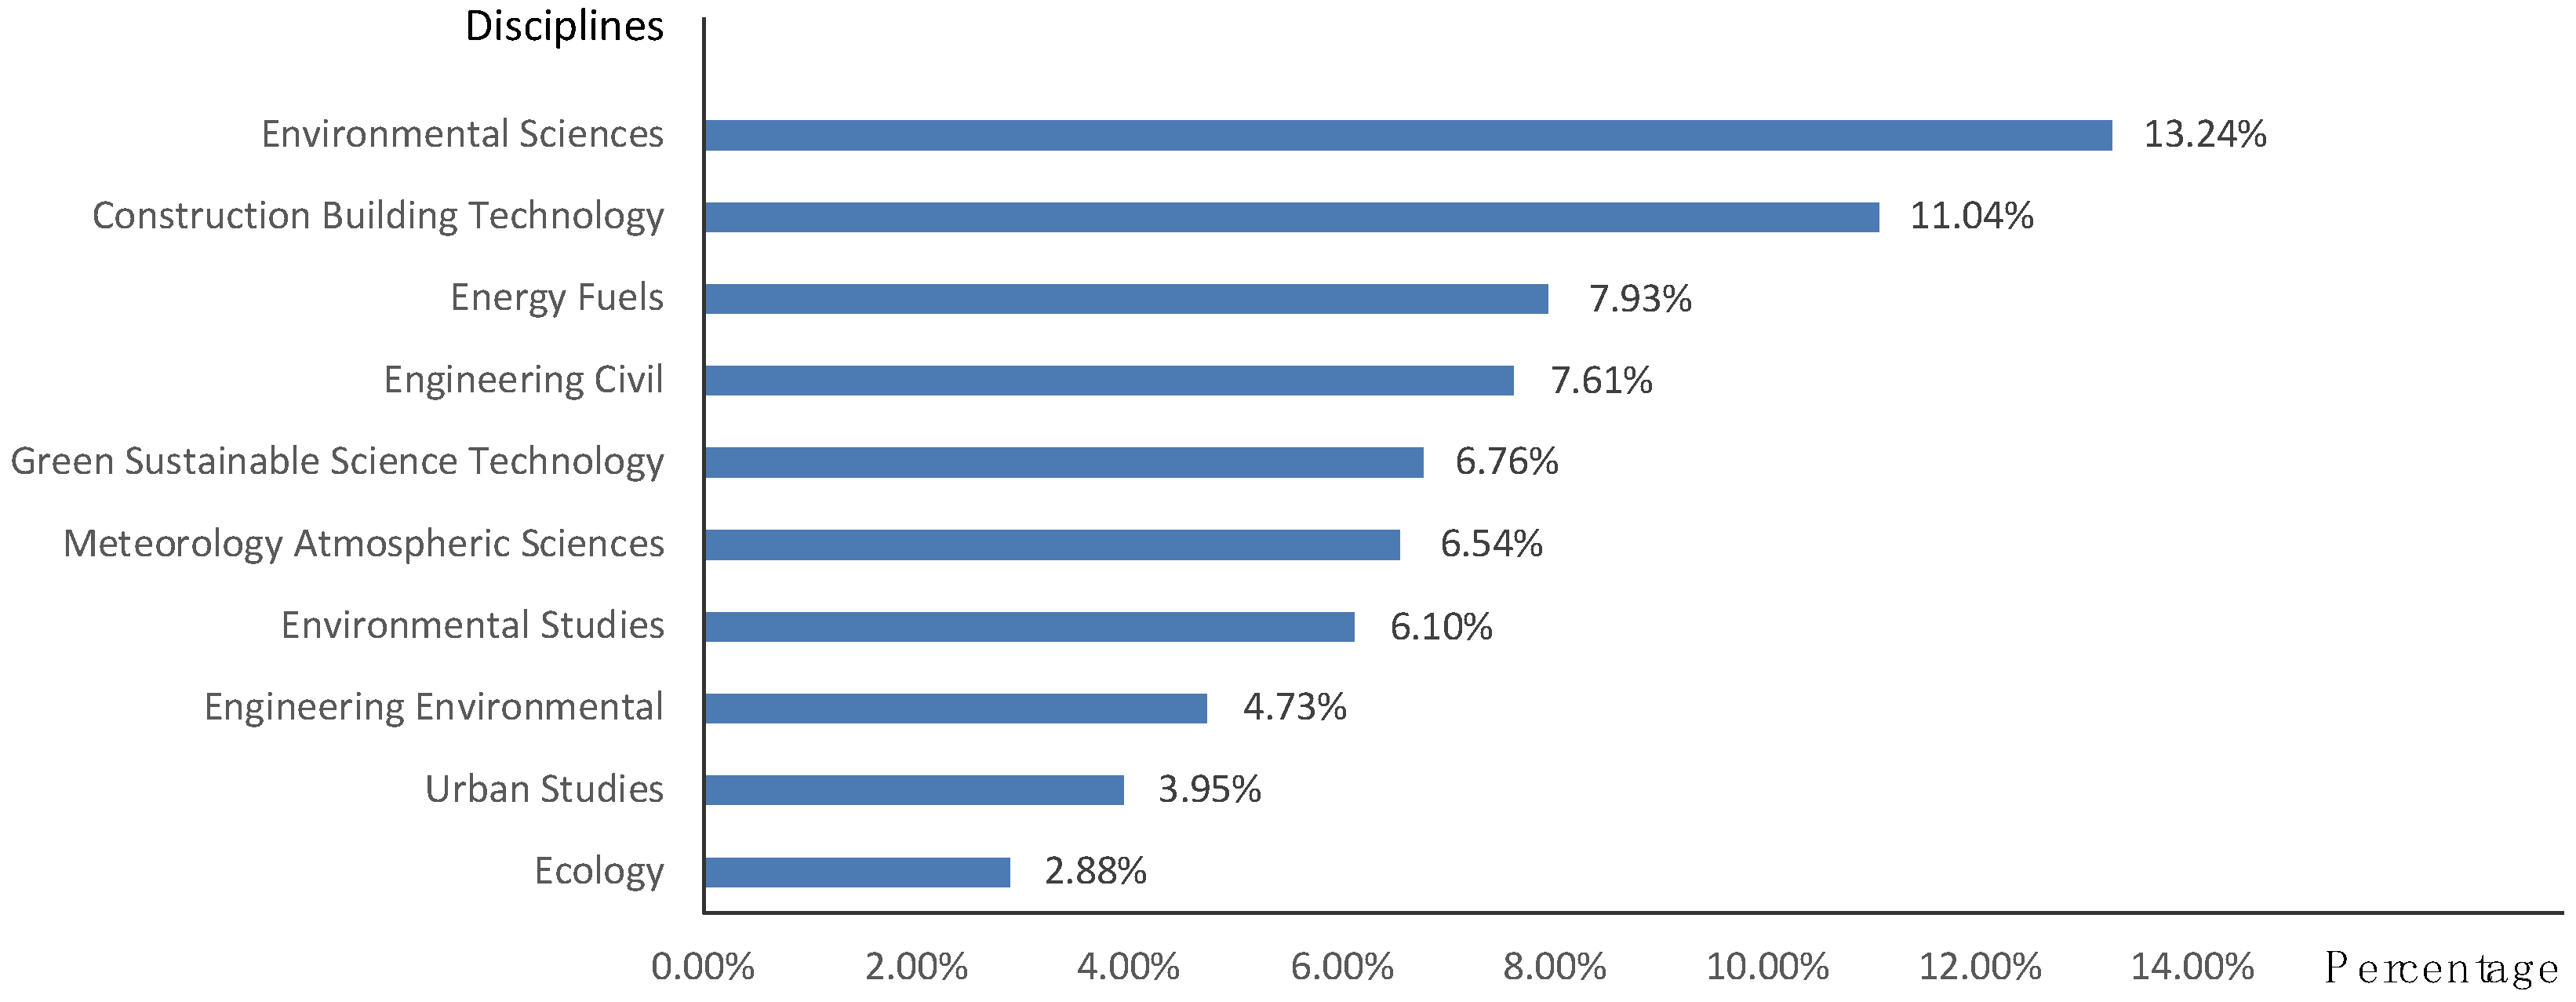
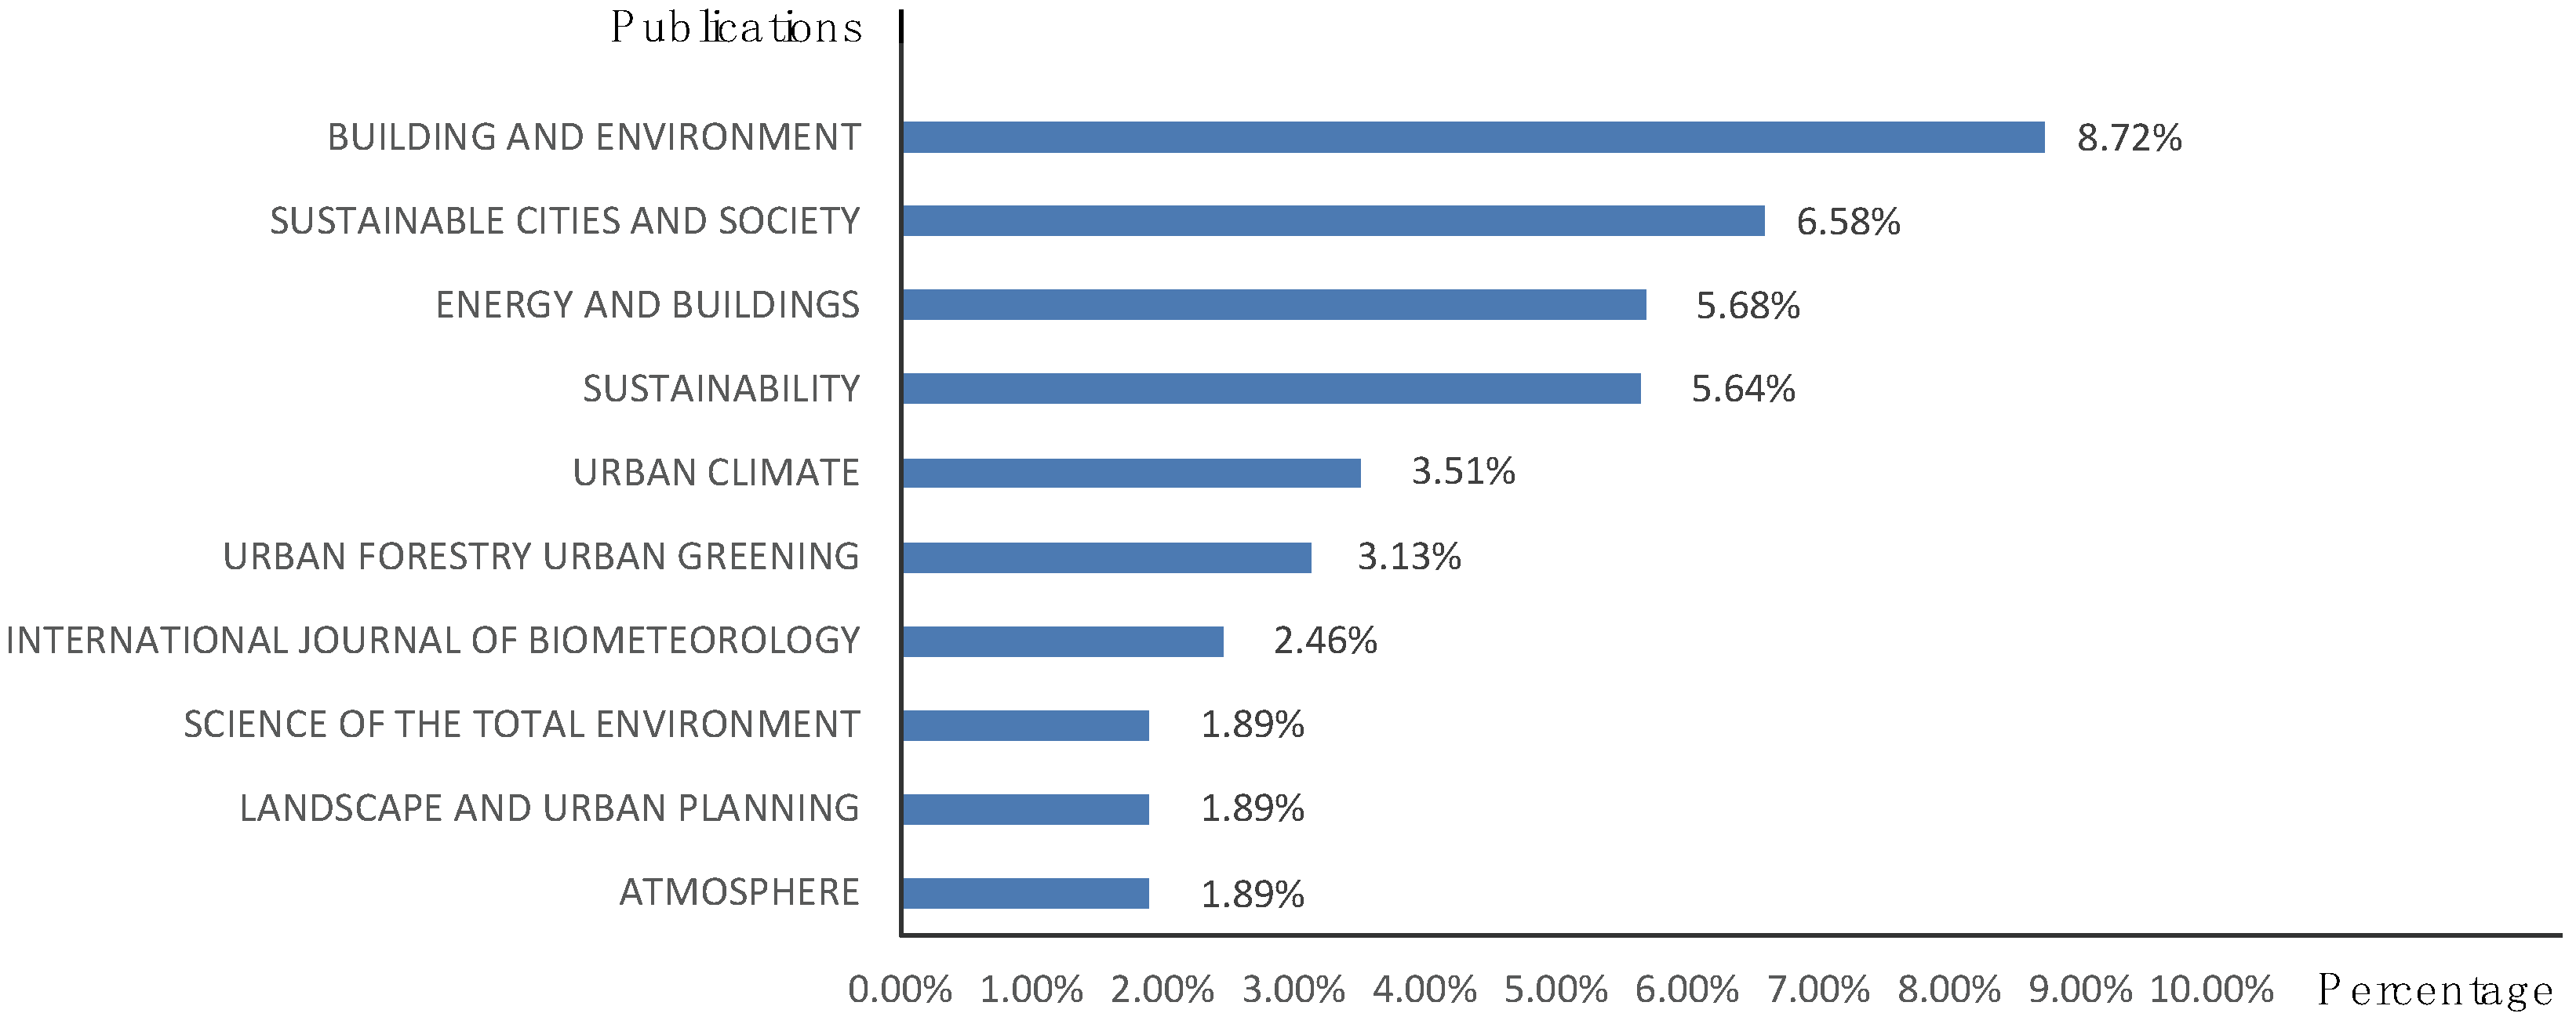
3.1.2. Interdisciplinary and Publication Analysis
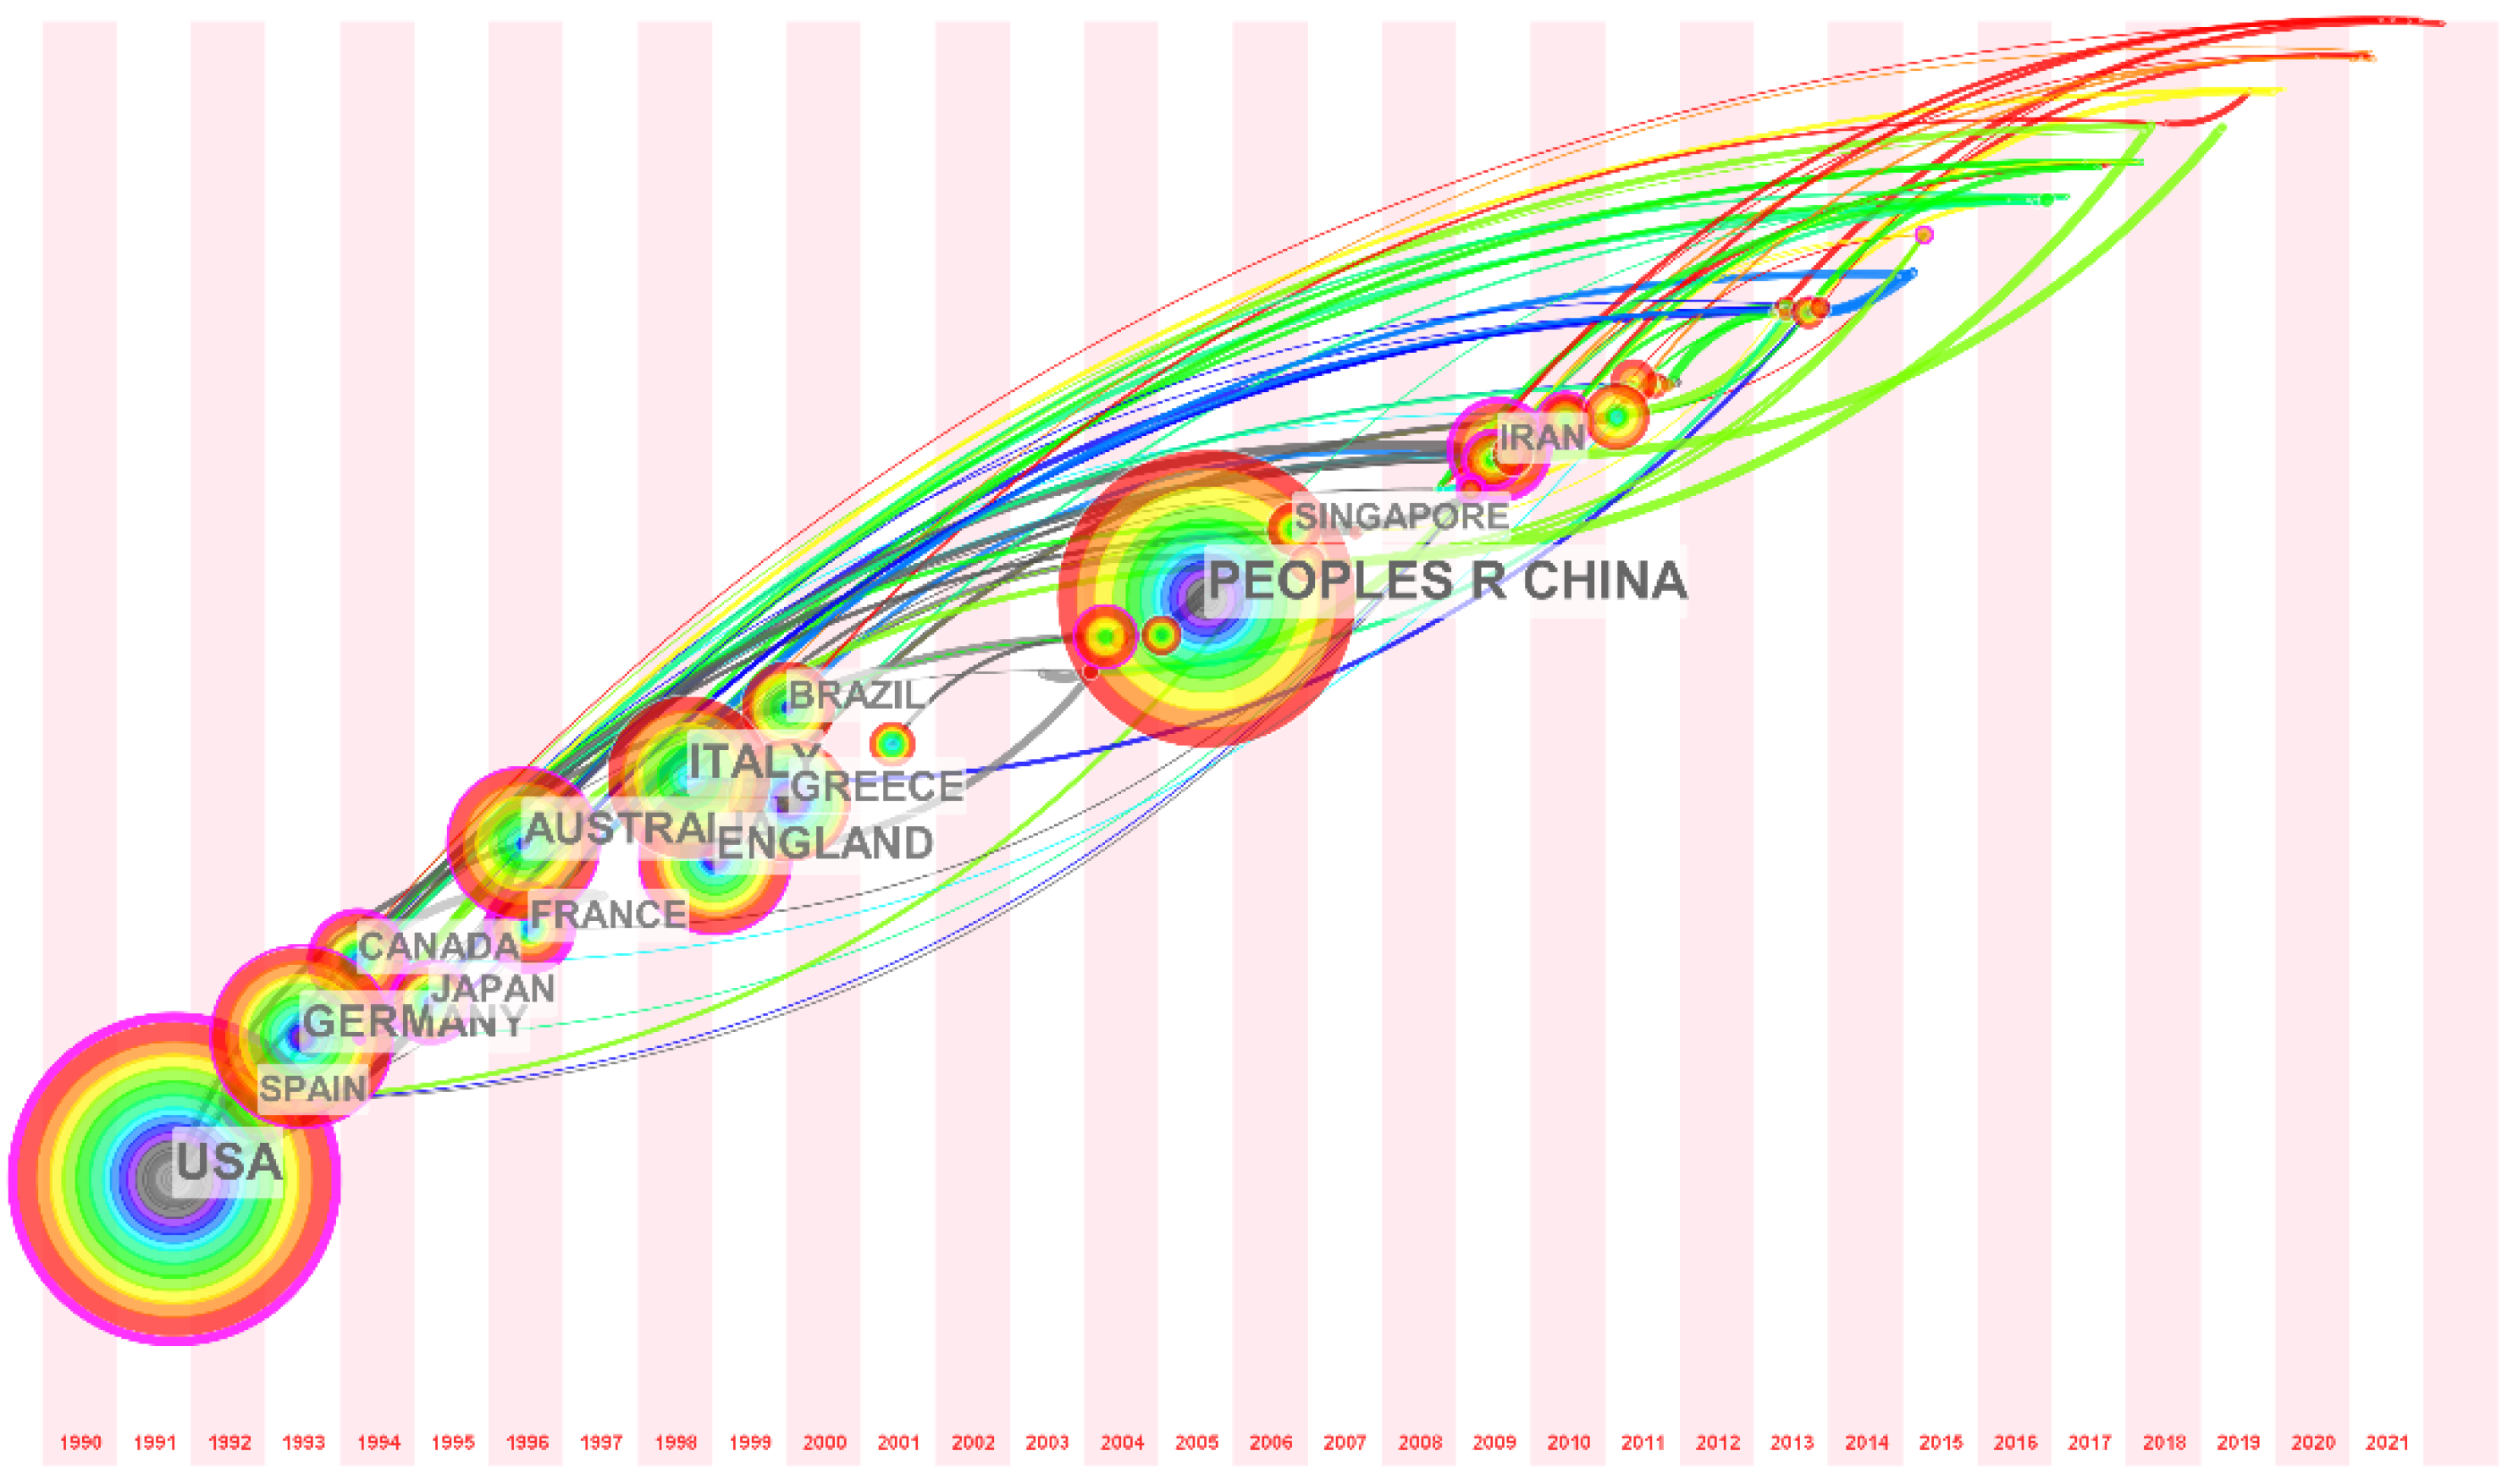
3.1.3. Country Distribution Analysis
3.2. Development Stages of Urban Microclimate Research
3.2.1. The Nascent Exploratory Phase (1990–1997): The Rise of Multidisciplinary and Urban Studies
3.2.2. Model Quantification Phase (1998–2005): Application of Numerical Quantification and Model Evaluation
3.2.3. Diversified Development Phase (2006–2015): System Maturity and Expansion of Research Breadth
3.2.4. Eco-Synergy Phase (2016 to Date): Focus on Eco-Synergy with Multiple Types of Elements
4. Hot Spots and Trends in Urban Microclimate Research
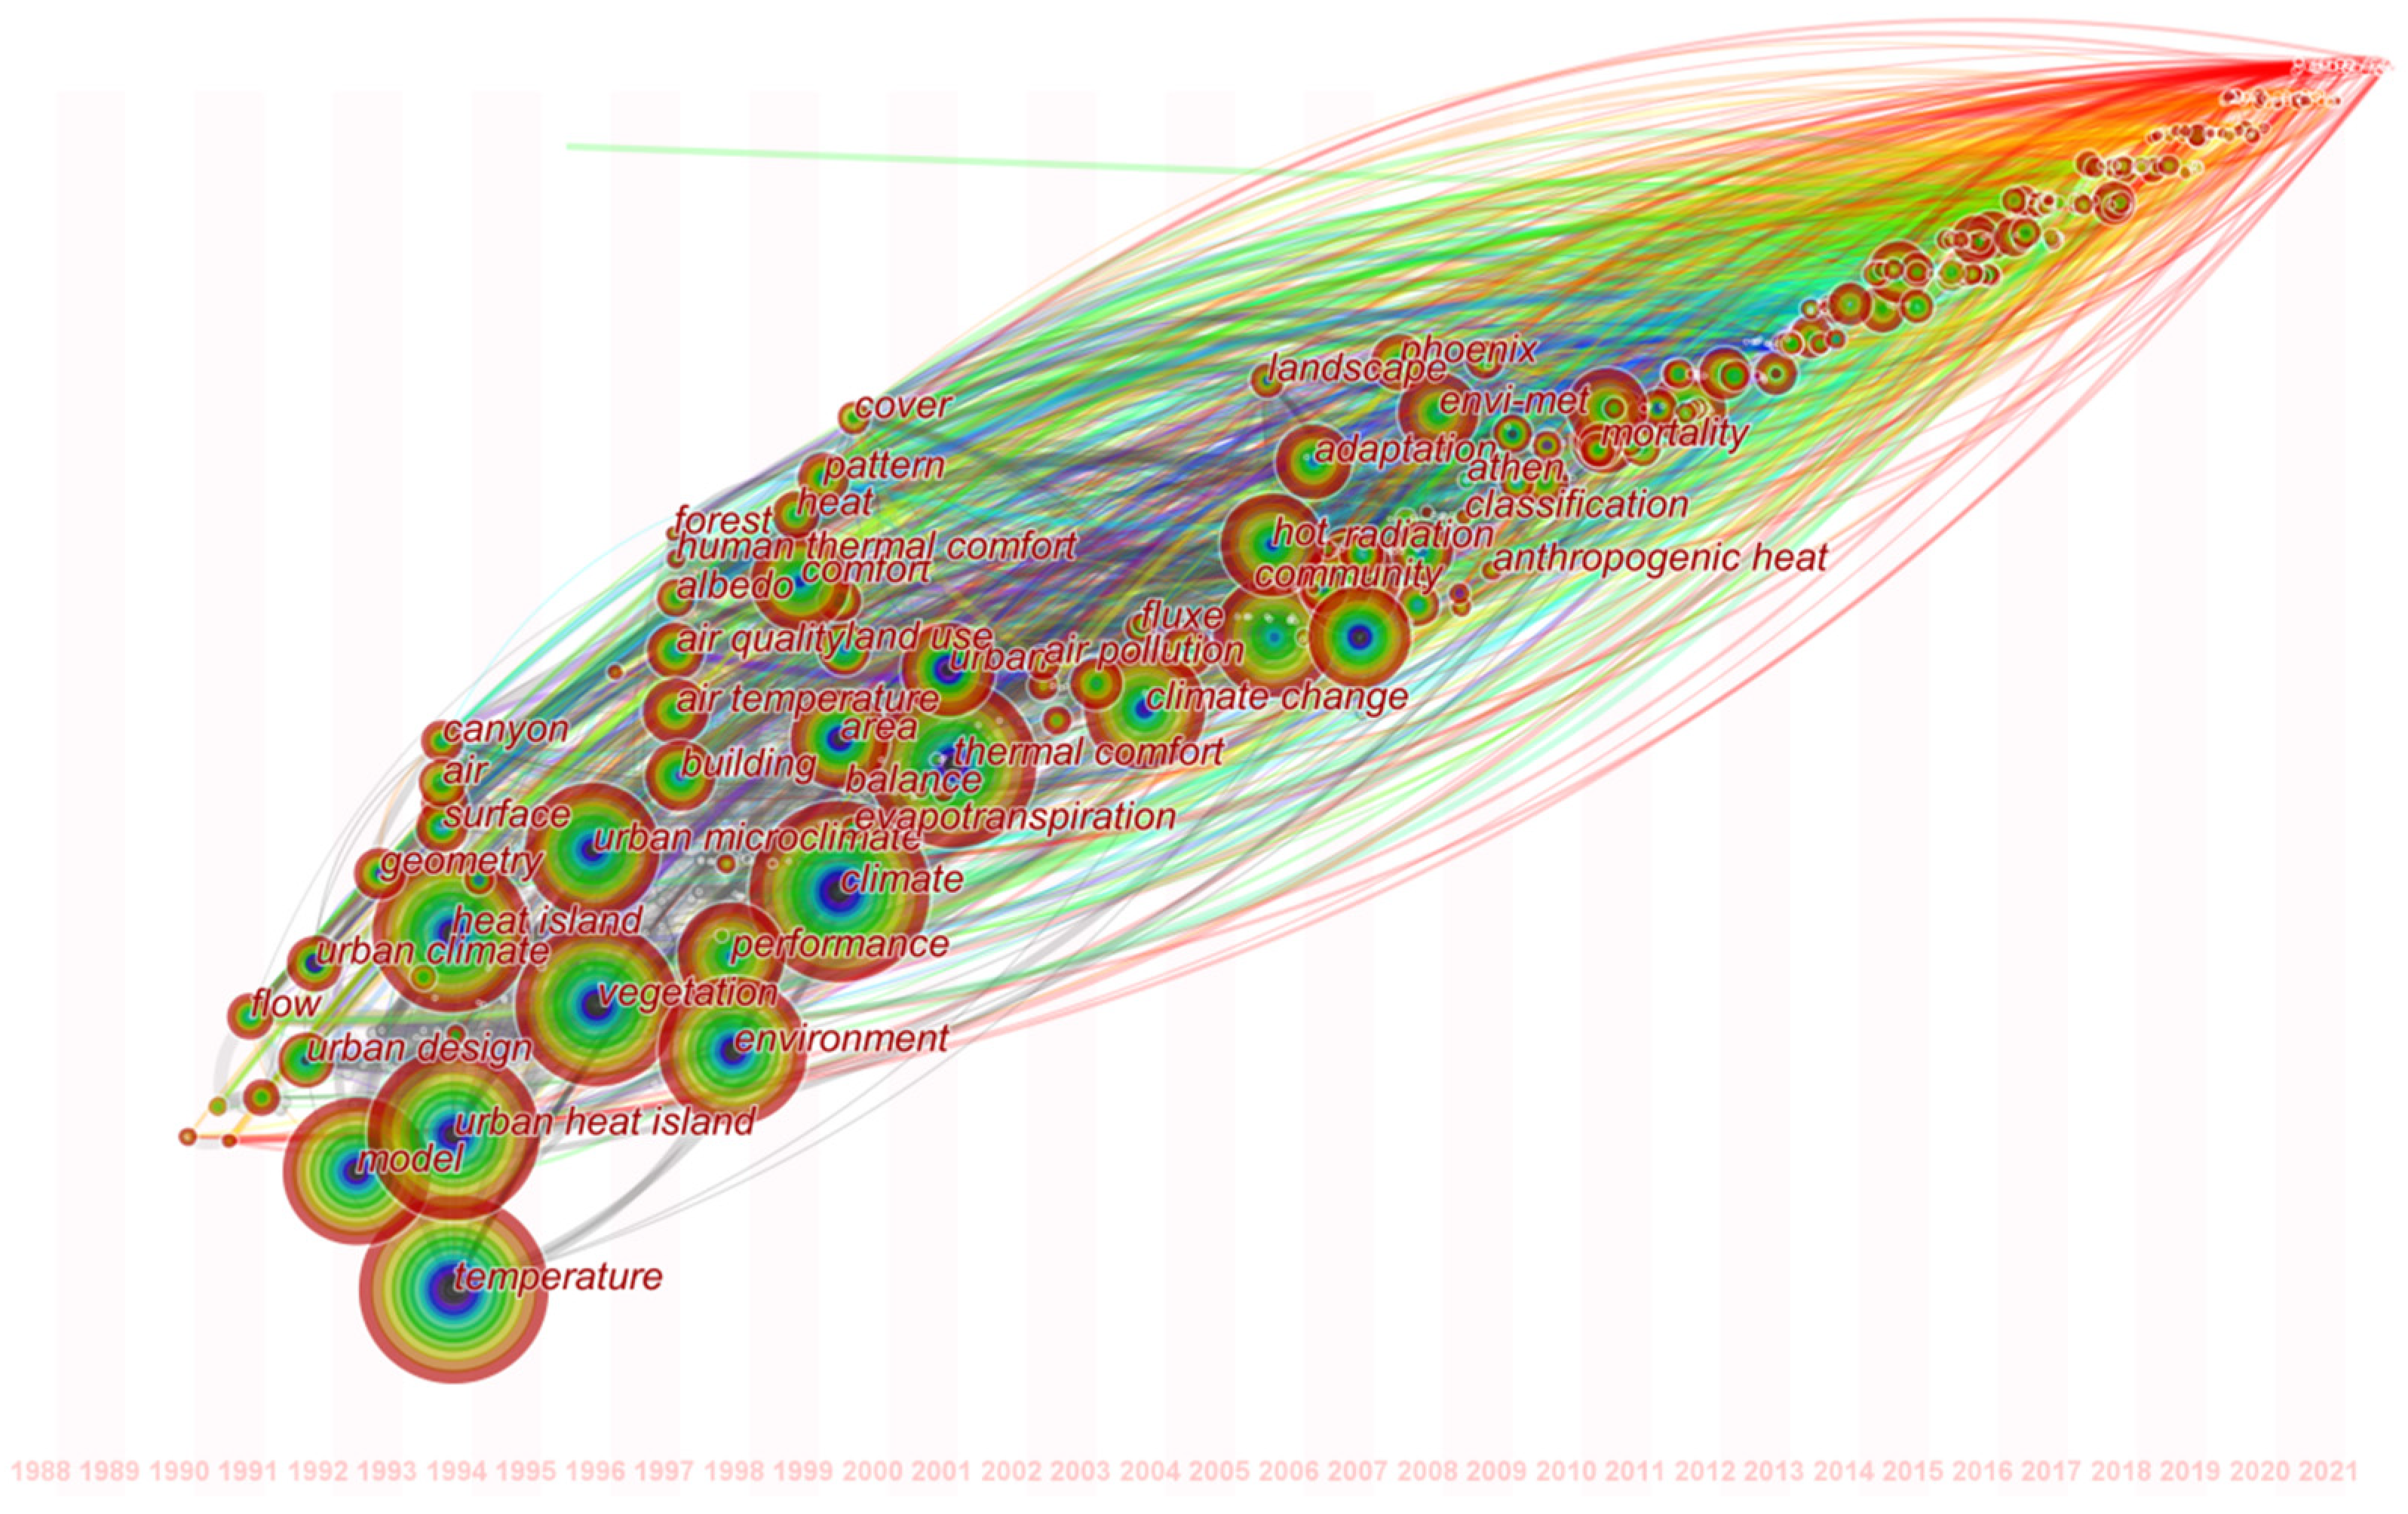
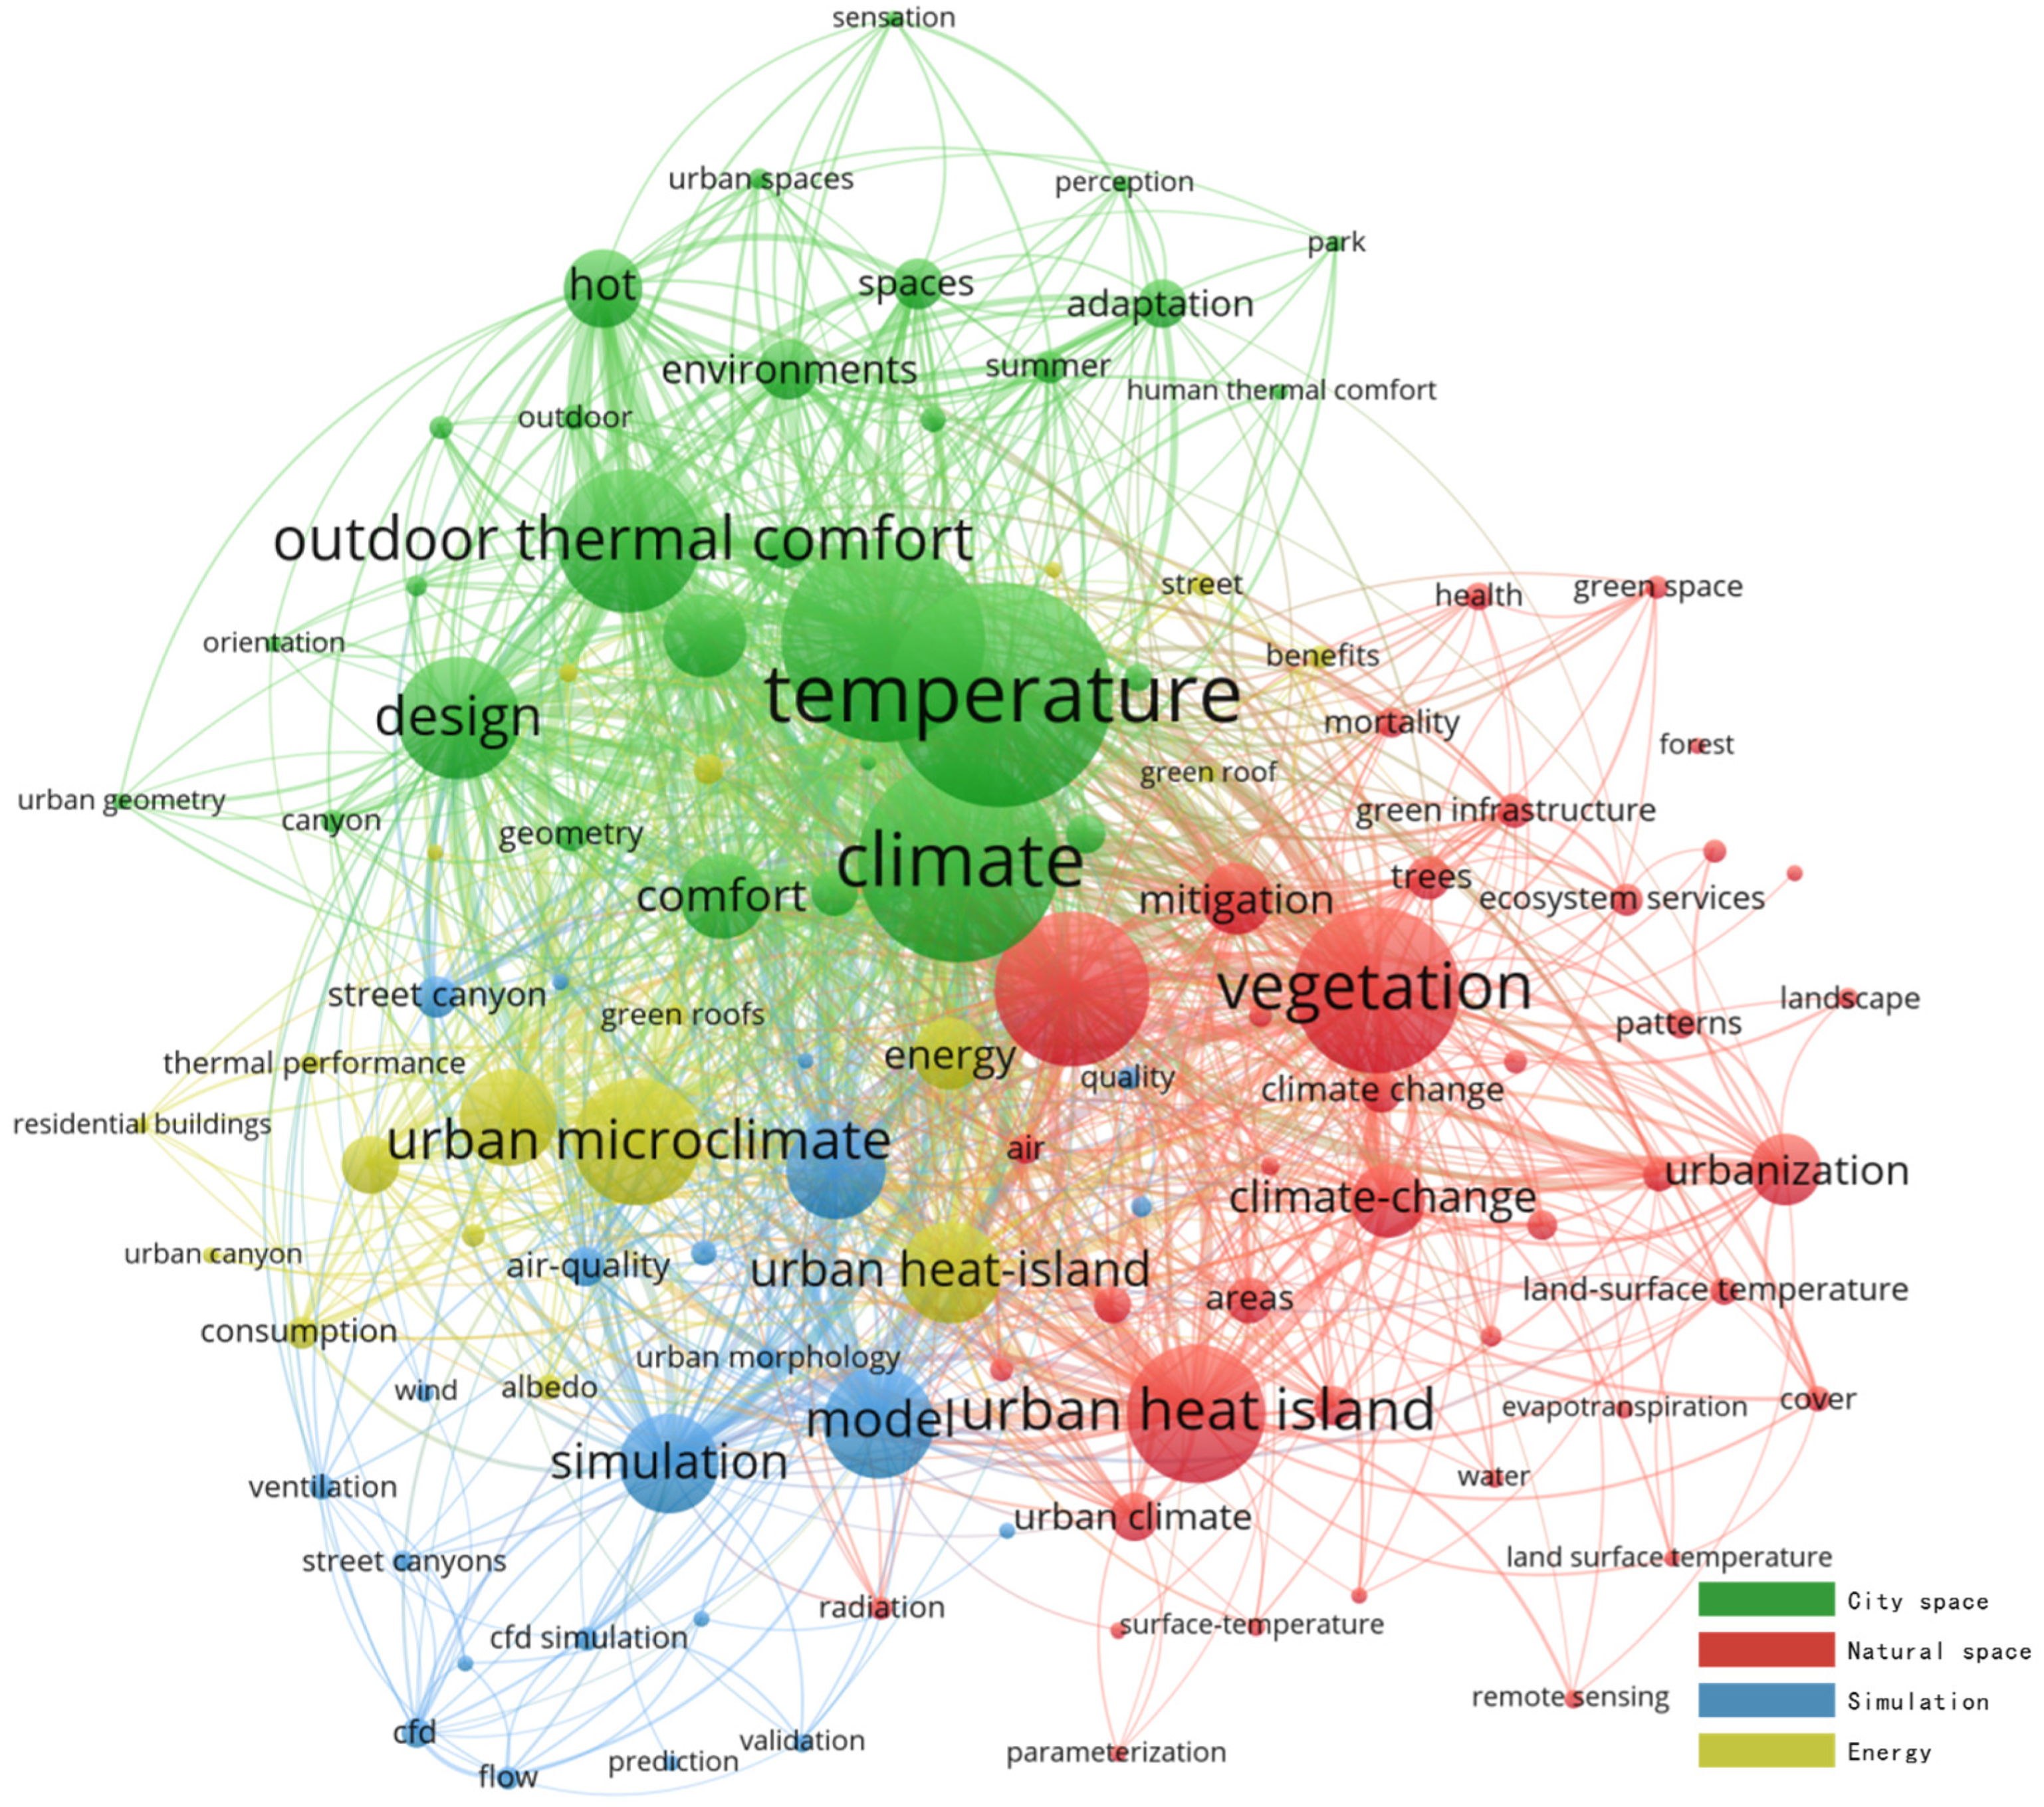
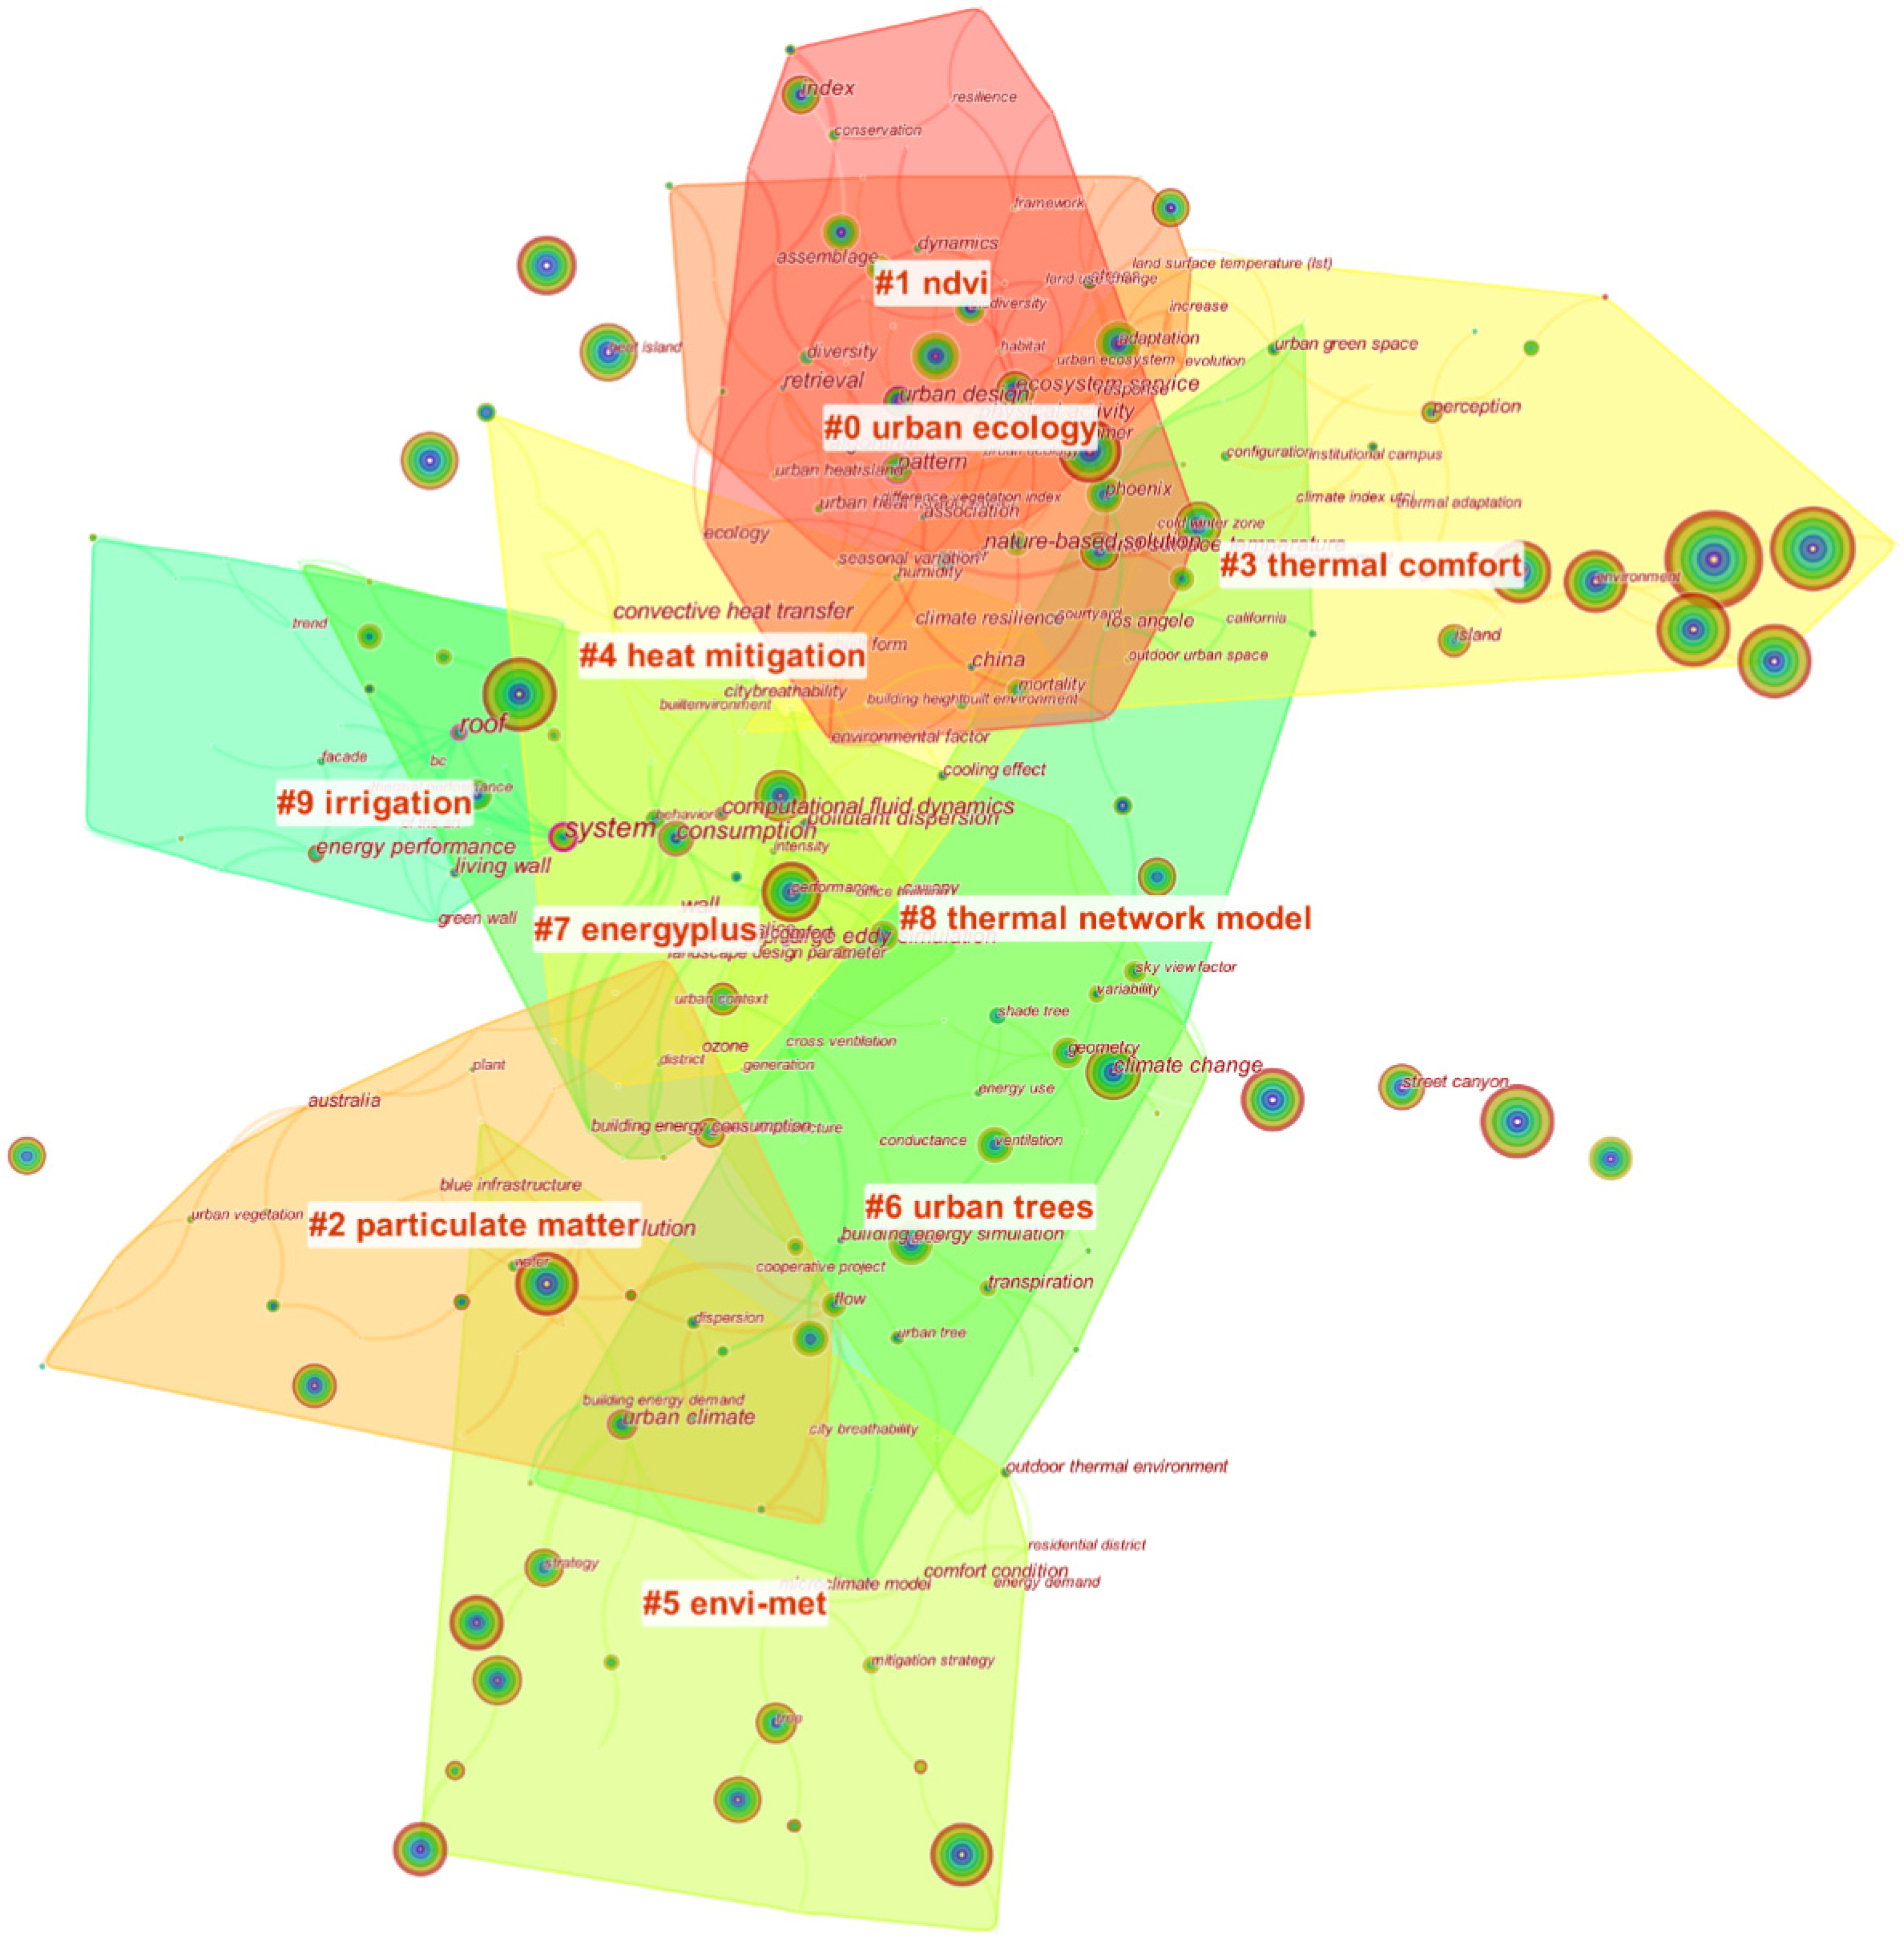
4.1. Distribution of Research Hotspots Based on Keyword Clustering
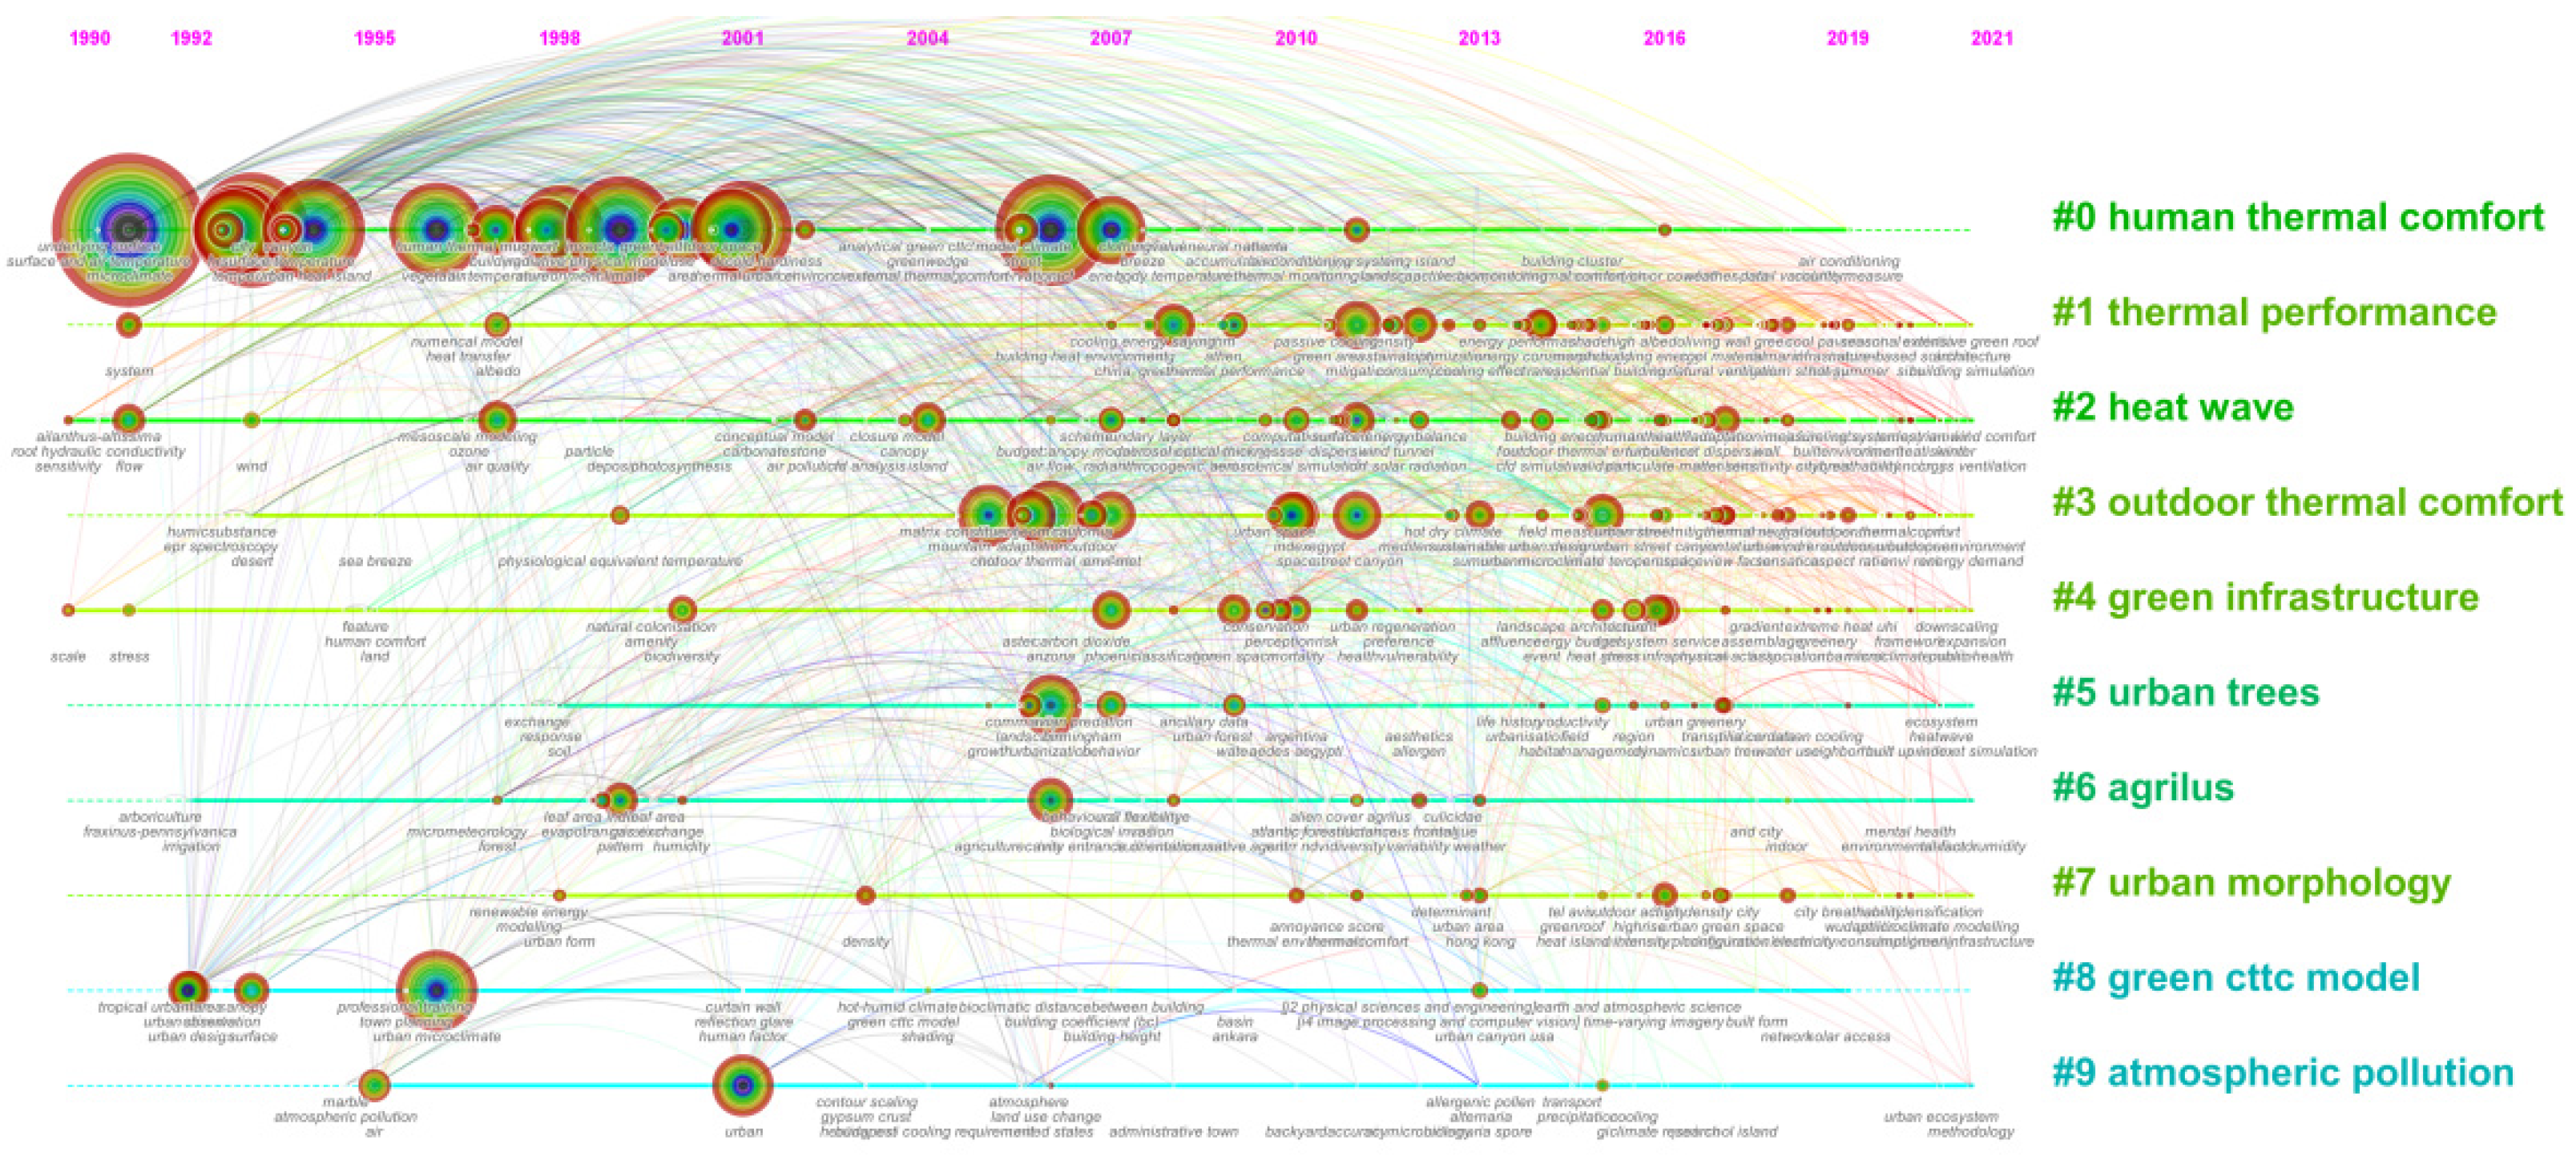
4.2. Evolution of Research Hotspots Based on Annual Overlap
4.3. Research Hotspot Prediction Based on Keyword Emergence
5. General Forecast of Trends in Research Characteristics
5.1. Multi-Scale Urban Climate Simulation Study
5.2. Multi-Factor Urban Microclimate Impact Study
5.3. Multi-Policy Urban Microclimate Guidance Study
6. Conclusions
Author Contributions
Funding
Institutional Review Board Statement
Informed Consent Statement
Conflicts of Interest
References
- Lin, J.; Brown, R. Integrating Microclimate into Landscape Architecture for Outdoor Thermal Comfort: A Systematic Review. Land 2021, 10, 196. [Google Scholar] [CrossRef]
- Global Risks Report, 2022. World Economic Forum. Available online: https://www.weforum.org/reports/global-risks-report-2022 (accessed on 11 January 2022).
- Climate Change, 2021. The Physical Science Basis. IPCC. Available online: https://www.ipcc.ch/report/sixth-assessment-report-working-group-i/ (accessed on 6 August 2021).
- Howard, L. The Climate of London: Deduced from Meteorological Observations; Cambridge University Press: Cambridge, UK, 2012; ISBN 978-1-139-22689-9. [Google Scholar]
- Xu, L.; Tong, S.; He, W.; Zhu, W.; Mei, S.; Cao, K.; Yuan, C. Better Understanding on Impact of Microclimate Information on Building Energy Modelling Performance for Urban Resilience. Sustain. Cities Soc. 2022, 80, 103775. [Google Scholar] [CrossRef]
- Li, J.; Mao, Y.; Ouyang, J.; Zheng, S. A Review of Urban Microclimate Research Based on CiteSpace and VOSviewer Analysis. Int. J. Environ. Res. Public Health 2022, 19, 4741. [Google Scholar] [CrossRef]
- Chokhachian, A.; Santucci, D.; Auer, T. A Human-Centered Approach to Enhance Urban Resilience, Implications and Application to Improve Outdoor Comfort in Dense Urban Spaces. Buildings 2017, 7, 113. [Google Scholar] [CrossRef] [Green Version]
- Physical Climatology. By H. Landsberg. Pennsylvania (The Pennsylvania State College, School of Mineral Industries), 1941. 8°. Pp. Xii + 283. Illustrations: REVIEWS. Q. J. R. Meteorol. Soc. 1942, 68, 305–307. [CrossRef]
- Yao, J.; Yang, F.; Zhuang, Z.; Shao, Y.; Yuan, P.F. The Effect of Personal and Microclimatic Variables on Outdoor Thermal Comfort: A Field Study in a Cold Season in Lujiazui CBD, Shanghai. Sustain. Cities Soc. 2018, 39, 181–188. [Google Scholar] [CrossRef]
- De Dear, R.J.; Akimoto, T.; Arens, E.A.; Brager, G.; Candido, C.; Cheong, K.W.D.; Li, B.; Nishihara, N.; Sekhar, S.C.; Tanabe, S.; et al. Progress in Thermal Comfort Research over the Last Twenty Years. Indoor Air 2013, 23, 442–461. [Google Scholar] [CrossRef]
- Middel, A.; Häb, K.; Brazel, A.J.; Martin, C.A.; Guhathakurta, S. Impact of Urban Form and Design on Mid-Afternoon Microclimate in Phoenix Local Climate Zones. Landsc. Urban Plan. 2014, 122, 16–28. [Google Scholar] [CrossRef]
- Toparlar, Y.; Blocken, B.; Maiheu, B.; van Heijst, G.J.F. A Review on the CFD Analysis of Urban Microclimate. Renew. Sustain. Energy Rev. 2017, 80, 1613–1640. [Google Scholar] [CrossRef]
- Cohen, P.; Potchter, O.; Matzarakis, A. Human Thermal Perception of Coastal Mediterranean Outdoor Urban Environments. Appl. Geogr. 2013, 37, 1–10. [Google Scholar] [CrossRef]
- Corgnati, S.P.; Filippi, M.; Viazzo, S. Perception of the Thermal Environment in High School and University Classrooms: Subjective Preferences and Thermal Comfort. Build. Environ. 2007, 42, 951–959. [Google Scholar] [CrossRef]
- Nikolopoulou, M.; Lykoudis, S. Thermal Comfort in Outdoor Urban Spaces: Analysis across Different European Countries. Build. Environ. 2006, 41, 1455–1470. [Google Scholar] [CrossRef] [Green Version]
- Wang, Y.; Berardi, U.; Akbari, H. Comparing the Effects of Urban Heat Island Mitigation Strategies for Toronto, Canada. Energy Build. 2016, 114, 2–19. [Google Scholar] [CrossRef]
- Perini, K.; Magliocco, A. Effects of Vegetation, Urban Density, Building Height, and Atmospheric Conditions on Local Temperatures and Thermal Comfort. Urban For. Urban Green. 2014, 13, 495–506. [Google Scholar] [CrossRef]
- Chen, Y.; Chen, C.M.; Liu, Z.Y.; Hu, Z.G.; Wang, X.W. Methodological Functions of CiteSpace Knowledge Graphs. Scientol. Res. 2015, 33, 242–253. (In Chinese) [Google Scholar] [CrossRef]
- Chen, C. Science Mapping: A Systematic Review of the Literature. J. Data Inf. Sci. 2017, 2, 1–40. [Google Scholar] [CrossRef] [Green Version]
- Pan, X.; Yan, E.; Cui, M.; Hua, W. Examining the Usage, Citation, and Diffusion Patterns of Bibliometric Mapping Software: A Comparative Study of Three Tools. J. Informetr. 2018, 12, 481–493. [Google Scholar] [CrossRef]
- Chen, C.; Morris, S. Visualizing Evolving Networks: Minimum Spanning Trees versus Pathfinder Networks. In Proceedings of the IEEE Symposium on Information Visualization 2003 (IEEE Cat. No.03TH8714), Seattle, WA, USA, 19–21 October 2003; pp. 67–74. [Google Scholar]
- Graves, W.R.; Joly, R.J.; Dana, M.N. Water Use and Growth of Honey Locust and Tree-of-Heaven at High Root-Zone Temperature. HortScience 1991, 26, 1309–1312. [Google Scholar] [CrossRef] [Green Version]
- Chen, C. CiteSpace II: Detecting and Visualizing Emerging Trends and Transient Patterns in Scientific Literature. J. Am. Soc. Inf. Sci. 2006, 57, 359–377. [Google Scholar] [CrossRef] [Green Version]
- Girvan, M.; Newman, M.E.J. Community Structure in Social and Biological Networks. Proc. Natl. Acad. Sci. USA 2002, 99, 7821–7826. [Google Scholar] [CrossRef] [Green Version]
- Kleinberg, J. Bursty and Hierarchical Structure in Streams. In Proceedings of the Eighth ACM SIGKDD International Conference on Knowledge Discovery and Data Mining—KDD ‘02, New York, NY, USA, 23–26 July 2002; p. 91. [Google Scholar]
- Gorbushina, A.A.; Krumbein, W.E.; Hamman, C.H.; Panina, L.; Soukharjevski, S.; Wollenzien, U. Role of Black Fungi in Color Change and Biodeterioration of Antique Marbles. Geomicrobiol. J. 1993, 11, 205–221. [Google Scholar] [CrossRef]
- Akbari, H.; Taha, H. The Impact of Trees and White Surfaces on Residential Heating and Cooling Energy Use in Four Canadian Cities. Energy 1992, 17, 141–149. [Google Scholar] [CrossRef]
- Cureau, R.J.; Pigliautile, I.; Pisello, A.L. A New Wearable System for Sensing Outdoor Environmental Conditions for Monitoring Hyper-Microclimate. Sensors 2022, 22, 502. [Google Scholar] [CrossRef] [PubMed]
- Bruse, M.; Fleer, H. Simulating Surface–Plant–Air Interactions inside Urban Environments with a Three Dimensional Numerical Model. Environ. Model. Softw. 1998, 13, 373–384. [Google Scholar] [CrossRef]
- Carlson, T.N.; Traci Arthur, S. The Impact of Land Use—Land Cover Changes Due to Urbanization on Surface Microclimate and Hydrology: A Satellite Perspective. Glob. Planet. Chang. 2000, 25, 49–65. [Google Scholar] [CrossRef]
- Adolphe, L. A Simplified Model of Urban Morphology: Application to an Analysis of the Environmental Performance of Cities. Environ. Plan. B Plan. Des. 2001, 28, 183–200. [Google Scholar] [CrossRef]
- Matzarakis, A.; Mayer, H.; Iziomon, M.G. Applications of a Universal Thermal Index: Physiological Equivalent Temperature. Int. J. Biometeorol. 1999, 43, 76–84. [Google Scholar] [CrossRef]
- Steemers, K. Energy and the City: Density, Buildings and Transport. Energy Build. 2003, 35, 3–14. [Google Scholar] [CrossRef]
- Dimoudi, A.; Nikolopoulou, M. Vegetation in the Urban Environment: Microclimatic Analysis and Benefits. Energy Build. 2003, 35, 69–76. [Google Scholar] [CrossRef] [Green Version]
- De la Flor, F.S.; Domínguez, S.A. Modelling Microclimate in Urban Environments and Assessing Its Influence on the Performance of Surrounding Buildings. Energy Build. 2004, 36, 403–413. [Google Scholar] [CrossRef]
- Erell, E. The Application of Urban Climate Research in the Design of Cities. Adv. Build. Energy Res. 2008, 2, 95–121. [Google Scholar] [CrossRef]
- Ali-Toudert, F.; Mayer, H. Numerical Study on the Effects of Aspect Ratio and Orientation of an Urban Street Canyon on Outdoor Thermal Comfort in Hot and Dry Climate. Build. Environ. 2006, 41, 94–108. [Google Scholar] [CrossRef]
- Yu, C.; Hien, W.N. Thermal Benefits of City Parks. Energy Build. 2006, 38, 105–120. [Google Scholar] [CrossRef]
- Harlan, S.L.; Brazel, A.J.; Prashad, L.; Stefanov, W.L.; Larsen, L. Neighborhood Microclimates and Vulnerability to Heat Stress. Soc. Sci. Med. 2006, 63, 2847–2863. [Google Scholar] [CrossRef]
- Huang, L.; Li, J.; Zhao, D.; Zhu, J. A Fieldwork Study on the Diurnal Changes of Urban Microclimate in Four Types of Ground Cover and Urban Heat Island of Nanjing, China. Build. Environ. 2008, 43, 7–17. [Google Scholar] [CrossRef]
- Shashua-Bar, L.; Pearlmutter, D.; Erell, E. The Cooling Efficiency of Urban Landscape Strategies in a Hot Dry Climate. Landsc. Urban Plan. 2009, 92, 179–186. [Google Scholar] [CrossRef]
- Santamouris, M.; Gaitani, N.; Spanou, A.; Saliari, M.; Giannopoulou, K.; Vasilakopoulou, K.; Kardomateas, T. Using Cool Paving Materials to Improve Microclimate of Urban Areas—Design Realization and Results of the Flisvos Project. Build. Environ. 2012, 53, 128–136. [Google Scholar] [CrossRef] [Green Version]
- Kong, F.; Yin, H.; James, P.; Hutyra, L.R.; He, H.S. Effects of Spatial Pattern of Greenspace on Urban Cooling in a Large Metropolitan Area of Eastern China. Landsc. Urban Plan. 2014, 128, 35–47. [Google Scholar] [CrossRef]
- Toparlar, Y.; Blocken, B.; Vos, P.; van Heijst, G.J.F.; Janssen, W.D.; van Hooff, T.; Montazeri, H.; Timmermans, H.J.P. CFD Simulation and Validation of Urban Microclimate: A Case Study for Bergpolder Zuid, Rotterdam. Build. Environ. 2015, 83, 79–90. [Google Scholar] [CrossRef] [Green Version]
- Böcker, L.; Dijst, M.; Prillwitz, J. Impact of Everyday Weather on Individual Daily Travel Behaviours in Perspective: A Literature Review. Transp. Rev. 2013, 33, 71–91. [Google Scholar] [CrossRef]
- Livesley, S.J.; McPherson, E.G.; Calfapietra, C. The Urban Forest and Ecosystem Services: Impacts on Urban Water, Heat, and Pollution Cycles at the Tree, Street, and City Scale. J. Environ. Qual. 2016, 45, 119–124. [Google Scholar] [CrossRef] [PubMed]
- Berardi, U. The Outdoor Microclimate Benefits and Energy Saving Resulting from Green Roofs Retrofits. Energy Build. 2016, 121, 217–229. [Google Scholar] [CrossRef]
- Salata, F.; Golasi, I.; Petitti, D.; de Lieto Vollaro, E.; Coppi, M.; de Lieto Vollaro, A. Relating Microclimate, Human Thermal Comfort and Health during Heat Waves: An Analysis of Heat Island Mitigation Strategies through a Case Study in an Urban Outdoor Environment. Sustain. Cities Soc. 2017, 30, 79–96. [Google Scholar] [CrossRef]
- Gunawardena, K.R.; Wells, M.J.; Kershaw, T. Utilising Green and Bluespace to Mitigate Urban Heat Island Intensity. Sci. Total Environ. 2017, 584, 1040–1055. [Google Scholar] [CrossRef]
- Ramin Shamshiri, R.; Kalantari, F.; Ting, K.C.; Thorp, K.R.; Hameed, I.A.; Weltzien, C.; Ahmad, D.; Shad, Z.M. Advances in Greenhouse Automation and Controlled Environment Agriculture: A Transition to Plant Factories and Urban Agriculture. Int. J. Agric. Biol. Eng. 2018, 11, 1–22. [Google Scholar] [CrossRef]
- Yang, X.; Peng, L.L.H.; Jiang, Z.; Chen, Y.; Yao, L.; He, Y.; Xu, T. Impact of Urban Heat Island on Energy Demand in Buildings: Local Climate Zones in Nanjing. Appl. Energy 2020, 260, 114279. [Google Scholar] [CrossRef]
- Malakoutikhah, M.; Alimohammadlou, M.; Rabiei, H.; Faghihi, S.A.; Kamalinia, M.; Jahangiri, M. A Scientometric Study of Unsafe Behavior through Web of Science during 1991–2020. Int. J. Occup. Saf. Ergon. 2021, 1–13. [Google Scholar] [CrossRef]
- Lam, C.K.C.; Lee, H.; Yang, S.-R.; Park, S. A Review on the Significance and Perspective of the Numerical Simulations of Outdoor Thermal Environment. Sustain. Cities Soc. 2021, 71, 102971. [Google Scholar] [CrossRef]
- Conry, P.; Sharma, A.; Potosnak, M.J.; Leo, L.S.; Bensman, E.; Hellmann, J.J.; Fernando, H.J.S. Chicago’s Heat Island and Climate Change: Bridging the Scales via Dynamical Downscaling. J. Appl. Meteorol. Climatol. 2015, 54, 1430–1448. [Google Scholar] [CrossRef]
- Scherer, D.; Antretter, F.; Bender, S.; Cortekar, J.; Emeis, S.; Fehrenbach, U.; Gross, G.; Halbig, G.; Hasse, J.; Maronga, B.; et al. Urban Climate Under Change [UC]2—A National Research Programme for Developing a Building-Resolving Atmospheric Model for Entire City Regions. Meteorol. Z. 2019, 28, 95–104. [Google Scholar] [CrossRef]
- Lindberg, F.; Grimmond, C.S.B.; Gabey, A.; Huang, B.; Kent, C.W.; Sun, T.; Theeuwes, N.E.; Järvi, L.; Ward, H.C.; Capel-Timms, I.; et al. Urban Multi-Scale Environmental Predictor (UMEP): An Integrated Tool for City-Based Climate Services. Environ. Model. Softw. 2018, 99, 70–87. [Google Scholar] [CrossRef]
- Ching, J.; Aliaga, D.; Mills, G.; Masson, V.; See, L.; Neophytou, M.; Middel, A.; Baklanov, A.; Ren, C.; Ng, E.; et al. Pathway Using WUDAPT’s Digital Synthetic City Tool towards Generating Urban Canopy Parameters for Multi-Scale Urban Atmospheric Modeling. Urban Clim. 2019, 28, 100459. [Google Scholar] [CrossRef]
- McRae, I.; Freedman, F.; Rivera, A.; Li, X.; Dou, J.; Cruz, I.; Ren, C.; Dronova, I.; Fraker, H.; Bornstein, R. Integration of the WUDAPT, WRF, and ENVI-Met Models to Simulate Extreme Daytime Temperature Mitigation Strategies in San Jose, California. Build. Environ. 2020, 184, 107180. [Google Scholar] [CrossRef]
- Molnár, G.; Gyöngyösi, A.Z.; Gál, T. Integration of an LCZ-Based Classification into WRF to Assess the Intra-Urban Temperature Pattern under a Heatwave Period in Szeged, Hungary. Theor. Appl. Climatol. 2019, 138, 1139–1158. [Google Scholar] [CrossRef] [Green Version]
- Yang, W.; Lin, Y.; Li, C.-Q. Effects of Landscape Design on Urban Microclimate and Thermal Comfort in Tropical Climate. Adv. Meteorol. 2018, 2018, 2809649. [Google Scholar] [CrossRef]
- Raut, P.; Li, S.; Chen, Y.-M.; Zhu, Y.; Jana, S.C. Strong and Flexible Composite Solid Polymer Electrolyte Membranes for Li-Ion Batteries. ACS Omega 2019, 4, 18203–18209. [Google Scholar] [CrossRef]
- Raut, P.; Swanson, N.; Kulkarni, A.; Pugh, C.; Jana, S.C. Exploiting Arene-Perfluoroarene Interactions for Dispersion of Carbon Black in Rubber Compounds. Polymer 2018, 148, 247–258. [Google Scholar] [CrossRef]
- Yang, P.; Ren, G.; Hou, W. Temporal–Spatial Patterns of Relative Humidity and the Urban Dryness Island Effect in Beijing City. J. Appl. Meteorol. Climatol. 2017, 56, 2221–2237. [Google Scholar] [CrossRef]
- Bherwani, H.; Singh, A.; Kumar, R. Assessment Methods of Urban Microclimate and Its Parameters: A Critical Review to Take the Research from Lab to Land. Urban Clim. 2020, 34, 100690. [Google Scholar] [CrossRef]


| Phase | Year | Frequency | Keyword | Burst |
|---|---|---|---|---|
| 1990–1997 | 1993 | 419 | Temperature | 8.29 |
| 1993 | 308 | Heat island | ||
| 1993 | 219 | Model | ||
| 1996 | 294 | Vegetation | ||
| 1997 | 46 | Albedo | ||
| 1998–2005 | 1998 | 282 | Environment | 4.03 |
| 1998 | 167 | Performance | ||
| 1999 | 62 | Pattern | ||
| 2000 | 62 | Land use | 7.58 | |
| 2001 | 331 | Thermal comfort | ||
| 2003 | 69 | land surface temperature | ||
| 2005 | 136 | Hot | ||
| 2006–2015 | 2006 | 231 | Outdoor thermal comfort | |
| 2006 | 124 | Urbanization | 3.19 | |
| 2007 | 127 | Energy | ||
| 2007 | 126 | ENVI-met | ||
| 2009 | 63 | Green space | ||
| 2011 | 126 | Mitigation | ||
| 2011 | 102 | Street canyon | ||
| 2014 | 51 | Strategy | ||
| 2015 | 75 | Mean radiant temperature | ||
| 2014 | 87 | Expansion | ||
| 2014 | 58 | Urban Expansion | ||
| 2016 to date | 2016 | 55 | Green infrastructure | 3.50 |
| 2016 | 51 | Ecosystem service | ||
| 2017 | 45 | Ventilation | ||
| 2018 | 30 | Mitigation strategy | ||
| 2019 | 23 | Aspect ratio | 4.16 |
| Keywords | Strength | Start | End | 1990----------------------------------------------------------2021 |
|---|---|---|---|---|
| Urban design | 5.2354 | 1992 | 2017 | 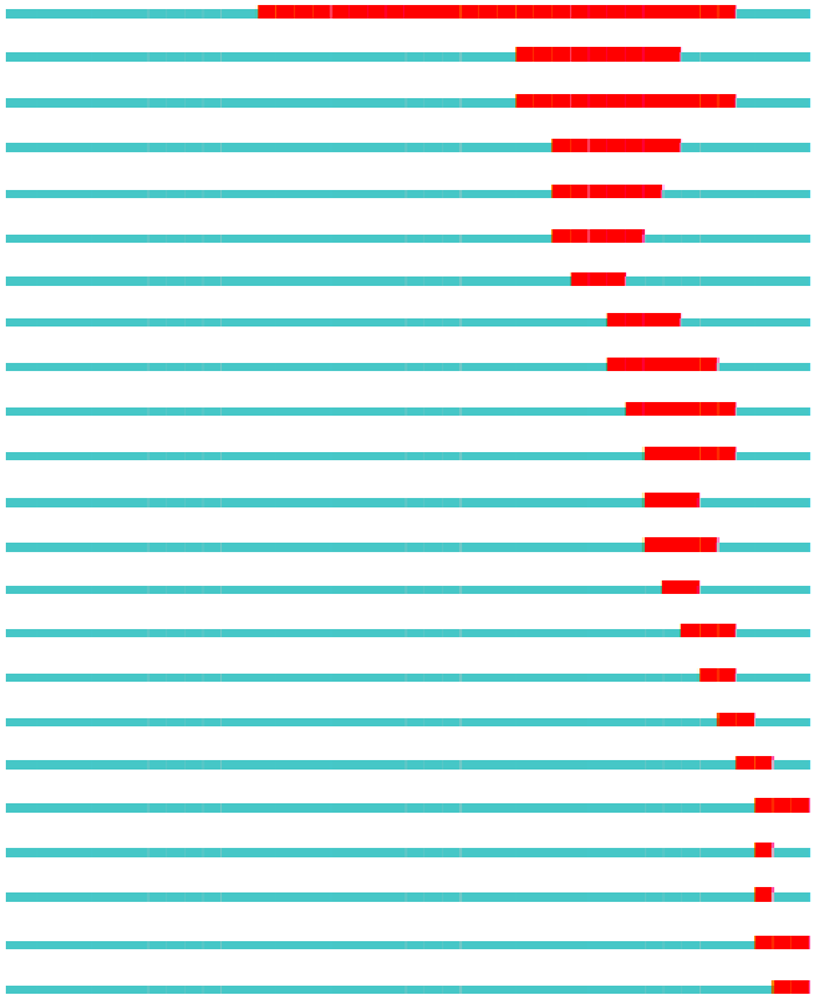 |
| Landscape | 4.4904 | 2006 | 2014 | |
| Community | 4.2531 | 2006 | 2017 | |
| Parameterization | 4.093 | 2008 | 2014 | |
| Temperature | 8.2872 | 2008 | 2013 | |
| Air pollution | 4.2191 | 2008 | 2012 | |
| Thermal performance | 3.1075 | 2009 | 2011 | |
| Urban planning | 4.0628 | 2011 | 2014 | |
| Impervious surface | 3.5086 | 2011 | 2016 | |
| Land use | 7.5759 | 2012 | 2017 | |
| Green roof | 4.3646 | 2013 | 2017 | |
| Evapotranspiration | 3.8072 | 2013 | 2015 | |
| The hot, dry climate | 4.8018 | 2013 | 2016 | |
| Urbanization | 3.1877 | 2014 | 2015 | |
| GI | 3.3411 | 2015 | 2017 | |
| Biodiversity | 3.1095 | 2016 | 2017 | |
| Cool material | 4.0713 | 2017 | 2018 | |
| Thermal sensation | 3.5097 | 2018 | 2019 | |
| Urban heat | 3.5198 | 2019 | 2021 | |
| Equivalent temperature | 3.3522 | 2019 | 2019 | |
| Energy performance | 3.7053 | 2019 | 2019 | |
| Aspect ratio | 4.1644 | 2019 | 2021 | |
| Urban park | 3.9219 | 2020 | 2021 |
| Keywords | Strength | Begin | End | 2017------------------------2022 |
|---|---|---|---|---|
| Coating | 2.0568 | 2017 | 2019 | 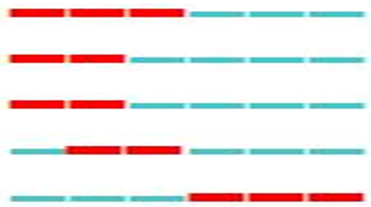 |
| Atmosphere boundary layer | 1.9597 | 2017 | 2018 | |
| Mediterranean climate | 2.0746 | 2017 | 2018 | |
| Shading | 2.8963 | 2018 | 2019 | |
| Energy efficiency | 2.2226 | 2020 | 2022 |
| Cluster Name | Size | Profile Value | Year | Main Keywords |
|---|---|---|---|---|
| 0. Urban ecology | 35 | 0.913 | 2018 | urban ecosystems; land surface temperature; air temperature; ecosystem services; indicators; physical health; global climate regulation |
| 1. NDVI (Normalized Difference Vegetation Index) | 30 | 0.936 | 2018 | surface urban heat island; physical activity; citizen science; biological invasion; convective heat flux |
| 2. Particulate matter | 30 | 0.882 | 2018 | agent-based model; ventilation path; twining plants; small urban planting design; geographic information system (gis); single planting |
| 3. Thermal comfort | 29 | 0.857 | 2018 | cool pavement; microclimate model; thermal behavior; physiological equivalent temperature index; micrometeorological measurements; hedonic modelling; outdoor microclimate map |
| 4. Heat mitigation | 26 | 0.918 | 2018 | turbulence; urban canyon; weather research and forecasting model; low-rise housing; humid tropics region; office buildings; height-to-width ratio; passive design |
| 5. ENVI-met | 25 | 0.953 | 2018 | mitigation; integrated environmental assessment; residential district; direct shortwave radiation scattering; wind speed reduction; plant geometry; plant physiology |
| 6. Urban trees | 23 | 0.886 | 2018 | tree species; air relative humidity; reduced soil water availability; antioxidants; surface-energy balance; light; latent heat flux; sap flow dynamics |
| 7. EnergyPlus | 23 | 0.879 | 2018 | thermal adaptation; form indices; cooling energy consumption; generic residential districts; OpenFOAM |
| 8. Thermal network model | 23 | 0.946 | 2017 | building energy simulation; computational fluid dynamics; vertical greenery system; CoMFA human heat balance model; lumped thermal parameter |
| 9. Irrigation | 21 | 0.872 | 2017 | green walls; urban agriculture; urbanization; Teb; urban water cycle; subtropical monsoon climate; vertical farming |
Publisher’s Note: MDPI stays neutral with regard to jurisdictional claims in published maps and institutional affiliations. |
© 2022 by the authors. Licensee MDPI, Basel, Switzerland. This article is an open access article distributed under the terms and conditions of the Creative Commons Attribution (CC BY) license (https://creativecommons.org/licenses/by/4.0/).
Share and Cite
Zhou, Y.; An, N.; Yao, J. Characteristics, Progress and Trends of Urban Microclimate Research: A Systematic Literature Review and Bibliometric Analysis. Buildings 2022, 12, 877. https://doi.org/10.3390/buildings12070877
Zhou Y, An N, Yao J. Characteristics, Progress and Trends of Urban Microclimate Research: A Systematic Literature Review and Bibliometric Analysis. Buildings. 2022; 12(7):877. https://doi.org/10.3390/buildings12070877
Chicago/Turabian StyleZhou, Yichen, Na An, and Jiawei Yao. 2022. "Characteristics, Progress and Trends of Urban Microclimate Research: A Systematic Literature Review and Bibliometric Analysis" Buildings 12, no. 7: 877. https://doi.org/10.3390/buildings12070877
APA StyleZhou, Y., An, N., & Yao, J. (2022). Characteristics, Progress and Trends of Urban Microclimate Research: A Systematic Literature Review and Bibliometric Analysis. Buildings, 12(7), 877. https://doi.org/10.3390/buildings12070877