
Design and Thermal Environment Analysis of a Decentralized Cooling System with Surface-Mount Heat Pipe Exchangers on Servers in Data Centers

 ,
,  , ,
, ,  and
and
Abstract
:1. Introduction
2. Data Center
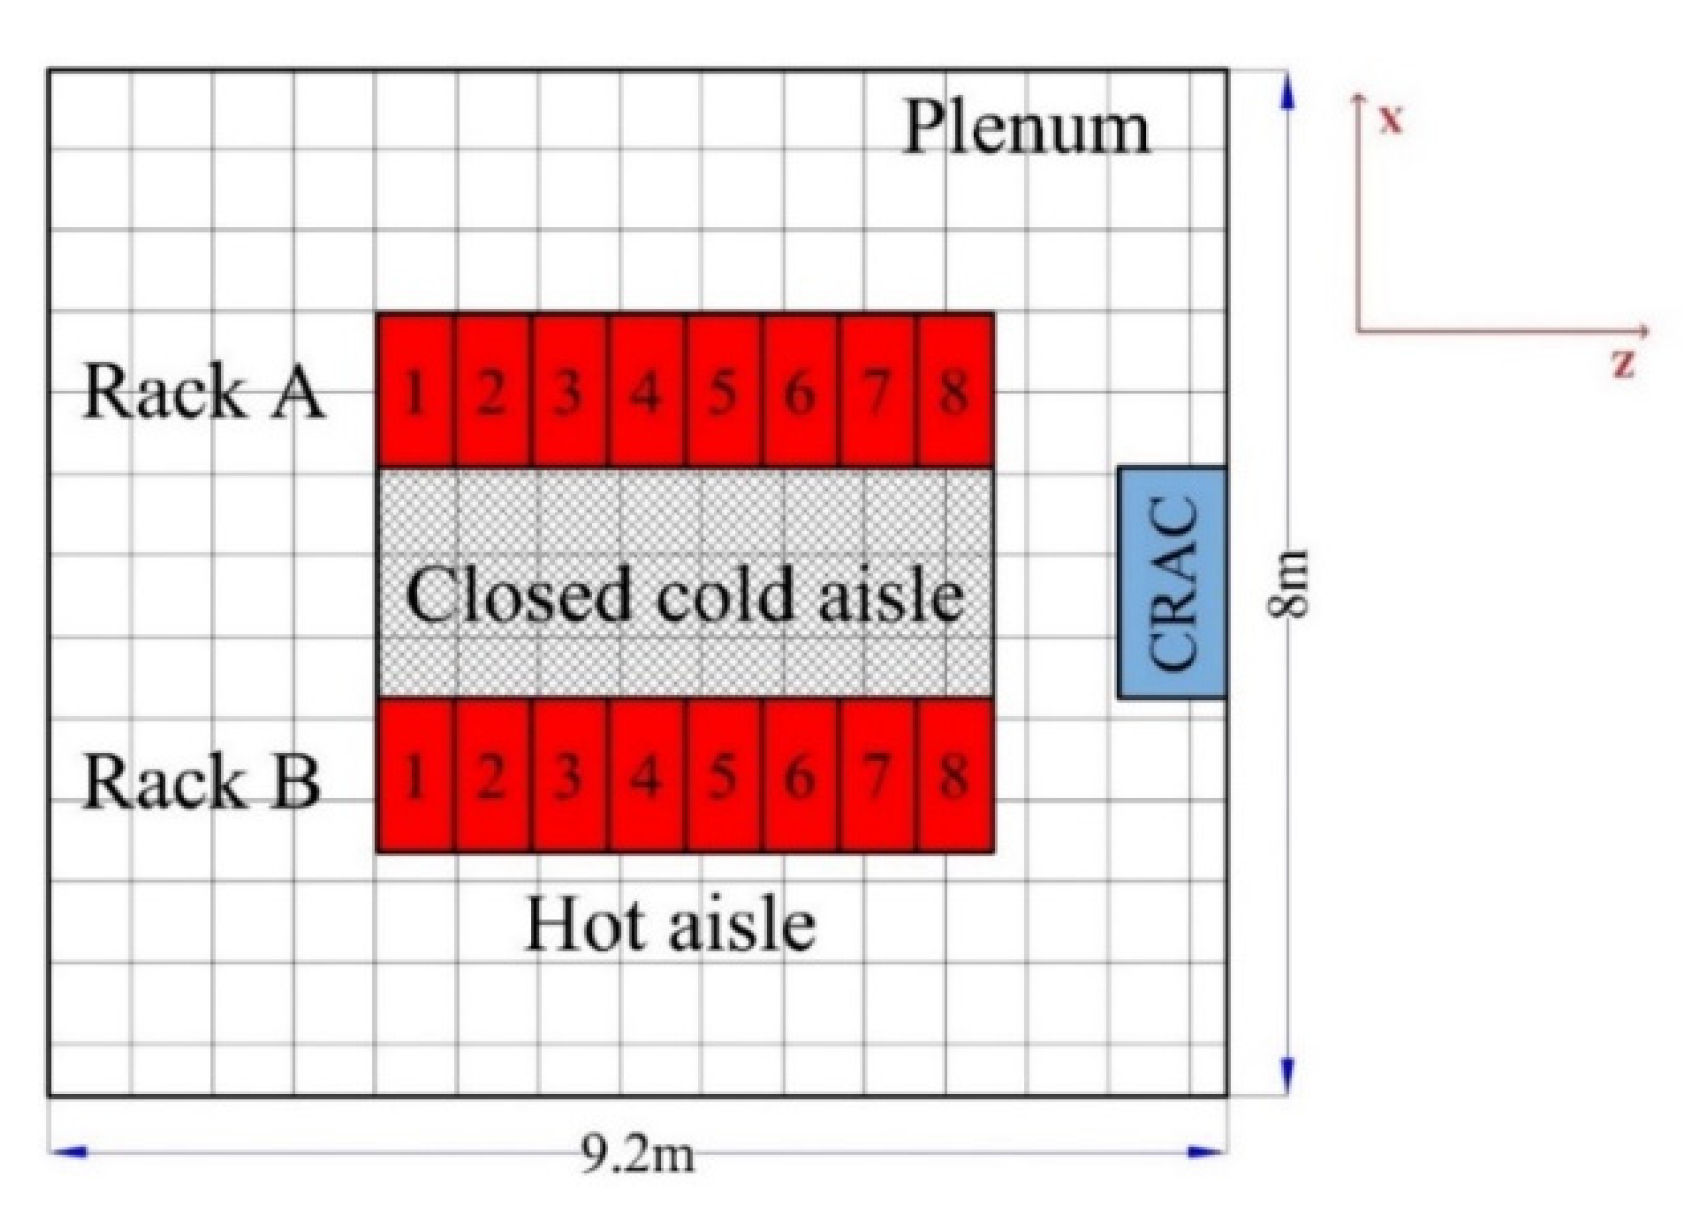
2.1. Description of the Studied DC Room
2.2. Model Set-Up
2.2.1. Control Equation and Turbulence Model
- (a)
- Mass conservation equation (continuity equation):
- (b)
- Momentum conservation equation:
- (c)
- Energy conservation equation:
- (d)
- Turbulent kinetic energy equation:
- (e)
- Dissipation rate equation:
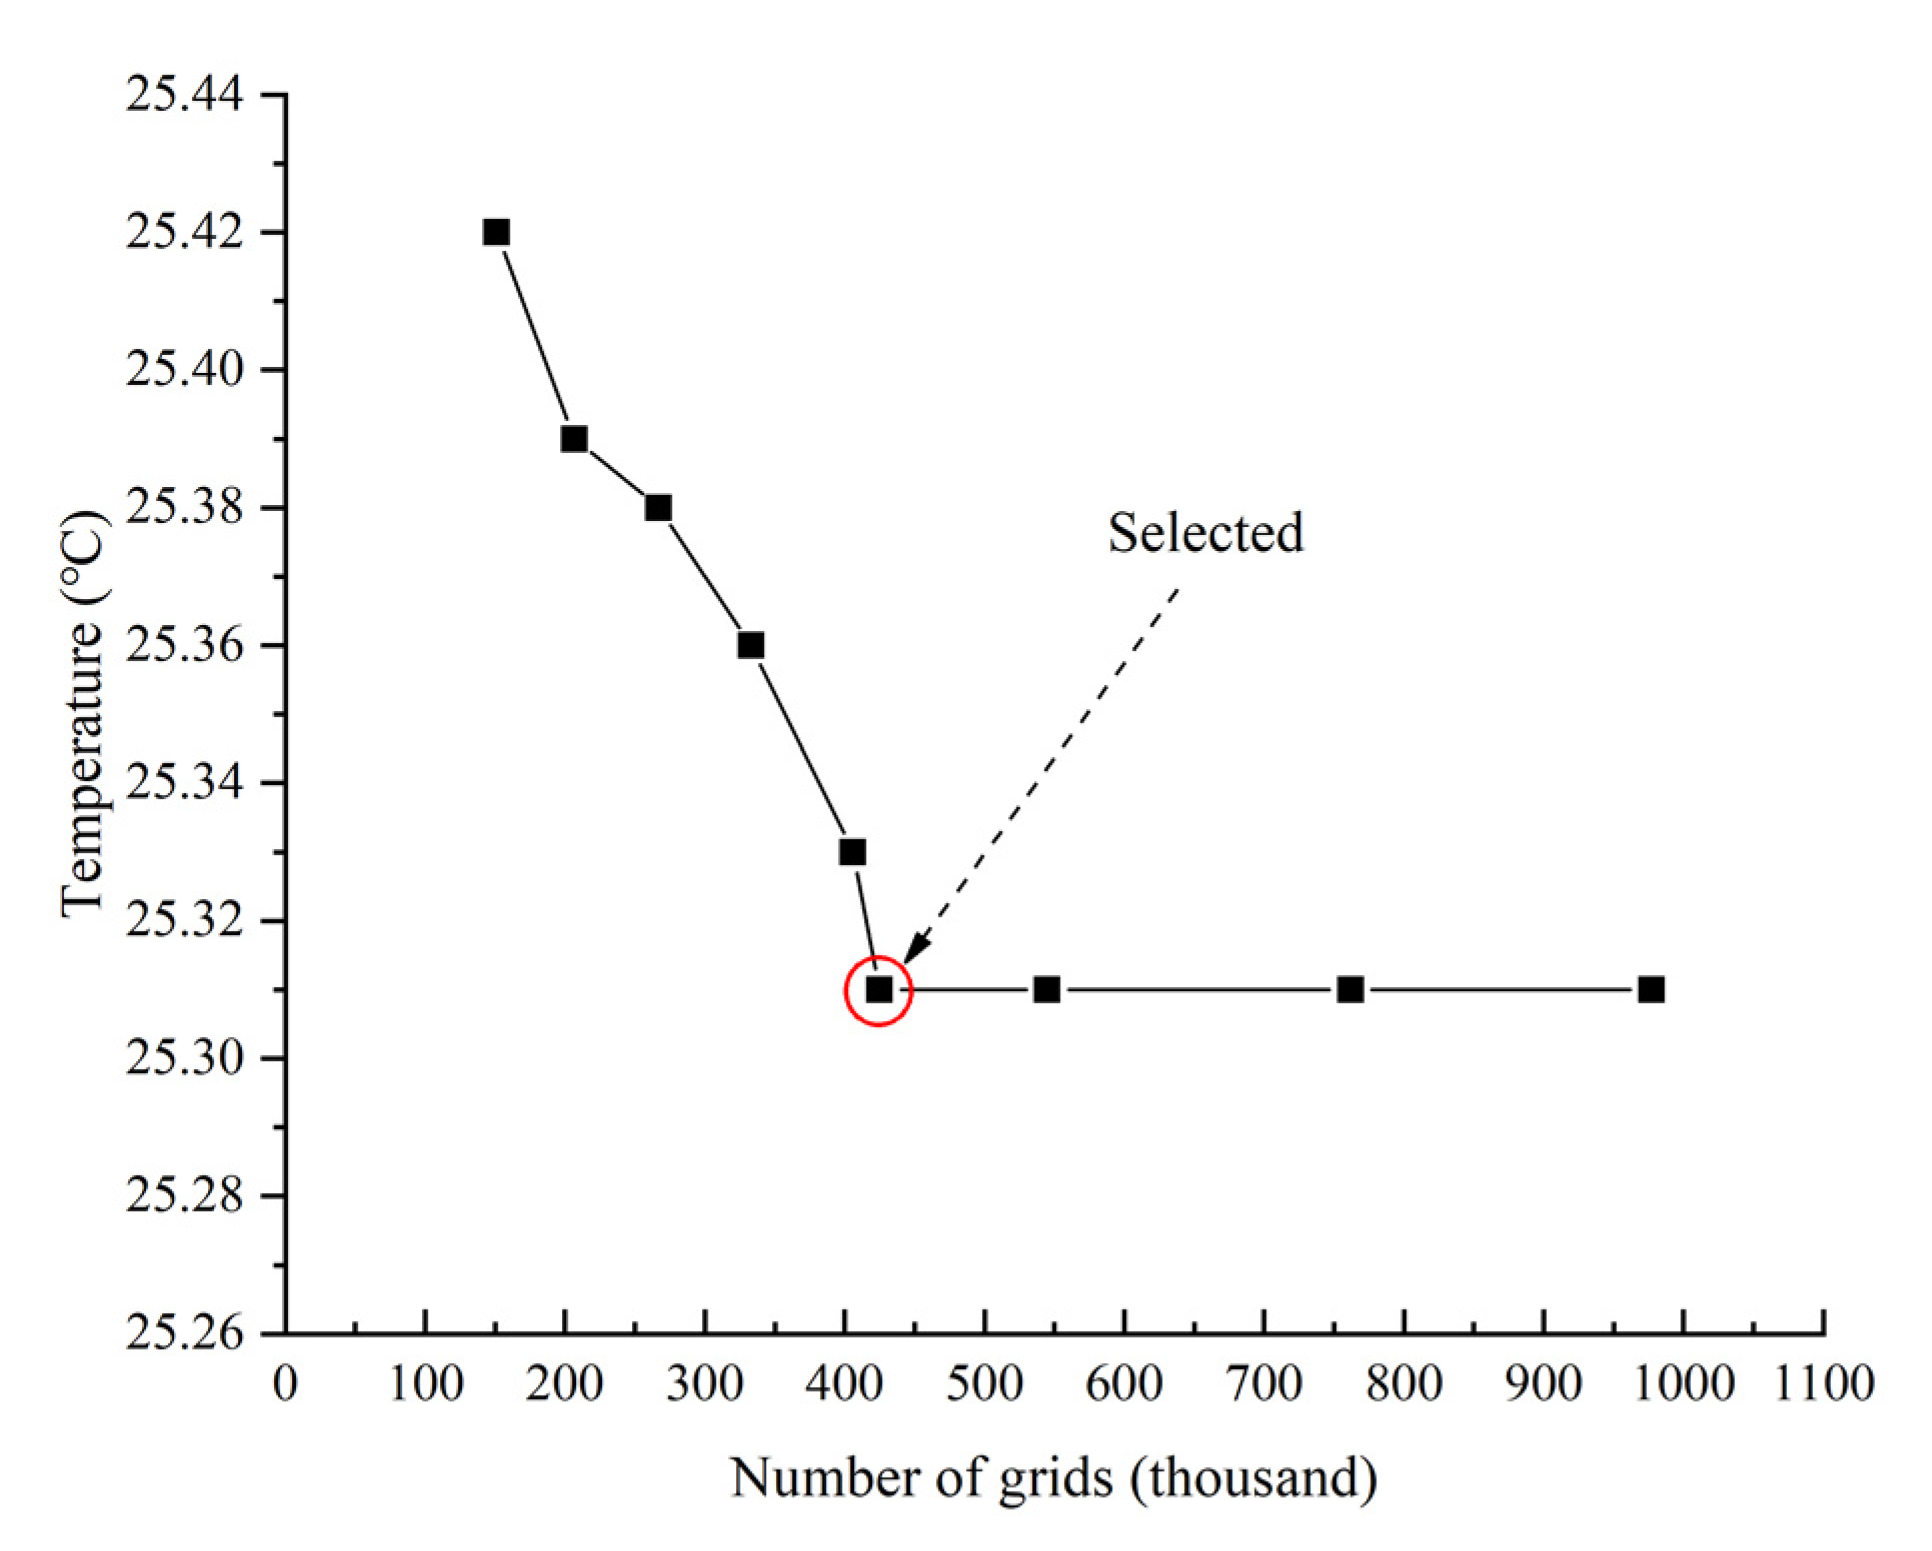
2.2.2. Boundary Conditions and Mesh Generation
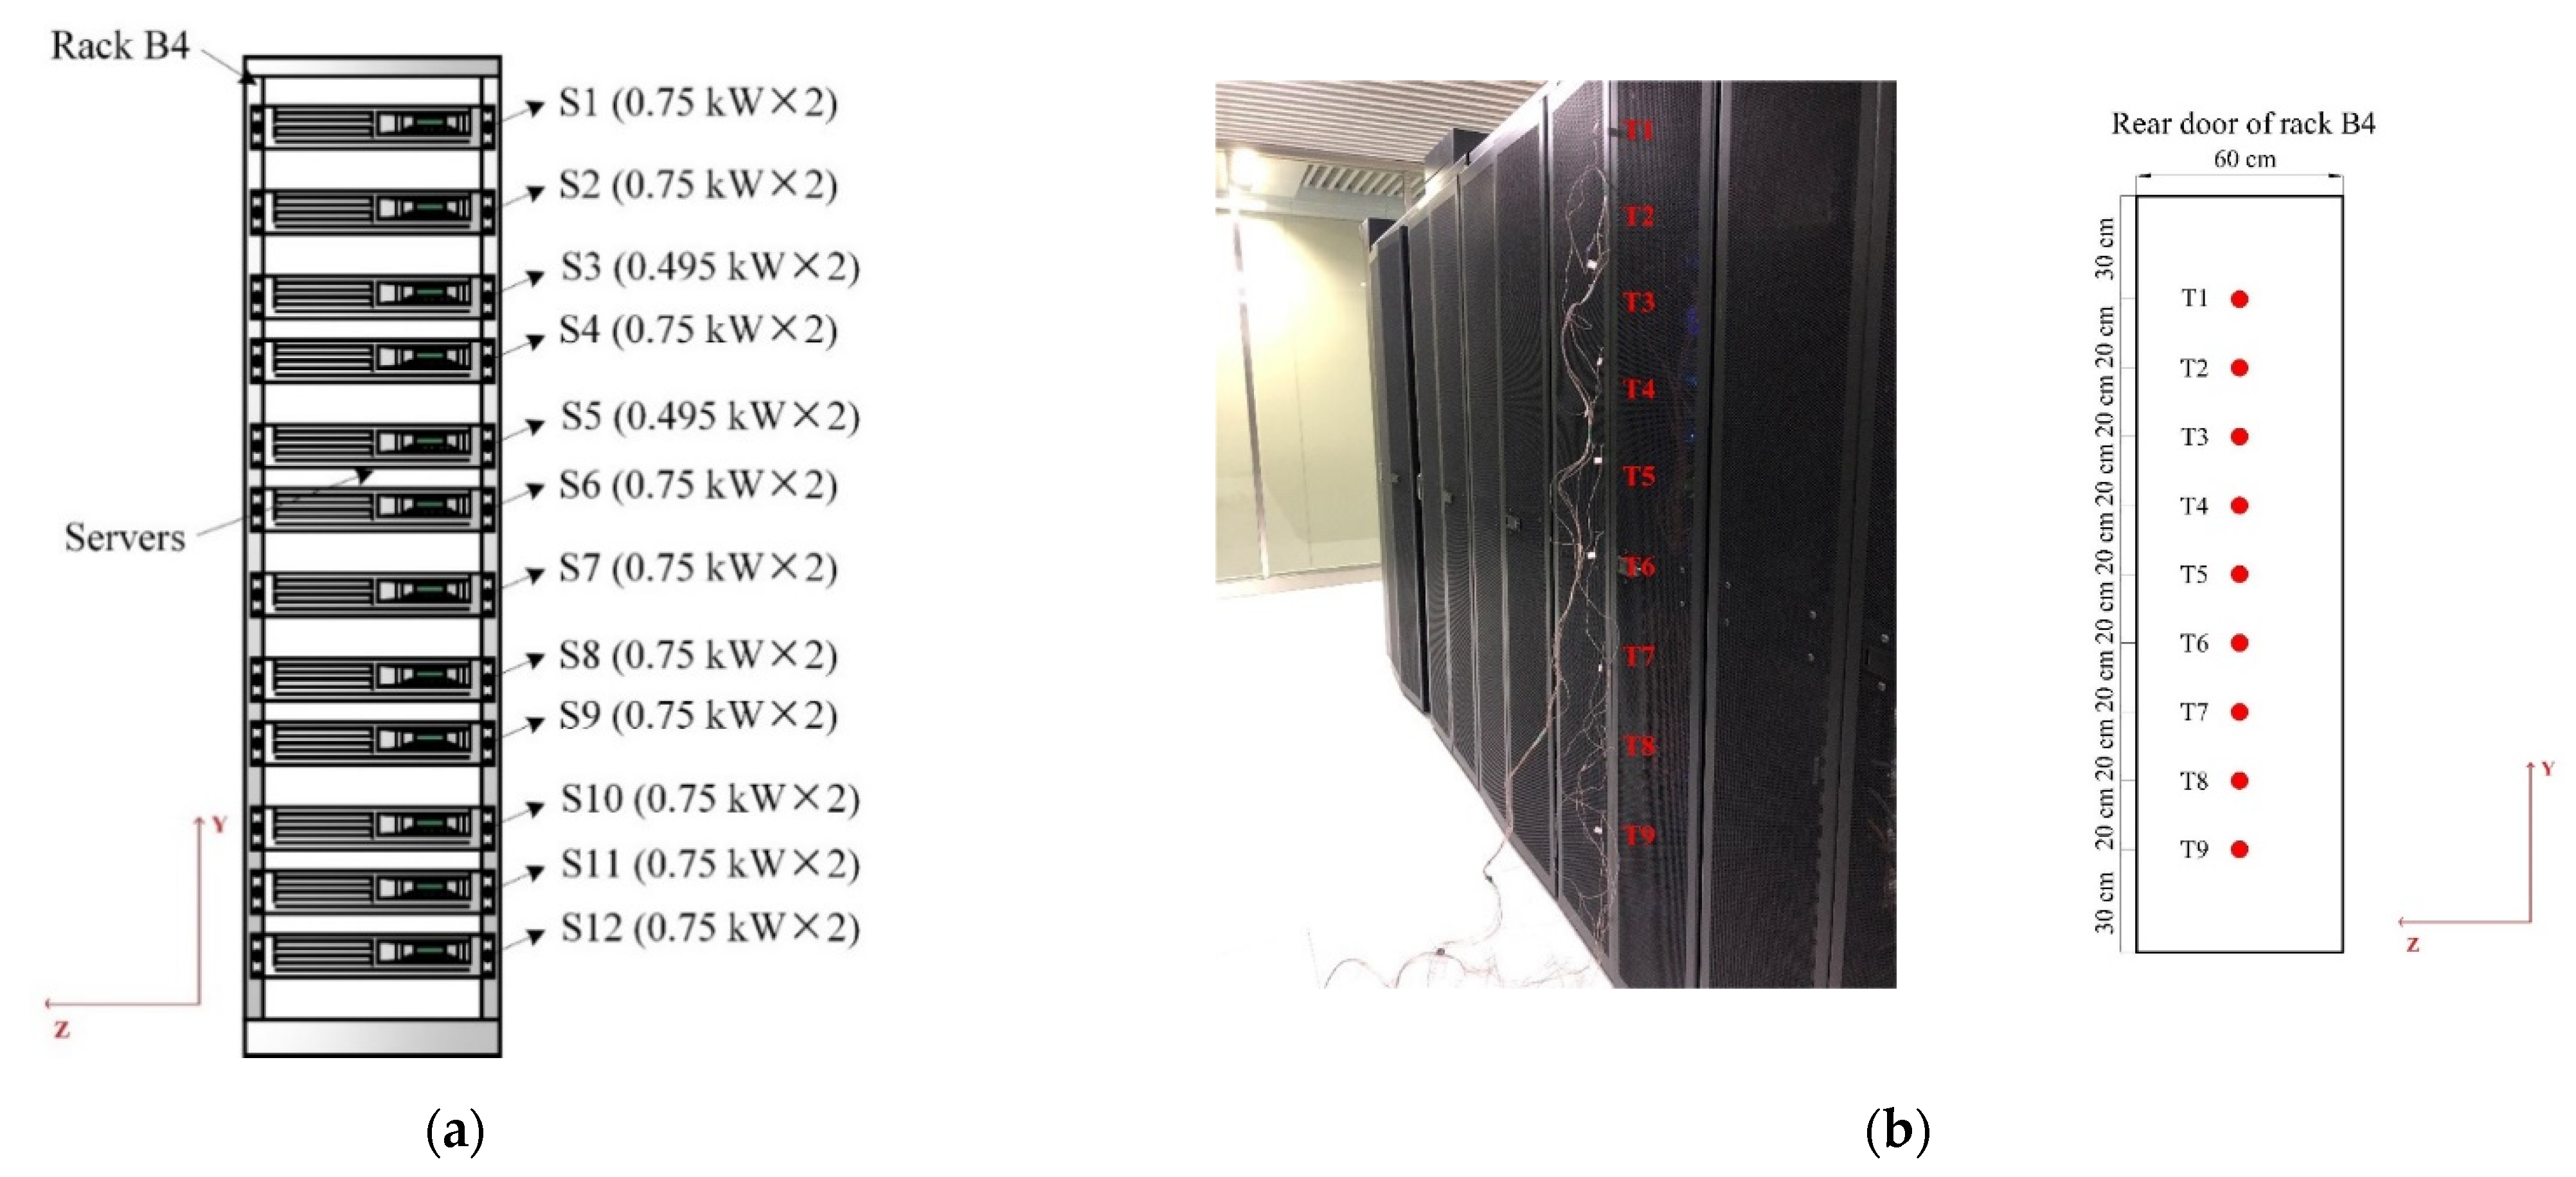
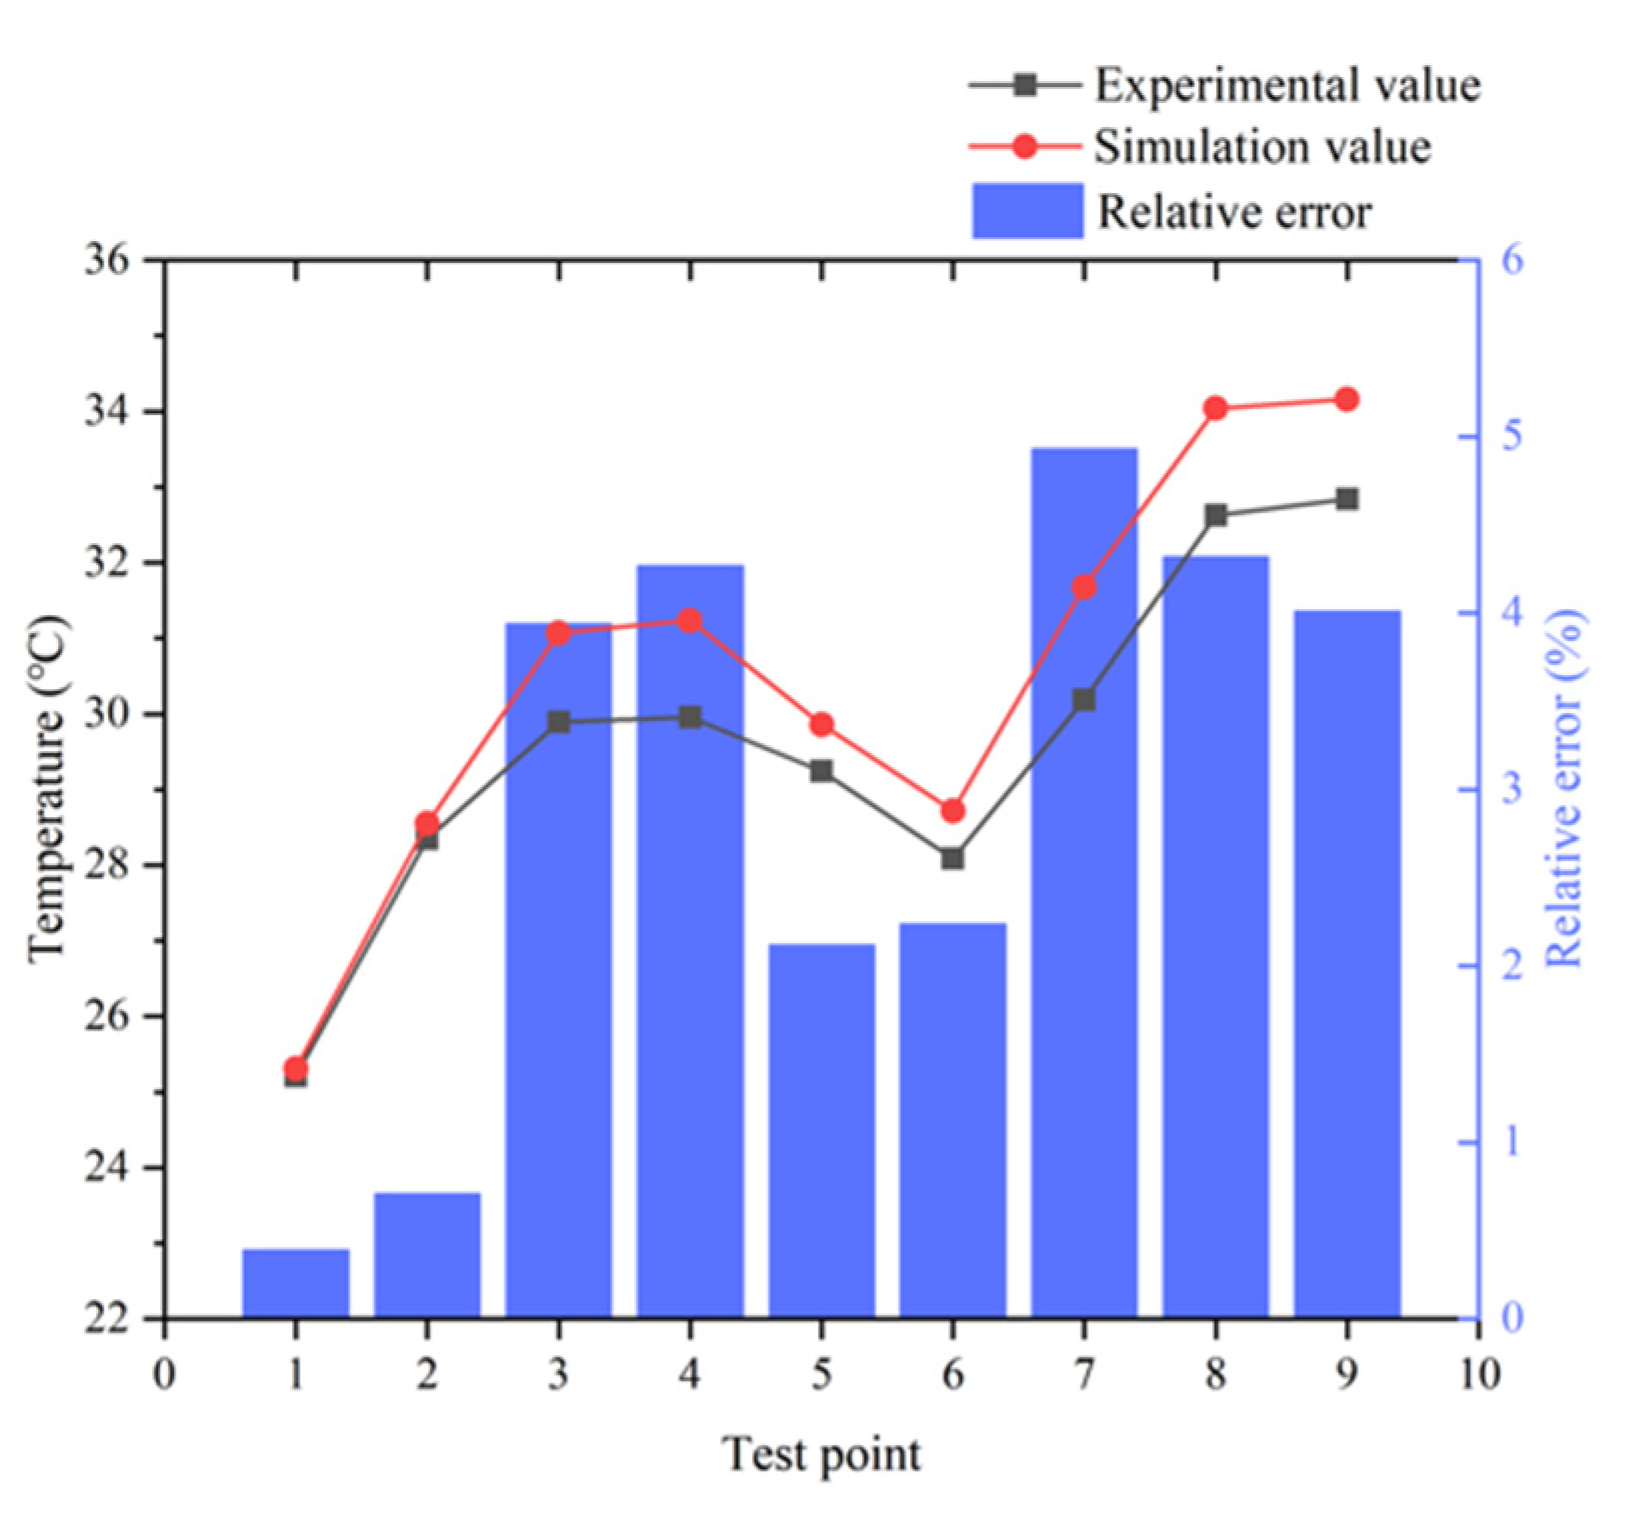
2.3. Experimental Validation of Model Reliability
- ⮚
- Highest rated power (16.98 kW) among all 16 racks;
- ⮚
- Only two kinds of rack-mounted servers with power of 0.75 kW×2 and 0.495 kW×2;
- ⮚
- All the servers are 2 U, which share the consistent appearance size;
- ⮚
- Servers are placed more evenly, whose intervals are 1 U and 2 U.
3. Improved Thermal Environment with Installed HPEs
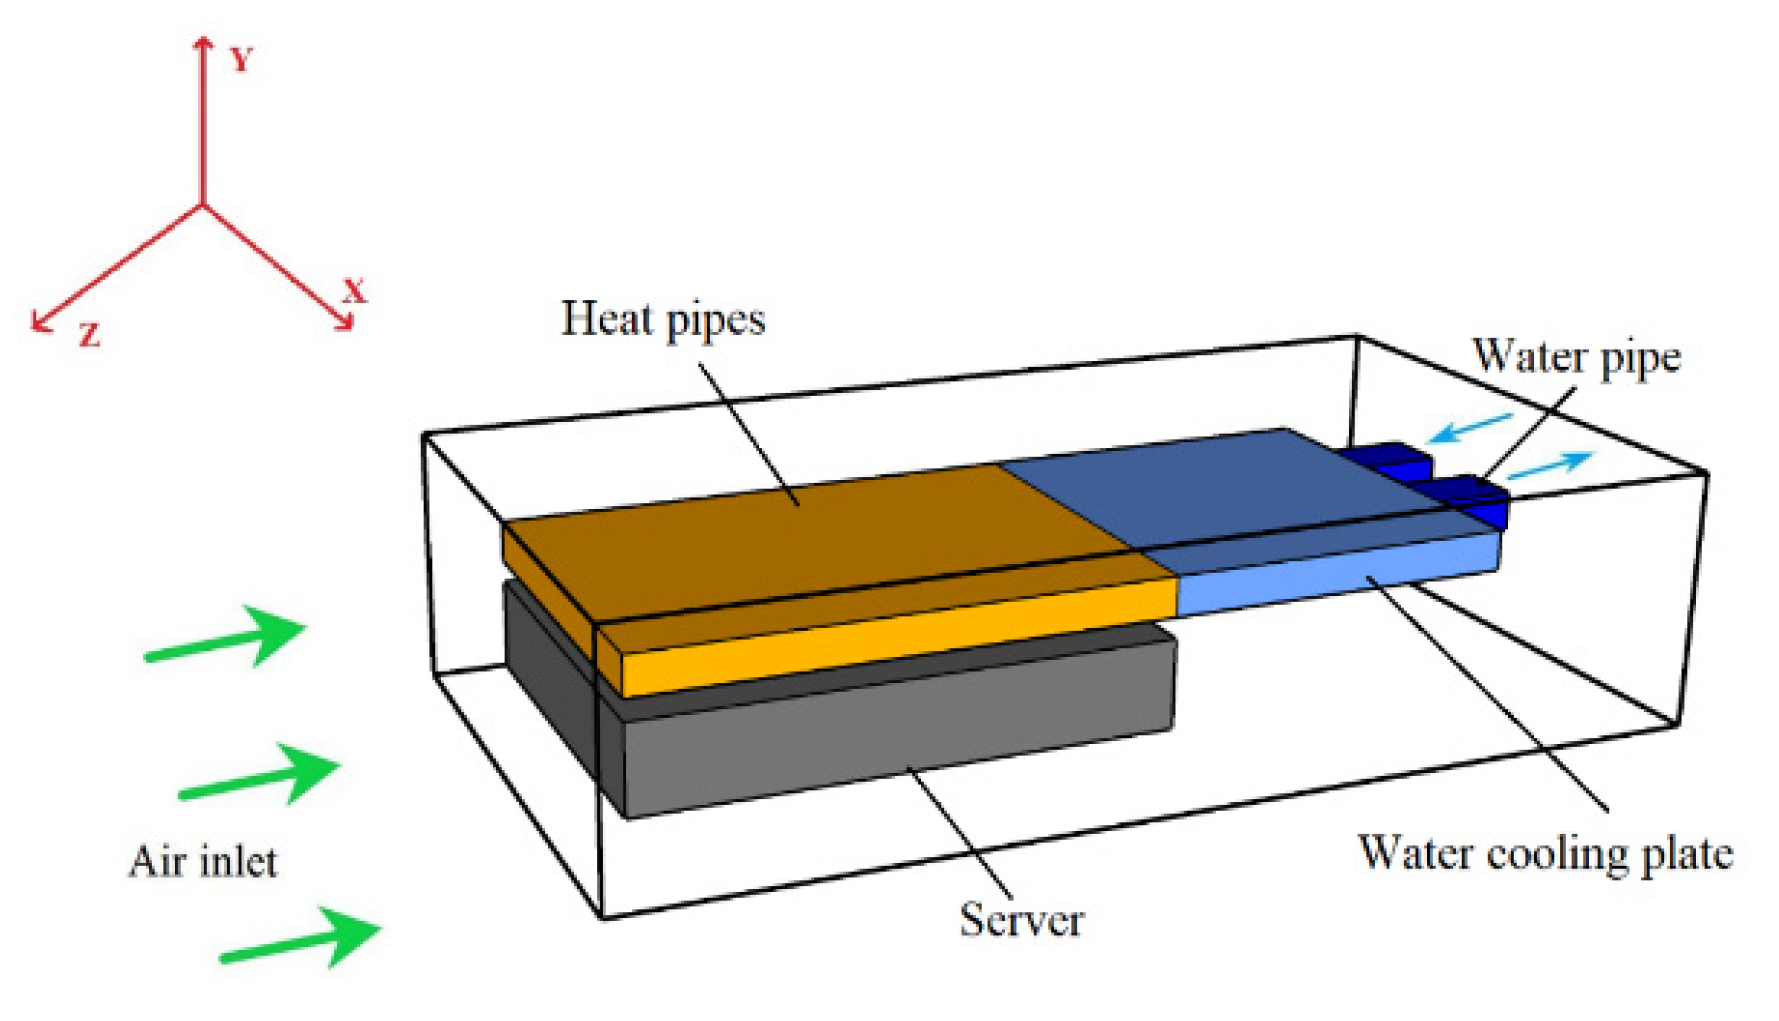
3.1. Description of the HPEs
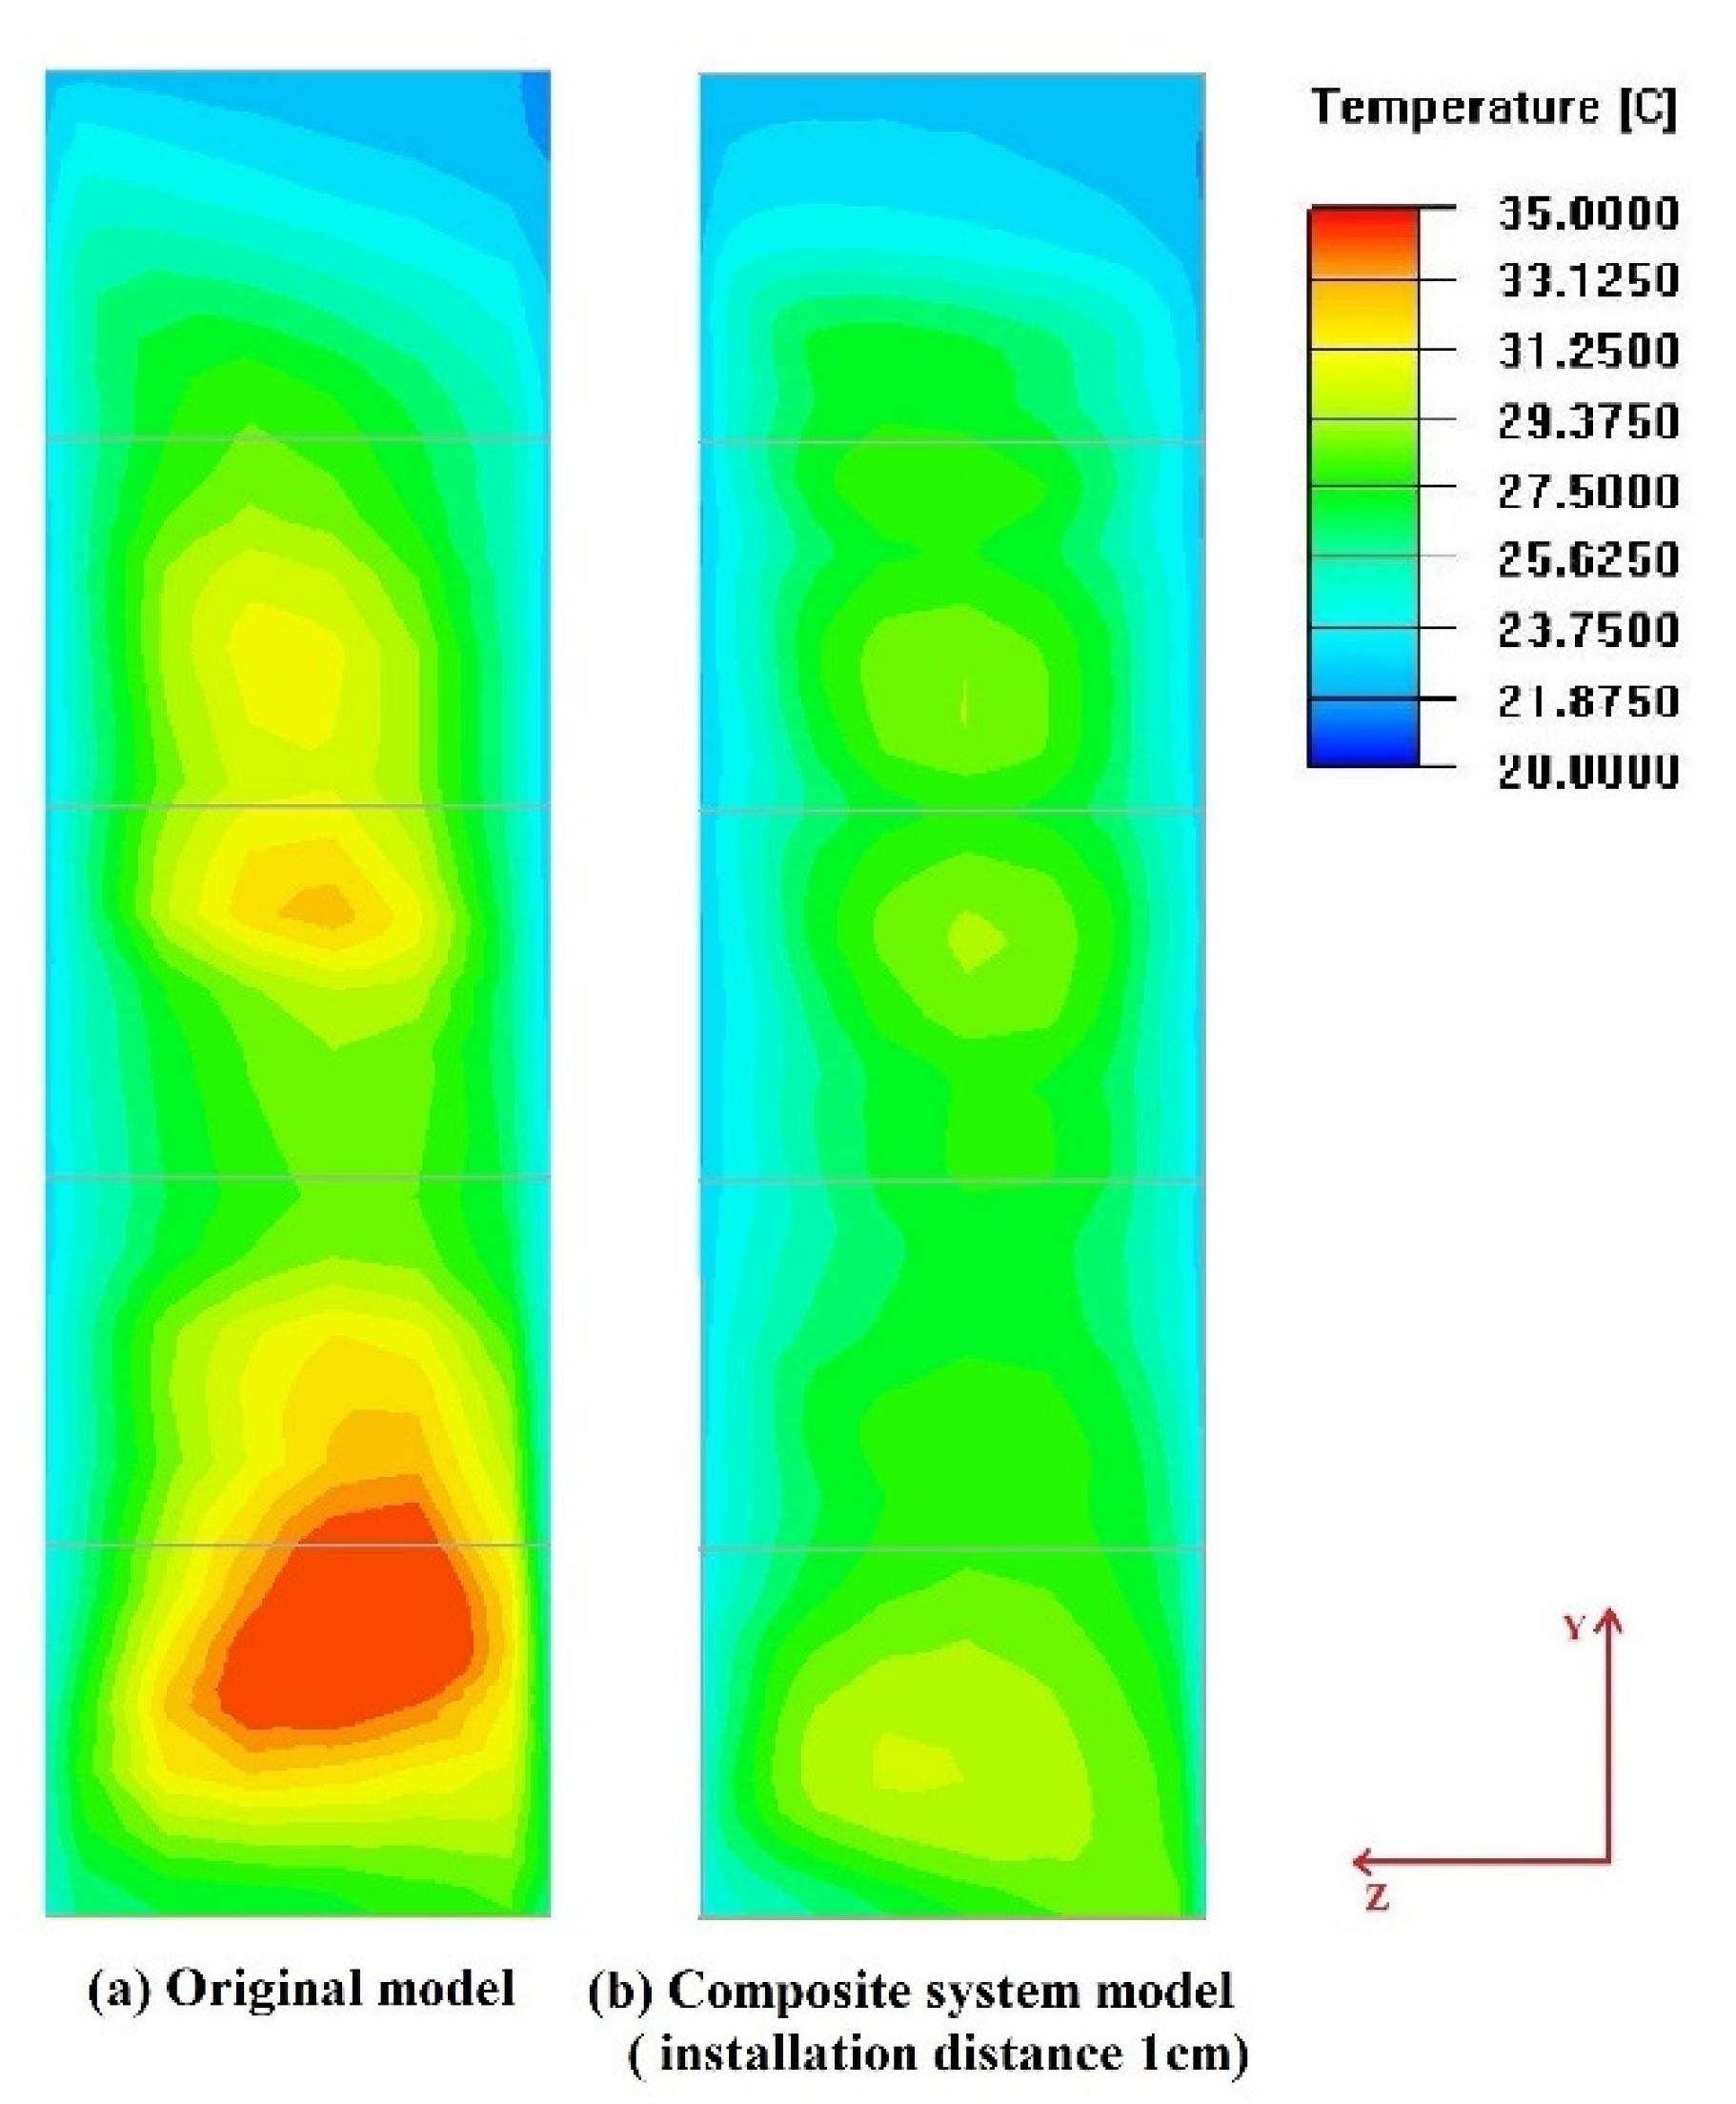
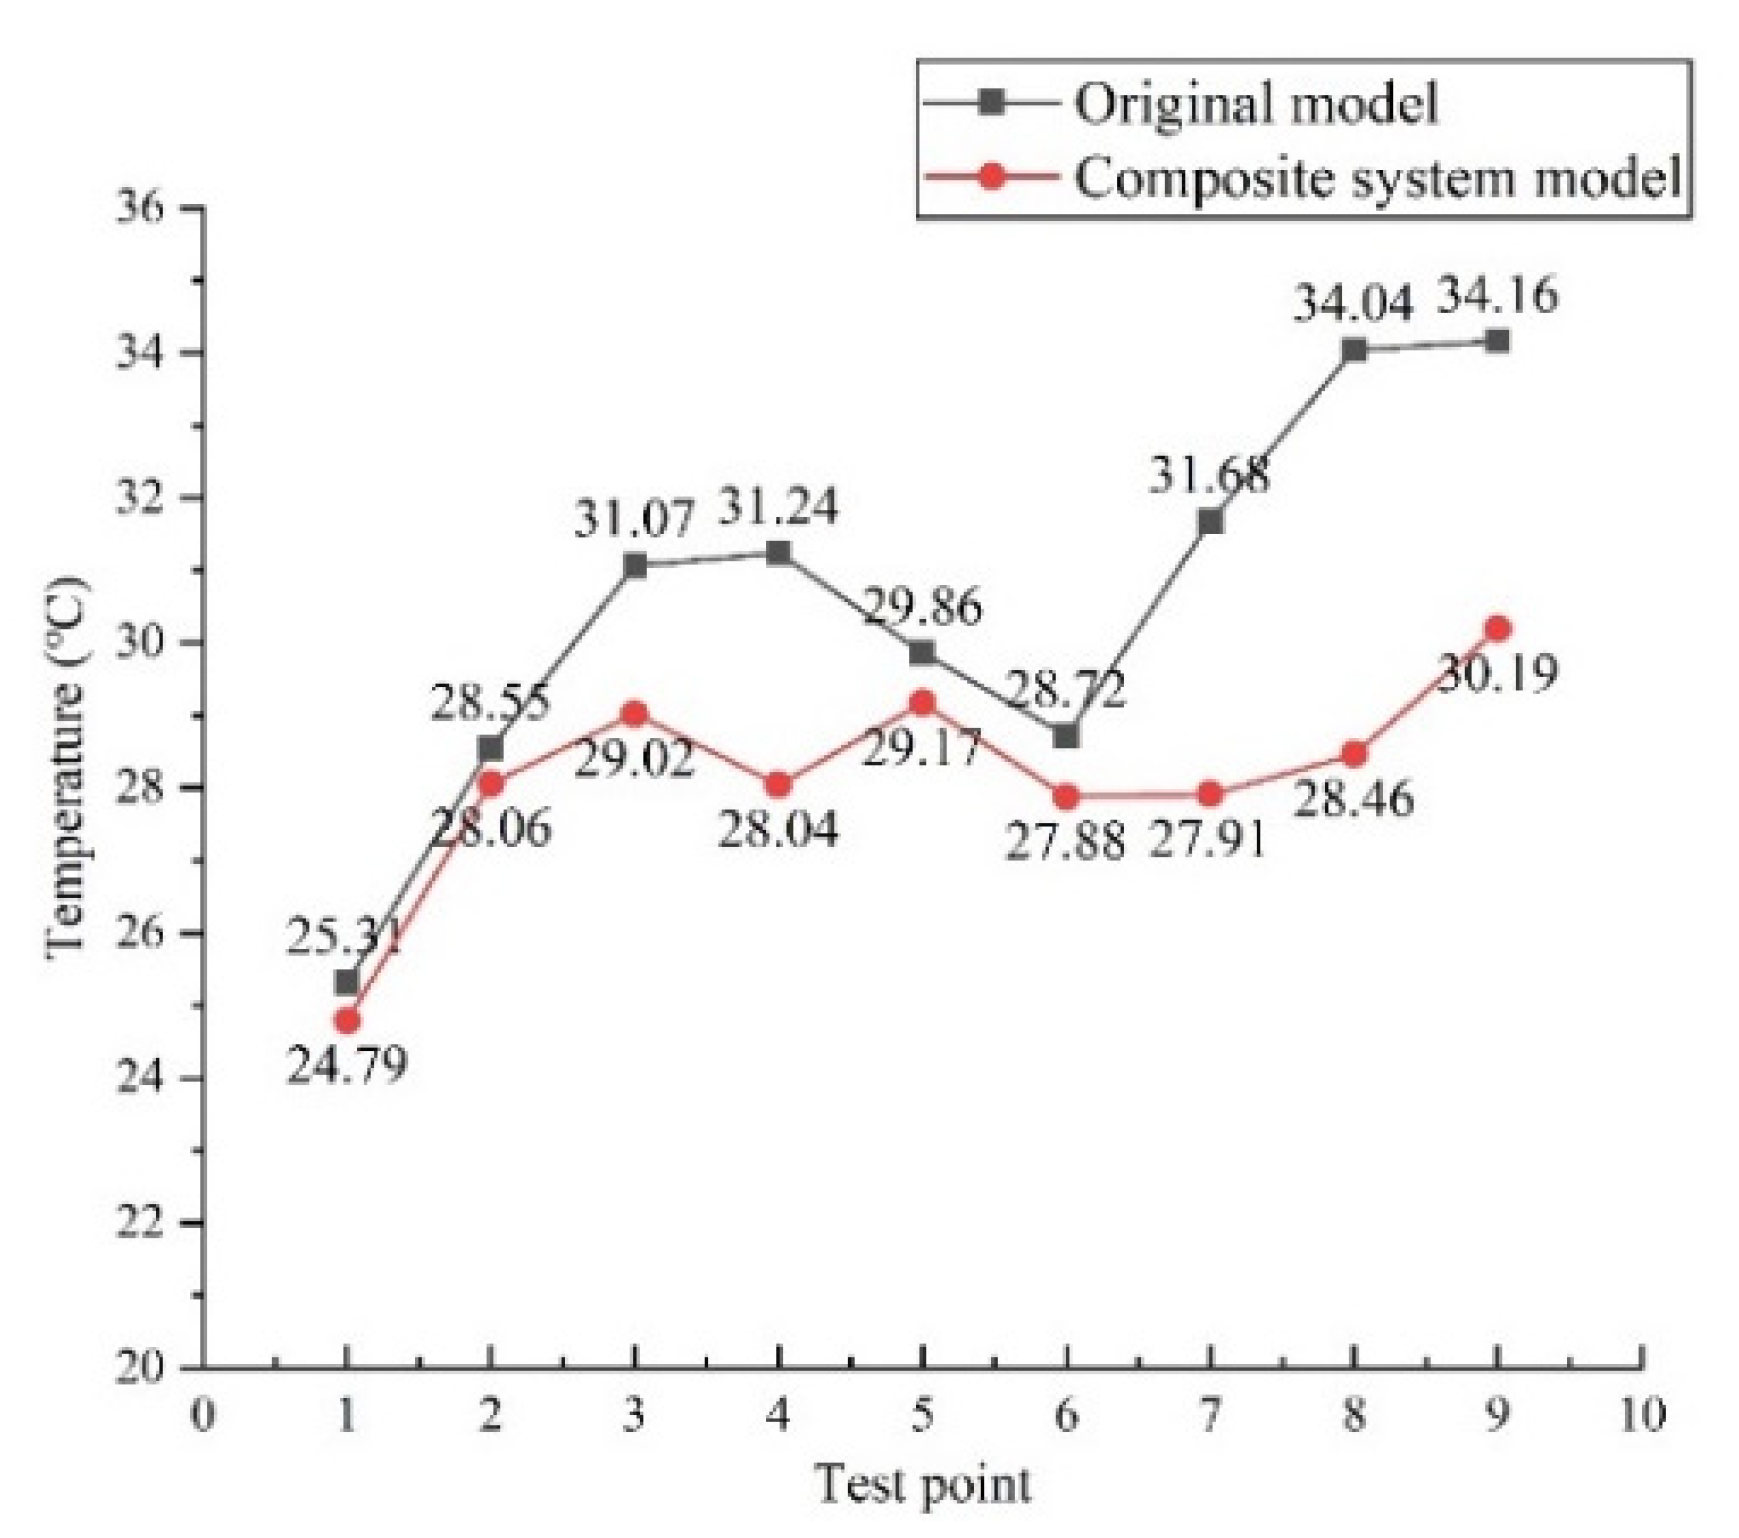
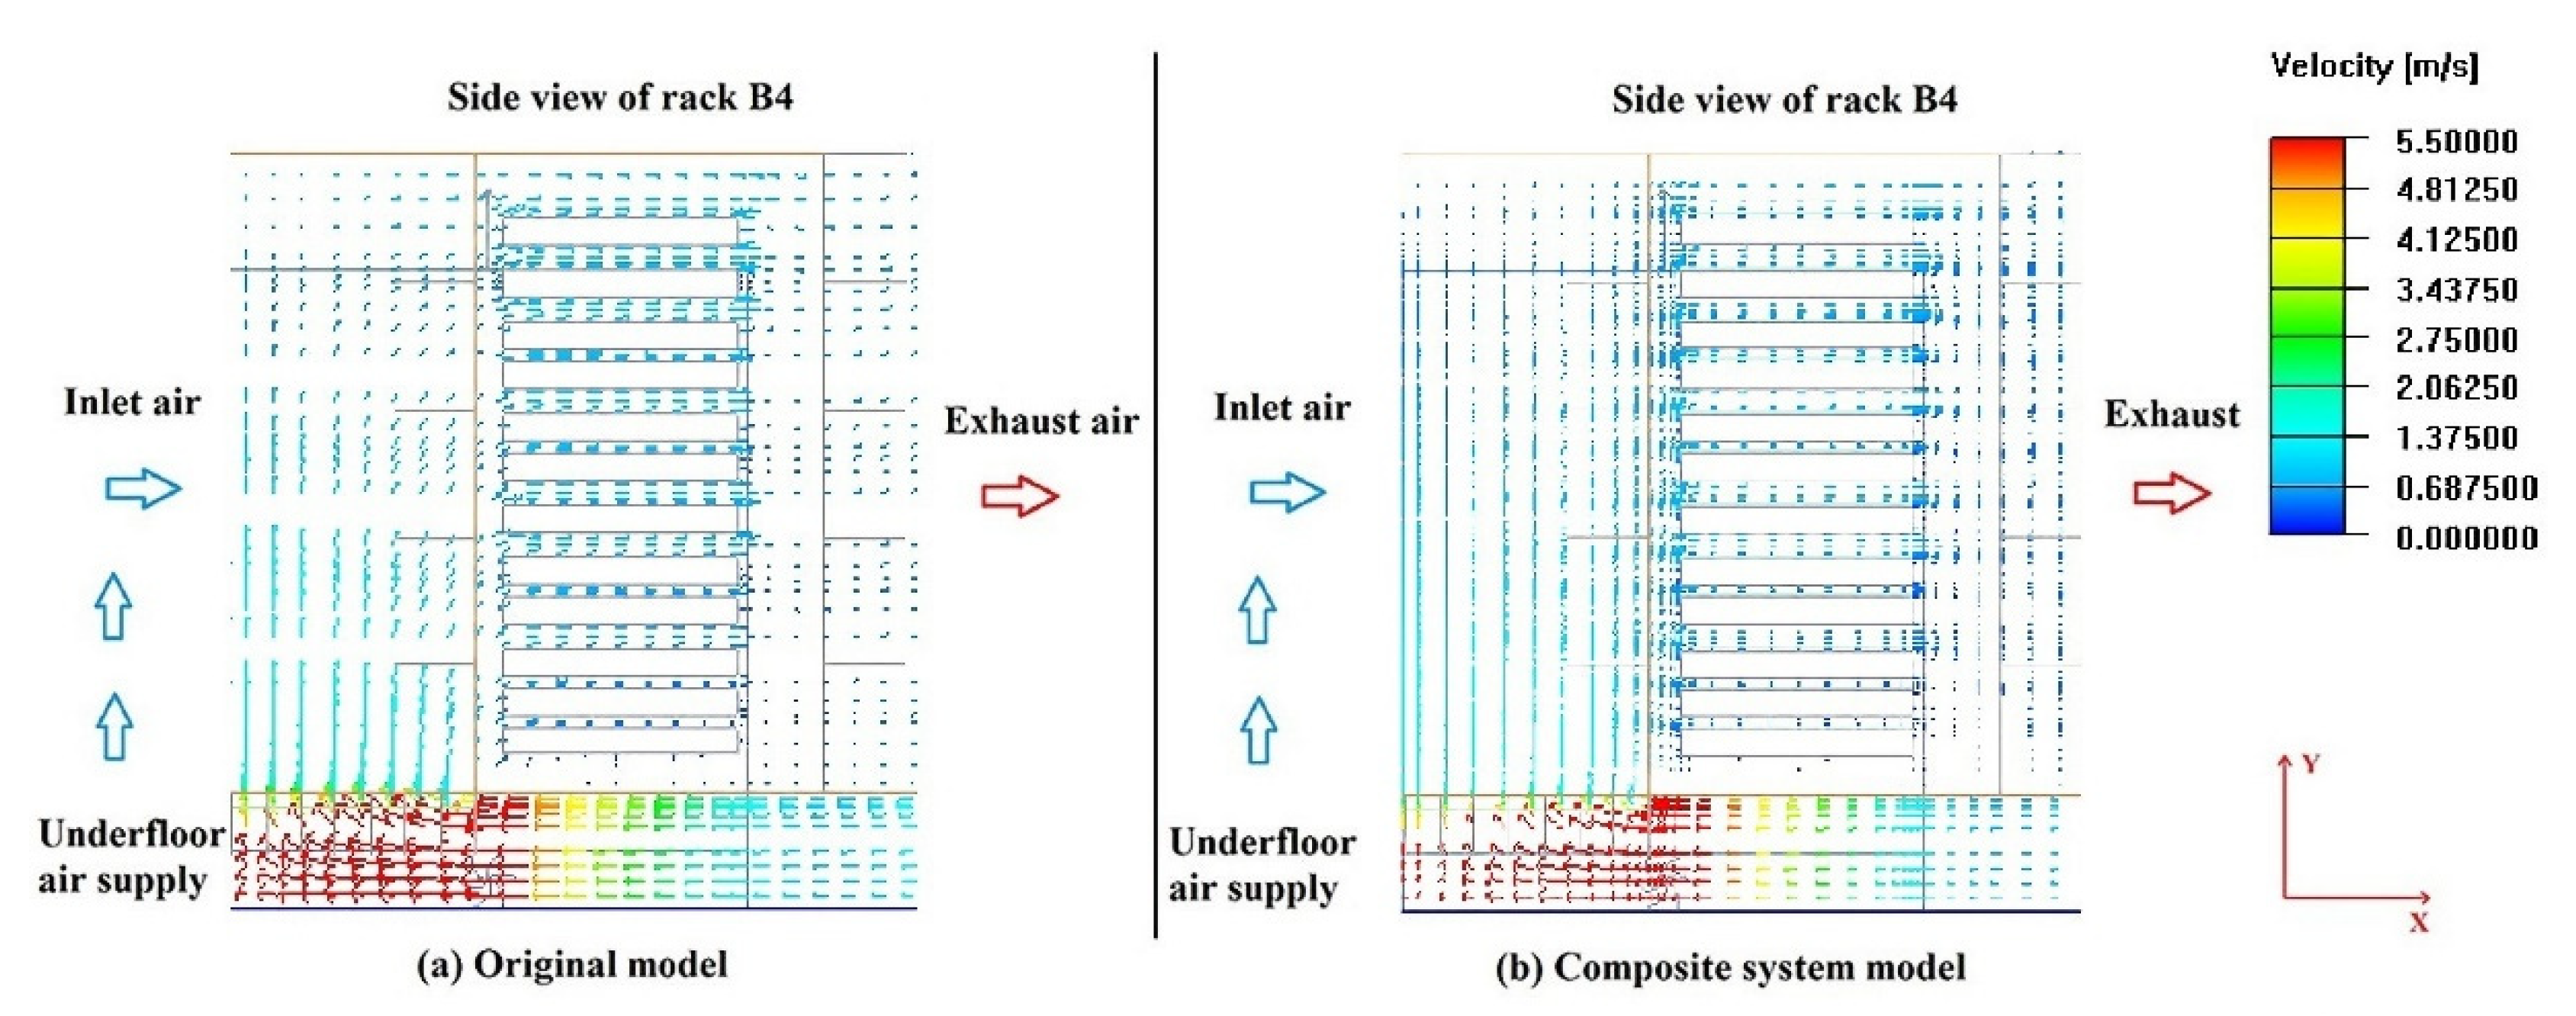
3.2. Comparison of Composite and Standard Cooling System
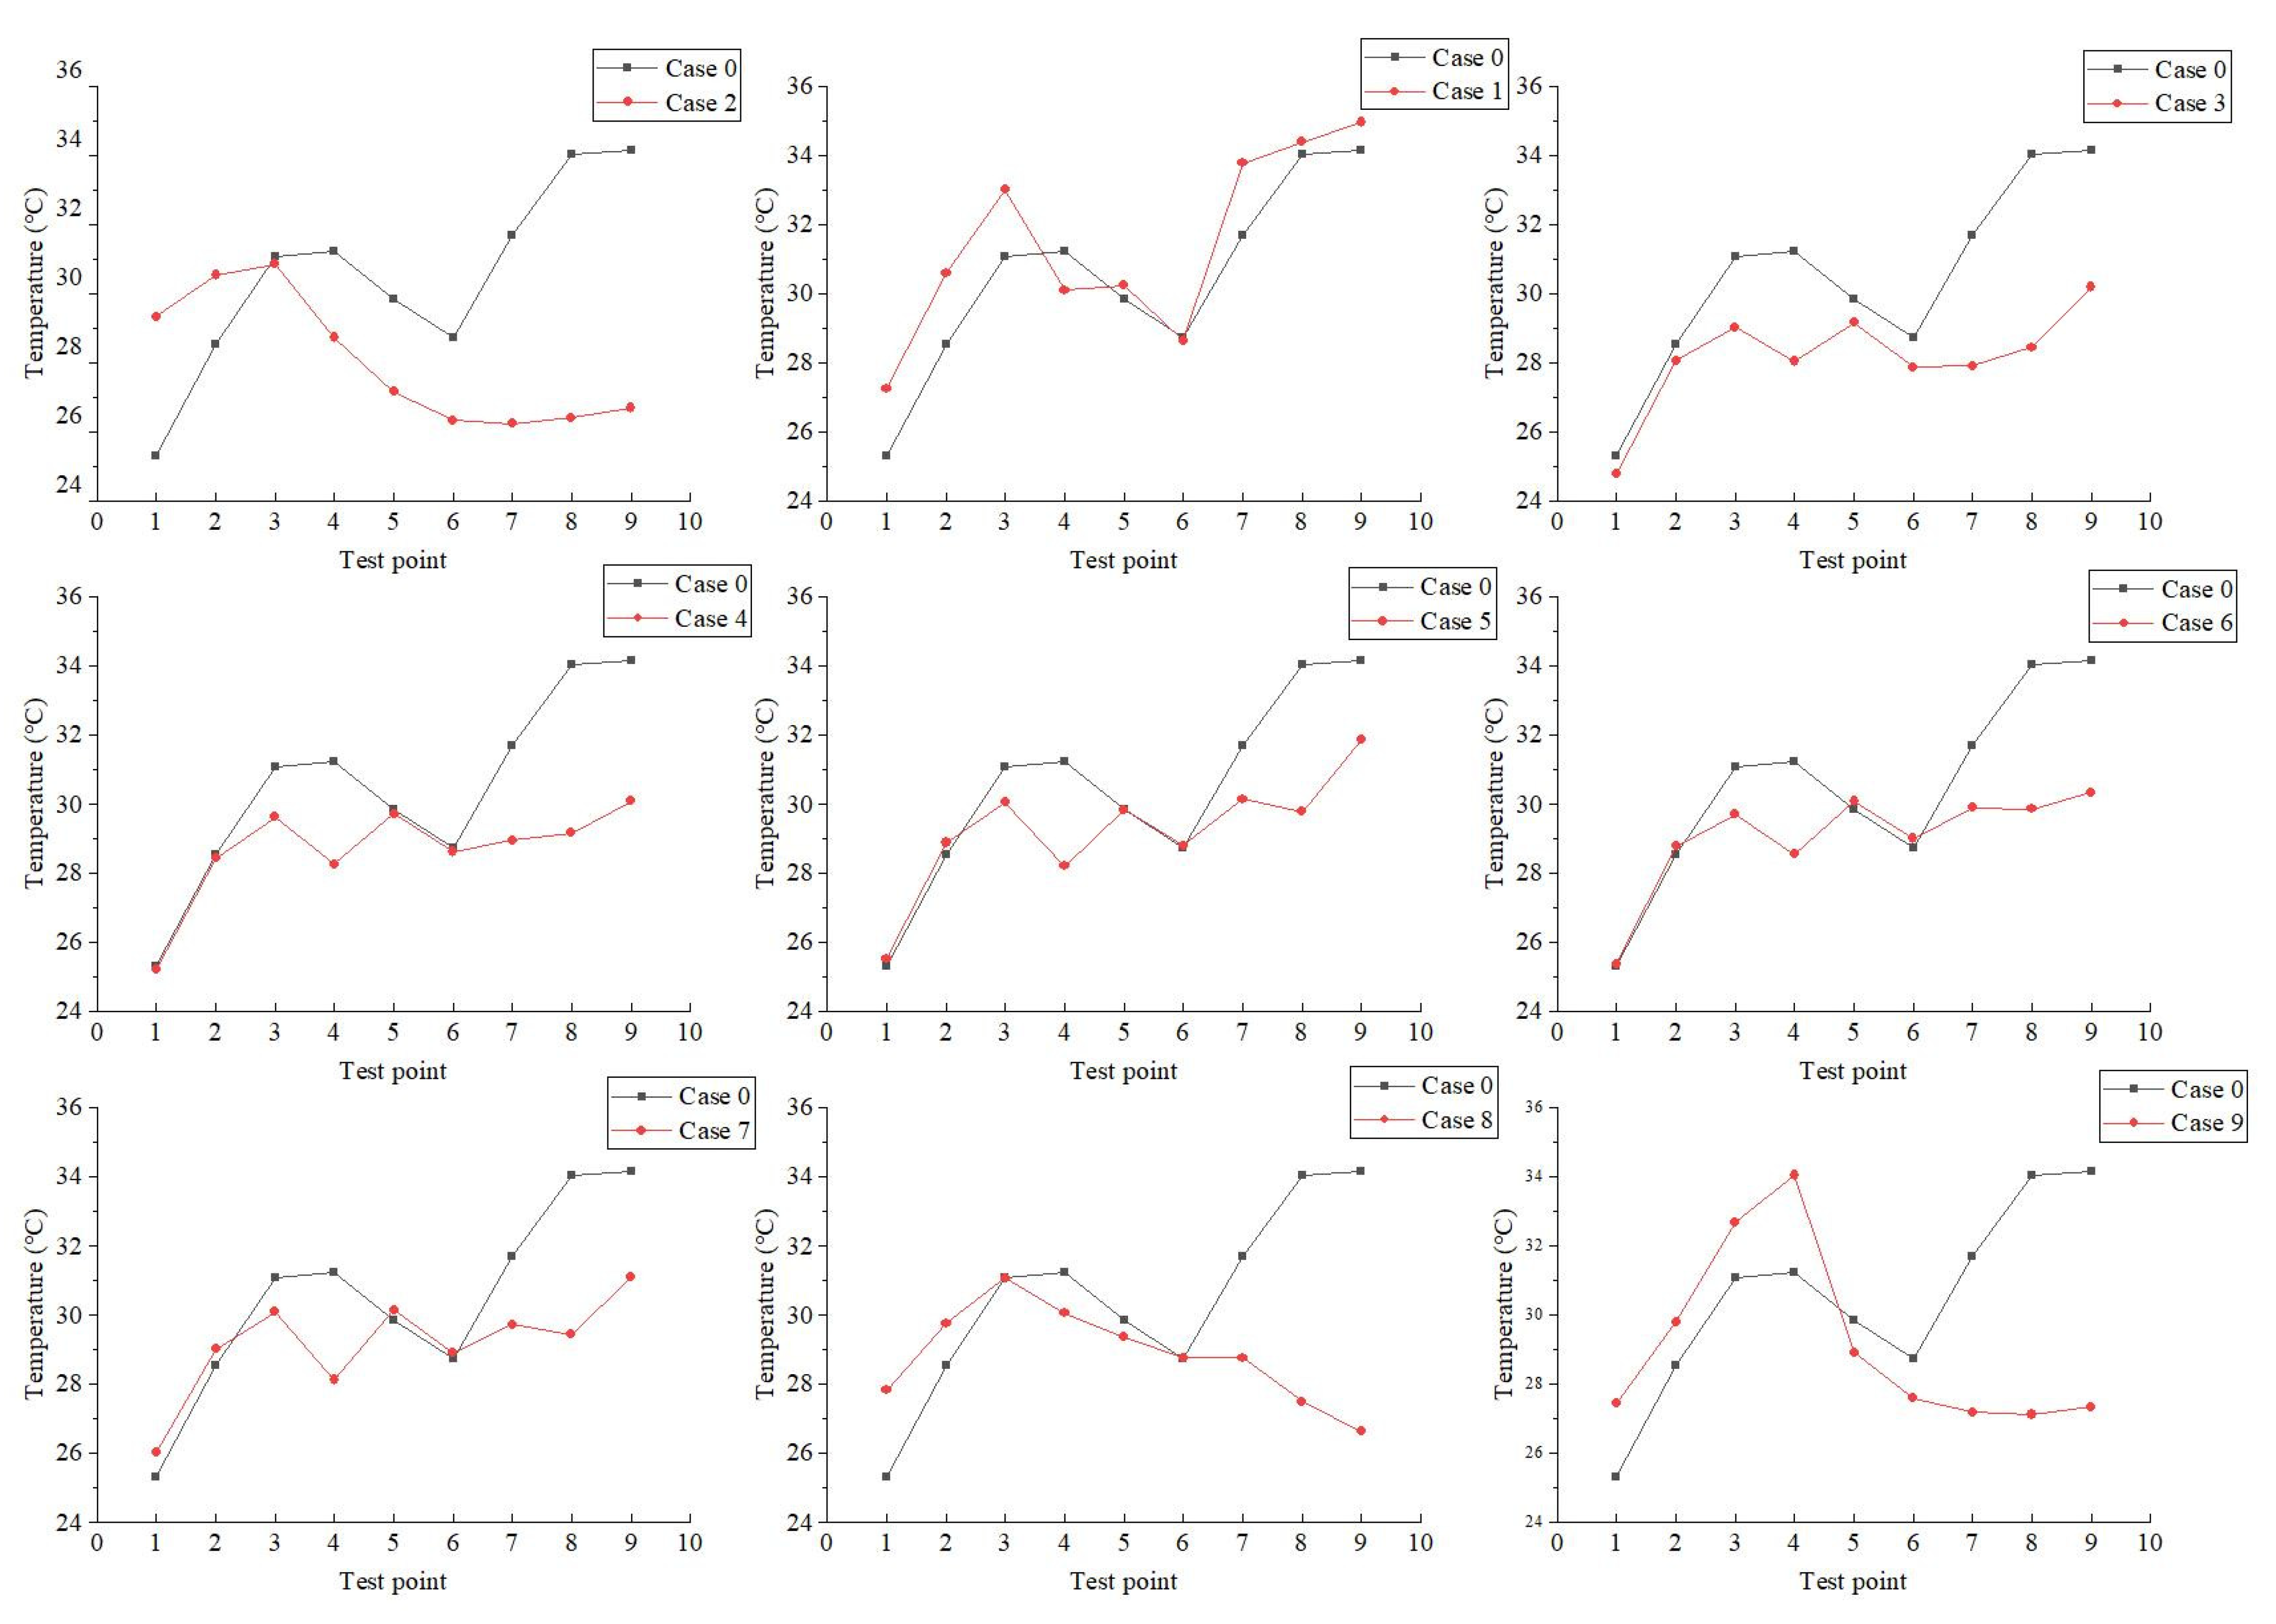
3.3. The Effect of Installation Distance on Performance
4. Composite System with HPEs Installed under the Server
4.1. Model Establishment of the System with a Heat Exchanger Installed under the Server
4.2. Analysis of under Server Simulation
4.3. Comparison of above and below Installation
4.4. Discussion and Further Work
5. Conclusions
- (1)
- Installing HPEs between servers means that convective air cooling and HP cooling technology can be combined. The maximum temperature drop of rack hotspot is 3.97 °C, and the standard deviation of outlet temperature is also optimized by 1.32 °C, which can significantly improve temperature uniformity and reduce the risk of the hot spots in the rack.
- (2)
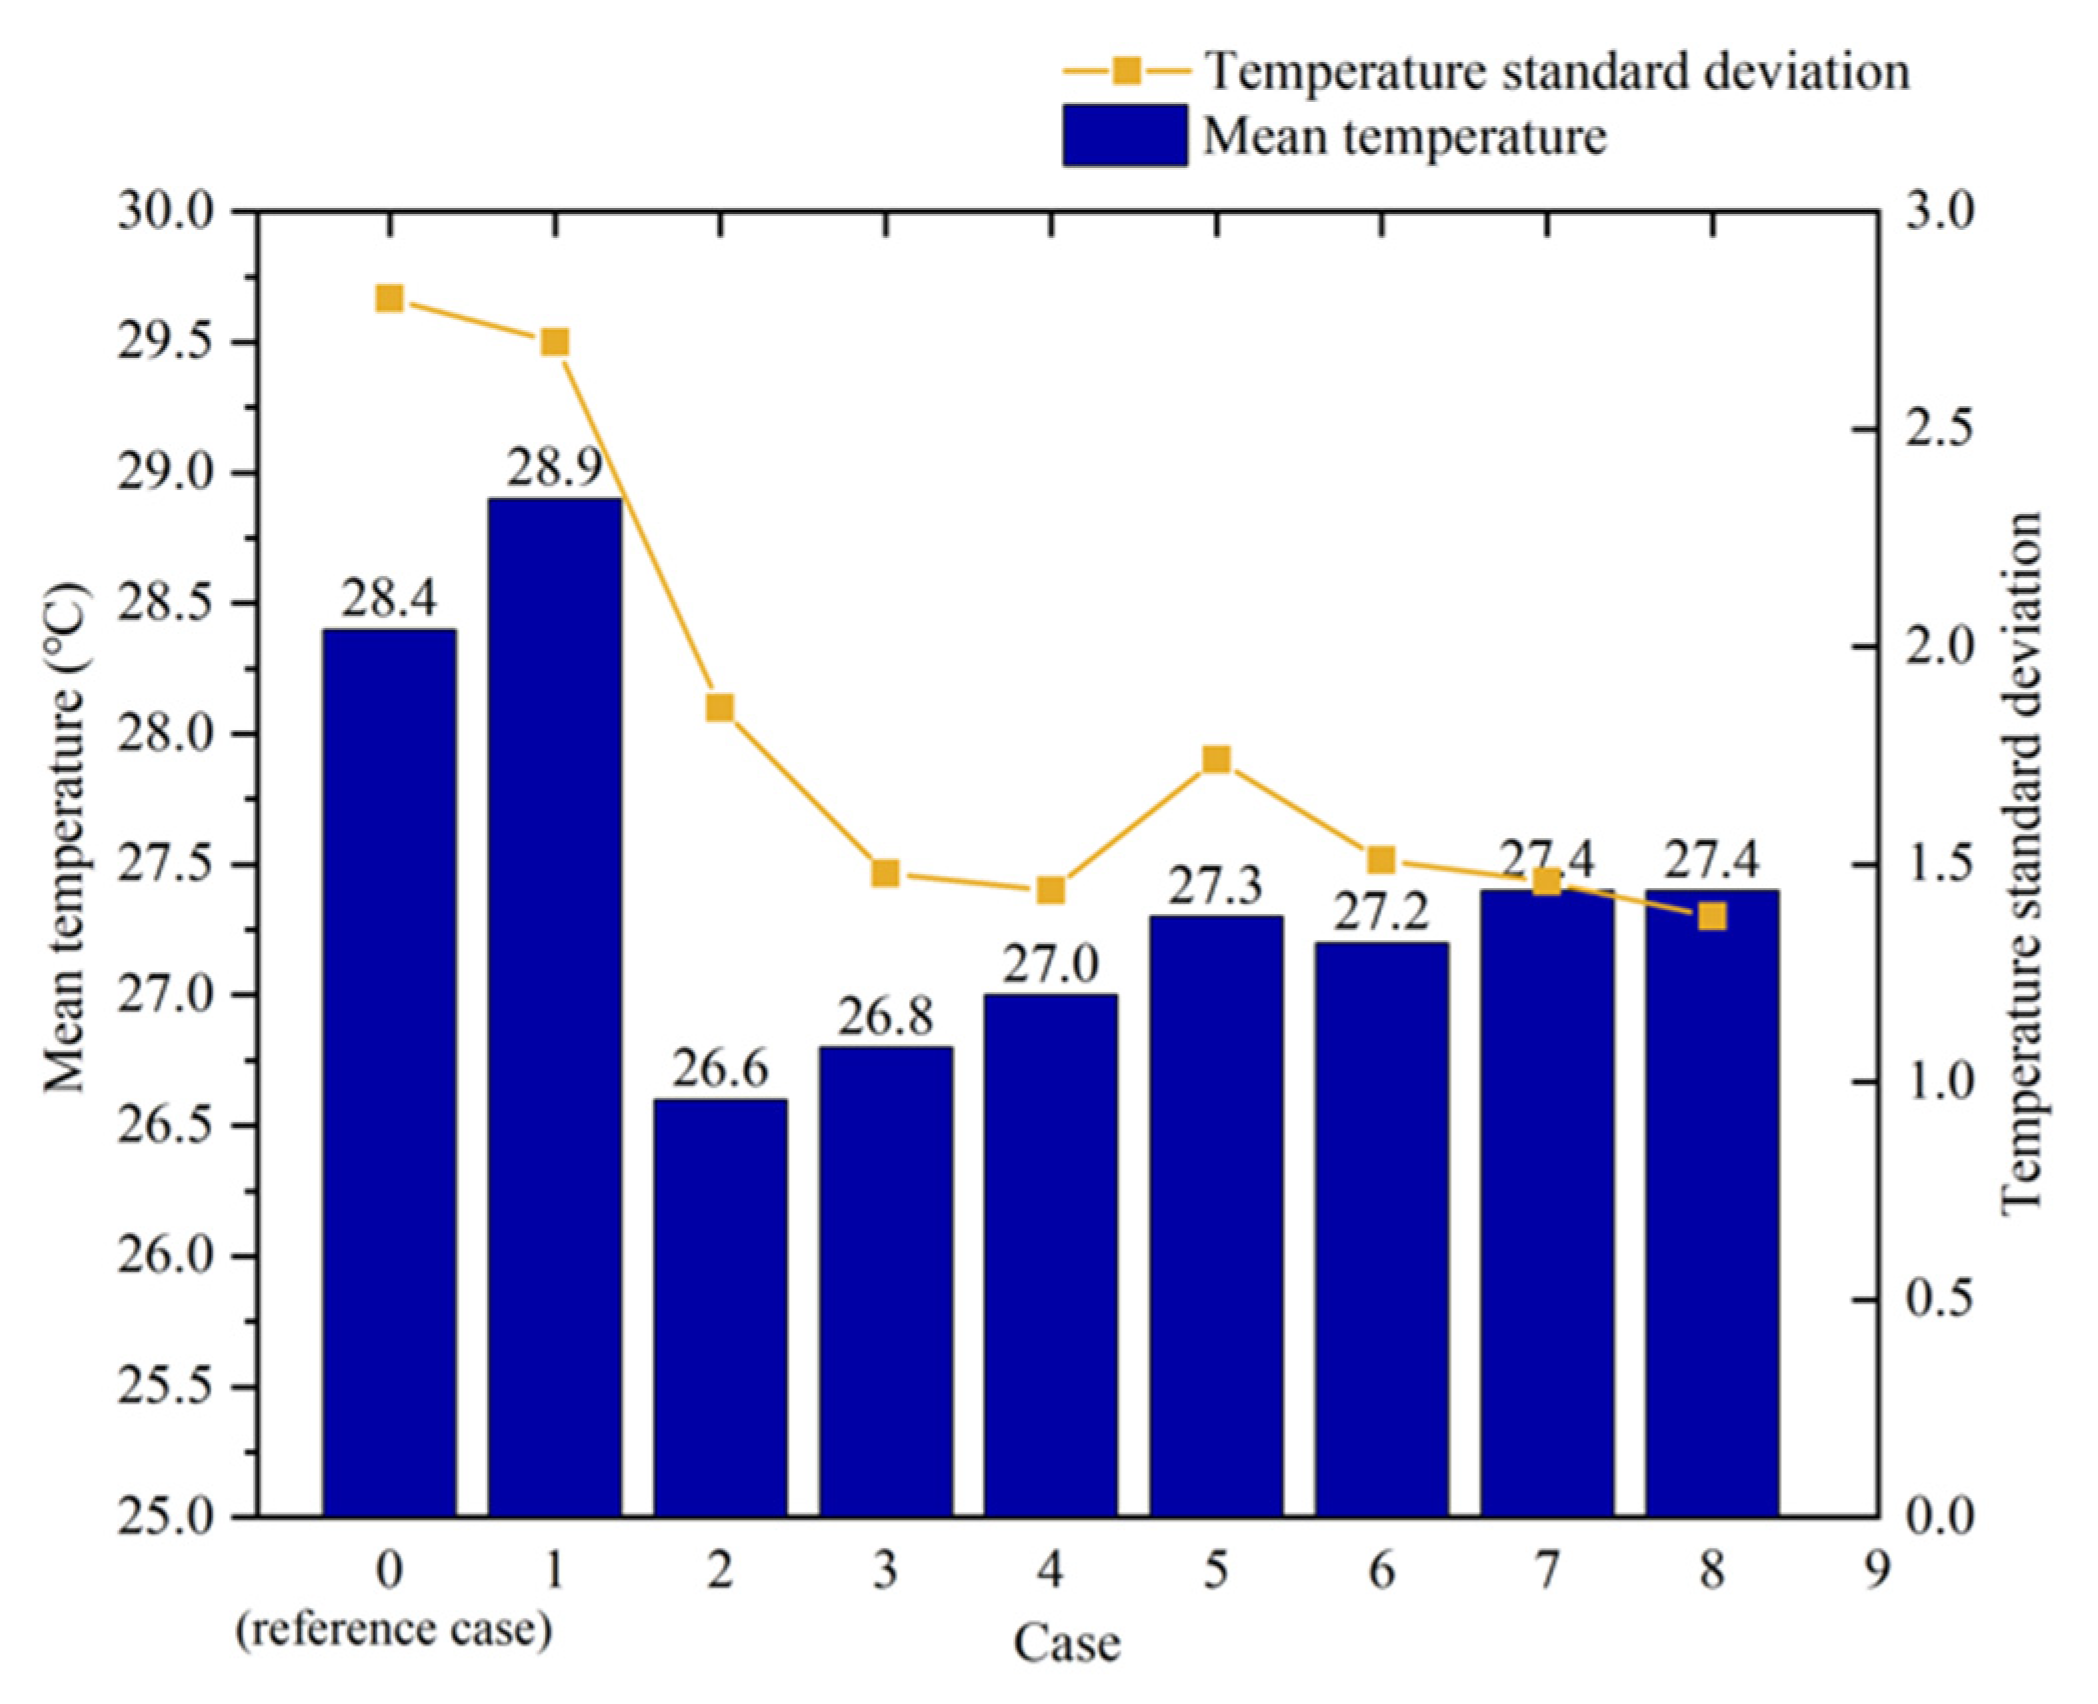
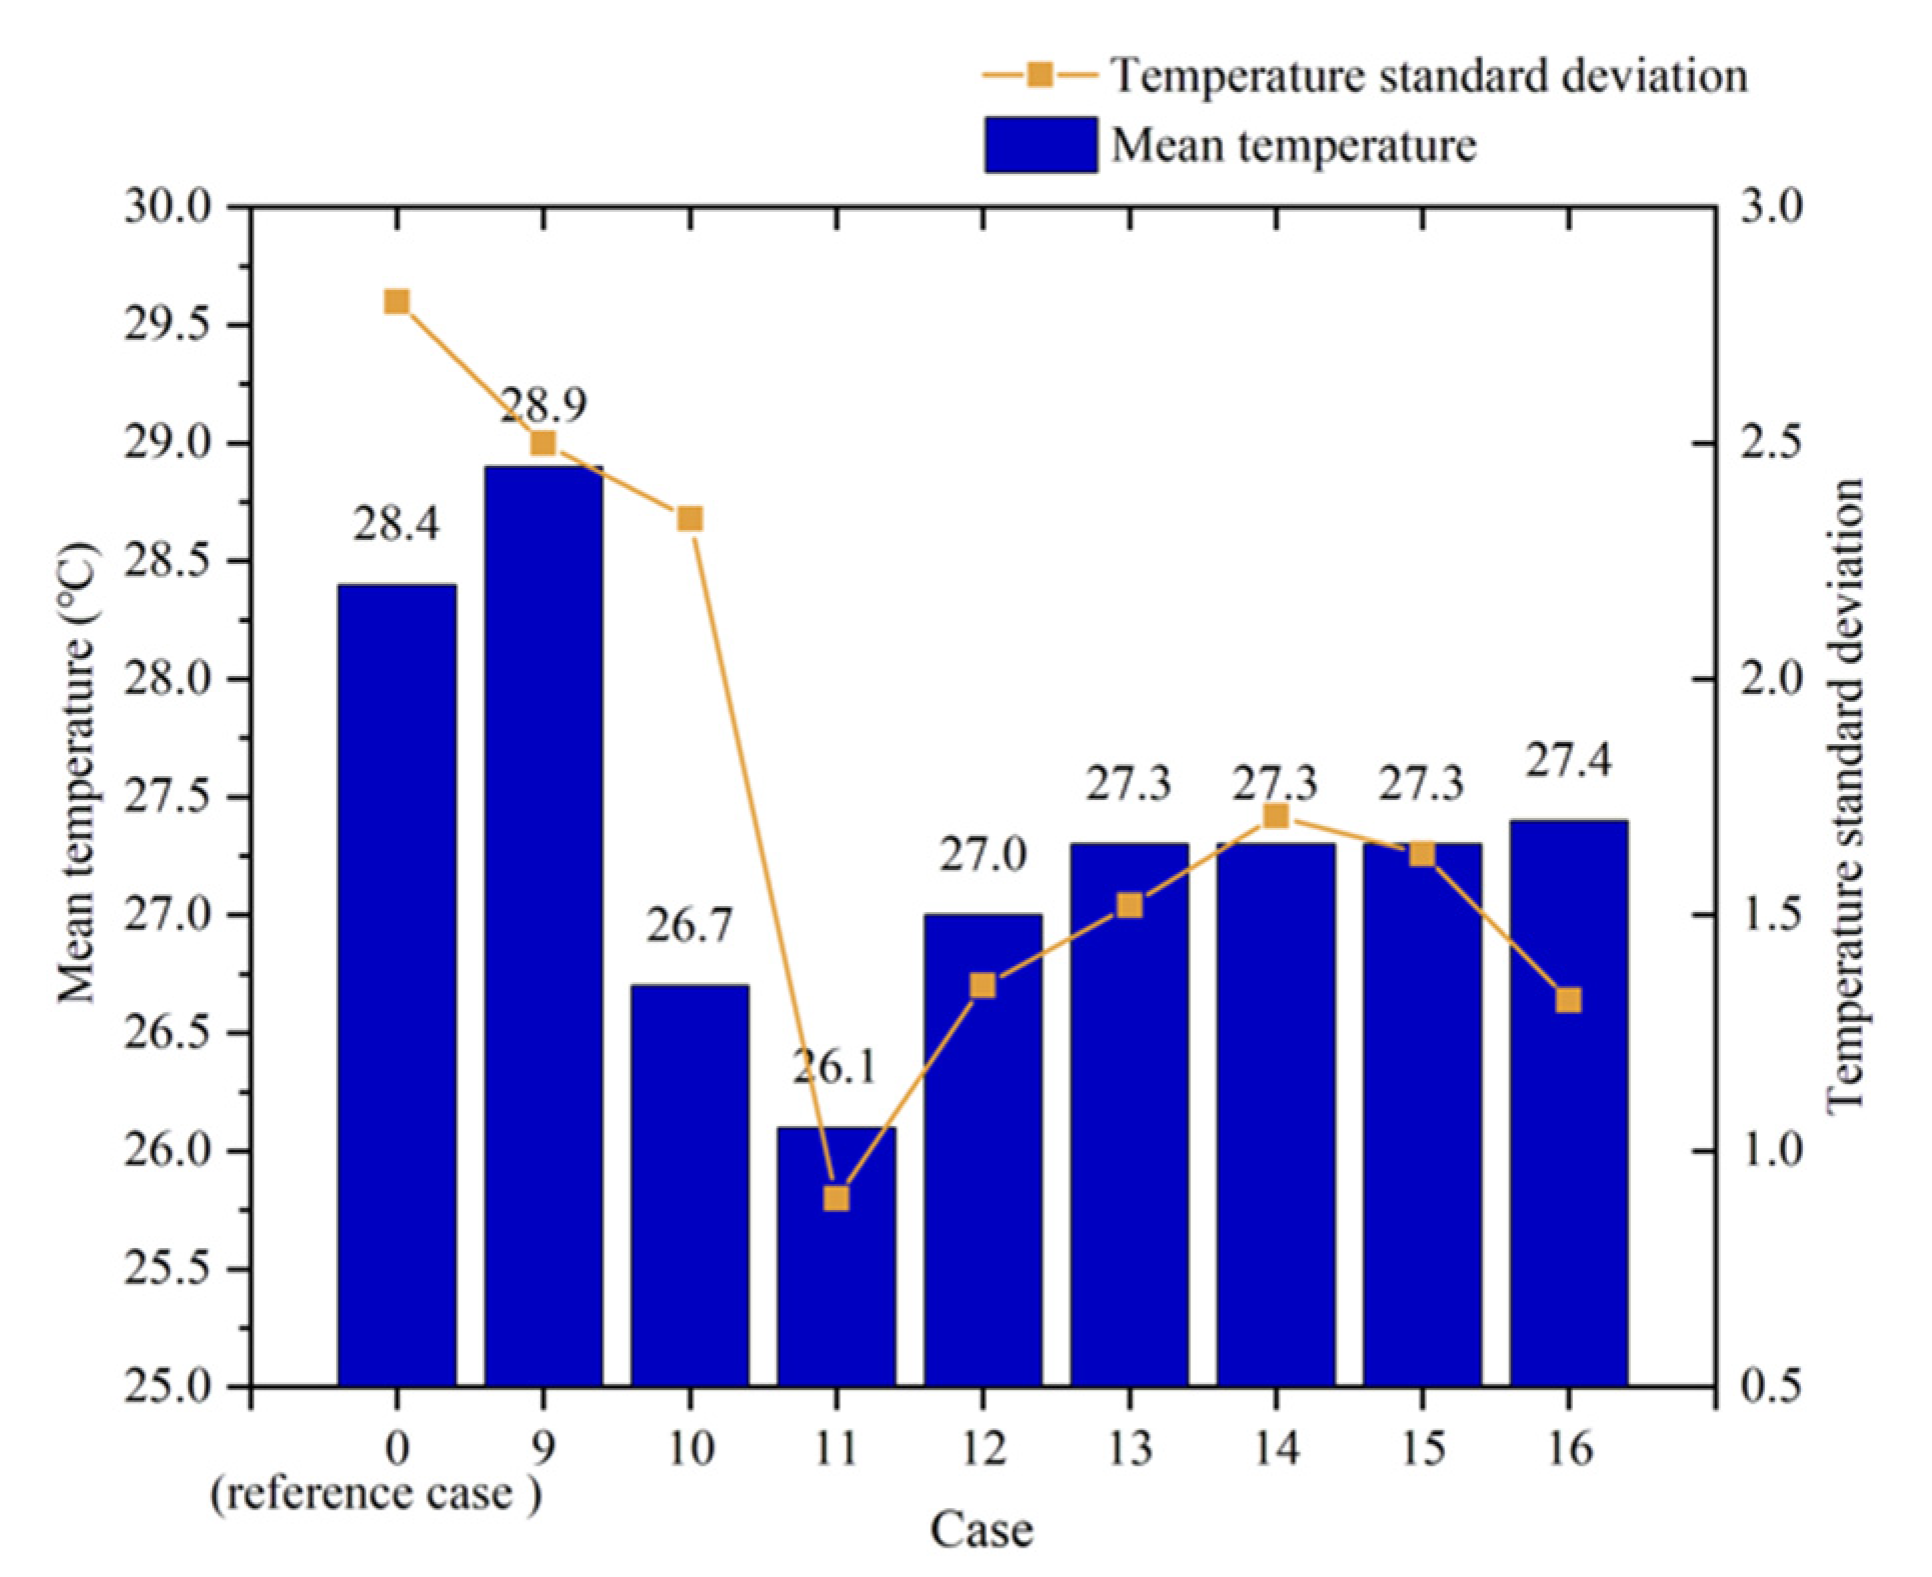
- Whether the HPEs are installed above or below the server, when the installation distance is 0.01 m, the composite system has the best performance, and the temperature of the back door is optimized to 26.8 °C and 26.1 °C.
- (3)
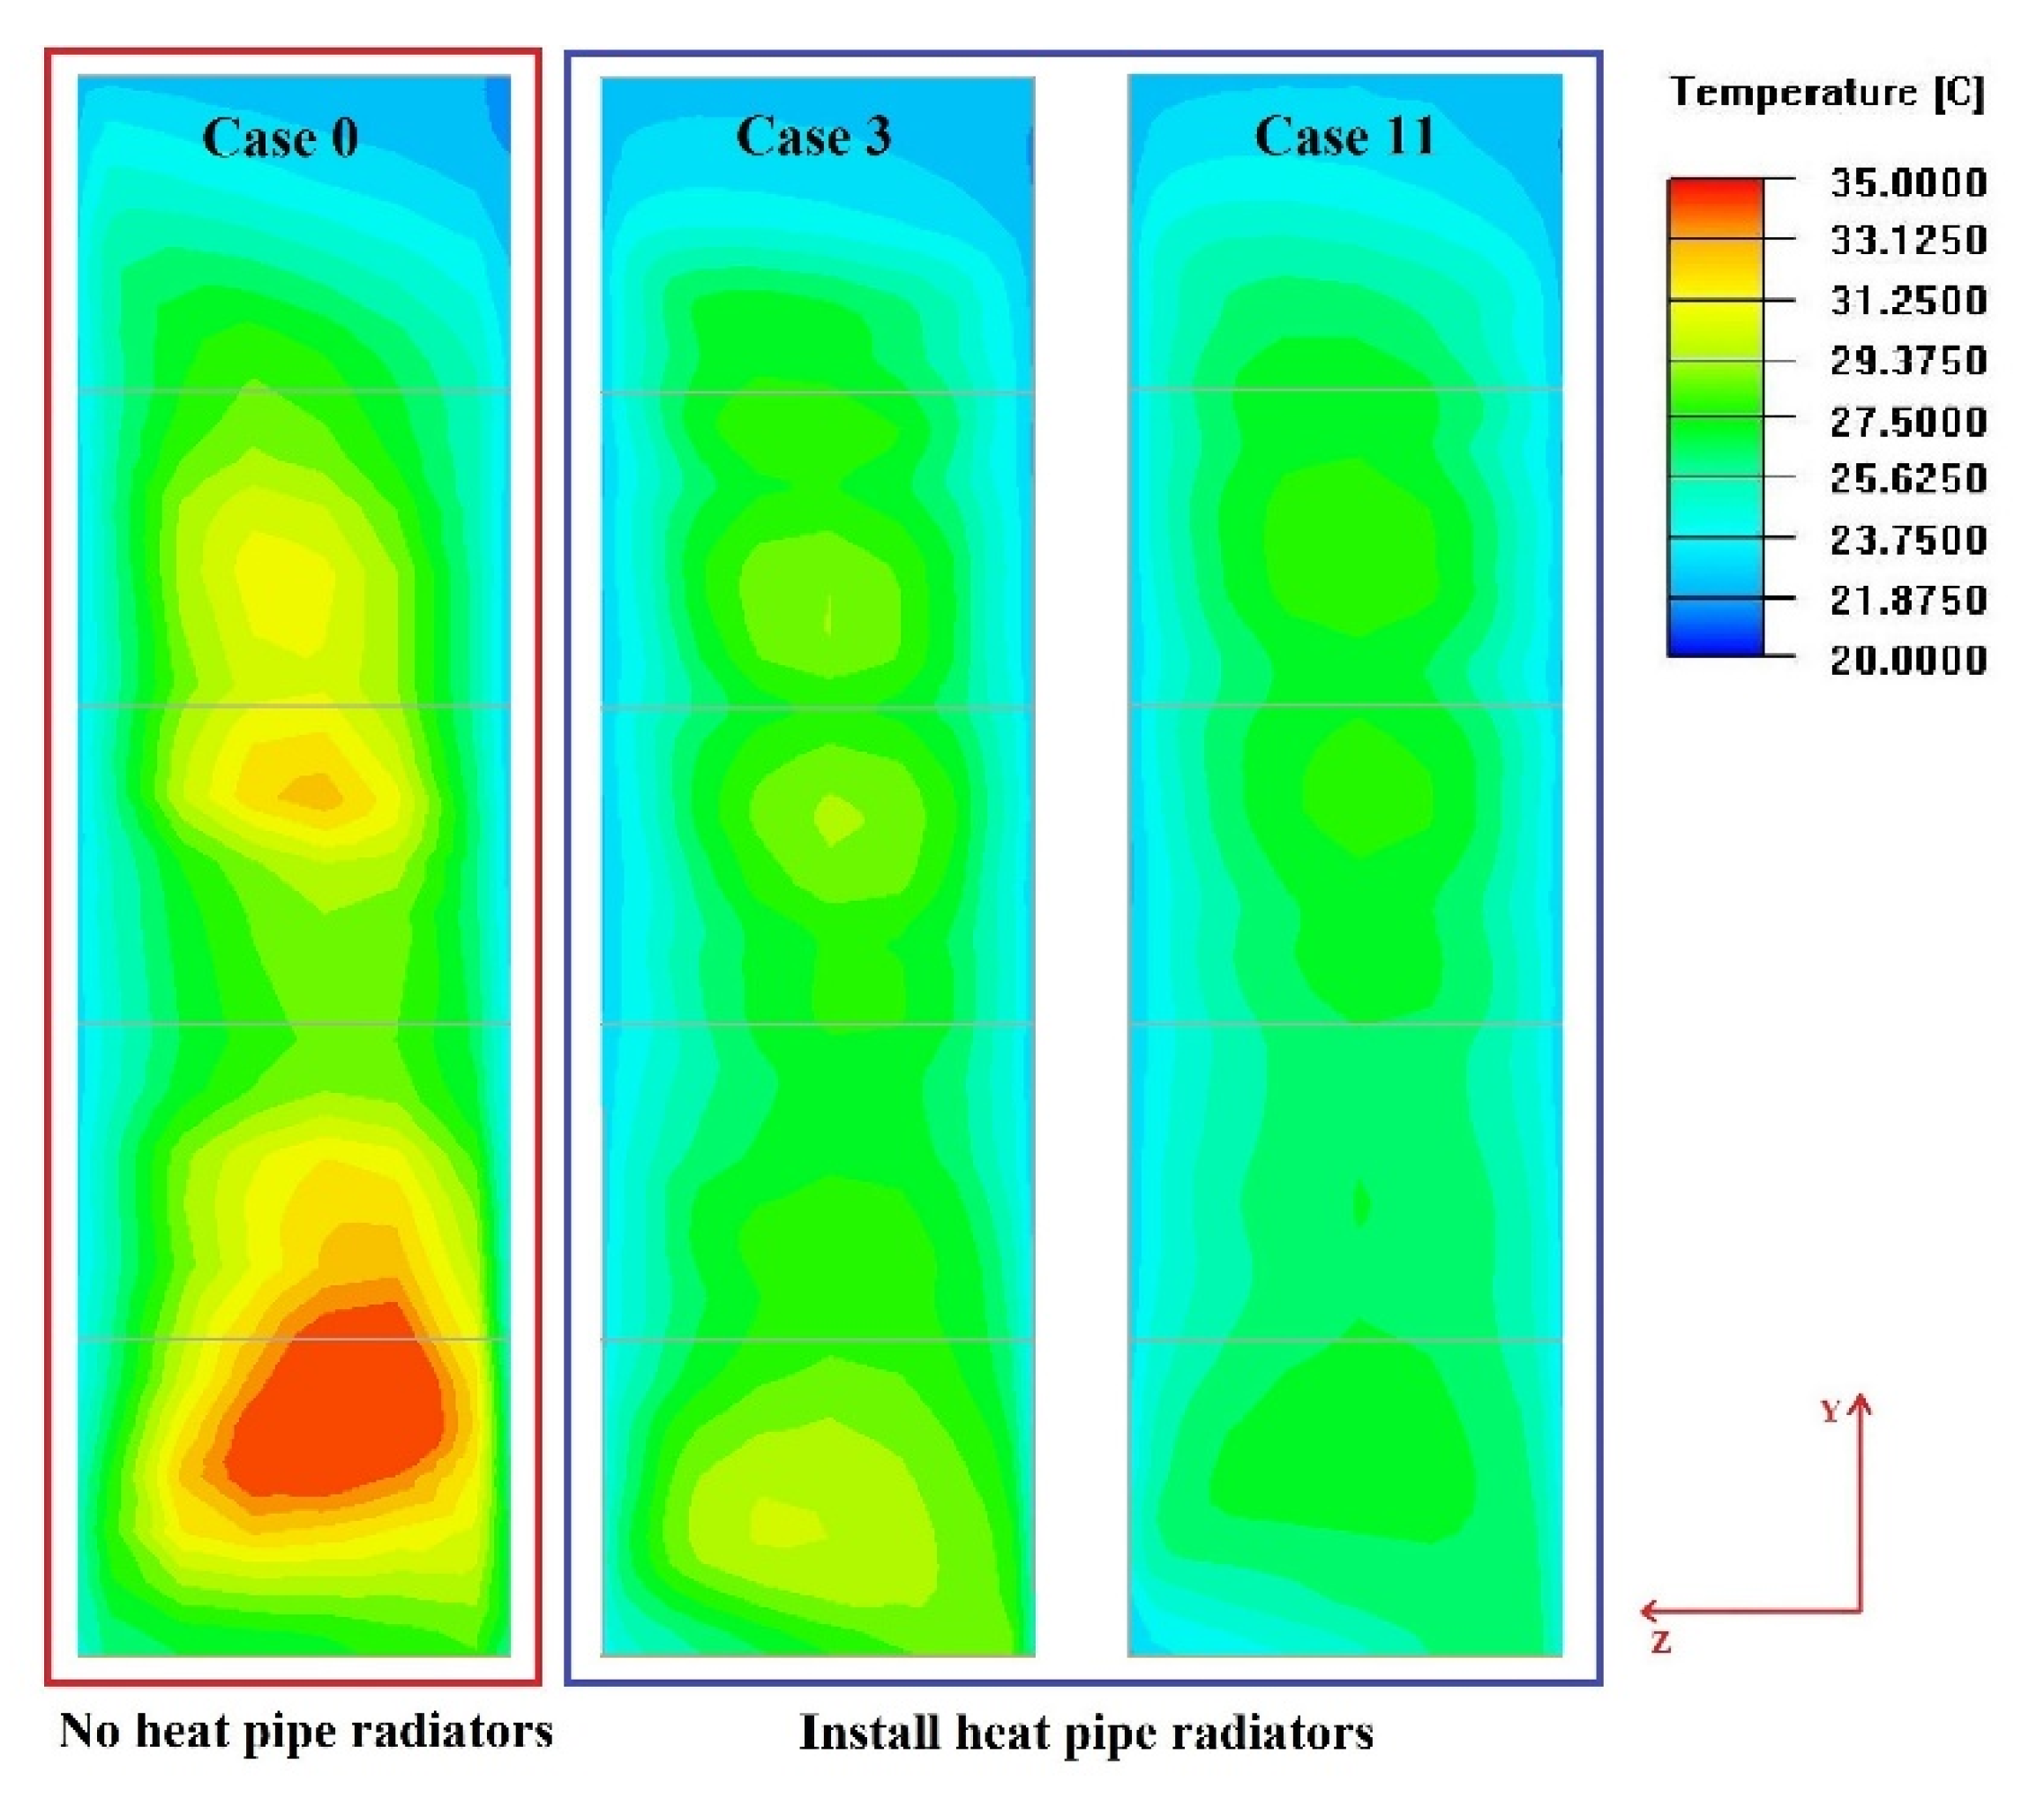
- The composite cooling system with the HPEs installed 0.01 m below the servers is the most effective way to improve the thermal environment of base room, and it greatly eliminates the heat accumulation in the rack. The hot spot temperature of the rack is reduced from 37.0 °C to 28.6 °C, and the maximum temperature drop among all recording points reached 6.8 °C.
Author Contributions
Funding
Institutional Review Board Statement
Informed Consent Statement
Data Availability Statement
Acknowledgments
Conflicts of Interest
References
- Masanet, E.; Shehabi, A.; Lei, N.; Smith, S.; Koomey, J. Recalibrating global data center energy-use estimates. Science 2020, 367, 984–986. [Google Scholar] [CrossRef] [PubMed]
- Dai, J.; Ohadi, M.M.; Das, D.; Pecht, M.G. Optimum Cooling of Data Centers; Springer: New York, NY, USA, 2016. [Google Scholar] [CrossRef]
- Dayarathna, M.; Wen, Y.; Fan, R. Data Center Energy Consumption Modeling: A Survey. IEEE Commun. Surv. Tutor. 2016, 18, 732–794. [Google Scholar] [CrossRef]
- Jin, C.; Bai, X.; Yang, C.; Mao, W.; Xu, X. A review of power consumption models of servers in data centers. Appl. Energy 2020, 265, 114806. [Google Scholar] [CrossRef]
- Gelenbe, E.; Caseau, Y. The impact of information technology on energy consumption and carbon emissions. Ubiquity 2015, 2015, 1–15. [Google Scholar] [CrossRef] [Green Version]
- Belkhir, L.; Elmeligi, A. Assessing ICT global emissions footprint: Trends to 2040 & recommendations. J. Clean. Prod. 2018, 177, 448–463. [Google Scholar] [CrossRef]
- Whitney, J.; Delforge, P. Data Center Efficiency Assessment; Natural Resources Defense Council: New York, NY, USA, 2014. [Google Scholar]
- Song, Z.; Zhang, X.; Eriksson, C. Data Center Energy and Cost Saving Evaluation. Energy Procedia 2015, 75, 1255–1260. [Google Scholar] [CrossRef] [Green Version]
- Khalaj, A.H.; Halgamuge, S.K. A Review on efficient thermal management of air- and liquid-cooled data centers: From chip to the cooling system. Appl. Energy 2017, 205, 1165–1188. [Google Scholar] [CrossRef]
- Gong, X.; Zhang, Z.; Gan, S.; Niu, B.; Yang, L.; Xu, H.; Gao, M. A review on evaluation metrics of thermal performance in data centers. Build. Environ. 2020, 177, 106907. [Google Scholar] [CrossRef]
- Ni, J.; Bai, X. A review of air conditioning energy performance in data centers. Renew. Sustain. Energy Rev. 2017, 67, 625–640. [Google Scholar] [CrossRef]
- Zhang, H.; Shao, S.; Xu, H.; Zou, H.; Tian, C. Free cooling of data centers: A review. Renew. Sustain. Energy Rev. 2014, 35, 171–182. [Google Scholar] [CrossRef]
- Rambo, J.; Joshi, Y. Convective Transport Processes in Data Centers. Numer. Heat Transf. Part A Appl. 2006, 49, 923–945. [Google Scholar] [CrossRef]
- Yuan, X.; Zhou, X.; Liu, J.; Wang, Y.; Kosonen, R.; Xu, X. Experimental and numerical investigation of an airflow management system in data center with lower-side terminal baffles for servers. Build. Environ. 2019, 155, 308–319. [Google Scholar] [CrossRef]
- Ni, J.; Jin, B.; Ning, S.; Wang, X. The Numerical Simulation of the Airflow Distribution and Energy Efficiency in Data Centers with Three Types of Aisle Layout. Sustainability 2019, 11, 4937. [Google Scholar] [CrossRef] [Green Version]
- Yuan, X.; Xu, X.; Liu, J.; Pan, Y.; Kosonen, R.; Gao, Y. Improvement in airflow and temperature distribution with an in-rack UFAD system at a high-density data center. Build. Environ. 2020, 168, 106495. [Google Scholar] [CrossRef]
- Zhou, X.; Yuan, X.; Xu, X.; Liu, J.; Kosonen, R.; Liu, C. Research on the thermal performance of rack-level composite baffle diversion system for data centre. Energy Effic. 2020, 13, 1245–1262. [Google Scholar] [CrossRef]
- Ahmadi, V.E.; Erden, H.S. A parametric CFD study of computer room air handling bypass in air-cooled data centers. Appl. Therm. Eng. 2020, 166, 114685. [Google Scholar] [CrossRef]
- Wang, J.; Zhang, Q.; Yoon, S.; Yu, Y. Reliability and availability analysis of a hybrid cooling system with water-side economizer in data center. Build. Environ. 2019, 148, 405–416. [Google Scholar] [CrossRef]
- Cheung, H.; Wang, S. Reliability and availability assessment and enhancement of water-cooled multi-chiller cooling systems for data centers. Reliab. Eng. Syst. Saf. 2019, 191, 106573. [Google Scholar] [CrossRef]
- Chen, H.; Peng, Y.-H.; Wang, Y.-L. Thermodynamic analysis of hybrid cooling system integrated with waste heat reusing and peak load shifting for data center. Energy Convers. Manag. 2019, 183, 427–439. [Google Scholar] [CrossRef]
- Wu, C.; Tong, W.; Kanbur, B.; Duan, F. Full-scale Two-phase Liquid Immersion Cooing Data Center System in Tropical Environment. In Proceedings of the 2019 18th IEEE Intersociety Conference on Thermal and Thermomechanical Phenomena in Electronic Systems (ITherm), Las Vegas, NV, USA, 28–31 May 2019; pp. 703–708. [Google Scholar]
- Kheirabadi, A.C.; Groulx, D. Experimental evaluation of a thermal contact liquid cooling system for server electronics. Appl. Therm. Eng. 2018, 129, 1010–1025. [Google Scholar] [CrossRef]
- Alkharabsheh, S.; Puvvadi, U.; Ramakrishnan, B.; Ghose, K.; Sammakia, B. Failure Analysis of Direct Liquid Cooling System in Data Centers. In Proceedings of the ASME 2017 International Technical Conference and Exhibition on Packaging and Integration of Electronic and Photonic Microsystems Collocated with the ASME 2017 Conference on Information Storage and Processing Systems, San Francisco, CA, USA, 29 August–1 September 2017; p. V001T02A008. [Google Scholar]
- Zühlsdorf, B.; Jensen, J.K.; Elmegaard, B. Heat pump working fluid selection—economic and thermodynamic comparison of criteria and boundary conditions. Int. J. Refrig. 2019, 98, 500–513. [Google Scholar] [CrossRef]
- Zeng, L.; Liu, X.; Zhang, Q.; Yi, J.; Li, X.; Liu, X.; Su, H. Experimental and Simulation Study of Micro-Channel Backplane Heat Pipe Air Conditioning System in Data Center. Appl. Sci. 2020, 10, 1255. [Google Scholar] [CrossRef] [Green Version]
- Ding, T.; He, Z.G.; Hao, T.; Li, Z. Application of separated heat pipe system in data center cooling. Appl. Therm. Eng. 2016, 109, 207–216. [Google Scholar] [CrossRef]
- Garimella, S.V.; Persoons, T.; Weibel, J.A.; Gektin, V. Electronics Thermal Management in Information and Communications Technologies: Challenges and Future Directions. IEEE Trans. Compon. Packag. Manuf. Technol. 2016, 7, 1191–1205. [Google Scholar] [CrossRef] [Green Version]
- Okazaki, T.; Sumida, Y.; Matsushita, A. Development of Vapor Compression Refrigeration Cycle with a Natural-Circulation Loop; Mitsubishi Electric Corp.: Shizuoka, Japan, 1999. [Google Scholar]
- Okazaki, T.; Seshimo, Y. Cooling system using natural circulation for air conditioning. Trans. Jpn. Soc. Refrig. Air Cond. Eng. 2011, 25, 239–251. [Google Scholar]
- Tian, H.; Li, Z.; Liu, X. Application study of data center heat pipe air conditioning system. Build Sci. 2010, 10, 141–145. (In Chinese) [Google Scholar]
- Ling, L.; Zhang, Q.; Yu, Y.; Wu, Y.; Liao, S. Study on thermal performance of micro-channel separate heat pipe for telecommunication stations: Experiment and simulation. Int. J. Refrig. 2015, 59, 198–209. [Google Scholar] [CrossRef]
- Zhang, H.; Shao, S.; Xu, H.; Zou, H.; Tian, C. Integrated system of mechanical refrigeration and thermosyphon for free cooling of data centers. Appl. Therm. Eng. 2015, 75, 185–192. [Google Scholar] [CrossRef]
- Zhou, F.; Li, C.; Zhu, W.; Zhou, J.; Ma, G.; Liu, Z. Energy-saving analysis of a case data center with a pump-driven loop heat pipe system in different climate regions in China. Energy Build. 2018, 169, 295–304. [Google Scholar] [CrossRef]
- Mulay, V. Analysis of Data Center Cooling Strategies and the Impact of the Dynamic Thermal Management on the Data Center Efficiency, Mechanical Engineering; University of Texas at Arlington: Arlington, TX, USA, 2010. [Google Scholar]
- Alkharabsheh, S.; Fernandes, J.; Gebrehiwot, B.; Agonafer, D.; Ghose, K.; Ortega, A.; Joshi, Y.; Sammakia, B. A Brief Overview of Recent Developments in Thermal Management in Data Centers. J. Electron. Packag. 2015, 137, 040801. [Google Scholar] [CrossRef]
- Song, Z. Thermal performance of a contained data center with fan-assisted perforations. Appl. Therm. Eng. 2006, 102, 1175–1184. [Google Scholar] [CrossRef]
- Cruz, E.; Joshi, Y. Coupled inviscid-viscous solution method for bounded domains: Application to data-center thermal management. Int. J. Heat Mass Transf. 2015, 85, 181–194. [Google Scholar] [CrossRef]
- Priyadumkol, J.; Kittichaikarn, C. Application of the combined air-conditioning systems for energy conservation in data center. Energy Build. 2014, 68, 580–586. [Google Scholar] [CrossRef]
- Almoli, A.; Thompson, A.; Kapur, N.; Summers, J.; Thompson, H.; Hannah, G. Computational fluid dynamic investigation of liquid rack cooling in data centres. Appl. Energy 2012, 89, 150–155. [Google Scholar] [CrossRef]
- Jin, C.; Bai, X.; Yang, C. Effects of airflow on the thermal environment and energy efficiency in raised-floor data centers: A review. Sci. Total Environ. 2019, 695, 133801. [Google Scholar] [CrossRef]
- Phan, L.; Hu, B.; Lin, C.-X. An evaluation of turbulence and tile models at server rack level for data centers. Build. Environ. 2019, 155, 421–435. [Google Scholar] [CrossRef]
- Wang, F. Computational Fluid Dynamics Analysis: The Principle and Application of CFD Software; Tsinghua University Press: Beijing, China, 2004. [Google Scholar]
- Zhang, K.; Zhang, X.; Li, S.; Wang, G. Numerical Study on the Thermal Environment of UFAD System with Solar Chimney for the Data Center. Energy Procedia 2014, 48, 1047–1054. [Google Scholar] [CrossRef] [Green Version]
- Yuan, X.; Wang, Y.; Liu, J.; Xu, X.; Yuan, X. Experimental and numerical study of airflow distribution optimisation in high-density data centre with flexible baffles. Build. Environ. 2018, 140, 128–139. [Google Scholar] [CrossRef]
- Li, Y.; Nielsen, P.V. CFD and ventilation research. Indoor Air 2011, 21, 442–453. [Google Scholar] [CrossRef]
- Wang, J.; Lin, Y.; Zhu, K.; Lin, E. Design and performance analysis of the server water-cooled heat pipe cooling system. Sci. Technol. Innov. Her. 2015, 12, 58–59. [Google Scholar]
- Chung, D.D.L. Materials for thermal conduction. Appl. Therm. Eng. 2001, 21, 1593–1605. [Google Scholar] [CrossRef]


| Items | Description | Values | Site Photo | |
|---|---|---|---|---|
| Base Room | Dimension of base room | 9.2 m (L) × 8 m (W) × 4 m (H) |  Base data room 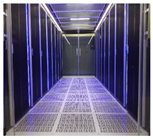 CCA | |
| Height of plenum | 0.45 m | |||
| Height above the plenum | 3.55 m | |||
| Air supply pattern | UFAD & direct air return | |||
| Aisle configuration mode | CCA & OHA | |||
| Dimension of CCA | 4.8 m (L) × 1.8 m (W) × 2.2 m (H) | |||
| No. of perforated tiles | Altogether 24 in three rows | |||
| Dimension of perforated tiles | 0.6 m (L) × 0.6 m (W) | |||
| Room ambient humidity | Below 36% | |||
| Room ambient temperature | Approximate 26 °C | |||
| CRACs | Number and type | A Schneider air-cooled conditioner |  CRAC unit 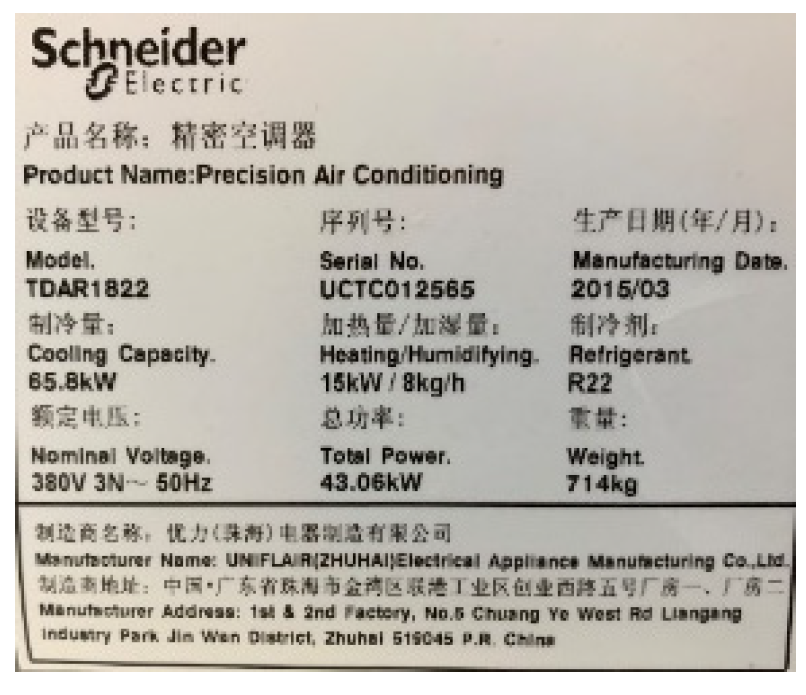 Nameplate of CRACs | |
| Dimensions of CRACs | 1.8 m (L) × 0.8 m (W) × 2.25 m (H) | |||
| Distance between CCAs and CRACs | 1.6 m | |||
| Height of CRACs above the plenum | 1.8 m | |||
| Height of CRACs under the plenum | 0.45 m | |||
| Dimensions of CRACs’ air outlet vent | 1.8 m (L) × 0.25 m (W) | |||
| Area of each air vent of CRACs | 0.45 m2 | |||
| Air velocity from the CRACs | 5.3 m/s | |||
| Set supply air temperature (SAT) | 22 °C | |||
| Actual operating SAT | Between 22.1 and 22.3 °C | |||
| Total power per CRAC | 43.1 kW | |||
| Cooling capacity per CRAC | 65.8 kW | |||
| COP | 1.53 | |||
| Operation time | 24/24 h, 365 days/year | |||
| Racks & Servers | Number of racks | Altogether 16 in 2 rows (Racks A&B) | 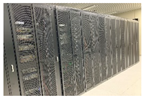 |  |
| Dimensions of each rack | 1.2 m (L) × 0.6 m (W) × 2.2 m (H) | |||
| The ratio of open area of doors | 65% | |||
| Type of servers | 2 U | |||
| Dimensions of servers | 0.8 m (L) × 0.46 m (W) × 0.09 m (H) | |||
| Rated power of servers | (495 W× 2) × 2 & (750 W× 2) × 10 | |||
| Distance between neighboring servers | 0.09 m or 0.0045 m | Racks | Servers | |
| Parameters | Setting Values |
|---|---|
| DC wall | Adiabatic |
| Raised floor of DC | Adiabatic |
| Ceiling of DC | Adiabatic |
| Air supply temperature of CRACs | 22 °C |
| Air supply speed of CRACs | 5.33 m/s |
| The opening rate of perforated tiles | 45% |
| The opening rate of rack door | 65% |
| Mesh type | Hexa Unstructured |
| Number of simulation iterations | 1000 |
| Convergence criterion of energy equation | 10−6 |
| Convergence criterion of other equation | 10−3 |
| Case | 1 | 2 | 3 | 4 | 5 | 6 | 7 | 8 |
|---|---|---|---|---|---|---|---|---|
| Installation height/(cm) | 0 | 0.5 | 1.0 | 1.5 | 2.0 | 2.5 | 3.0 | 3.5 |
| Above/Under server | Above | |||||||
| Case | 9 | 10 | 11 | 12 | 13 | 14 | 15 | 16 |
| Distance from the bottom of the server/(cm) | 0 | 0.5 | 1.0 | 1.5 | 2.0 | 2.5 | 3.0 | 3.5 |
| Above/Under server | Under | |||||||
| Case | 9 | 10 | 11 | 12 | 13 | 14 | 15 | 16 | |
|---|---|---|---|---|---|---|---|---|---|
| Test Point | |||||||||
| 1 | + | + | − | + | + | + | + | + | |
| 2 | + | + | − | + | + | + | + | + | |
| 3 | + | + | − | − | − | − | + | − | |
| 4 | − | − | − | − | − | − | − | − | |
| 5 | + | − | − | − | − | − | − | − | |
| 6 | + | − | − | − | − | − | − | + | |
| 7 | + | − | − | − | − | − | − | − | |
| 8 | − | − | − | − | − | − | − | − | |
| 9 | + | − | − | − | − | − | − | − | |
Publisher’s Note: MDPI stays neutral with regard to jurisdictional claims in published maps and institutional affiliations. |
© 2022 by the authors. Licensee MDPI, Basel, Switzerland. This article is an open access article distributed under the terms and conditions of the Creative Commons Attribution (CC BY) license (https://creativecommons.org/licenses/by/4.0/).
Share and Cite
Yuan, X.; Zhou, X.; Liang, Y.; Pan, Y.; Kosonen, R.; Lin, Z. Design and Thermal Environment Analysis of a Decentralized Cooling System with Surface-Mount Heat Pipe Exchangers on Servers in Data Centers. Buildings 2022, 12, 1015. https://doi.org/10.3390/buildings12071015
Yuan X, Zhou X, Liang Y, Pan Y, Kosonen R, Lin Z. Design and Thermal Environment Analysis of a Decentralized Cooling System with Surface-Mount Heat Pipe Exchangers on Servers in Data Centers. Buildings. 2022; 12(7):1015. https://doi.org/10.3390/buildings12071015
Chicago/Turabian StyleYuan, Xiaolei, Xuetao Zhou, Yumin Liang, Yiqun Pan, Risto Kosonen, and Zhongping Lin. 2022. "Design and Thermal Environment Analysis of a Decentralized Cooling System with Surface-Mount Heat Pipe Exchangers on Servers in Data Centers" Buildings 12, no. 7: 1015. https://doi.org/10.3390/buildings12071015
APA StyleYuan, X., Zhou, X., Liang, Y., Pan, Y., Kosonen, R., & Lin, Z. (2022). Design and Thermal Environment Analysis of a Decentralized Cooling System with Surface-Mount Heat Pipe Exchangers on Servers in Data Centers. Buildings, 12(7), 1015. https://doi.org/10.3390/buildings12071015