Abstract
Building information modeling (BIM) is an emerging process for managing the design, construction, operation, and maintenance of a facility. While BIM has developed in diverse aspects, the lack of organizational BIM capabilities remains a barrier to its implementation across the global architecture, engineering, and construction (AEC) industry. Accordingly, AEC organizations need to understand their organizational BIM capabilities and those of other organizations to realize the benefits of implementing BIM. This study examines the key criteria for assessing organizational BIM capabilities across two countries—Malaysia and Iran. For this purpose, the study compares the assessment criteria for BIM capabilities among the two countries based on the following elements: (1) criticality of the criteria; (2) degree of centrality of the criteria; and (3) underlying groups of the criteria. A systematic literature review of 26 articles and semi-structured interviews with BIM professionals provided nineteen criteria. A total of 121 and 126 BIM professionals evaluated the criticality of the criteria through a survey in Malaysia and Iran. The collected data were analyzed using the contextual disparities test (Mann–Whitney U test, Kruskal–Wallis H test, and rank agreement factor), network analysis, and exploratory factor analysis (EFA). The leading key criteria in both countries are “the company has the necessary infrastructure to implement BIM”, “the company has a good attitude towards new technology”, and “the company understands its expertise”. However, the subsequent key criteria differ between countries. Furthermore, while the level of agreement on the ranking of the criteria is at a neutral level, the Mann–Whitney U test indicates that the level of criticality significantly differs between countries for most criteria. There are also changes in the level of criticality of the criteria between countries. Finally, criteria with a high degree of centrality differ between countries. On the contrary, although the criteria slightly differ between countries, the overarching groups of the criteria are similar (i.e., the criteria are related to organizational BIM capabilities and organizational capabilities). Understanding these criteria can help researchers and industry practitioners develop the optimal tool for assessing organizational BIM capabilities for the local industry.
1. Introduction
Engineering and construction challenges are being addressed with technological advances, especially in project management, scheduling, and safety concerns [1,2,3,4,5,6,7]. In this regard, Building Information Models have recently attracted increasing attention from the architecture, engineering, and construction (AEC) industry because they offer many benefits and can be used to save resources during design, planning, and construction. Several industries began developing 3D modeling in the 1970s based on early computer-aided design (CAD) efforts [2]. In the early 2000s, Building Information Modeling (BIM) was introduced in pilot projects to support architects and engineers in designing buildings [8,9]. As a result, significant research has focused on improving preplanning and design, visualization, quantification, costing, and data management. The basic functionalities of design, architecture, engineering, scheduling, progress tracking, and job site safety have been complemented by specialized design and engineering tools [10,11,12,13,14,15]. BIM is used primarily in the preplanning, design, construction, and integrated project delivery of buildings and infrastructure. However, recently the focus has shifted from the early stages of the life cycle (LC) to maintenance, refurbishment, deconstruction, and end-of-life considerations, especially for complex structures [2,16].
Considering these wide ranges of BIM features, Oraee et al. [17] displayed that most BIM projects are limited to visualization, and only a few use advanced BIM elements. Many researchers tried to understand the barriers that do not allow engineers to use advanced features of BIM. According to Migilinskas et al. [18], BIM implementation needs tools that enable direct coordination and monitoring processes between project participants and team members. However, contractual arrangements in industrial projects prevent collaboration between different parts to implement BIM. Charef et al. [19] studied some European countries and concluded that many reasons, such as managerial, technological, and attitudes obstacles, influenced not the implementation of BIM. Most factors (managerial, technological, and attitudes) differ between developing and developed countries [20,21,22]. The importance of these factors varies based on income level, particularly between high- and low-income nations. These findings suggest that BIM usage varies greatly between low- and high-income nations [21].
Differing critical assessment criteria from region to region. Therefore, this study explores the key criteria for organizational BIM capabilities in two different countries: Iran and Malaysia. To achieve this purpose, the following steps were done: (1) Survey development: A survey was developed to gather information. The method used for developing the survey criteria was a systematic literature review (SLR) and semi-structured interviews with industry professionals. (2) Data collection: The second step is data collection. The questionnaire was sent to many industries in these countries, and then the filled questionnaire was collected. (3) Data Analysis: (a) Reliability analysis: to determine the data’s appropriateness and reliability. (b) Data normality and degree of criticality test: to determine which tests and tools were appropriate for further analysis. (c) Contextual disparity test: The Mann-Whitney U test is considered one of the most common nonparametric tests for determining whether two samples are independent of one another or whether there is a significant difference between them. (d) Network Analysis: to highlight the variables’ degrees of betweenness and centrality and amplify the variables’ correlations. (e) Factor Analysis: To classify the criteria.
2. Literature Review
2.1. Factors Affecting Organizational BIM Capabilities
A variety of working conditions hampers BIM adoption. According to Succar et al. [23], for executing new technology such as BIM, one person’s attitude in many projects determines the acceptable risk level. For this reason, many engineers avoid using new technologies. The individual’s BIM ability is not related to job status. Project participants must possess the proper skills, knowledge, and personal qualities to integrate BIM activities or produce BIM-related outputs. In addition, according to Oraee et al. [17], not sharing information among different groups is one of the main obstacles to BIM. Besides, most BIM research frameworks do not consider human effects and organizational factors. At the same time, evidence has shown that it is one of the crucial factors in the BIM enactment.
Mahamadu et al. [24] displayed that one of the principal factors in BIM success is staff experience. Also, one of the necessary factors in BIM acceptance is the educational level. On the other hand, ref. [25] by analyzing 35 articles, mostly from developed countries such as the USA, UK, and South Korea, Antwi-Afari et al. [25] determined five critical success factors for BIM implementation: (1) Collaboration between stakeholders in the design, engineering, and construction (2) Accurate 3D visualization of a facility (3) Coordination and schematization of construction (4) Enhancing the exchange of information and knowledge management, and (5) enhanced site planning and safety.
BIM adoption is a very complex process. In two-stage adoption, BIM should adopt: First, technology adoption at the individual level, and second, technology adoption at the organizational level. Ahuja et al. [26] reviewed some technology adoption theories at organizational and individual levels. They concluded that technology adoption depends not only on the technology itself but also on the characteristic of a user’s social attitudes and other casual factors. To address challenges in BIM adoption, Ahuja et al. recommended a plan for implementing BIM. They suggested providing guidelines to adopt BIM, recommended some standardization in this process, increased awareness, clarified the BIM-related process, and improved top management support.
Managers have a central role in BIM implementation. Supportive and committed managers can address various concerns during the BIM implementation process. The high-ranked employer, middle manager, or top manager can initiate BIM on the organizational scale. BIM initiators can be leaders in communication with BIM software sellers, training supervisors, and technicians [27]. The existence of a manager with knowledge, experience, and skills in BIM is also critical to answering the obscurity. These managers are responsible for implementing strategy and the diffusion of BIM philosophy and benefits. To ensure acceptance, BIM implementation leaders must identify and analyze the sources of resistance and use strategies to deal with them effectively to achieve consensus throughout the implementation process [28]. Therefore, expert managers can change the whole attitude of the organization and employers about BIM and aid in implementing BIM correctly.
Implementation of BIM initially requires organizational acceptance. A willingness to put in time and effort is the first step toward learning BIM. Even if all employees are unaware of all BIM details, they should still be familiar with the specific applications of BIM. They will be able to create meaningful data that might assist them in their daily work. Also, Arayici et al. [29] showed that BIM adoption is slow because learning new skills is a long process for employees. Some organizations use a bottom-top approach. This approach allowed employees to learn BIM by doing. Despite the long process, all employees have extended knowledge about the BIM procedure after a while. In addition, the implementation of BIM is related to process and product. In terms of process, most of the time, BIM adoption needs to change the working process. Collaboration and communication across disciplines are essential for integrated model development. In term of product, expectation from BIM is different across disciplines. BIM is seen by design disciplines as an extension of CAD, while contractors and project managers expect BIM to be a more intelligent DMS that can extract data directly from CAD packages for analysis, time sequence, and cash flow modeling, simulation, and risk scenarios [30].
Wong et al. [31] reviewed BIM initiatives in the USA, Finland, Norway, Denmark, Singapore, and Hong Kong and, from an analysis, figured that some general BIM attributes must be executed for BIM implementation. First, they concluded that the public and private sectors should collaborate effectively for BIM execution in the AEC industry. The second step is clarifying BIM’s significant roles and developing some policies. As they mentioned in their study, BIM policy could include developing practical information which allows exchanging information smoothly, deposing guidelines for modeling and BIM standards, and promoting, liaising, and presenting BIM initiatives in the country to other stakeholders. Wong et al. [31] also reviewed the BIM research in this count and found that some areas like sustainability, interoperability, and informational and transformational issues must get more attention.
Financial support is one of the crucial barriers to BIM execution, mainly in small and medium enterprises. Upper managers should support the continued development of BIM financially. According to Oraee et al. [17], BIM projects usually involve numerous offices and locations, with team members working in silos and pursuing different objectives. Another obstacle to BIM implementation is resistance to changing attitudes. The “influencing” and “motivation” competencies of BIM leaders play a vital role in this situation; a leader with tremendous influence and motivation skills can convince team members and demonstrate the benefits of BIM. Sometimes employees resist and have negative attitudes toward sharing data; influencing and motivation competencies can aid managers in encouraging participants. As they demonstrate the benefits of BIM, they can also motivate employees to reduce or eradicate their resistance to change. Besides motivating the project’s participants, BIM leaders themselves must be self-motivated, eager to learn various BIM-related subjects and concepts, and willing to reach the goals and objectives outlined in the BIM execution plan [32].
Consequently, Mahamadu et al. [33] showed that knowledge about the process, technology, and information management is the first BIM capability indicator. Also, if BIM capabilities increase, the probability of project success grows. Furthermore, different criteria in BIM success have no equal effect. For example, technological and infrastructure requirements affect BIM success. However, experience and specific BIM modeling process maturity and expertise are critical. Therefore, these findings support that BIM capability assessments for implementation or a basic evaluation of candidate suitability require technical infrastructure. Nevertheless, to leverage some tangible and intangible benefits of BIM, information-related process maturity and knowledge and skill availability among individual personnel are crucial.
2.2. Methods for Enhancing Organizational BIM Capabilities
2.2.1. Standardization
Developing BIM standards is vital for BIM implementation. These standards showed the process for creating, maintaining, and sharing construction data. Some organizations in developed countries established a wide range of standards to encourage projects manager to adopt BIM, such as the US general administration in the US and BEIIC in Australia. Coordination across project units and standardization of BIM is critical to improved results during the BIM execution [34]. Therefore, standardization ensures that BIM is implemented successfully [35]. As a result, standardization leads to conducting BIM smoothly. To elevate BIM adoption, governments can use that as stimuli, bonuses, and code.
2.2.2. Policies
In BIM deployment, BIM policy plays a critical role. The people, process, and policy (PPP) plus technology are essential factors for new technology adoption. The industry needs to adopt BIM users (people), best practices (processes), and a policy to facilitate the adoption process. The motivation of governments to adopt BIM plays a critical role. For reaching this purpose, one of the main tools is policies. Its policies range from a firm mandate of BIM for all publically procured projects through legislation changes, or the provision of financial and organizational aid, to low-level encouragement and support. Singapore, Finland, Korea, the USA, the UK, and Australia are pioneers in BIM policies. Although the government and its subsidiaries have played a key role in demanding and promoting BIM adoption in all countries, they have taken significantly different approaches [36].
2.2.3. BIM Roles and Training
Ahn et al. [37] reviewed the BIM roles and training approach used by four constructors in the United States. There are generally two or three levels of competence for the BIM experts in each participating company. The first level is the BIM coordinator, responsible for the BIM models supplied by specialty contractors. The second level is the BIM manager; the BIM manager drives BIM model implementation and software. Moreover, at the company’s headquarters and regional offices, it is the director’s responsibility to oversee BIM managers and coordinators; support BIM implementation; promote BIM knowledge and skills sharing among employees; identify new technologies and approaches and promote the benefits of BIM in the AEC industry. All four companies use different instruction strategies like BIM courses, training sessions, BIM conferences, and forums. Also, all reviewed companies held modules that included one or two classes covering overall BIM implementation. This training is followed by specialized courses for each implementation, such as BIM for scheduling, estimating, and energy simulation. As a final step, the BIM departments organize a BIM conference for their company’s BIM experts so they can share what they have learned from their projects and enhance their capabilities and practices.
2.2.4. Motivation
Adriaanse et al. [38] emphasized the importance of motivating components, in both personal and external stages, to incorporate new technology like BIM in the AEC industry. An individual’s motivation can be defined as their willingness to adopt new technology beneficially. External motivators include contract agreements for BIM adoption and stakeholders seeking to adopt the technology. One of the other important things for motivation is creating a friendly space in companies that allow employees to experiment willingly and take risks which will let workers obtain new skills [39]. On the other hand, without personal and external motivation, employees do not do their job with interest, which decreases efficiency; one of the most vital responsibilities of constructors who want to implement BIM is to motivate their employees in both external and personal stages.
2.2.5. Company’s Culture
According to Ahn et al. [37], a part of the BIM adoption process is developing implementation details plans and collaboration methods for subcontractors and creating a company’s culture. Research suggests that company culture, leadership, and knowledge management can affect the creation of technological knowledge. A company’s culture defines its identity and personality. Positive workplace cultures attract talent, drive engagement, affect happiness and satisfaction, and affect performance. In addition, research conducted in construction projects has found that positively encouraging teamwork brings the team closer together. As a result, the team becomes much more united. Villena-Manzanares et al. [40] showed the effectiveness of new technology-enhanced with senior management support. In order to achieve that, senior management support must encourage a collaborative culture and technical education among project team members. Also, new initiatives are highly likely to be undertaken in organizations that embrace change and possess a unified set of values and goals.
2.2.6. Network Relationships
BIM technology implementation needs learning the application of BIM, reinventing the workflow, training work staff, assigning responsibilities, and constructing the BIM models [29]. To deal effectively with information exchange, integration, IT systems, and software problems, the teams responsible for driving the implementation process need to work collaboratively with external dealers, consultants, supply chain partners, as well as internal divisions such as R&D. It is essential to have access to high-quality external parties such as consultants and software dealers, since most AEC firms, particularly SMEs, tend not to have the expertise or resources necessary to implement BIM. Consultancy services may include analyzing business requirements, developing protocols and documentation, and recommending computer hardware and software. Software dealers may sometimes lay the consultant [28].
2.3. Process and Performance Management
Some companies might use the maturity BIM model to understand the company’s status in BIM implementation. In addition to determining the company’s goals, maturity tools also can use for measuring readiness and scaling a company’s abilities. Maturity models are so various; because of that, each organization can choose a maturity model due to their requirement and use this model to improve the organization’s maturity. Models of maturity evaluation are divided into three main categories. The first [41] is project-oriented, the second is organization-oriented [41], and the last macro maturity models [23]. Due to this variety, the goals must be defined before choosing the models. BIM implementation monitoring should incorporate a maturity model, data collection methods, and tools to assess BIM-enabled processes and components. Managers and leaders of BIM can then use information collected from performance evaluations to verify that BIM practices are implemented under the defined BIM plans and policies.
One way to compare BIM performance among various organizations is to use external benchmarking tools and data collection [42]. The purpose of sharing information is to understand success and failure factors and develop long-term improvement plans. BIM adoption is highly dependent on ingrained, tacit knowledge, making duplicating more difficult. Knowledge transformation can be obtained by moving knowledgeable persons between companies, creating industry networks, or reproducing practices through routine observations [43]. No one-size-fits-all approach exists for BIM implementation. Each organization should analyze its status and choose the best approach for BIM implementation [28].
2.4. Organizational BIM Research in Iran
While BIM is slowly being implemented in Iran, limited research has been conducted to provide a picture of how BIM is used and practiced in Iran. Also, existing research and books about implementing BIM in developing countries did not include Iran, such as Rogers et al. study [44,45]. A country or company’s natural context will determine what factors determine the drivers of and barriers to BIM [46]. Therefore, research from other countries cannot be directly applied to the Iranian context. In addition, published research on BIM in Iran, such as the one by Kiani et al. [47], has only covered the application of BIM as a scheduling tool, so the overall status of BIM in Iran remains unexamined. Alternatively, another research by Hosseini et al. [48] only reviewed Iran’s BIM. It did not compare with the other developing country. There is no academic study on the current state of BIM in Iran, to the best of the authors’ knowledge. Consequently, it is considered crucial to promote BIM to understand BIM’s status in each country.
Hosseini et al. [48] found low levels of adoption and a lack of interest in BIM adoption in Iran’s AEC industry. Based on the collected data, the Iranian AEC industry is significantly behind other Middle Eastern countries, particularly those in the Persian Gulf, concerning awareness and adoption of BIM on construction projects. In other words, 29.5% of construction companies are engaged in some form of BIM adoption, whereas 56.8% have no experience with BIM, and 36.4% do not even plan on adopting BIM anytime soon. Additionally, because policymakers and government do not pay enough attention to BIM, construction companies are not as willing to adopt it as their counterparts in other Middle Eastern countries. Policymakers and the government play an important role in controlling the business climate in the Iranian AEC industry and the advantages of BIM; they should pay particular attention to measures aimed at promoting BIM in the country. To reach this purpose, the government should be mandating BIM in large construction projects, funding research projects for pilot studies with BIM, and sharing the knowledge gained throughout the entire AEC industry; this can be achieved.
Khanzadi et al.’s [47] study on key performance in Iran BIM application showed interesting results that displayed BIM benefits for project performance indicators as perceived by building design and construction practitioners in Iran. The construction cost reduction and time-efficient delivery indicators were assigned relatively lower roles than quality improvement and sustainable construction indicators. Due to the low profitability and high firm failure rates of Iranian project-based industries (such as construction), construction companies adopt new methods and change their traditional approaches, such as CAD, when they can benefit from money-back and proven returns of investment, so they default to monetary values rather than quality and sustainability principles. Nevertheless, the authors emphasize that because of some limitations, finding should be considered cautiously.
2.5. Organizational BIM Research in Malaysia
Malaysia’s AEC industry is one of the country’s key economic drivers, but other factors affect growth. A steady growth rate of 5–6 percent per year is expected for the AEC industry, contributing 4.5 percent to GDP in 2015. To keep growth in the AEC industry, the Eleven Malaysian plan has focused on increasing construction productivity by increasing the adoption of BIM among construction players [49]. Al-Ashmori et al. [50] distributed a questionnaire among 590 Malaysian stakeholders to realize their decision and factors affecting BIM implementation. This study indicated that BIM distribution among Malaysian companies is very slow. The following benefits were essential to stakeholders’ decisions: increased productivity and efficiency, estimating time and cost associated with design changes, eliminating clashes in design, improving multi-party communication, integrating construction scheduling and planning, and monitoring progress during construction. To increase BIM’s adoption among Malaysian contractors, it is crucial to be supported by the government and the private sector at all levels.
Another research by Ismail et al. [51] displayed that most quantity surveyors in Malaysia know about B but are not using it yet. Most of these users in Malaysia employed Golden Software for cost-estimating. In addition, most of the respondents claim that they have moderate knowledge about BIM. However, most of the respondents plan to use BIM in the future. Manzoor et al. [52] mentioned some approaches to increasing the awareness of BIM in Malaysia, such as workshops, lectures, and conference events. Also, the study classified four categories of strategies for obtaining sustainable growth: standardization-related strategies, economic-related strategies, awareness-related strategies, and environment-related strategies. By developing relevant regulations, project participants can clarify the application requirements of BIM technology. These findings also serve as a valuable guide for authorities and governments when developing relevant legal norms to enhance BIM use in sustainable buildings. Moreover, BIM users should consider the importance of using BIM technology when constructing sustainable buildings. In conclusion, the rate of usage of BIM among Malaysian AEC organizations is unsatisfactory, and this shows that, in contrast to developed countries, BIM has been adopted in Malaysia slowly.
Memon et al. [53] studied the status, advantages, barriers, and strategies for enhancing BIM implementation in Malaysia. They displayed six main barriers to BIM in the AEC industry: (1) Training: A lack of training is one of the biggest obstacles to implementing BIM satisfactorily. It has also affected decision-making for BIM adoption. (2) Cost: To implement BIM in the AEC industry, a significant investment is needed to update software and hardware and train staff. Most service providers are hesitant to make such investments unless they see long-term benefits to their organization and if the owner will subsidize the training costs [53]. (3) Client demand: Most stakeholders fear change. They believe changing contract conditions to include 3D or BIM models will affect receiving competitive bids. (4) Ownership: Resolving the ownership issue for BIM data is crucial, as is taking steps to protect the data [54]. (5) Culture issues/resistance to change: Technology changes and process changes have been forced by BIM implementation. For most employees, it is hard to accept changes in common procedures. (6) Interoperability: Lack of interoperability is one of the most common obstacles to BIM implementation.
3. Methodology
3.1. Survey Development
Questionnaire surveys have frequently been used to gain expert opinions in construction management. Random data can be obtained systematically using a questionnaire survey. Thus, the data for this study was obtained by a questionnaire survey. To perform a complete analysis of the current literature and build an assessment framework for BIM capabilities inside an organization, this study used a systematic literature review (SLR) approach using the Preferred Reporting Items for Systematic Review and Meta-Analyses (PRISMA) guidelines. A systematic search for current construction management publications was undertaken using the Scopus database’s title/abstract/keyword features. ‘Building information modeling’ OR ‘building information modelling’ AND ‘capability’ OR ‘capabilities’ were employed to accomplish this. The search was conducted on 6 November 2020. Using the search code, 205 articles were found. Inclusion and exclusion criteria were set to ensure that articles were eligible for this study. All selected articles must be peer-reviewed publications from well-recognized journals. Compared to other sources, journal articles usually offer comprehensive and reliable sources of information in a field of study [55,56]. Conference papers and thesis dissertations were not included due to their quality. In addition, the articles must be written in English. Next, unrelated articles were screened by examining the title, abstract, and keywords. After that, the whole text of the selected articles was thoroughly reviewed to eliminate the articles that were not related to the objective of this study. Finally, 26 articles were found to be valid for further investigation.
In addition, fifteen semi-structured interviews with BIM managers were performed to uncover any additional variables in the existing body of knowledge. After each interview, a summary was provided to respondents to help validate the results. Then, a survey was created based on the findings of the SLR and interviews. By merging variables with identical meanings, nineteen assessment criteria were developed. The criteria generated from SLR and interviews are summarized in Table 1. During the pilot test, three construction management professors assessed the survey to ensure the use of technical vocabulary and the elimination of ambiguous statements.

Table 1.
List of criteria for assessing organizational BIM capabilities.
The study objectives and contact information were displayed on the first page of the survey, followed by two parts. Respondents were asked about their individual and organizational backgrounds in the first part. It is crucial to understand the respondent’s background to determine data reliability. The second part consists of criteria for assessing organizational BIM capabilities. Respondents were requested to evaluate the criticality of the criteria on a five-point Likert scale (1 being not critical, 2 being less critical, 3 being neutral, 4 being critical, and 5 being extremely critical). According to Zhang et al., (2011), the five-point Likert scale is famous as it can produce precise findings. Nonetheless, at the end of the survey, respondents are allowed to provide additional criteria.
3.2. Data Collection
The target audience comprises all BIM professionals. The sample was nonprobable in this study due to the lack of a sampling frame in the AEC industry [62]. Nonprobability sampling can establish a representative sample when a truly random sampling approach cannot be utilized to select responders from the total population [63]. Instead, it may be possible to choose responders based on their willingness to participate [64]. Thus, the sampling method used in this study is purposive sampling and snowball sampling. First, the purposive sampling technique was used to select suitable survey participants. Then, snowball sampling was used to reach an adequate number of participants by inviting the participants to forward the survey to others that they deemed appropriate for the survey. Much other research in the construction management field has also employed the same sampling techniques [65,66,67].
BIM professionals directly working in the AEC industry in Iran and Malaysia were contacted to select the first respondents [68]. Consequently, the identified respondents were invited to provide information about relevant individuals based on their industry or academic experience. In addition, two follow-ups were sent to the target respondents two weeks after the first contact to boost the survey’s success rate. As a result, 126 and 121 valid responses were obtained in Iran and Malaysia.
Table 2 shows the demographic profile of the 126 BIM professionals in Iran and their industry and BIM experience. Almost 80% of those surveyed have worked in the AEC industry for two or more years. In addition, 60 respondents, or 47.6%, have two to five years of experience, 19.8% have six to nine years of experience, and 11.9 percent have more than ten years of experience. These outcomes show a breadth of construction experience. In terms of BIM, 62.7 percent of respondents said they used it in one to five projects, 16.7% said they used it in six to ten projects, and 20.6 percent said they used it in more than ten projects. Because BIM is a relatively new technology in the industry, the respondents’ backgrounds are appropriate for this survey.
Table 2.
Respondent profile for Iran.
Table 3 shows the responses of 121 Malaysian respondents in terms of their industry experience and BIM experience. In total, 52.1% of respondents have two to five years of experience, 13.2% have six to nine years of experience, and 5.0% have more than ten years of experience. A large number of respondents have extensive construction experience. BIM has been used in one to five projects by 69.4% of respondents, 19.0% in six to ten projects, and 11.6 percent in more than ten projects.
Table 3.
Respondent profile for Malaysia.
3.3. Data Analysis
3.3.1. Reliability Analysis
Before further analysis, the data were analyzed to determine their appropriateness and reliability, which is required to improve the justifications for the results. The Cronbach’s alpha test was used to conduct the reliability test in this study. It is widely used in various research, particularly construction management-related research [69,70]. Because the analysis and discussions were done on a comparative basis, the test was performed on each group, given the divisions of the entire sample. Using a scale of 0 to 1, where 0 represents no reliability and 1 represents full reliability, the closer the alpha value gets to 1, the more reliable it is, and vice versa for a given threshold of 0.70 [71].
The normality test was another essential test to establish whether more tests and tools were needed after determining the data’s reliability. The normality test reveals the data distribution’s nature or type [72]. Determining data distribution is necessary, especially if the researcher is unsure of the nature or type of data distribution. The Shapiro-Wilk test is commonly used to determine data distribution [73]. Suppose the calculated Shapiro-Wilk test is less than the significance p-value, which is 0.05. In that case, the data distribution pattern is nonnormally distributed.
3.3.2. Contextual Disparities Test
The Mann-Whitney U test is widely recognized as one of the most important and extensively used nonparametric approaches for determining the significance of a difference between two independent samples [74]. The Mann-Whitney U test was performed to examine the significant statistical discrepancies in the criticality of the criteria in the two countries. The null hypothesis used for the test is that there is no difference in the levels of the criticality of criteria between Malaysian and Iran. The null hypothesis can be rejected if the individual significance levels reach the threshold alpha value of 0.05.
A normalization method is also used to objectively evaluate the levels of importance of the criteria between the two groups, utilizing the means and weights within each category of criteria from each country. The difference between the normalized values is then calculated. A change of 0.20 implies a change of one level on a five-point Likert scale with values ranging from 0 to 1. All respondent groups’ mean and normalized values, including Malaysia and Iran, were calculated and compared.
Finally, the degree of agreement between the two countries was examined to determine areas of agreement or disagreement and the impact of any discrepancies on the criteria. The rank agreement factor (RAF) approach can be used to perform quantitative comparisons when comparing agreement levels between groups. The average absolute difference in ranking between the two groups was computed using the RAF technique. The null hypothesis is that there is no good agreement in the ranking of criteria between Malaysia and Iran. Therefore, the alternate hypothesis is that “there is good agreement in the ranking of criteria between Malaysia and Iran.” Using the RAF technique, the percentage agreement was calculated using Equations (1)–(5) to test the null hypothesis.
The mean value of the total ranks (R) is given by:
The RAF is defined as:
The maximum rank agreement factor (RAFmax) is given by:
The percentage disagreement (PD) is given by:
The percentage agreement (PA) is given by:
PA = 100 − PD.
3.3.3. Network Analysis
The network analysis emphasizes the degree of betweenness and centrality of the variables, amplifying the correlations. The social network analysis (SNA) technique is intended to depict a social structure encapsulating different individuals and in various contexts or organizations (commonly referred to as nodes), which are connected or tied by a shared or common variable or various kinds of interdependencies ranging from kinship relationships, beliefs, and common interests [75]. This study used two typical SNA approach measures out of the many known [75]. The degree of centrality and betweenness are the two methods used. The betweenness illustrates the amount to which a node or variable lies among other nodes or variables in the network, and centrality assesses the critical power of nodes depending on how well they connect the network [76].
3.3.4. Factor Analysis
This study used the factor analysis technique to classify the assessment criteria. Factor analysis is a statistical technique used to identify a smaller number of constructs connected to a group of items or variables [77]. It is considered a powerful method for categorizing a huge number of variables into fewer and more meaningful constructs using factor points of responses and determining the smallest number of categories that quantify the highest variance in a group of data [78].
Factor extraction and rotation are two crucial stages in factor analysis. The Kaiser-Meyer-Olkin (KMO) measure of sample adequacy and Bartlett’s test of sphericity were used to determine whether the data set was suitable for factor analysis [69,79]. The KMO illustrates the ratio of the squared connection between the composing variables to the corresponding squared partial correlations, reflecting sampling suitability or adequacy. A zero KMO value indicates a diffused correlated pattern, making the data set unsuitable for factor analysis. Contrarily, a KMO value of 1 indicates the compactness of correlated patterns, making the data set suitable for further analysis. Any KMO greater than 0.5 is frequently regarded as sufficient for factor analysis to proceed [80]. Bartlett’s sphericity test, on the other hand, looks for homogeneity in variance. The population correlation matrix is not an identity matrix when the sphericity test statistic result is substantially bigger with a corresponding lower significance threshold, indicating that the factor model is suitable [78]. Then, the constructs were given names based on the common themes that run through the variables [81,82]. Furthermore, in the absence of a common theme, naming was done by combining the themes of the variables with the highest cross factor loadings and rejecting the variables with lower loadings.
4. Results
4.1. Results of Contextual Disparity Test
According to Table 4, the most significant criteria for assessing organizational BIM capabilities is whether a company has sufficient resources to implement BIM (AC05). This criterion ranked first among others in Malaysia for organizational BIM capabilities. The lack of facilities and sufficient resources may be the reason for this. Notably, this criterion is among the top three criteria in Iran (i.e., 3rd criterion). It was followed by a subsequent rating of the company as a standard process for evaluating BIM capability (AC04), which was listed second and first, in Malaysia and Iran, with a similar rating in both countries. Therefore, a systematic process for assessing the BIM capabilities is necessary for every organization to monitor and evaluate their BIM adoption from time to time and act as necessary. Furthermore, the criteria that state that the company has enough BIM experience (AC03) is almost achieved in both countries but is more emphasized in Malaysia. As envisaged by the Iranian results, the criterion “company has specific roles for staff” (AC09) has been highlighted as it has been found that the importance of human resource management and deciding the role of each employee has been prioritized (ranking second).
Table 4.
Results for the contextual disparity test.
The results of the Mann–Whitney U test on the assessment criteria for organizational BIM capabilities are also presented in Table 4. It is evident from these results that there is a large difference between the two countries as among the nineteen criteria, eighteen criteria have p-values less than 0.05. In other words, only one criterion was found to have a Mann–Whitney U test value greater than 0.05: “company has a good history of implementing BIM” (AC07). There could be various reasons for this variation in the results, including the different cultural perspectives on the importance of criteria when using the Likert scale in two countries.
The comparison of normalized values between Iran and Malaysia shows differences in the normalized values of the criteria. Specifically, fourteen out of nineteen criteria were observed to have shown a change of one level in the scale. A five-point Likert scale has values ranging from 0 to 1. Thus, a change of 0.20 indicates a change of one level on the scale. These results mean that more than half of the criteria have changes in their levels of importance. These findings suggest that the level of importance of each criterion can differ between countries.
Based on the RAF technique, the level of agreement between both rankings is at around 52%, which is a neutral level of agreement between the two countries. These results of lack of agreement between countries indicate that the local situation or environment in each country is different, leading to different perspectives. In other words, different countries have different perspectives on the criteria for assessing organizational BIM capabilities. Therefore, each country should develop its criteria for organizational BIM capabilities. Alternatively, multigroup modeling of key criteria for organizational BIM capabilities is crucial.
4.2. Results for Network Analysis
Table 5 and Figure 1 presents the results of the network analysis, while Figure 1 illustrates the results. The centrality of assessment criteria for organizational BIM capabilities in Malaysia include:
Table 5.
Results of network analysis.
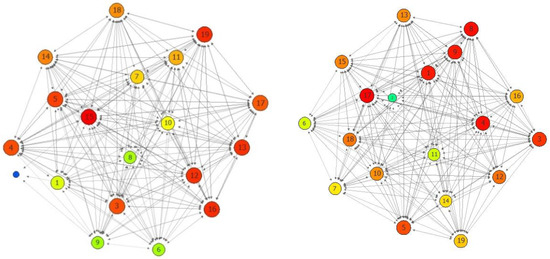
Figure 1.
Network analysis highlighting the degree of relationships (centrality and betweenness) of the assessment criteria for organizational BIM capabilities in Malaysia (left) and Iran (right).
- Company has a standard performance benchmarked (AC12)
- Staff receive guidance and supervision by BIM experts (AC13)
- Company can provide an example with rich BIM data (AC15)
- Company can provide the best products and services (AC16)
- Company understands its expertise (AC19).
On the contrary, the centrality of criteria for organizational BIM capabilities in Iran include:
- Staff have enough BIM experience (AC01)
- Company has a standard process for evaluating BIM capability (AC04)
- Staff can design specific models using BIM (AC08)
- Company has specific roles for staff (AC09)
- Company has official standard contracts and agreements for BIM (AC17)
These results indicate that the criteria with a high degree of centrality differ between the two countries. These results are similar to the findings from the agreement analysis, which indicates that Iran and Malaysia have different perspectives on the criteria for assessing organizational BIM capabilities.
4.3. Results for Factor Analysis
Table 6 and Table 7 show the factor analysis results of the criteria for assessing organizational BIM capabilities. For Malaysia, the varimax rotation revealed two underlying groups that explained 57.202% of the overall variance. All criteria have factor loadings greater than 0.50. The first construct is named organizational BIM capabilities. The second construct is organizational capabilities. For Iran, the varimax rotation revealed three underlying groups that explained 66.43% of the overall variance. The three constructs are organizational BIM capabilities, organizational capabilities, and organizational background. In other words, both countries have similarities in organizational BIM capabilities and organizational capabilities constructs but differ in the “organization background” construct.
Table 6.
Results of factor analysis for Malaysian data.
Table 7.
Results of factor analysis for Iran’s data.
5. Discussion
This section discusses and summarizes the potential reasons for the symmetries and asymmetries between Iran and Malaysia on the underlying constructs of criteria for assessing organizational BIM capabilities.
5.1. Organizational BIM Capabilities
Guidelines are an important component of successful BIM implementation [83]. Having no guidelines can weaken the implementation due to a lack of knowledge of BIM implementation procedures [84]. Although many guidelines have been developed to aid the transformation process, these guidelines are not universal. Current guidelines are often developed based on local requirements and AEC environments, which vary widely from country to country [85]. Organizations implement initiatives and develop guidelines to remain competitive in the local market [86]. A major issue with these guidelines is the inconsistency in the standards developed. The result is a great deal of confusion among professionals in the AEC industry over the appropriate guidelines for BIM implementation [45]. In light of this, it is critical to establish uniform and country-specific guidelines. The mean of these critical criteria is significantly higher than others in both countries. Particularly, when it comes to Malaysia, it may be because the government is taking more initiative with BIM. Malaysia’s government, for instance, established the National Steering Committee on BIM in 2013. To foster BIM implementation in Malaysia, a committee comprising governments, professional associations, and private organizations must develop a roadmap [87]. Additionally, the recently released “Iran BIM Strategic Plan for Public Projects” provides some guidelines on the implementation process for BIM in Iran. Further, considering the recent lack of adequate hardware and software resources in Iran, having sufficient resources to address the high demand for BIM implementation has been cited as the most critical criterion in Iran. (AC05). From this perspective, it seems that companies in Iran must provide the resources as the primary concern before they can benefit from organizational BIM capabilities.
5.2. Organizational Capabilities
The way in which technology is implemented concerns users as much as the technology itself. In BIM, user engagement and positive attitudes toward emerging technologies are necessary for success within an organization. To do that, the manager should have a wide vision of the staff’s skills and organizational resources, which allows the organization to increase its capability. Various research has also emphasized the need for organizations to develop their capabilities to create value and sustainability in the competitive environment [88,89]. Therefore, top management must devote more resources to improving critical business processes and developing capabilities around the processes to overcome the challenges associated with implementing BIM [90]. Similar to prior works, the results indicate deep relationships exist between successful BIM implementation and organizational capabilities across both countries. This finding indicates that strong organizational capabilities are necessary for successful BIM adoption regardless of country.
5.3. Organization Background
According to Mahamadu et al. [24] prioritizing administrative and strategic capacity for organizational BIM use success requires adequate staff experience and project execution planning (i.e., methodology) for more efficient BIM delivery performance. According to the results of this study in Iran, two main criteria illustrating origination’s background in BIM adoption, “Staffs have adequate academic qualifications” and “Company has a good history of implementing BIM,” has highly been considered in successful BIM adoption. This may be because of the importance of experience in Iran’s cultural attitude and probable previous failed experiences.
5.4. Theoretical Implications and Contribution
This study tries to understand the BIM organization capabilities in Iran and Malaysia. In addition to critical understanding criteria influencing BIM organizational capability in each of these countries, this study attempts to compare the similarities and differences between Iran and Malaysia. Stakeholders, employees, and researchers can use obtained criteria to enhance existing frameworks in their countries. This proposed framework can increase the BIM implementation in the AEC industry. Furthermore, this study shows that, unlike the emphasis of papers on some organizational BIM criteria, they have a more negligible effect than assumed. Therefore, improving an organization’s BIM capabilities should be prioritized according to its culture, capabilities, and competencies. The study results are crucial because they identify specific areas for organizations to improve BIM and prevent unneeded organizational changes.
5.5. Practical and Managerial Implications
The study provides a broad overview of the critical organizational BIM capabilities required to implement BIM effectively in Iran and Malaysia. Because resources are limited in the organization, this study helps stakeholders control their resources effectively according to the vital criteria. As a result, the Managing Director of an organization or CEO in both countries can gain a deeper understanding of the underlying components of BIM capability factors by categorizing these variables. Organizations and policymakers can use the list of key criteria to improve the BIM capabilities of local organizations.
5.6. Limitations and Future Research
Despite the relevance of these results, the study has constraints that need attention in future research. First, the sample size (n 126) was small. Second, because of the lack of sampling, the frame for this investigation is nonprobability. Suppose a truly random sampling approach cannot select the responders from the entire population. In that case, nonprobability sampling can be used to create a representative sample [91]. Wilkins [65] suggests that participants may be chosen for the study based on their desire to participate. In addition, the data were primarily interpreted within an Iranian and Malaysian context. Some criteria are significantly different between Iran and Malaysia even though both countries are developing. It showed that employing these criteria for the other country should be used carefully. Consequently, a broader scope of data collection across different countries and countries may enhance the development of optimal strategies for organizations. Despite this, the results of this study provide valuable insights into BIM capabilities in organizations. By tailoring the study to local needs, future research can build roadmaps based on study results.
6. Concluding Remarks
BIM is a new method that provides a framework for managing the design and construction, as well as operation and maintenance of a facility using information models. A significant number of developments in different aspects of BIM have taken place. However, the lack of organizational capabilities remains a stumbling block to the widespread adoption of BIM in the AEC industry. It follows that organizations in the AEC industry will need to identify criteria for assessing organizational BIM capabilities, develop strategies to facilitate BIM implementation, and ensure its benefits are realized. Using two case studies from Malaysia and Iran, the present study examines the key criteria for assessing organizational BIM capabilities. To accomplish this objective, the study assessed the assessment criteria for organizational BIM capabilities across countries according to three elements: (1) criticality of the criteria, (2) amount of centrality of the criteria, and (3) underlying groups of the criteria. In an SLR of 26 articles and semi-structured interviews with BIM professionals, nineteen criteria were found. The criticality of the criteria was evaluated by 121 and 126 BIM professionals via an online survey conducted in Malaysia and Iran. Based on three measures: contextual disparities test (Mann–Whitney U test, Kruskal–Wallis H test and rank agreement factor), network analysis, and EFA, the leading key criteria from respondents in both countries are the company having the necessary infrastructure for implementing BIM, being receptive to new technology, and knowing its expertise. However, the subsequent key criteria differ between countries. The Mann–Whitney U test indicates that the level of criticality significantly differs between countries for most criteria. There are also changes in the level of criticality of the criteria. The level of agreement on the ranking of the criteria is at a neutral level of 52%. Criteria that have a high degree of centrality also differ between countries. However, although the criteria slightly differ between countries, the overarching constructs of the criteria are similar (i.e., the criteria are related to organizational BIM capabilities and organizational capabilities). Based on the findings, both countries emphasize the importance of sufficient resources and a standard guideline for organizational BIM. More importantly, the management of employees and specifying rules for each are important in Iran. In future research, comparing the results with other countries with different income levels would help determine the impact of a country’s income levels on the criteria for assessing organizational BIM capabilities.
Author Contributions
Conceptualization, M.S.R., M.R. and R.A.R.; methodology, A.R.R. and R.A.R.; software, A.R.R. and R.A.R.; formal analysis, A.R.R. and R.A.R.; resources, M.S.R., M.R., A.F. and M.E.R.; data curation, M.S.R., M.R. and R.A.R.; writing—original draft preparation, M.S.R., A.R.R. and M.E.R.; writing—review and editing, M.S.R., A.R.R., M.R., A.F. and R.A.R.; visualization, A.R.R. and R.A.R.; supervision, R.A.R.; project administration, M.S.R. All authors have read and agreed to the published version of the manuscript.
Funding
This research received no external funding.
Institutional Review Board Statement
Ethical review and approval were waived for this study, due to the study involving anonymous data collection.
Informed Consent Statement
Informed consent was obtained from all subjects involved in the study.
Data Availability Statement
The data presented in this study are available on request from the corresponding author. The data are not publicly available due to some data being proprietary or confidential in nature. Therefore, the data may only be provided with restrictions (e.g., anonymized data).
Acknowledgments
We would like to acknowledge VT’s OASF support for covering the fees of publishing this article.
Conflicts of Interest
The authors declare no conflict of interest.
References
- Sobhkhiz, S.; Taghaddos, H.; Rezvani, M.; Ramezanianpour, A.M. Utilization of semantic web technologies to improve BIM-LCA applications. Autom. Constr. 2021, 130, 103842. [Google Scholar] [CrossRef]
- Volk, R.; Stengel, J.; Schultmann, F. Building Information Modeling (BIM) for existing buildings—Literature review and future needs. Autom. Constr. 2014, 38, 109–127. [Google Scholar] [CrossRef]
- Erfani, A.; Tavakolan, M.; Mashhadi, A.H.; Mohammadi, P. Heterogeneous or homogeneous? A modified decision-making approach in renewable energy investment projects. AIMS Energy 2021, 9, 558–580. [Google Scholar] [CrossRef]
- Moeinifard, P.; Rajabi, M.S.; Bitaraf, M. Lost Vibration Test Data Recovery Using Convolutional Neural Network: A Case Study. arXiv 2022, arXiv:2204.05440. [Google Scholar]
- Beigi, P.; Khoueiry, M.; Rajabi, M.S.; Hamdar, S. Station Reallocation and Rebalancing Strategy for Bike-Sharing Systems: A Case Study of Washington DC. arXiv 2022, arXiv:2204.07875. [Google Scholar]
- Beigi, P.; Haque, M.; Rajabi, M.S.; Hamdar, S. Bike Share’s Impact on COVID-19 Transmission and Bike Share’s Responses to COVID-19: A case study of Washington DC. arXiv 2022, arXiv:2205.05011v1. [Google Scholar]
- Aghakhani, S.; Mohammadi, B.; Rajabi, M.S. A New Hybrid Multi-Objective Scheduling Model for Hierarchical Hub and Flexible Flow Shop Problems. arXiv 2022, arXiv:2205.06465. [Google Scholar]
- Penttilä, H.; Rajala, M.; Freese, S. Building information modelling of modern historic buildings. In Proceedings of the 25th eCAADe Conference Proceedings, CUMINCAD, Frankfurt, Germany, 26–29 October 2007. [Google Scholar]
- Hosseini, M.R.; Azari, E.; Tivendale, L.; Banihashemi, S.; Chileshe, N. Building Information Modeling (BIM) in Iran: An Exploratory Study. J. Eng. Proj. Prod. Manag. 2016, 6, 78–89. [Google Scholar] [CrossRef]
- Zhang, S.; Teizer, J.; Lee, J.K.; Eastman, C.M.; Venugopal, M. Building Information Modeling (BIM) and Safety: Automatic Safety Checking of Construction Models and Schedules. Autom. Constr. 2013, 29, 183–195. [Google Scholar] [CrossRef]
- Rajabi, M.S.; Taghaddos, H.; Zahrai, M. Improving Emergency Training for Earthquakes through Immersive Virtual Environments and Anxiety Tests: A Case Study. arXiv 2022, arXiv:2205.04993. [Google Scholar]
- Mudiyanselage, S.E.; Nguyen, P.H.D.; Rajabi, M.S.; Akhavian, R. Automated Workers’ Ergonomic Risk Assessment in Manual Material Handling Using sEMG Wearable Sensors and Machine Learning. Electronics 2021, 10, 2558. [Google Scholar] [CrossRef]
- Rajabi, M.S.; Beigi, P.; Aghakhani, S. Drone Delivery Systems and Energy Management: A Review and Future Trends. arXiv 2022, arXiv:2206.10765. [Google Scholar]
- Lotfi, R.; Kargar, B.; Gharehbaghi, A.; Afshar, M.; Rajabi, M.S.; Mardani, N. A data-driven robust optimization for multi-objective renewable energy location by considering risk. In Environment, Development and Sustainability; Springer: Berlin/Heidelberg, Germany, 2022. [Google Scholar]
- Beigi, P.; Rajabi, M.S.; Aghakhani, S. An Overview of Drone Energy Consumption Factors and Models. arXiv 2022, arXiv:2206.10775. [Google Scholar]
- Shakerian, M.; Rajabi, M.S.; Tajik, M.; Taghaddos, H. Hybrid Simulation-based Resource Planning and Constructability Analysis of RCC Pavement Projects. arXiv 2022, arXiv:220405659. [Google Scholar]
- Oraee, M.; Hosseini, M.R.; Edwards, D.J.; Li, H.; Papadonikolaki, E.; Cao, D. Collaboration barriers in BIM-based construction networks: A conceptual model. Int. J. Proj. Manag. 2019, 37, 839–854. [Google Scholar] [CrossRef]
- Migilinskas, D.; Popov, V.; Juocevicius, V.; Ustinovichius, L. The Benefits, Obstacles and Problems of Practical Bim Implementation. Procedia Eng. 2013, 57, 767–774. [Google Scholar] [CrossRef]
- Charef, R.; Emmitt, S.; Alaka, H.; Fouchal, F. Building Information Modelling adoption in the European Union: An overview. J. Build. Eng. 2019, 25, 100777. [Google Scholar] [CrossRef]
- Tan, C.Y.M.; Rahman, R.A.; Xia, B.; Chen, Q. Streamlining WELL Concepts of Office Buildings for Developing Countries: The Case of Malaysia. In Construction Research Congress 2022; American Society of Civil Engineers: Reston, VA, USA, 2022; pp. 606–616. [Google Scholar]
- Al-Mohammad, M.S.; Haron, A.T.; Esa, M.; Aloko, M.N.; Alhammadi, Y.; Anandh, K.S.; Rahman, R.A. Factors affecting BIM implementation: Evidence from countries with different income levels. Constr. Innov. 26 April 2022; ahead-of-print. [Google Scholar]
- Al-Mohammad, M.S.; Haron, A.T.; Aloko, M.N.; Rahman, R.A. Factors affecting BIM implementation in post-conflict low-income economies: The case of Afghanistan. J. Eng. Des. Technol. 2021; ahead-of-print. [Google Scholar]
- Succar, B.; Kassem, M. Macro-BIM adoption: Conceptual structures. Autom. Constr. 2015, 57, 64–79. [Google Scholar] [CrossRef]
- Mahamadu, A.M.; Mahdjoubi, L.; Booth, C.; Manu, P.; Manu, E. Building information modelling (BIM) capability and delivery success on construction projects. Constr. Innov. 2019, 19, 170–192. [Google Scholar] [CrossRef]
- Antwi-Afari, M.F.; Li, H.; Pärn, E.A.; Edwards, D.J. Critical success factors for implementing building information modelling (BIM): A longitudinal review. Autom. Constr. 2018, 91, 100–110. [Google Scholar] [CrossRef]
- Ahuja, R.; Sawhney, A.; Jain, M.; Arif, M.; Rakshit, S. Factors influencing BIM adoption in emerging markets—The case of India. Int. J. Constr. Manag. 2020, 20, 65–76. [Google Scholar] [CrossRef]
- Wang, G.; Song, J. The relation of perceived benefits and organizational supports to user satisfaction with building information model (BIM). Comput. Hum. Behav. 2017, 68, 493–500. [Google Scholar] [CrossRef]
- Abbasnejad, B.; Nepal, M.P.; Ahankoob, A.; Nasirian, A.; Drogemuller, R. Building Information Modelling (BIM) adoption and implementation enablers in AEC firms: A systematic literature review. Archit. Eng. Des. Manag. 2021, 17, 411–433. [Google Scholar] [CrossRef]
- Arayici, Y.; Coates, P.; Koskela, L.; Kagioglou, M.; Usher, C.; O’Reilly, K. Technology adoption in the BIM implementation for lean architectural practice. Autom. Constr. 2011, 20, 189–195. [Google Scholar] [CrossRef]
- Gu, N.; London, K. Understanding and facilitating BIM adoption in the AEC industry. Autom. Constr. 2010, 19, 988–999. [Google Scholar] [CrossRef]
- Wong, A.K.D.; Wong, F.K.W.; Nadeem, A. Attributes of Building Information Modelling Implementations in Various Countries. Archit. Eng. Des. Manag. 2010, 6, 288–302. [Google Scholar] [CrossRef]
- Mirhosseini, S.A.; Kiani Mavi, R.; Kiani Mavi, N.; Abbasnejad, B.; Rayani, F. Interrelations among Leadership Competencies of BIM Leaders: A Fuzzy DEMATEL-ANP Approach. Sustainability 2020, 12, 7830. [Google Scholar] [CrossRef]
- Mahamadu, A.M.; Mahdjoubi, L.; Booth, C.A. Critical BIM qualification criteria for construction pre-qualification and selection. Archit. Eng. Des. Manag. 2017, 13, 326–343. [Google Scholar] [CrossRef]
- Eastman, C.M.; Eastman, C.; Teicholz, P.; Sacks, R.; Liston, K. BIM Handbook: A Guide to Building Information Modeling for Owners, Managers, Designers, Engineers and Contractors; John Wiley & Sons: Hoboken, NJ, USA, 2011. [Google Scholar]
- Azhar, S.; Carlton, W.A.; Olsen, D.; Ahmad, I. Building information modeling for sustainable design and LEED® rating analysis. Autom. Constr. 2011, 20, 217–224. [Google Scholar] [CrossRef]
- Lee, G.; Borrmann, A. BIM policy and management. Constr. Manag. Econ. 2020, 38, 413–419. [Google Scholar] [CrossRef]
- Ahn, Y.H.; Kwak, Y.H.; Suk, S.J. Contractors’ Transformation Strategies for Adopting Building Information Modeling. J. Manag. Eng. 2016, 32, 05015005. [Google Scholar] [CrossRef]
- Adriaanse, A.; Voordijk, H.; Dewulf, G. The use of interorganisational ICT in United States construction projects. Autom. Constr. 2010, 19, 73–83. [Google Scholar] [CrossRef]
- Klein, K.J.; Knight, A.P. Innovation Implementation. Curr. Dir. Psychol. Sci. 2005, 14, 243–246. [Google Scholar] [CrossRef]
- Villena-Manzanares, F.; García-Segura, T.; Pellicer, E. Organizational Factors That Drive to BIM Effectiveness: Technological Learning, Collaborative Culture, and Senior Management Support. Appl. Sci. 2020, 11, 199. [Google Scholar] [CrossRef]
- Succar, B.; Sher, W.; Williams, A. Measuring BIM performance: Five metrics. Archit. Eng. Des. Manag. 2012, 8, 120–142. [Google Scholar] [CrossRef]
- Du, J.; Liu, R.; Issa, R.R.A. BIM Cloud Score: Benchmarking BIM Performance. J. Constr. Eng. Manag. 2014, 140, 04014054. [Google Scholar] [CrossRef]
- Baden-Fuller, C.; Winter, S.G. Replicating Organizational Knowledge: Principles or Templates? SSRN Electron. J. 2008. [Google Scholar] [CrossRef][Green Version]
- Rogers, J.; Chong, H.Y.; Preece, C.; Lim, C.C.; Jayasena, H.S. BIM Development and Trends in Developing Countries: Case Studies; Bentham Science Publisher: Sharjah, United Arab Emirates, 2015. [Google Scholar]
- Rogers, J.; Chong, H.Y.; Preece, C. Adoption of Building Information Modelling technology (BIM). Eng. Constr. Archit. Manag. 2015, 22, 424–445. [Google Scholar] [CrossRef]
- Poirier, E.; Staub-French, S.; Forgues, D. Embedded contexts of innovation. Constr. Innov. 2015, 15, 42–65. [Google Scholar] [CrossRef]
- Kiani, I.; Sadeghifam, A.N.; Ghomi, S.K.; Marsono, A.K.B. Barriers to implementation of building information modeling in scheduling and planning phase in Iran. Aust. J. Basic Appl. Sci. 2015, 9, 91–97. [Google Scholar]
- Hosseini, M.R.; Azari, E.; Tivendale, L.; Chileshe, N. Barriers to adoption of building information modeling (BIM) in Iran: Preliminary results. In Proceedings of the 6th International Conference on Engineering, Project, and Production Management (EPPM2015), Gold Coast, Australia, 2 September 2015. [Google Scholar]
- Mamter, S.; Aziz, A.R.A.; Zulkepli, J. Root causes occurrence of low BIM adoption in Malaysia: System dynamics modelling approach. AIP Conf. Proc. 2017, 1903, 080011. [Google Scholar]
- Al-Ashmori, Y.Y.; Othman, I.; Rahmawati, Y.; Amran, Y.H.M.; Sabah, S.H.A.; Rafindadi, A.D.; Mikićf, M. BIM benefits and its influence on the BIM implementation in Malaysia. Ain Shams Eng. J. 2020, 11, 1013–1019. [Google Scholar] [CrossRef]
- Ismail, N.A.A.; Adnan, H.; Bakhary, N.A. Building Information Modelling (BIM) adoption by quantity surveyors: A preliminary survey from Malaysia. In IOP Conference Series: Earth and Environmental Science; IOP Publishing: Bristol, UK, 2019; p. 052041. [Google Scholar]
- Manzoor, B.; Othman, I.; Gardezi, S.S.S.; Harirchian, E. Strategies for Adopting Building Information Modeling (BIM) in Sustainable Building Projects—A Case of Malaysia. Buildings 2021, 11, 249. [Google Scholar] [CrossRef]
- Memon, A.H.; Rahman, I.A.; Memon, I.; Azman, N.I.A. BIM in Malaysian construction industry: Status, advantages, barriers and strategies to enhance the implementation level. Res. J. Appl. Sci. Eng. Technol. 2014, 8, 606–614. [Google Scholar] [CrossRef]
- Azhar, S.; Nadeem, A.; Mok, J.Y.N.; Leung, B.H.Y. Building Information Modeling (BIM): A new paradigm for visual interactive modeling and simulation for construction projects. In Proceedings of the First International Conference on Construction in Developing Countries, Karachi, Pakistan, 4–5 August 2008; pp. 435–446. [Google Scholar]
- Zheng, X.; Le, Y.; Chan, A.P.C.; Hu, Y.; Li, Y. Review of the application of social network analysis (SNA) in construction project management research. Int. J. Proj. Manag. 2016, 34, 1214–1225. [Google Scholar] [CrossRef]
- Yi, W.; Chan, A.P.C. Critical Review of Labor Productivity Research in Construction Journals. J. Manag. Eng. 2014, 30, 214–225. [Google Scholar] [CrossRef]
- Mahamadu, A.M.; Manu, P.; Mahdjoubi, L.; Booth, C.; Aigbavboa, C.; Abanda, F.H. The importance of BIM capability assessment. Eng. Constr. Archit. Manag. 2019, 27, 24–48. [Google Scholar] [CrossRef]
- Succar, B.; Sher, W.; Williams, A. An integrated approach to BIM competency assessment, acquisition and application. Autom. Constr. 2013, 35, 174–189. [Google Scholar] [CrossRef]
- McCuen, T.L.; Suermann, P.C.; Krogulecki, M.J. Evaluating Award-Winning BIM Projects Using the National Building Information Model Standard Capability Maturity Model. J. Manag. Eng. 2012, 28, 224–230. [Google Scholar] [CrossRef]
- Wang, Y.; Gosling, J.; Naim, M.M. Assessing supplier capabilities to exploit building information modelling. Constr. Innov. 2019, 19, 491–510. [Google Scholar] [CrossRef]
- Lattuch, F.; Hickey, R.B. From intention to action: An organizational learning case of implementing Building Information Modeling. Dev. Learn. Organ. Int. J. 2019, 34, 1–4. [Google Scholar] [CrossRef]
- Zhao, X.; Hwang, B.G.; Pheng Low, S.; Wu, P. Reducing Hindrances to Enterprise Risk Management Implementation in Construction Firms. J. Constr. Eng. Manag. 2015, 141, 04014083. [Google Scholar] [CrossRef]
- Patton, M.Q. Qualitative Research & Evaluation Methods: Integrating Theory and Practice; Sage Publications: Newbury Park, CA, USA, 2014. [Google Scholar]
- Wilkins, J.R. Construction workers’ perceptions of health and safety training programmes. Constr. Manag. Econ. 2011, 29, 1017–1026. [Google Scholar] [CrossRef]
- Owusu, E.K.; Chan, A.P.C.; Hosseini, M.R. Impacts of anti-corruption barriers on the efficacy of anti-corruption measures in infrastructure projects: Implications for sustainable development. J. Clean. Prod. 2020, 246, 119078. [Google Scholar] [CrossRef]
- Adabre, M.A.; Chan, A.P.C. Towards a sustainability assessment model for affordable housing projects: The perspective of professionals in Ghana. Eng. Constr. Archit. Manag. 2020, 27, 2523–2551. [Google Scholar] [CrossRef]
- Radzi, A.R.; Rahman, R.A.; Almutairi, S. Modeling COVID-19 Impacts and Response Strategies in the Construction Industry: PLS–SEM Approach. Int. J. Environ. Res. Public Health 2022, 19, 5326. [Google Scholar] [CrossRef] [PubMed]
- Mao, C.; Shen, Q.; Pan, W.; Ye, K. Major Barriers to Off-Site Construction: The Developer’s Perspective in China. J. Manag. Eng. 2015, 31, 04014043. [Google Scholar] [CrossRef]
- Chan, A.P.C.; Darko, A.; Olanipekun, A.O.; Ameyaw, E.E. Critical barriers to green building technologies adoption in developing countries: The case of Ghana. J. Clean. Prod. 2018, 172, 1067–1079. [Google Scholar] [CrossRef]
- Badraddin, A.K.; Radzi, A.R.; Almutairi, S.; Rahman, R.A. Critical Success Factors for Concrete Recycling in Construction Projects. Sustainability 2022, 14, 3102. [Google Scholar] [CrossRef]
- Nunnally, J.C. Psychometric Theory 3E; Tata McGraw-Hill Education: New York, NY, USA, 1994. [Google Scholar]
- Darko, A.; Chan, A.P.C.; Owusu-Manu, D.G.; Ameyaw, E.E. Drivers for implementing green building technologies: An international survey of experts. J. Clean. Prod. 2017, 145, 386–394. [Google Scholar] [CrossRef]
- Gel, Y.R.; Miao, W.; Gastwirth, J.L. Robust directed tests of normality against heavy-tailed alternatives. Comput. Stat. Data Anal. 2007, 51, 2734–2746. [Google Scholar] [CrossRef]
- Osei-Kyei, R.; Chan, A.P.C. Comparative Analysis of the Success Criteria for Public–Private Partnership Projects in Ghana and Hong Kong. Proj. Manag. J. 2017, 48, 80–92. [Google Scholar] [CrossRef]
- Freeman, L.C. The development of social network analysis–With an emphasis on recent events. Sage Handb. Soc. Netw. Anal. 2011, 21, 26–39. [Google Scholar]
- Scott, J. Social Network Analysis. Sociology 1988, 22, 109–127. [Google Scholar] [CrossRef]
- Norusis, M. SPSS 16.0 Advanced Statistical Procedure; Companion Prentice Hall: Upper Saddle River, NJ, USA, 2008. [Google Scholar]
- Julie, P. SPSS SURVIVAL MANUAL-A Step by Step Guide to Data Analysis Using SPSS; Allen & Unwin: Crows Nest, Australia, 2011. [Google Scholar]
- Radzi, A.R.; Rahman, R.A.; Doh, S.I.; Esa, M. Construction Readiness for Highway Projects: Key Decision Criteria. J. Constr. Eng. Manag. 2022, 148, 04021196. [Google Scholar] [CrossRef]
- Zhang, B.; Le, Y.; Xia, B.; Skitmore, M. Causes of Business-to-Government Corruption in the Tendering Process in China. J. Manag. Eng. 2017, 33, 05016022. [Google Scholar] [CrossRef]
- Owusu, E.K.; Chan, A.P.C.; Shan, M. Causal Factors of Corruption in Construction Project Management: An Overview. Sci. Eng. Ethics 2019, 25, 1–31. [Google Scholar] [CrossRef]
- Munianday, P.; Radzi, A.R.; Esa, M.; Rahman, R.A. Optimal Strategies for Improving Organizational BIM Capabilities: PLS-SEM Approach. J. Manag. Eng. 2022, 38, 04022015. [Google Scholar] [CrossRef]
- Othman, I.; Al-Ashmori, Y.Y.; Rahmawati, Y.; Mugahed Amran, Y.H.; Al-Bared, M.A.M. The level of Building Information Modelling (BIM) Implementation in Malaysia. Ain Shams Eng. J. 2021, 12, 455–463. [Google Scholar] [CrossRef]
- Mehran, D. Exploring the Adoption of BIM in the UAE Construction Industry for AEC Firms. Procedia Eng. 2016, 145, 1110–1118. [Google Scholar] [CrossRef]
- Hong, Y.; Hammad, A.W.A.; Sepasgozar, S.; Akbarnezhad, A. BIM adoption model for small and medium construction organisations in Australia. Eng. Constr. Archit. Manag. 2019, 26, 154–183. [Google Scholar] [CrossRef]
- Dang, N.S.; Rho, G.T.; Shim, C.S. A Master Digital Model for Suspension Bridges. Appl. Sci. 2020, 10, 7666. [Google Scholar] [CrossRef]
- Hanafi, M.H.; Gek Sing, G.; Abdullah, S.; Ismail, R. Organisational readiness of building information modelling implementation: Architectural practices. J. Teknol. 2016, 78. [Google Scholar] [CrossRef]
- Chen, L.; Fong, P.S.W. Visualizing Evolution of Knowledge Management Capability in Construction Firms. J. Constr. Eng. Manag. 2013, 139, 839–851. [Google Scholar] [CrossRef]
- Too, E.G. Capability Model to Improve Infrastructure Asset Performance. J. Constr. Eng. Manag. 2012, 138, 885–896. [Google Scholar] [CrossRef][Green Version]
- Collis, D.J. Research note: How valuable are organizational capabilities? Strateg. Manag. J. 1994, 15, 143–152. [Google Scholar] [CrossRef]
- Patton, M.Q. Qualitative Evaluation and Research Methods; SAGE Publications, Inc.: Thousand Oaks, CA, USA, 1990. [Google Scholar]
Publisher’s Note: MDPI stays neutral with regard to jurisdictional claims in published maps and institutional affiliations. |
© 2022 by the authors. Licensee MDPI, Basel, Switzerland. This article is an open access article distributed under the terms and conditions of the Creative Commons Attribution (CC BY) license (https://creativecommons.org/licenses/by/4.0/).