
Modelling of Cyclic Load Behaviour of Smart Composite Steel-Concrete Shear Wall Using Finite Element Analysis

 ,
,  ,
,  ,
,  ,
,
Abstract
:1. Introduction
2. Experimental Work
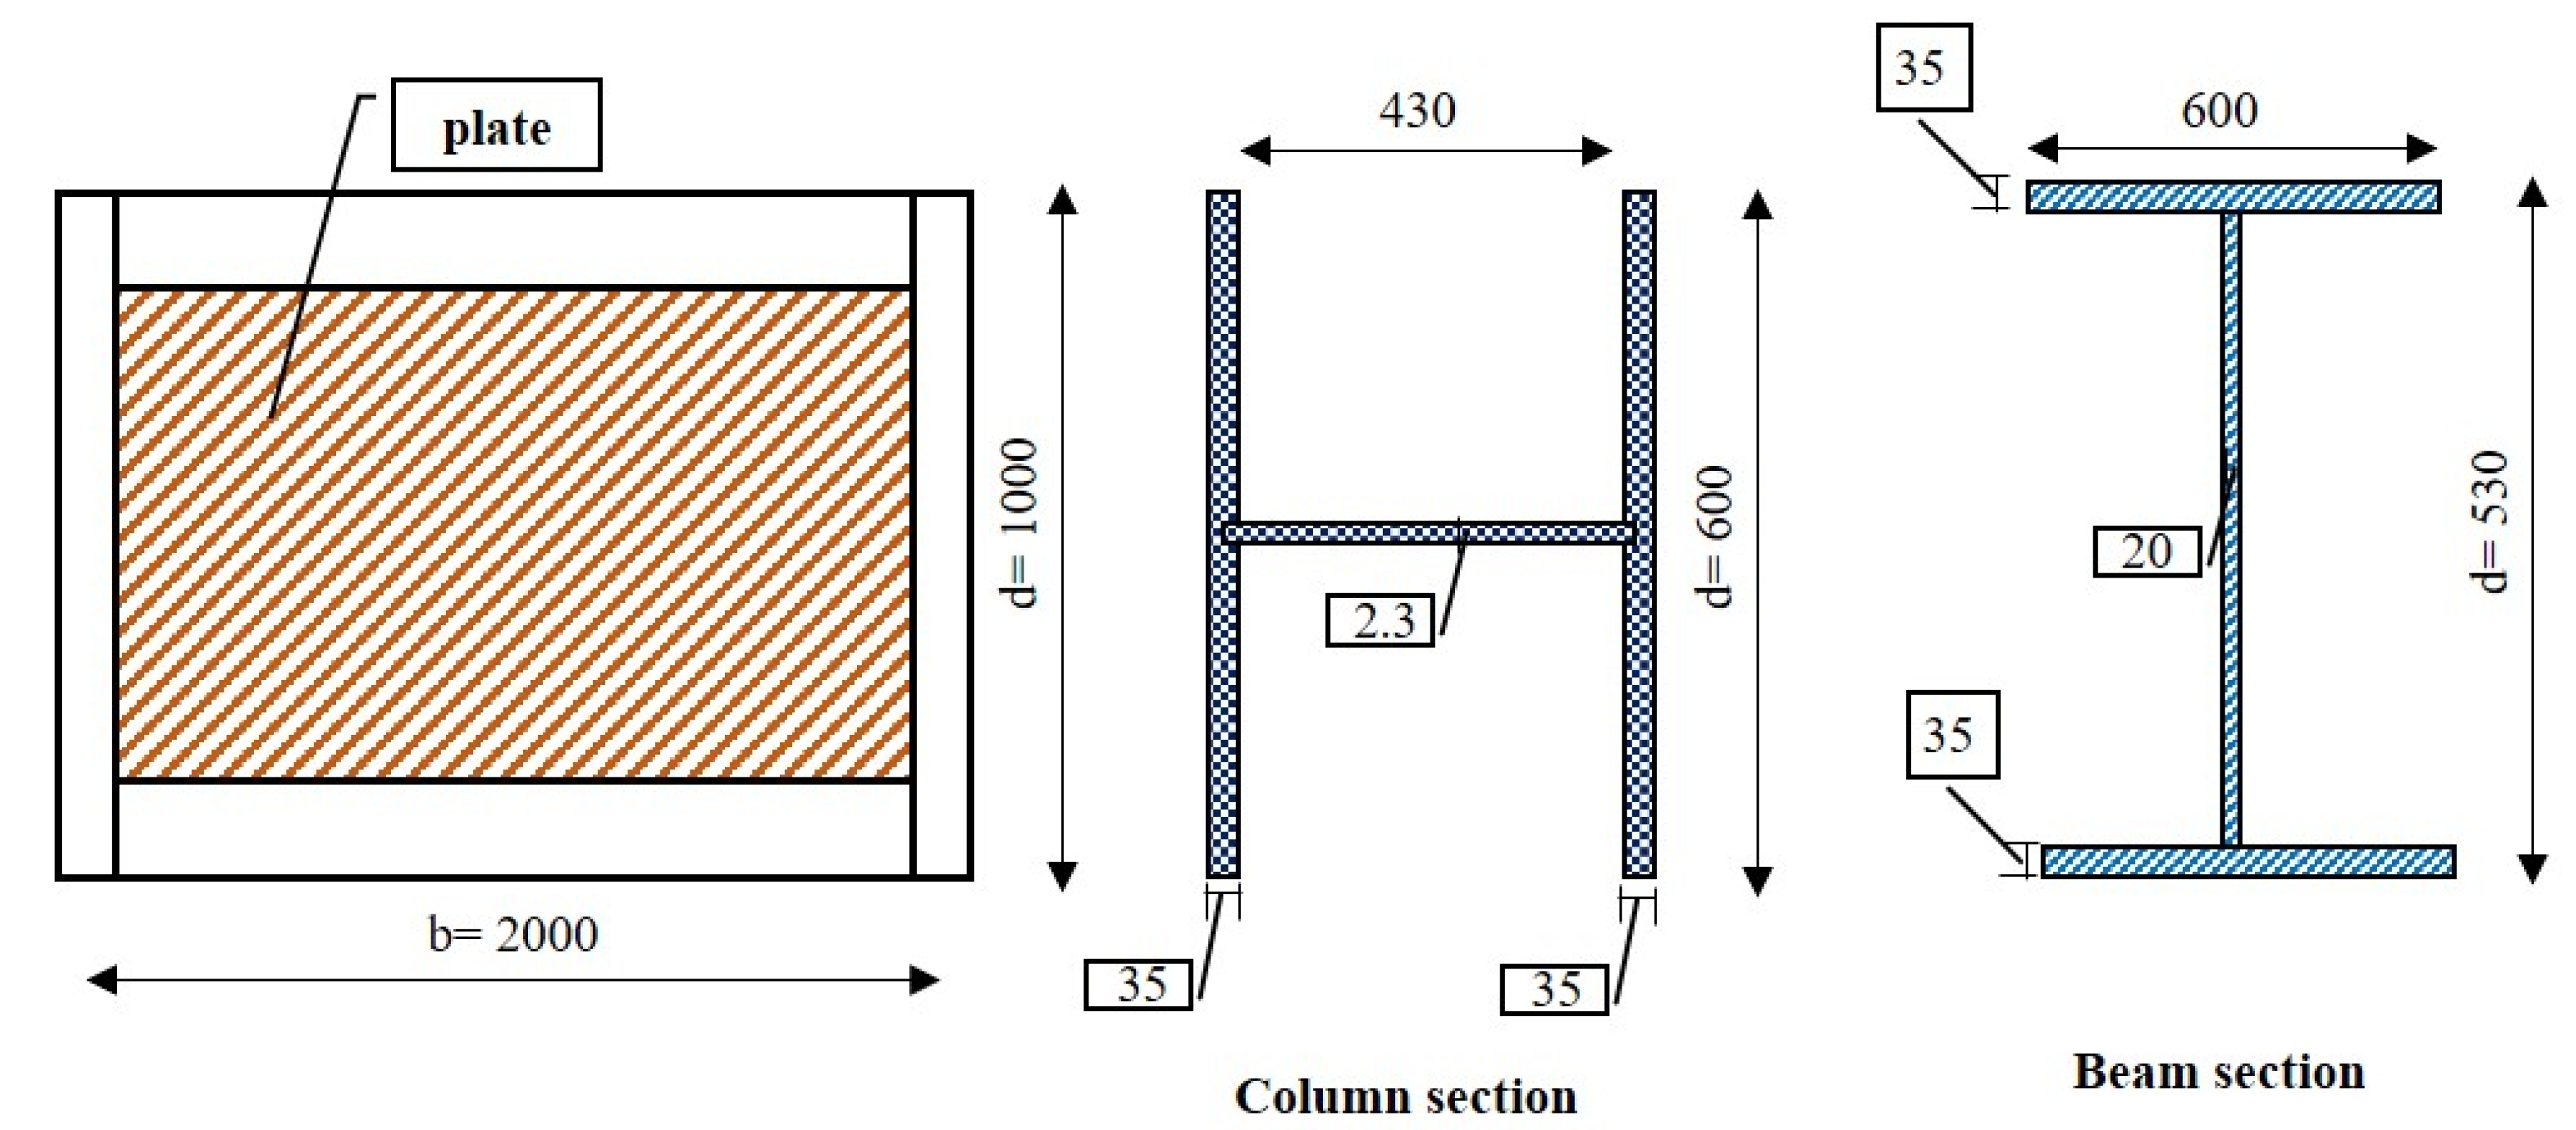
2.1. Sample Design
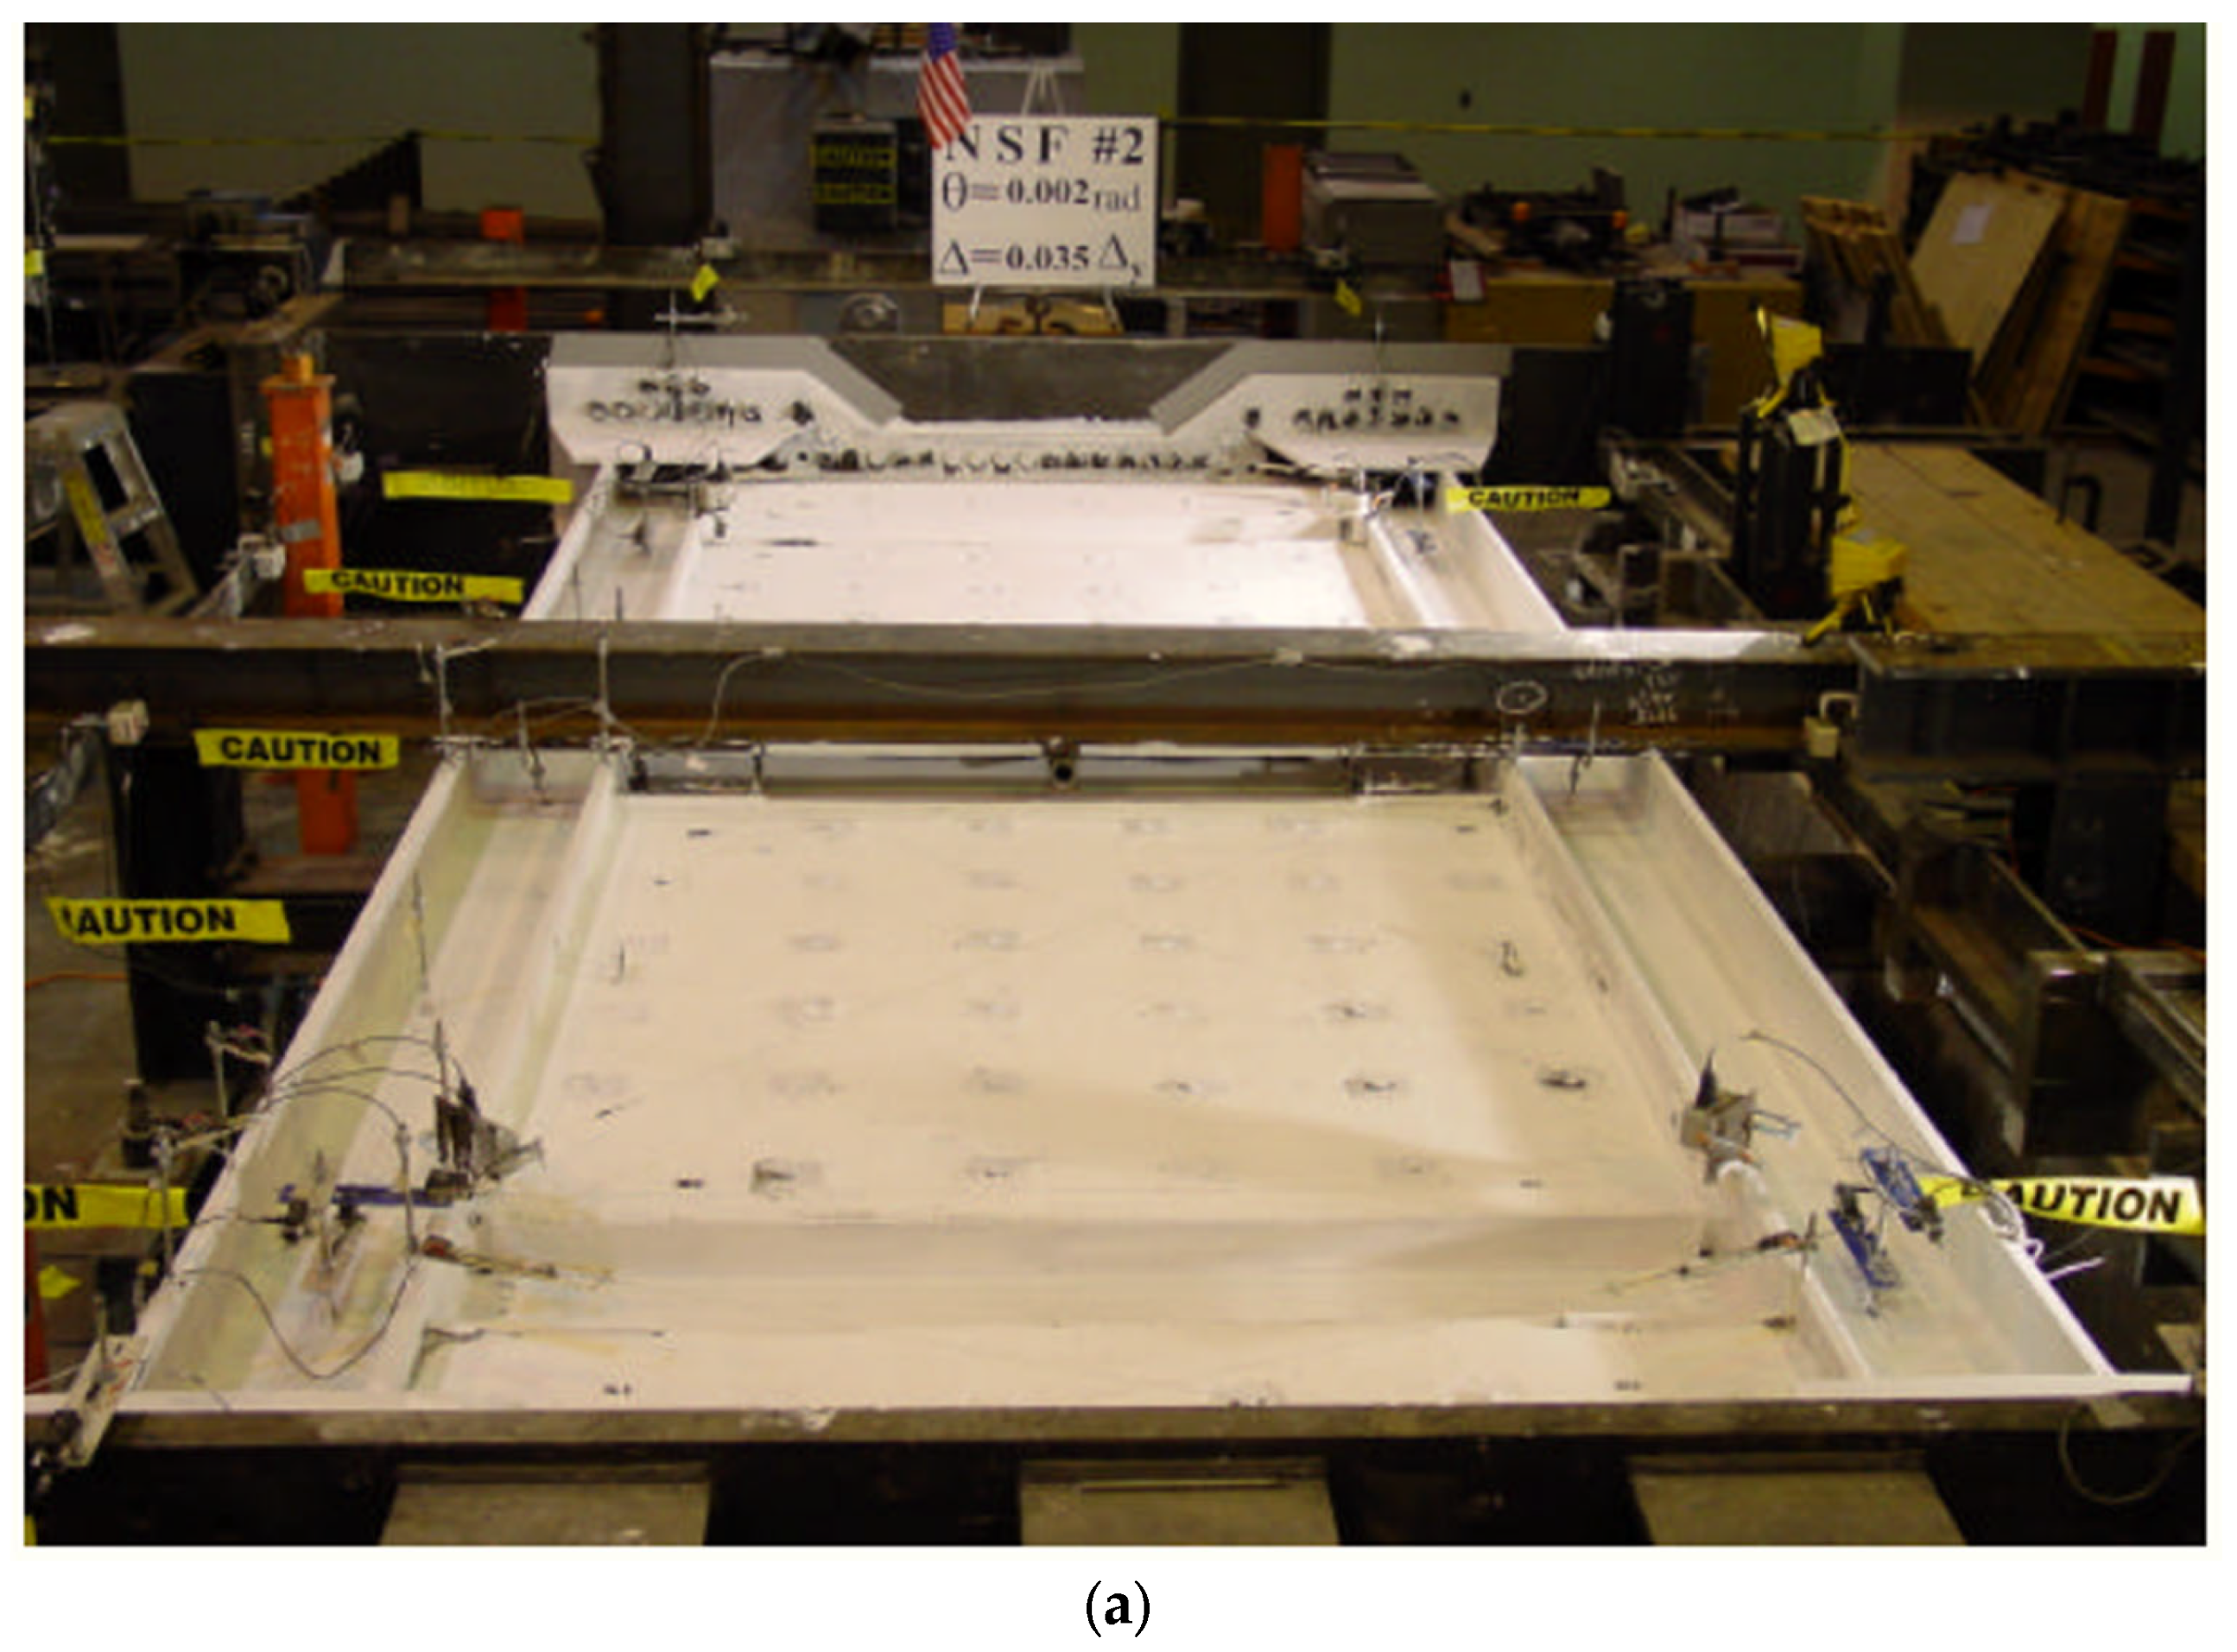
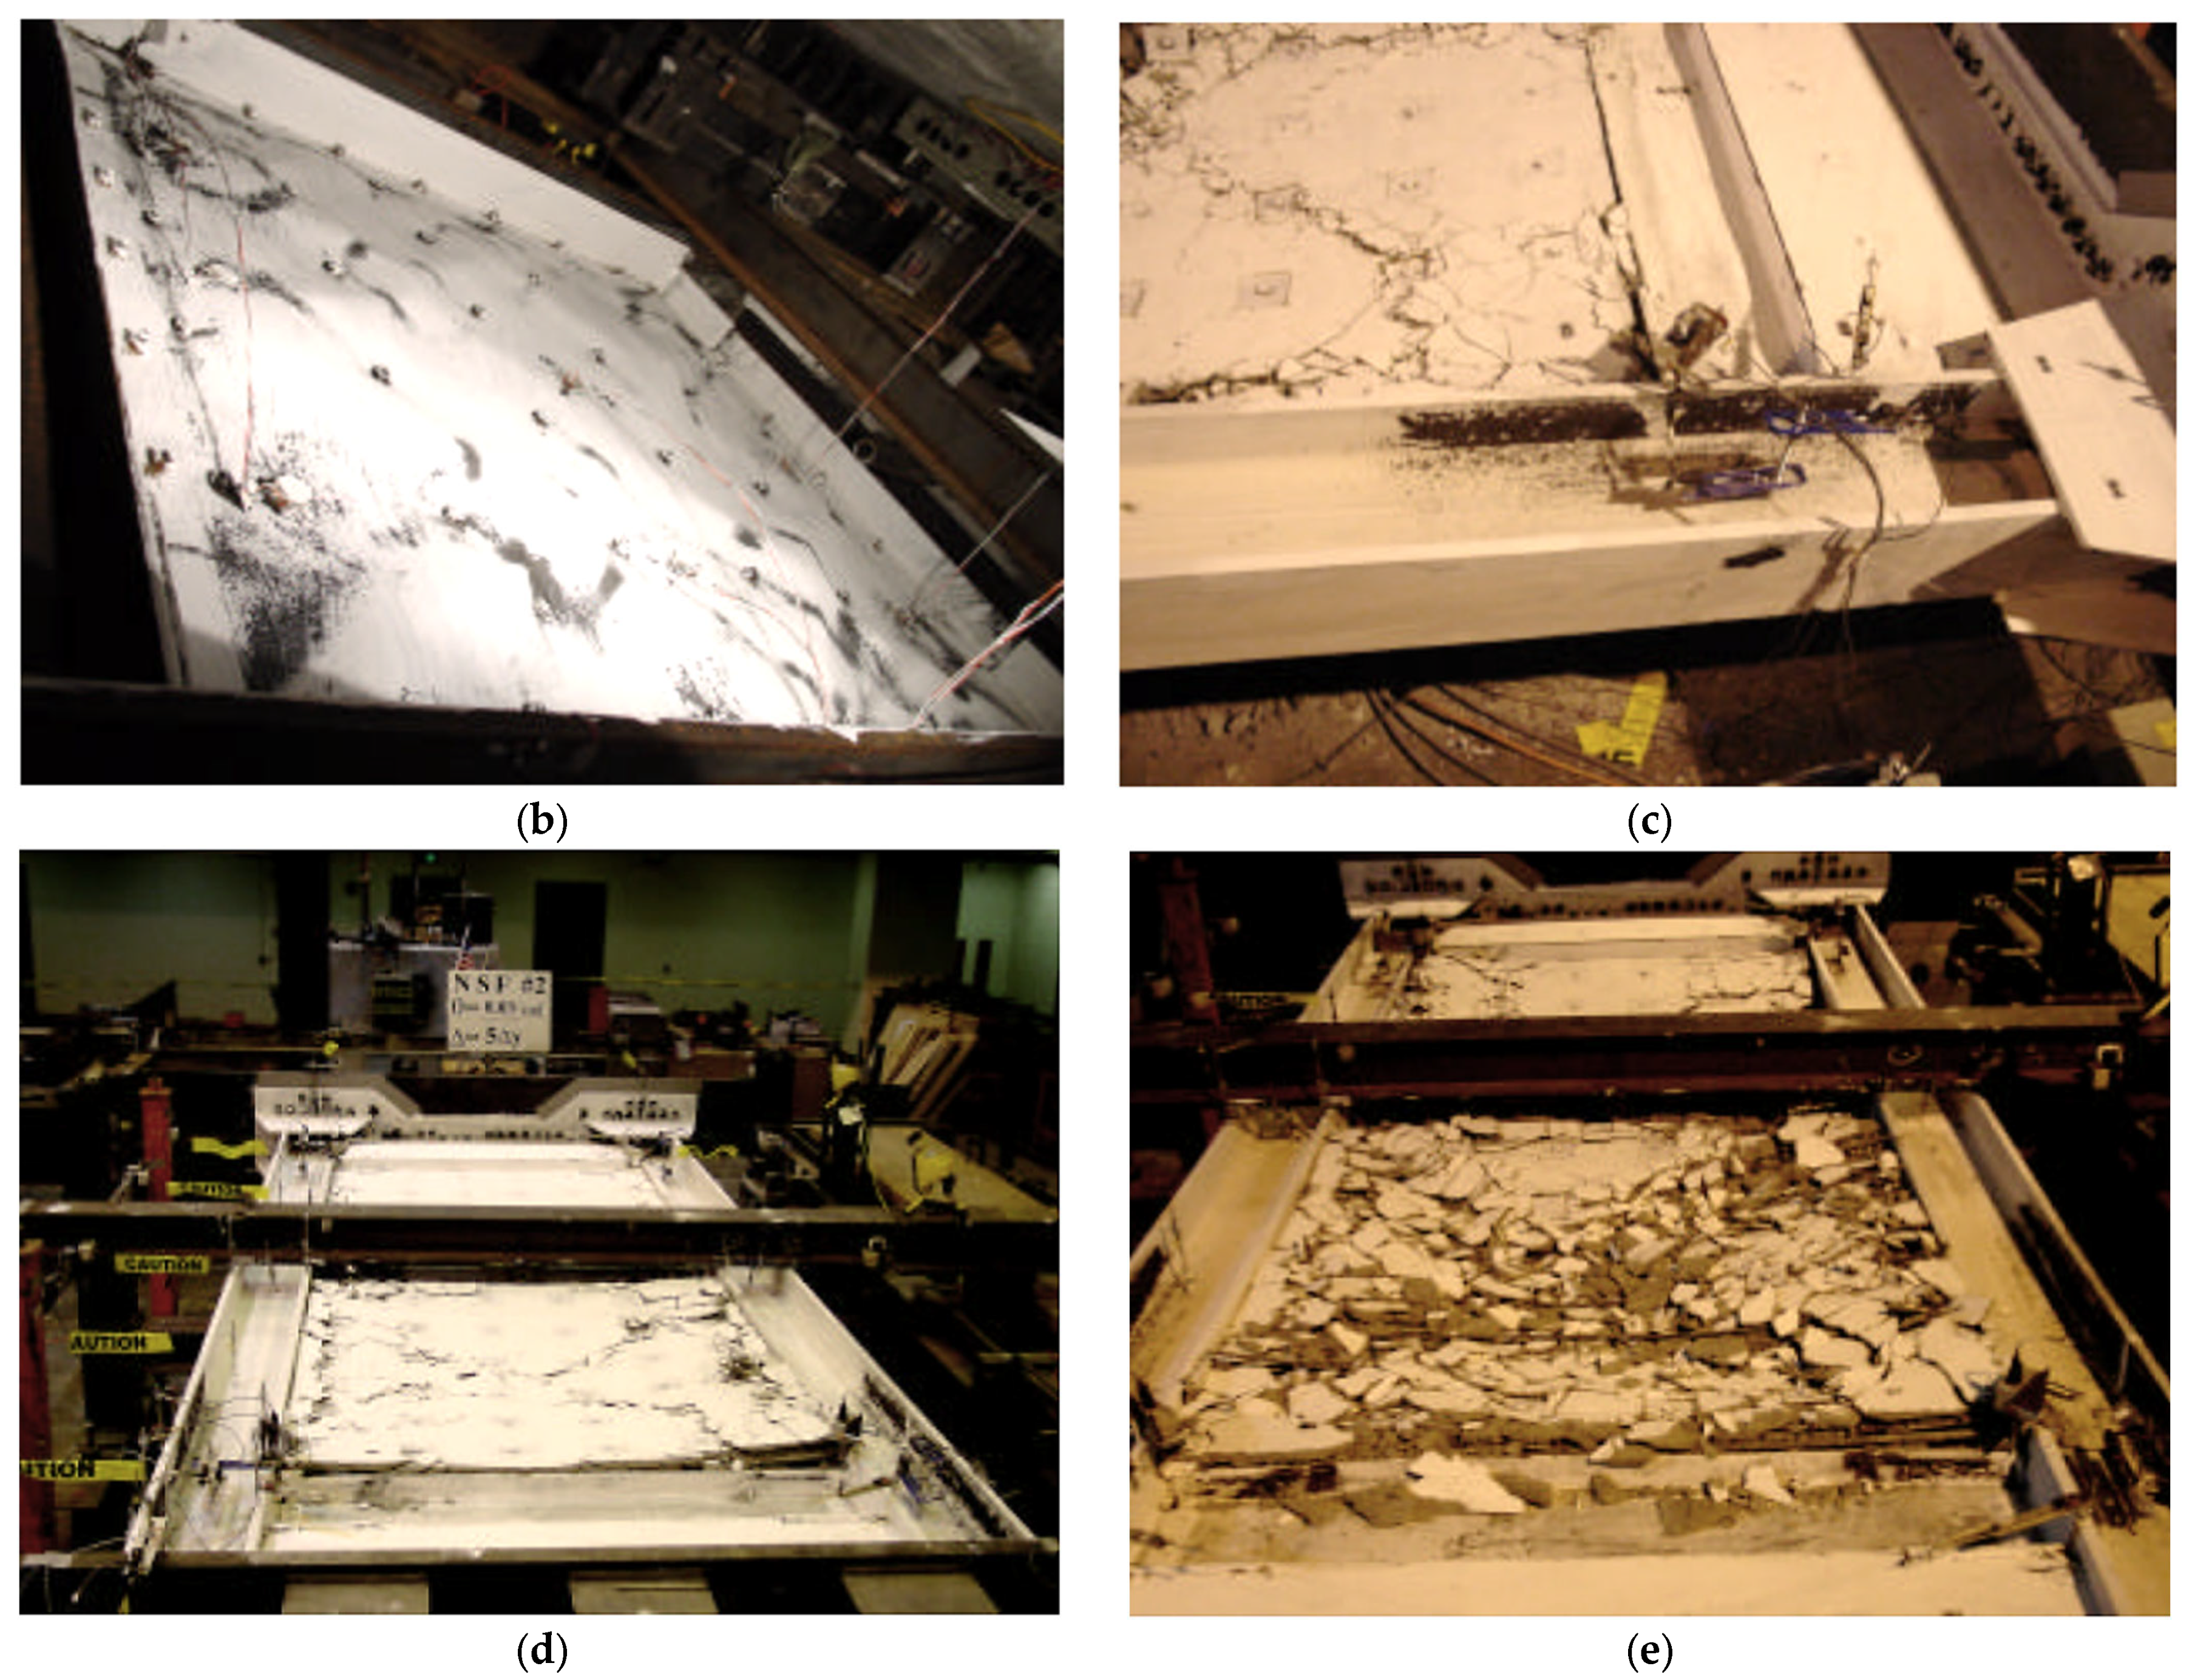
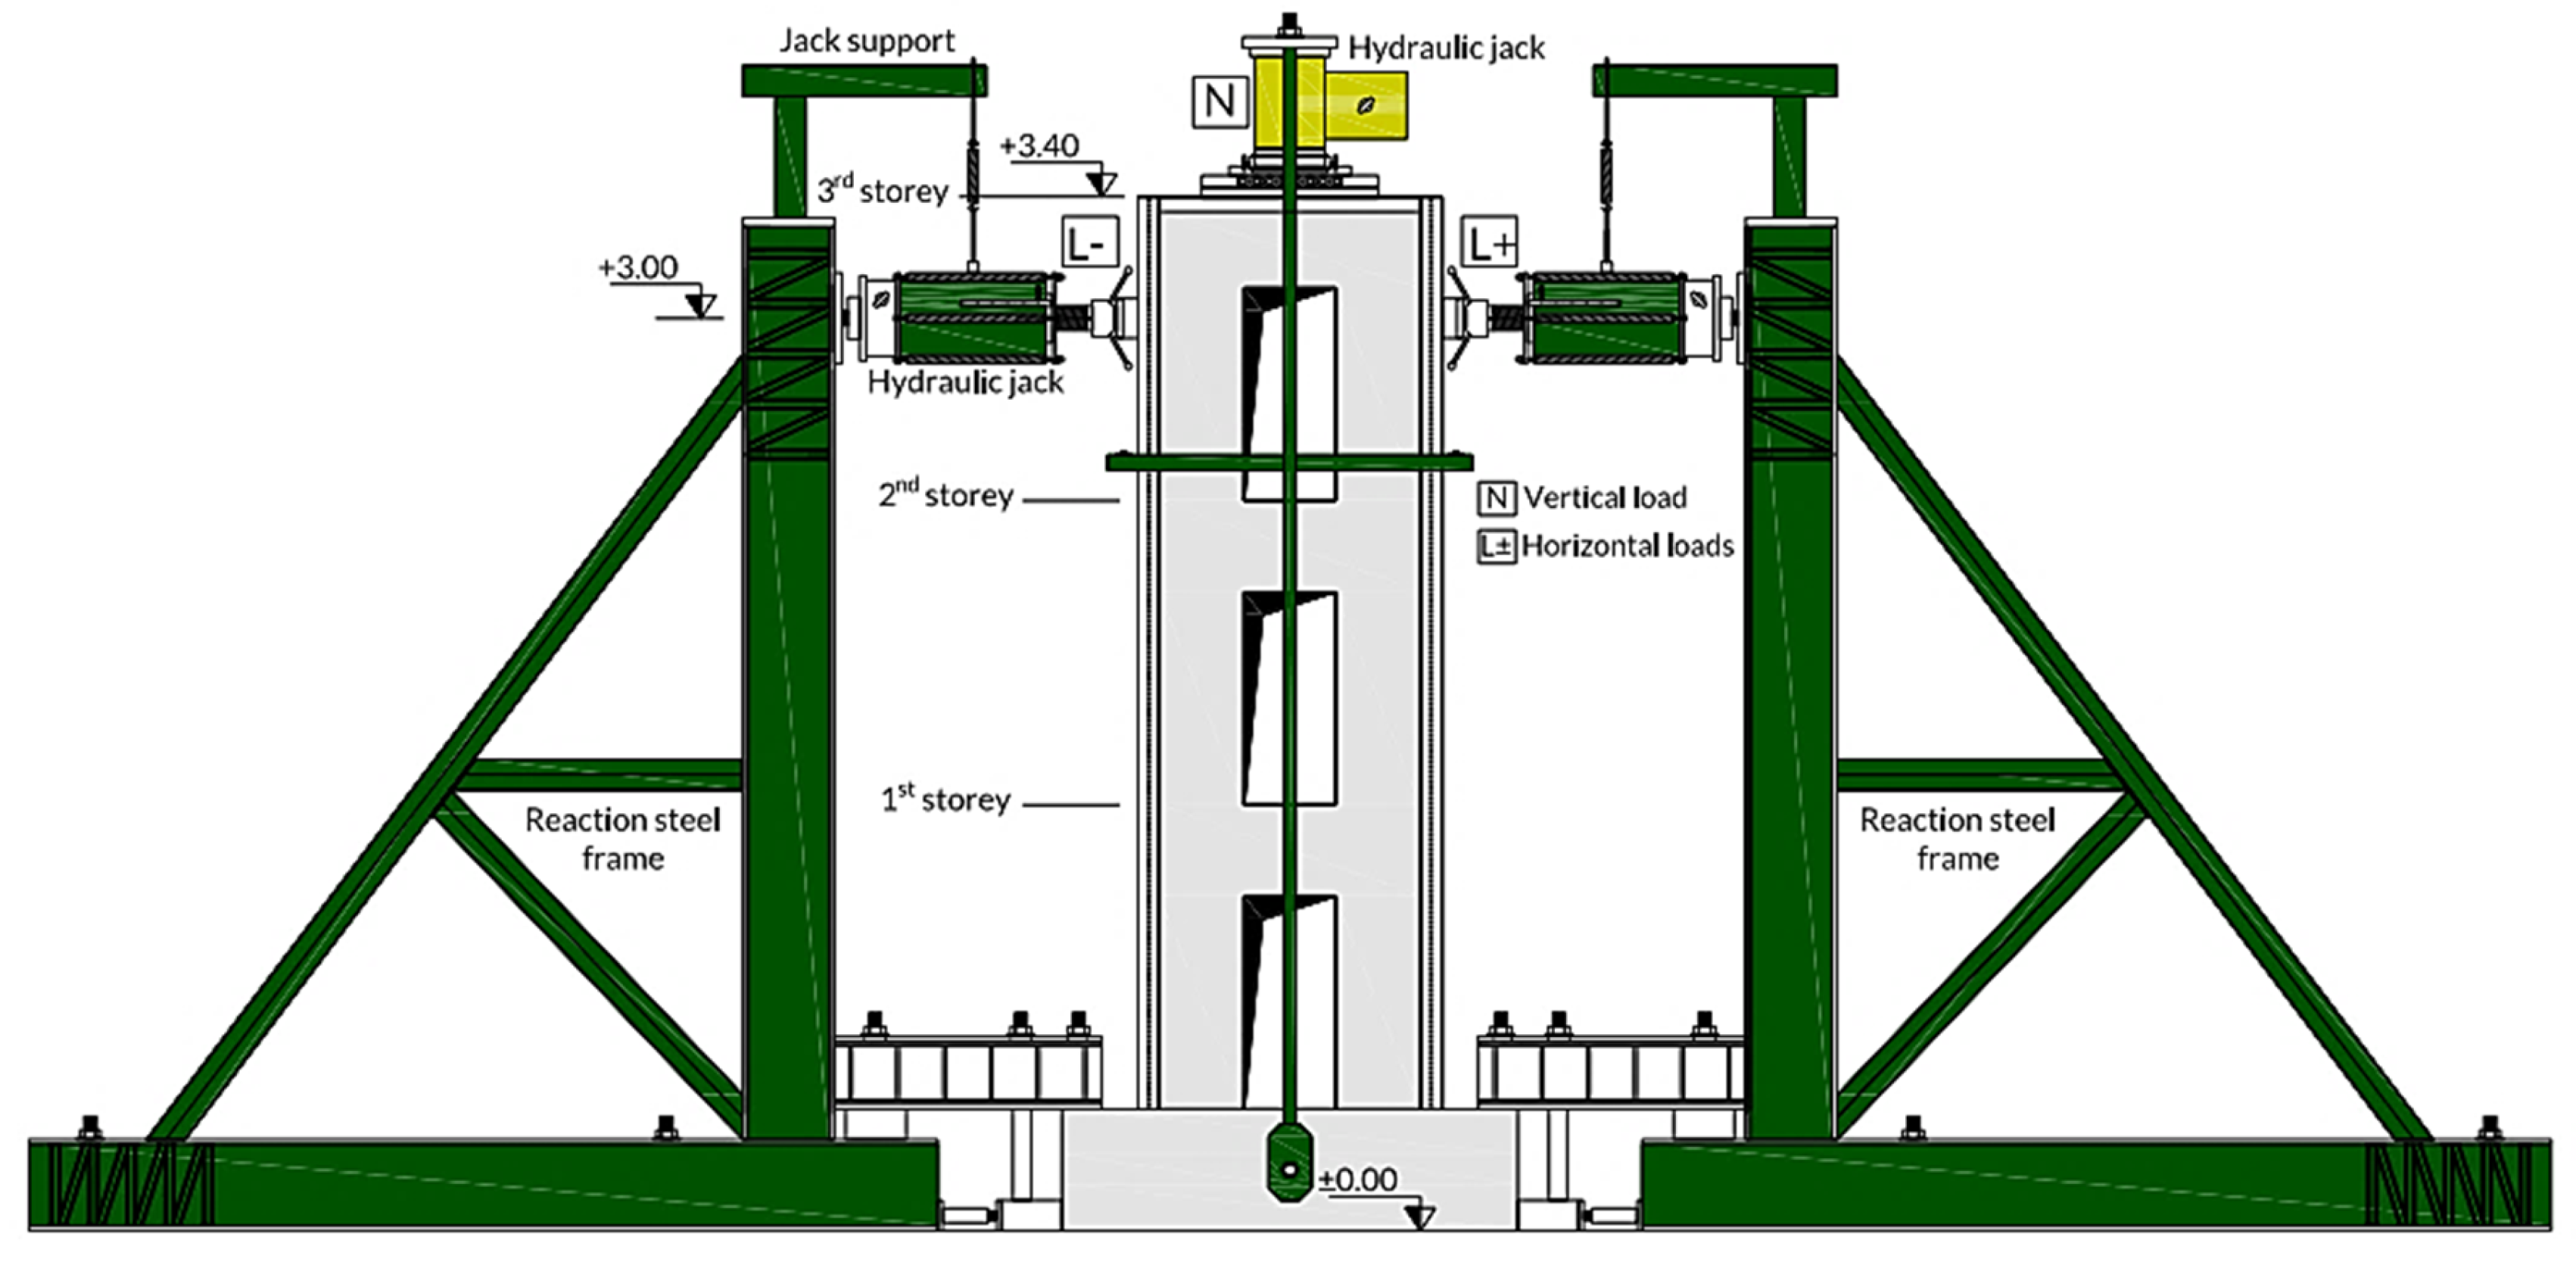
2.2. Loading Programme and Test Setup
3. Finite Element Model (FEM)
3.1. Model Overview
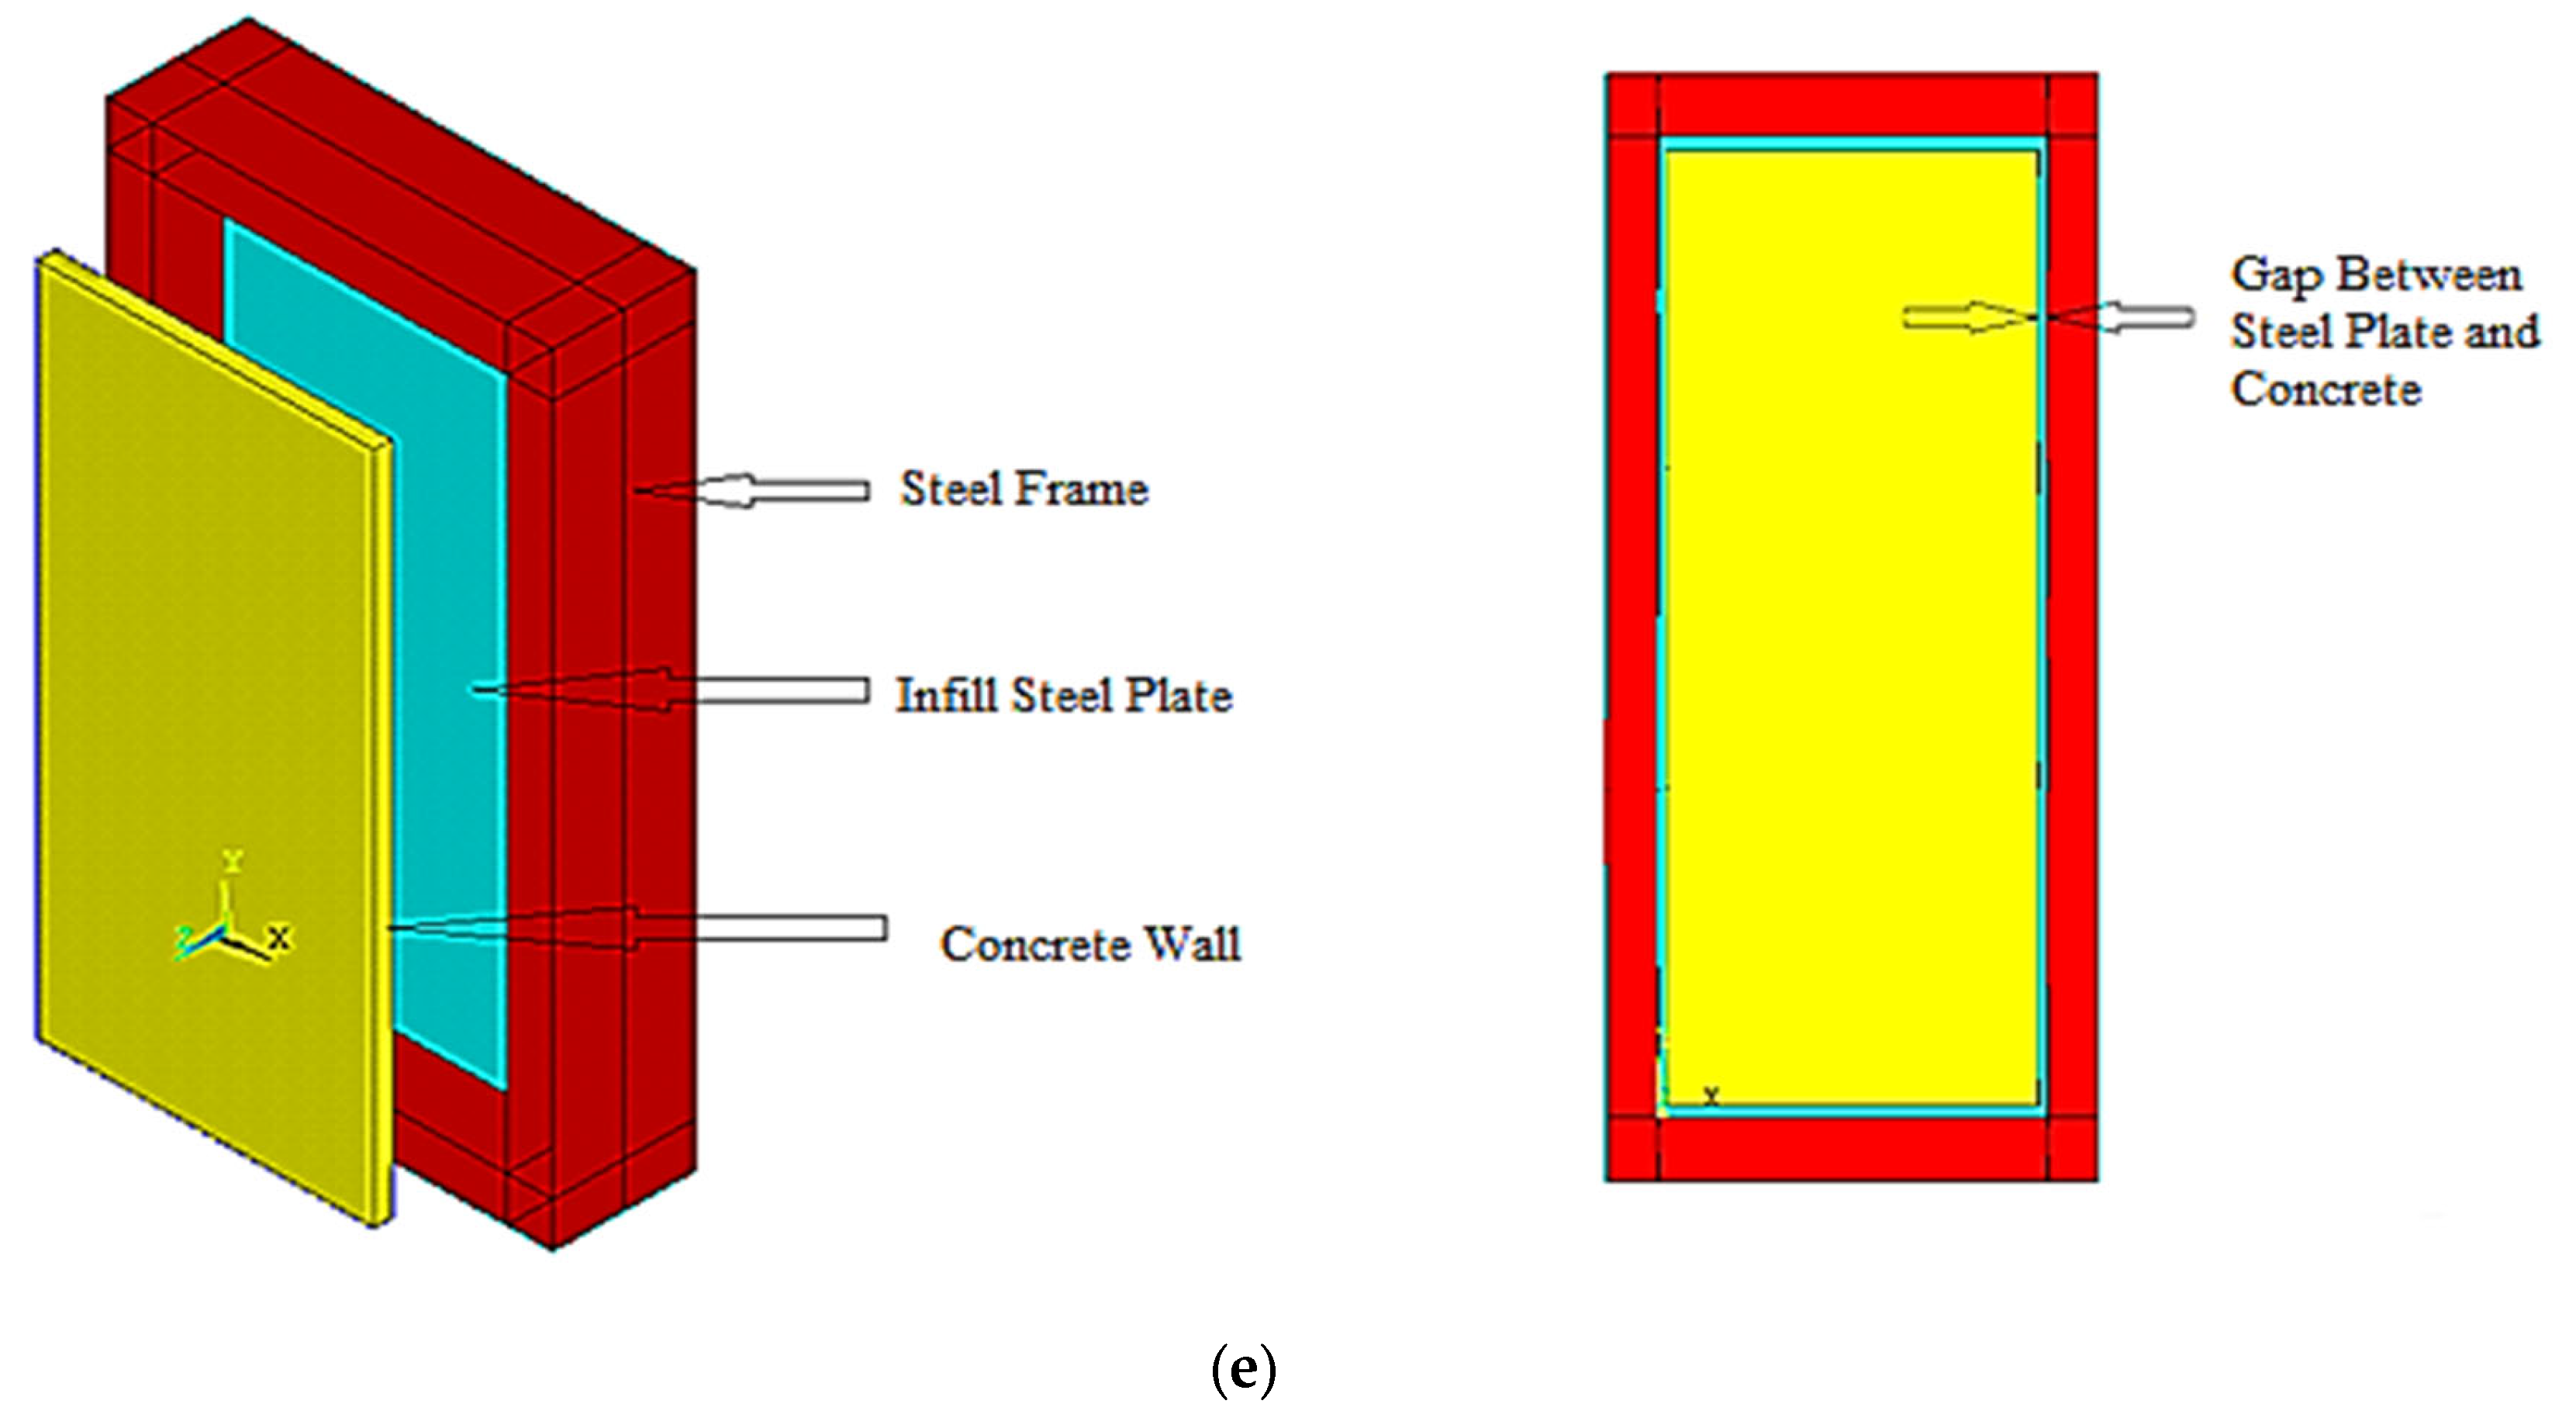
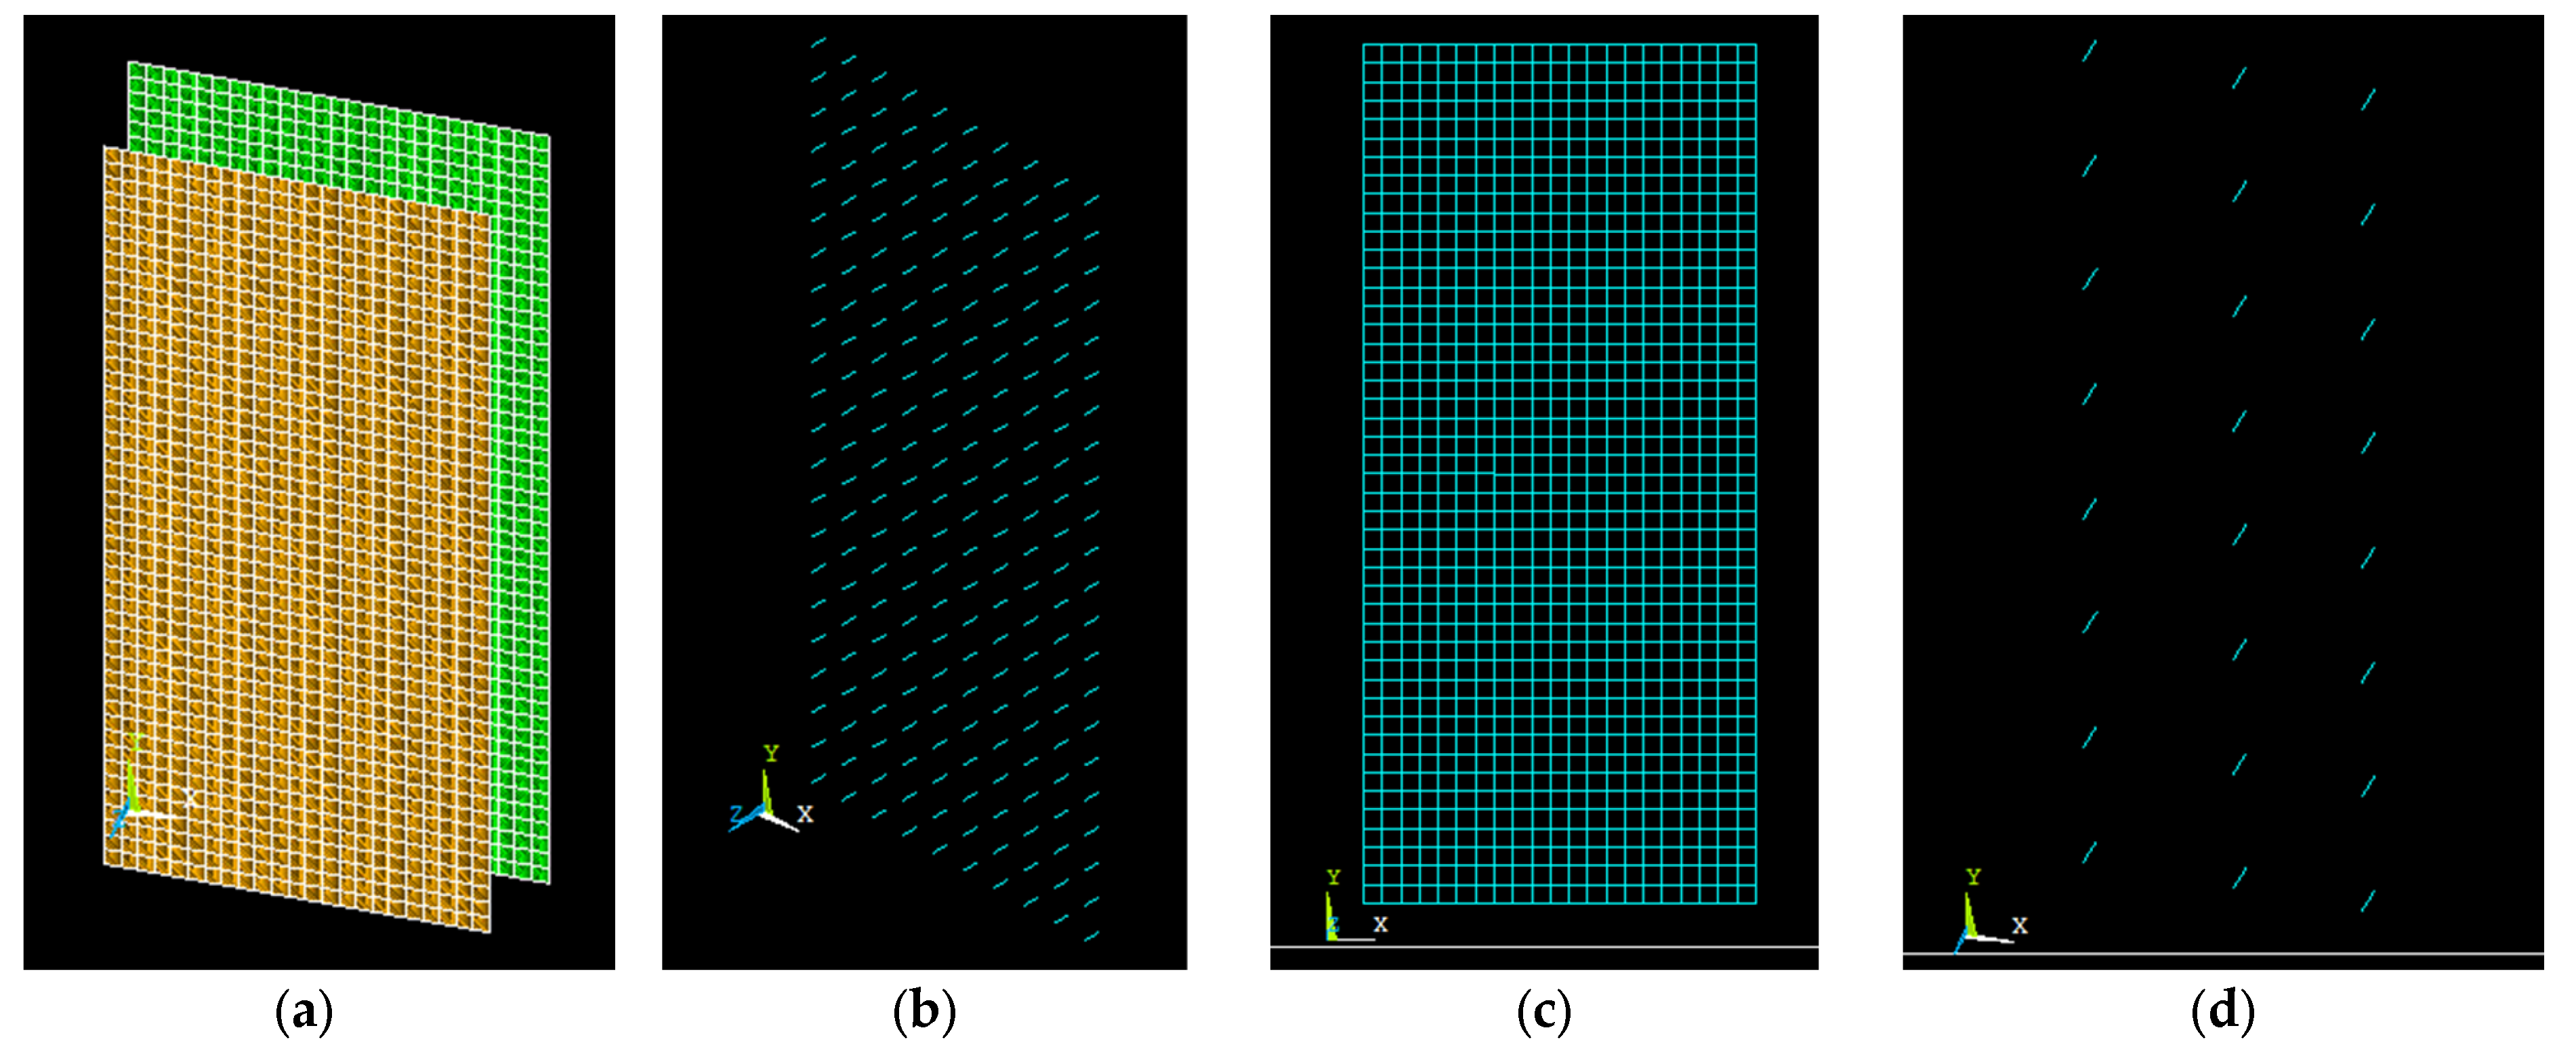
3.1.1. Part and Element of the FE Model
3.1.2. Contact of FE Mode
3.1.3. Boundary Conditions
3.1.4. Steel Constitutive Model
3.1.5. Concrete Constitutive Model
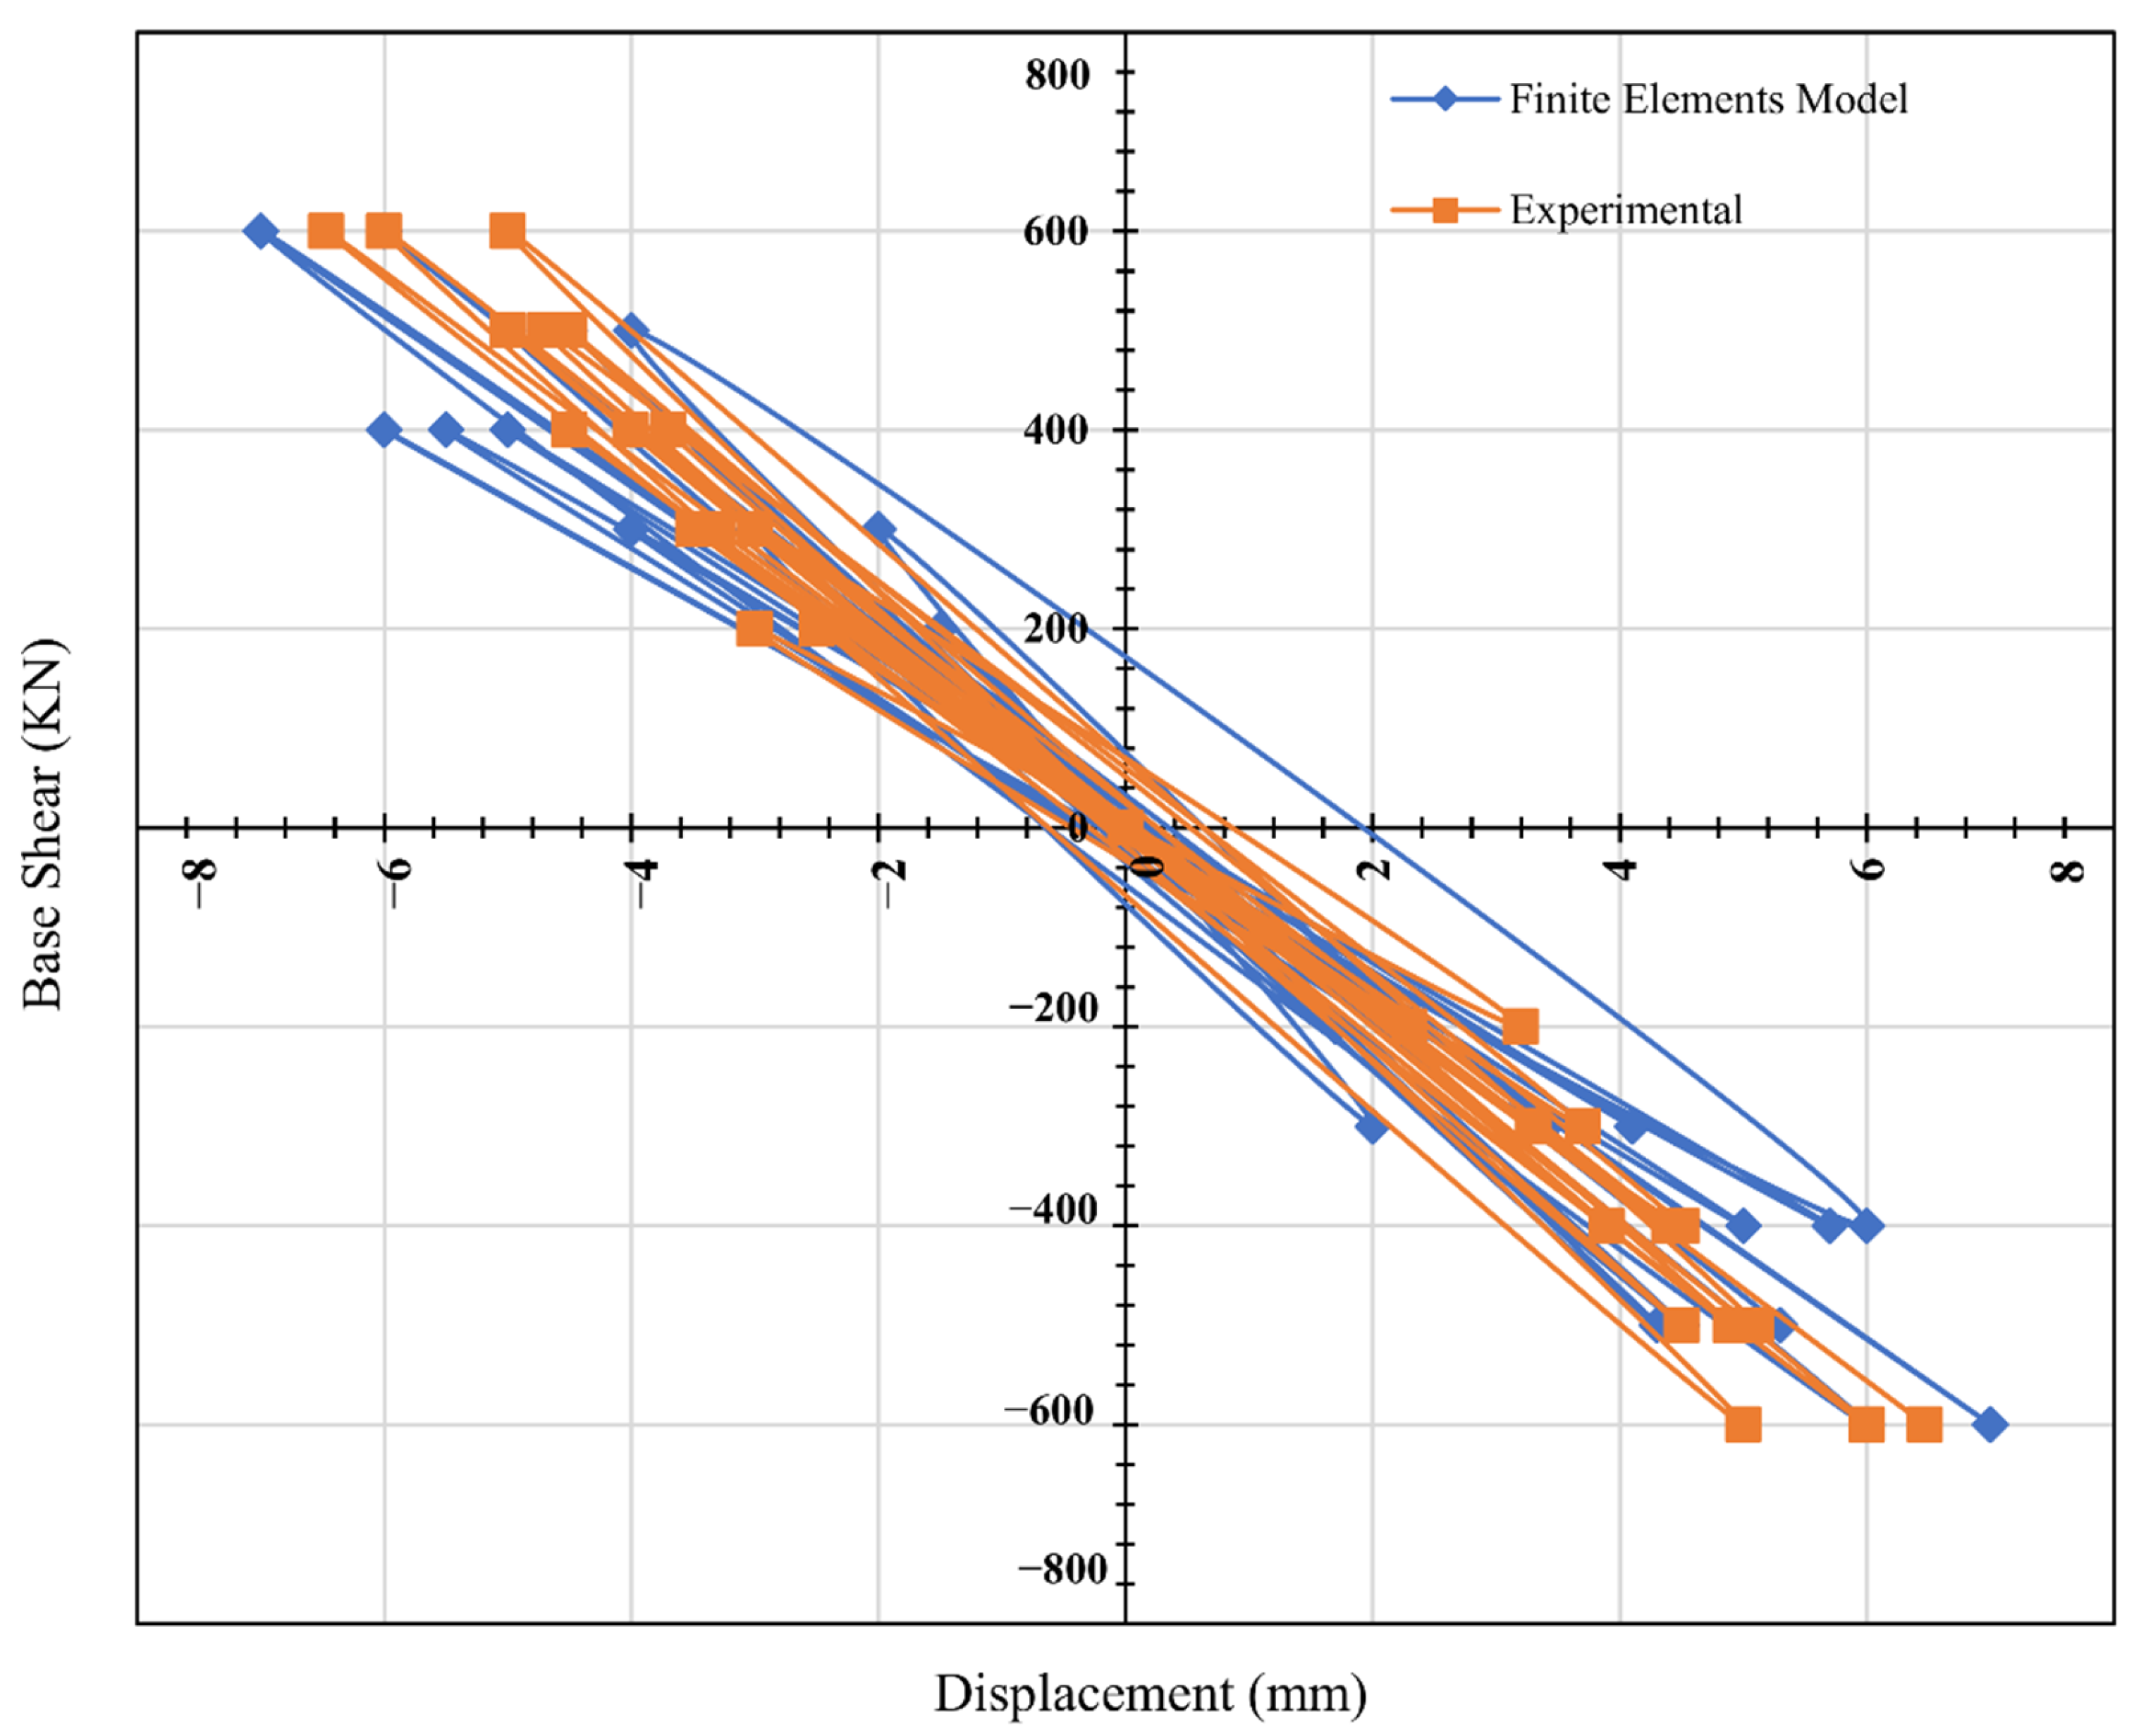
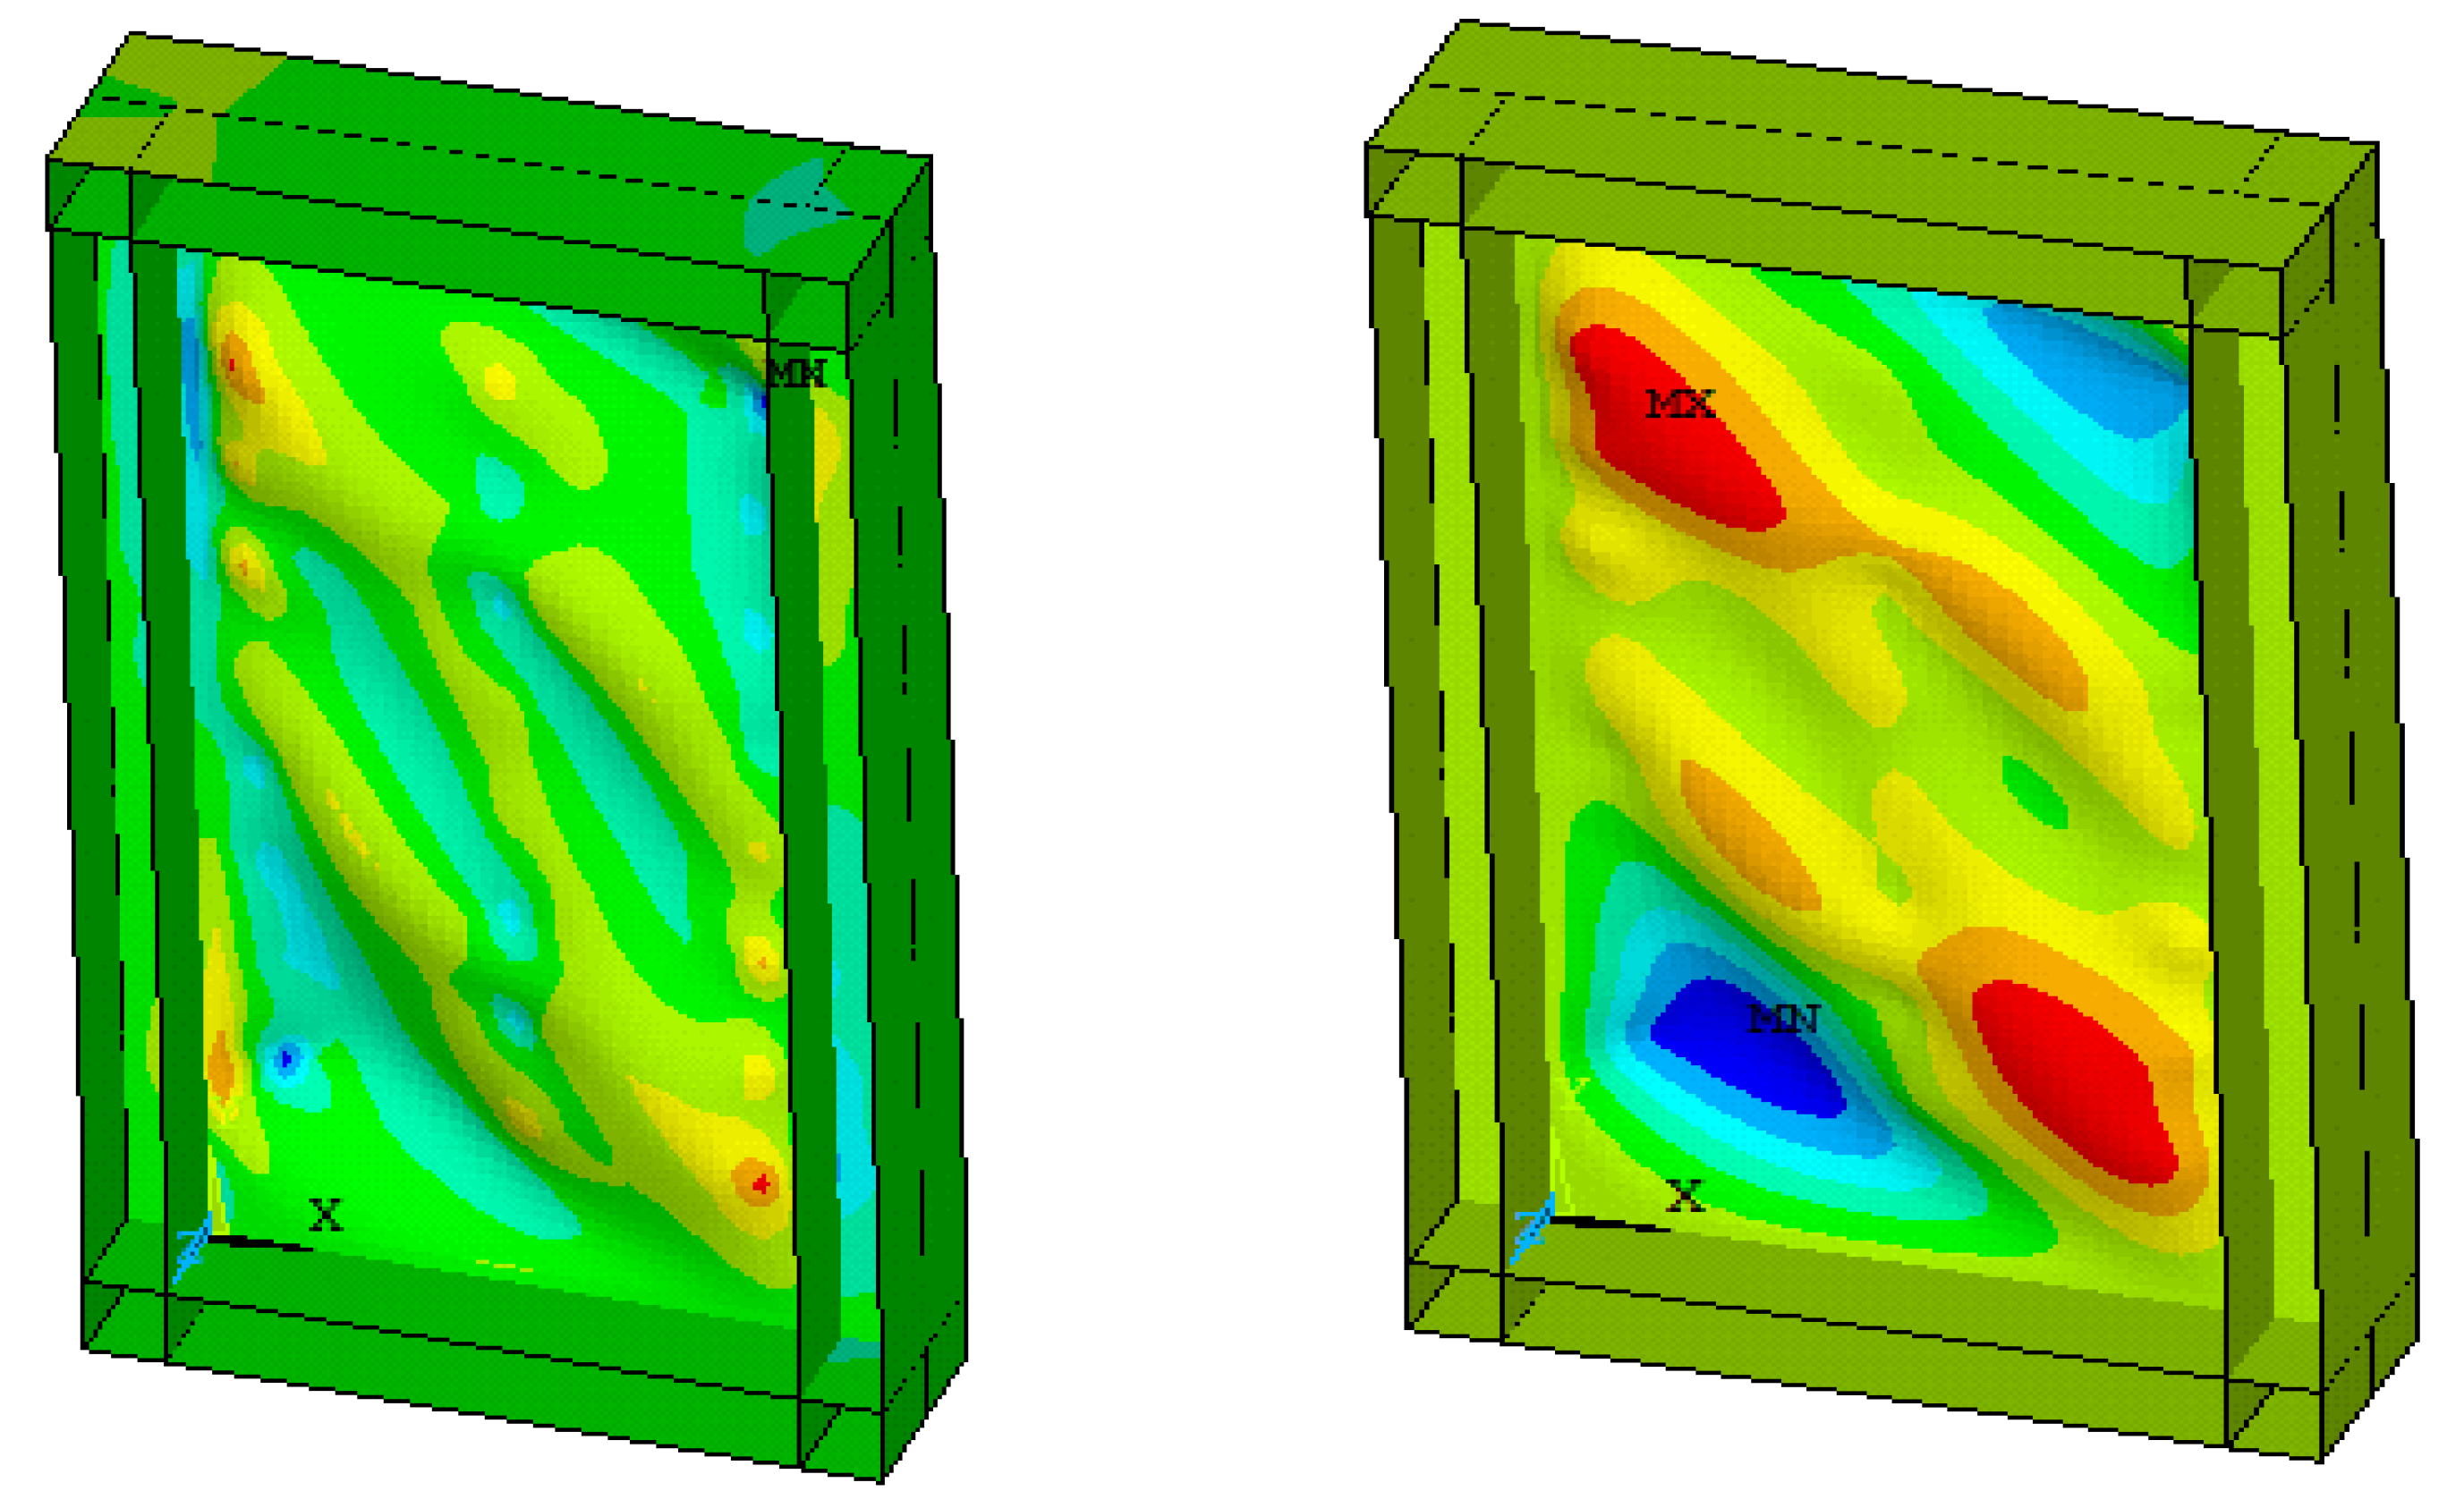
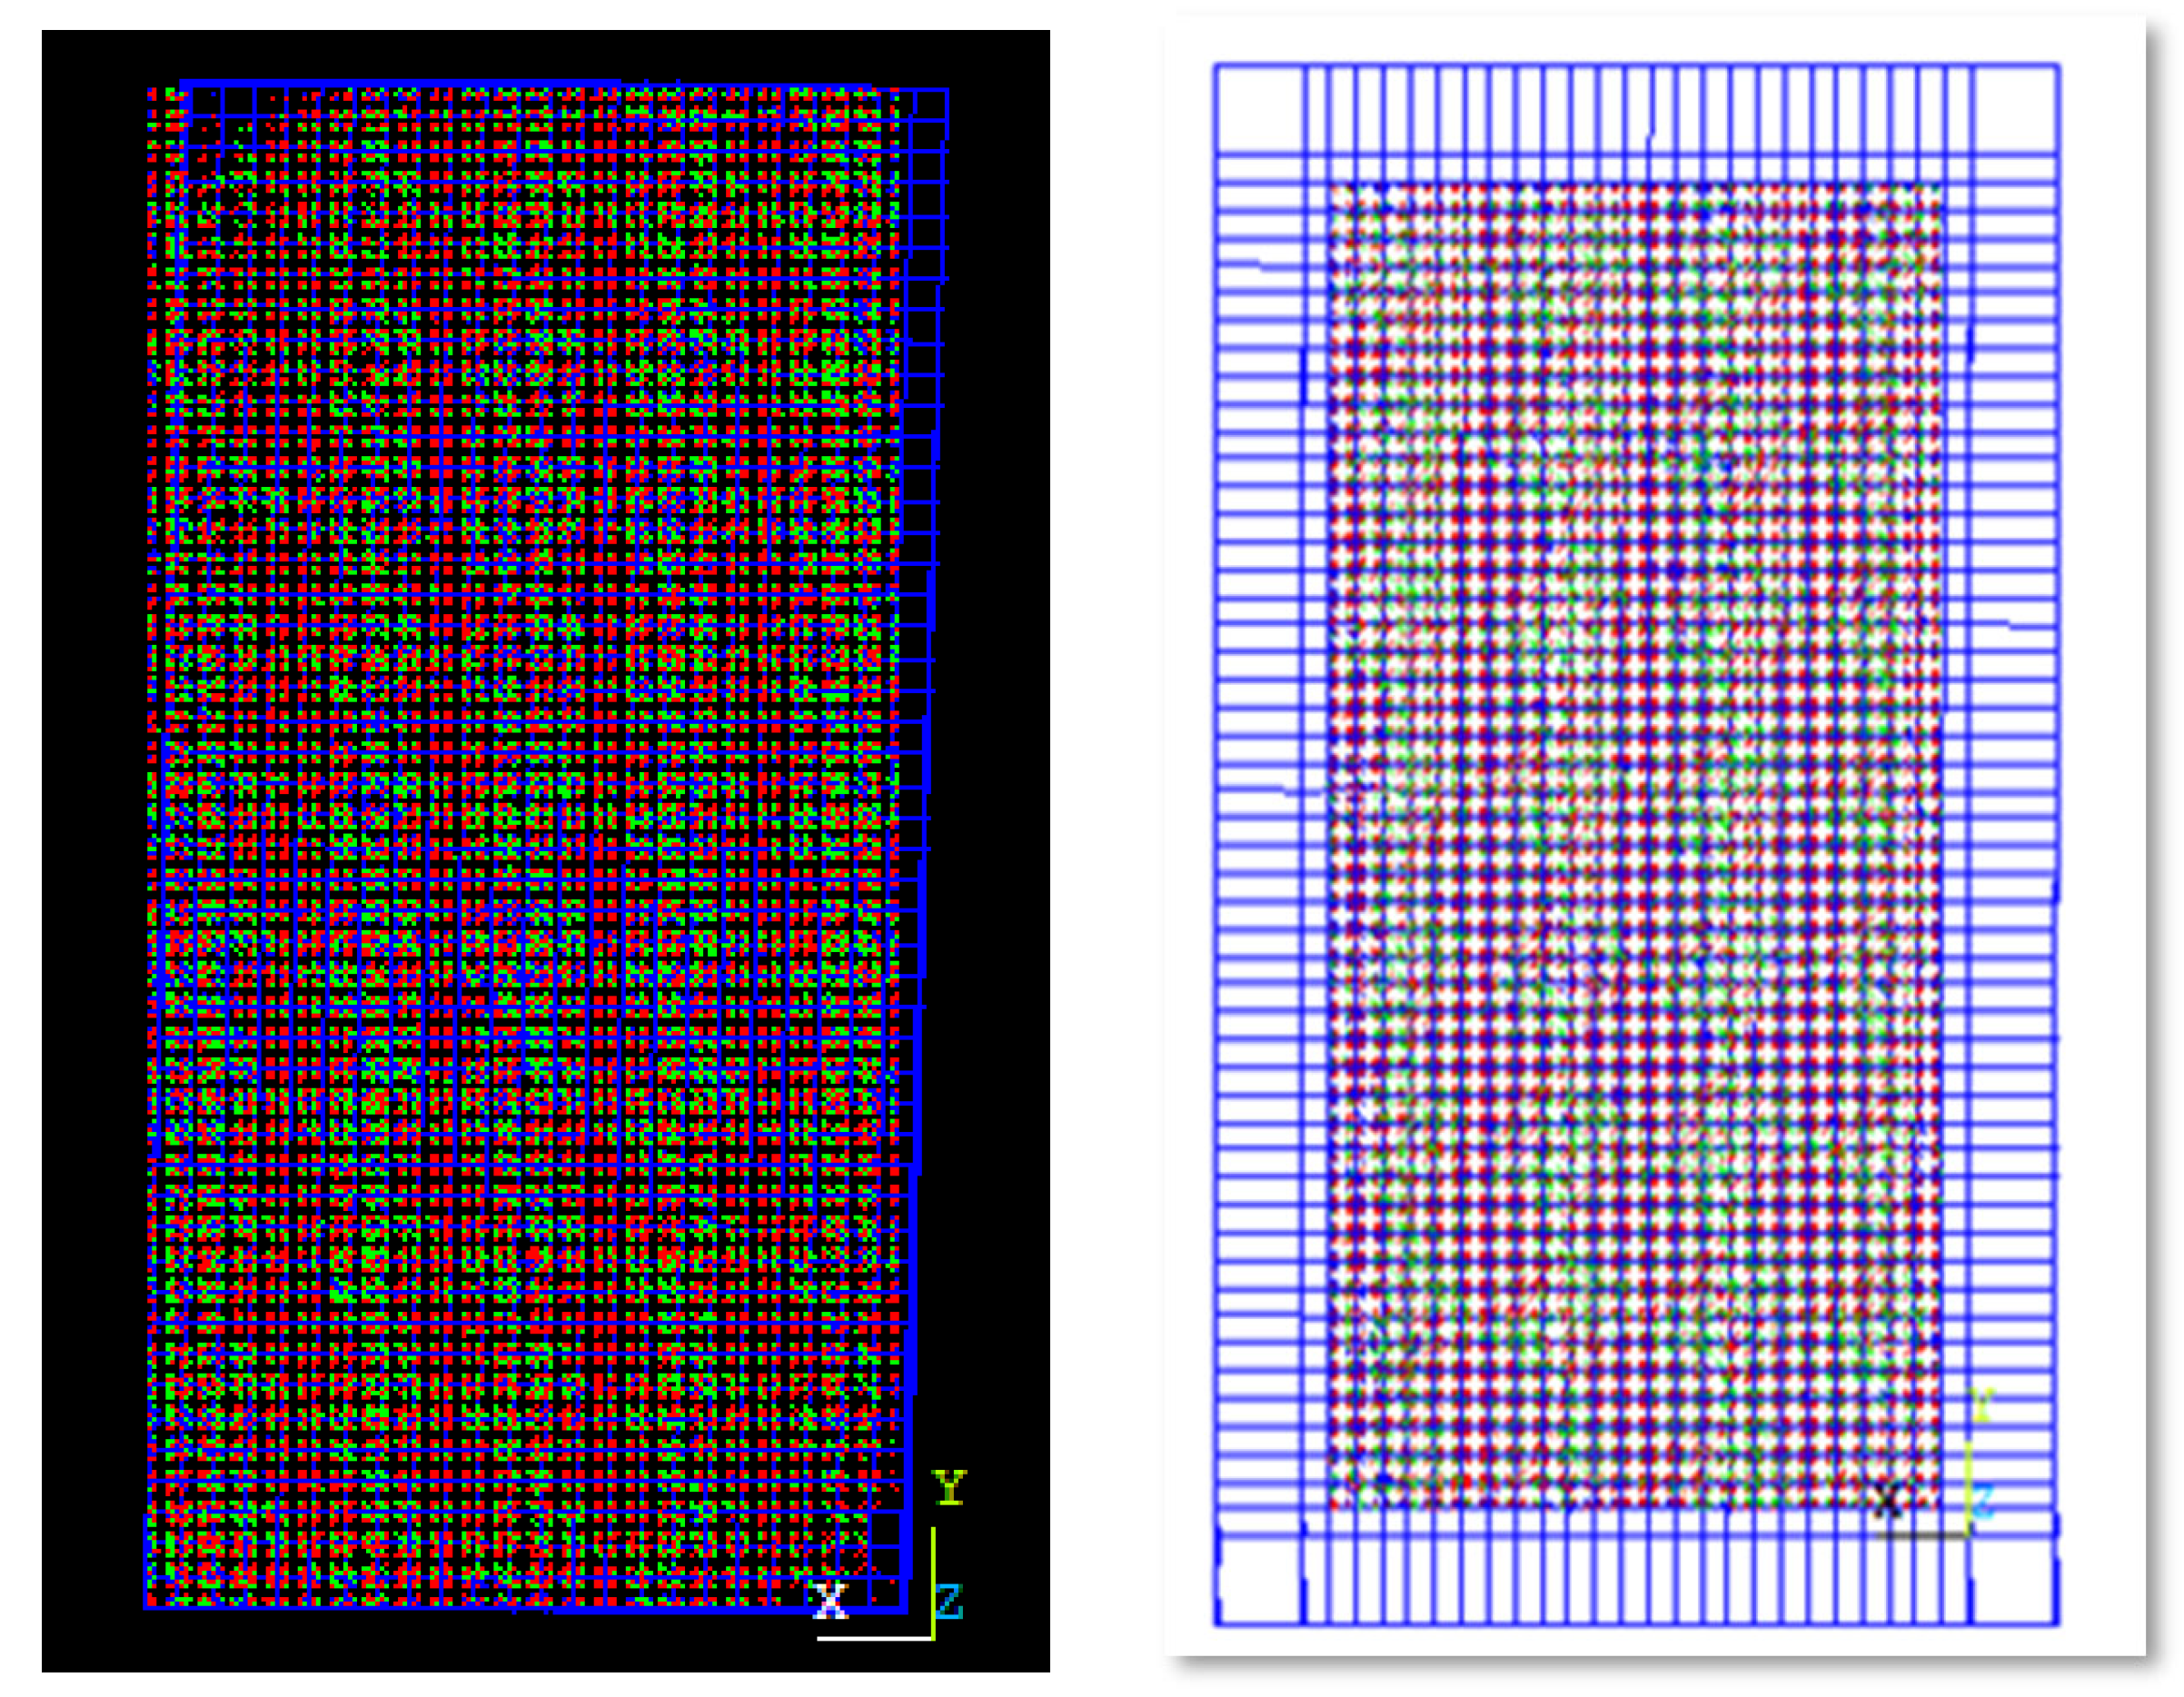
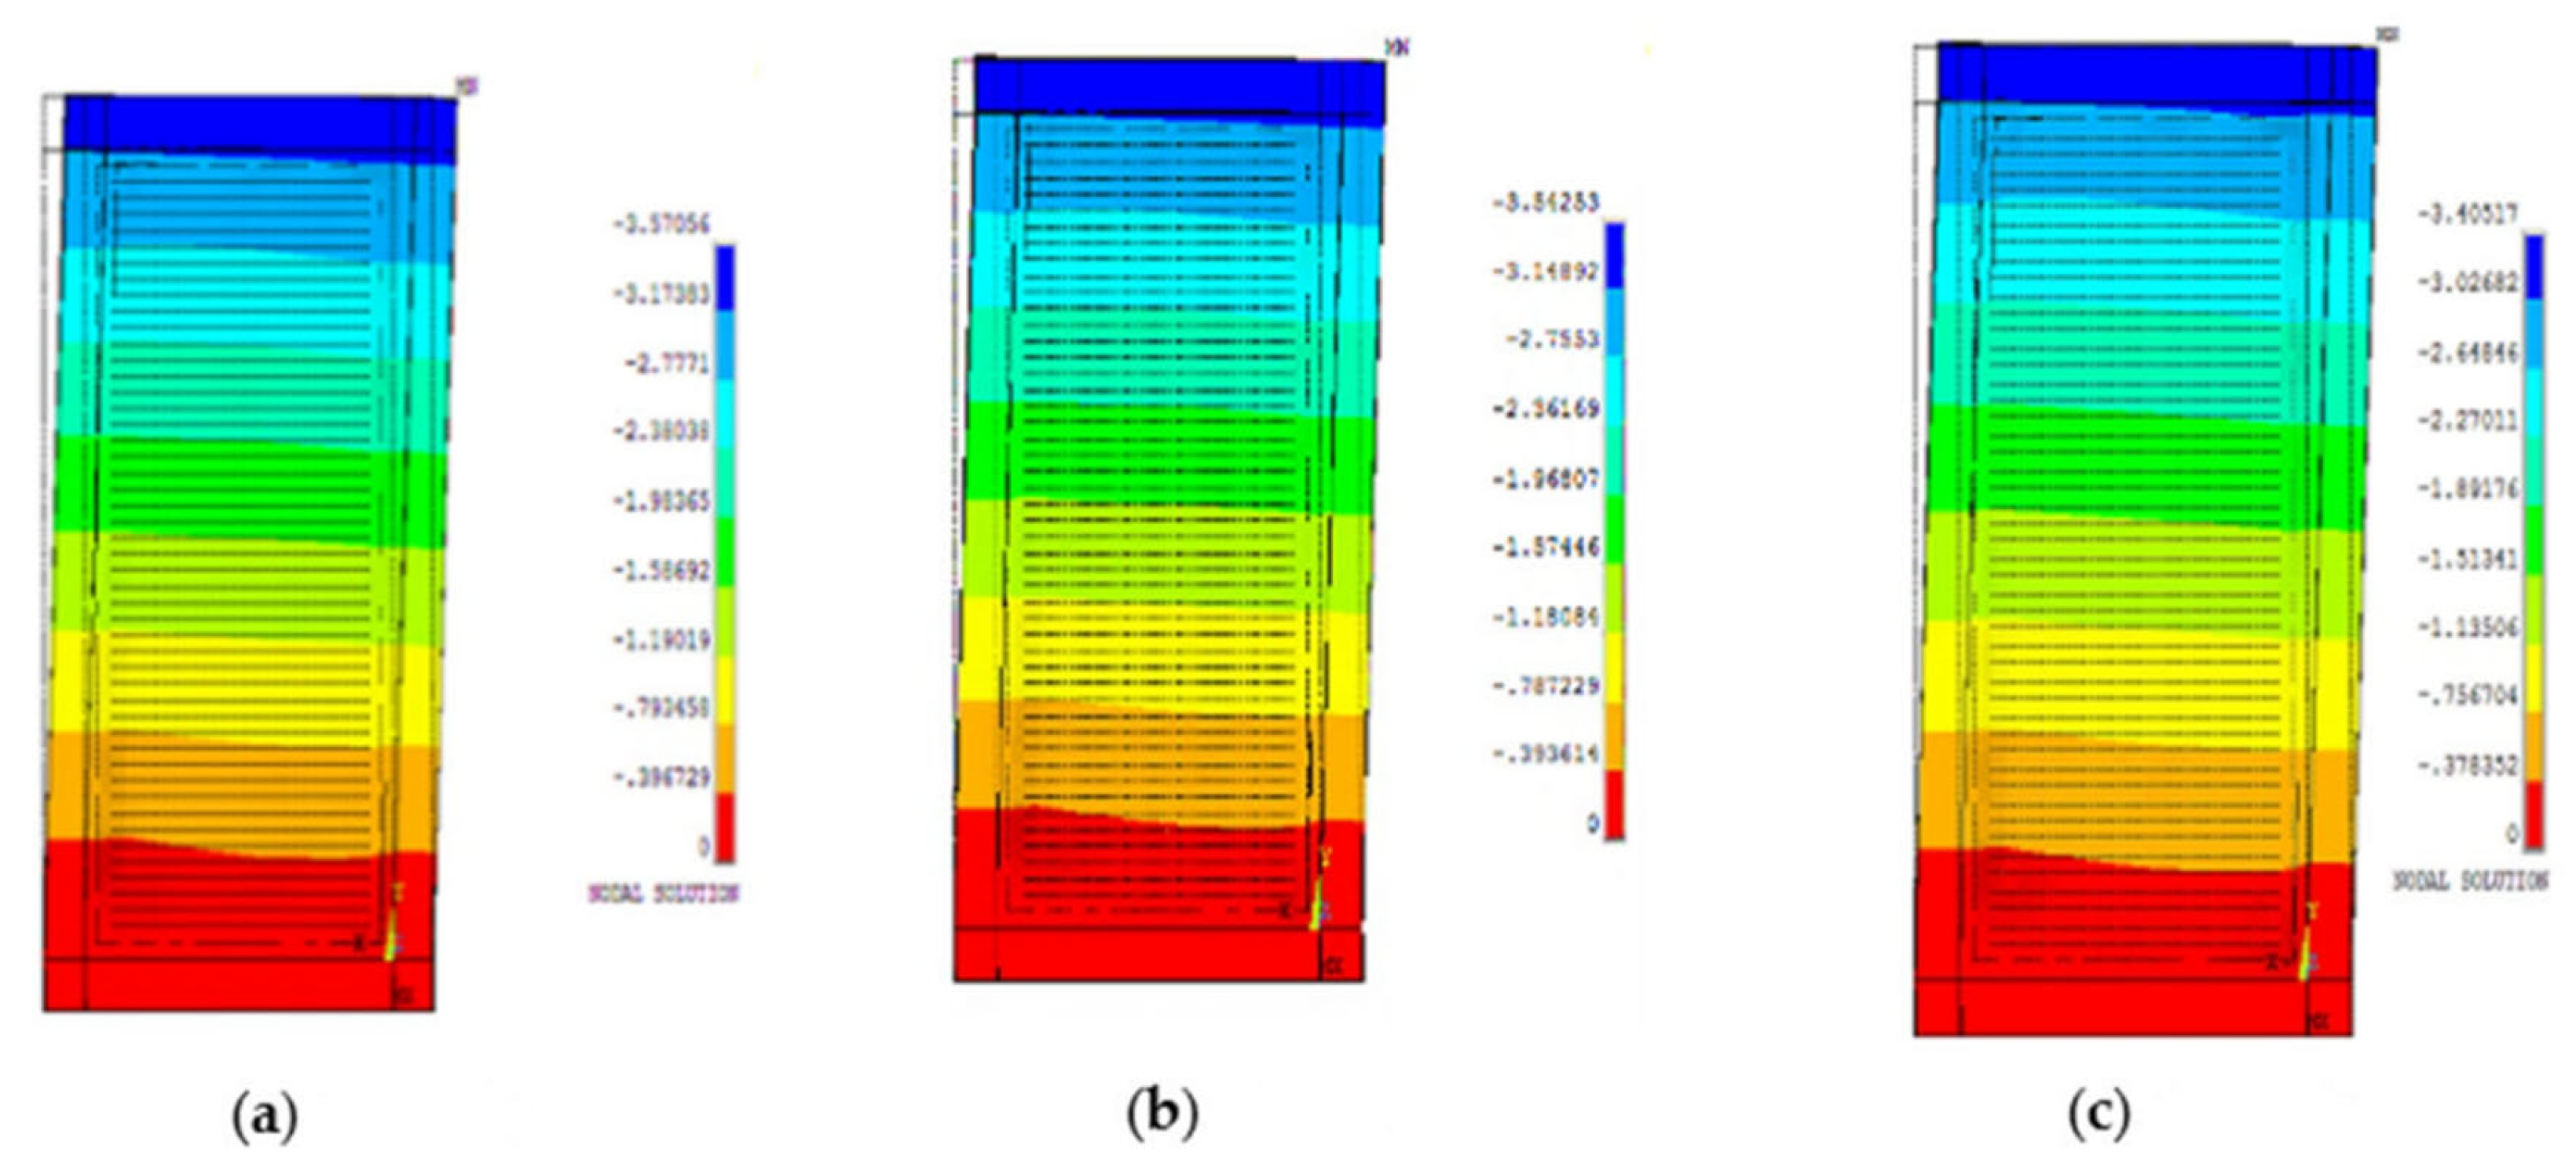
3.2. Validation of Finite Element Model
4. Parametric Analysis
4.1. Influence Rules of the Parameters
- The initial elastic stiffness phase
- The shear yielding stiffness phase
- The post yielding stiffness phase
- The pre-failure stiffness phase
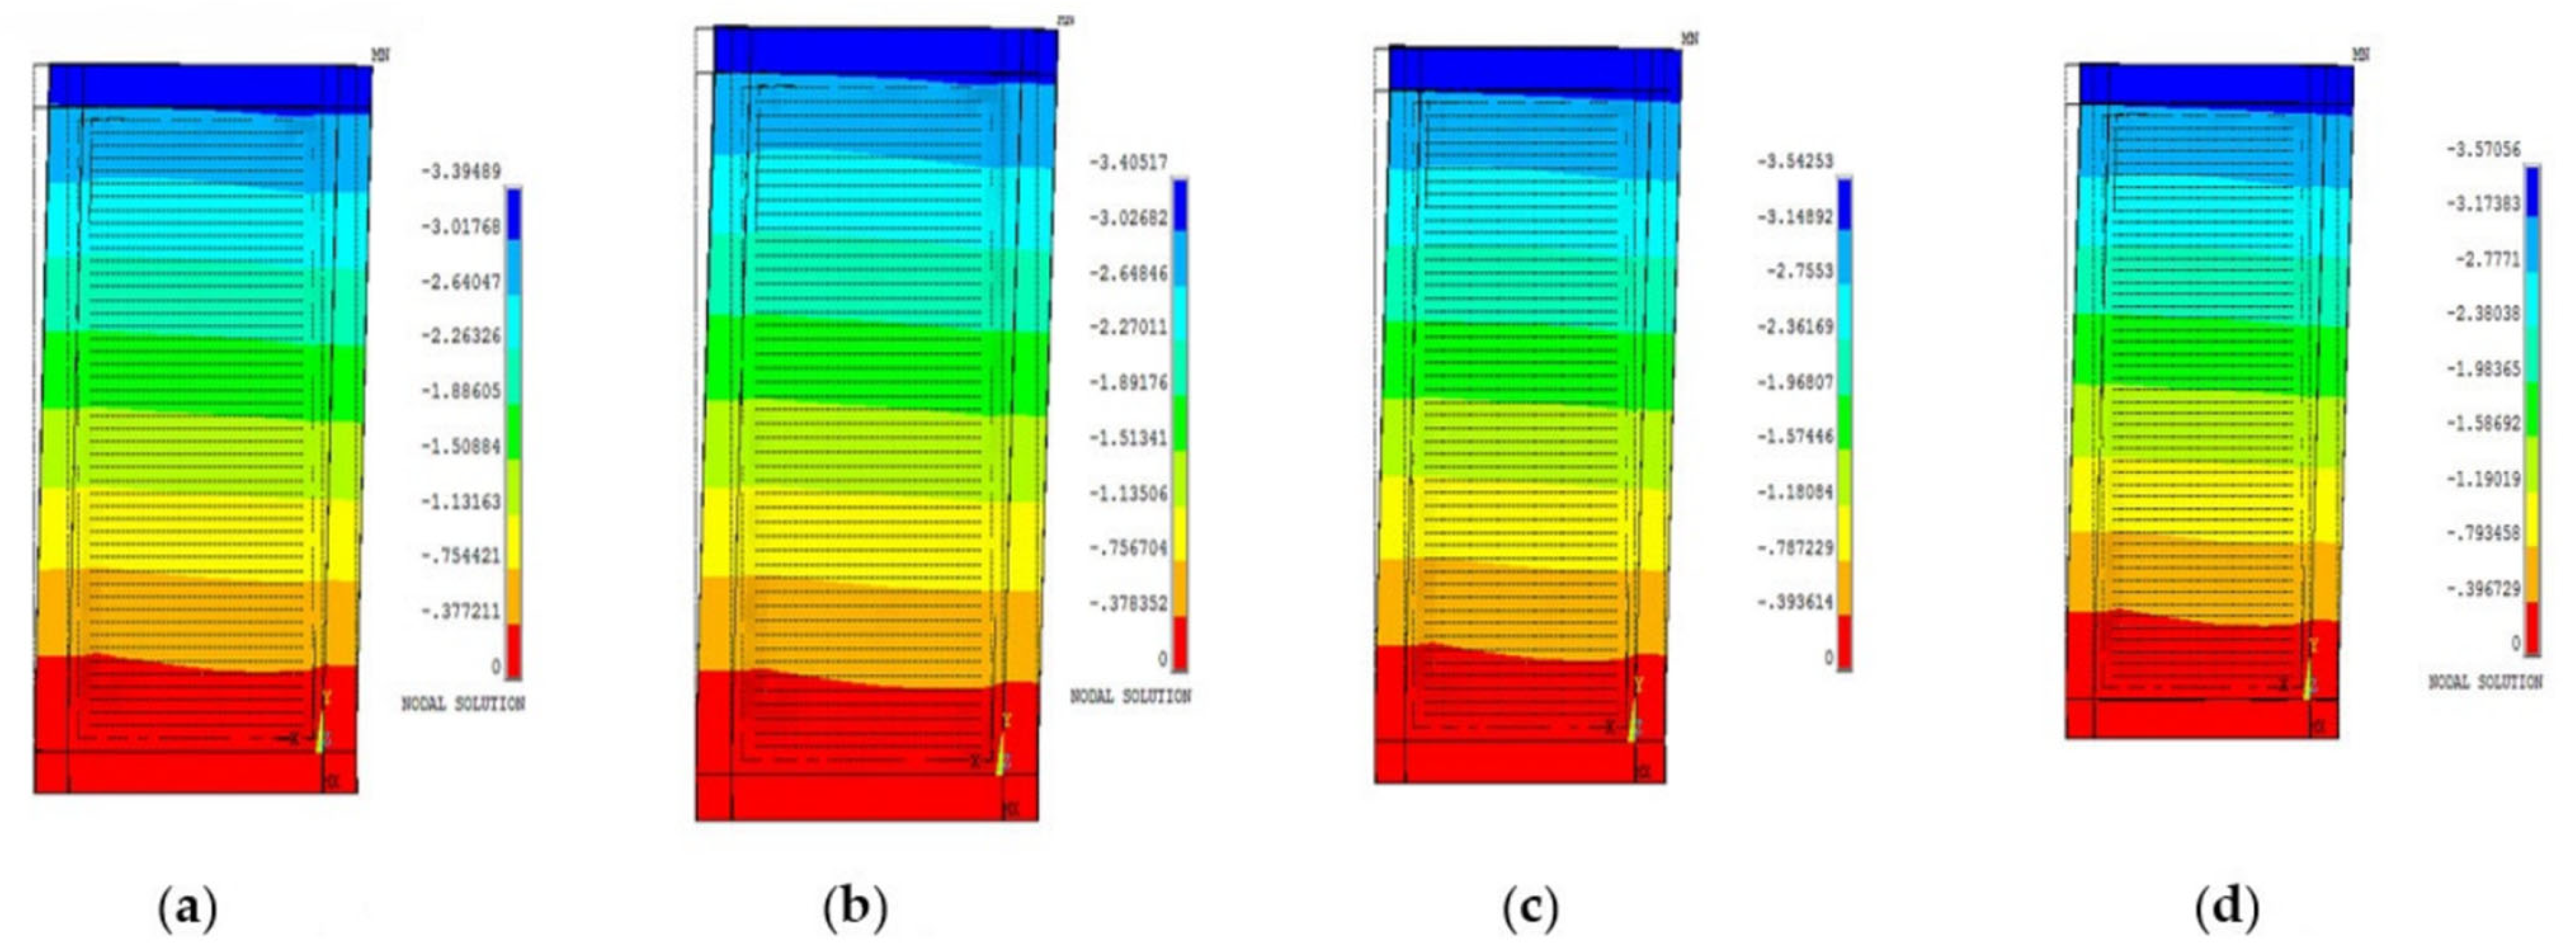
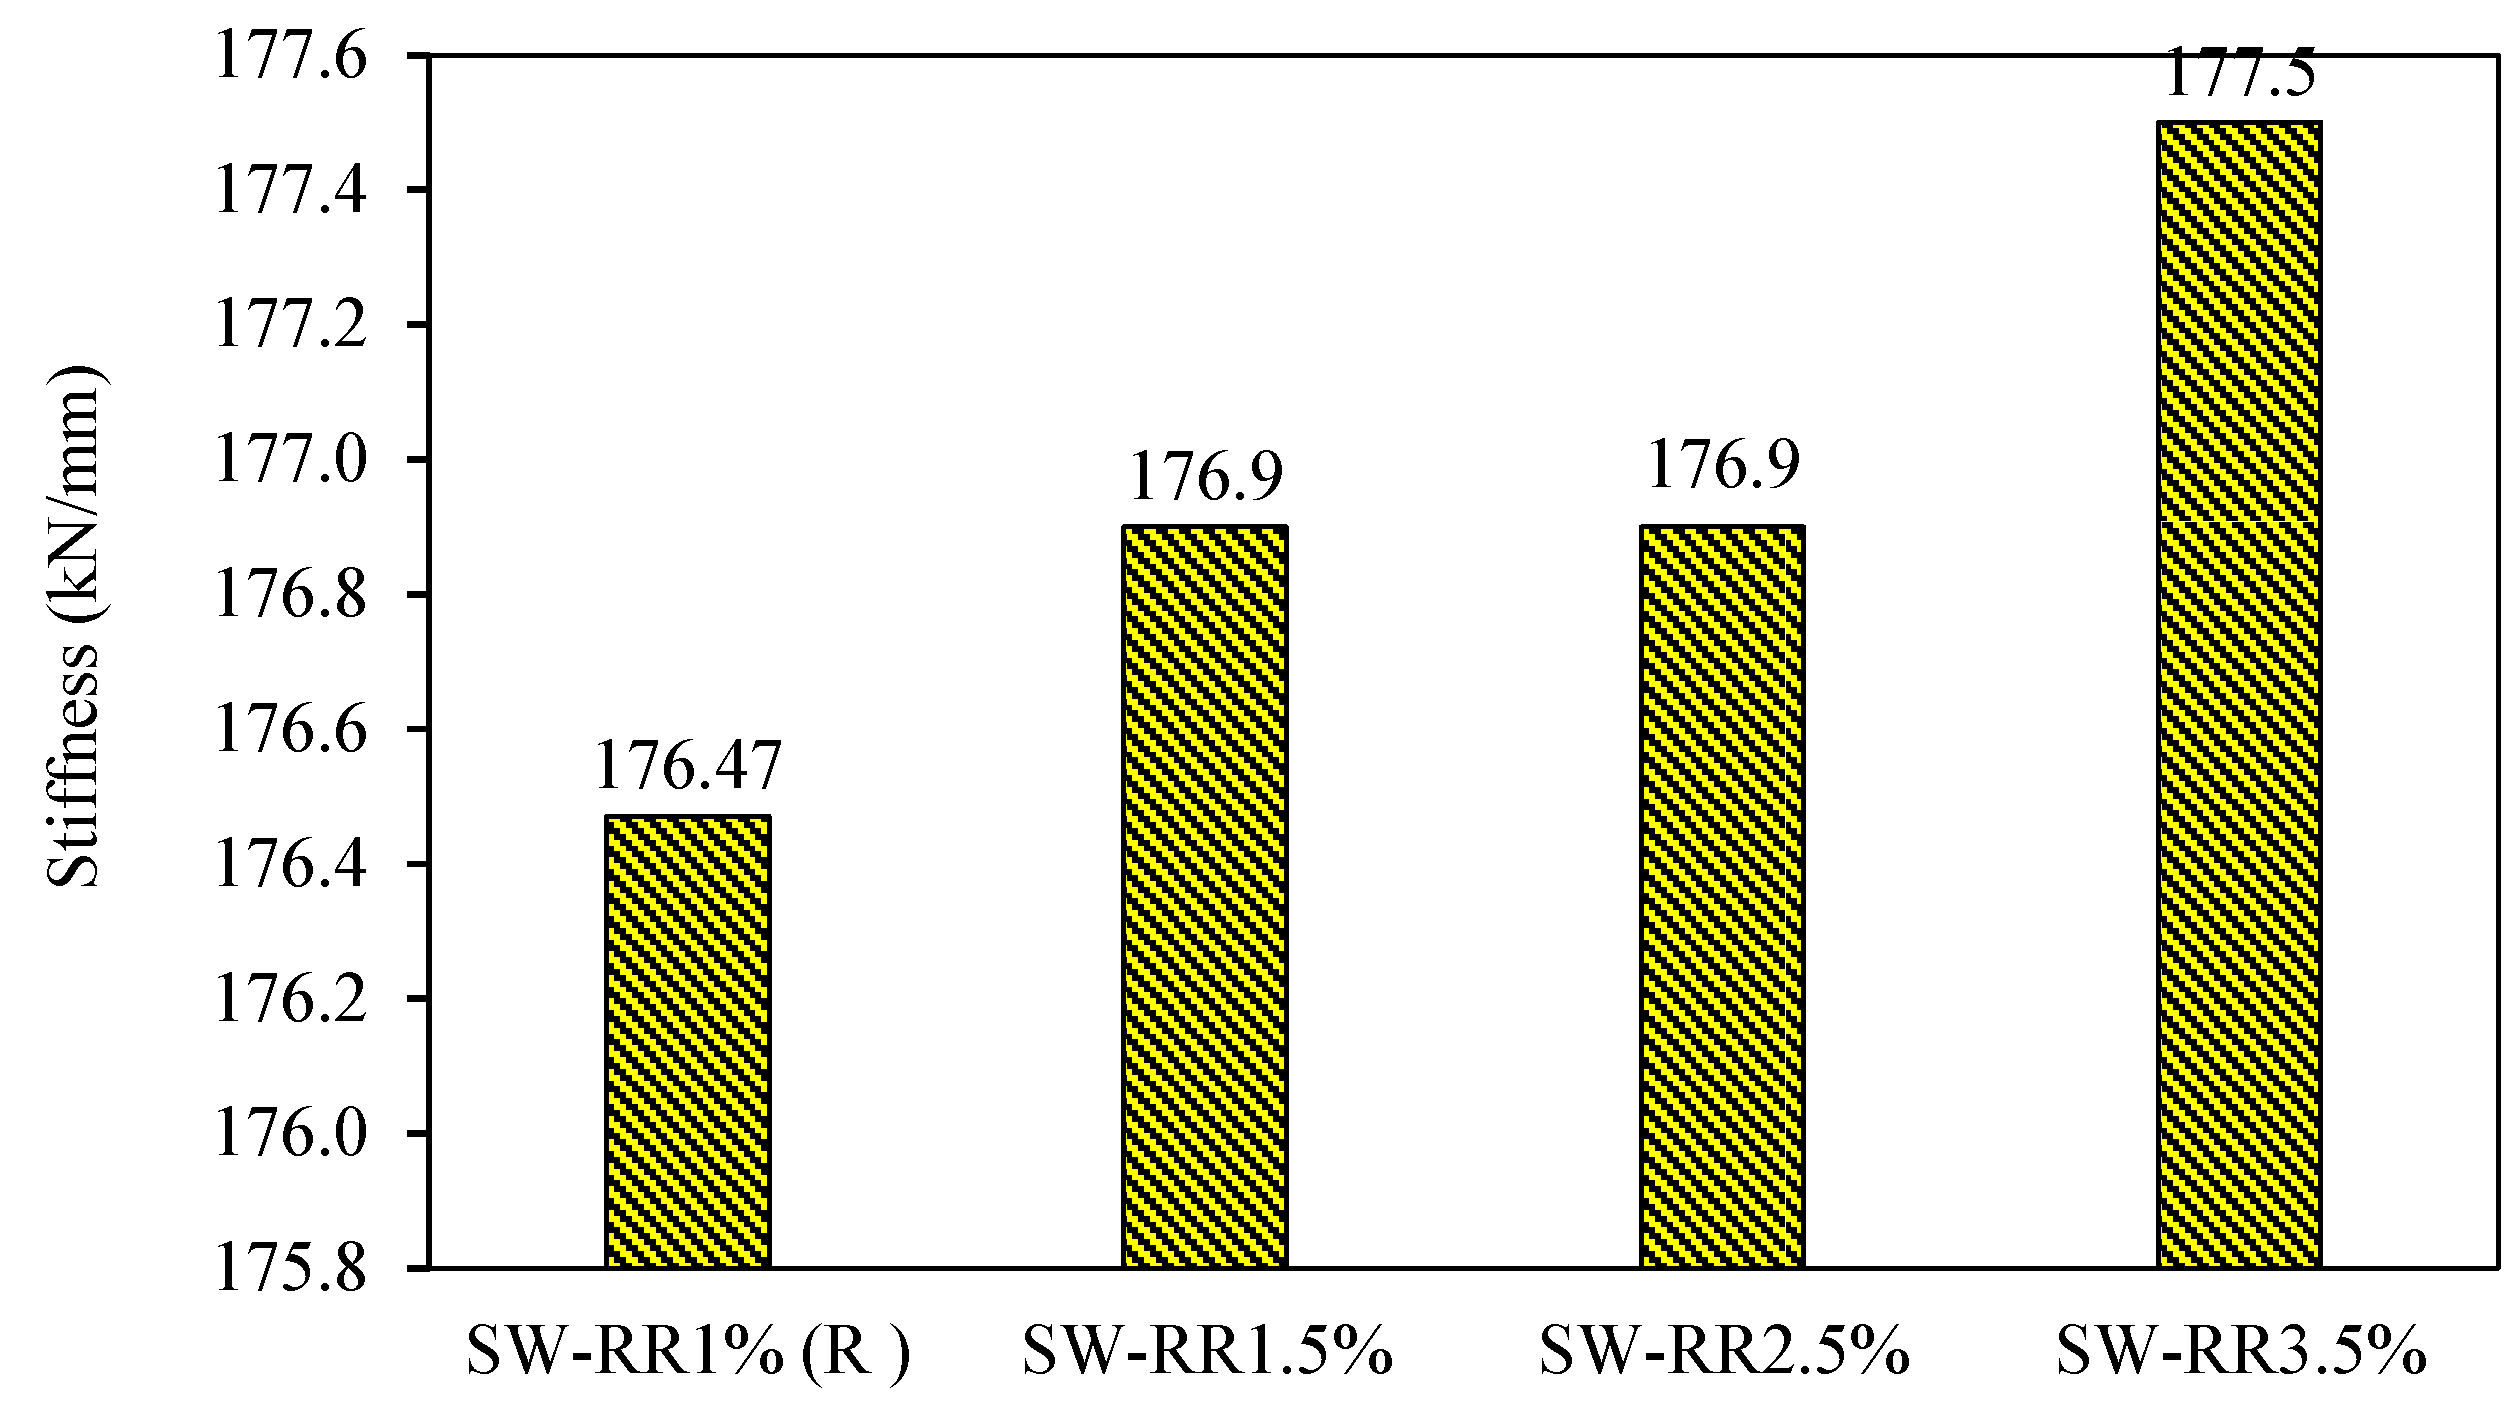
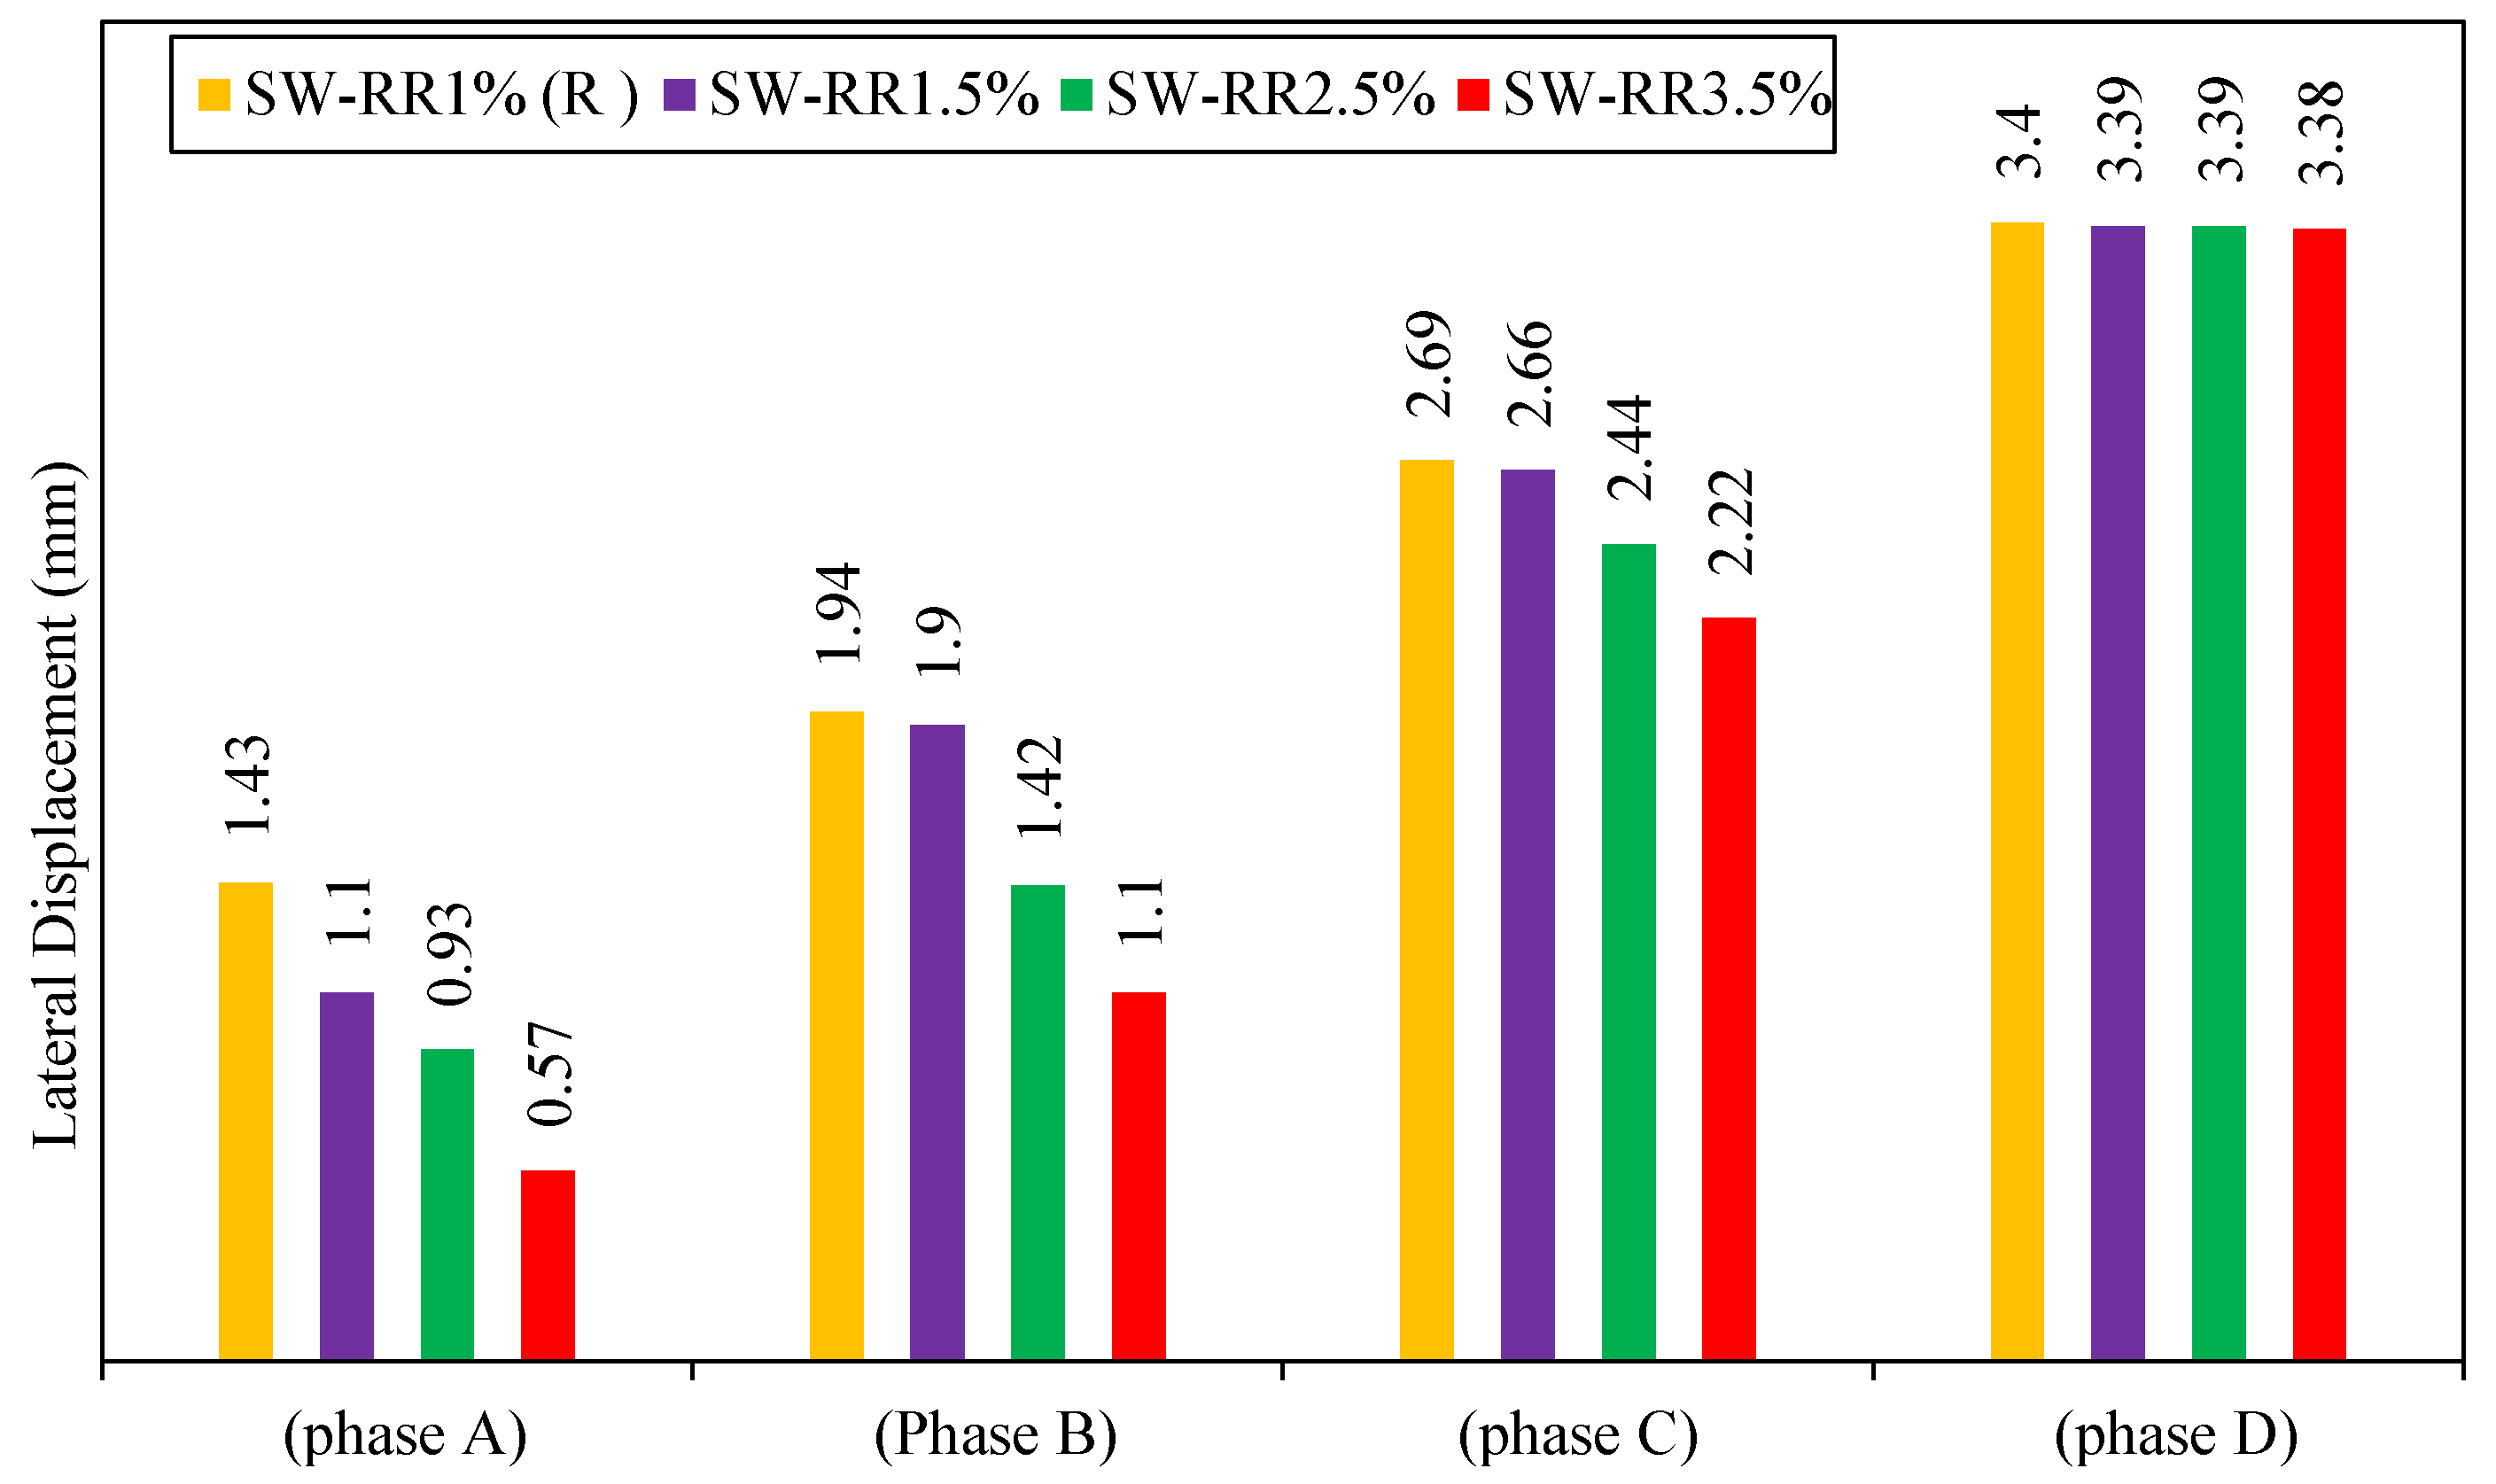
4.1.1. The First Group Models (Influence of Reinforcement Ratio)
- Lateral displacement
- Phase A:
- Phase B:
- Phase C:
- Phase D:
- 2.
- Stiffness
- 3.
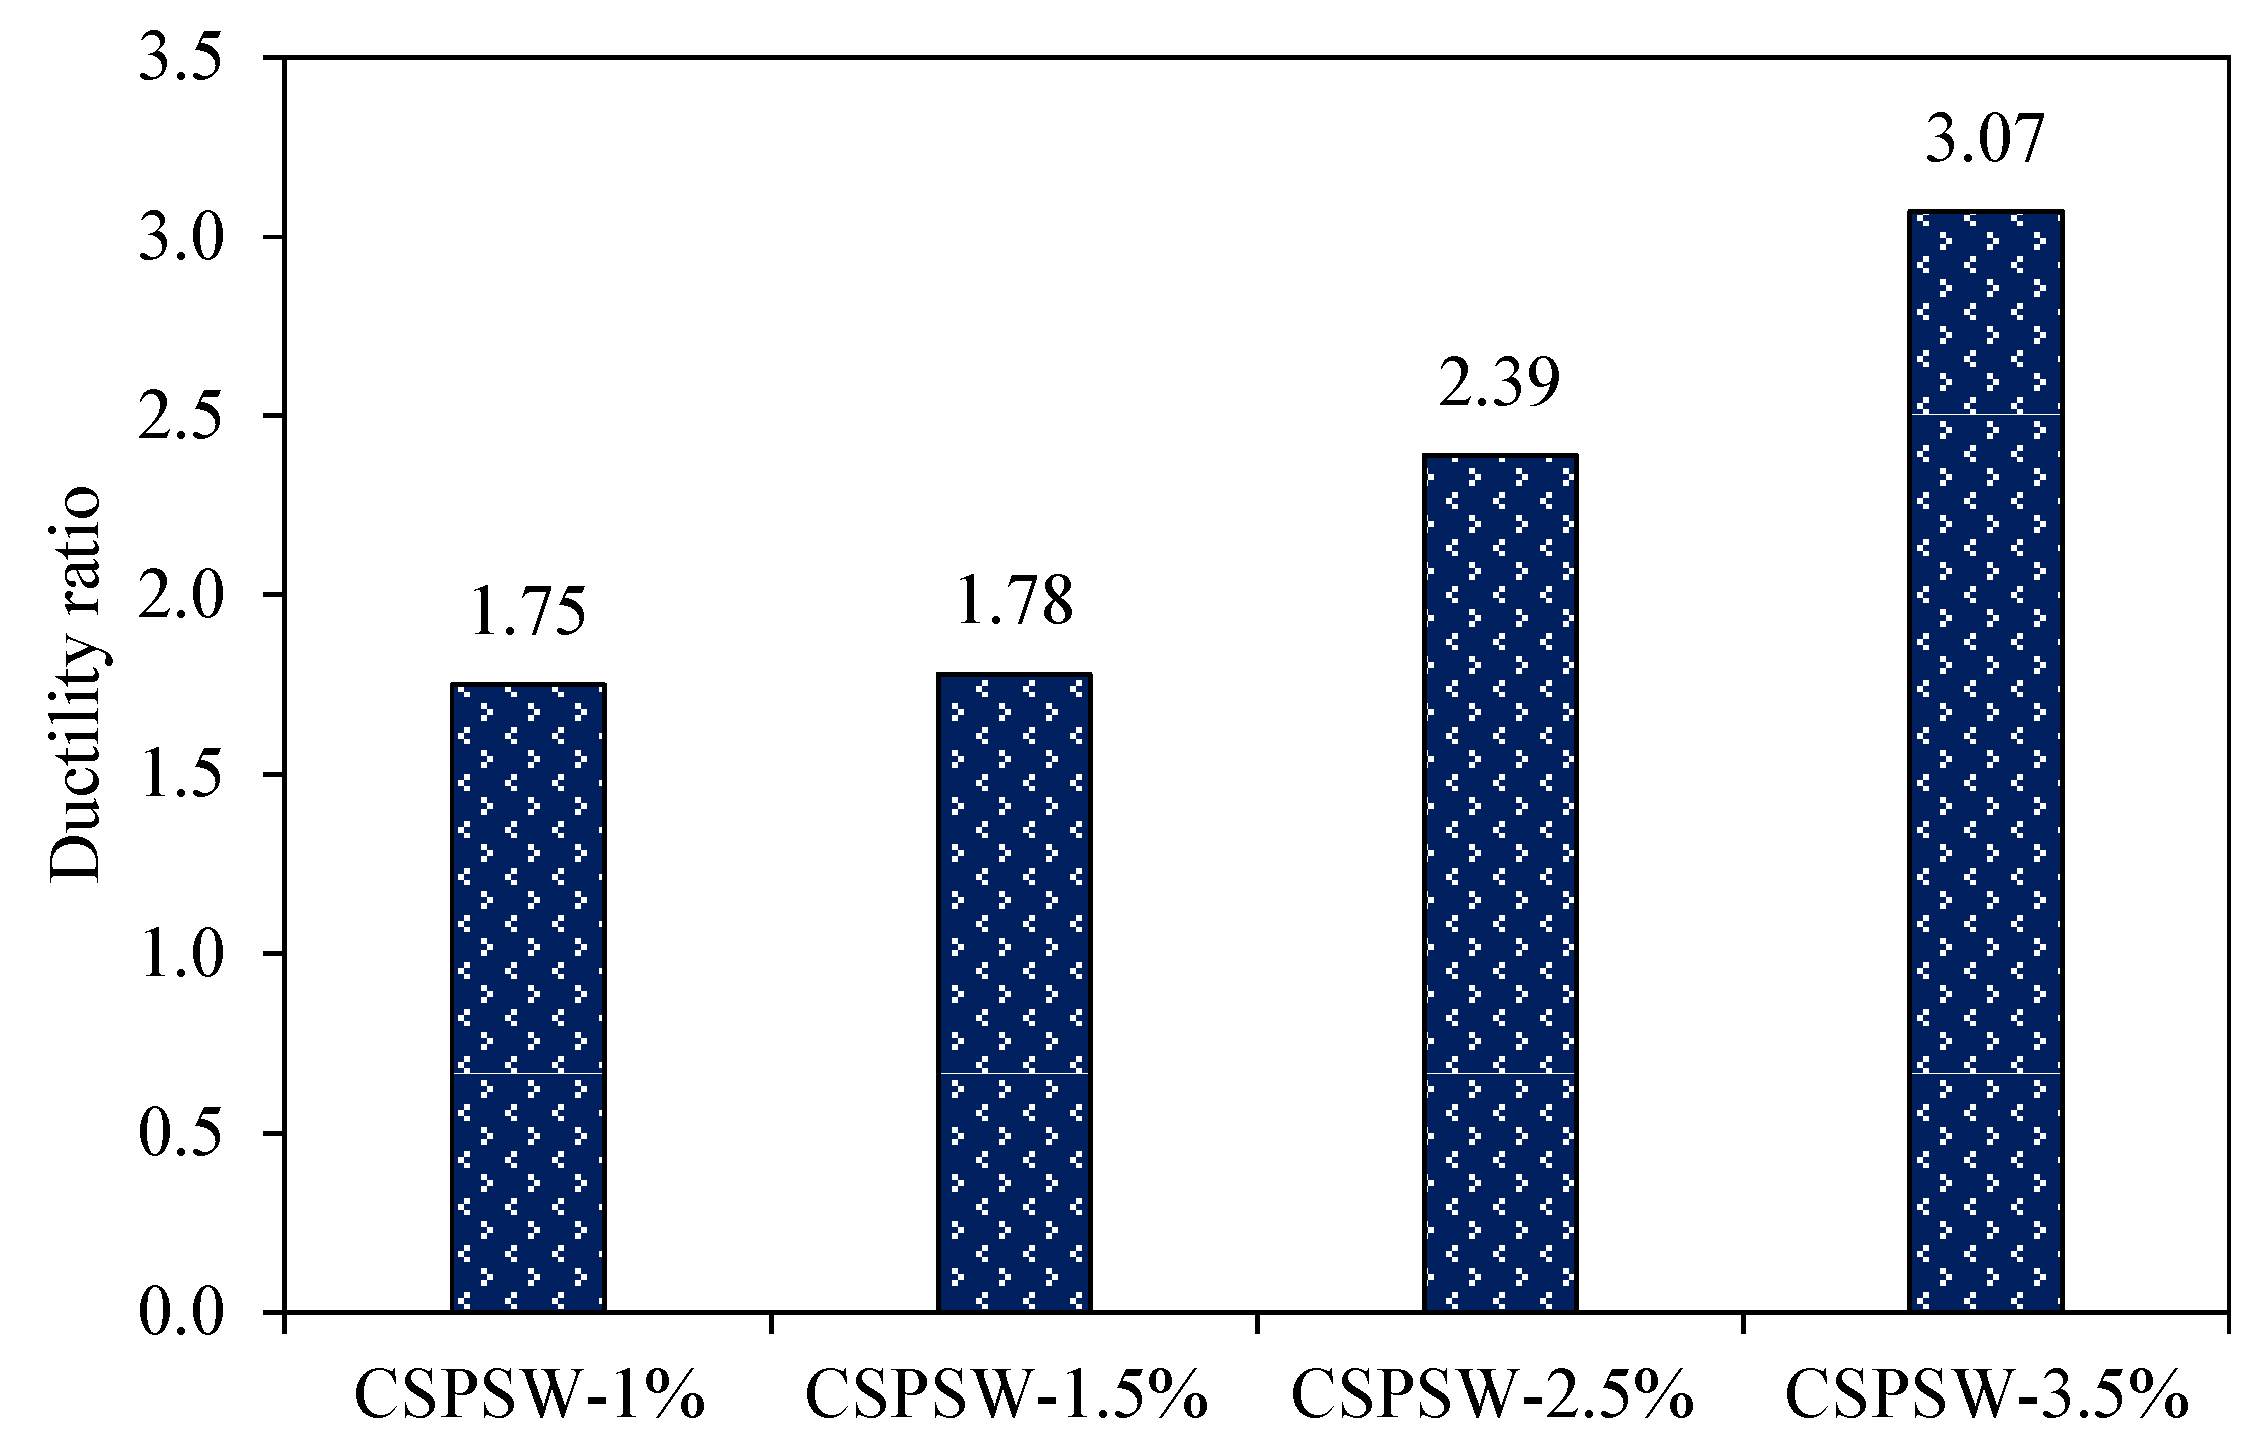
- Ductility
- 4.
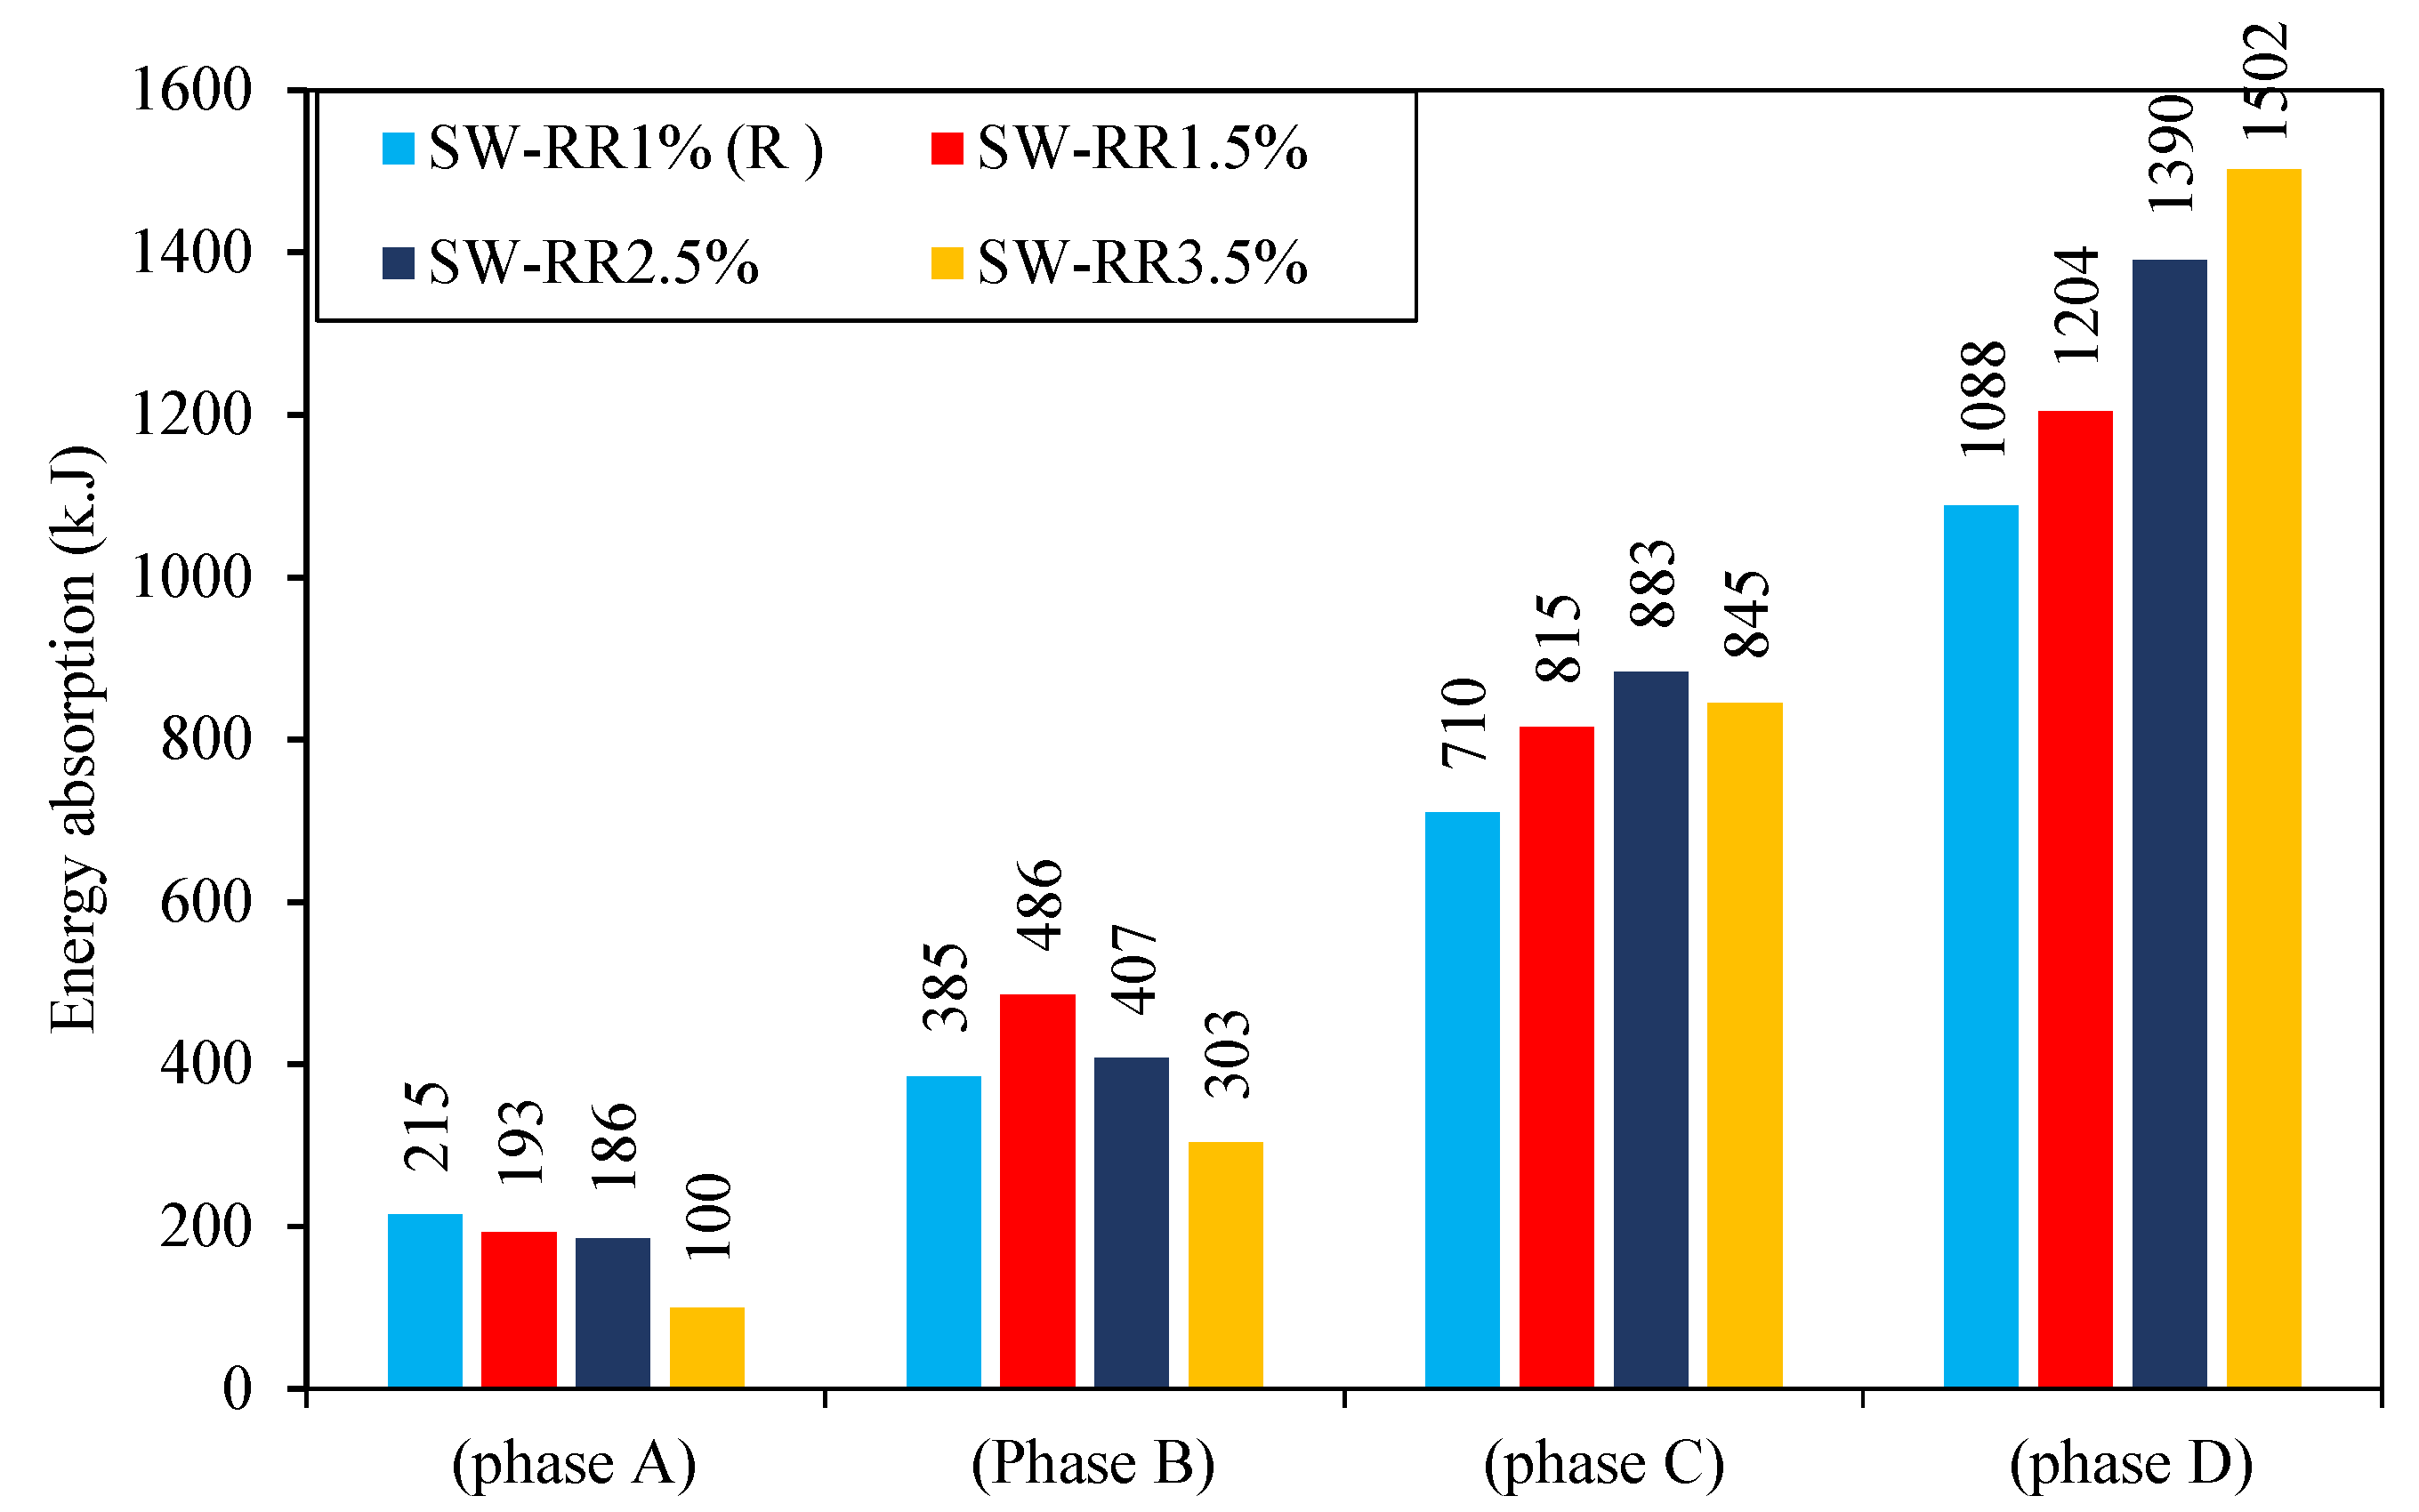
- Energy Absorption
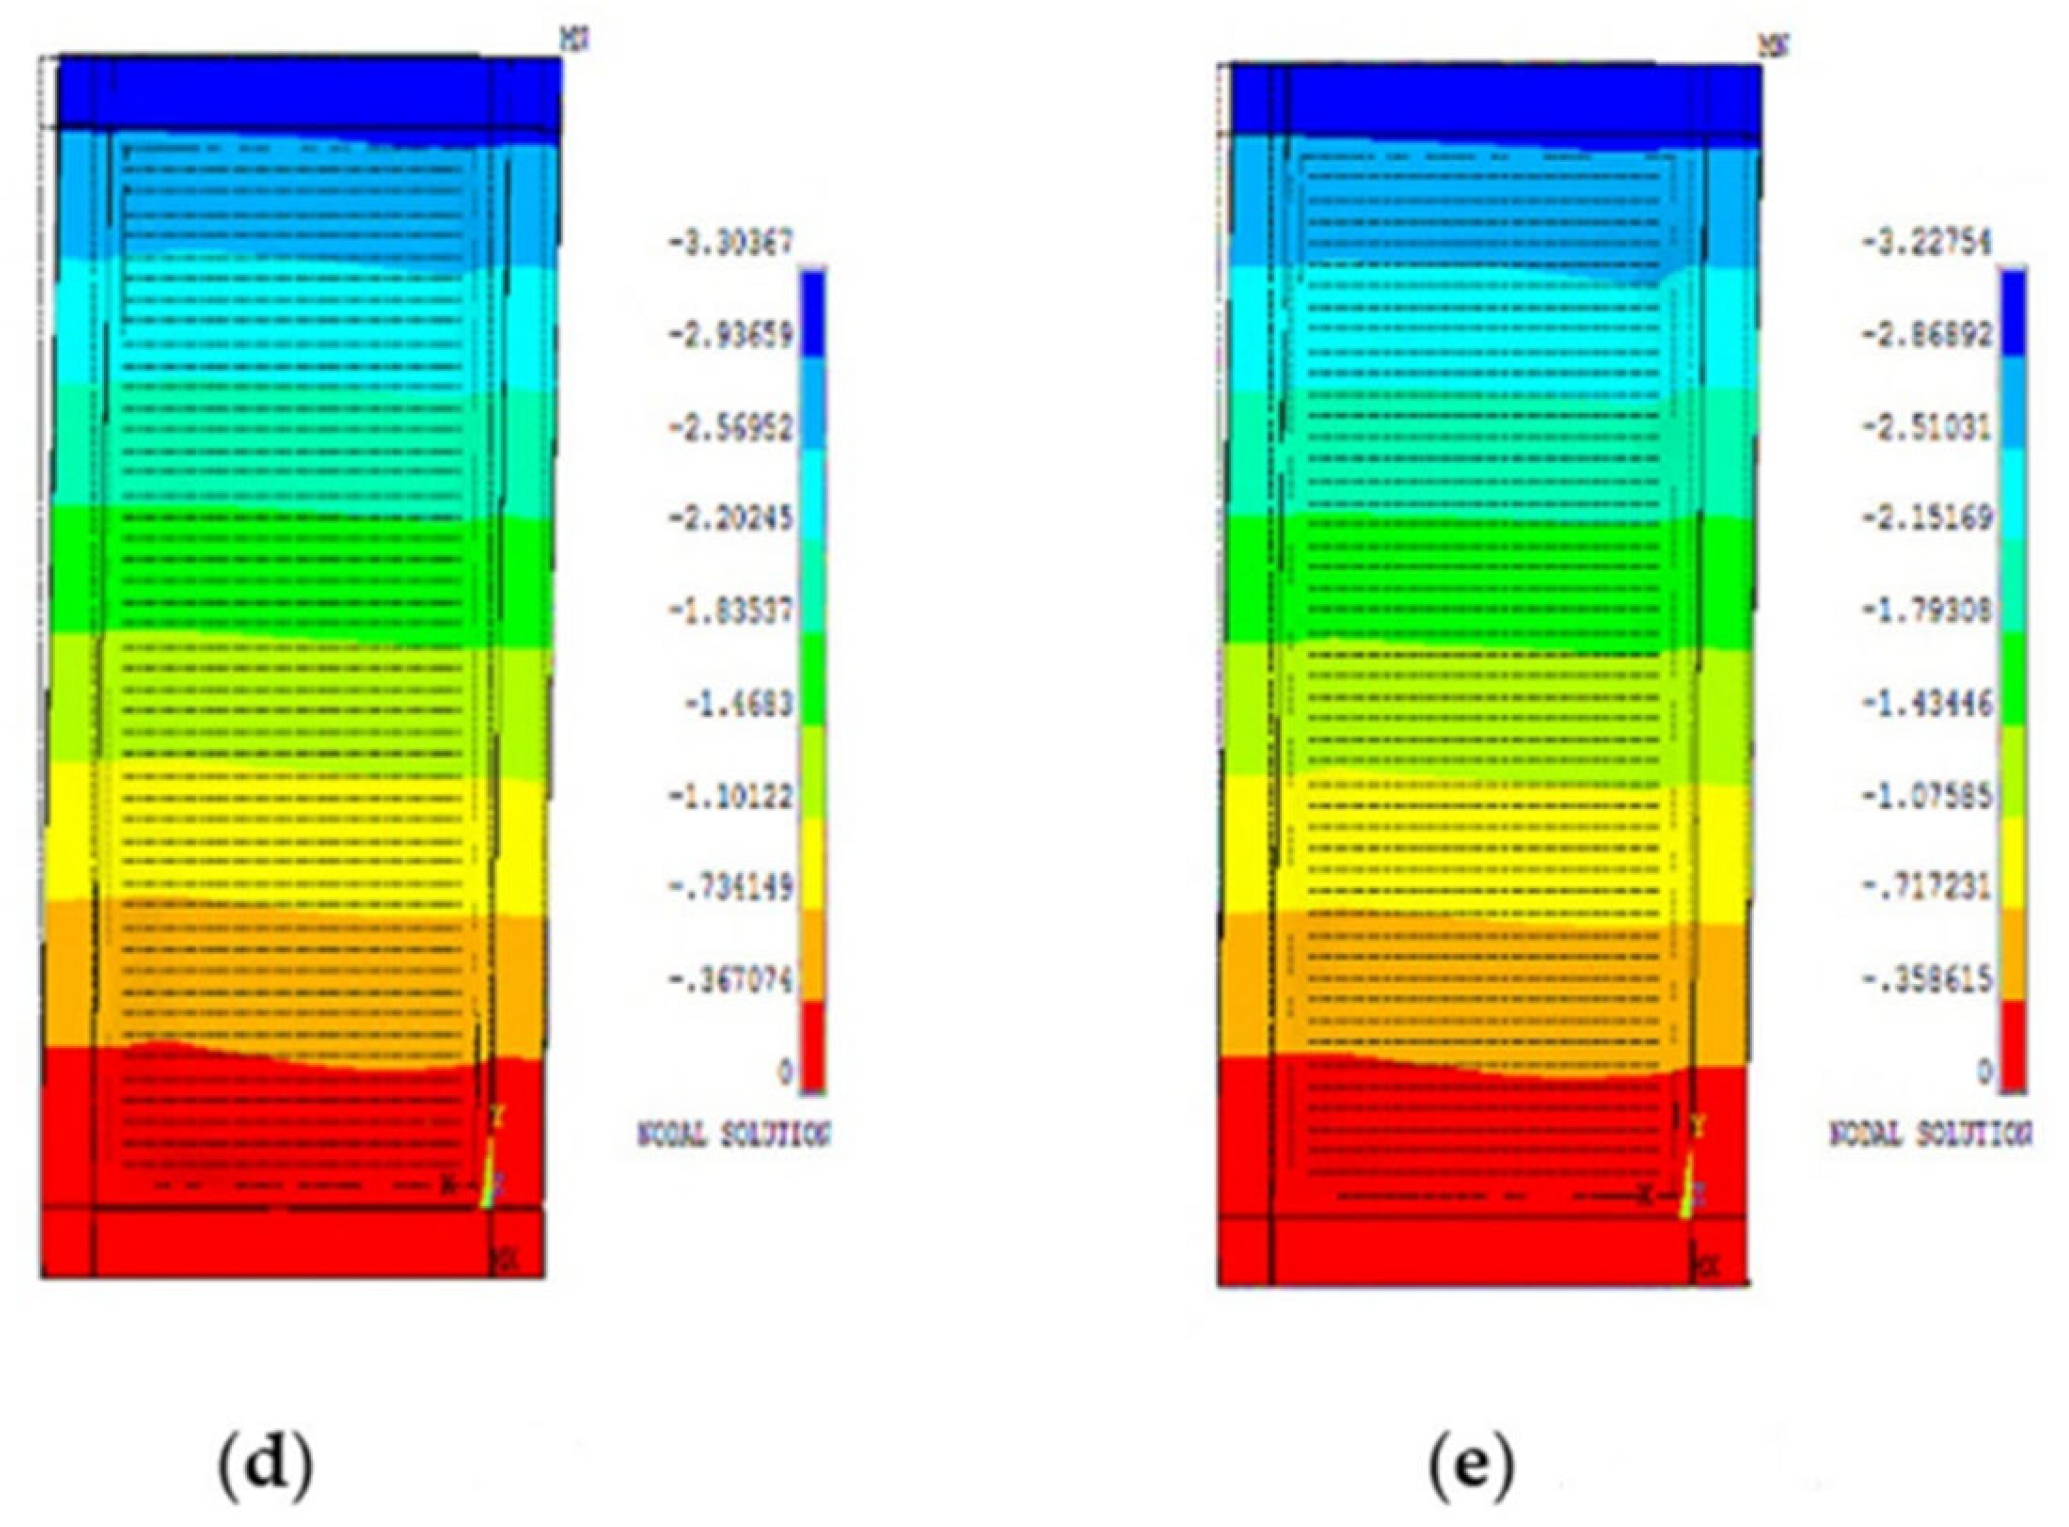
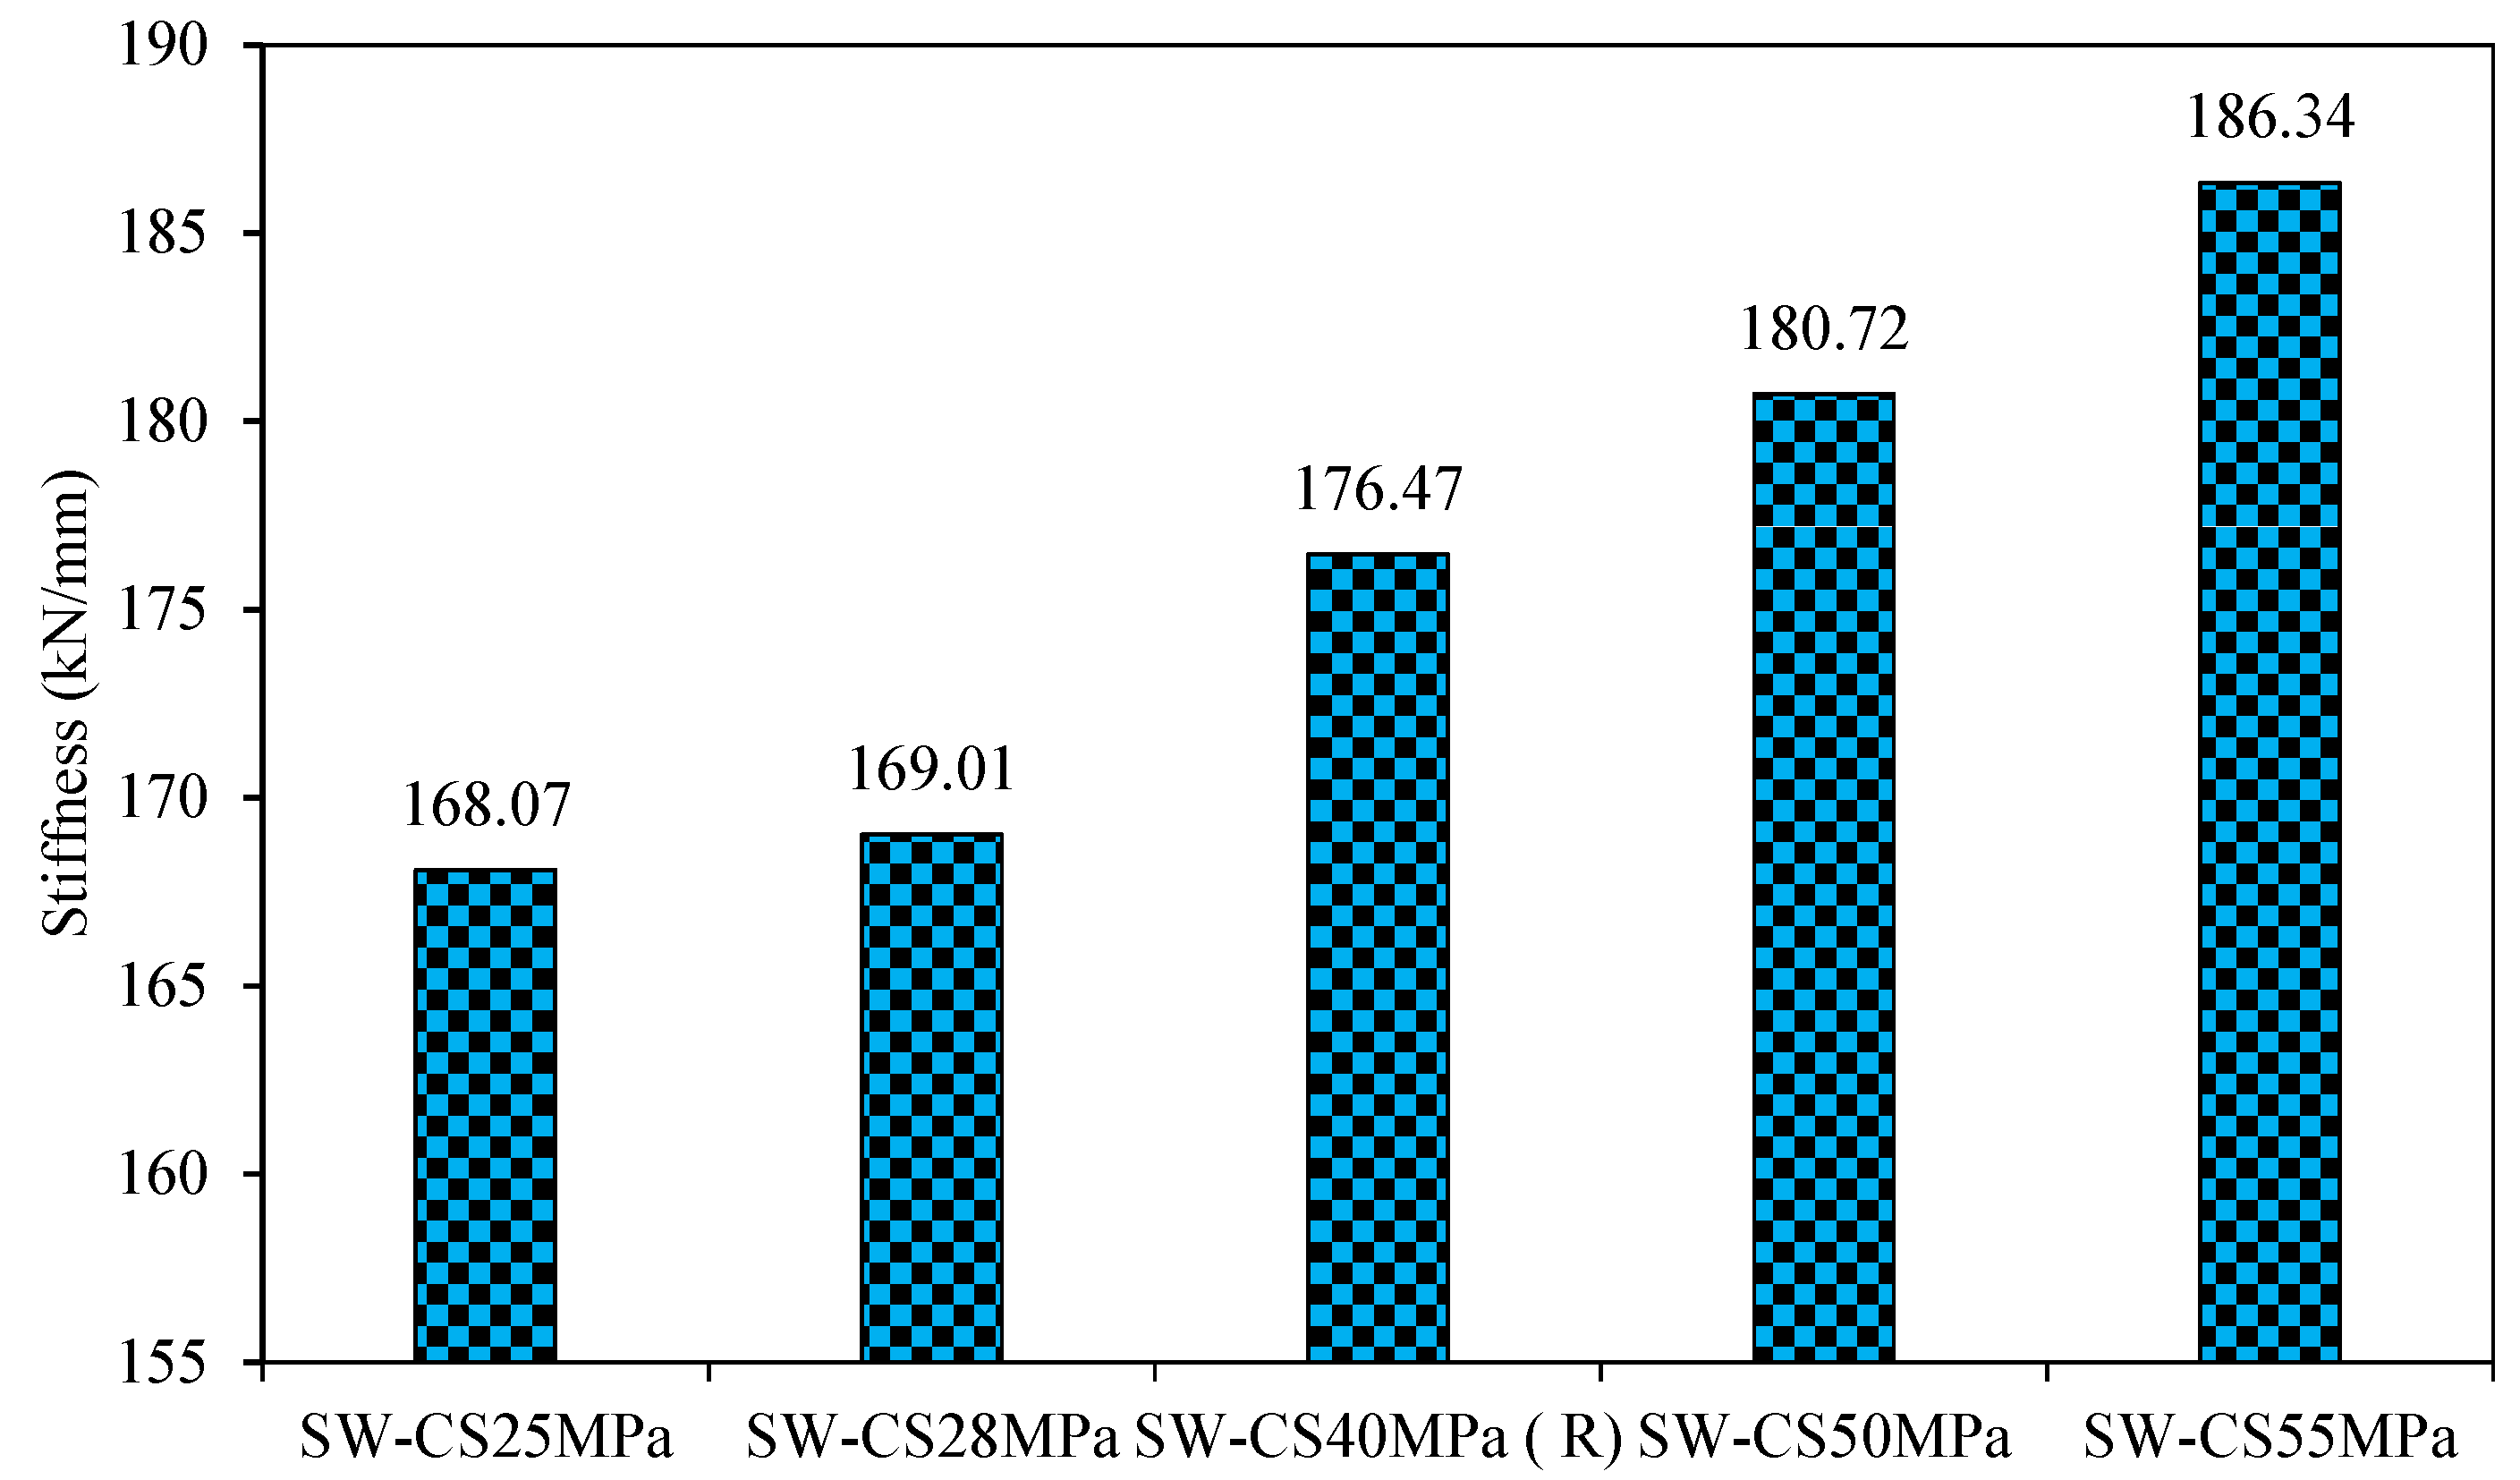
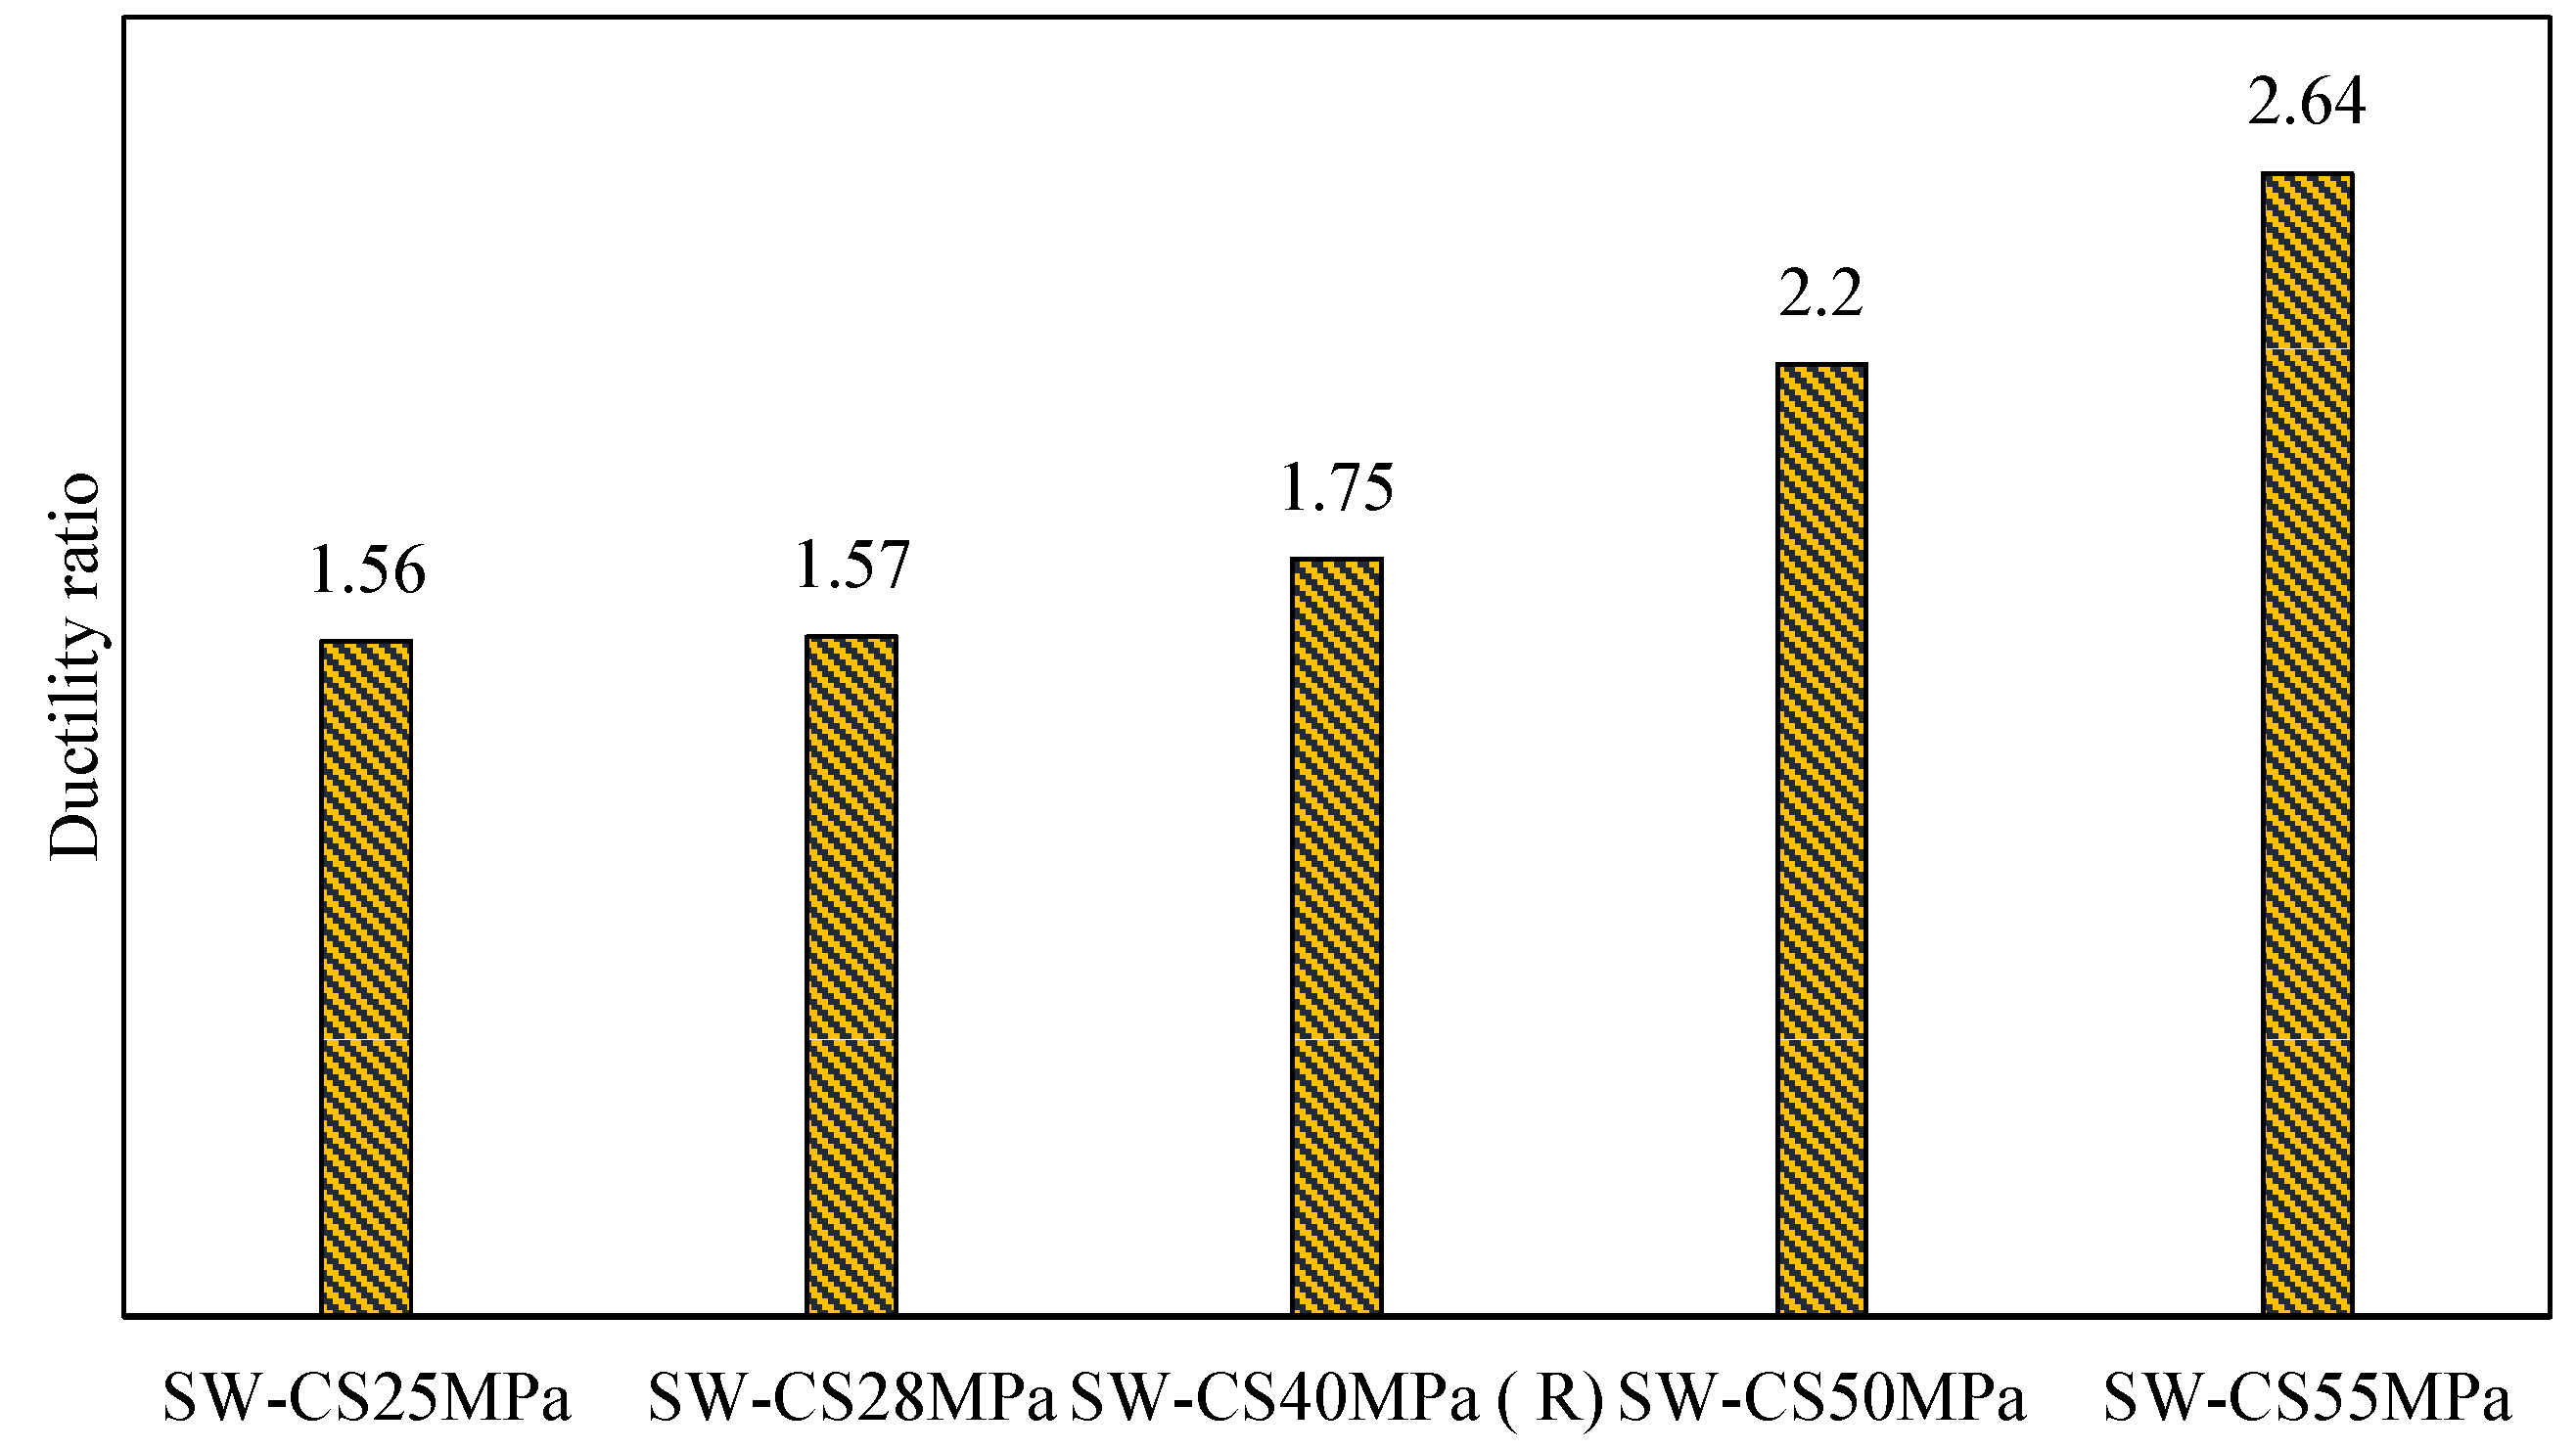
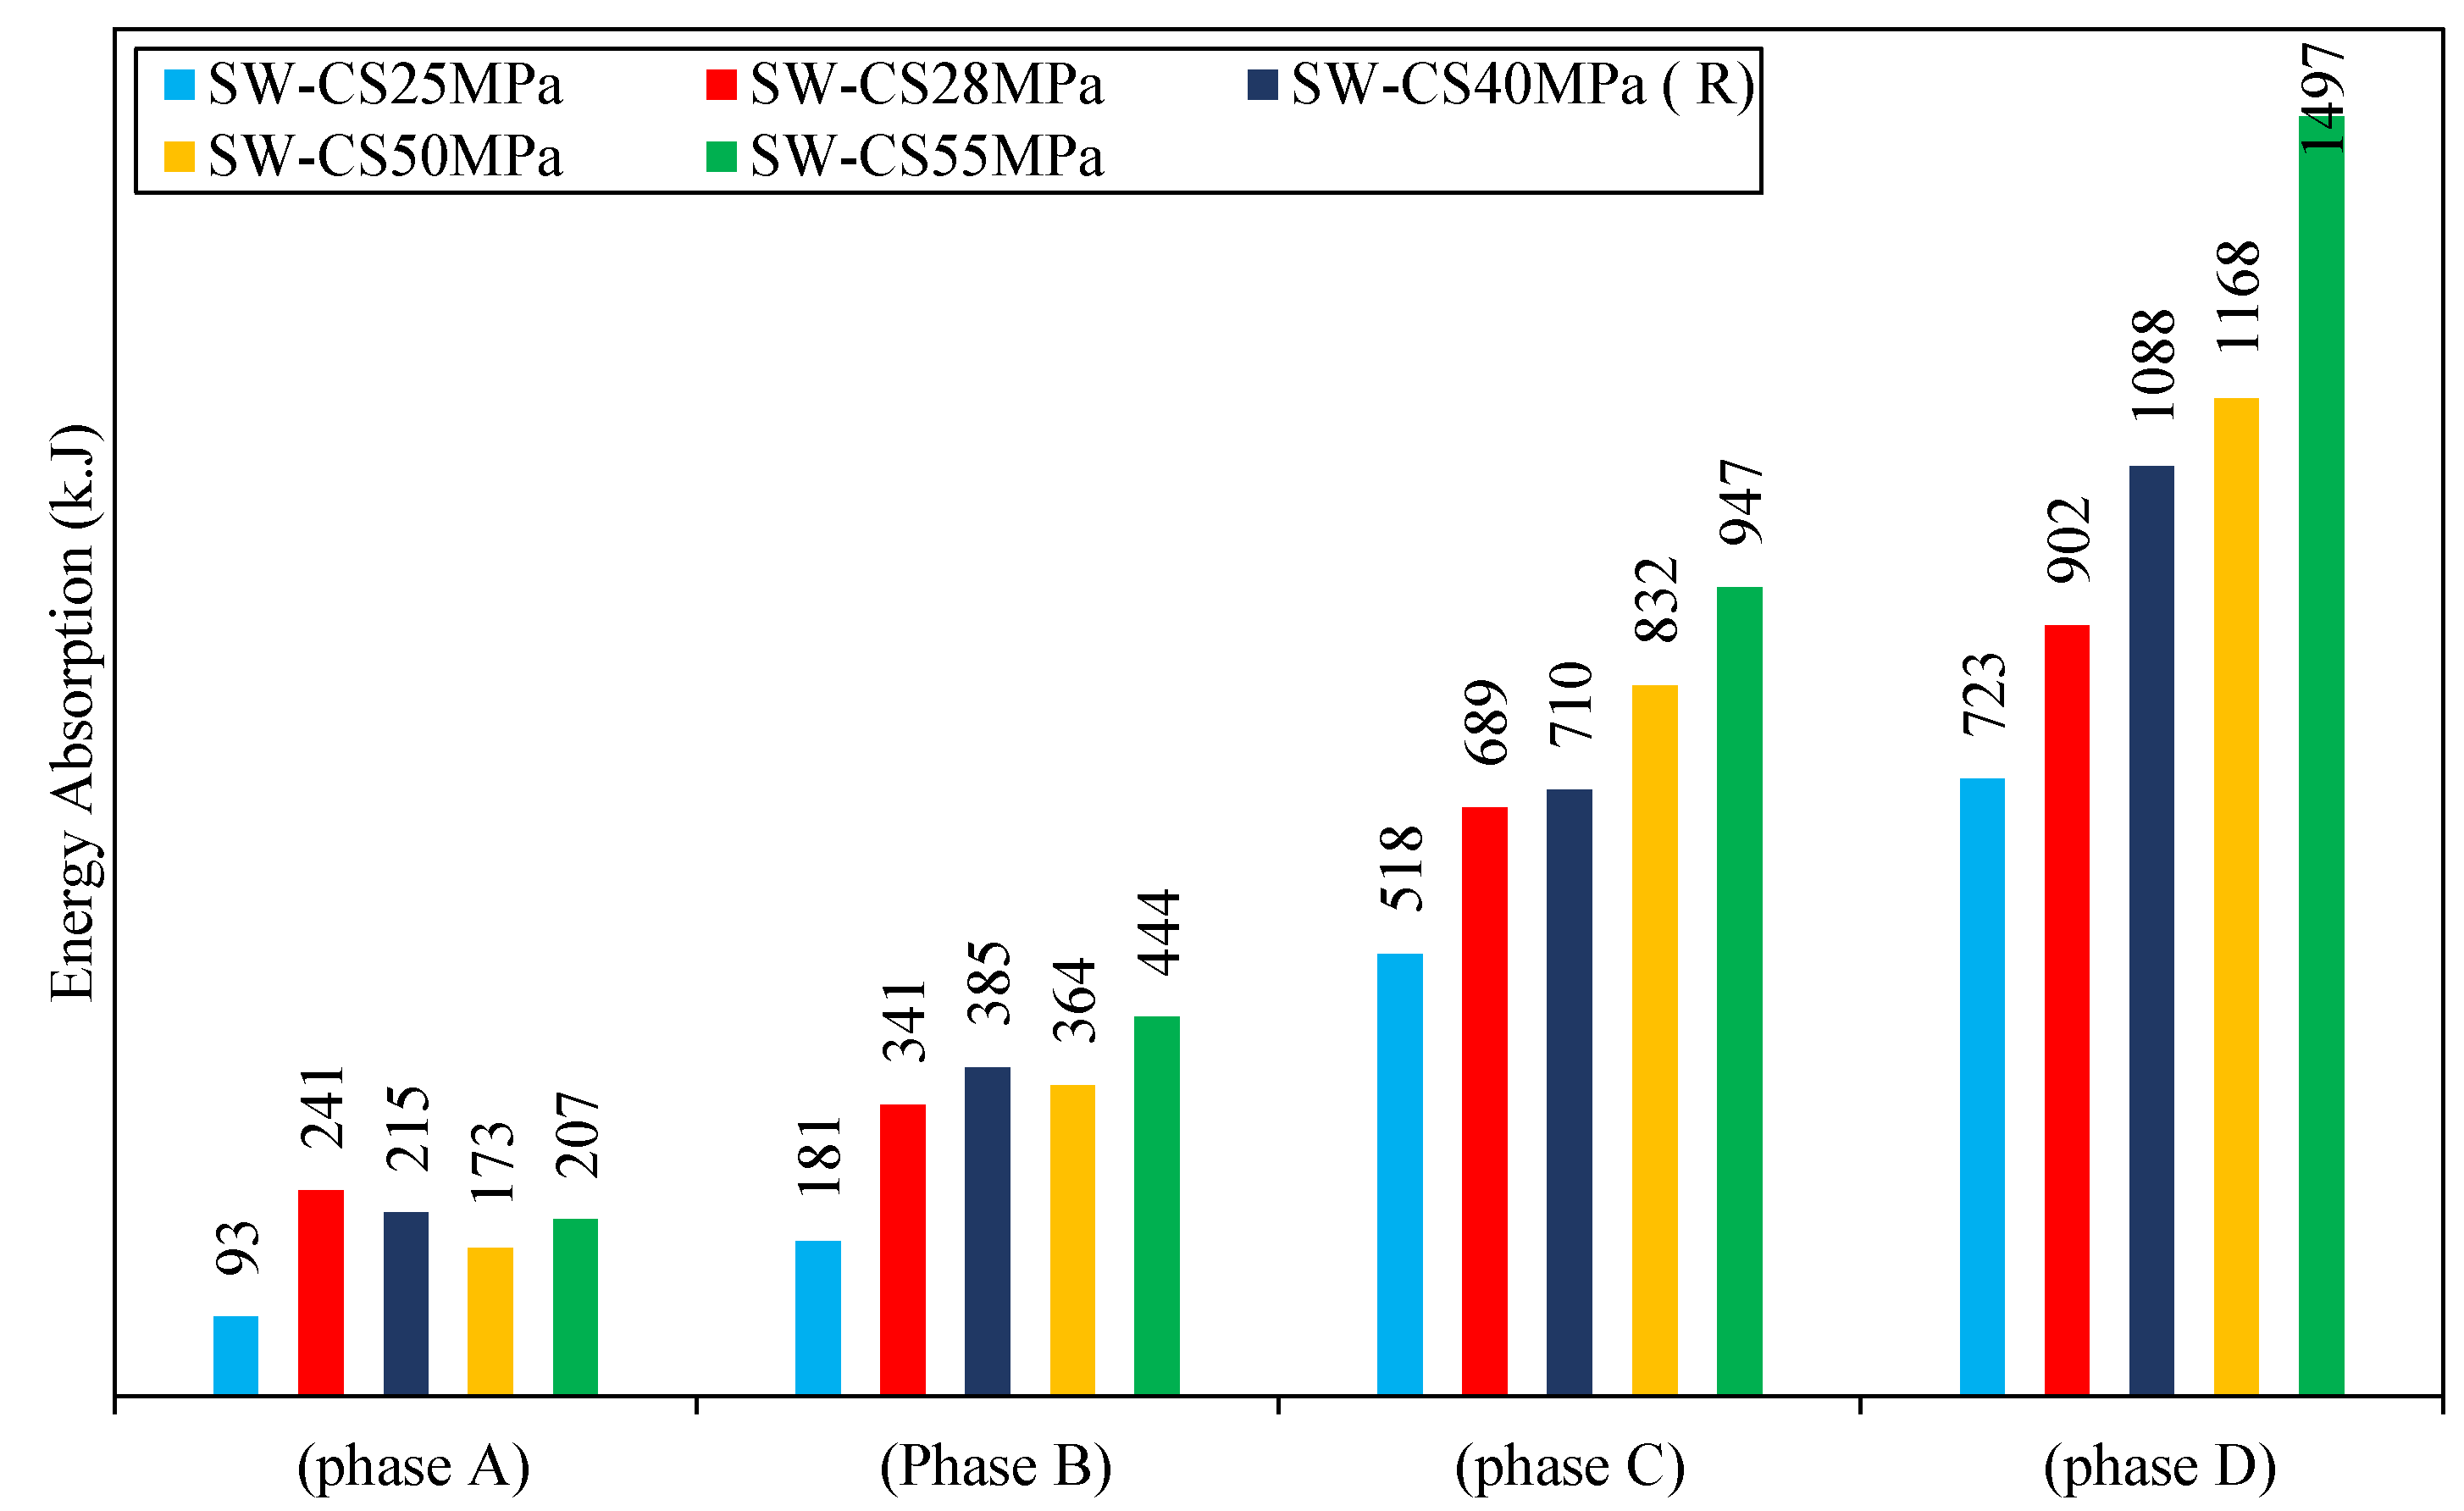
4.1.2. The Second Group Models (Influence of Concrete Wall Compressive Strength)
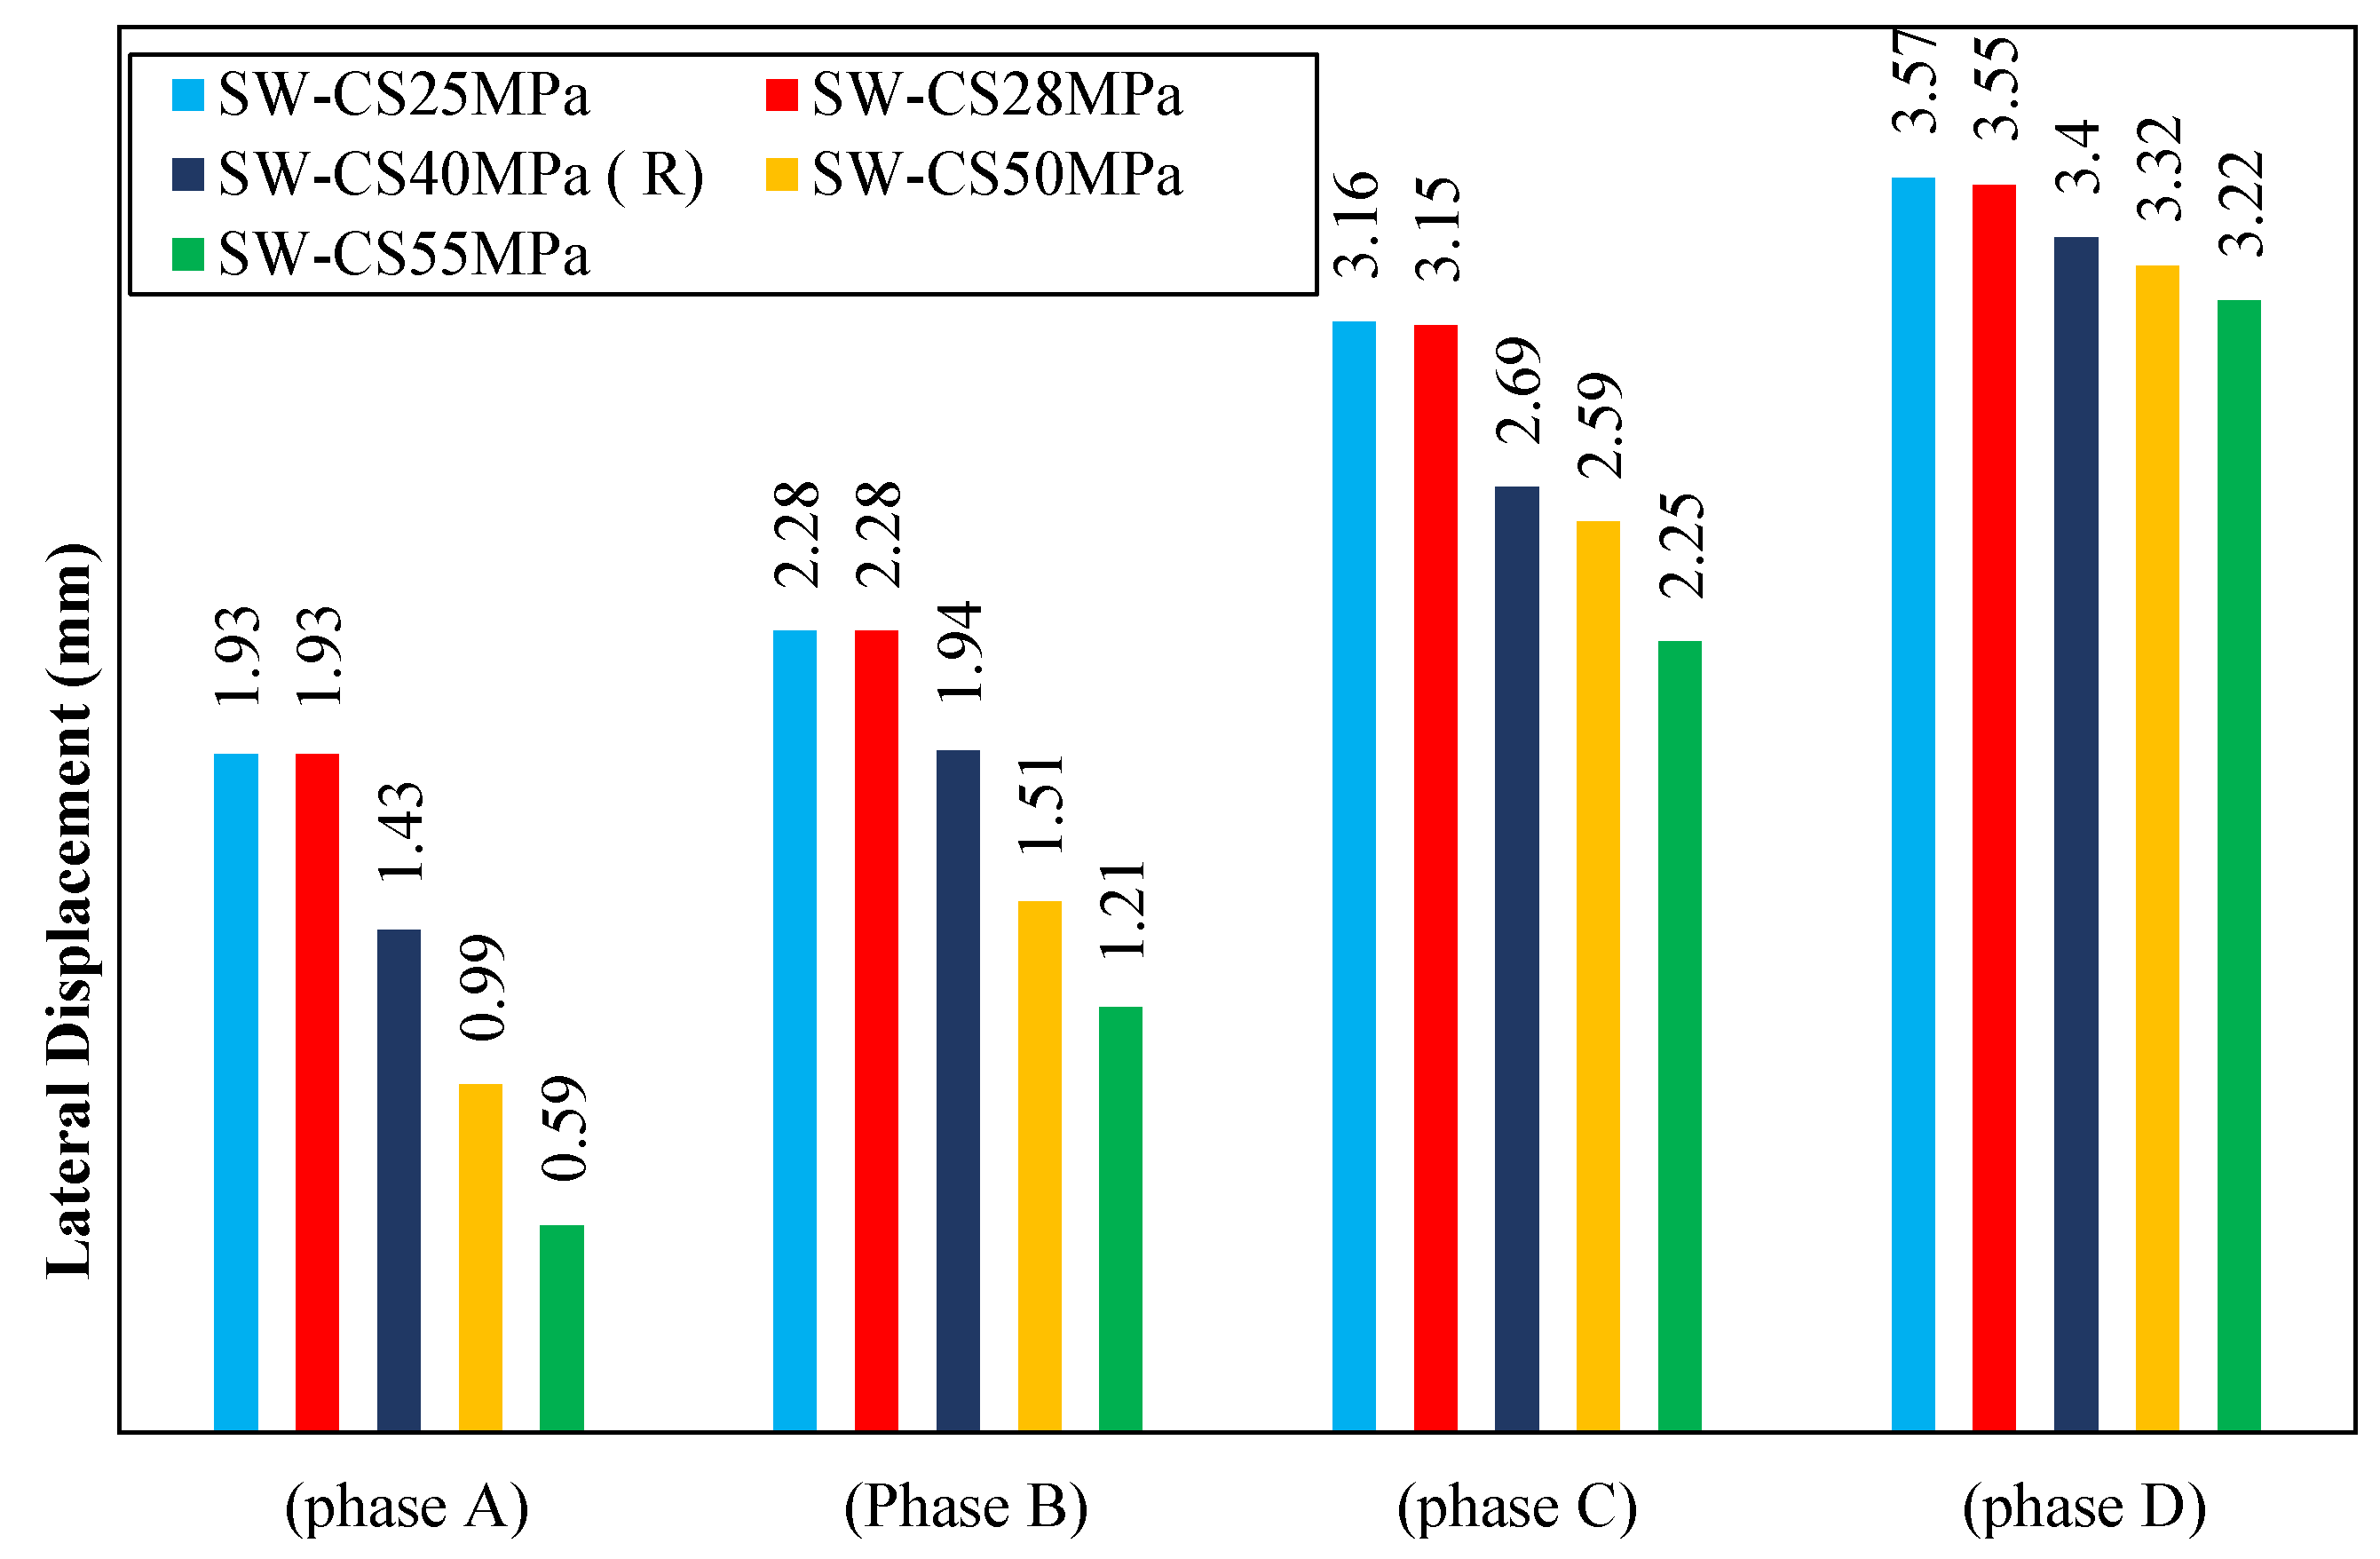
- Lateral Displacement
- Phase A:
- Phase B:
- Phase C:
- Phase D:
- 2.
- Stiffness
- 3.
- Ductility
- 4.
- Energy Absorption
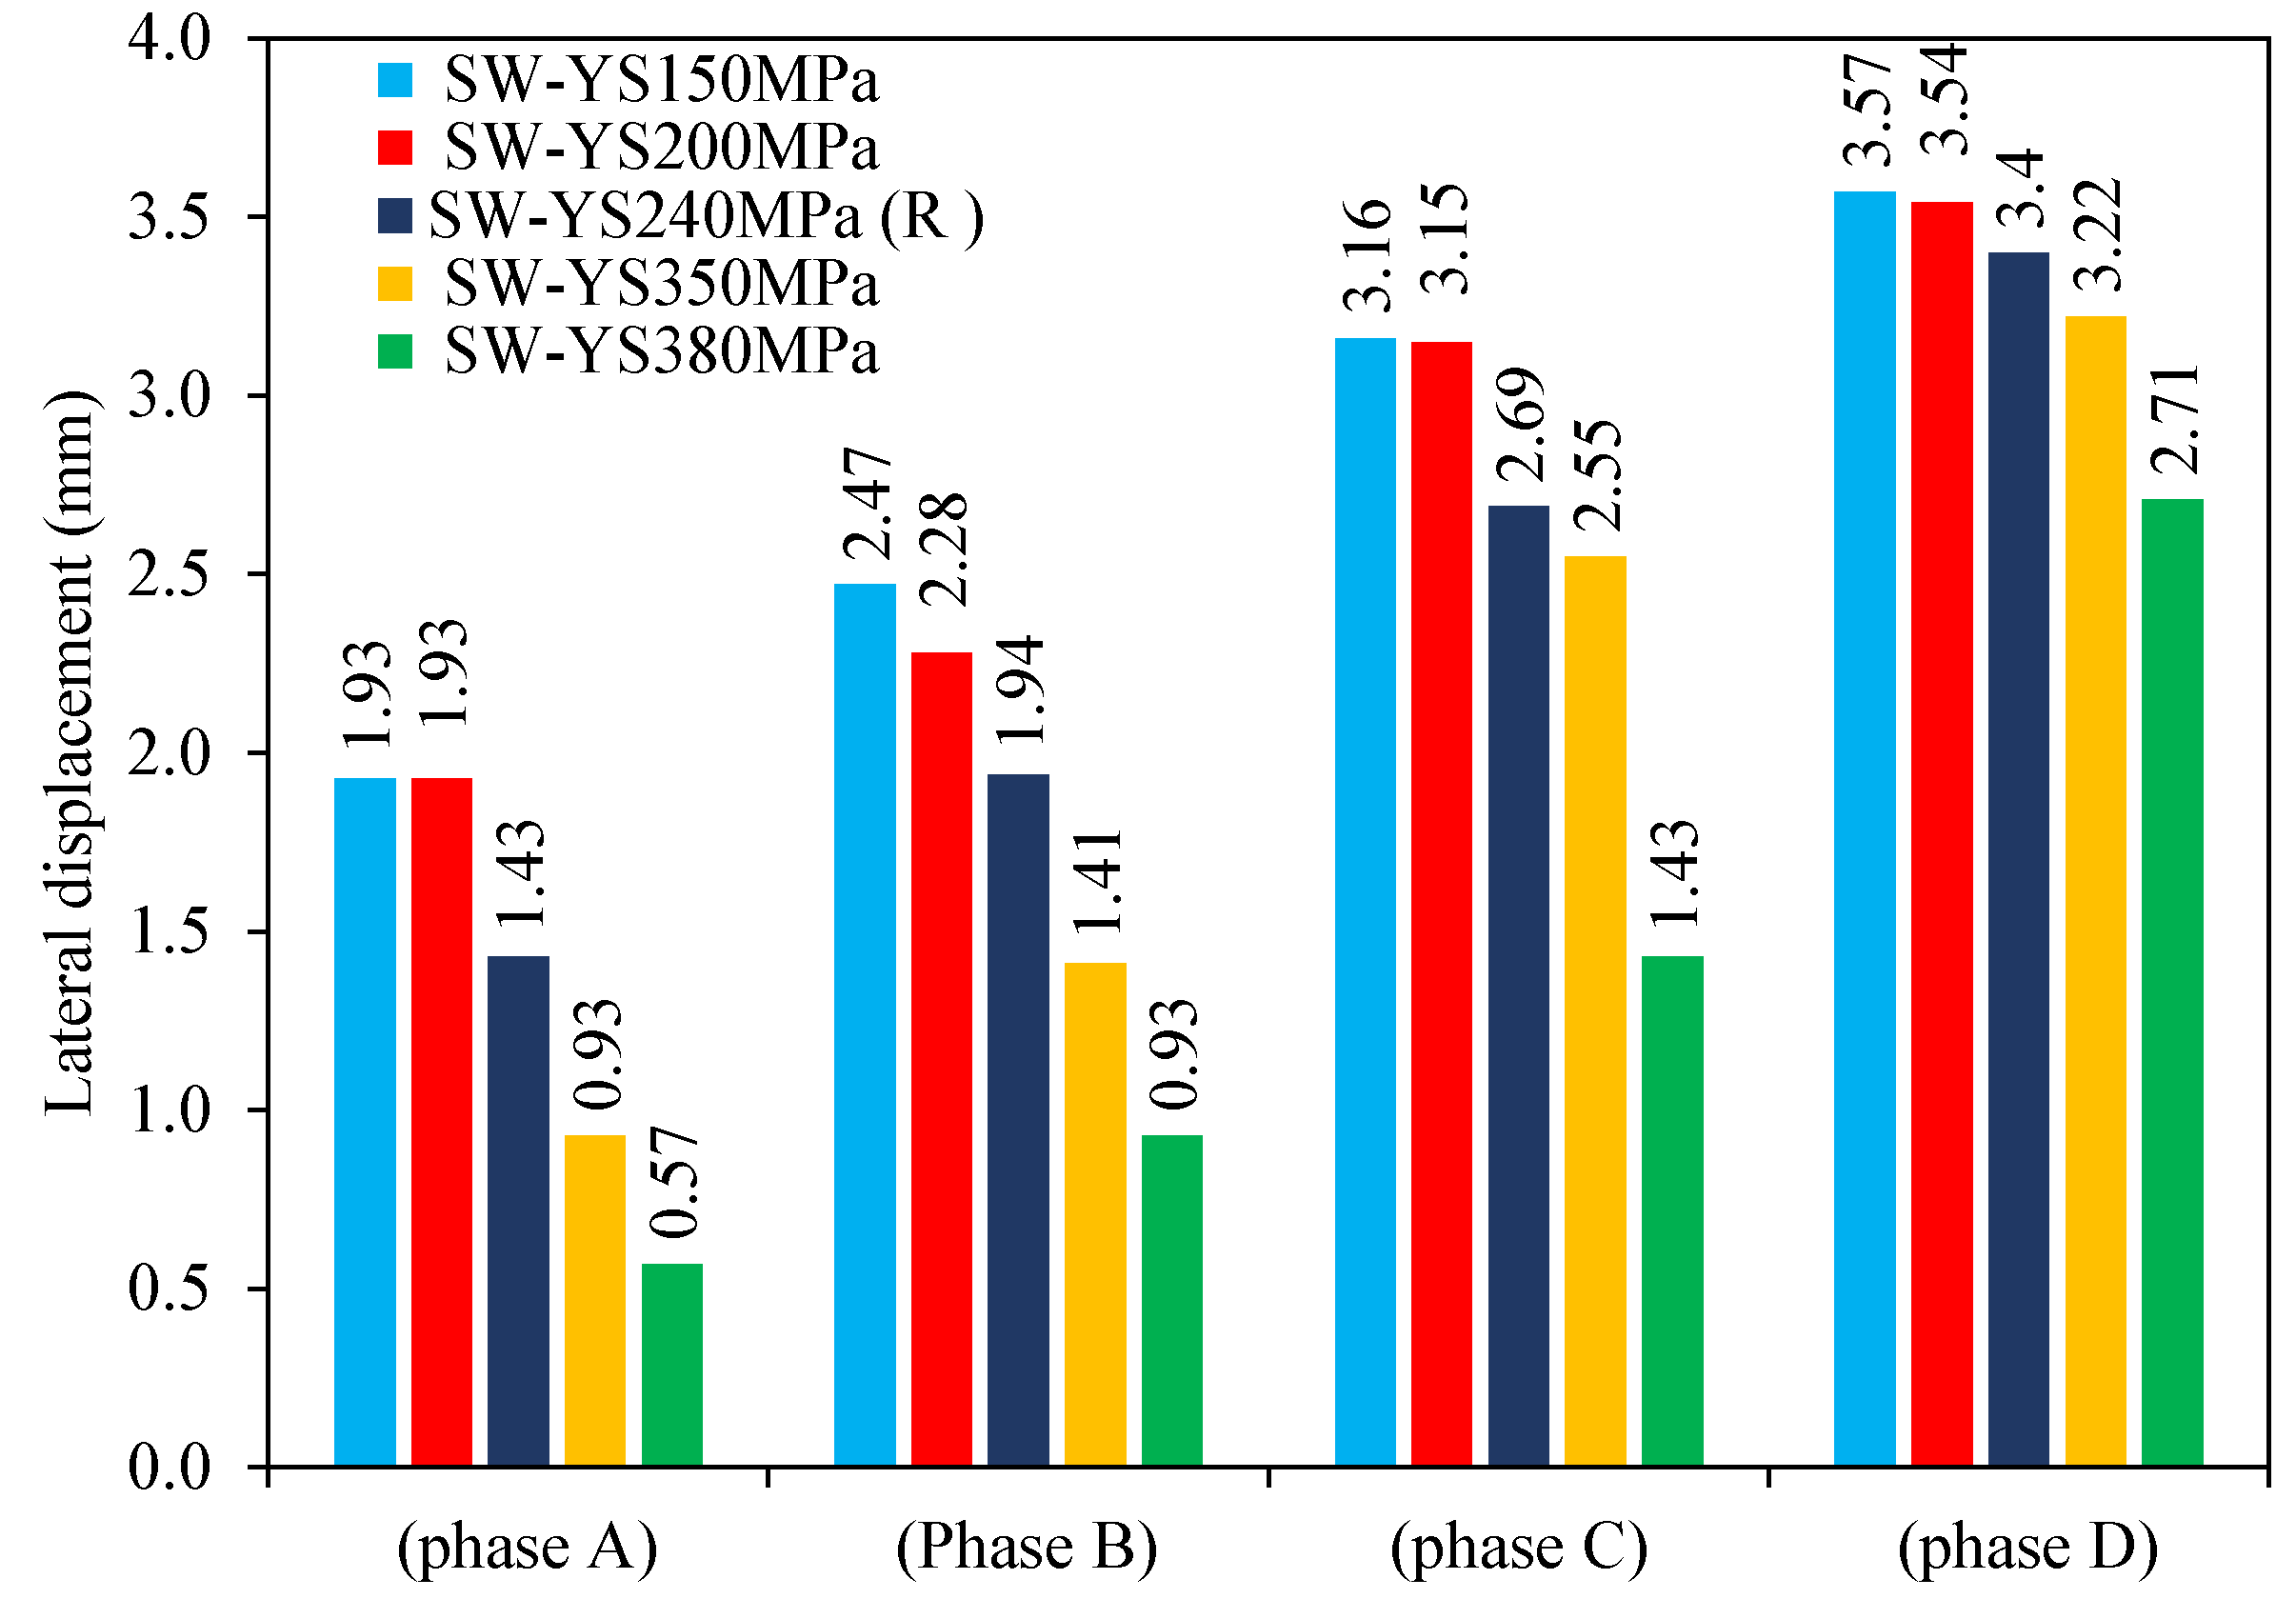
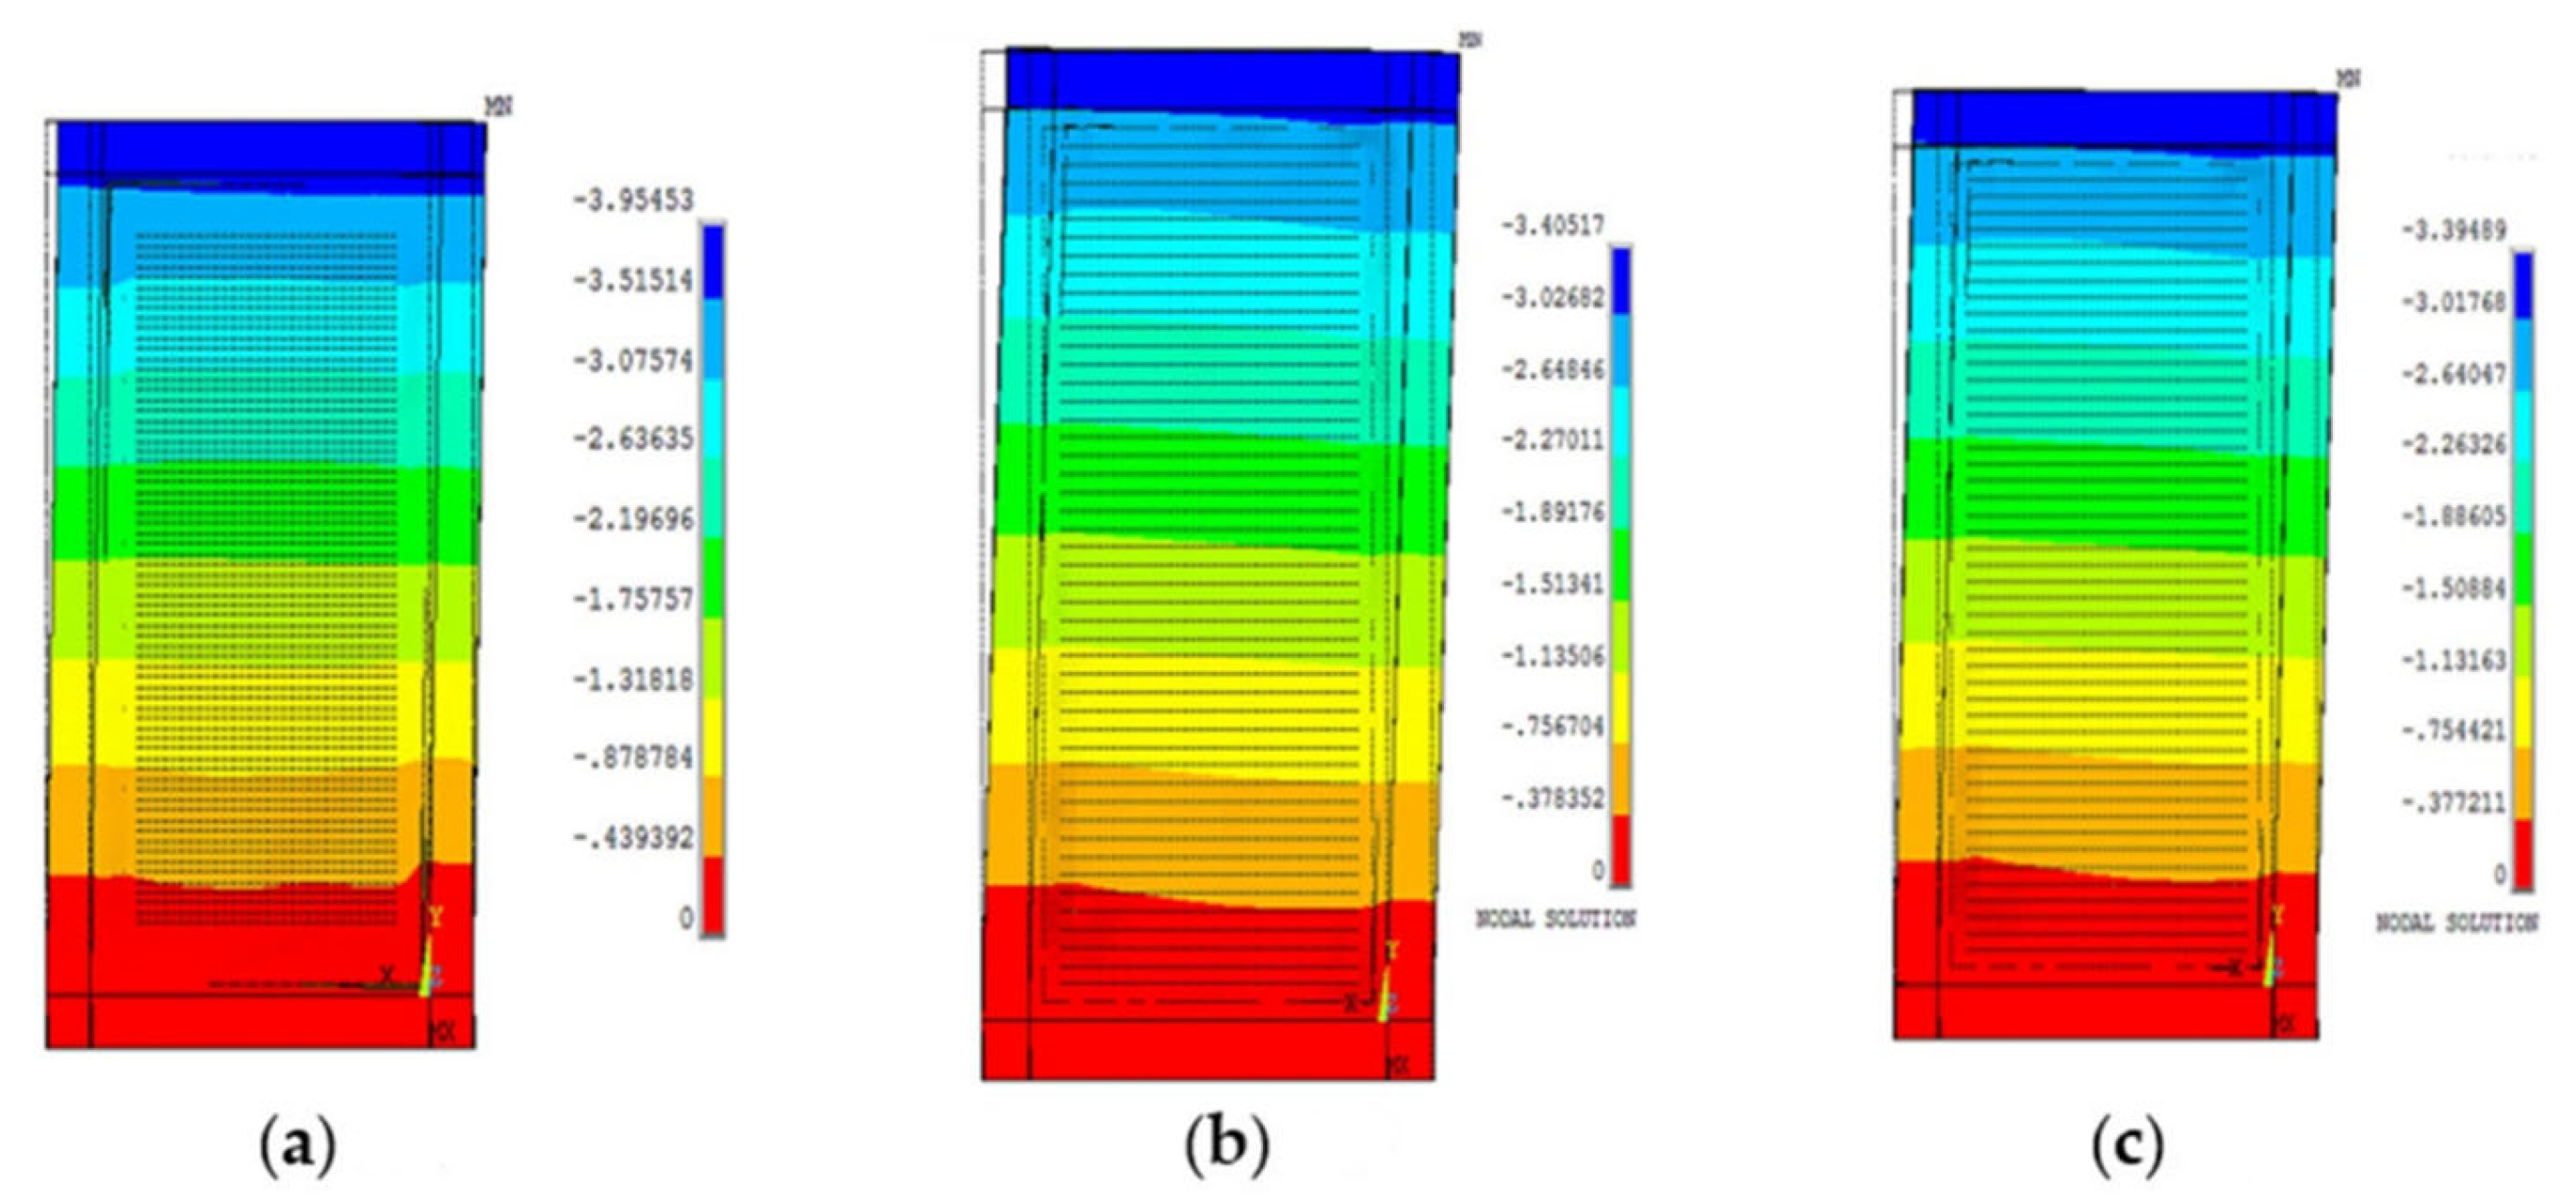
4.1.3. The Third Group Models (Influence of Yield Stress of Infill Steel Plate)
- Lateral displacement
- Phase A:
- Phase B:
- Phase C:
- Phase D:
- 2.
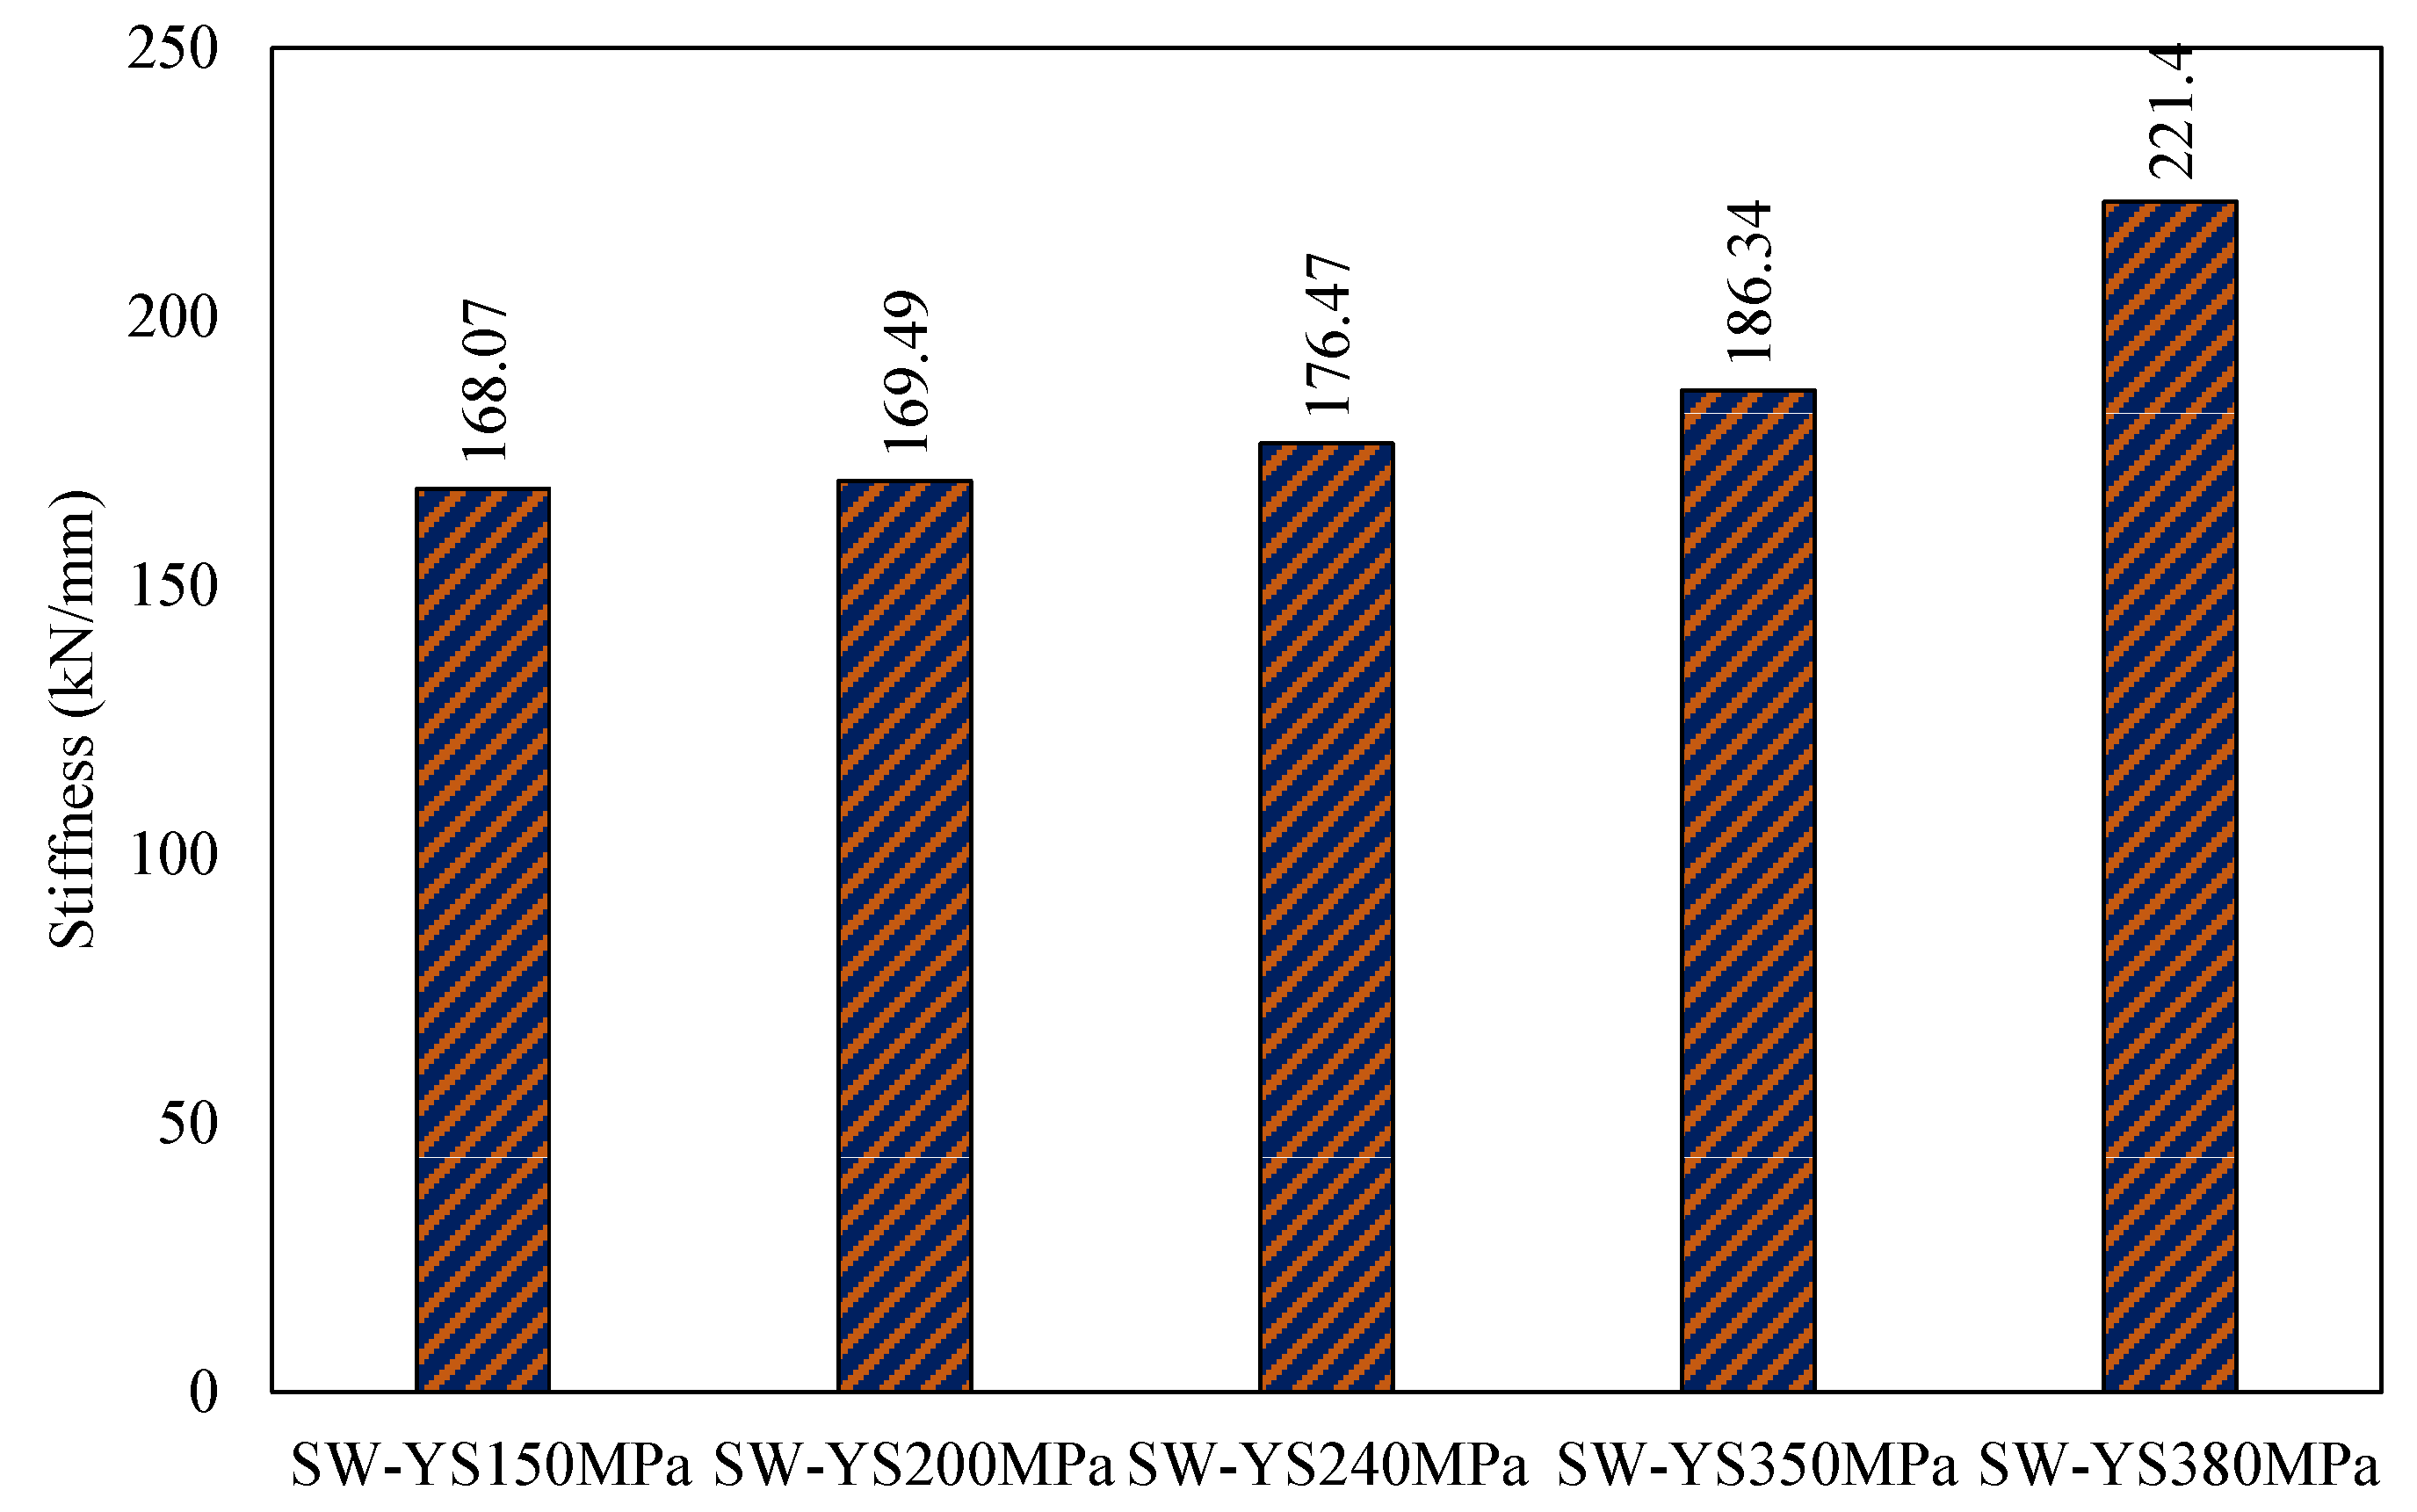
- Stiffness
- 3.
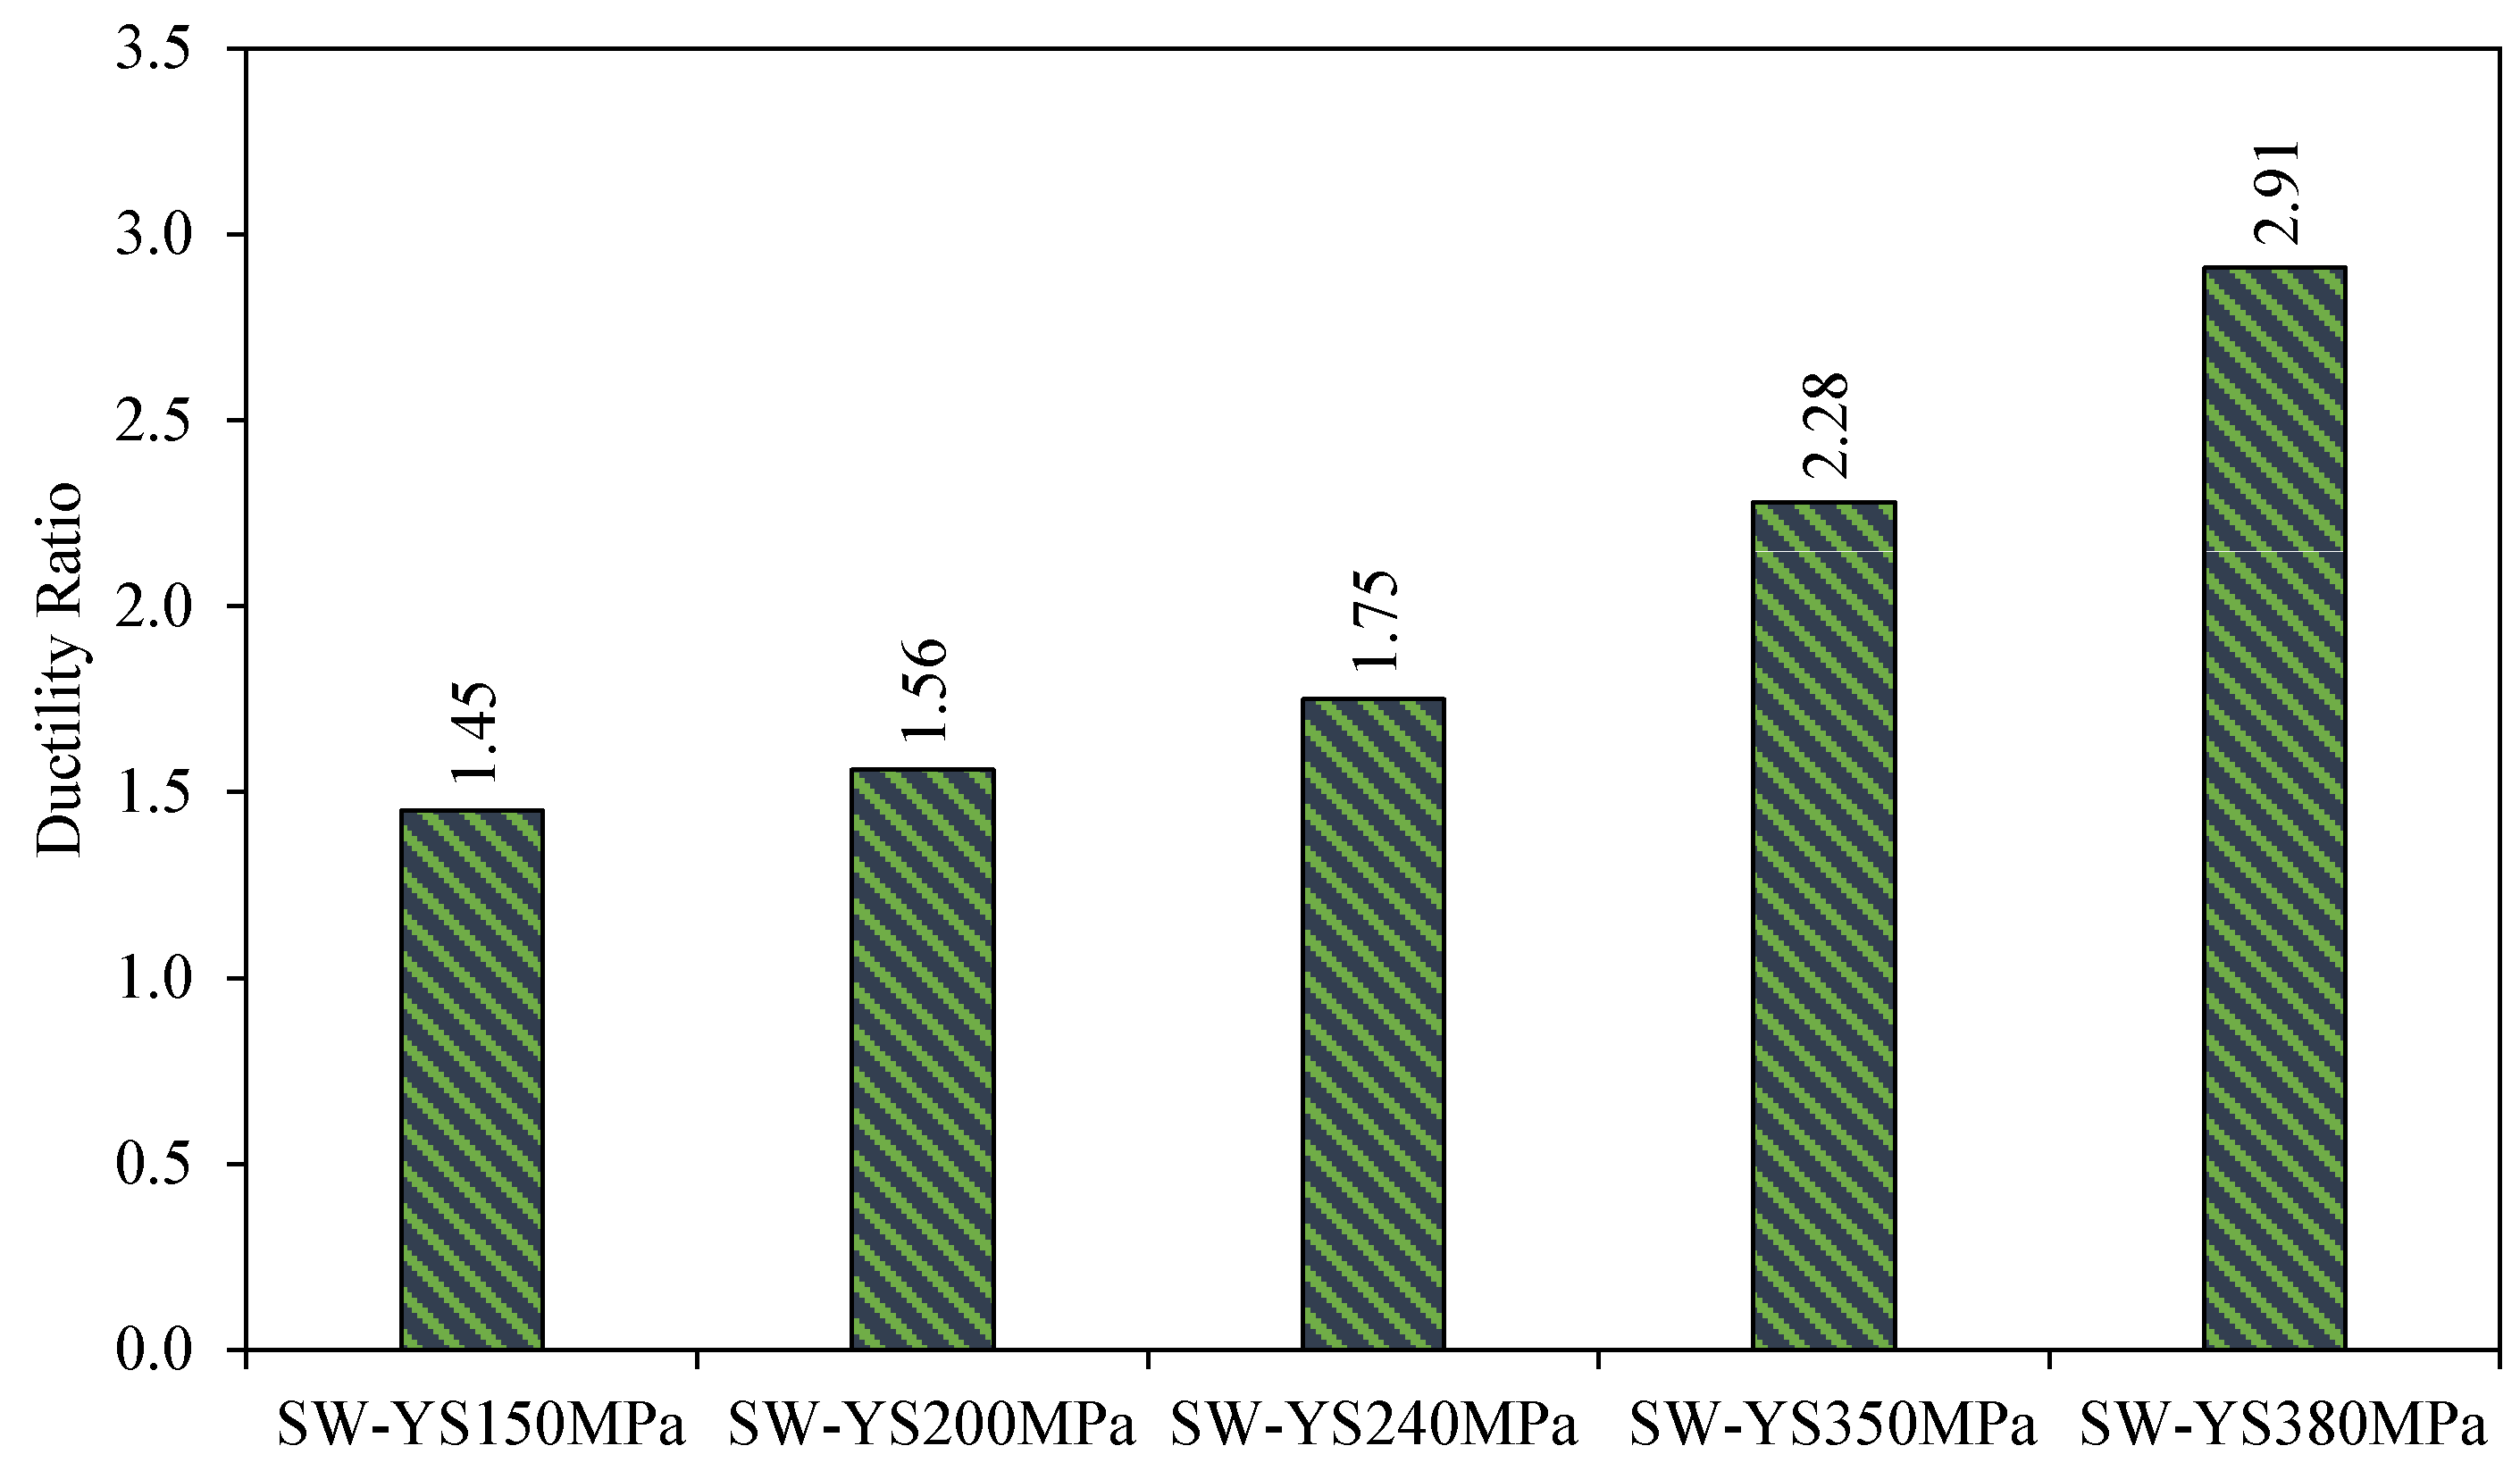
- Ductility
- 4.
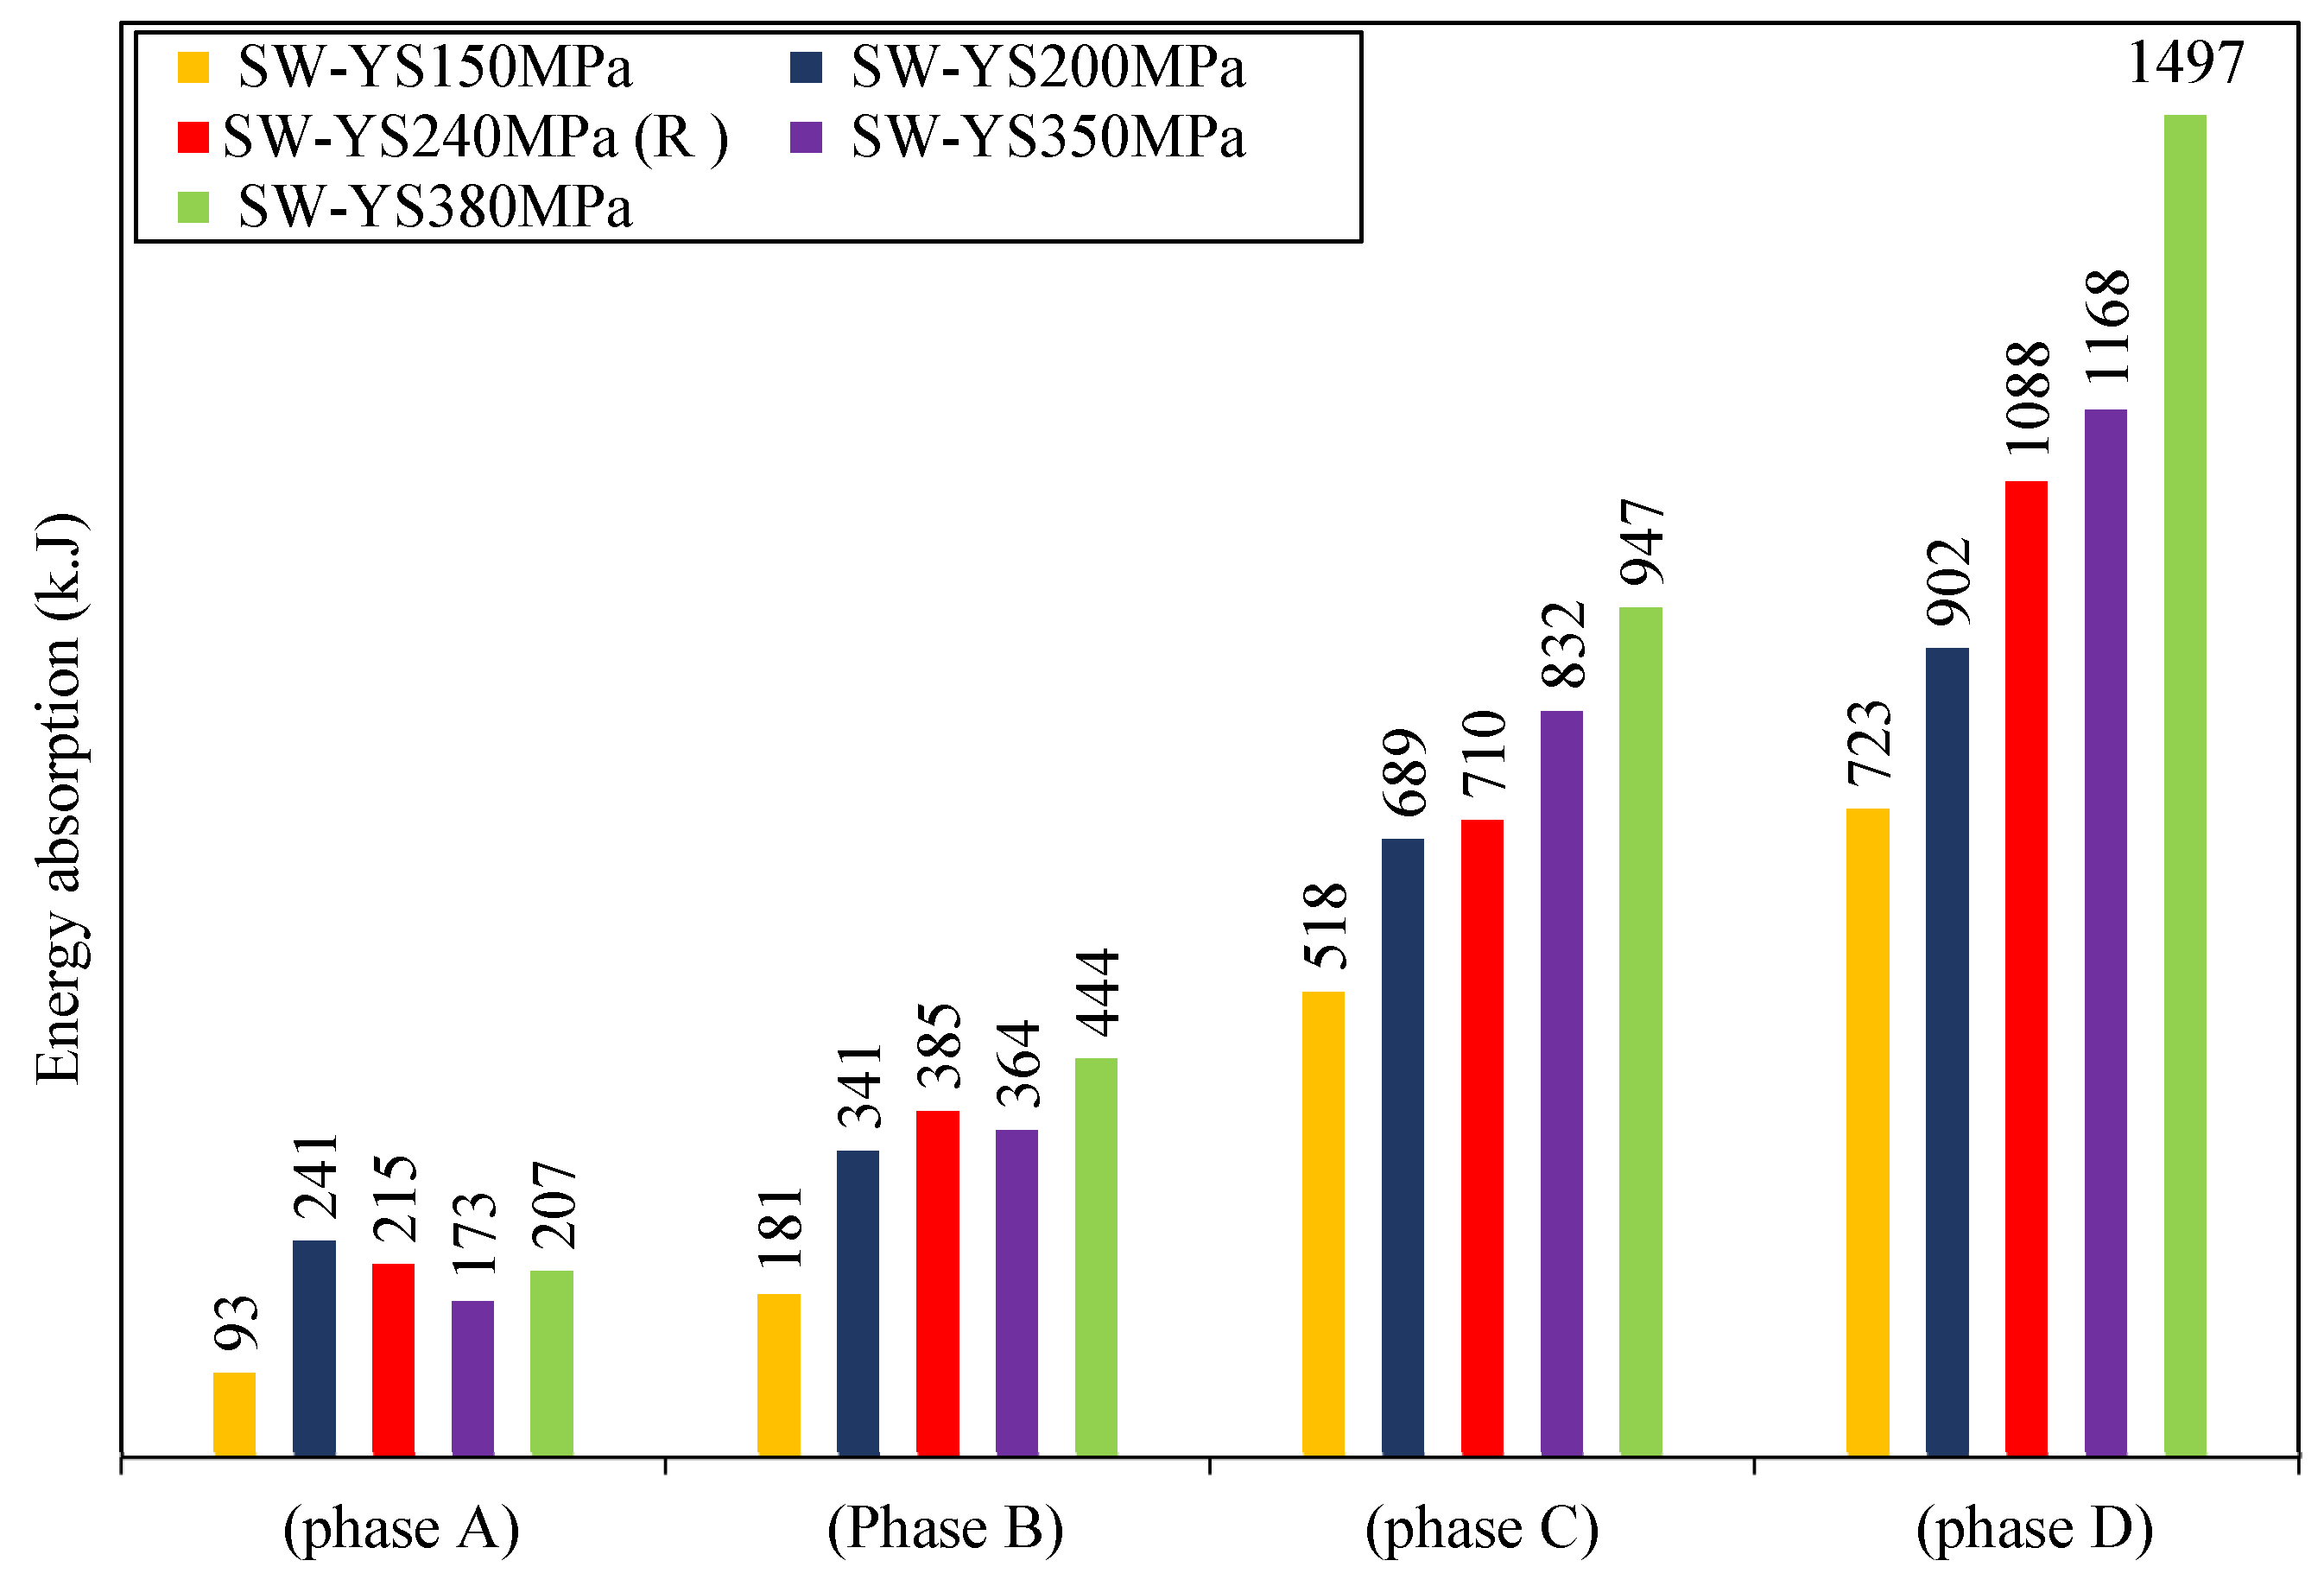
- Energy Absorption
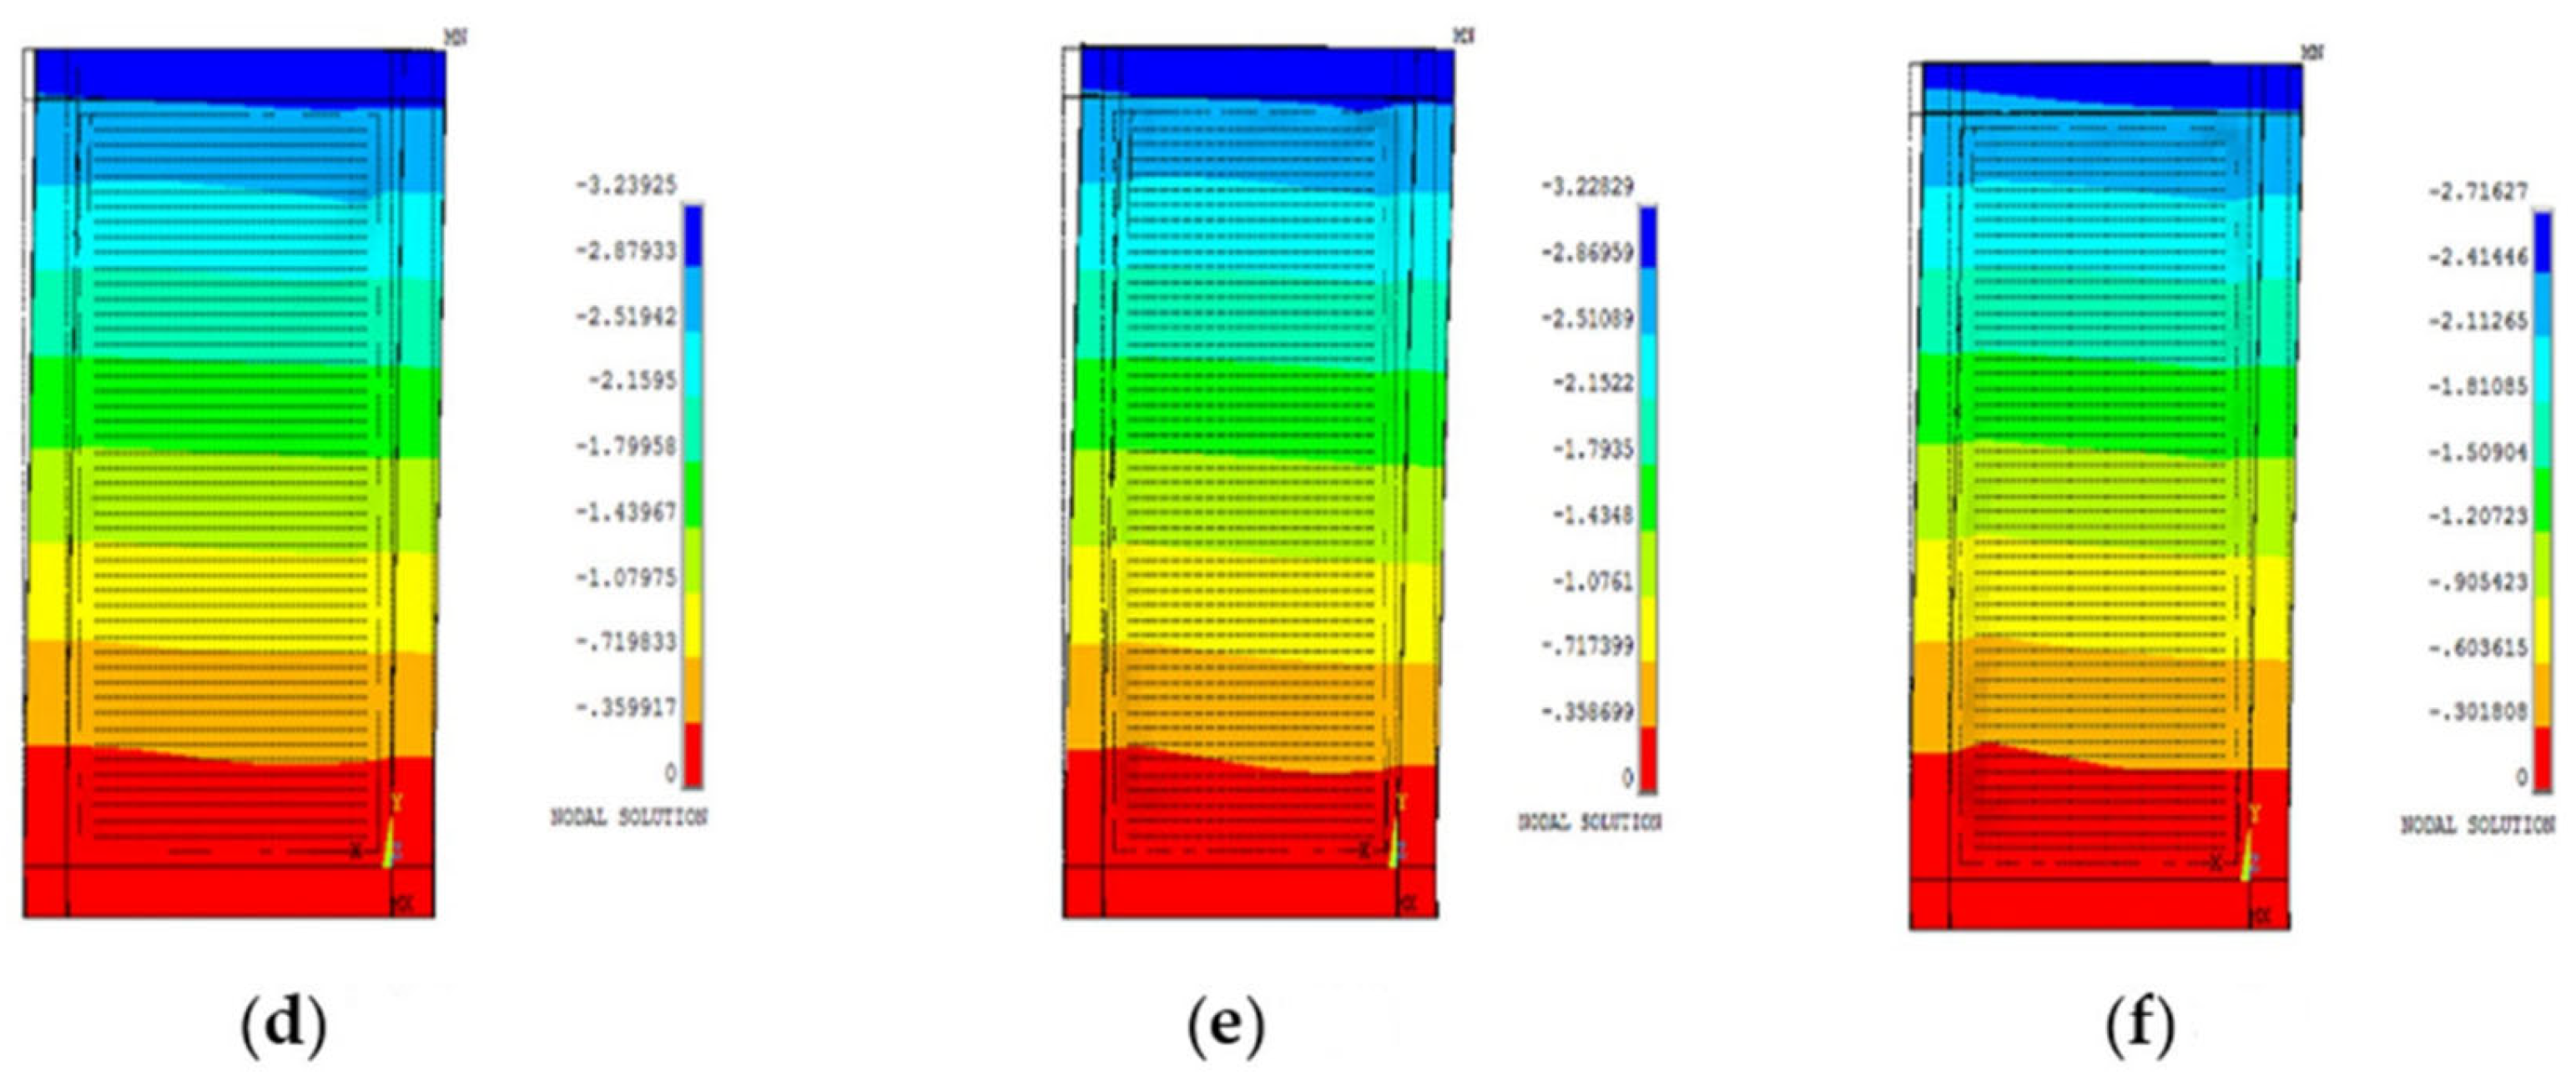
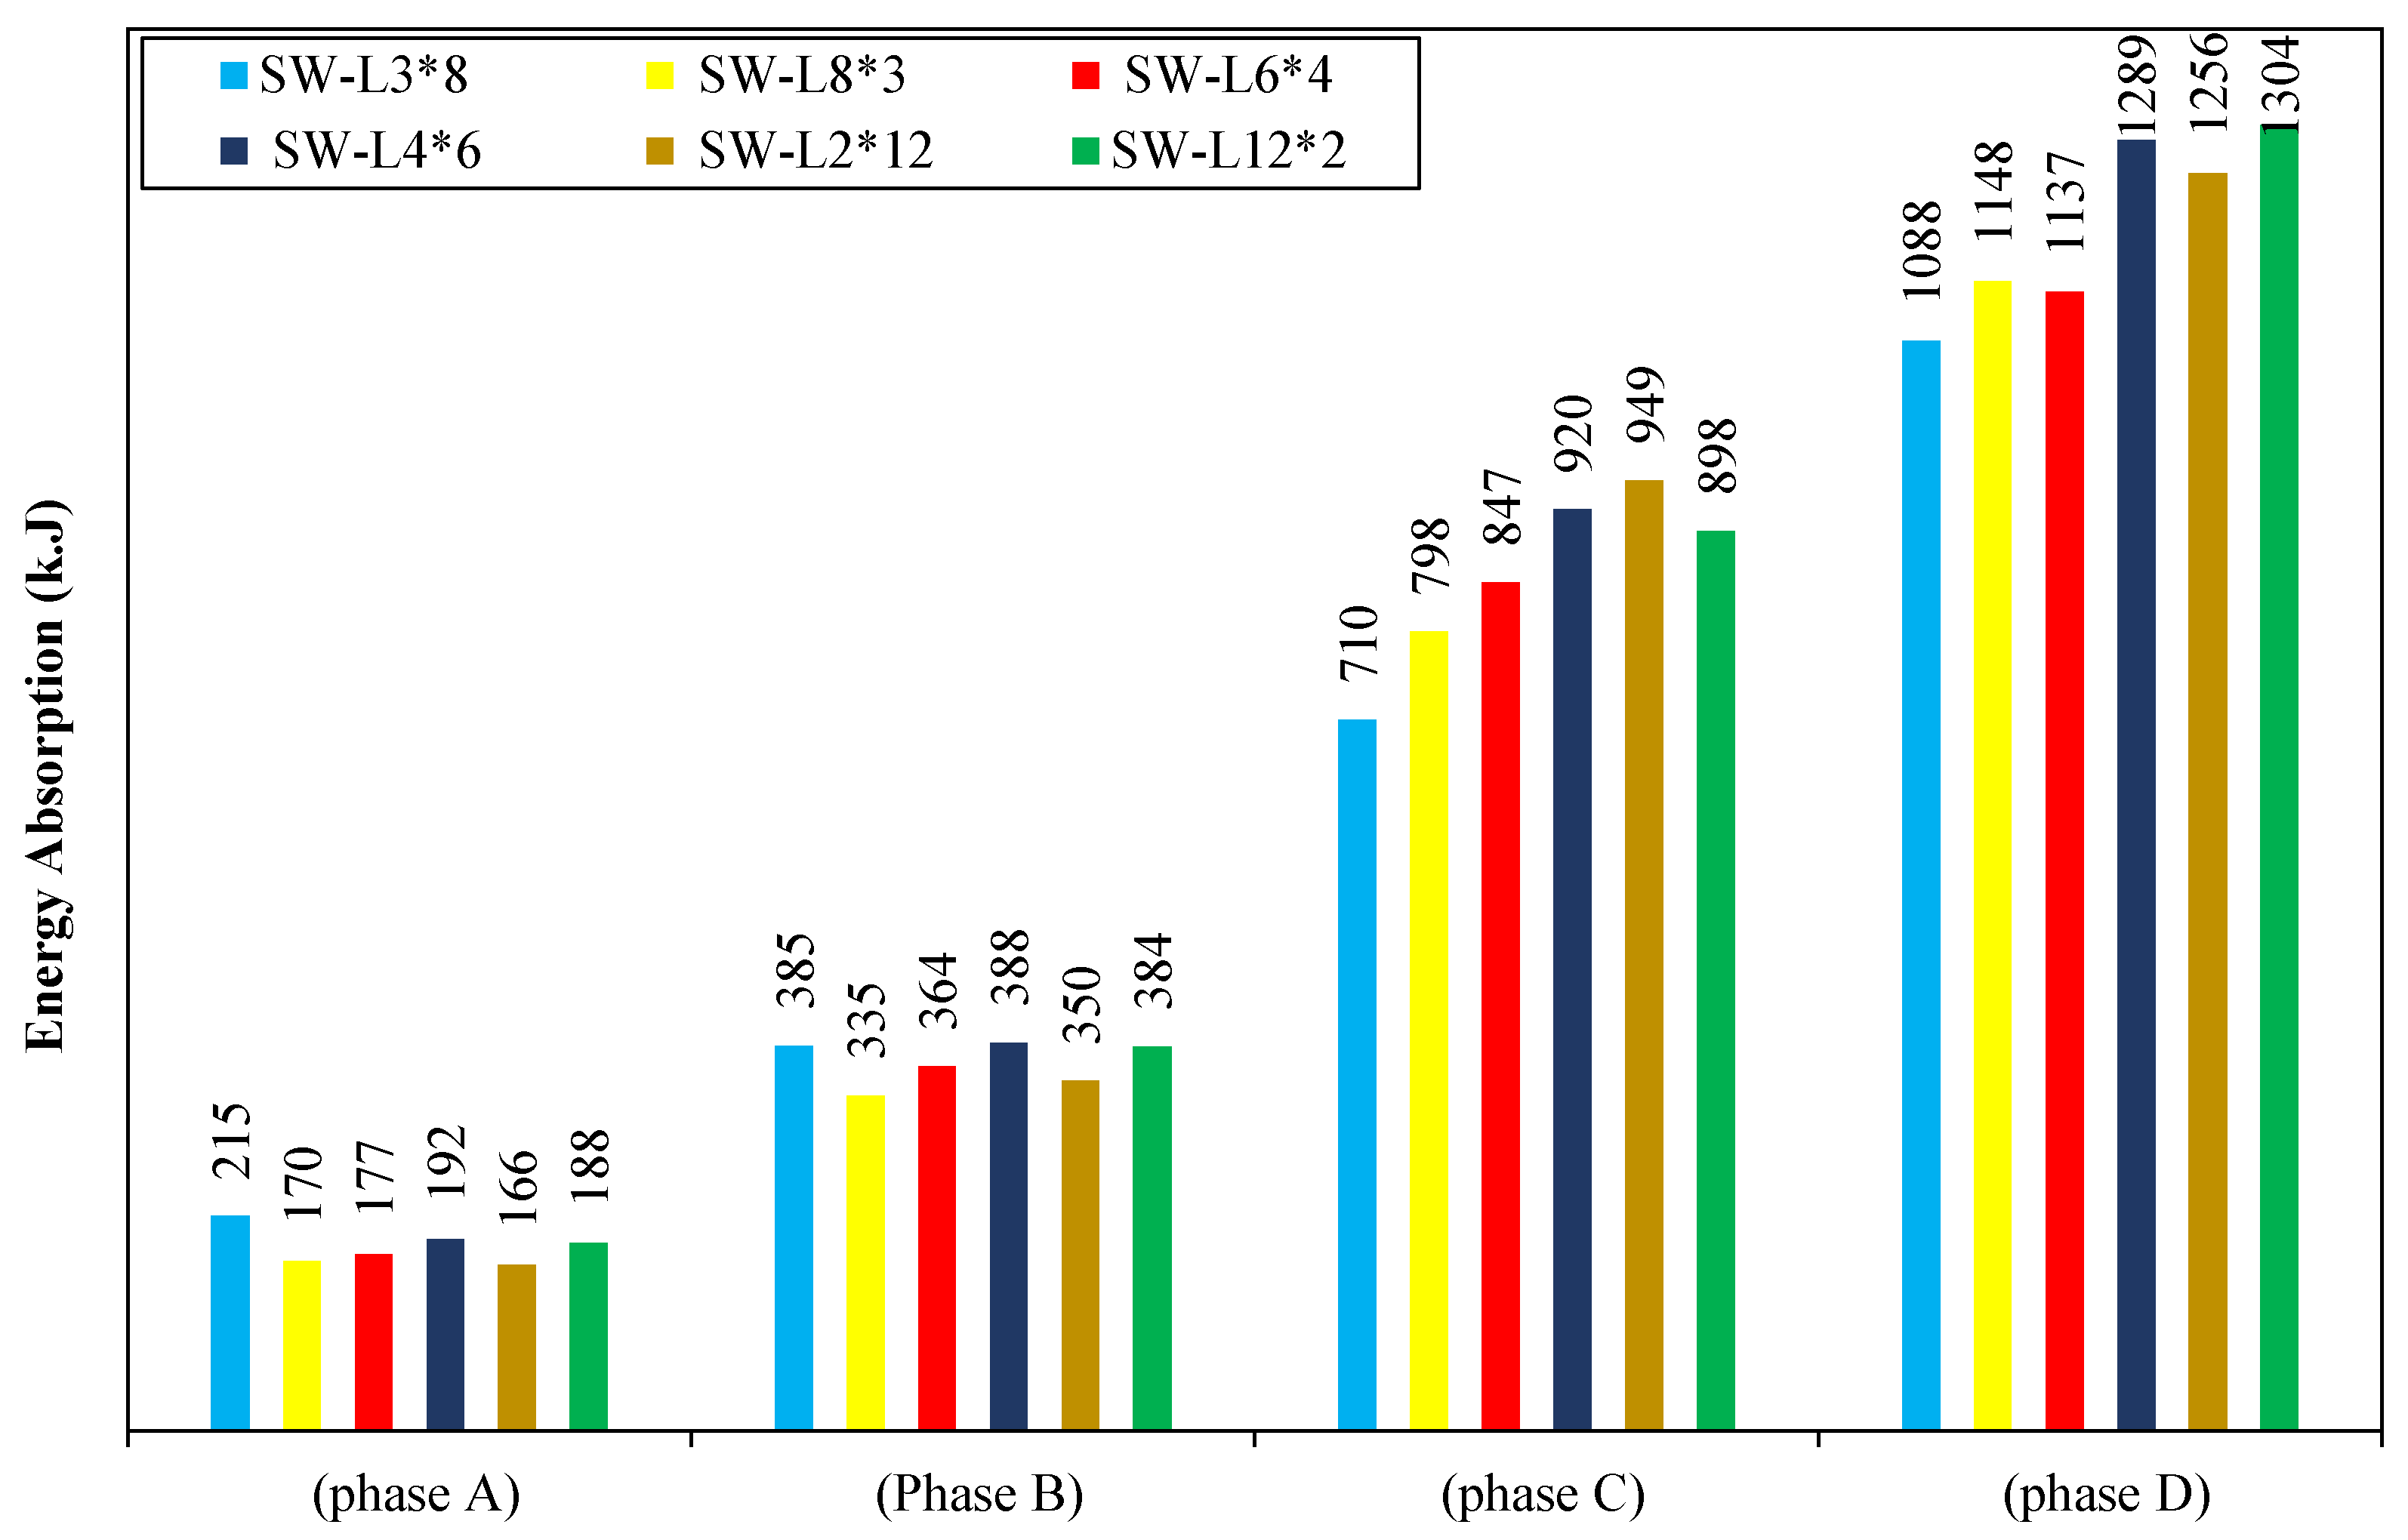
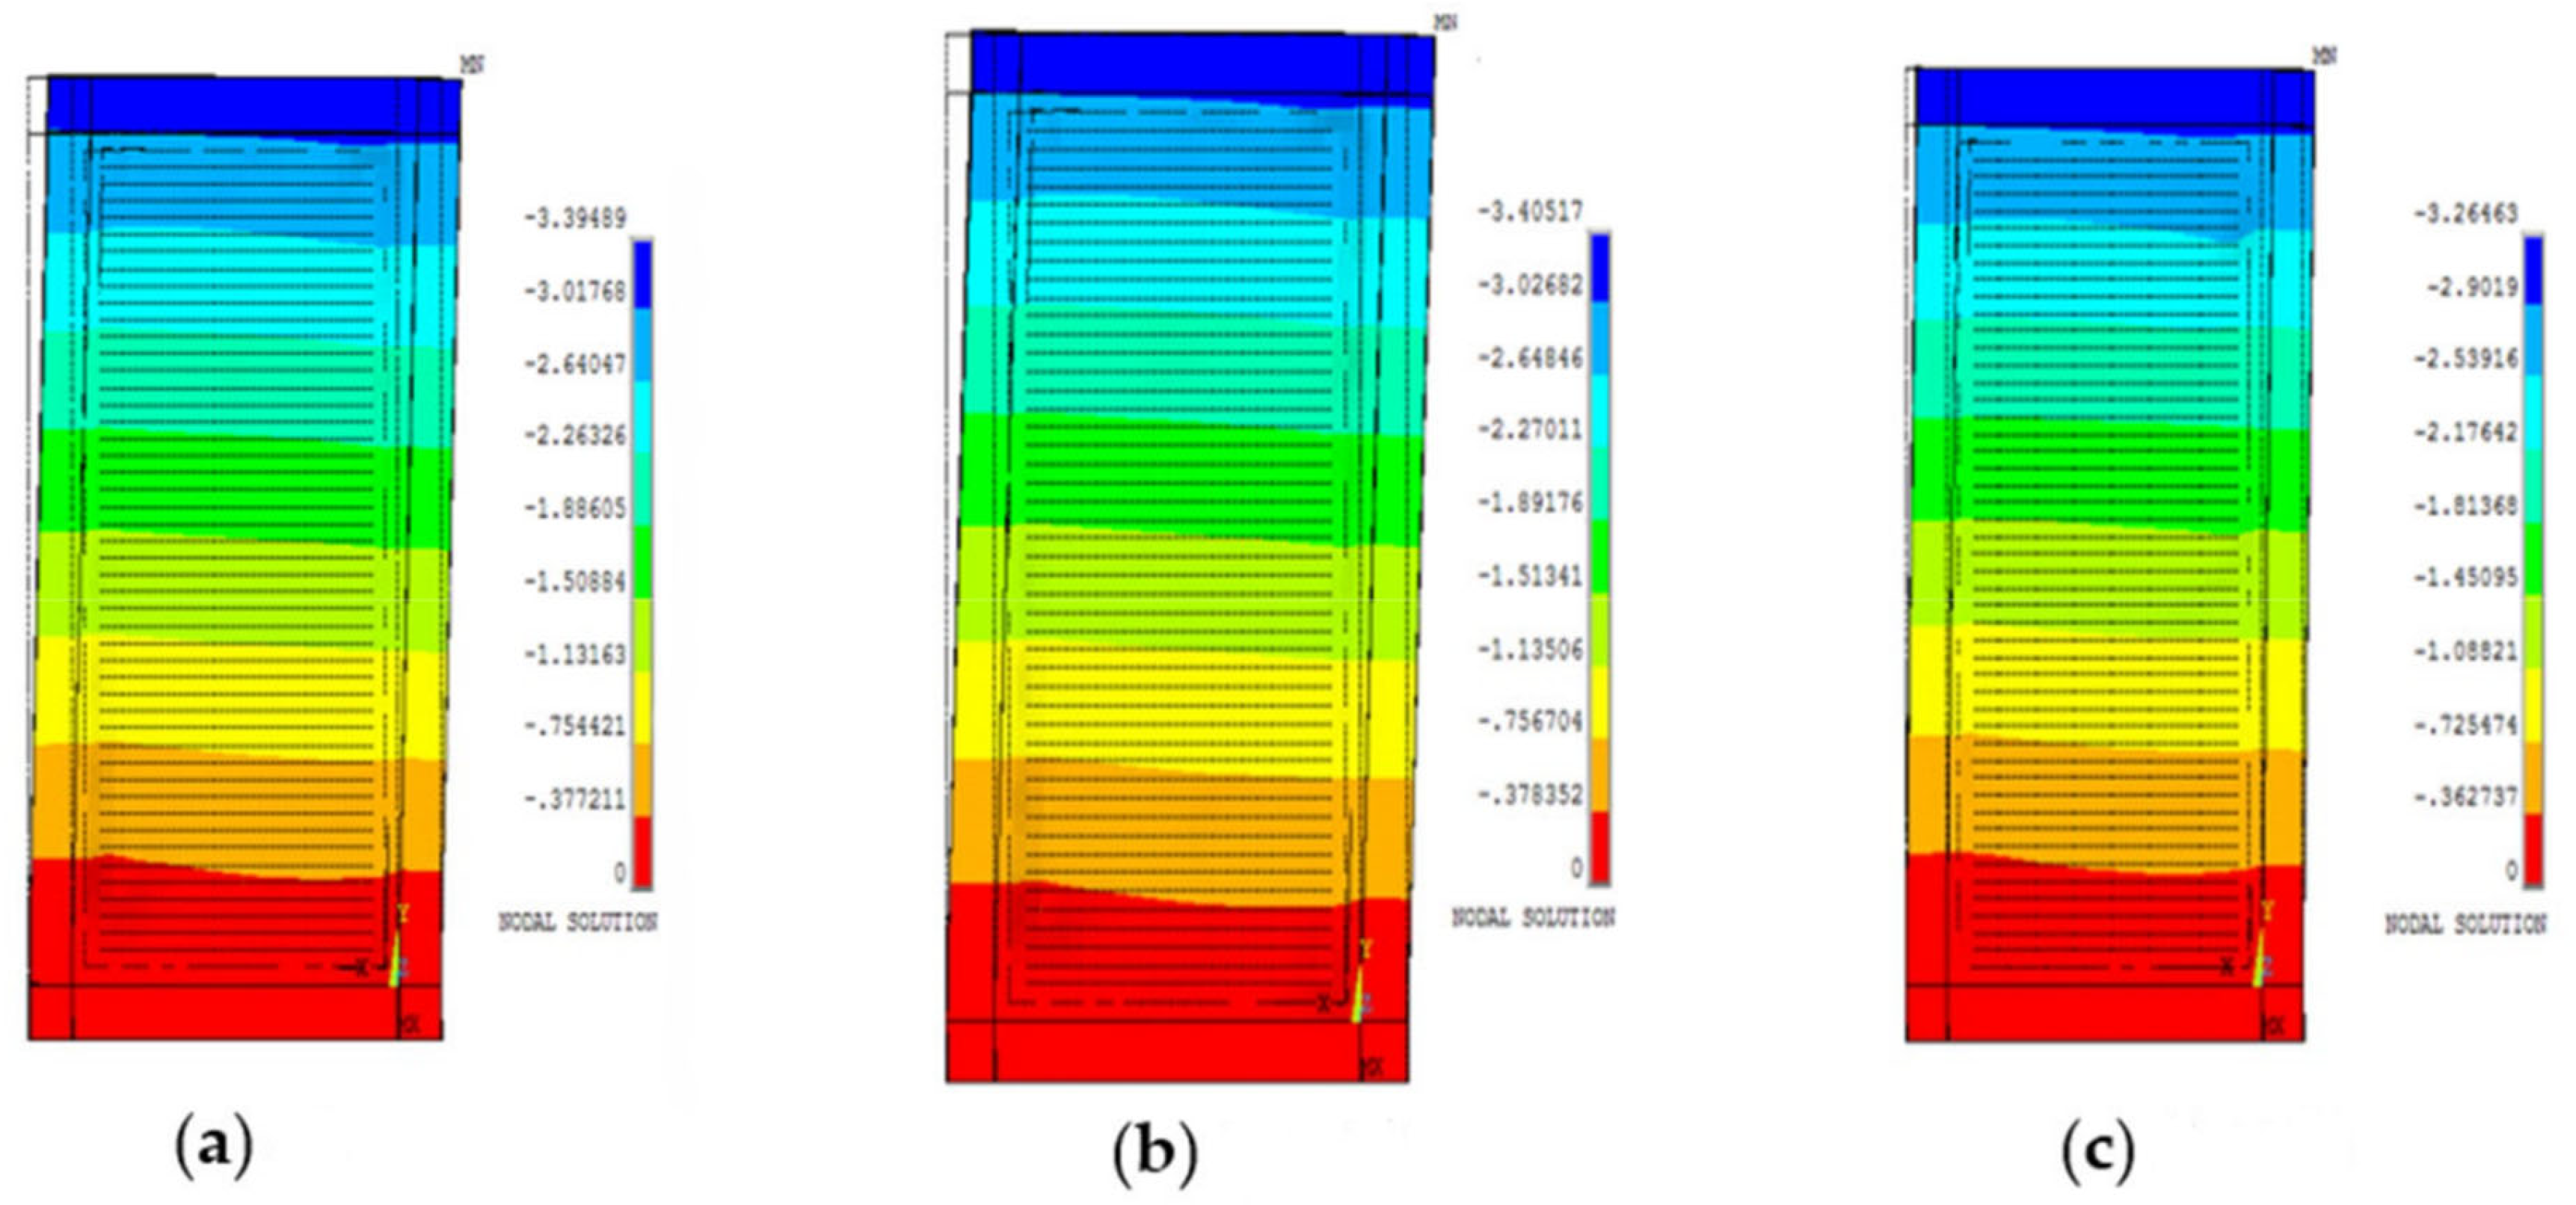
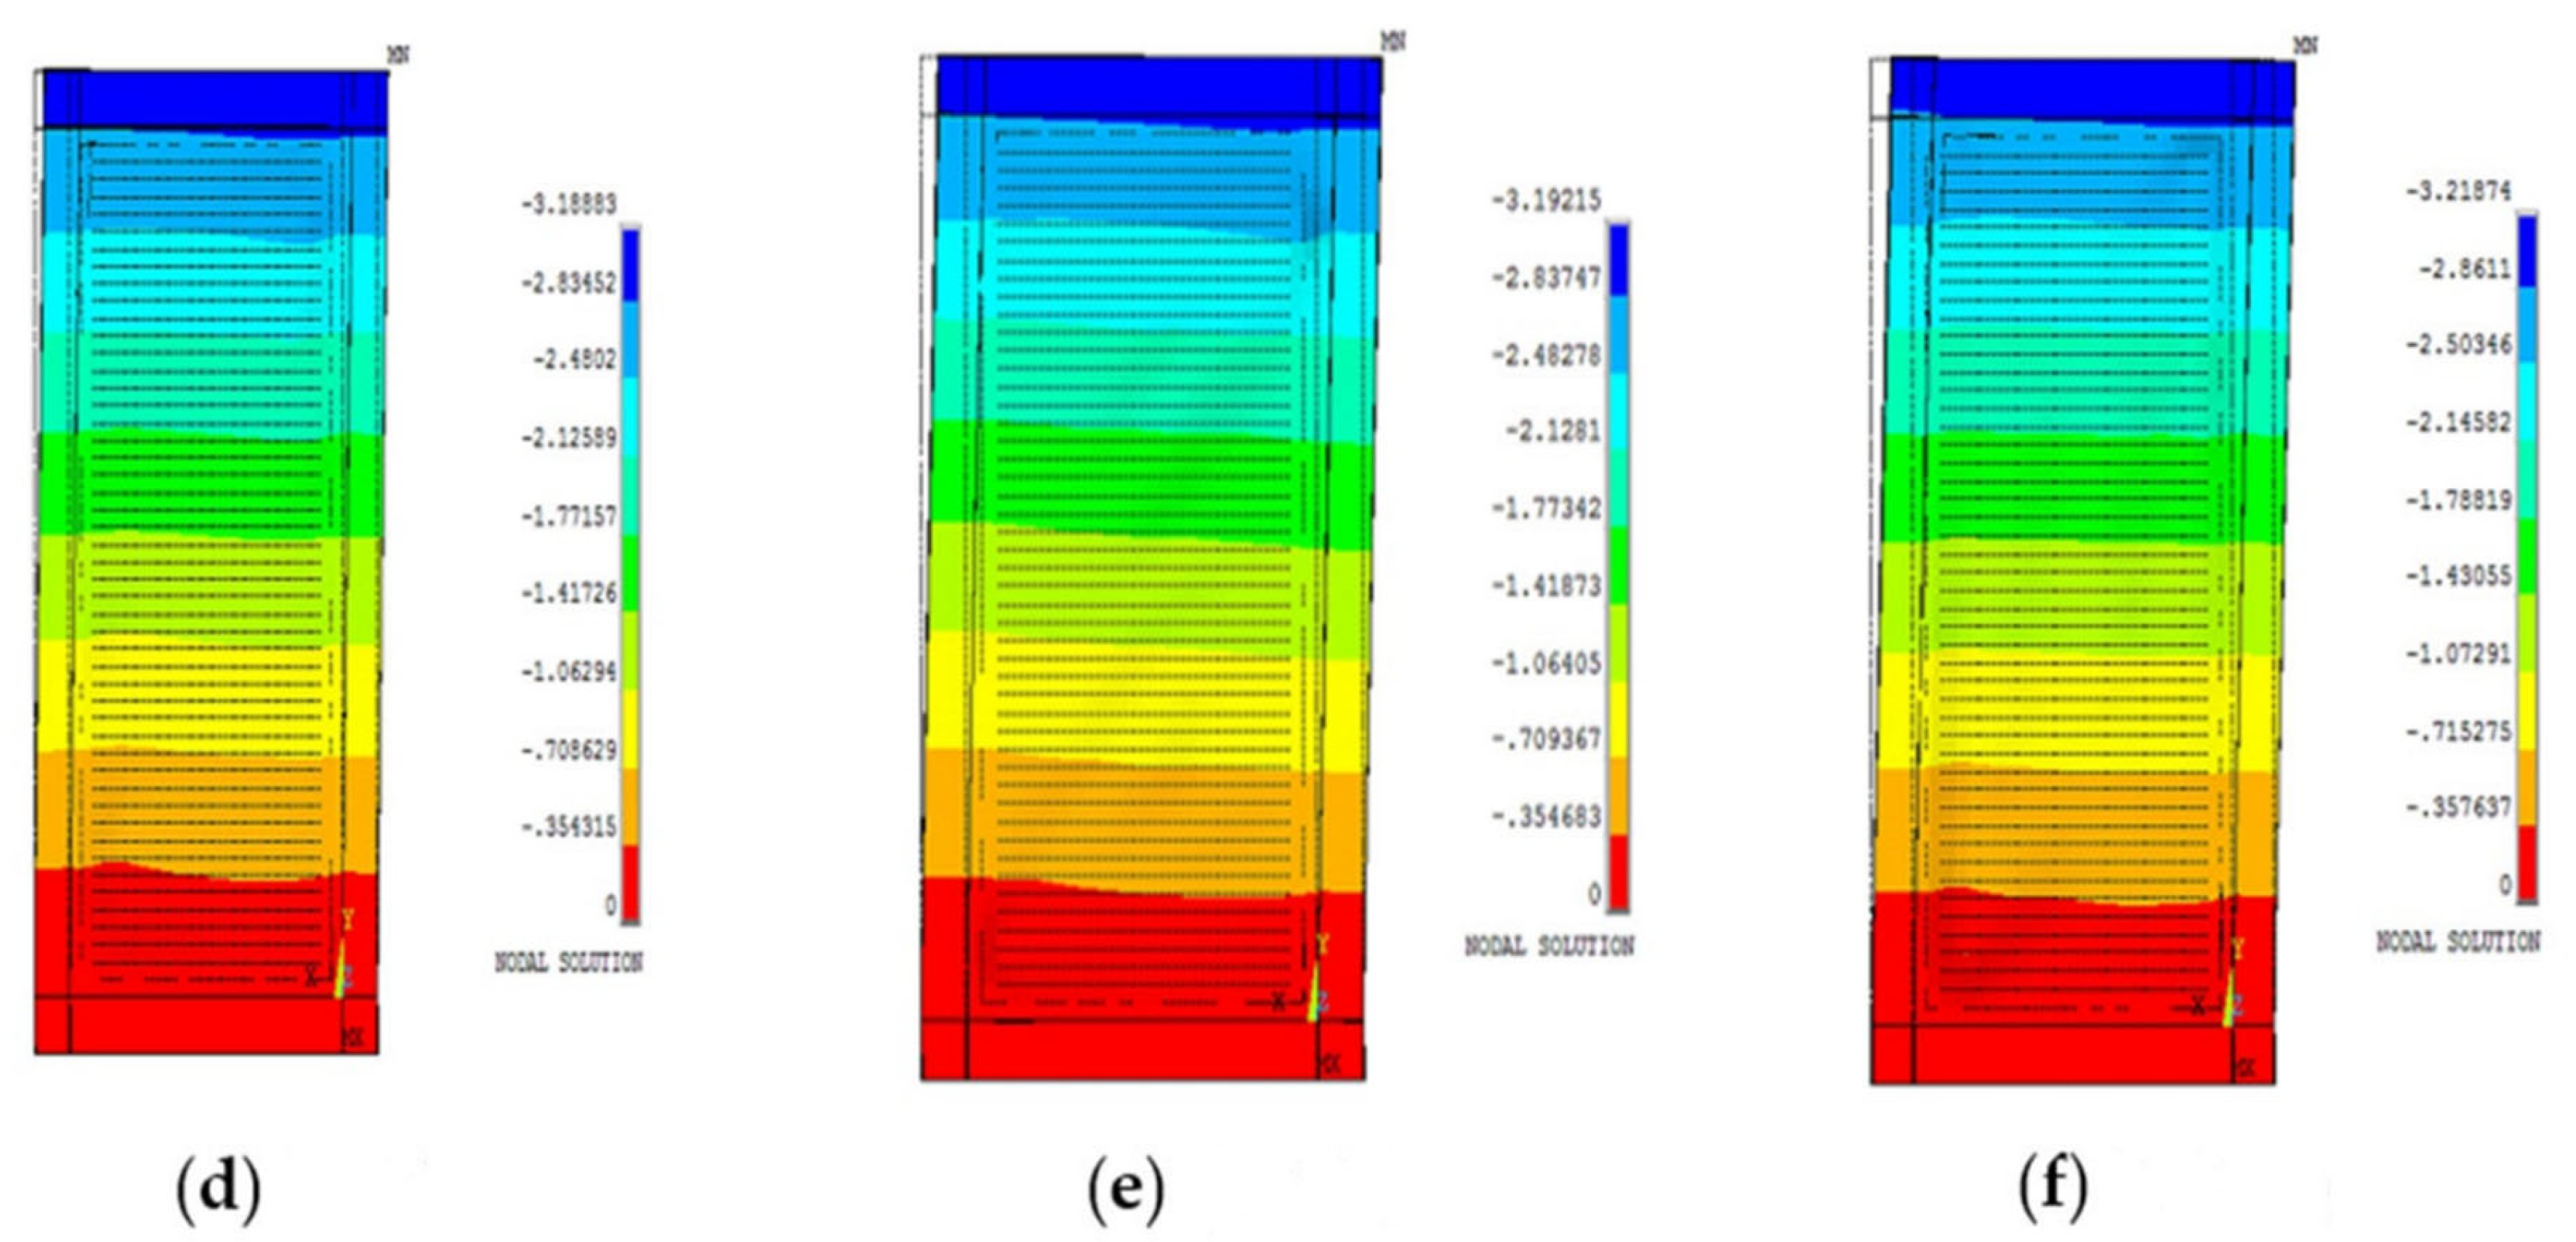
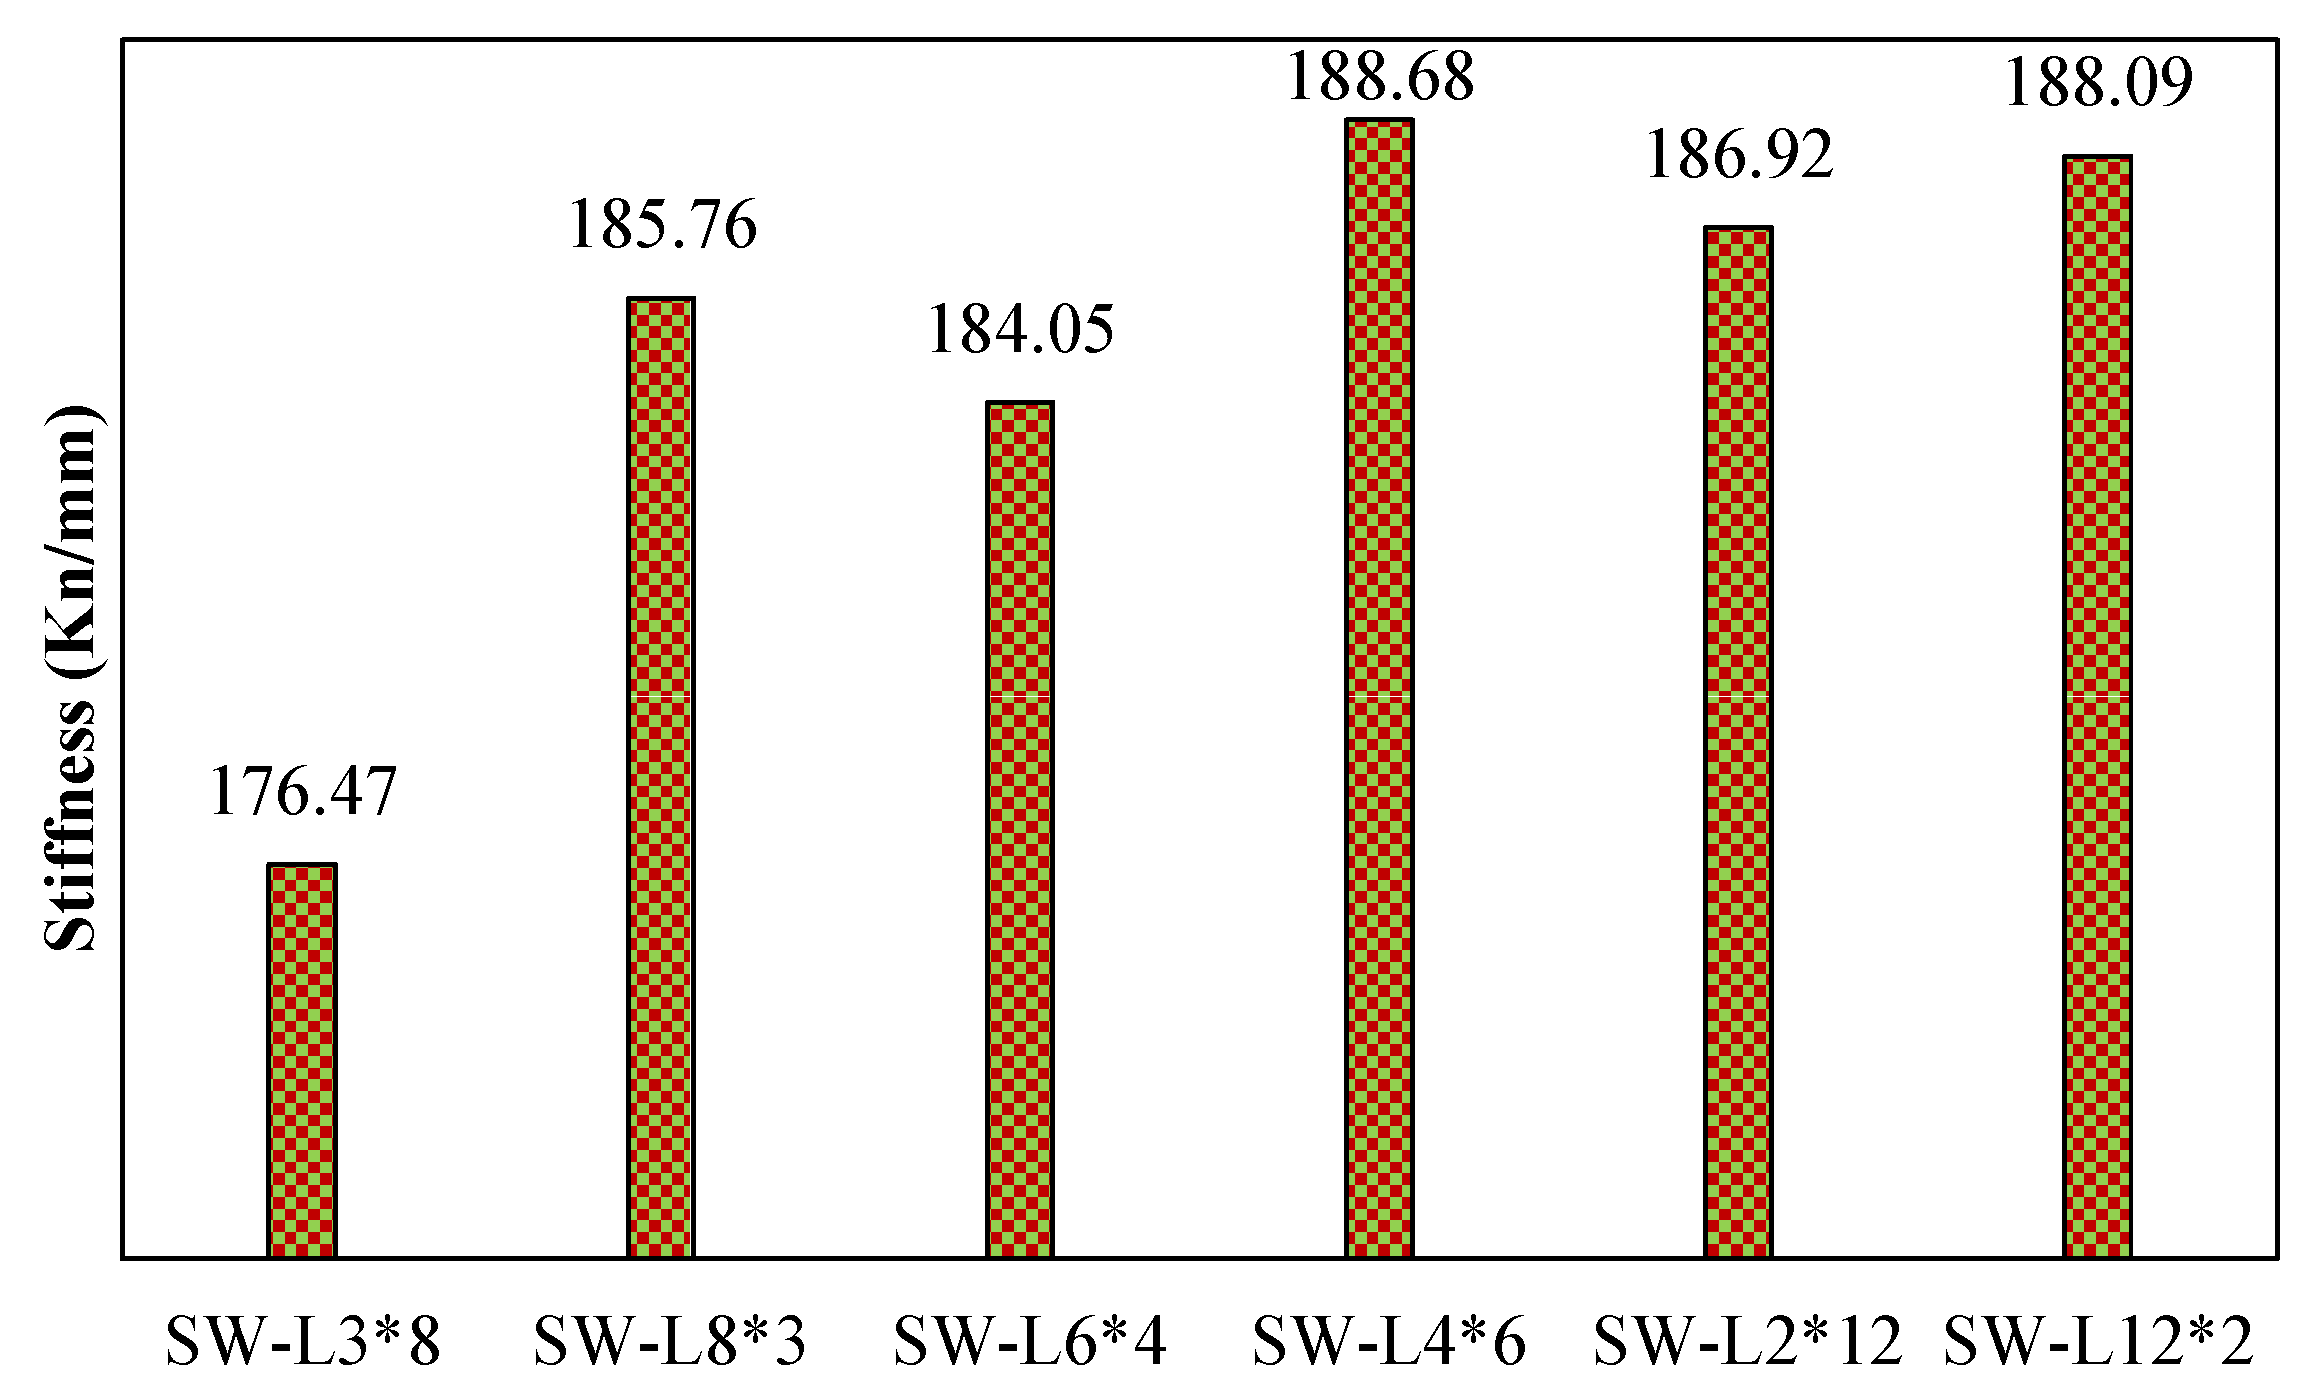
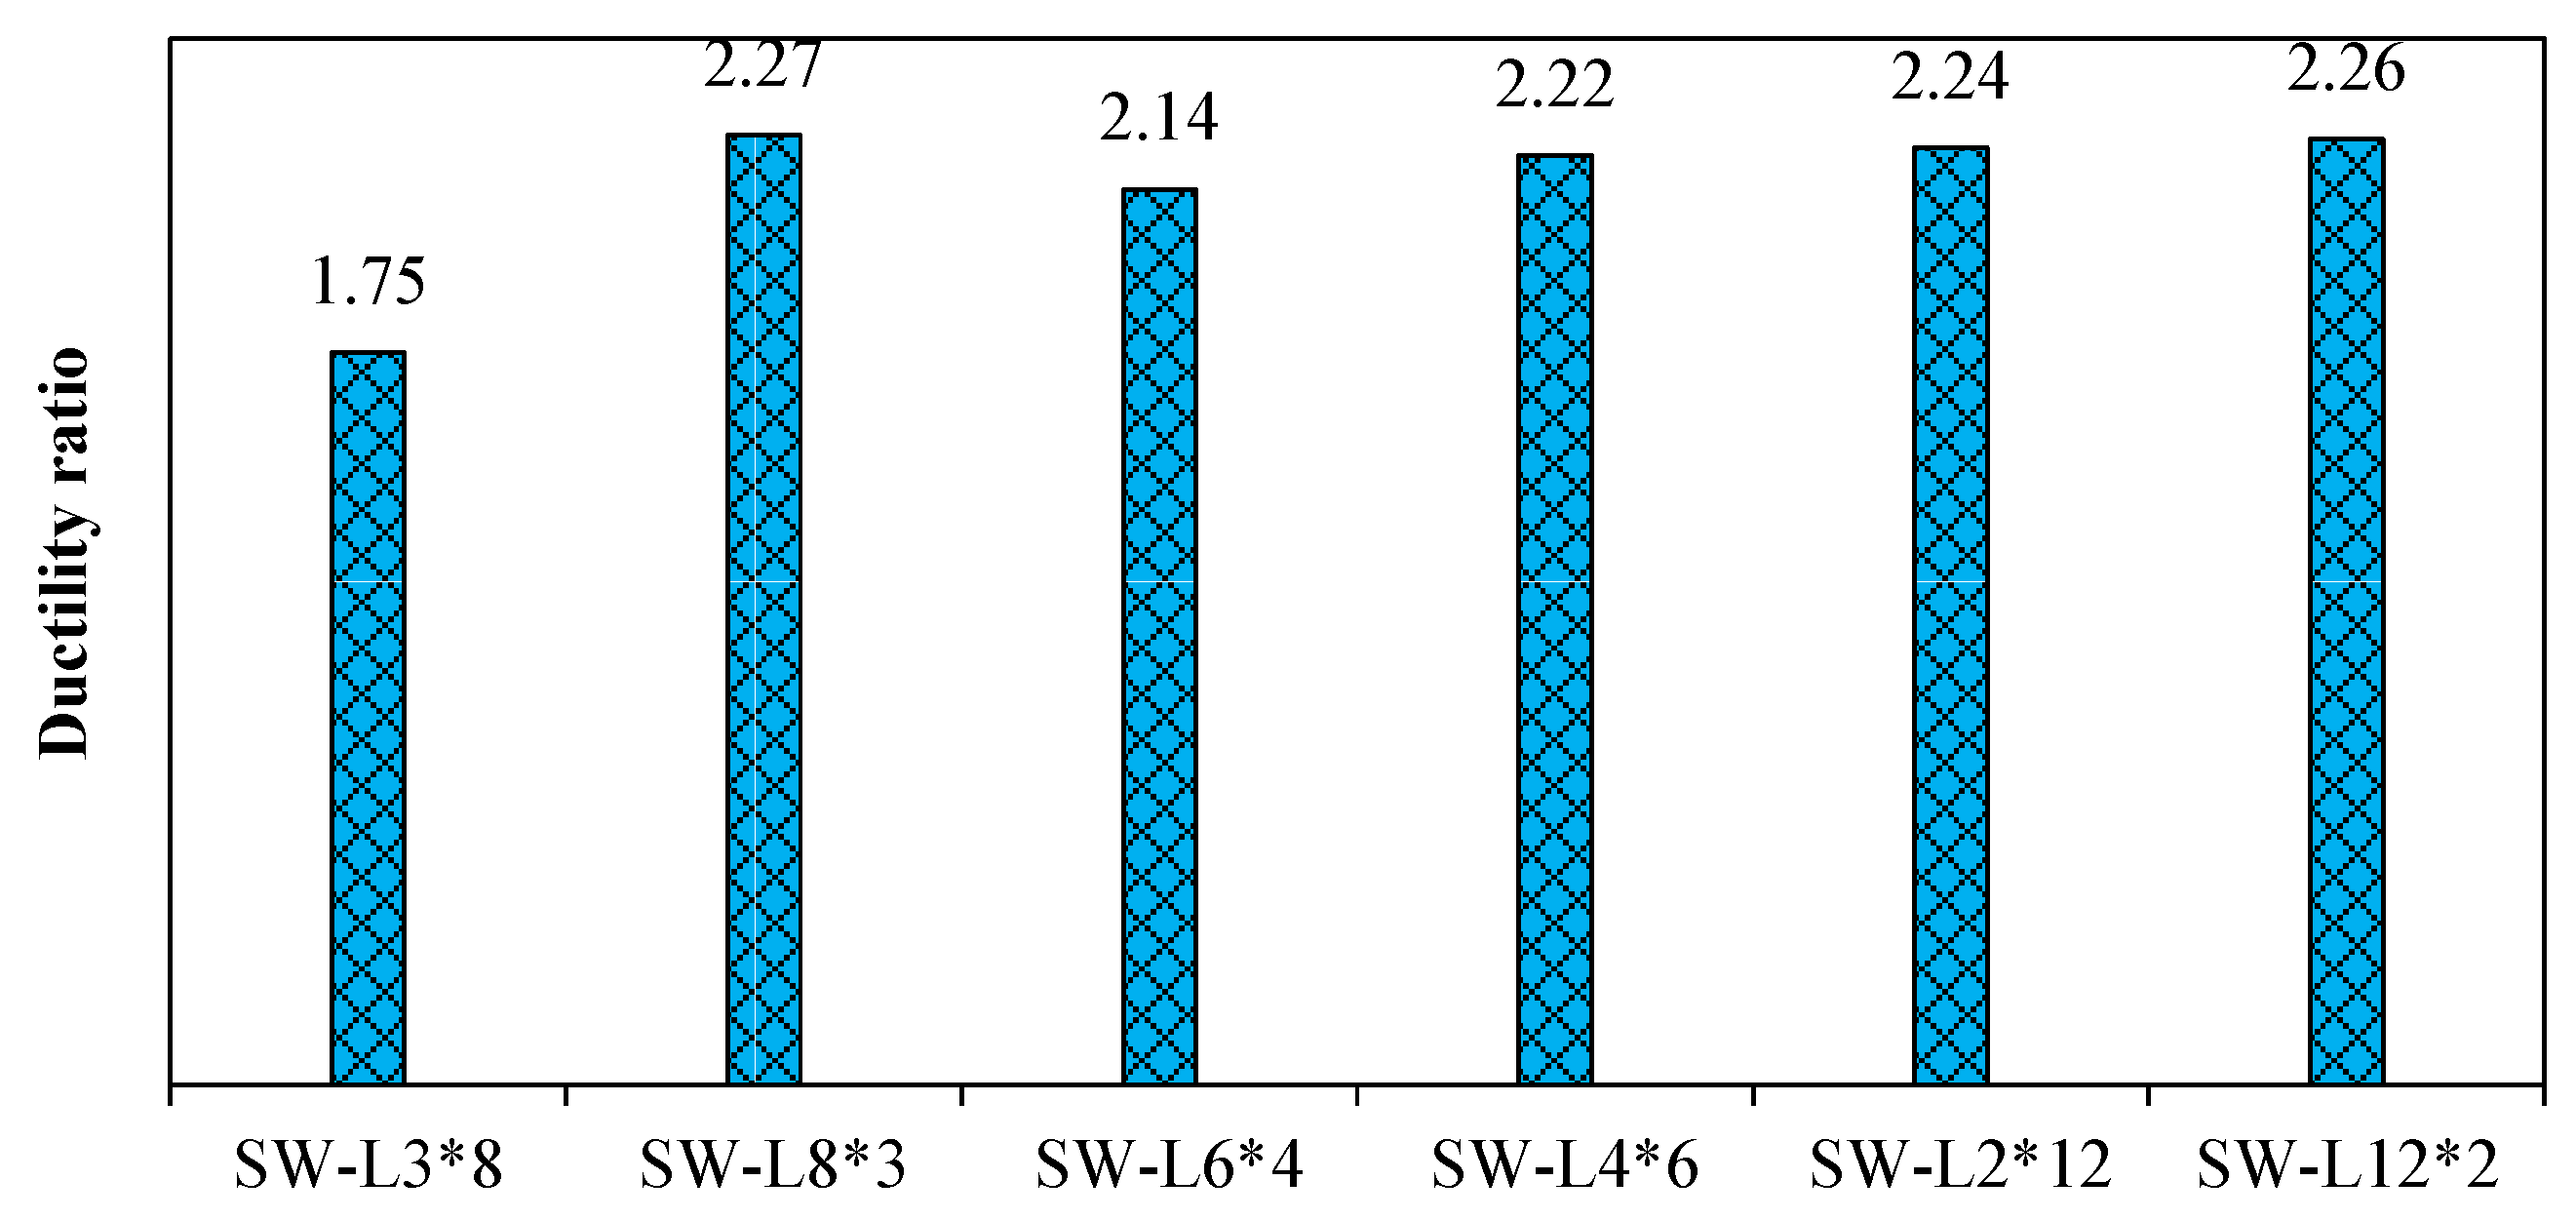
4.1.4. The Fourth Group Models (Influence of Shear Stud Layout)
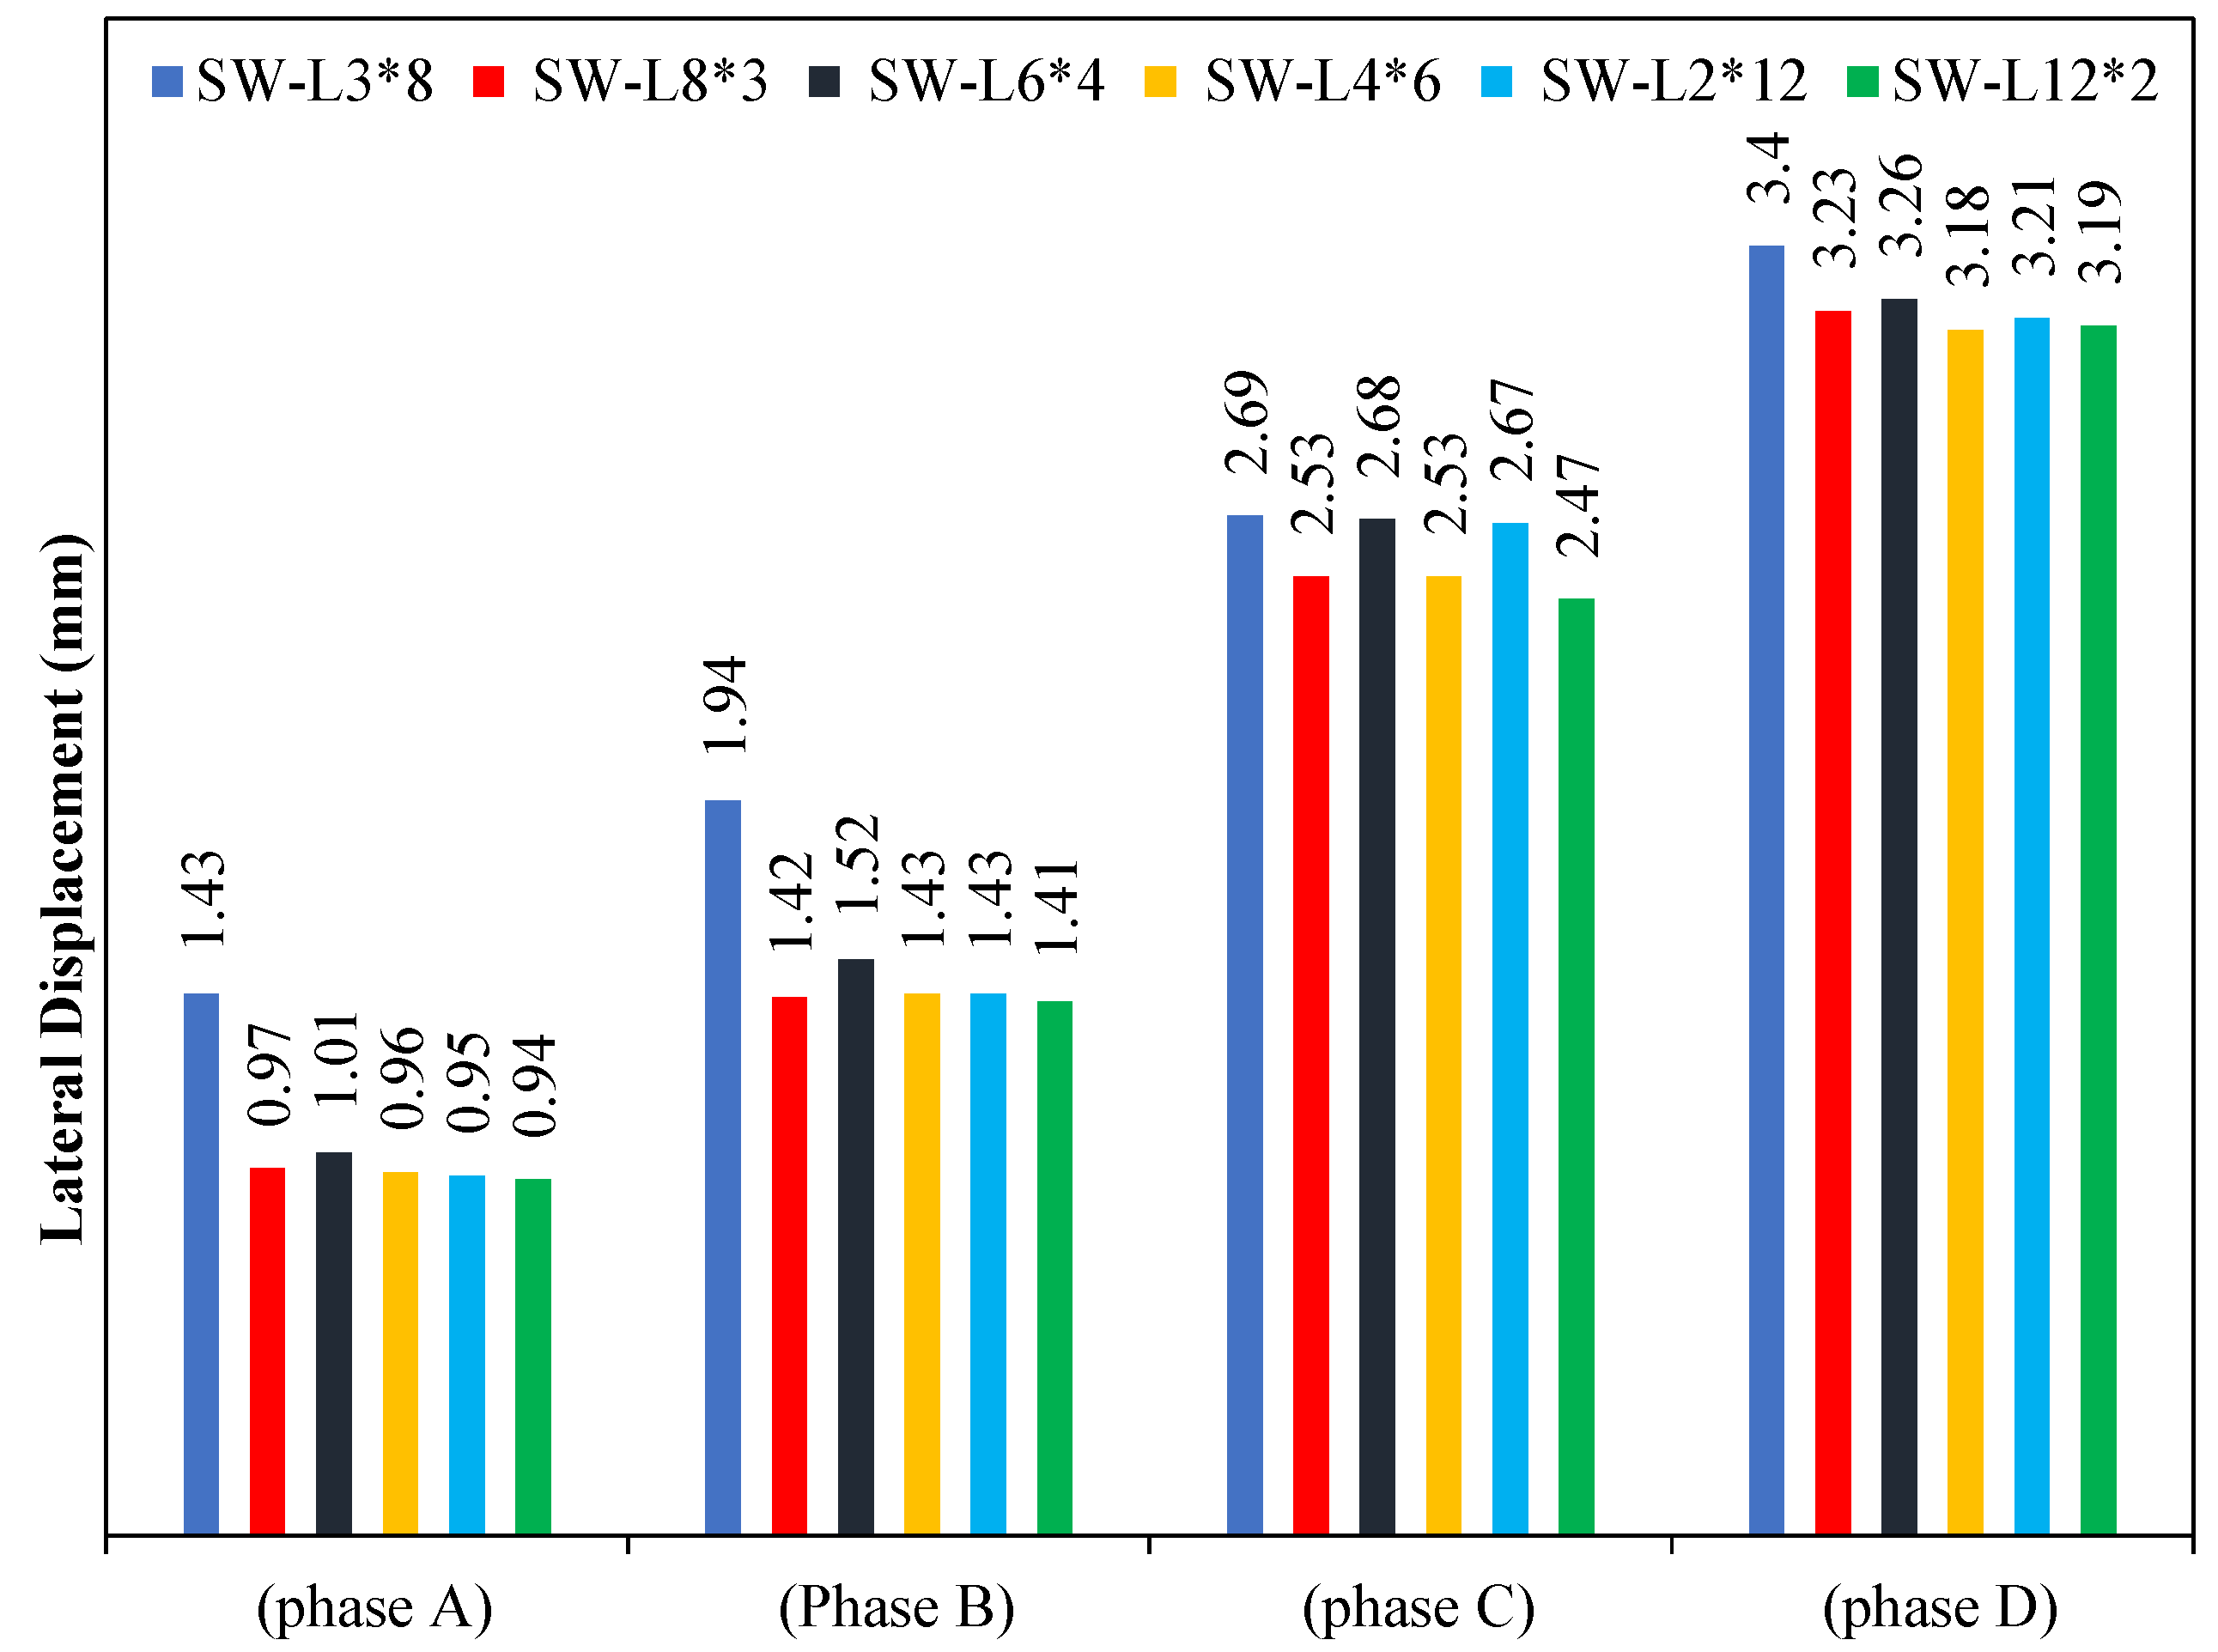
- Lateral displacement
- Phase A:
- Phase B:
- Phase C:
- Phase D:
- 2.
- Stiffness
- 3.
- Ductility
- 4.
- Energy Absorption
5. Conclusions
- The ratio of reinforcement has a good effect on the behaviour of smart CSPSW because the increasing ratio of reinforcement leads to a gradual drop in the load-carrying capacity until it reaches the fracture load. The ratio of reinforcement walls should be limited by a specific value, max. 3.5%, because the behaviour of smart CSPSW remains the same beyond that ratio (so the best range for using the thickness of the concrete wall was 1–3.5%).
- The compressive strength of the concrete walls has a vital impact on the behaviour of smart CSPSW. Increasing compressive strength leads to an increase in the contribution of concrete in force transfer. Therefore, the influence of lateral load on the infill steel plate becomes low. Additionally, increasing compressive strength led to restricting the model and reducing the lateral offset. The compressive strength of concrete walls should be limited by a specific value (max. 55 MPa). This is because to obtain more resistance from the concrete walls, there should be a change in the grade of concrete from ordinary to high strength, and this becomes costlier.
- The yield stress of steel plate should be limited by a specific value (max. 350 MPa); this is because to obtain more resistance from steel plate, we should change the type of steel plate, and this becomes costlier. Additionally, the behaviour of smart CSPSW remains the same beyond that value of yield stress. The change in the layout of the shear stud affected the type of failure in the model. The layout of the shear stud should be a concentrated distribution of the vertical to the horizontal direction. Since large distances will cause widespread buckling of the steel plate in free subpanels between shear studs and would result in no improvement, a layout of the shear studs was selected of (12 × 2, 6 × 4) (horizontal × vertical).
Author Contributions
Funding
Institutional Review Board Statement
Informed Consent Statement
Data Availability Statement
Acknowledgments
Conflicts of Interest
References
- Ji, X.; Cheng, Y.; Leong, T.; Cui, Y. Seismic Behavior and Strength Capacity of Steel Coupling Beam-to-SRC Wall Joints. Eng. Struct. 2019, 201, 109820. [Google Scholar] [CrossRef]
- González, J.G.; Hernández-Ortega, J.J.; Jiménez-Ballesta, A.E.; Pedreño, R.Z. Analysis of Tube-to-Tubesheet Welding in Carbon Steel Heat Exchangers of a Double Plate Header Box. Materials 2022, 15, 261. [Google Scholar] [CrossRef] [PubMed]
- Zhao, J.; Cai, G.; Si Larbi, A.; Zhang, Y.; Dun, H.; Degée, H.; Vandoren, B. Hysteretic Behaviour of Steel Fibre RC Coupled Shear Walls under Cyclic Loads: Experimental Study and Modelling. Eng. Struct. 2018, 156, 92–104. [Google Scholar] [CrossRef]
- Wang, B.; Jiang, H.; Lu, X. Experimental and Numerical Investigations on Seismic Behavior of Steel Truss Reinforced Concrete Core Walls. Eng. Struct. 2017, 140, 164–176. [Google Scholar] [CrossRef]
- Jiang, D.; Xiao, C.; Chen, T.; Zhang, Y. Experimental Study of High-Strength Concrete-Steel Plate Composite Shear Walls. Appl. Sci. 2019, 9, 2820. [Google Scholar] [CrossRef] [Green Version]
- Hassan, A.; Arif, M.; Shariq, M.; Alomayri, T. Experimental Test and Finite Element Modelling Prediction on Geopolymer Concrete Beams Subject to Flexural Loading. Innov. Infrastruct. Solut. 2022, 7, 13. [Google Scholar] [CrossRef]
- Wang, K.; Zhang, W.; Chen, Y.; Ding, Y. Seismic Analysis and Design of Composite Shear Wall with Stiffened Steel Plate and Infilled Concrete. Materials 2022, 15, 182. [Google Scholar] [CrossRef]
- Dan, D.; Fabian, A.; Stoian, V. Theoretical and Experimental Study on Composite Steelconcrete Shear Walls with Vertical Steel Encased Profiles. J. Constr. Steel Res. 2011, 67, 800–813. [Google Scholar] [CrossRef]
- Lu, X.; Zhang, Y.; Zhang, H.; Zhang, H.; Xiao, R. Experimental Study on Seismic Performance of Steel Fiber Reinforced High Strength Concrete Composite Shear Walls with Different Steel Fiber Volume Fractions. Eng. Struct. 2018, 171, 247–259. [Google Scholar] [CrossRef]
- Ramesh, S. Behavior and Design of Earthquake-Resistant Dual-Plate Composite Shear Wall Systems; Purdue University: West Lafayette, IN, USA, 2013. [Google Scholar]
- Bruneau, M.; Alzeni, Y.; Fouché, P. Seismic Behavior of Concrete-Filled Steel Sandwich Walls and Concrete-Filled Steel Tube Columns. In Proceedings of the Steel Innovations Conference 2013, Christchurch, New Zealand, 21–22 February 2013. [Google Scholar]
- Yan, J.B.; Yan, Y.Y.; Wang, T. Cyclic Tests on Novel Steel-Concrete-Steel Sandwich Shear Walls with Boundary CFST Columns. J. Constr. Steel Res. 2020, 164, 105760. [Google Scholar] [CrossRef]
- Liu, Y.; Zhou, Z.; Cao, W.; Wei, L. Study on Seismic Performance of the Masonry Wall with Lightweight Concrete Filled Steel Tube Core Column and Thermal-Insulation Sandwich. J. Earthq. Eng. Eng. Vib. 2016, 15, 223–230. [Google Scholar] [CrossRef]
- ASCE/SEI 7-2022; Minimum Design Loads for Buildings and Other Structures. American National Standards Institute: New York, NY, USA, 2022.
- AISC American Institute of Steel Construction. Seismic Provisions for Structural Steel Buildings; American Institute of Steel Construction: Chicago, IL, USA, 2010. [Google Scholar]
- Nie, X.; Wang, J.J.; Tao, M.X.; Fan, J.S.; Bu, F.M. Experimental Study of Flexural Critical Reinforced Concrete Filled Composite Plate Shear Walls. Eng. Struct. 2019, 197, 109439. [Google Scholar] [CrossRef]
- Othuman Mydin, M.A.; Wang, Y.C. Structural Performance of Lightweight Steel-Foamed Concretesteel Composite Walling System under Compression. Thin-Walled Struct. 2011, 49, 66–76. [Google Scholar] [CrossRef]
- Wright, H. Axial and Bending Behavior of Composite Walls. J. Struct. Eng. 1998, 124, 758–764. [Google Scholar] [CrossRef]
- Wang, M.Z.; Guo, Y.L.; Zhu, J.S.; Yang, X. Flexural-Torsional Buckling and Design Recommendations of Axially Loaded Concrete-Infilled Double Steel Corrugated-Plate Walls with T-Section. Eng. Struct. 2020, 208, 110345. [Google Scholar] [CrossRef]
- Zhang, X.; Qin, Y.; Chen, Z. Experimental Seismic Behavior of Innovative Composite Shear Walls. J. Constr. Steel Res. 2016, 116, 218–232. [Google Scholar] [CrossRef]
- Zhang, W.; Wang, K.; Chen, Y.; Ding, Y. Experimental Study on the Seismic Behaviour of Composite Shear Walls with Stiffened Steel Plates and Infilled Concrete. Thin-Walled Struct. 2019, 144, 106279. [Google Scholar] [CrossRef]
- Najem, H.M. Influence of Concrete Strength on the Cycle Performance of Composite Steel Plate Shear Walls. Diyala J. Eng. Sci. 2018, 11, 1–7. [Google Scholar] [CrossRef]
- Najem, H.M. The Effect of Infill Steel Plate Thickness on the Cycle Behavior of Steel Plate Shear Walls. Diyala J. Eng. Sci 2018, 11, 1–6. [Google Scholar] [CrossRef]
- Nguyen, N.H.; Whittaker, A.S. Numerical Modelling of Steel-Plate Concrete Composite Shear Walls. Eng. Struct. 2017, 150, 1–11. [Google Scholar] [CrossRef]
- Epackachi, S.; Whittaker, A.S.; Varma, A.H.; Kurt, E.G. Finite Element Modeling of Steel-Plate Concrete Composite Wall Piers. Eng. Struct. 2015, 100, 369–384. [Google Scholar] [CrossRef]
- Rafiei, S.; Hossain, K.M.A.; Lachemi, M.; Behdinan, K.; Anwar, M.S. Finite Element Modeling of Double Skin Profiled Composite Shear Wall System under In-Plane Loadings. Eng. Struct. 2013, 56, 46–57. [Google Scholar] [CrossRef]
- Wei, F.F.; Zheng, Z.J.; Yu, J.; Wang, Y.Q. Computational Method for Axial Compression Capacity of Double Steel-Concrete Composite Shear Walls with Consideration of Buckling. Gongcheng Lixue Eng. Mech. 2019, 36, 154–164. [Google Scholar] [CrossRef]
- Guo, L.; Wang, Y.; Zhang, S. Experimental Study of Rectangular Multi-Partition Steel-Concrete Composite Shear Walls. Thin-Walled Struct. 2018, 130, 577–592. [Google Scholar] [CrossRef]
- Wang, M.Z.; Guo, Y.L.; Zhu, J.S.; Yang, X. Flexural Buckling of Axially Loaded Concrete-Infilled Double Steel Corrugated-Plate Walls with T-Section. J. Constr. Steel Res. 2020, 166, 105940. [Google Scholar] [CrossRef]
- Shafaei, S.; Ayazi, A.; Farahbod, F. The Effect of Concrete Panel Thickness upon Composite Steel Plate Shear Walls. J. Constr. Steel Res. 2016, 117, 81–90. [Google Scholar] [CrossRef]
- Qin, Y.; Shu, G.P.; Zhou, G.G.; Han, J.H. Compressive Behavior of Double Skin Composite Wall with Different Plate Thicknesses. J. Constr. Steel Res. 2019, 157, 297–313. [Google Scholar] [CrossRef]
- Huang, Z.; Liew, J.Y.R. Structural Behaviour of Steel-Concrete-Steel Sandwich Composite Wall Subjected to Compression and End Moment. Thin-Walled Struct. 2016, 98, 592–606. [Google Scholar] [CrossRef]
- Li, X.; Li, X. Steel Plates and Concrete Filled Composite Shear Walls Related Nuclear Structural Engineering: Experimental Study for out-of-Plane Cyclic Loading. Nucl. Eng. Des. 2017, 315, 144–154. [Google Scholar] [CrossRef]
- Epackachi, S.; Nguyen, N.H.; Kurt, E.G.; Whittaker, A.S.; Varma, A.H. In-Plane Seismic Behavior of Rectangular Steel-Plate Composite Wall Piers. J. Struct. Eng. 2015, 141, 04014176. [Google Scholar] [CrossRef]
- JGJ/T 380; Technical Specification for Steel Plate Shear Walls. Ministry of Housing and Urban-Rural Development: Beijing, China, 2015.
- ACI 318M-11; Building Code Requirements for Structural Concrete and Commentary. ACI Committee 318: Farmington Hills, MI, USA, 2011.
- ANSI/AISC N690-18; Specification for Safety-Related Steel Structures for Nuclear Facilities. American Institute of Steel Construction: Chicago, IL, USA, 2018.
- Epackachi, S.; Nguyen, N.H.; Kurt, E.G.; Whittaker, A.S.; Varma, A.H. An Experimental Study of the In-Plane Response of Steel-Concrete Composite Walls. In Proceedings of the 22nd International Conference on Structural Mechanics in Reactor Technology (SMiRT-22), San Francisco, CA, USA, 18 August 2013. [Google Scholar]
- Khatir, S.; Tiachacht, S.; le Thanh, C.; Ghandourah, E.; Mirjalili, S.; Abdel Wahab, M. An Improved Artificial Neural Network Using Arithmetic Optimization Algorithm for Damage Assessment in FGM Composite Plates. Compos. Struct. 2021, 273, 114287. [Google Scholar] [CrossRef]
- Saadatmorad, M.; Jafari-Talookolaei, R.A.; Pashaei, M.H.; Khatir, S. Damage Detection on Rectangular Laminated Composite Plates Using Wavelet Based Convolutional Neural Network Technique. Compos. Struct. 2021, 278, 114656. [Google Scholar] [CrossRef]
- Khatir, S.; Tiachacht, S.; Thanh, C.-L.; Tran-Ngoc, H.; Mirjalili, S.; Abdel Wahab, M. A Robust FRF Damage Indicator Combined with Optimization Techniques for Damage Assessment in Complex Truss Structures. Case Stud. Constr. Mater. 2022, 17, e01197. [Google Scholar] [CrossRef]
- Rahai, A.; Hatami, F. Evaluation of Composite Shear Wall Behavior under Cyclic Loadings. J. Constr. Steel Res. 2009, 65, 1528–1537. [Google Scholar] [CrossRef]
- Zhao, Q.; Astaneh-Asl, A. Cyclic Behavior of Traditional and Innovative Composite Shear Walls. J. Struct. Eng. 2004, 130, 271–284. [Google Scholar] [CrossRef] [Green Version]


| Group No. | Group Name | SW | Gap | Thickness of Steel | Thickness of Concrete | Distance between Shear Stud | Ratio of Reinforcement | Compressive Strength | Yield Strength | The Layout of Shear Stud (H × V) |
|---|---|---|---|---|---|---|---|---|---|---|
| 1 | Ratio of reinforcement | SW-RR1% (R) | 40 | 3 | 50 | 200 | 1% | 45 | 240 | 3 × 8 |
| SW-RR1.5% | 40 | 3 | 50 | 200 | 1.5% | 45 | 240 | 3 × 8 | ||
| SW-RR2.5% | 40 | 3 | 50 | 200 | 2.5% | 45 | 240 | 3 × 8 | ||
| SW-RR3.5% | 40 | 3 | 50 | 200 | 3.5% | 45 | 240 | 3 × 8 | ||
| 2 | Compressive strength of concrete wall | SW-CS45MPa (R) | 40 | 3 | 50 | 200 | 1% | 45 | 240 | 3 × 8 |
| SW-CS25MPa | 40 | 3 | 50 | 200 | 1% | 25 | 240 | 3 × 8 | ||
| SW-CS28MPa | 40 | 3 | 50 | 200 | 1% | 28 | 240 | 3 × 8 | ||
| SW-CS50MPa | 40 | 3 | 50 | 200 | 1% | 50 | 240 | 3 × 8 | ||
| SW-CS55MPa | 40 | 3 | 50 | 200 | 1% | 55 | 240 | 3 × 8 | ||
| 3 | Yield stress of infill steel plate | SW-R | 40 | 3 | 50 | 200 | 1% | 45 | 240 | 3 × 8 |
| SW-YS150MPa | 40 | 3 | 50 | 200 | 1% | 45 | 150 | 3 × 8 | ||
| SW-YS200MPa | 40 | 3 | 50 | 200 | 1% | 45 | 200 | 3 × 8 | ||
| SW-YS350MPa | 40 | 3 | 50 | 200 | 1% | 45 | 350 | 3 × 8 | ||
| SW-YS380MPa | 40 | 3 | 50 | 200 | 1% | 45 | 380 | 3 × 8 | ||
| 4 | Layout of shear stud | SW-R | 40 | 3 | 50 | 200 | 1% | 45 | 240 | 3 × 8 |
| SW-L8*3 | 40 | 3 | 50 | 200 | 1% | 45 | 240 | 3 × 8 | ||
| SW-L6*4 | 40 | 3 | 50 | 200 | 1% | 45 | 240 | 6 × 4 | ||
| SW-L4*6 | 40 | 3 | 50 | 200 | 1% | 45 | 240 | 4 × 6 | ||
| SW-L2*12 | 40 | 3 | 50 | 200 | 1% | 45 | 240 | 2 × 12 |
| Time (Second) | Max. Load (KN) | Loading Shape | Frequencies (Hz) | |
|---|---|---|---|---|
| Start | End | |||
| 0.0 | 71 | 0.0 | Cyclic | 0 |
| 72 | 180 | 300 | Cyclic | 1/60 |
| 181 | 360 | 500 | Cyclic | 1/60 |
| 361 | 540 | 600 | Cyclic | 1/60 |
Publisher’s Note: MDPI stays neutral with regard to jurisdictional claims in published maps and institutional affiliations. |
© 2022 by the authors. Licensee MDPI, Basel, Switzerland. This article is an open access article distributed under the terms and conditions of the Creative Commons Attribution (CC BY) license (https://creativecommons.org/licenses/by/4.0/).
Share and Cite
Najm, H.M.; Ibrahim, A.M.; Sabri, M.M.; Hassan, A.; Morkhade, S.; Mashaan, N.S.; Eldirderi, M.M.A.; Khedher, K.M. Modelling of Cyclic Load Behaviour of Smart Composite Steel-Concrete Shear Wall Using Finite Element Analysis. Buildings 2022, 12, 850. https://doi.org/10.3390/buildings12060850
Najm HM, Ibrahim AM, Sabri MM, Hassan A, Morkhade S, Mashaan NS, Eldirderi MMA, Khedher KM. Modelling of Cyclic Load Behaviour of Smart Composite Steel-Concrete Shear Wall Using Finite Element Analysis. Buildings. 2022; 12(6):850. https://doi.org/10.3390/buildings12060850
Chicago/Turabian StyleNajm, Hadee Mohammed, Amer M. Ibrahim, Mohanad Muayad Sabri, Amer Hassan, Samadhan Morkhade, Nuha S. Mashaan, Moutaz Mustafa A. Eldirderi, and Khaled Mohamed Khedher. 2022. "Modelling of Cyclic Load Behaviour of Smart Composite Steel-Concrete Shear Wall Using Finite Element Analysis" Buildings 12, no. 6: 850. https://doi.org/10.3390/buildings12060850
APA StyleNajm, H. M., Ibrahim, A. M., Sabri, M. M., Hassan, A., Morkhade, S., Mashaan, N. S., Eldirderi, M. M. A., & Khedher, K. M. (2022). Modelling of Cyclic Load Behaviour of Smart Composite Steel-Concrete Shear Wall Using Finite Element Analysis. Buildings, 12(6), 850. https://doi.org/10.3390/buildings12060850