Article

Axial Compression Prediction and GUI Design for CCFST Column Using Machine Learning and Shapley Additive Explanation

1
School of Architecture and Civil Engineering, Zhengzhou University of Industrial Technology, Zhengzhou 451100, China
2
School of Civil Engineering, Southeast University, Nanjing 211189, China
3
School of Civil Engineering, Xinyang College, Xinyang 464000, China
*
Author to whom correspondence should be addressed.
Buildings 2022, 12(5), 698; https://doi.org/10.3390/buildings12050698
Submission received: 26 March 2022 / Revised: 7 May 2022 / Accepted: 19 May 2022 / Published: 23 May 2022

Abstract

:
Axial bearing capacity is the key index of circular concrete-filled steel tubes (CCFST). A hybrid PSO-ANN model consisting of an artificial neural network (ANN) optimized with particle swarm algorithm (PSO) was proposed to reliably and accurately predict the axial bearing capacity in this paper. The predictive performance of the model was evaluated and compared with the EC4 code and original ANN based on a dataset of 227 experiments, and a graphical user interface (GUI) was developed to achieve the automatic output of the results. The influence of each design parameter on the bearing capacity was analyzed and quantified using the Shapley additive explanation (SHAP) method and sensitivity analysis. The results show that the prediction performance of the PSO-ANN model is superior, and can be recommended as a candidate for the prediction of axial compression bearing capacity of the CCFST column in terms of performance indices. Shapley additive explanation-based parameter analysis indicated that the diameter and thickness of the steel tube are the most two important parameters to the bearing capacity; in particular, the fluctuation of the diameter under the stochastic environment leads to the variation of the axial compression bearing capacity beyond the diameter itself.

1. Introduction

The circular concrete-filled steel tube (CCFST) is a structural element made of steel tubes and a core filled with concrete. In the CCFST column (Figure 1), the outer tube not only restrains the concrete core, but also prevents the local buckling inside the steel tube, thus having the advantages of high bearing capacity, good ductility, and good fire resistance [1,2,3,4,5]. In recent years, this composite member has been widely used in many load-bearing structures due to its high load-bearing capacity, low cost, and high labor efficiency [6,7,8,9]. With the development of material manufacturing technology and cost reduction, CCFST structures are increasingly using high-strength concrete and high-strength steel; therefore, CCFST is widely used in high-rise structures, fabricated buildings, and bridges [10,11].
The study of axial compression bearing capacity has been the focus of CCFST, and numerical simulation and experiments are the two main means for studying the bearing capacity performance of CCFST columns under axial compression [12,13,14,15,16,17,18,19]. Based on the results of these studies, several empirical formulas have been summarized and they can be seen in the standards ACI 318 (ACI 2014), Eurocode 4 (CEN 2004), and AISC 360 (AISC 2016). Most of these empirical formulas are obtained on the basis of regression analysis. They are easy to use and are used widely. However, for the same application scenario, different empirical formulas may give different results, which may cause confusion for decision makers. The laboratory test results can be considered a standard answer. However, it has to be said that the CCFST has a high bearing capacity, the study of its axial bearing capacity requires a lot of money and expensive experimental equipment, and the laboratory tests are labor-intensive [20,21]. Numerical simulations can theoretically model essentially any engineering problem, but they often require experimental testing to verify. Moreover, the modeling and computational process is a task that requires high-performance workstations and high computational skills, which cannot be ignored [22,23]. Therefore, there is an urgent need to develop an efficient prediction method that requires less computational effort, but can describe the highly nonlinear relationship between the ultimate strength of steel pipe concrete and the design parameters. This approach can intelligently output a uniform result in the same application scenario, and can partially replace the laboratory compression experiments to reduce the test cost and time.
In recent years, soft computing methods and intelligent algorithms have been developed and widely used in the field of civil engineering. Some machine learning models such as the ANN [24,25], GEP [26,27], and fuzzy logic [28] models have been applied to predict the ultimate load capacity of CCFST columns. Related studies have shown that even with limited experimental data, these intelligent algorithms can produce better results than traditional methods in many structural engineering problems. However, it is undeniable that while these models exhibit high sexual accuracy, they also have some limitations. For example, artificial neural networks have a slow learning speed and tend to fall into local minima [29], FL lacks effective learning capability, and GEP needs to be run several times. For these underlying models, further optimization to improve their performance may be needed. The combination of machine learning and optimization allows the model to efficiently explore the most appropriate computational parameters, thus improving the accuracy and computational efficiency of the prediction process. For example, Fei et al. [30] proposed a support vector regression model optimized with the sine cosine algorithm on 478 samples to predict the axial compressive strength of CCFST, and the accuracy of the proposed method was verified by comparing the performance with other widely used machine learning methods and design codes. Payam et al. [31] employed both IWO and ABC algorithms based on ANN to optimize the CFST columns, the results showed that IWO has a higher capability in optimizing the load-carrying capacity of CFST columns compared to the ABC algorithm.
In summary, the main application of machine learning techniques to the CCFST column is still in its infancy and exploration stage, and currently focuses on the prediction of mechanical properties of members. However, these studies seem to be inadequate. Especially for parametric design, inexperienced designers may need to determine an estimate of the axial compressive strength based on some predefined parameters. One practical way to realize this concept is to resort to artificial intelligence. The trained machine learning models can provide reference value as experienced team members. It is undeniable that machine learning models cannot completely replace laboratory compression experiments to estimate the axial compression strength as far as the current machine learning research results are concerned. However, if possible, based on the data from previous studies, using machine learning algorithms to accurately estimate the axial load capacity of CCFST columns with known design parameters would greatly reduce the test time and cost. To this end, this paper proposed a hybrid PSO-ANN model, with design parameters as input variables and axial bearing capacity as output variables, to achieve an accurate prediction of the axial bearing capacity. Moreover, an interactive graphical user interface (GUI) was developed tentatively to help the structural designers achieve the automatic output of the results. Additionally, Shapley additive explanation (SHAP)-based parametric analysis is performed to analyze the importance and contribution of each design parameter to the output, and a sensitivity analysis of the design parameters affecting the axial bearing capacity was carried out.

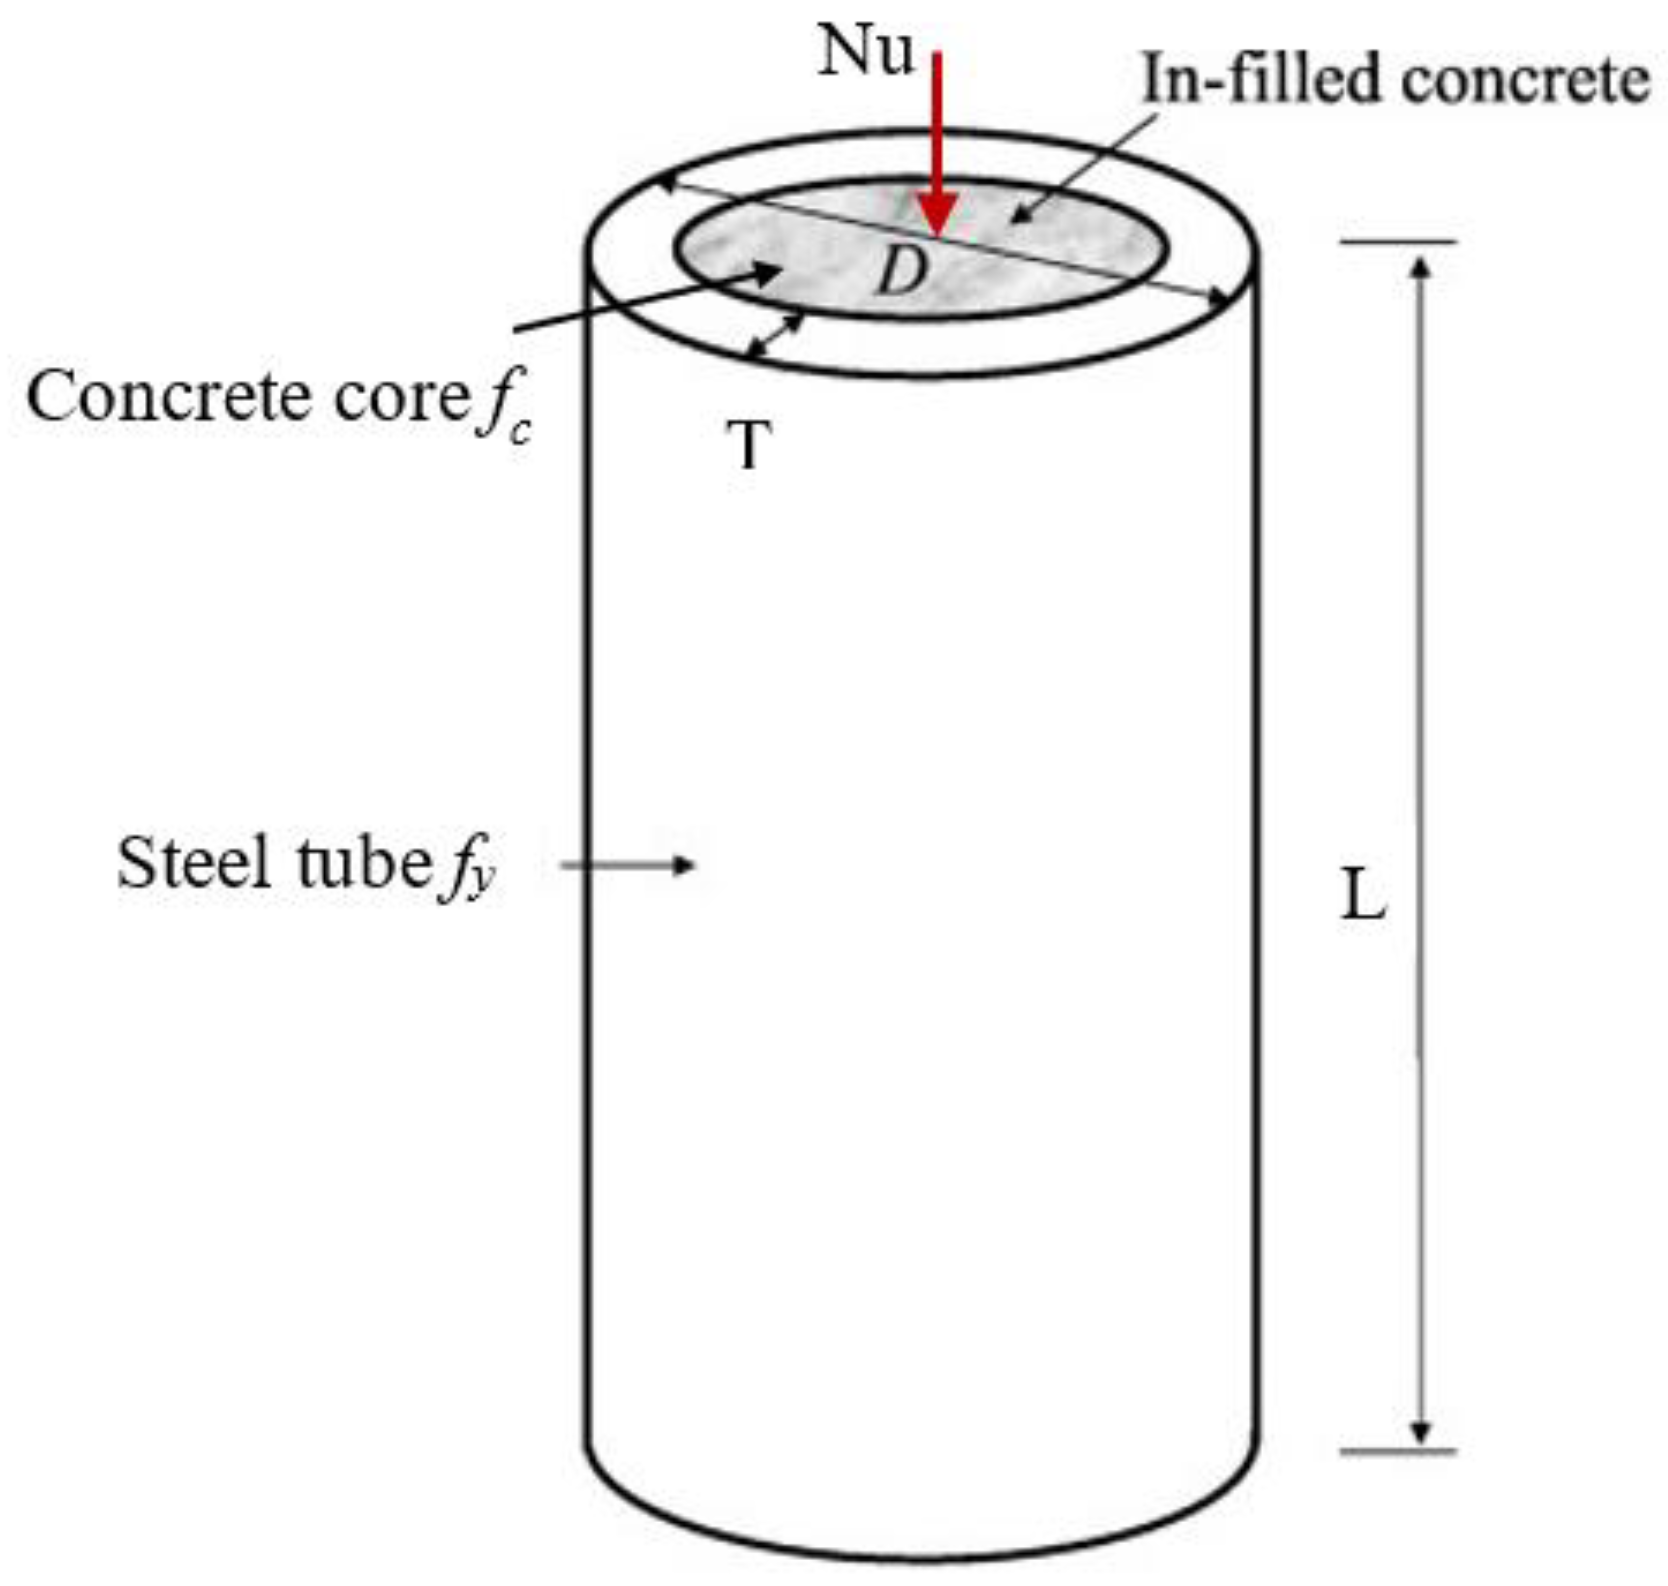
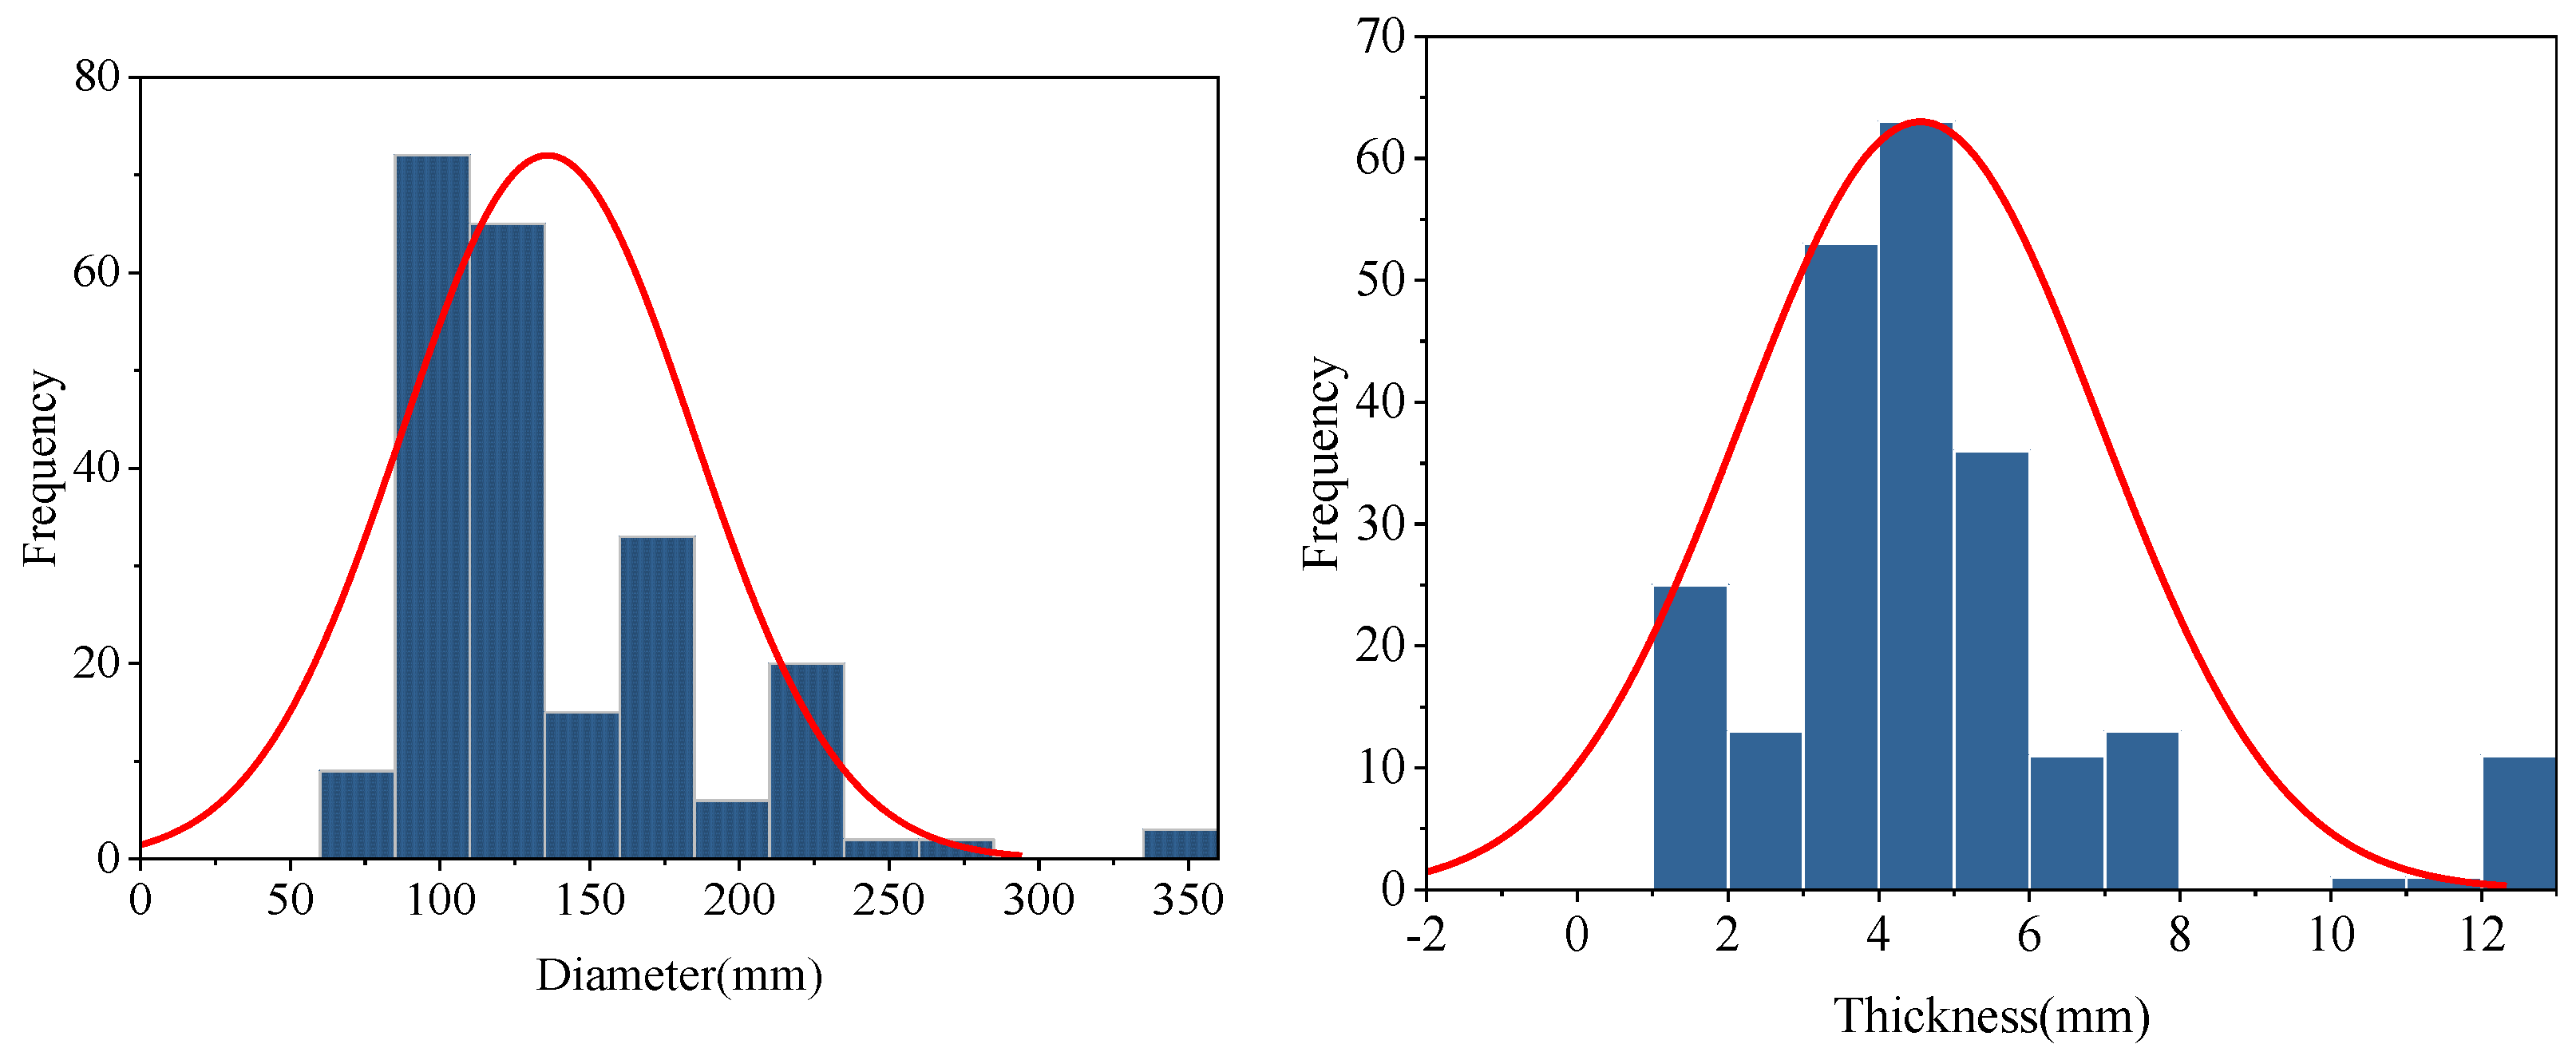
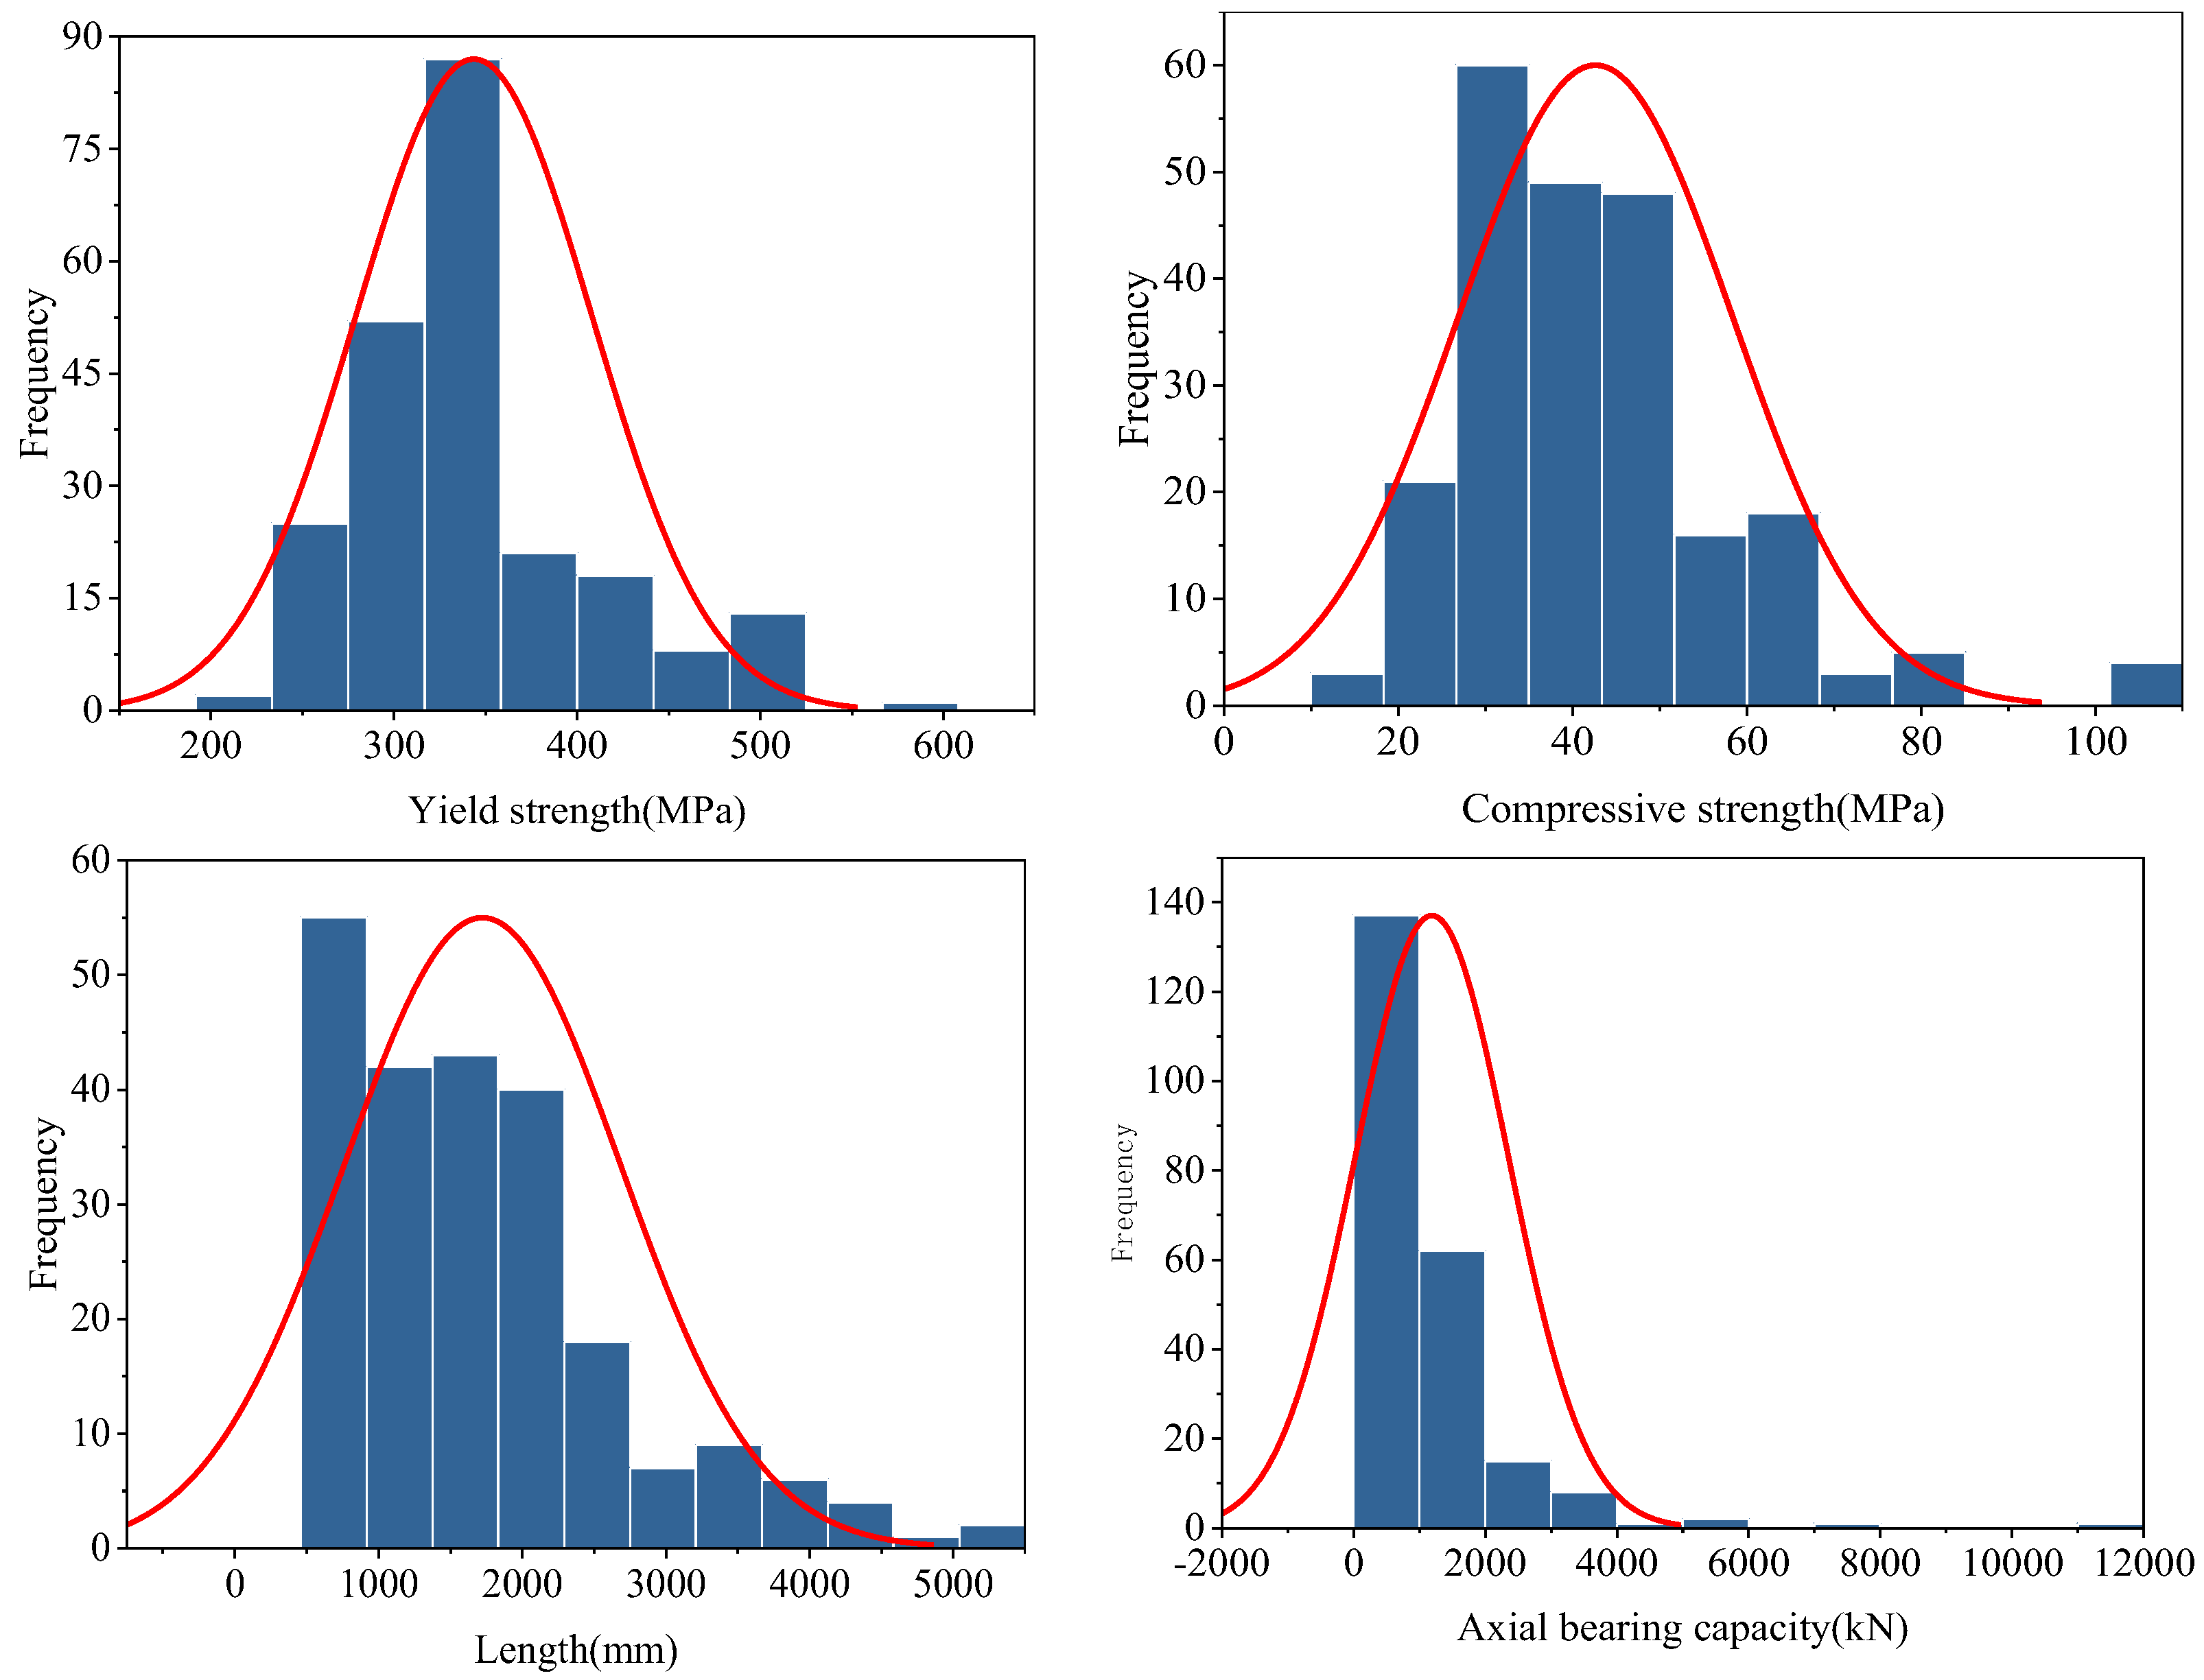
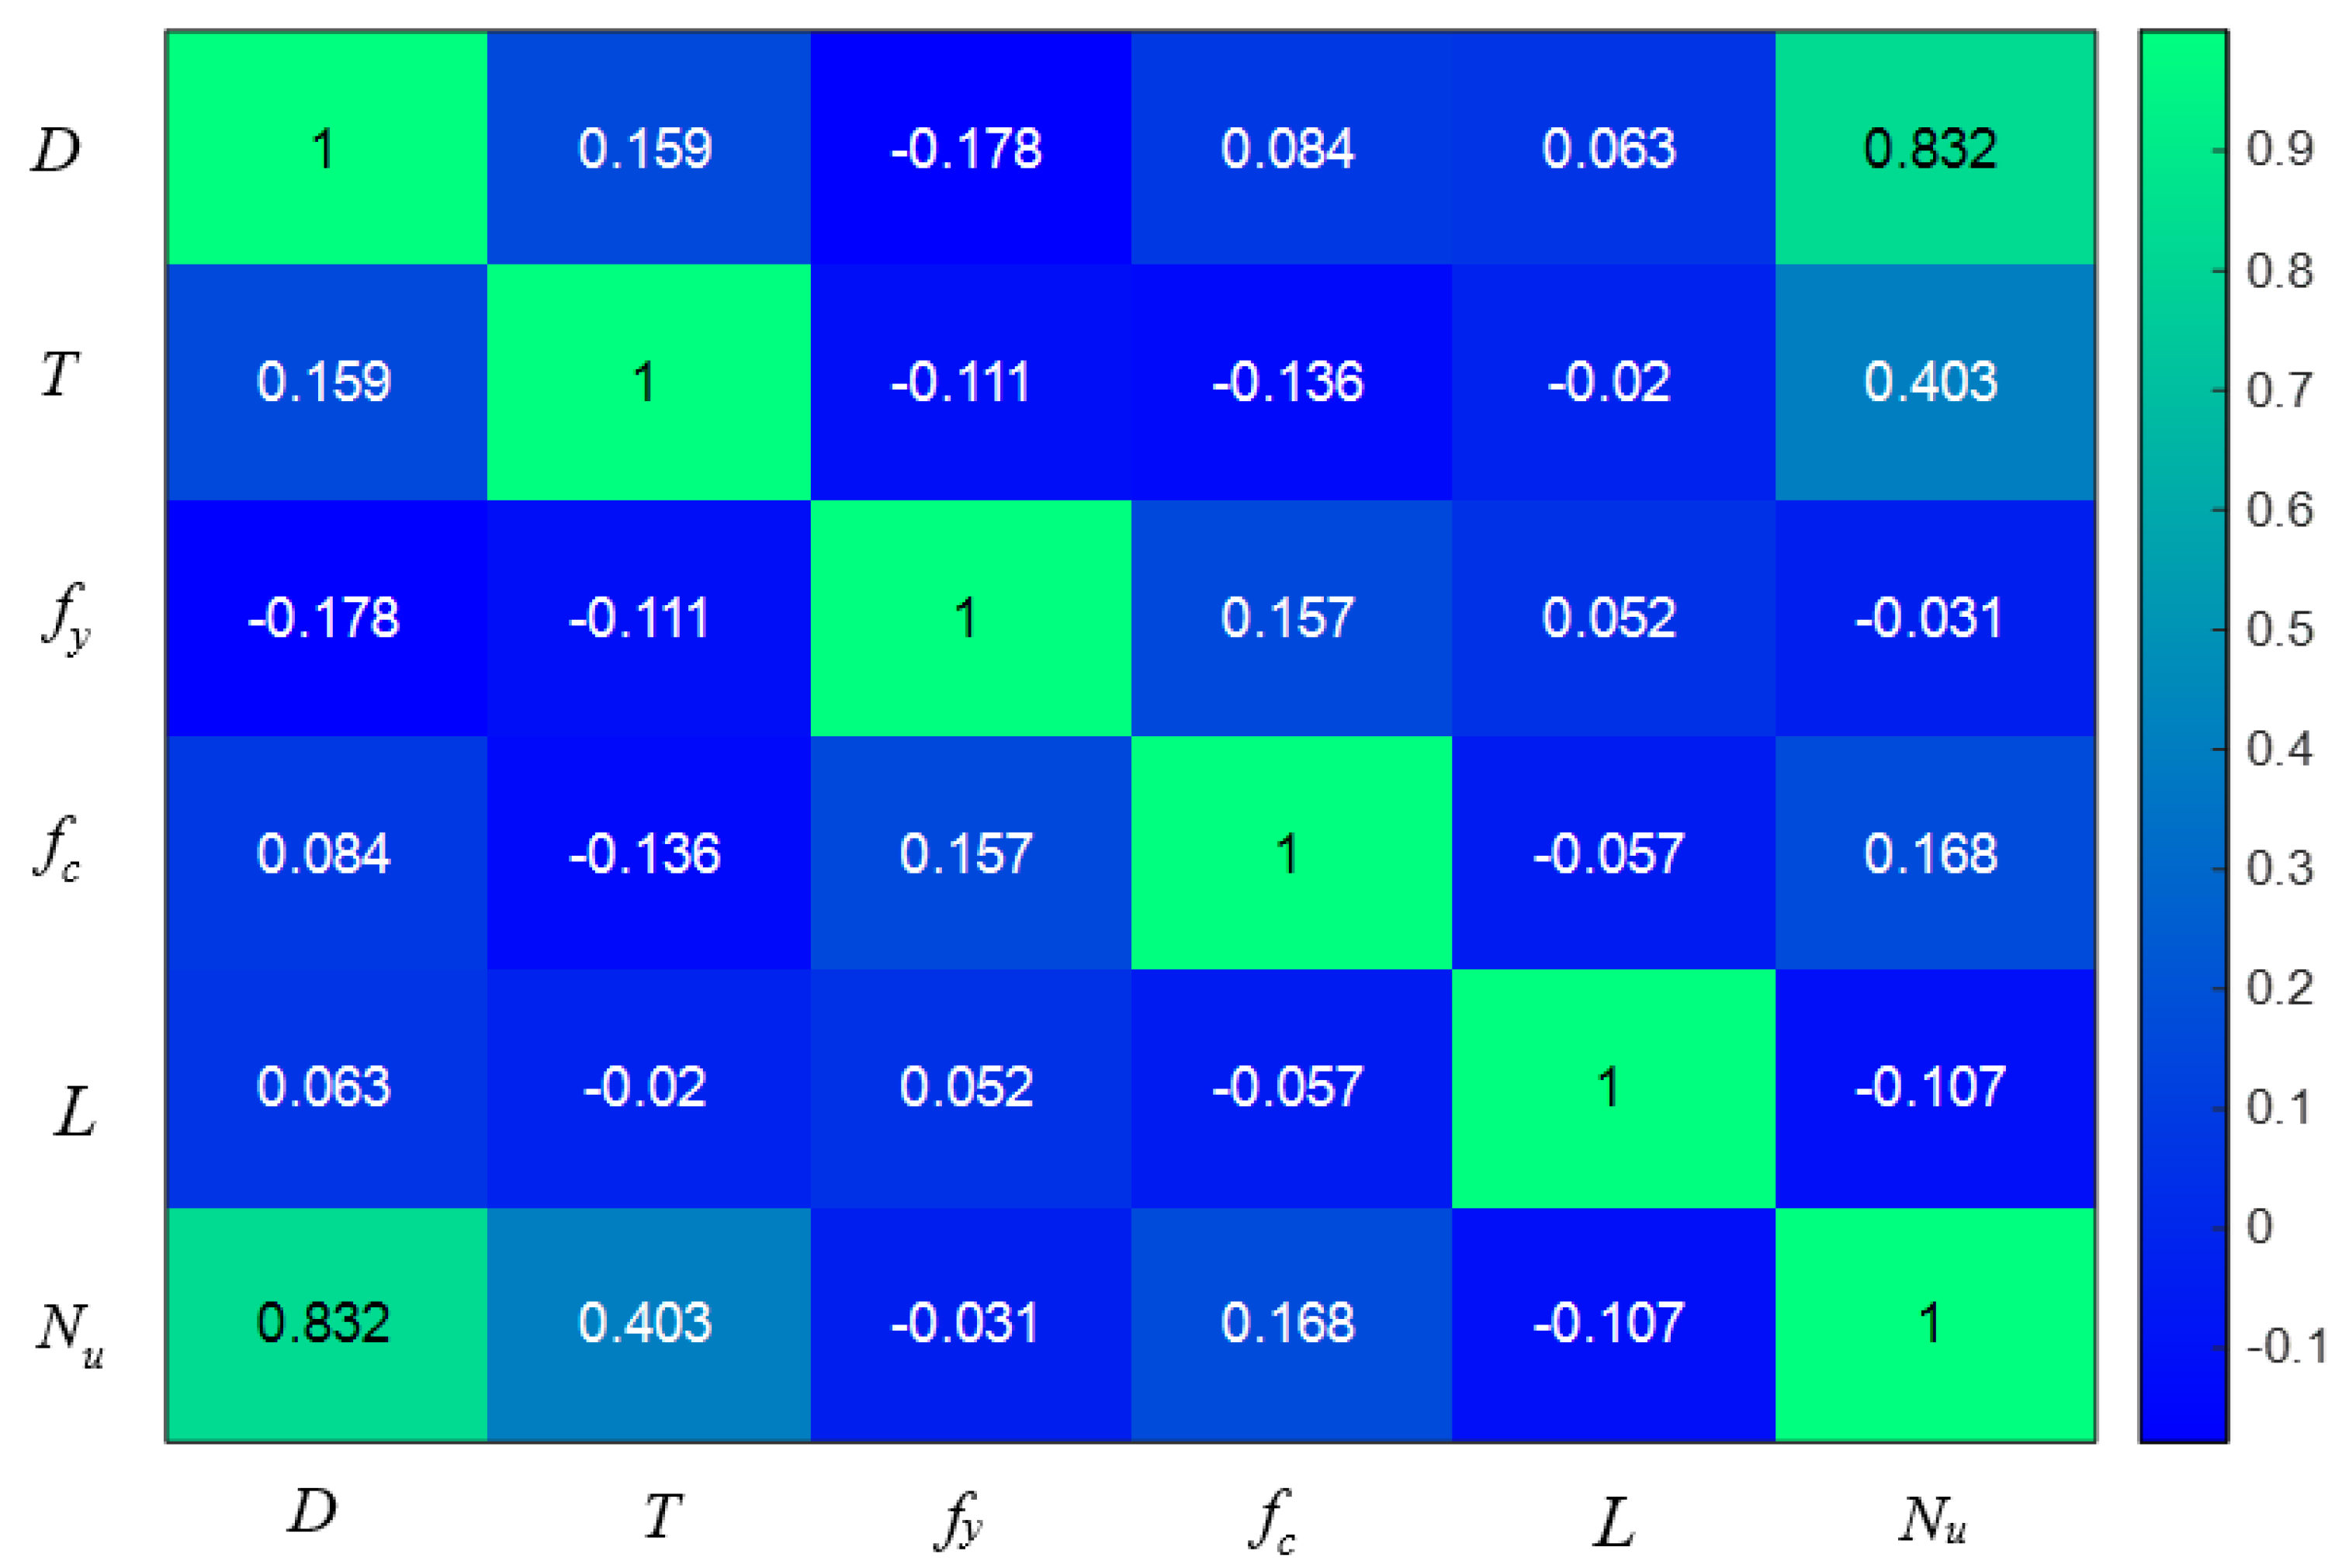
2. Dataset Description and Analysis

A total of 227 sets of CCSFT samples were collected. Each set of data includes five types of design parameters, the diameters of steel tube (D), the thickness of steel tube (T), the yield strength of steel (fy), concrete compressive strength (fc), column length (L) and the axial bearing capacity (Nu). The distribution and statistics of these parameters are shown in Figure 2 and Table 1, respectively. These parameters vary considerably from each other, for example, the axial bearing capacity varies from 210.7 kN to 11,460 kN. The Pearson correlation coefficient matrix between these data is shown in Figure 3. There is a complex non-linear relationship between the design parameters and the axial compression load capacity, which cannot be predicted by applying a linear model of a single parameter.

3. Prediction Models

In this section, the evaluation metrics of the models are first introduced, and the model prediction performance is evaluated and compared after using all of the models to create a prediction.

3.1. Performance Indices of Models

To evaluate the performance of model prediction, four evaluation indices, namely correlation coefficient (R), mean absolute error (MAE), root mean square error (RMSE), and mean squared error (MSE) are introduced. The mathematical expressions of these indices are defined as follows [32,33,34]. For the three prediction models in this section, to prevent overfitting, the data set is divided into two parts, with 80% constituting the training set and 20% the test set. Moreover, 10-fold cross-validation was performed.
R = N i = 1 N ( y t , i y p , i ) i = 1 N y t , i i = 1 N y p , i [ N ( i = 1 N y t , i 2 ) ( i = 1 N y t , i ) 2 ] [ N ( i = 1 N y p , i 2 ) ( i = 1 N y p , i ) 2 ]
M A E = i = 1 N y t , i y p , i N
R M S E = 1 N i = 1 N y t , i y p , i 2
M S E = 1 N i = 1 N y t , i y p , i 2
where N is the number of samples, and y t and y p are the true and predicted values. Theoretically, the closer the R is to 1 or the smaller the other three indicators are, the closer the predicted value is to the true value, and the better the model prediction is.

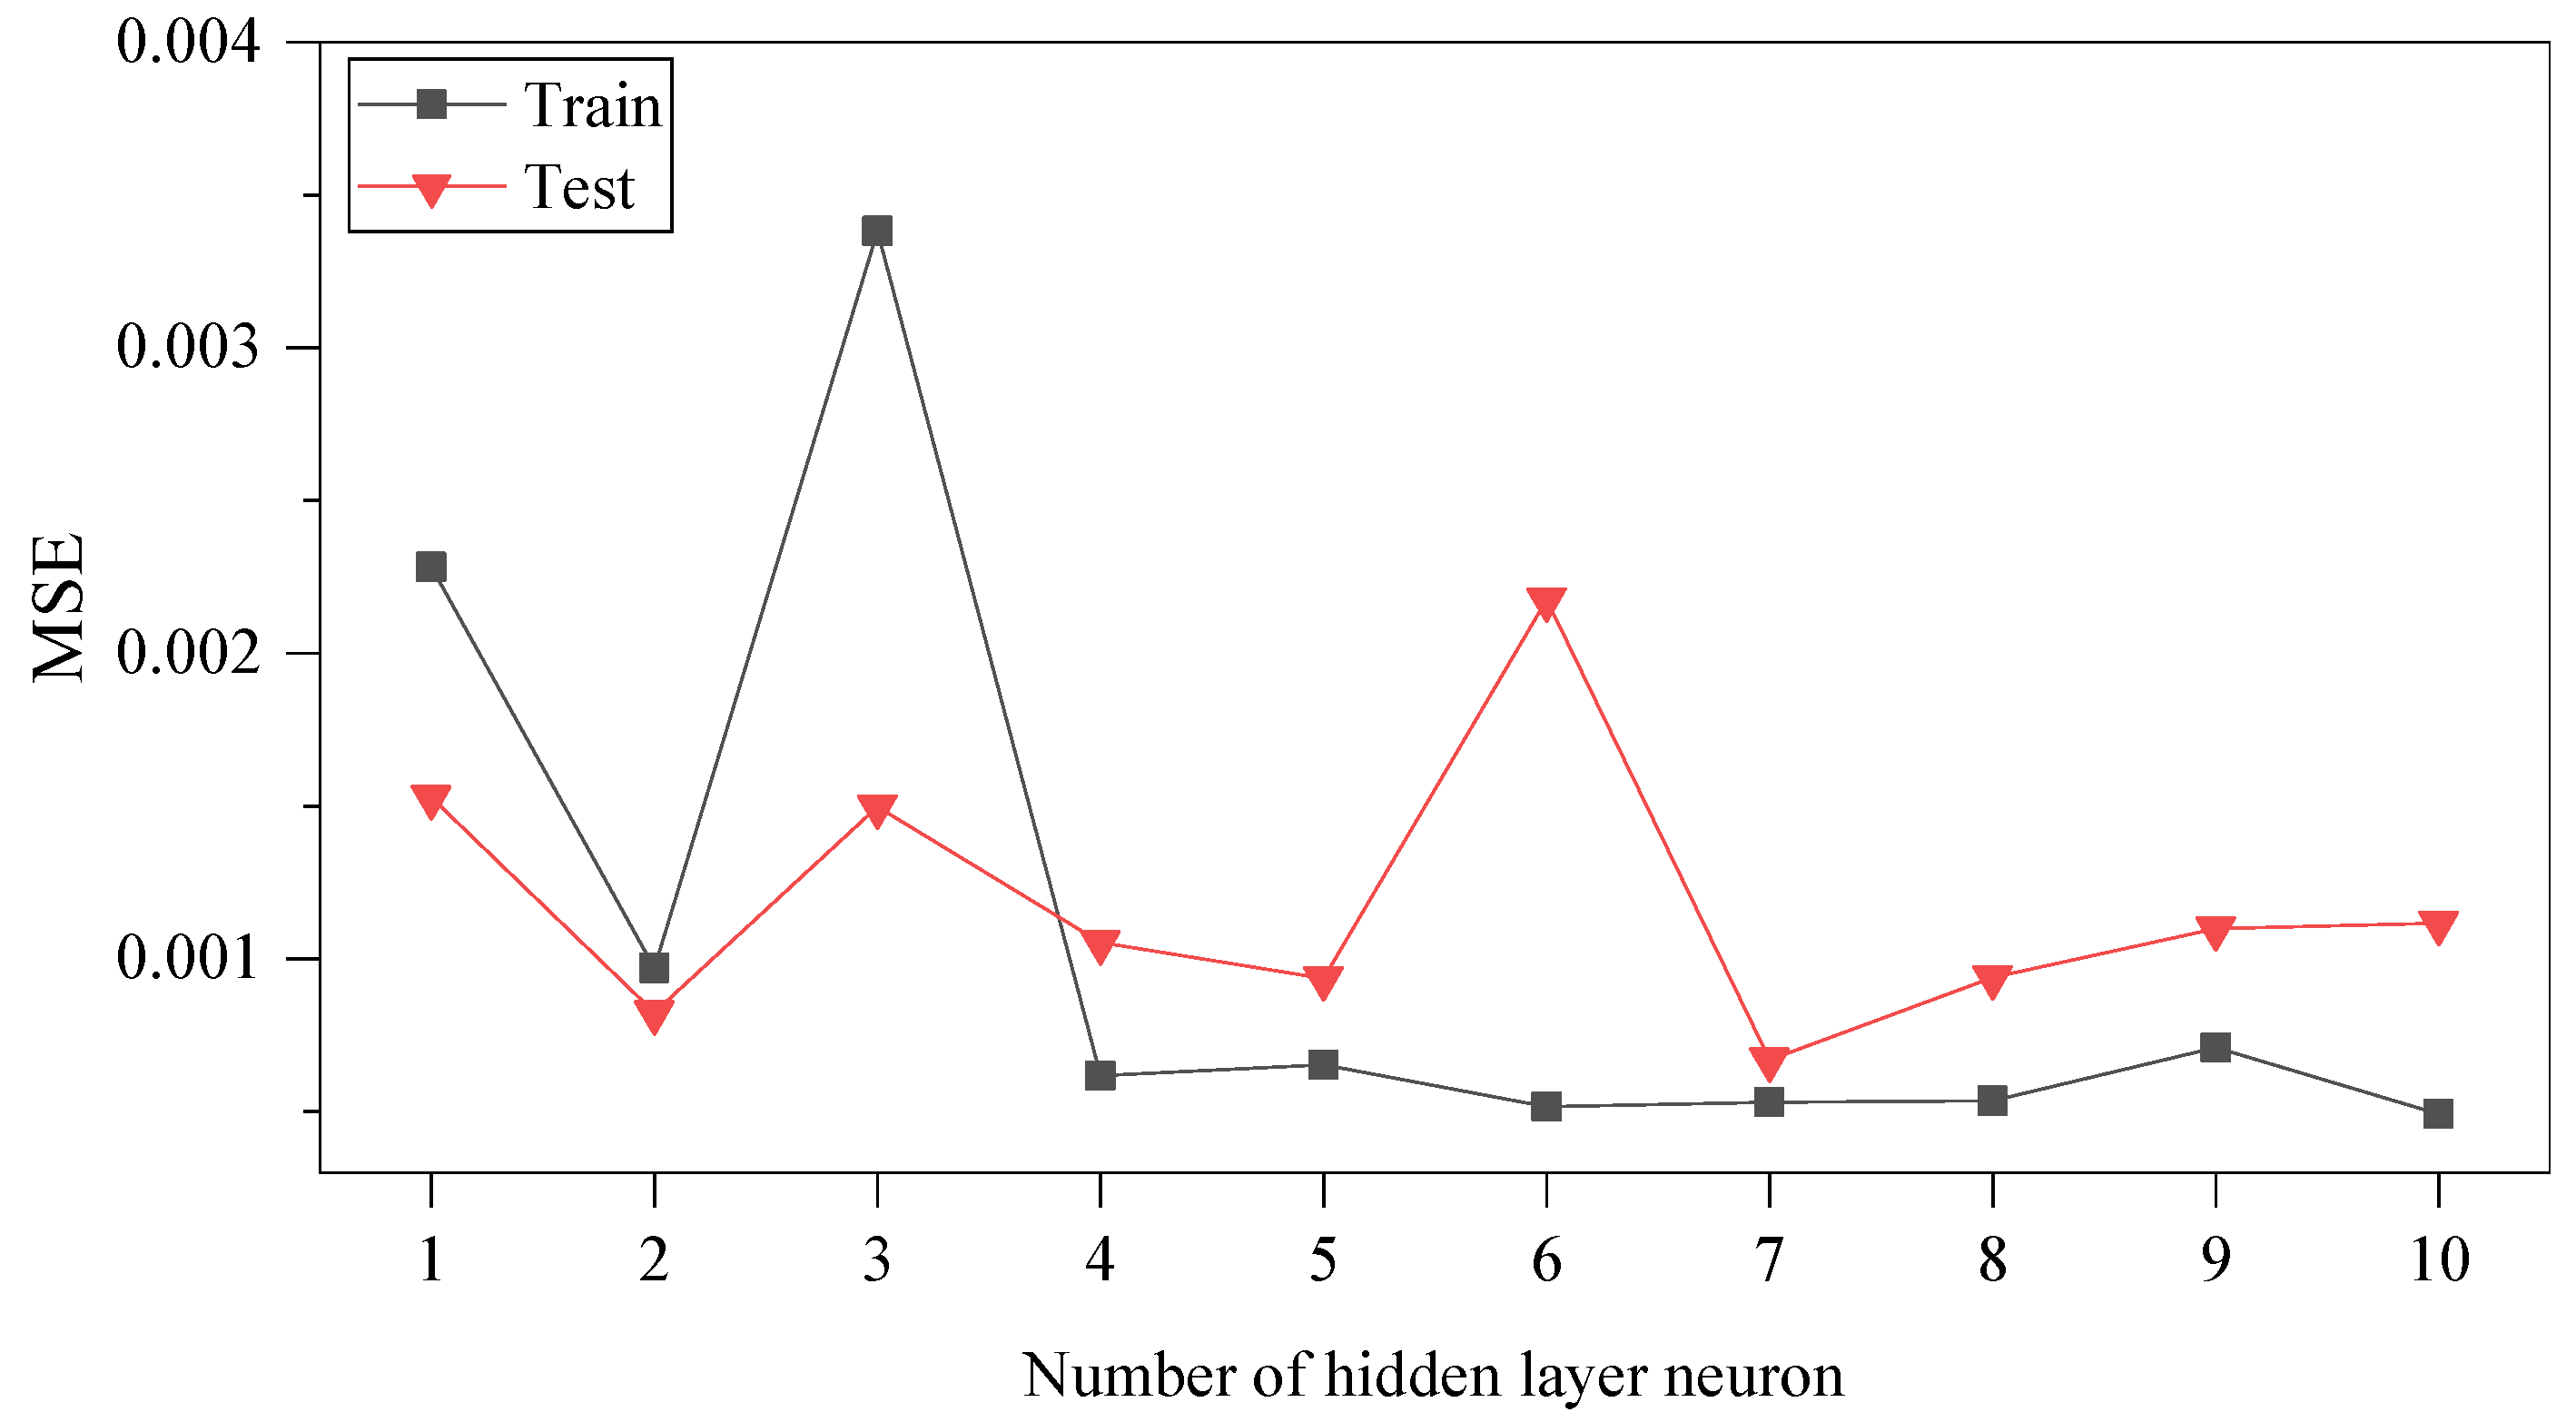
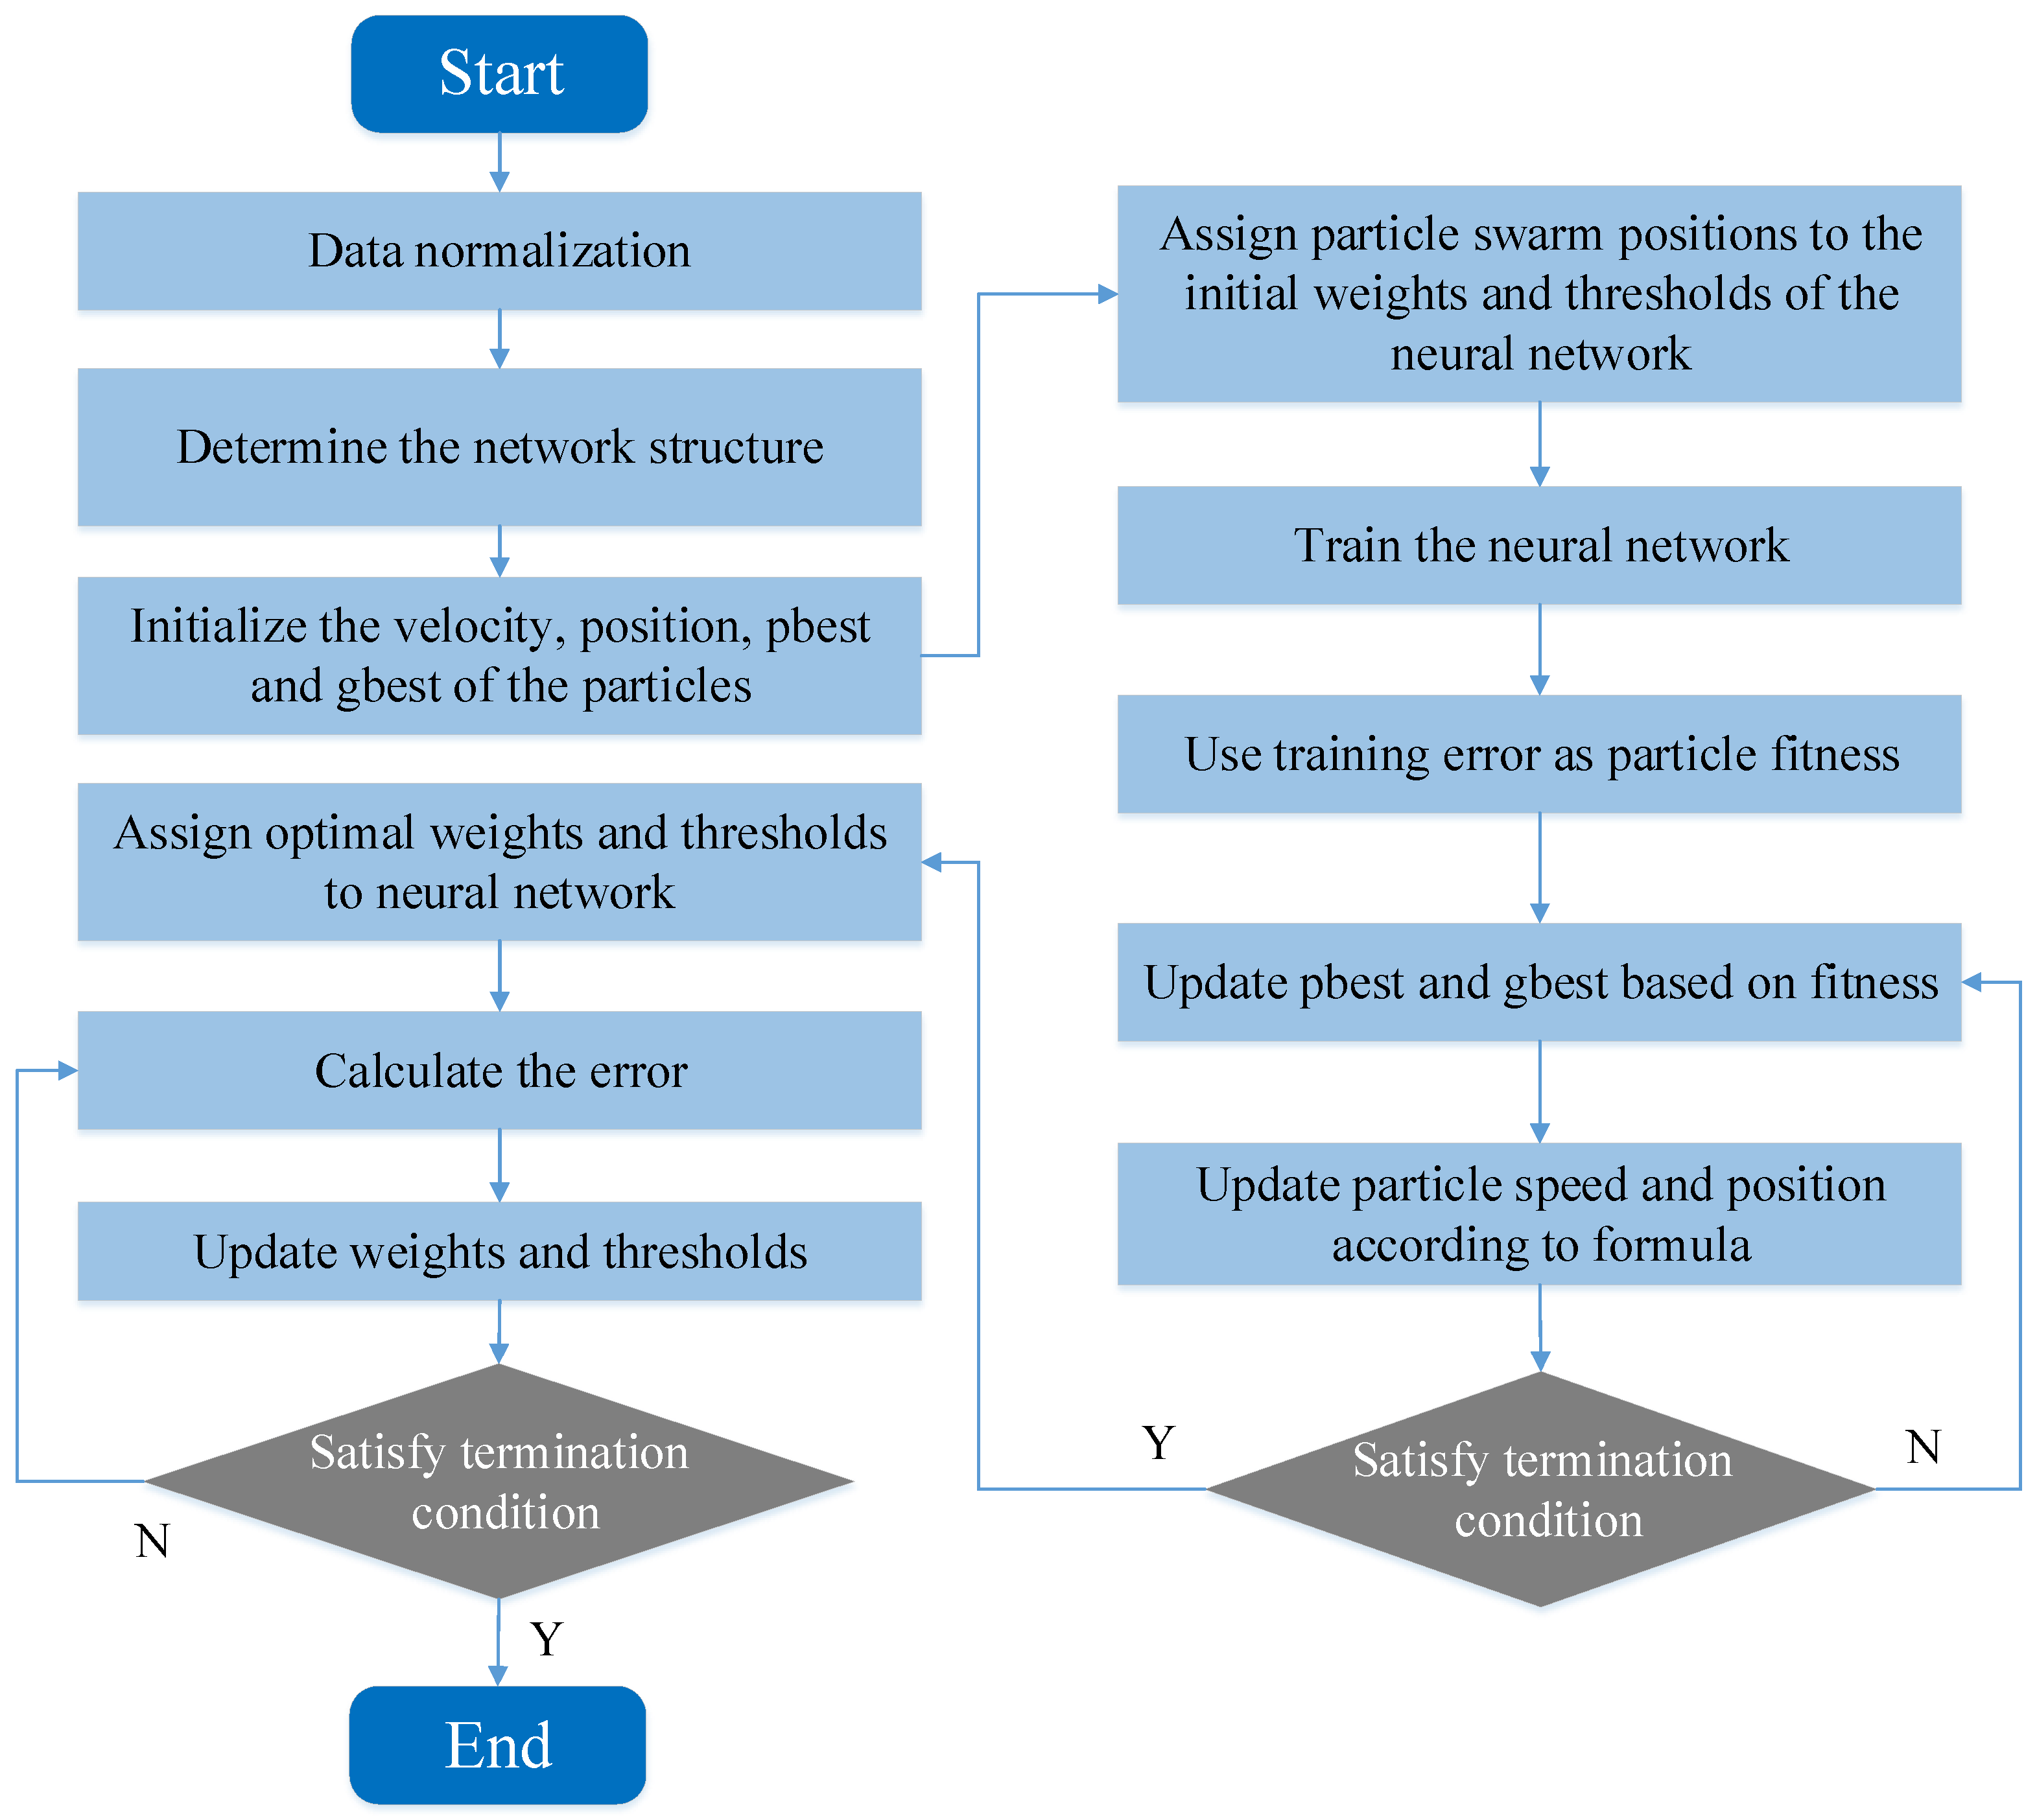
3.2. PSO-ANN Neural Network

A neural network is a mathematical model that applies a structure similar to that of the synaptic connections of the brain for information processing. It relies on the complexity of the system to process information by adjusting the interconnections between a large number of internal nodes [35]. ANN is widely used for function approximation, model identification and classification, data compression, and time series prediction [36]. With the sample data and network structure having been determined, the determination of initial weights and thresholds is the most important factor affecting the model training and prediction results. The random forest algorithm, genetic algorithm, ant colony algorithm, and particle swarm optimization algorithm provide new insights for seeking the best range of weights and thresholds [37,38,39,40].
The particle swarm optimization (PSO) algorithm, proposed by Kennedy and Eberhart in 1995, is an optimization method based on swarm intelligence [41,42]. It simulates the behavior of a flock of birds flying to feed, and the birds collaborate in order for the flock to optimally achieve its purpose. Similar to the genetic algorithm, it is also population-based stacked generation, but without the crossover and variation used in genetic algorithms; instead, the particles search for the optimal particle in the solution space. PSO has the advantage of being simple and easy to implement, with a profoundly intelligent background [43,44]. It is suitable not only for scientific research, but also for engineering applications and does not have many parameters that need to be tuned. For this reason, this section proposes the use of the PSO algorithm to solve for the optimal range of weights and thresholds for the network [45]. The global search ability of the particle swarm algorithm is used to optimize the topology, connection weights, and thresholds of the neural network. The good global search ability of the particle swarm algorithm is combined with the good local search ability of the ANN algorithm to improve the generalization ability and learning performance of the neural network and to improve the overall search efficiency of the neural network.
Related studies have shown that single hidden layer networks can achieve arbitrary nonlinear mappings by appropriately increasing the number of neuron nodes [46]. Therefore, a single hidden layer is used for the neural network in this paper. For the neural network, the number of neurons in the input layer is 5, the number of neurons in the output layer is 1, and the number of neurons in the hidden layer is not unique in general. Theoretically, if the number of neurons in the hidden layer is too small, the network cannot learn well, and the prediction accuracy will be affected, but if the number of neurons is too large, the training time will be too long, and will be prone to overfitting. The number of neurons in the hidden layer is usually adjusted by trial by error.
Network structures with different numbers of neurons in the hidden layer were established, and the training and testing errors on the dataset are shown in Figure 4. As can be seen, the MSE is smallest when the number of neurons in the hidden layer is 7; thus, the number of neurons in the hidden layer was chosen to be 7. The parameters of the whole neural network are shown in Table 2, and the flowchart of the PSO-ANN network is shown in Figure 5.
Before data training, it is recommended to scale the database to a range of [−1, 1] by the normalization procedure (Equation (5)) for faster convergence [47].
x n o r m , i = 2 × ( x i x i , min ) x i , max x i , min 1

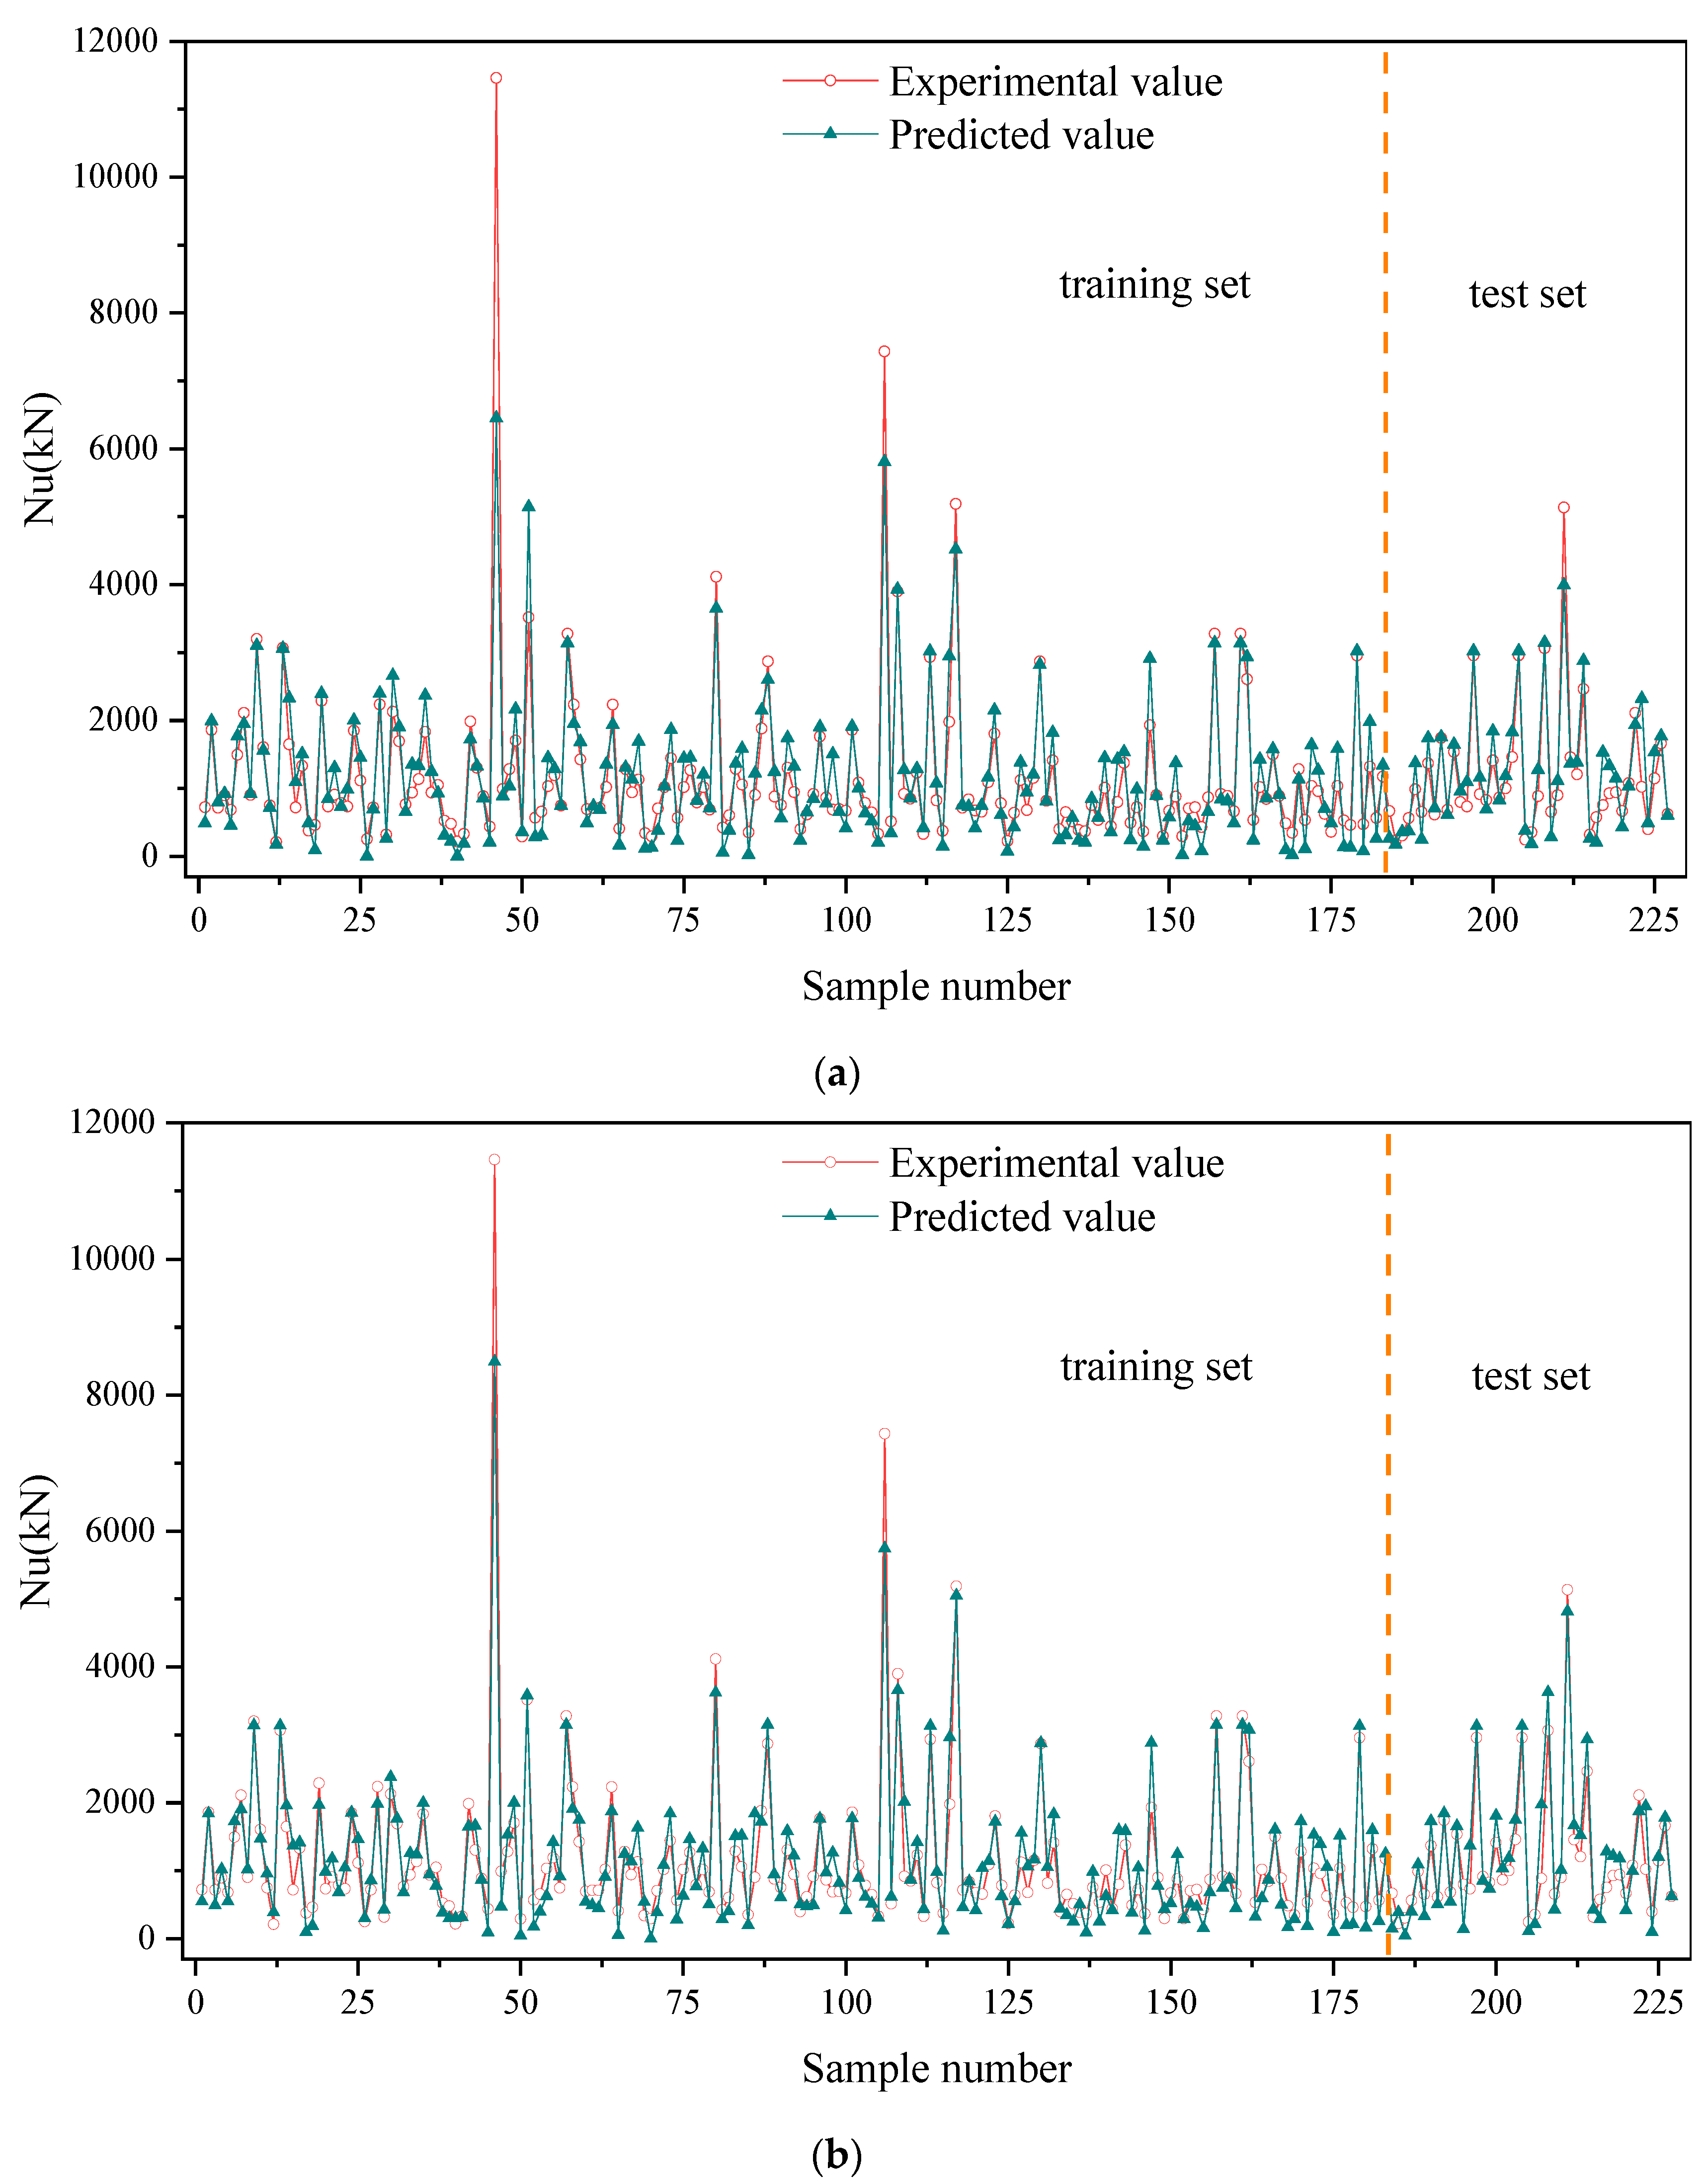
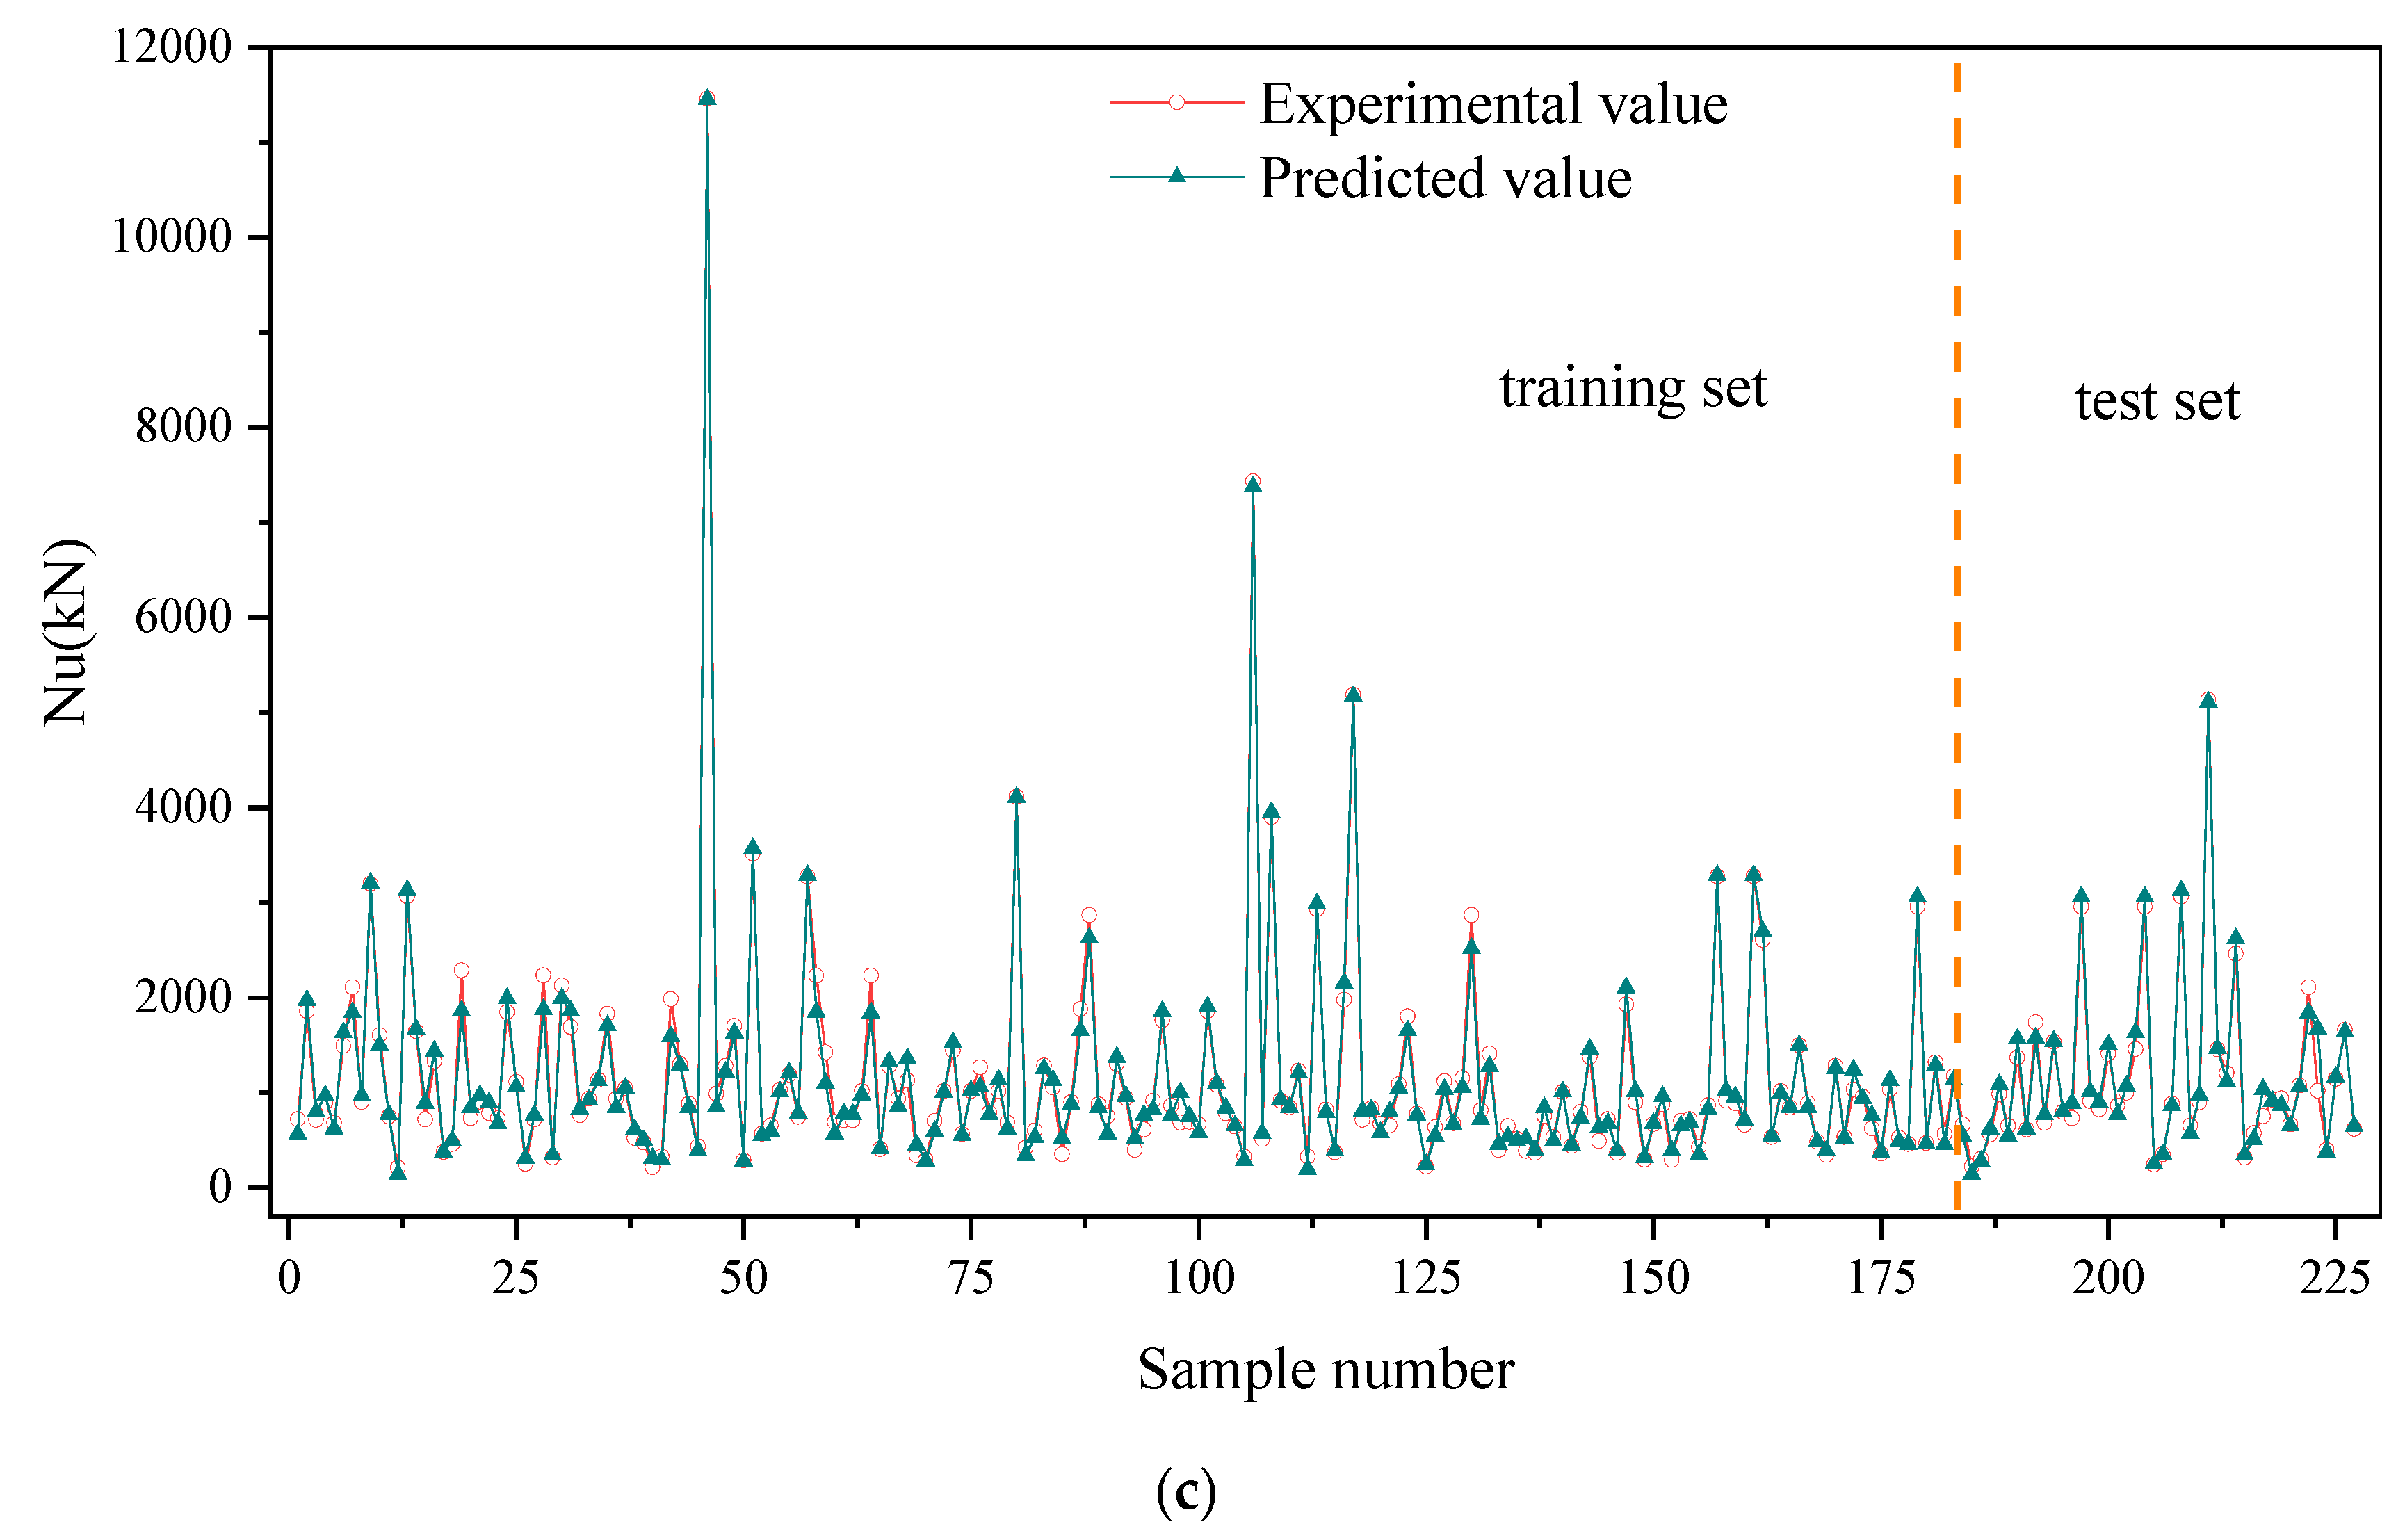
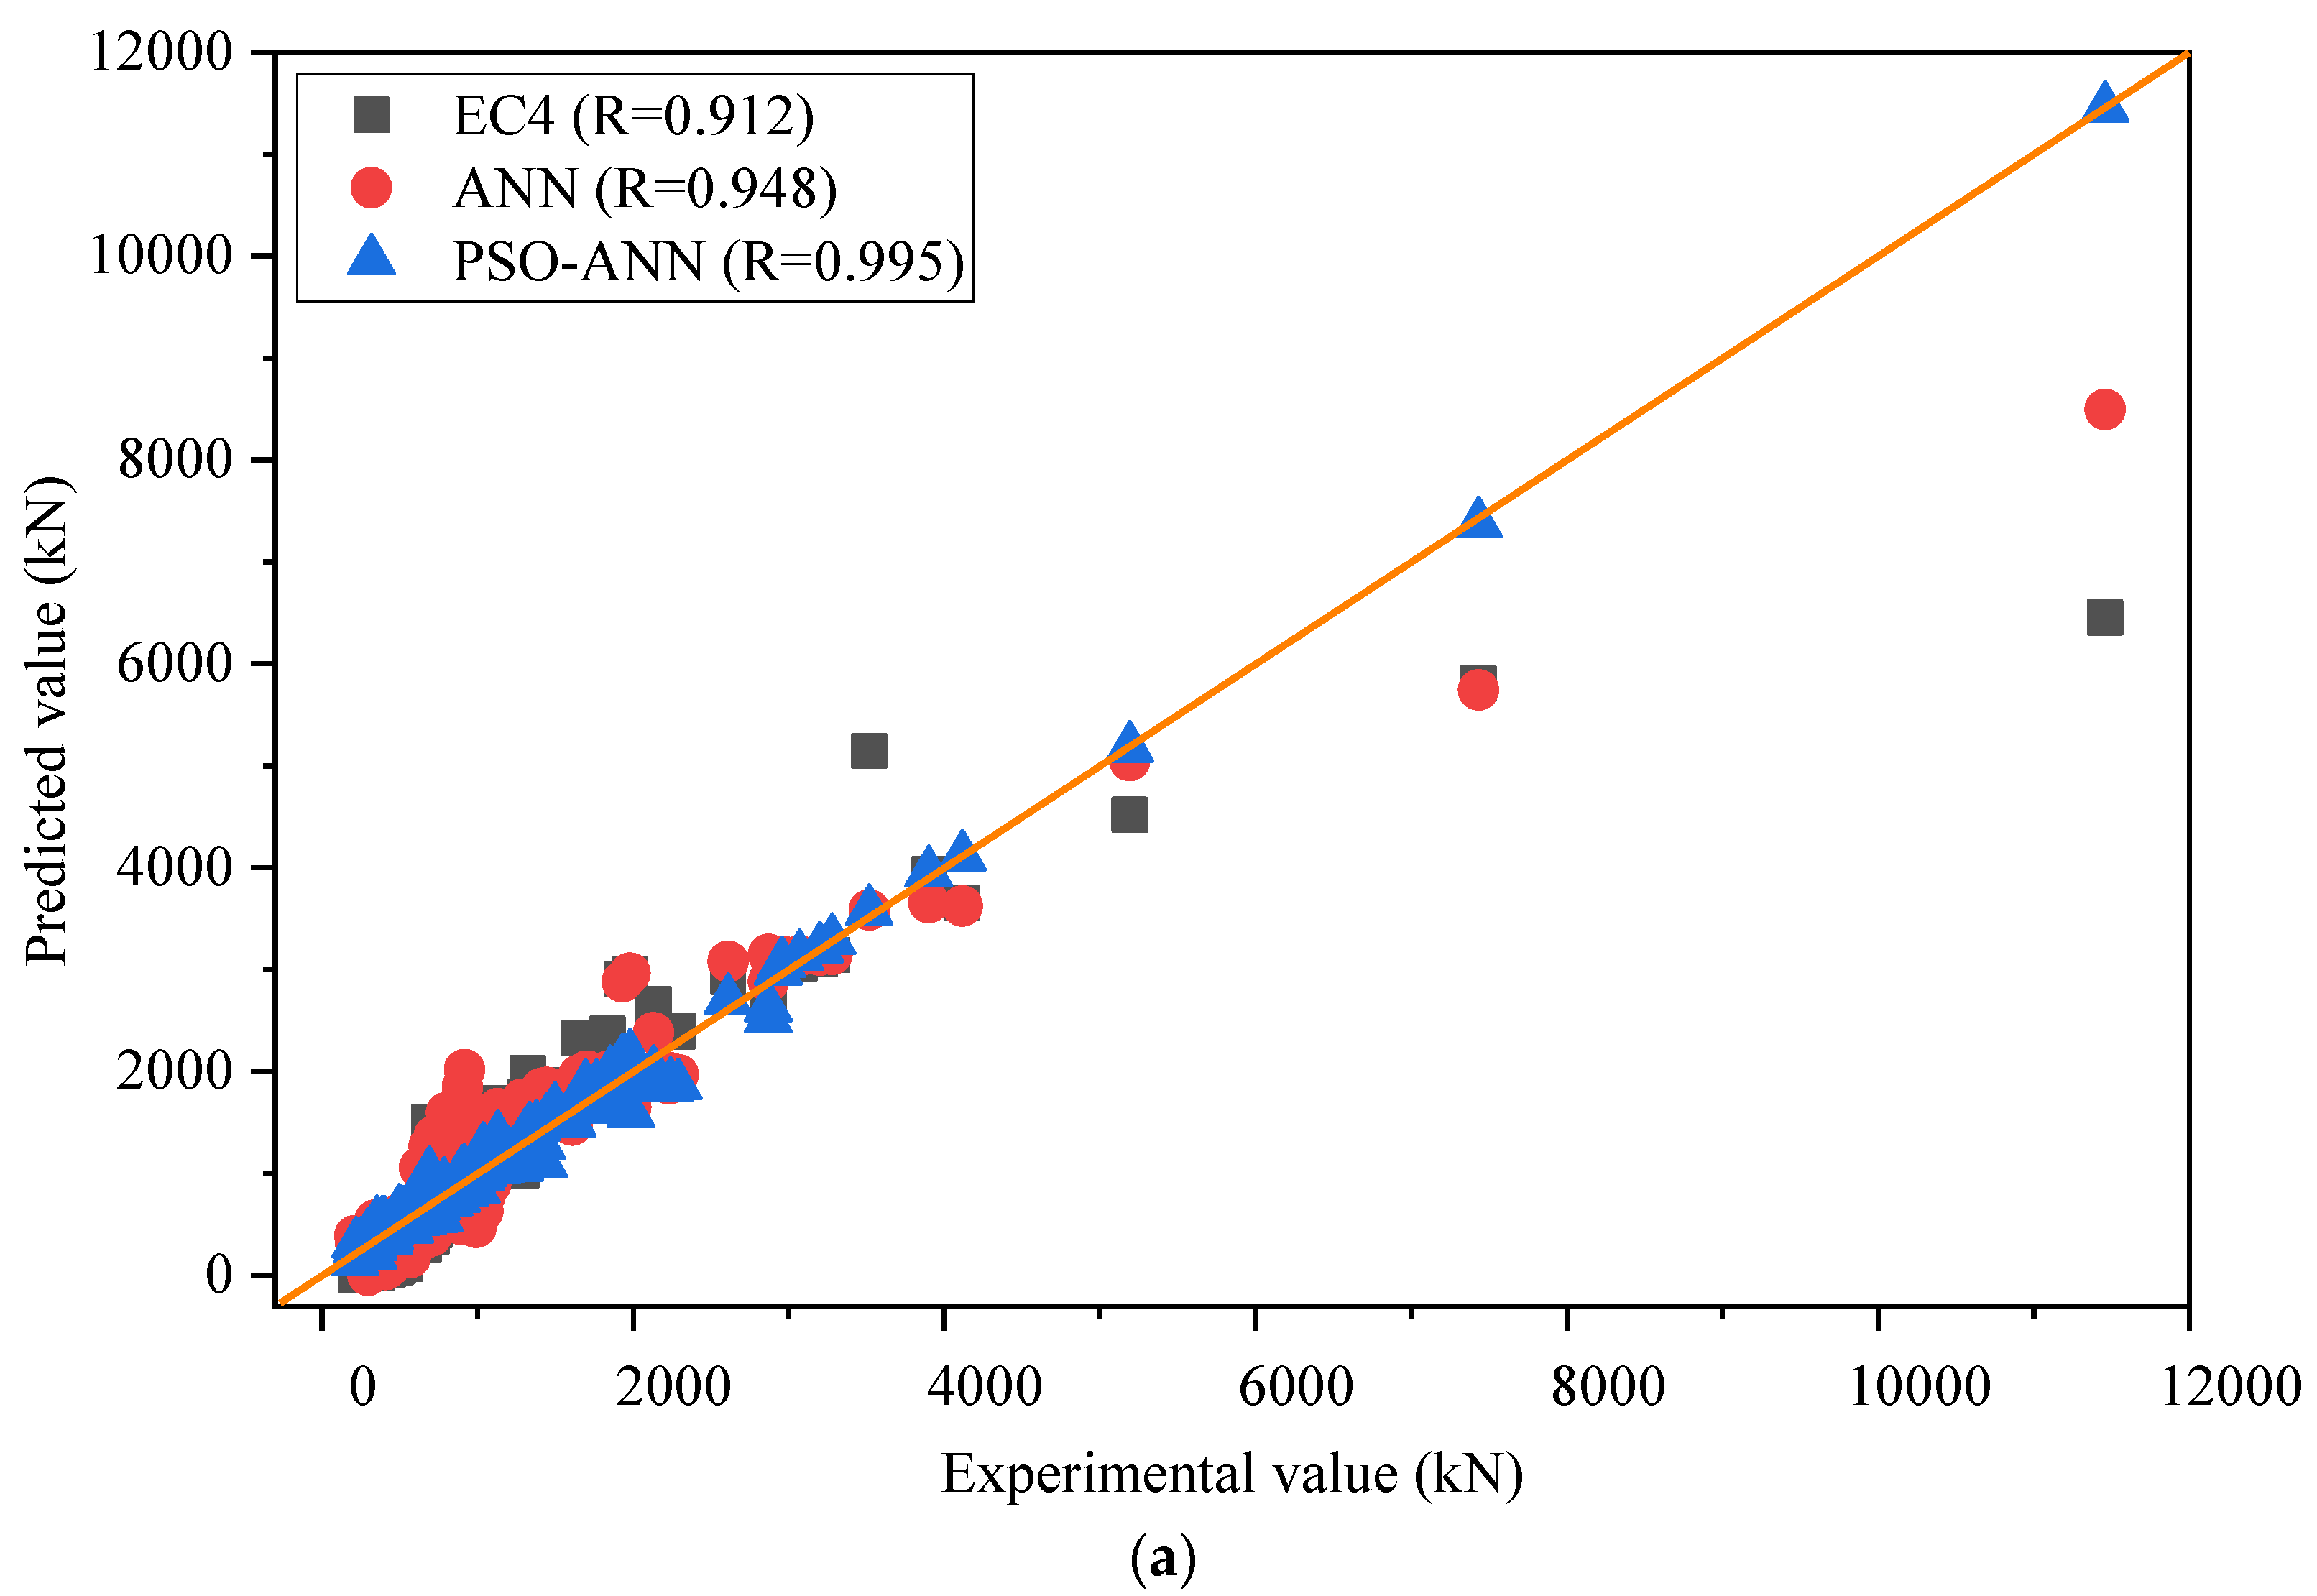
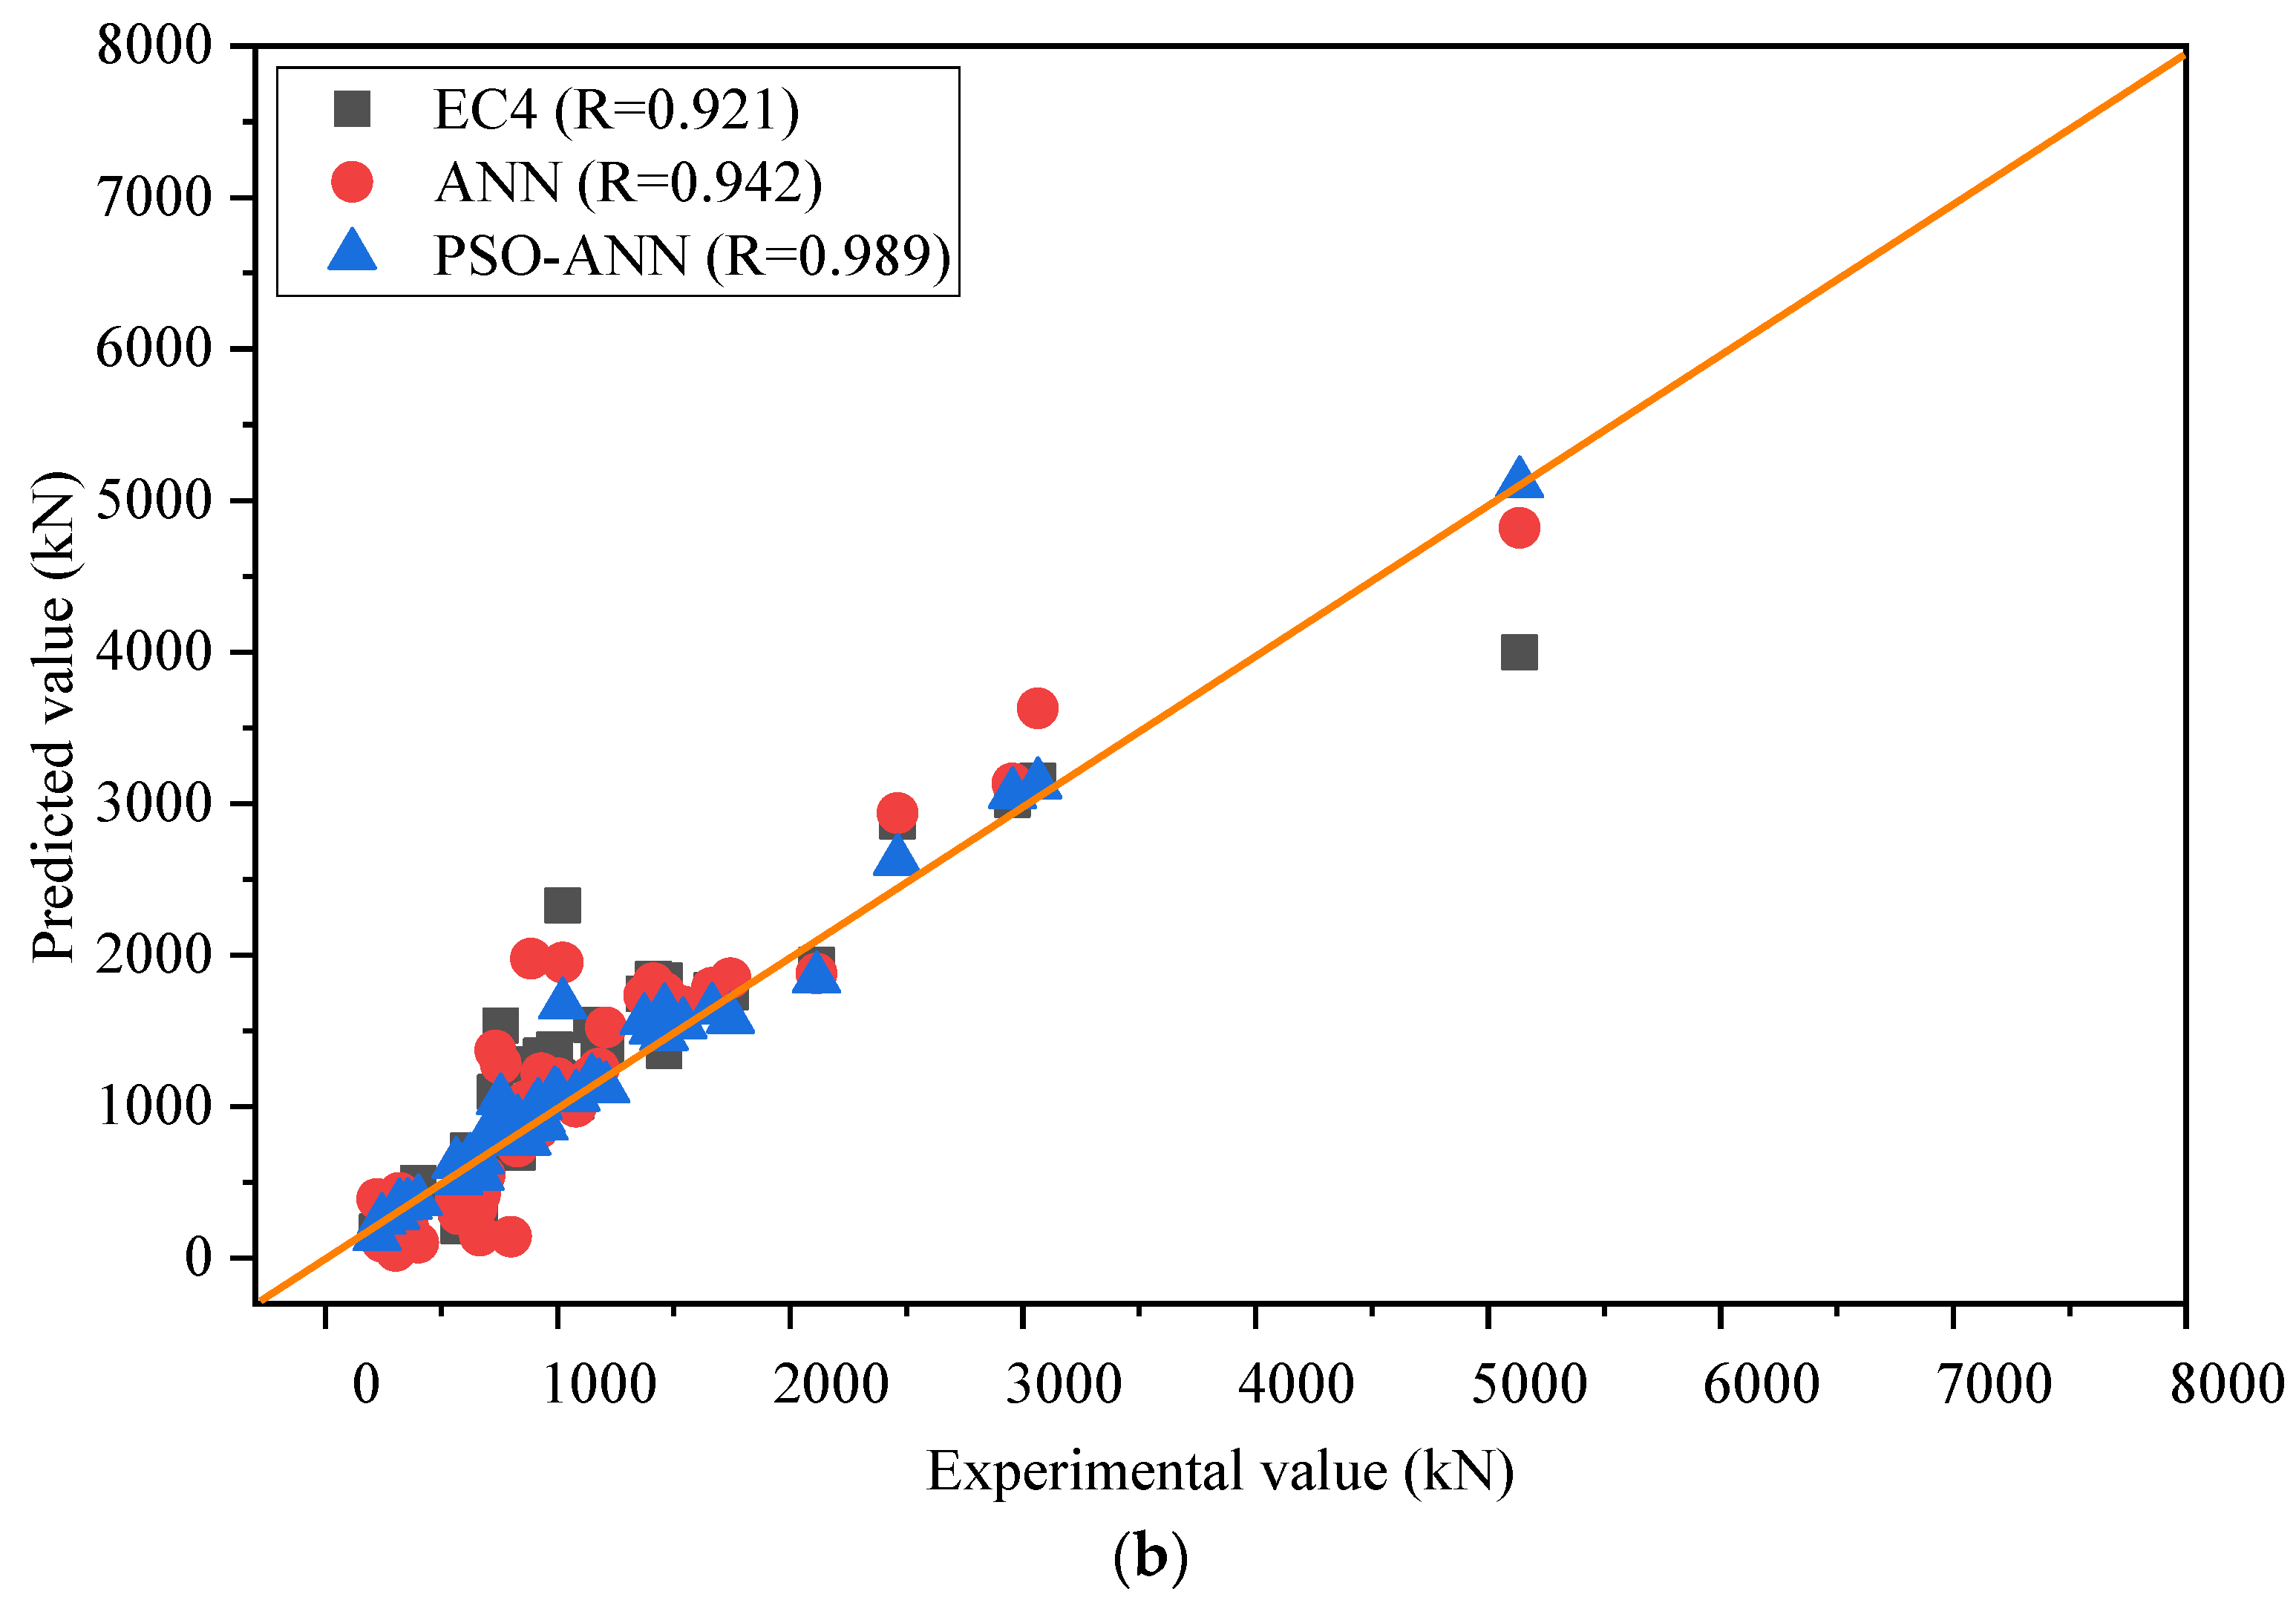
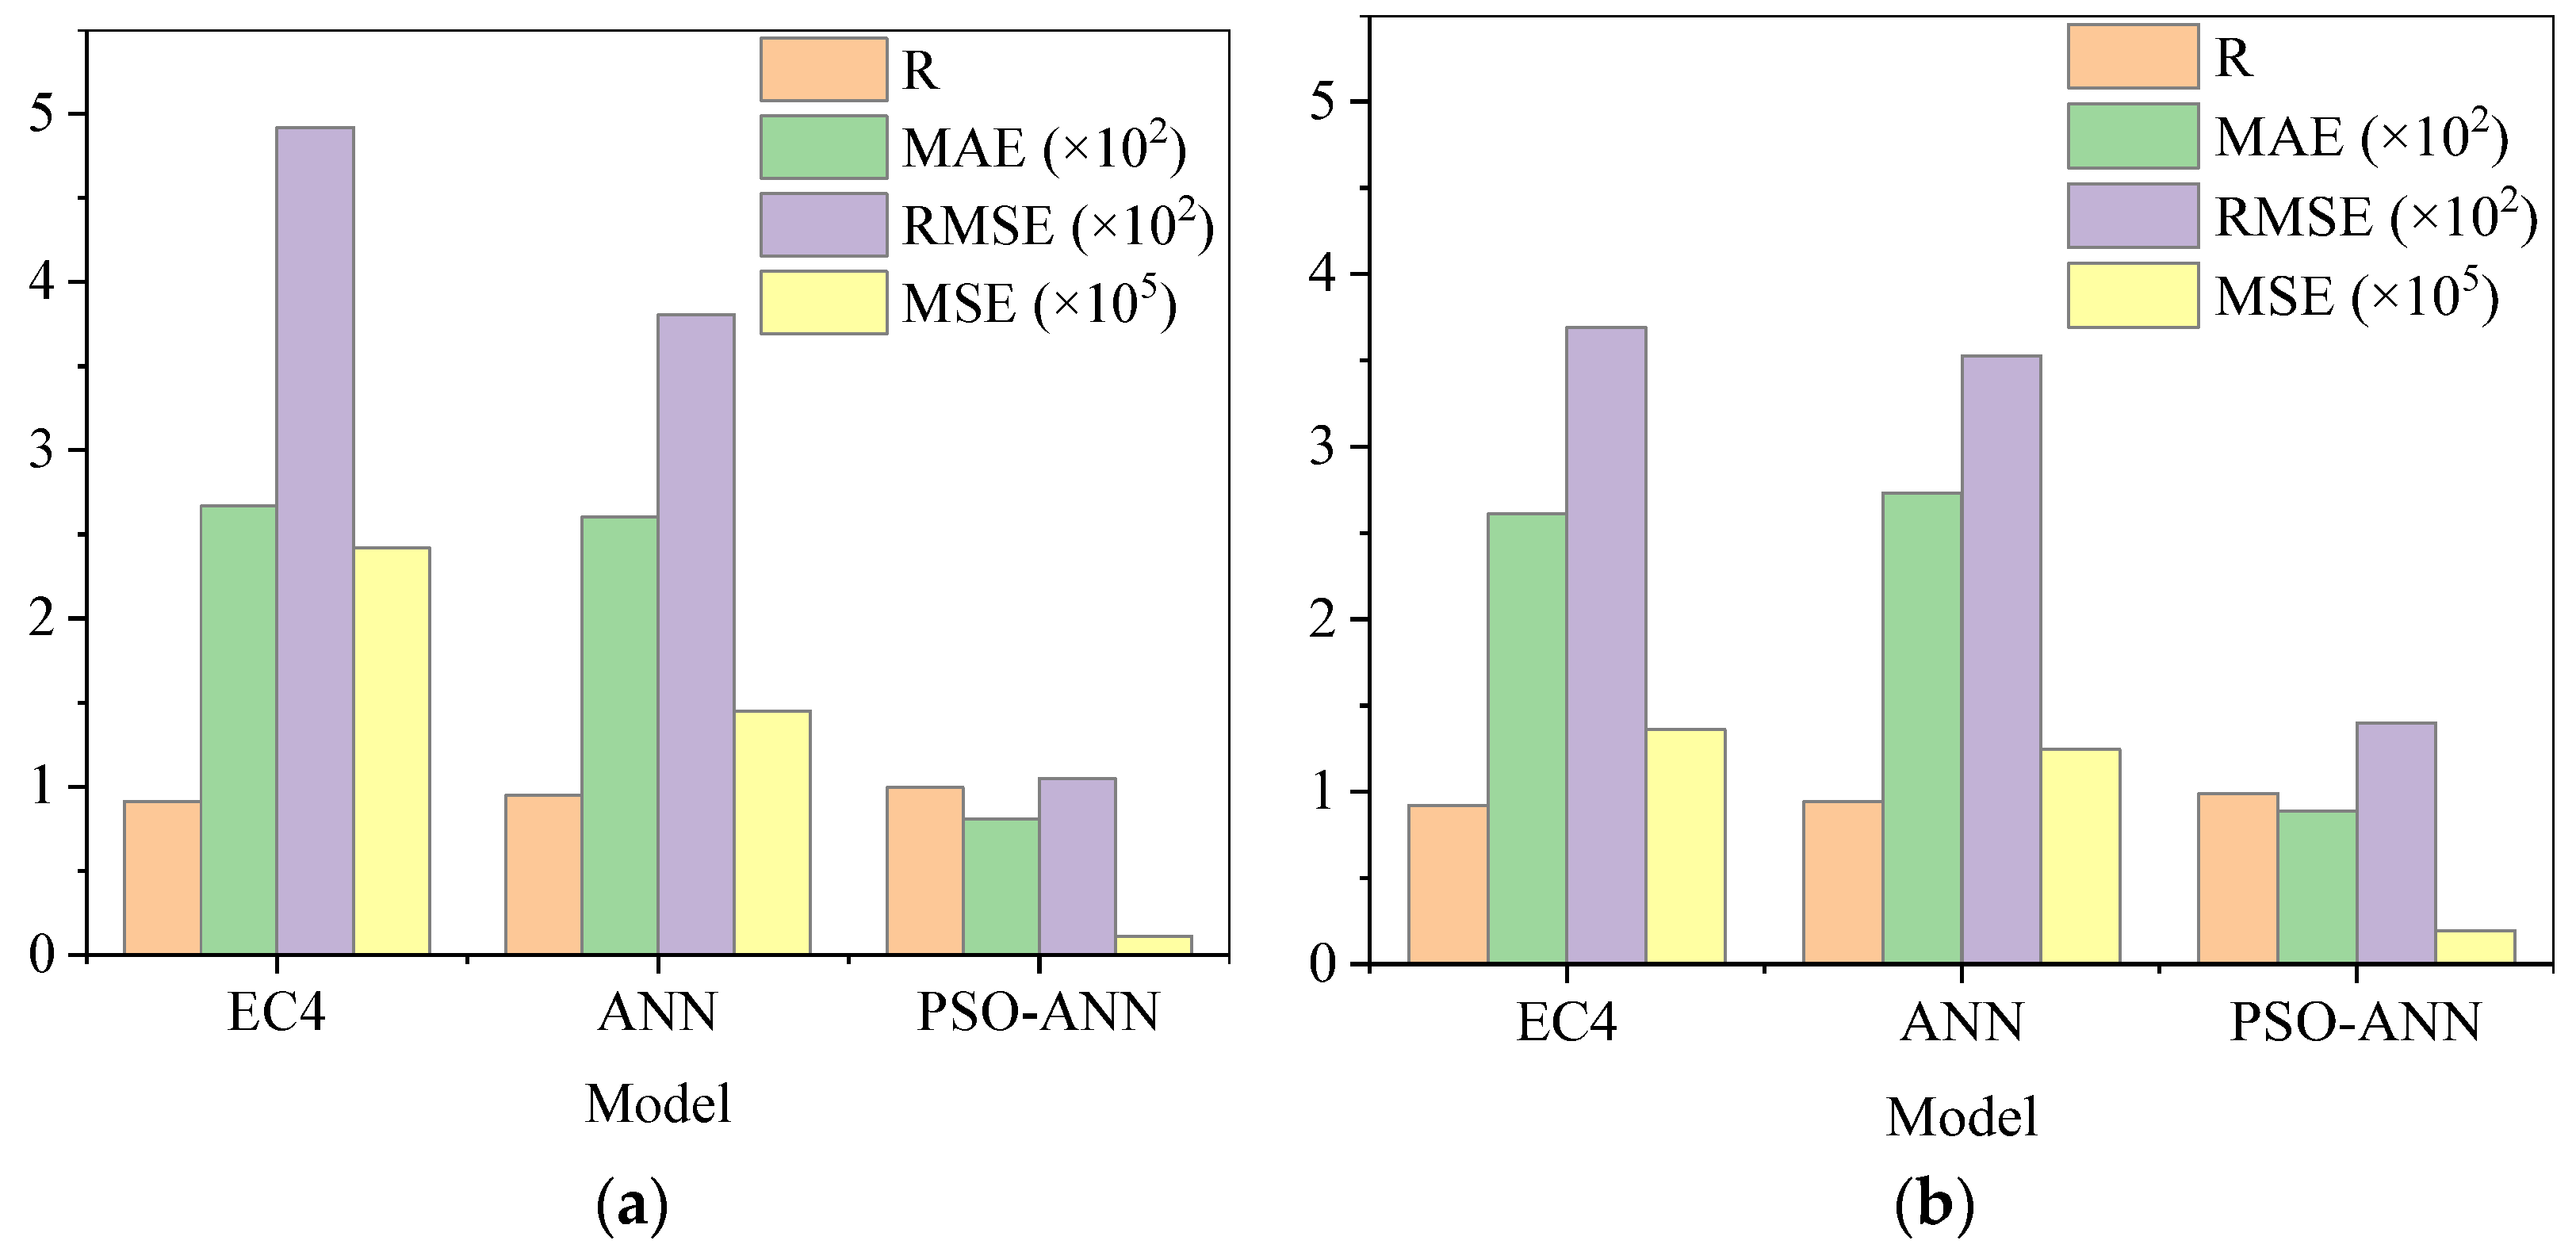
3.3. Comparison of Prediction Models

To highlight the performance of the model proposed in this paper, Eurocode 4 (EC4) and the original ANN model are also employed for training and prediction. The results are shown in Figure 6. To express these more clearly, the correlation coefficients between experimental and predicted values for different models are plotted in Figure 7. With respect to the PSO-ANN model, it can be observed that the data points cluster closely around the diagonal line, reflecting a complete agreement between the predicted and the experimental values, achieving a maximum correlation coefficient of 0.995 for the training set and 0.995 for the test set. Compared with EC4 and the original ANN model, at each sample point, the predicted value of the PSO-ANN model matches well with the experimental one, proving the accuracy and efficiency of the PSO-ANN model in capturing complex and nonlinear relations between six input variables and the ultimate compressive strength of the CCFST columns.
Additionally, the evaluation metrics of the training and test sets are presented in Figure 8. It can be observed from both sets that R is close to 1, and low values for MAE, RMSE, and MSE are achieved. This further verifies the accuracy and reliability of the PSO-ANN model.

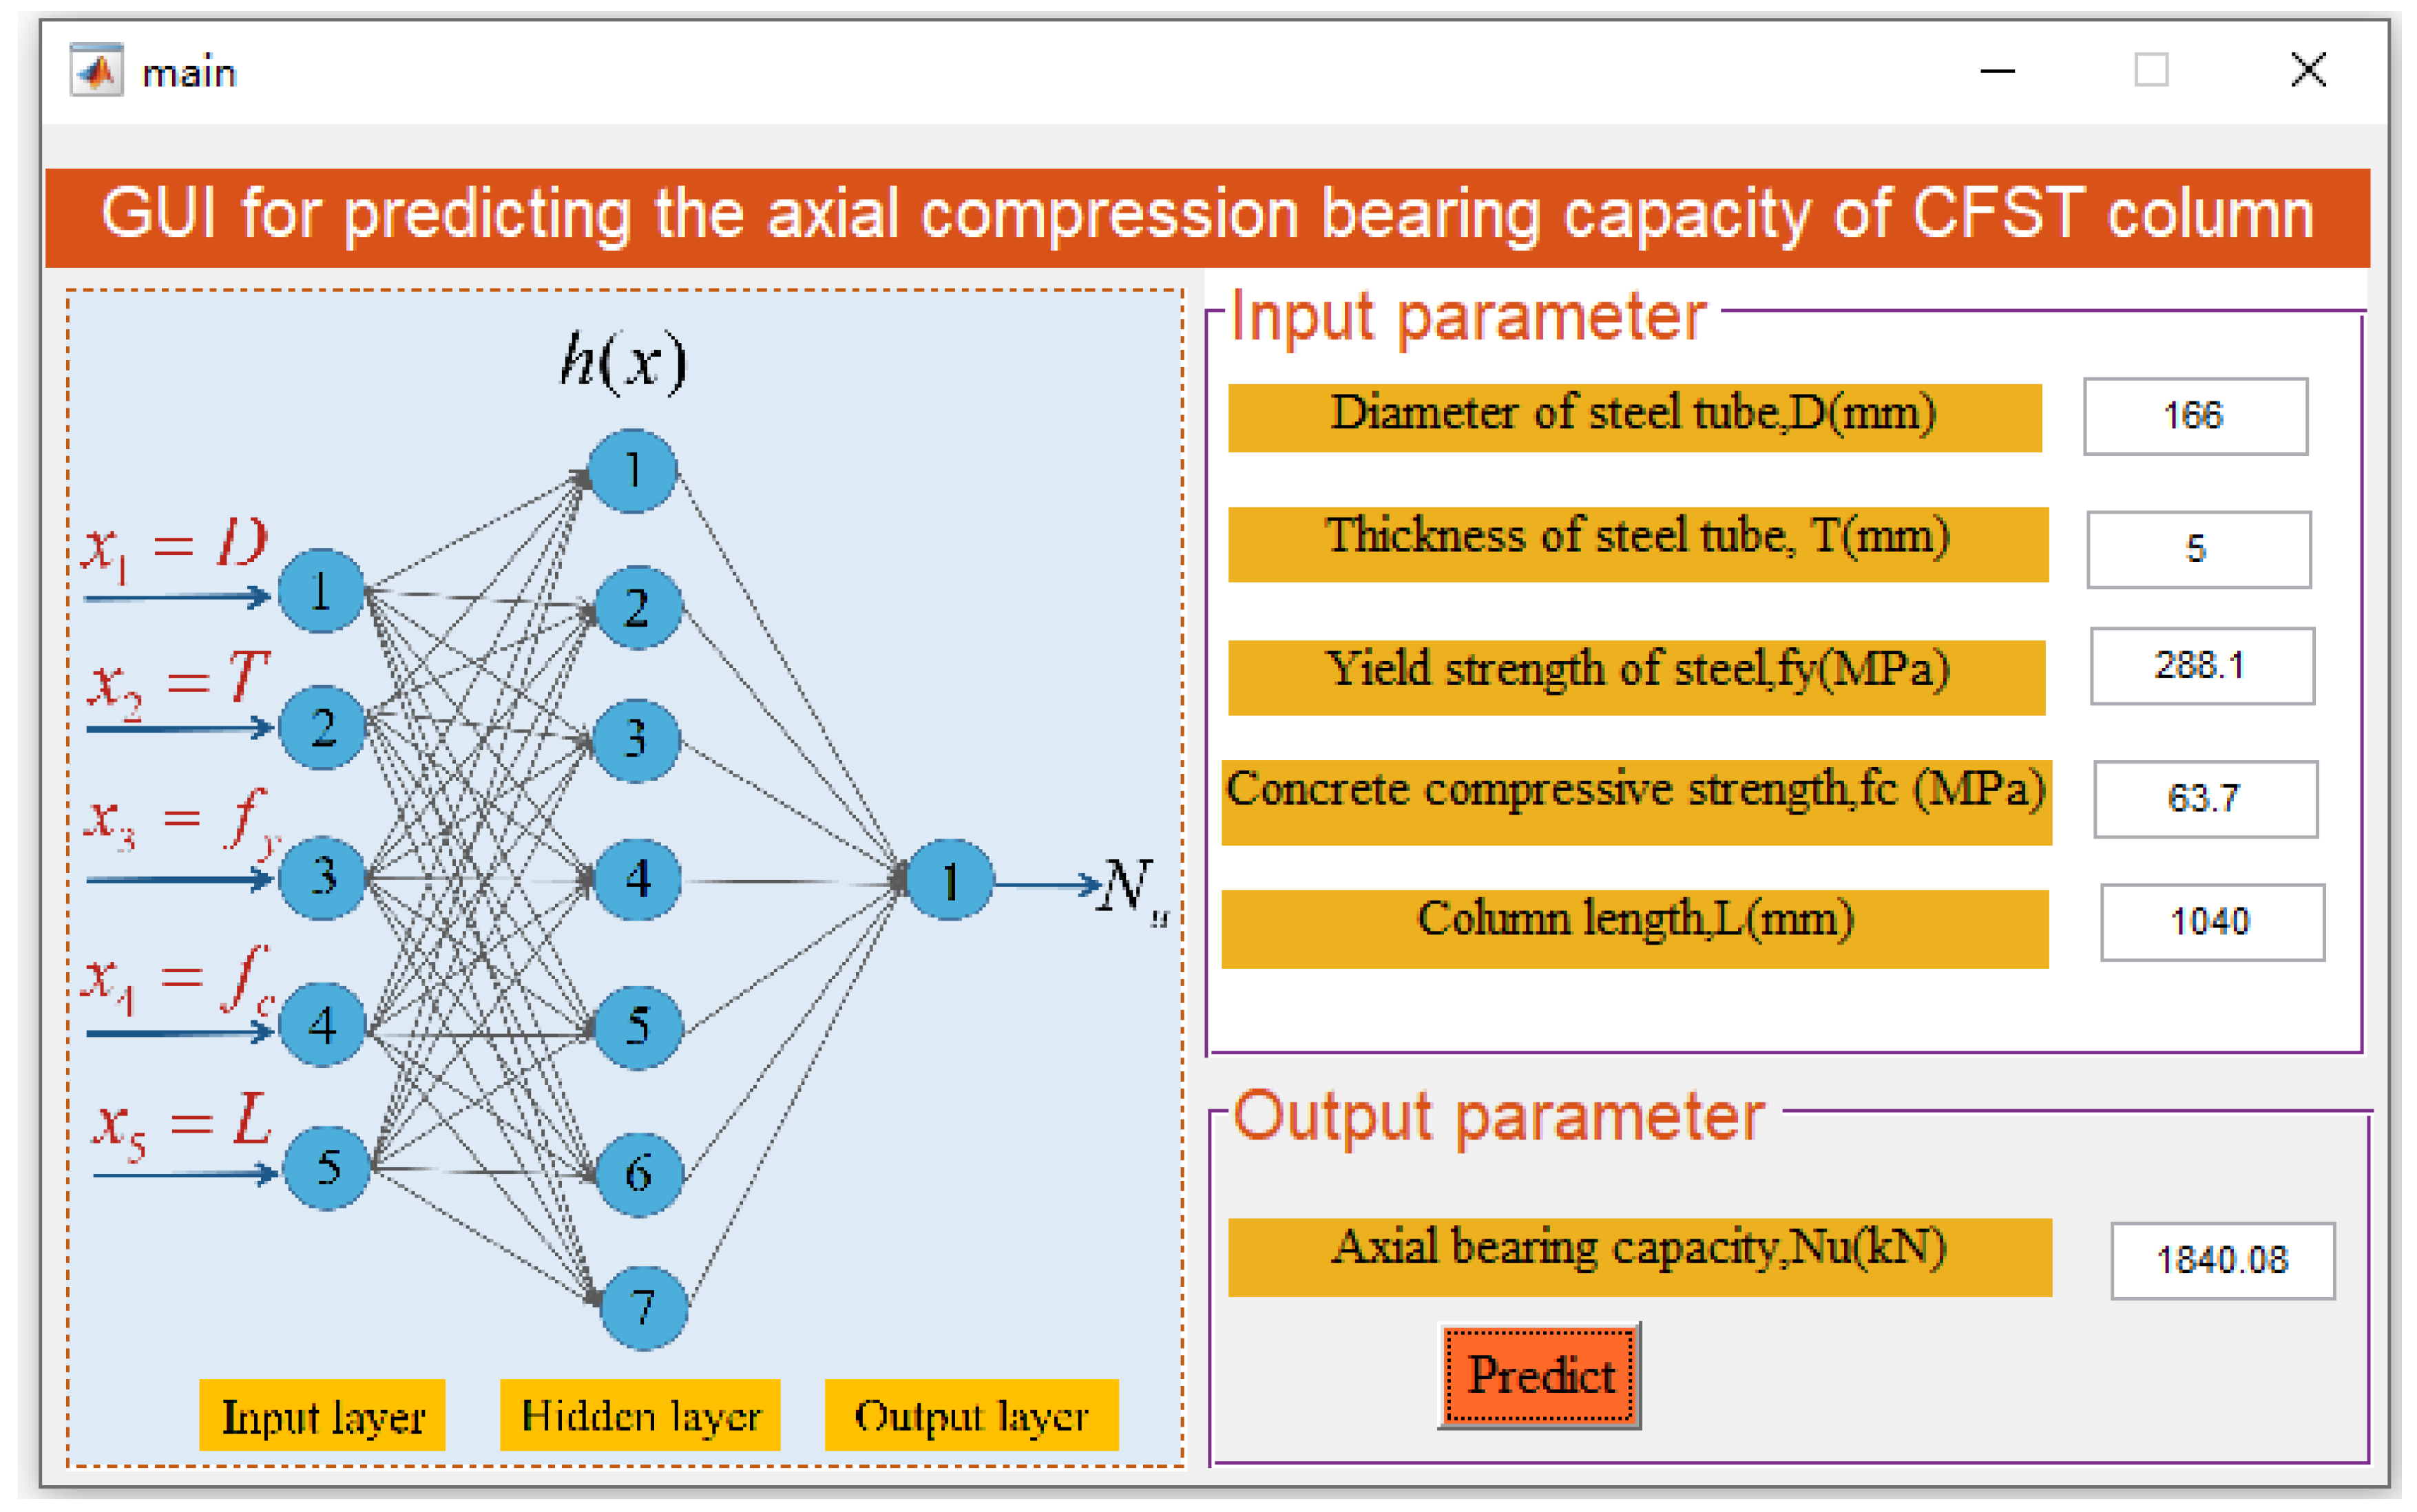
3.4. Development of Interactive Graphical User Interface

Although the PSO-ANN model showed high accuracy and good performance in predicting the axial compression bearing capacity of CCFST columns, it is not convenient for use by structural designers, who prefer to use well-developed software when implementing operations. For this reason, we developed a GUI to help users automatically output and display the results under variable inputs. As shown in Figure 9, the computer software encourages the user to manually enter the required five parameters. Finally, the axial compression bearing capacity of CCFST columns is directly displayed by clicking on the Predict button.

4. Influence of Design Parameters on Axial Bearing Capacity

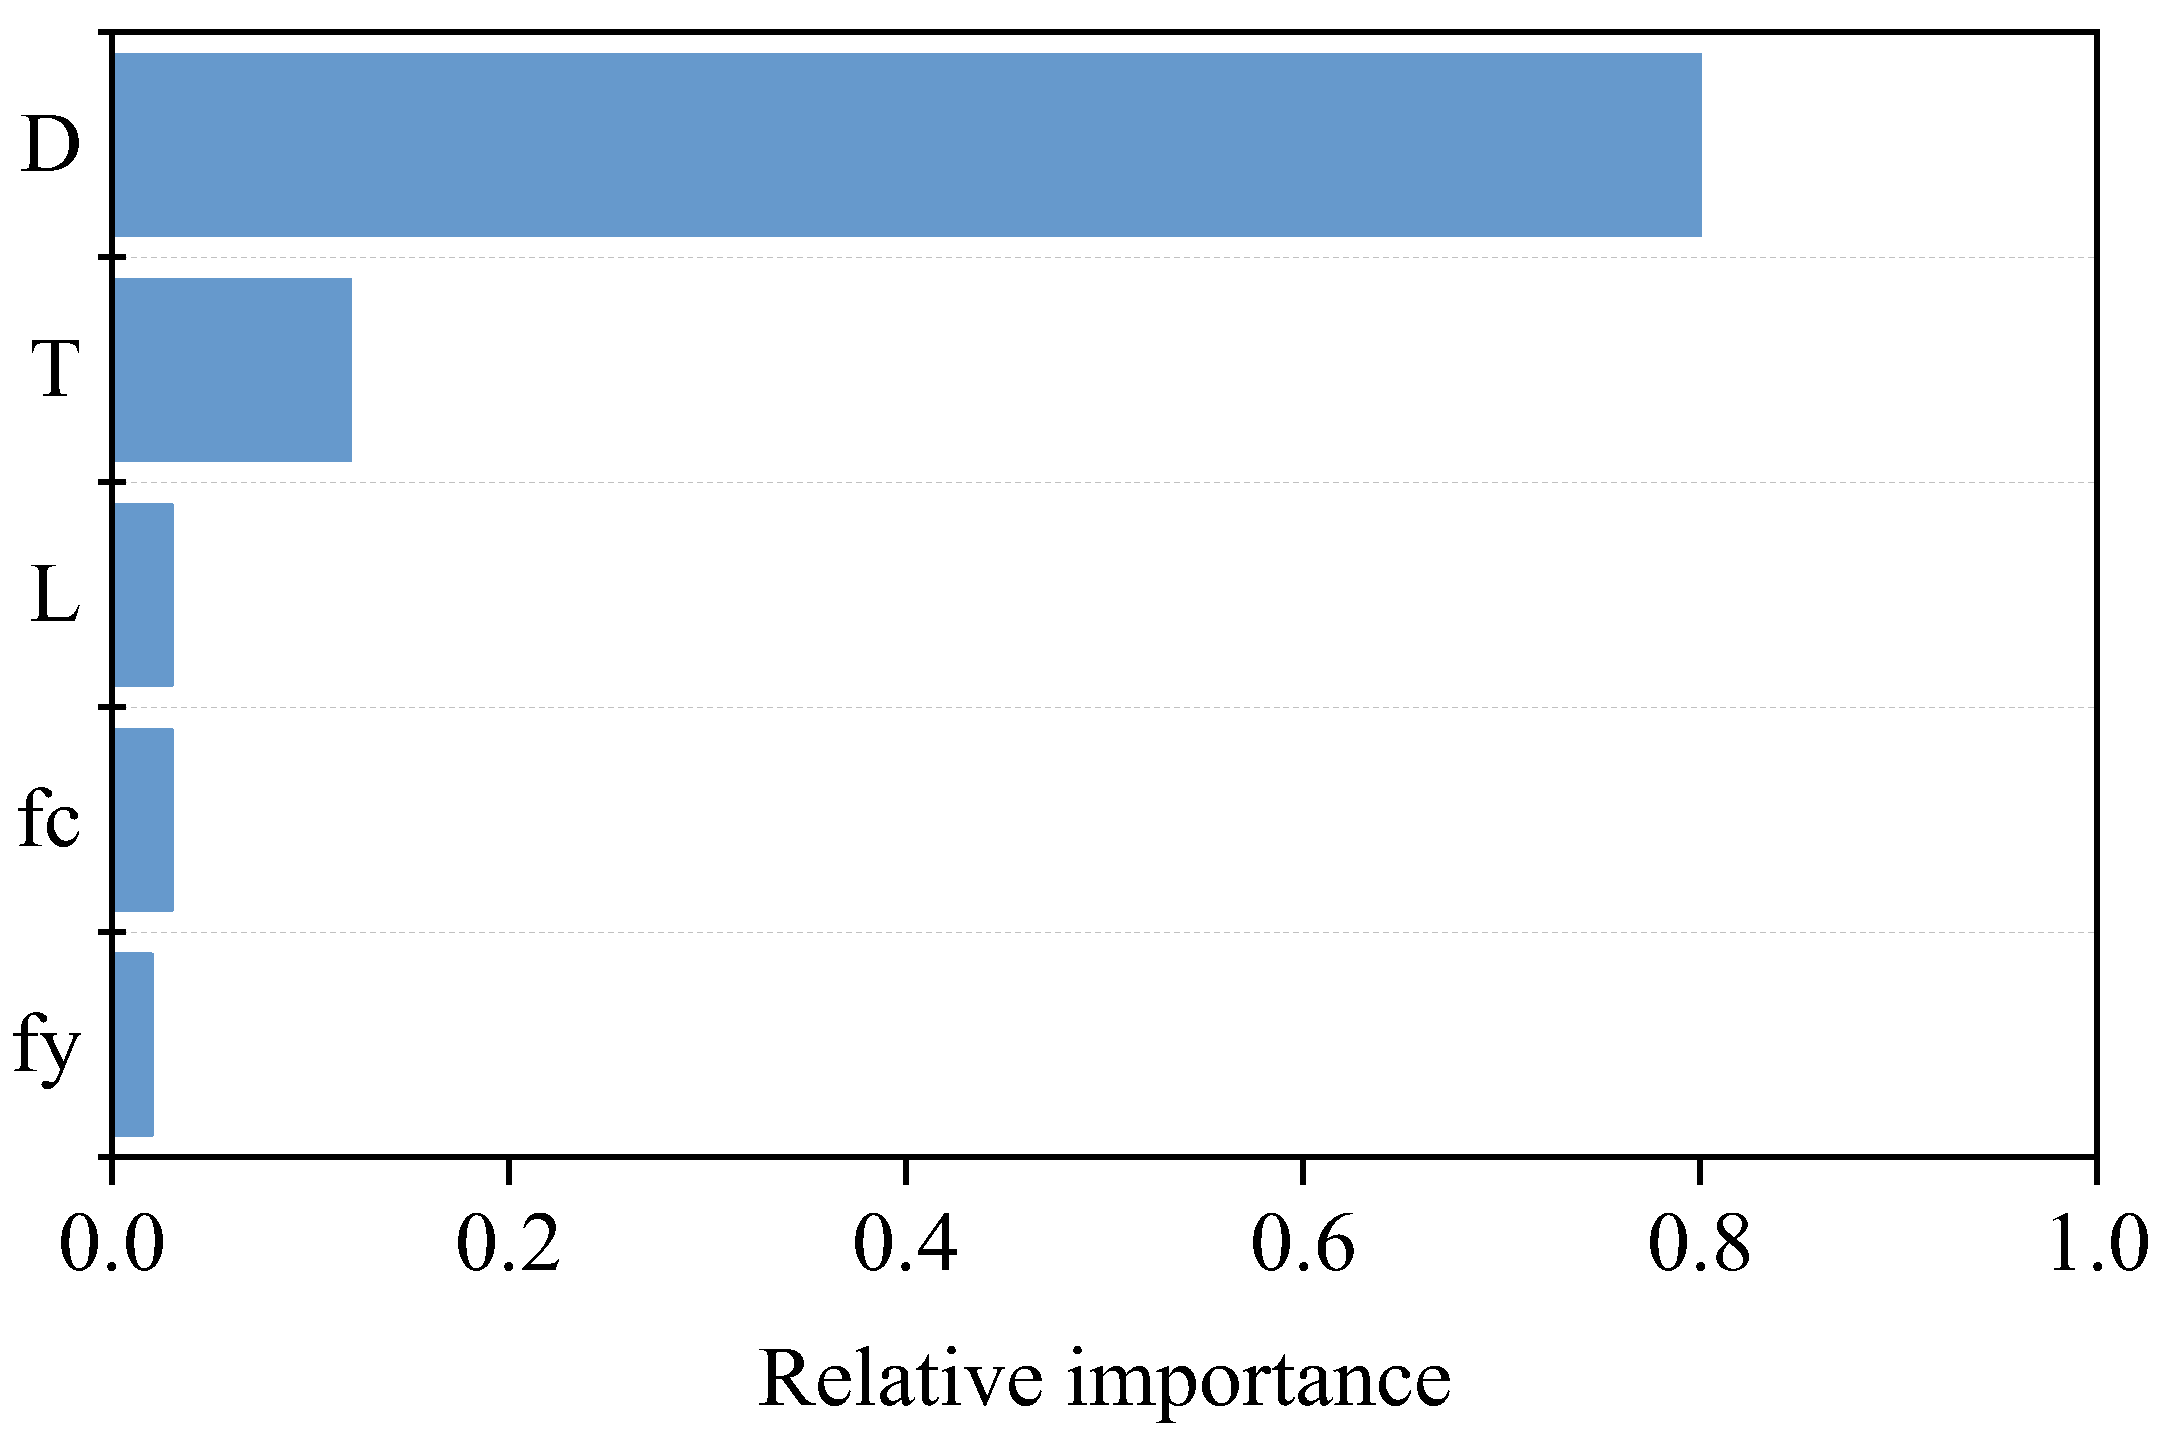
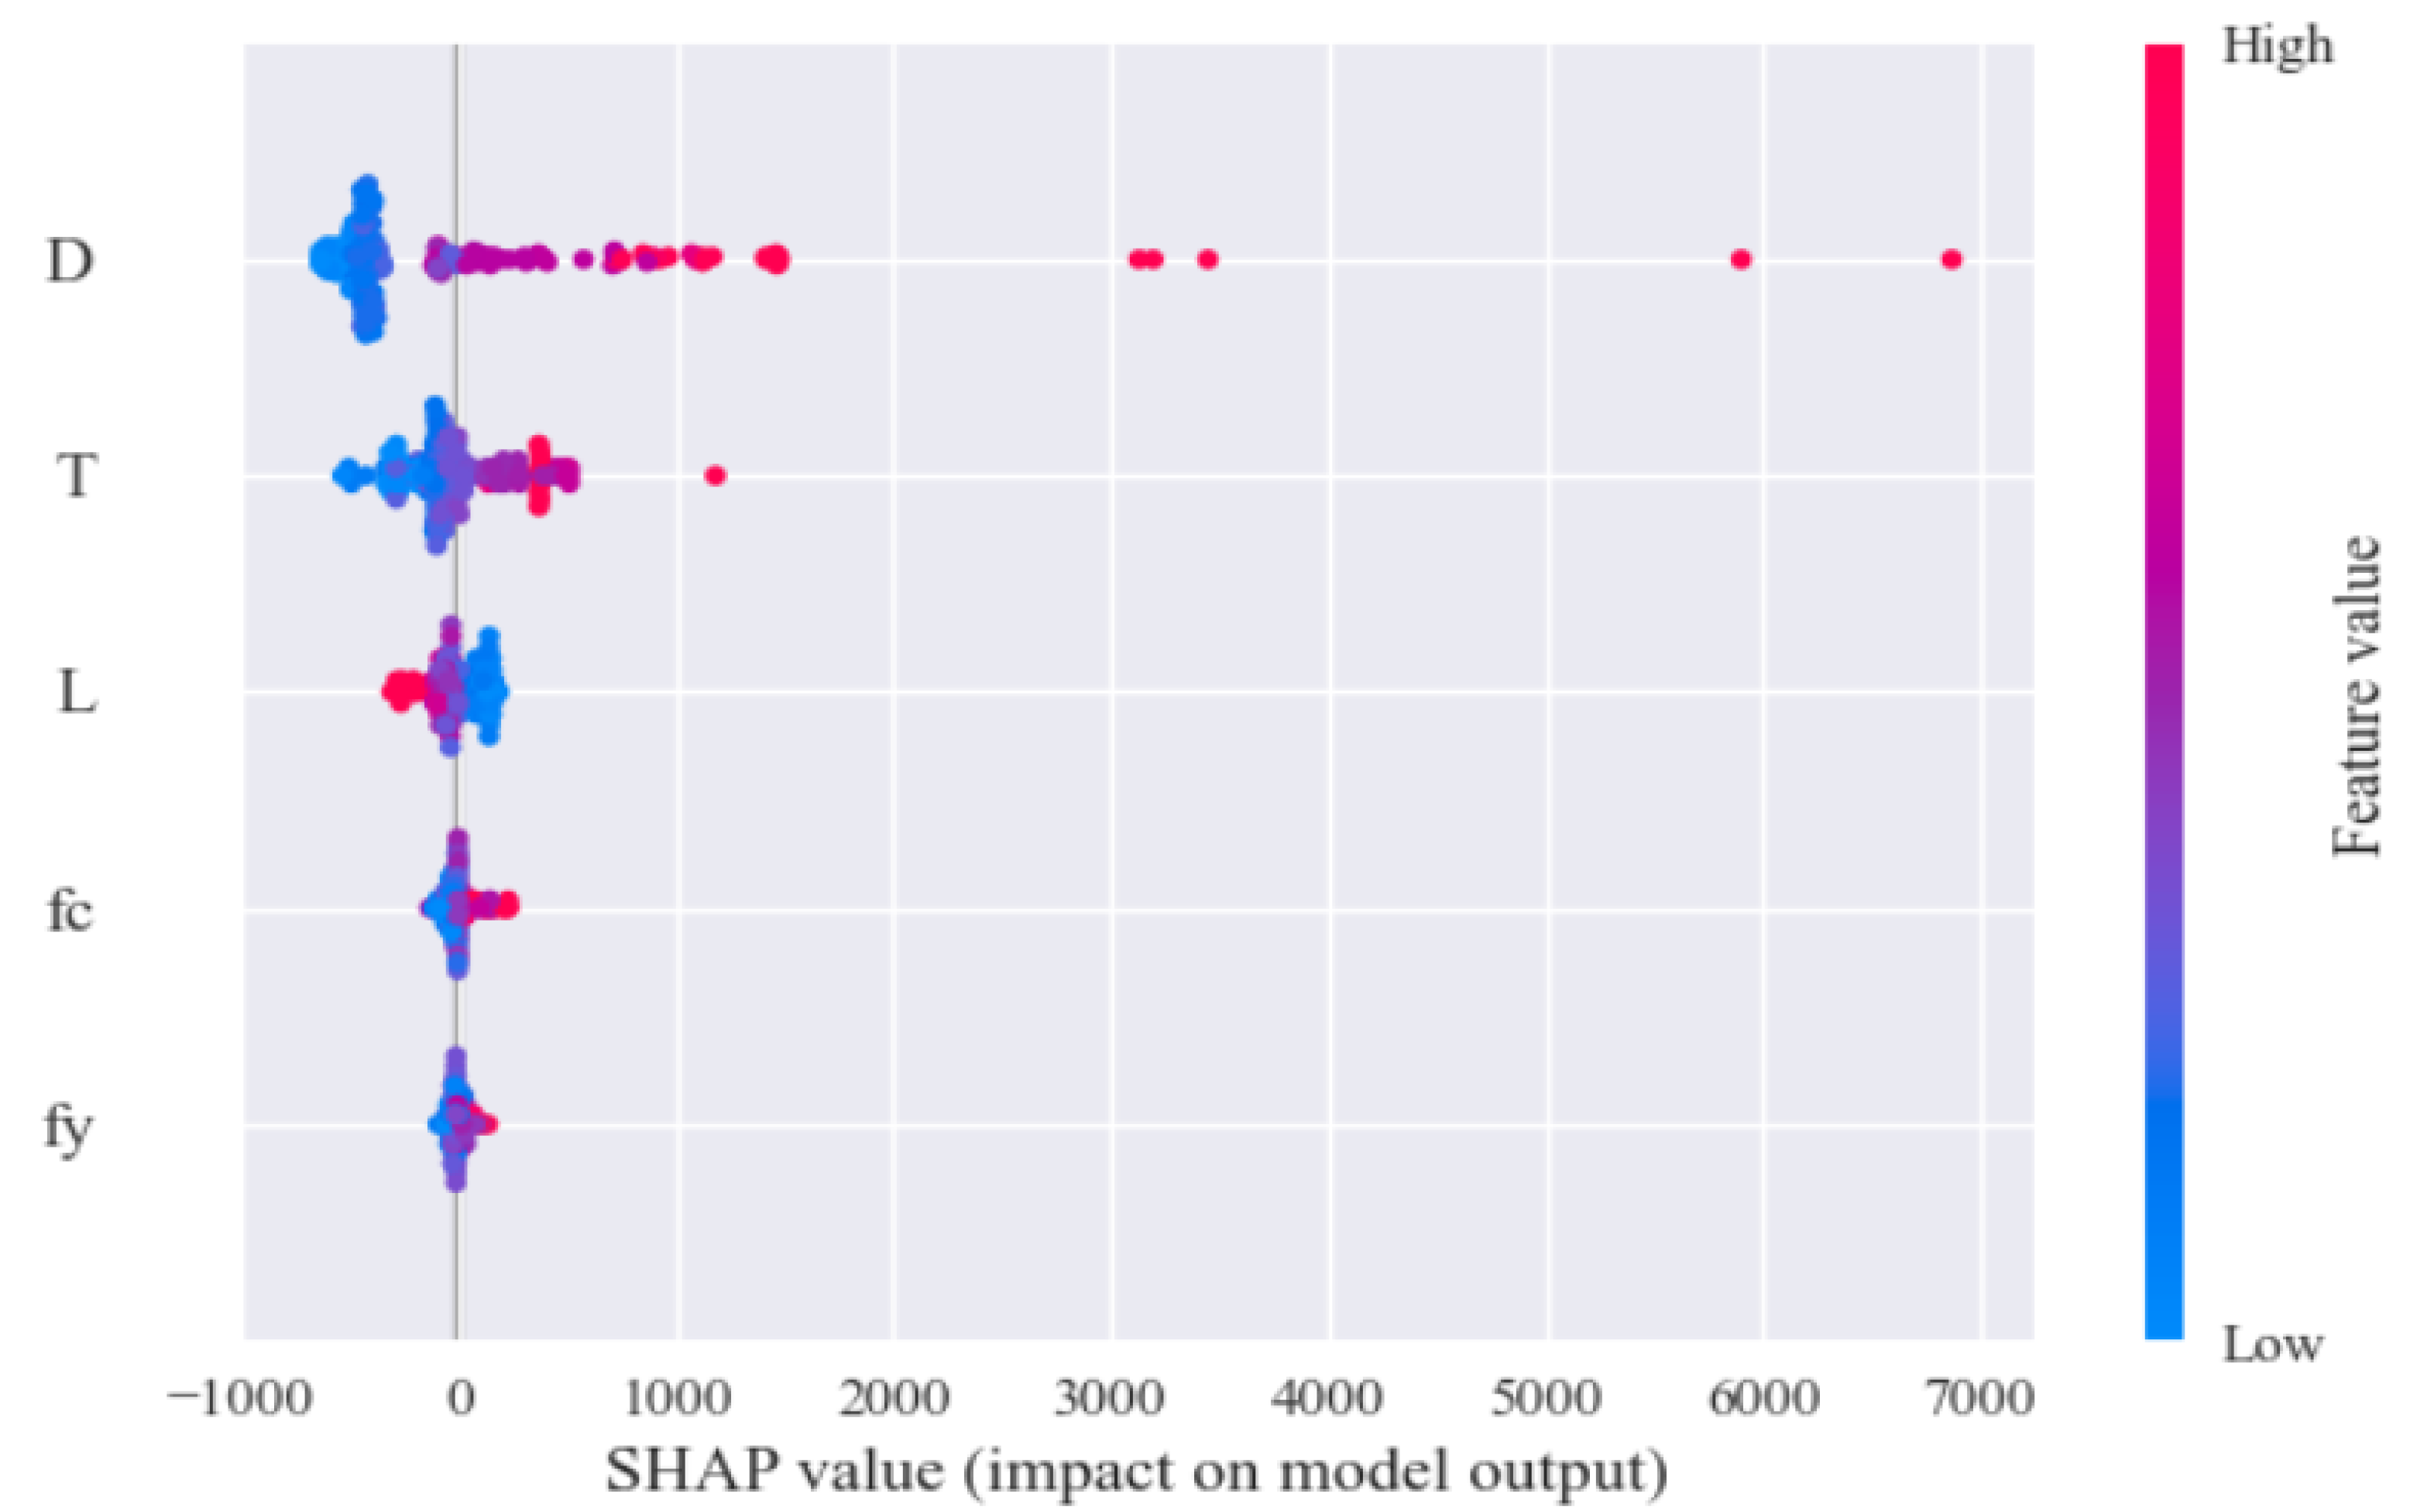
4.1. SHAP-Based Importance Factor Identification

The results in Section 3 show that for a given combination of design parameters, the machine learning model can automatically predict the axial carrying capacity with high accuracy. However, understanding the effect of each design parameter on the axial capacity of CCFST is of great significance for the design of the CCFST column; thus, it is necessary to investigate the effect of each input variable on the output results. For this purpose, the Shapley additive explanation (SHAP) method is introduced in this section to analyze the importance and contribution of each variable to the output results. As a game theory-based approach, the output model is constructed as a linear addition of the input variables in SHAP, which identifies whether the input variables contribute positively or negatively to each prediction [48,49]. The explanatory model g(x′) of the original model f(x) can be expressed as follows [50].
f ( x ) = g ( x ) = φ 0 + i = 1 8 φ i x i
where x is the original input, and there is a mapping function x = h x ( x ) between x and x′; φ0 indicates the constant value when all inputs are missing.
The global importance factors for the eight input variables are shown in Figure 10, and it is worth noting that the important factors here represent the average of the absolute Shapley values for each feature across the sample data. From Figure 10, it can be observed that diameter is the most important input variable, followed closely by thickness, length, compressive strength, and yield strength. Furthermore, the positive or negative impact of each input variable on the output results can be explored through the SHAP summary plot as shown in Figure 11.
As shown in Figure 11, each point represents the Shapley value for a particular input. As can be seen in Figure 11, the axial load carrying capacity increases with the increase of diameter (D), thickness (T), fc, and fy. Conversely, length (L) has a negative effect on the output results, with an increase in column length reducing the axial load capacity.

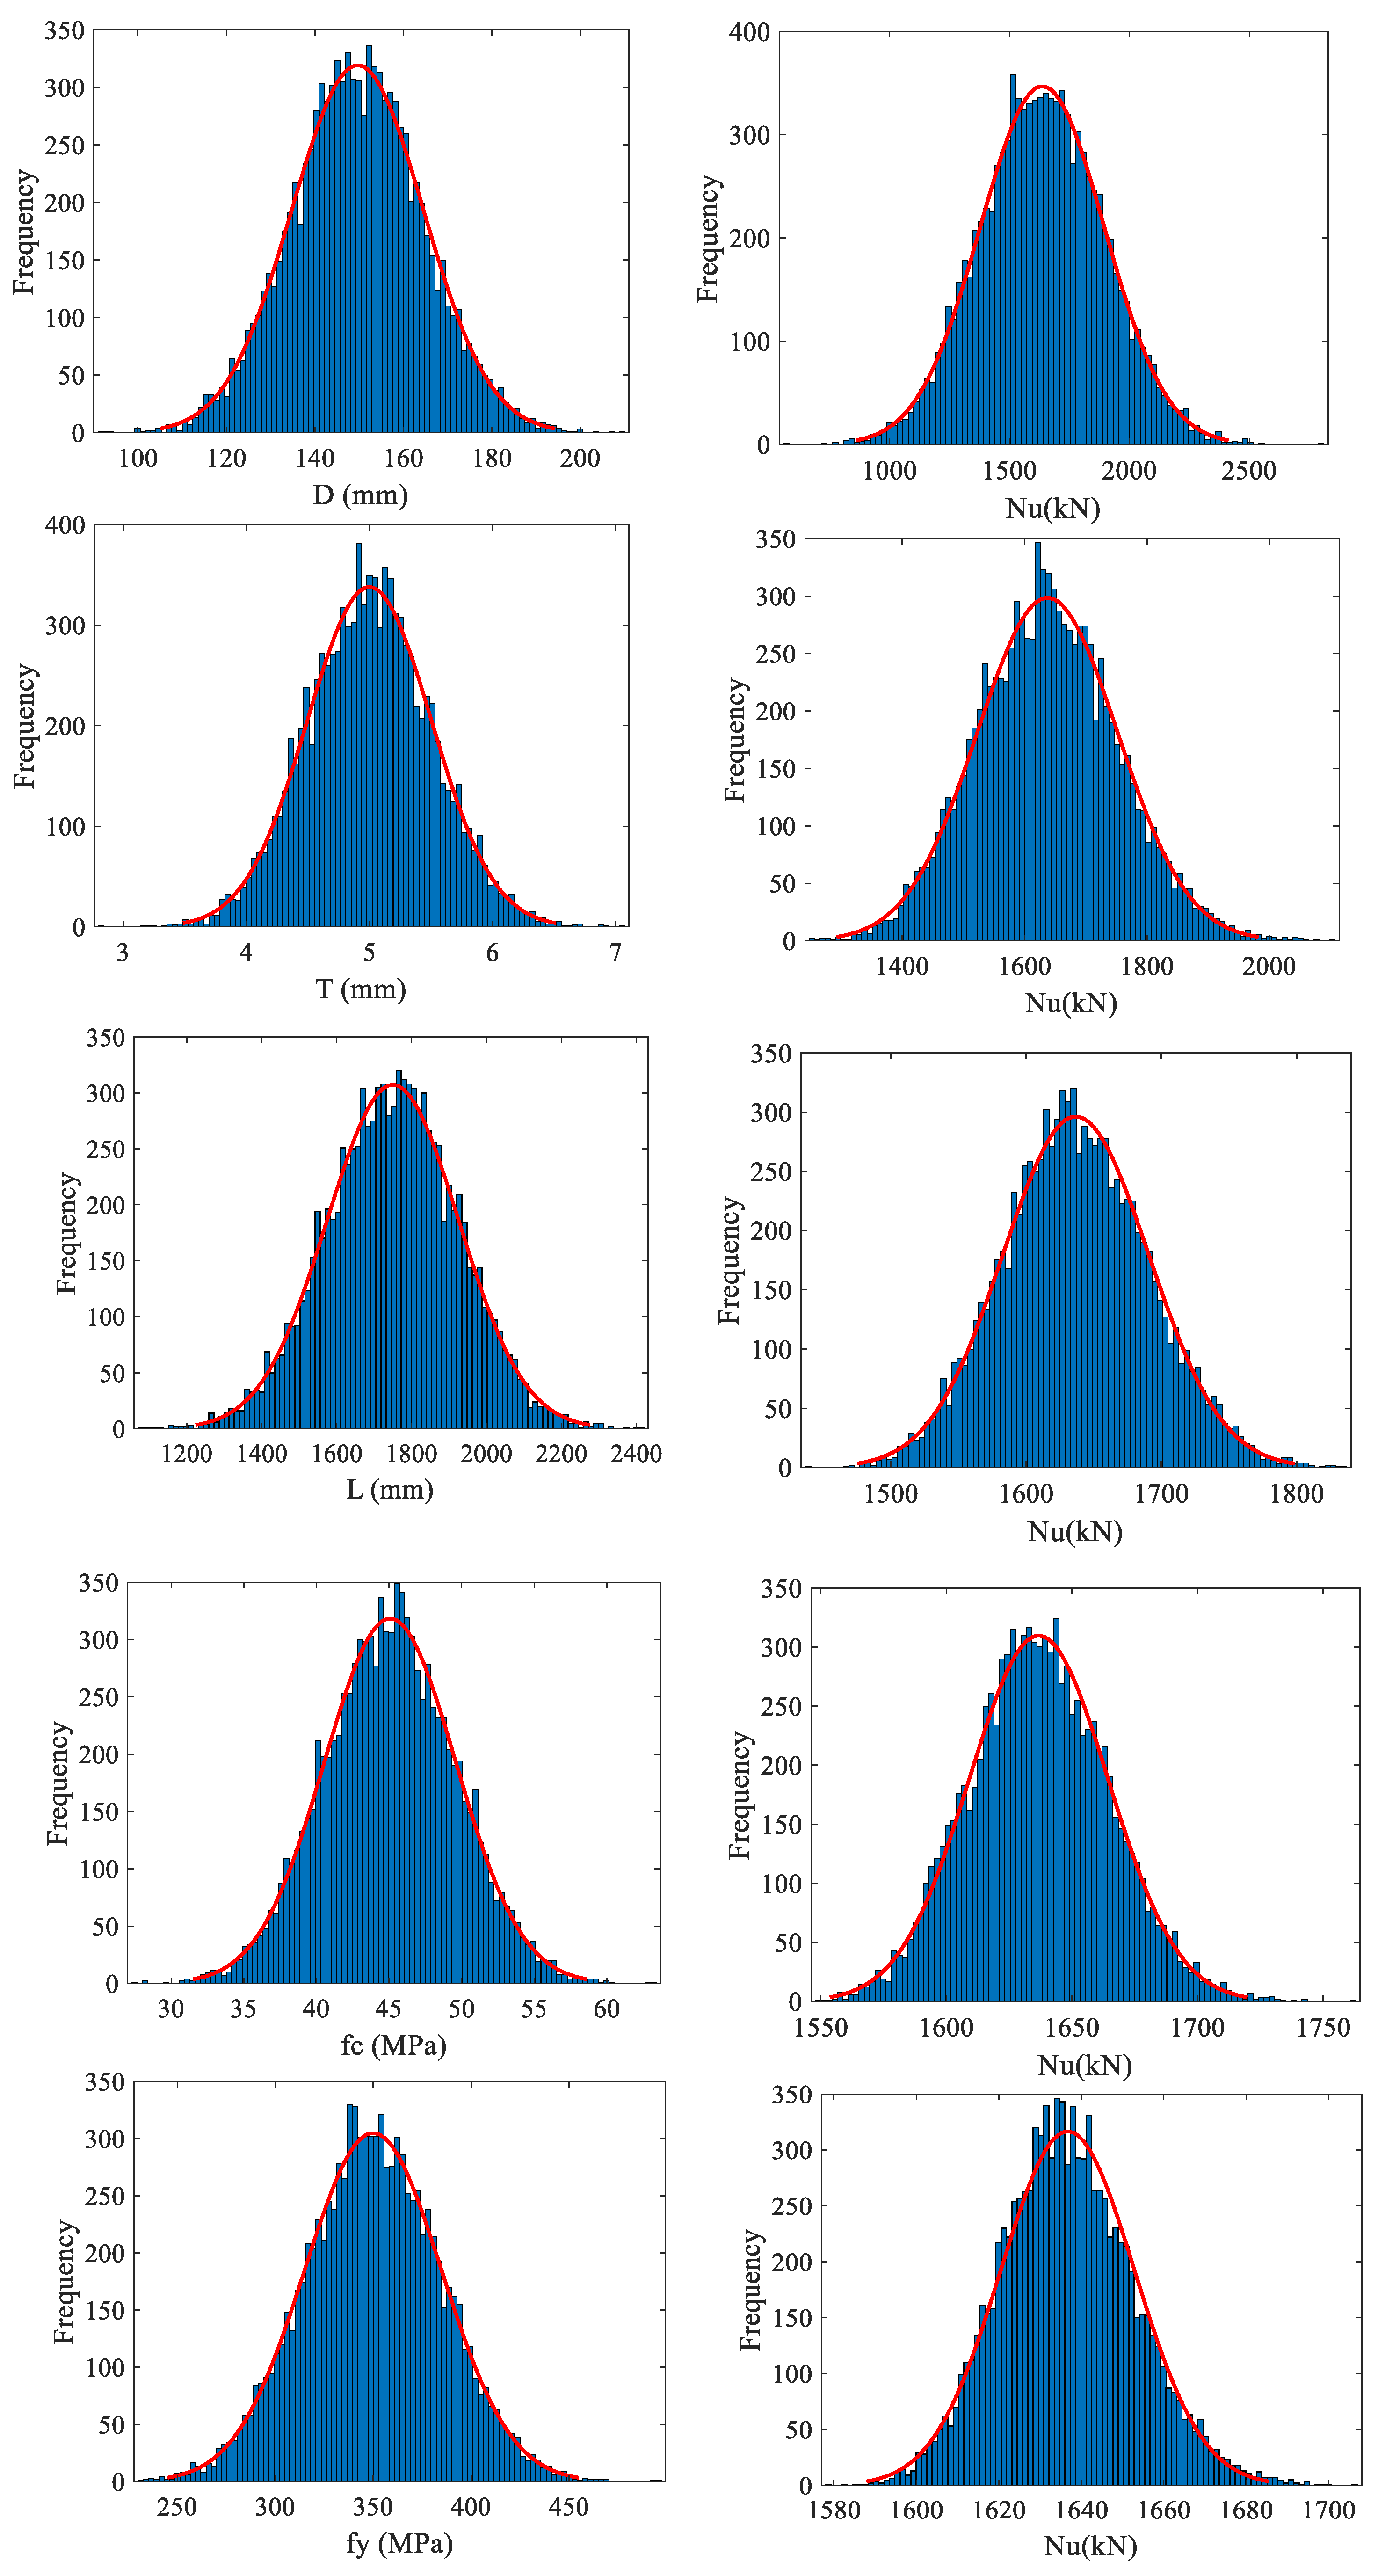
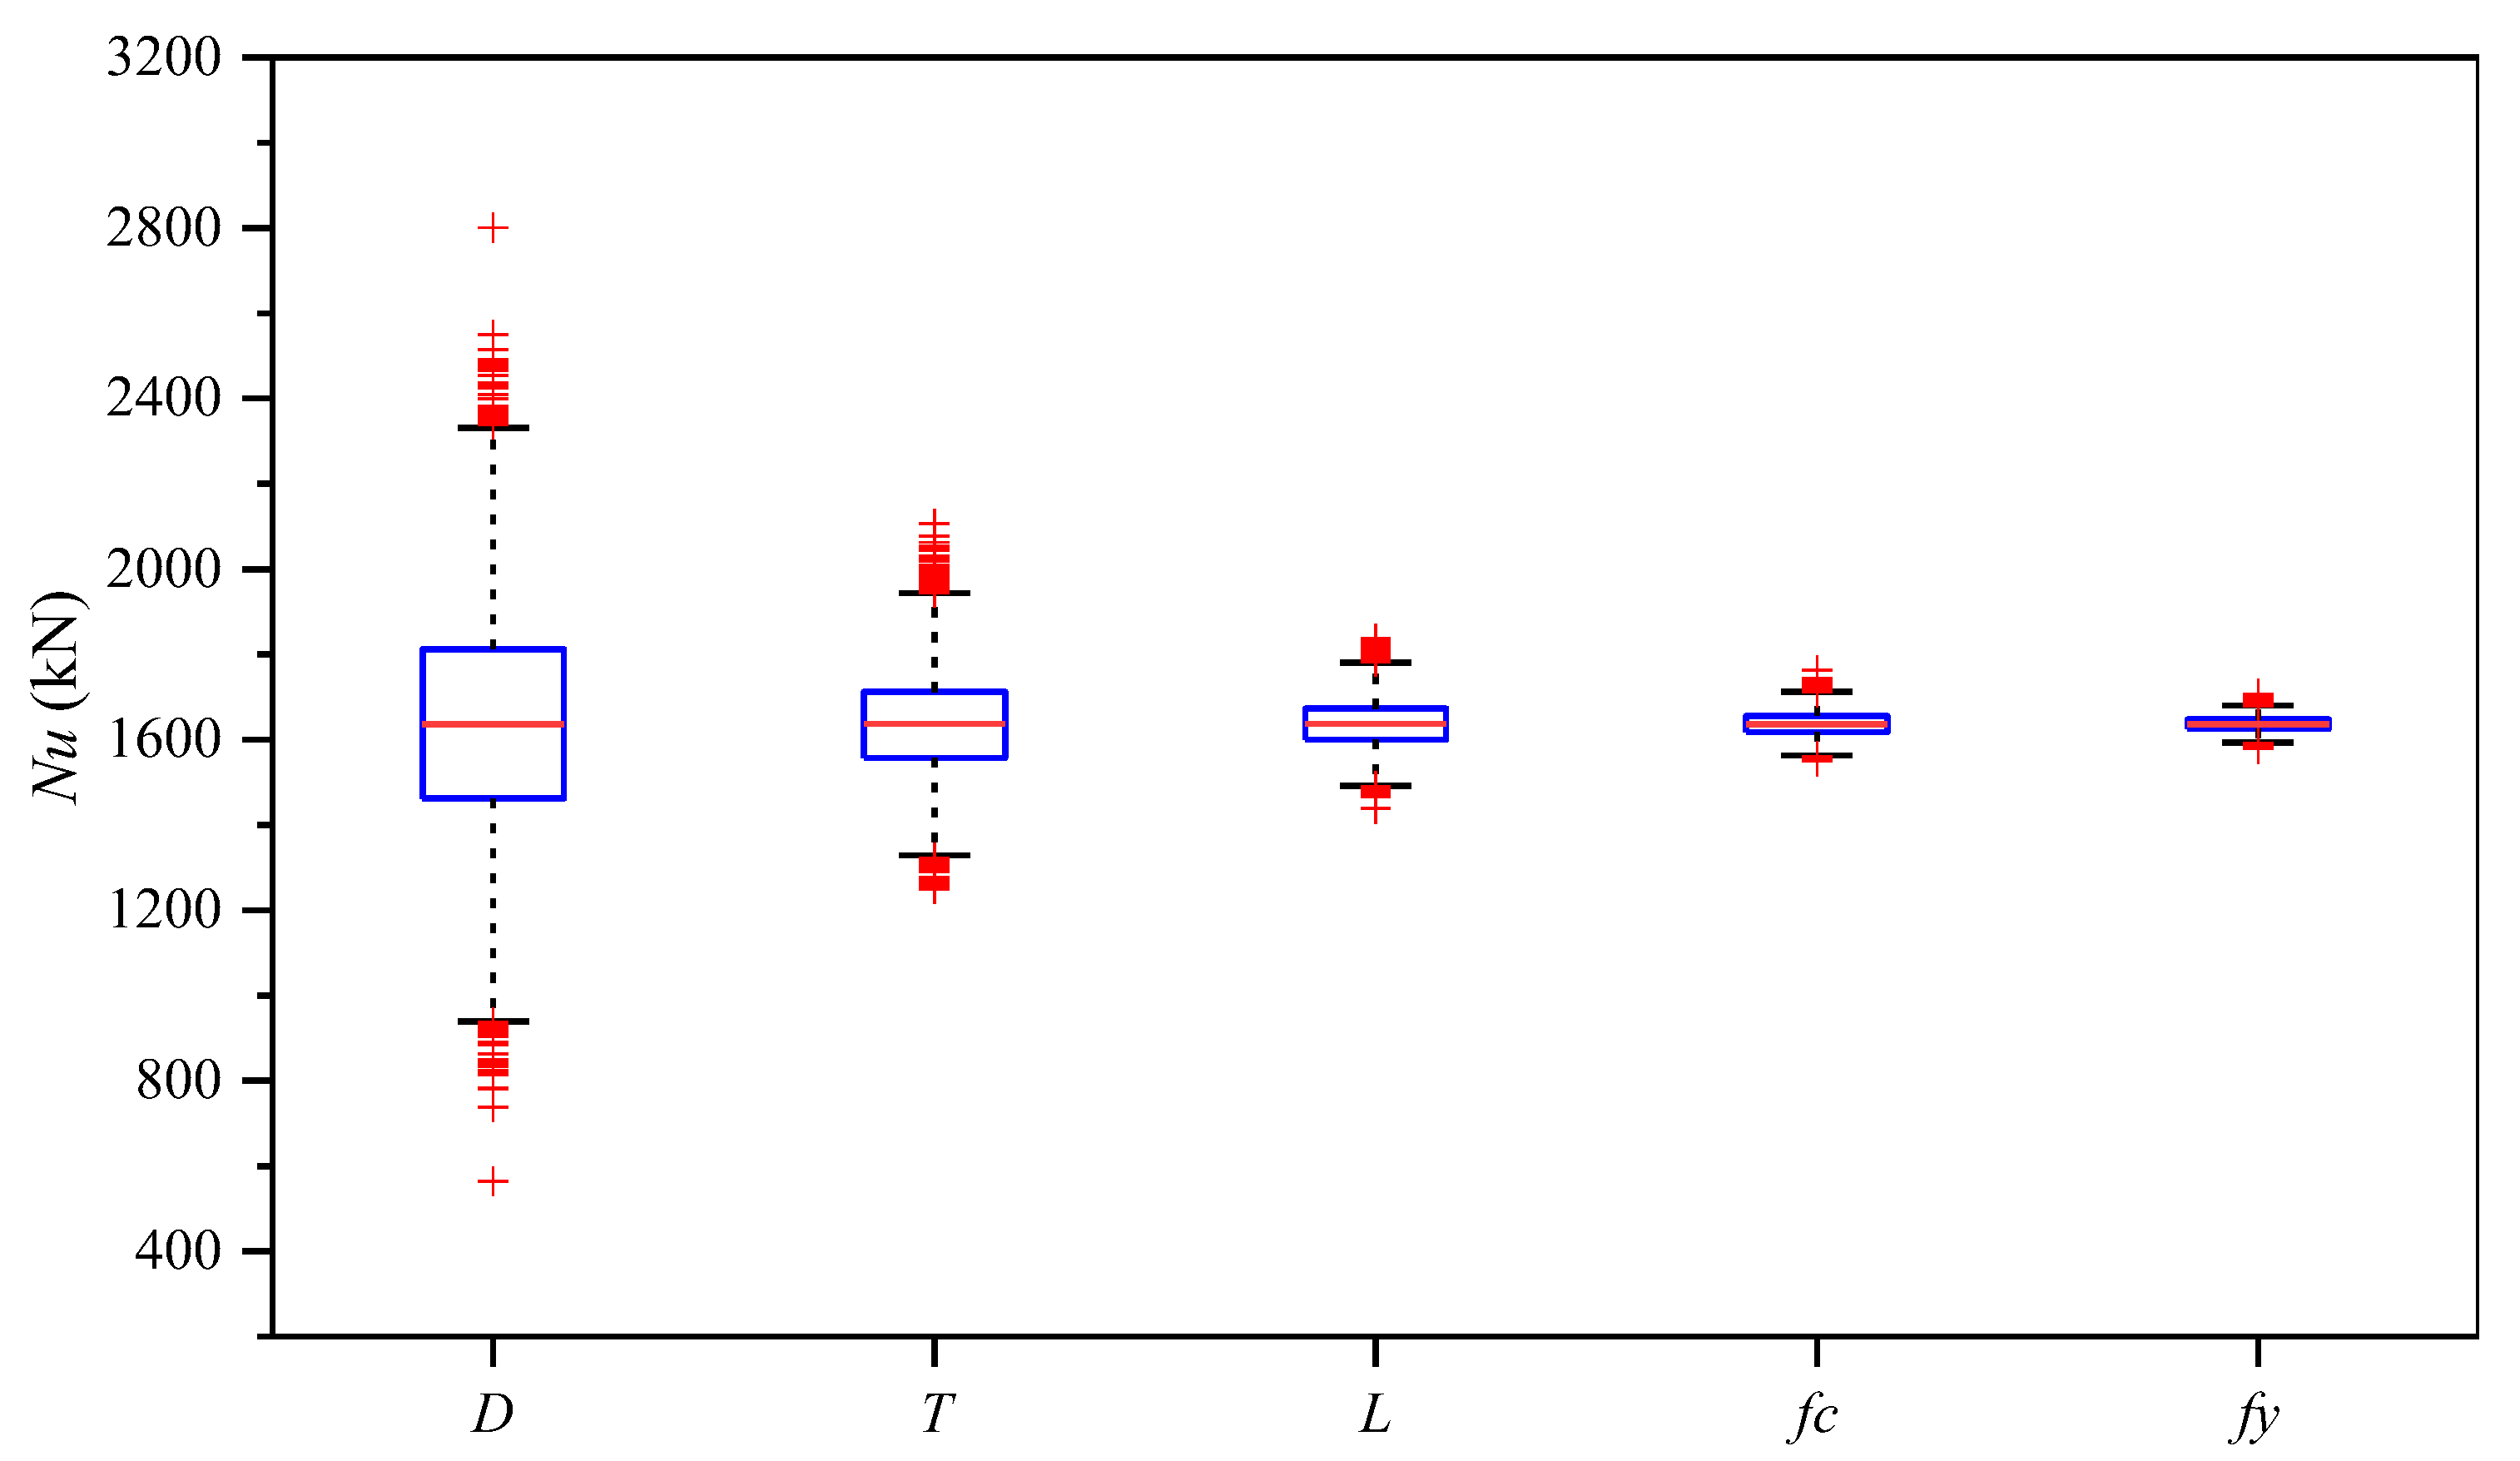
4.2. Quantification of the Influence Degree of Design Parameters on Bearing Capacity

SHAP-based studies qualitatively demonstrate the effect of each parameter on the output and the interrelationship between the input parameters but fail to quantify the extent of this effect. The random change of each parameter will have some effect on the axial compression load capacity. Moreover, in a stochastic environmental setting, there are almost no deterministic values for the content of these components [51]. To quantify this effect, a sensitivity analysis of the parameters is performed. Firstly, random numbers were used to simulate the experimental data according to the characteristics of the data set in Section 2, and the data requirements are shown in Table 3.
To study the variation in axial compression bearing capacity caused by the variation of a single variable, a normally distributed random sample with a coefficient of variation of 10% was generated for each parameter by referring to relevant studies by other scholars [40,51]. The distribution of each parameter sample with its corresponding axial compression bearing capacity variation is shown in Figure 12. It can be seen from Figure 13 that the random fluctuations of D and T are most likely to cause fluctuations in the axial bearing capacity. The coefficients of variation of the axial compression bearing capacity due to fluctuations of the five design parameters are 15.81%, 7.01%, 3.29%, 1.69%, and 0.99%, respectively. These results indicate that the diameter is the dominant factor in the variation of the axial compression bearing capacity, and the variation of diameter causes the variation of bearing capacity (15.81%) beyond the variation of diameter (10%). The coefficient of variation of the bearing capacity caused by the fluctuation of the other four parameters is less than 10%. The quantitative analysis of these variation coefficients is significant for guiding the design and construction of the CCFST column. It is worth mentioning that these quantitative indicators are obtained from the axial bearing capacity analysis under the current data set with the mean value of the parameters as the determined values of the configuration parameter for the stochastic environment. When the data set or the determination value of the configuration parameter is changed, the degree of variation of the bearing capacity caused by any one parameter under the same random degree may be different, but the ranking of the parameters causes the degree of variation of the axial bearing capacity should be the same.

5. Conclusions

In this work, a hybrid PSO-ANN model was employed for the prediction of the axial bearing capacity of CCFST columns, and a SHAP-based parametric sensitivity analysis was performed. The main conclusions are summarized as follows.
(1)
The PSO-ANN model can accurately capture the nonlinear relationship between the five input parameters and the axial bearing capacity of CCFST columns with a correlation coefficient of 0.99 for both training and test sets.
(2)
The prediction performance of the PSO-ANN model proposed is superior to that of the EC4 and original ANN model with regard to the R, MAE, RMSE, and MSE.
(3)
A GUI using MATLAB was developed tentatively to achieve automatic output and display of the axial bearing capacity of CCFST columns under manual keying of input variables, which could help structural designers in determining some initial estimates of the outcomes before performing any extensive laboratory or fieldwork.
(4)
Among the five design parameters affecting the bearing capacity of the CCFST column, diameter is the dominant factor, followed by steel tube thickness, length, compressive strength of concrete, and yield strength of steel. Except for the length, the increase of the other four parameters plays a positive role in the axial capacity, and the fluctuation of diameter in a random environment can lead to the variation of bearing capacity beyond its own variation range.
(5)
The research in this paper can assist or partially replace laboratory compression experiments of CCFST columns to achieve time and cost savings, and it can also be used as a convenient and reliable candidate for decision-making in the field of CCFST column construction and design.

Author Contributions

X.L.: Writing—review & editing, Data curation, Software; Y.W.: Methodology, Formal analysis, Writing—original draft; Y.Z.: Resources, Validation. All authors have read and agreed to the published version of the manuscript.

Funding

This research received no external funding.

Institutional Review Board Statement

Not applicable.

Informed Consent Statement

Not applicable.

Data Availability Statement

Not applicable.

Conflicts of Interest

The authors declare that they have no known competing financial interest or personal relationship that could have appeared to influence the work reported in this paper.

References

  1. Lee, H.J.; Park, H.G.; Choi, I.R. Compression loading test for concrete-filled tubular columns with high-strength steel slender section. J. Constr. Steel Res. 2019, 159, 507–520. [Google Scholar] [CrossRef]
  2. Huang, Z.C.; Li, D.X.; Uy, B.; Thai, H.T.; Hou, C. Local and post-local buckling of fabricated high-strength steel and composite columns. J. Constr. Steel Res. 2019, 154, 235–249. [Google Scholar] [CrossRef]
  3. Du, Y.; Zhang, Y.; Chen, Z.; Yan, J.-B.; Zheng, Z. Axial compressive performance of CFRP confined rectangular CFST columns using high-strength materials with moderate slenderness. Constr. Build. Mater. 2021, 299, 123912. [Google Scholar] [CrossRef]
  4. Chen, D.D.; Montano, V.; Huo, L.S.; Song, G.B. Depth detection of subsurface voids in concrete-filled steel tubular (CFST) structure using percussion and decision tree. Measurement 2020, 163, 107869. [Google Scholar] [CrossRef]
  5. Zhou, J.; Fang, X.D.; Jiang, Y. Cyclic behavior of concrete-encased high-strength concrete-filled steel tube composite walls: An experiment. Struct. Concr. 2021, 22, 691–708. [Google Scholar] [CrossRef]
  6. Kang, W.H.; Uy, B.; Tao, Z.; Hicks, S. Design strength of concrete-filled steel columns. Adv. Steel Constr. 2014, 11, 20. [Google Scholar]
  7. Wang, Z.-B.; Tao, Z.; Han, L.-H.; Uy, B.; Lam, D.; Kang, W.-H. Strength, stiffness and ductility of concrete-filled steel columns under axial compression. Eng. Struct. 2017, 135, 209–221. [Google Scholar] [CrossRef] [Green Version]
  8. Hou, C.; Han, L.H.; Zhao, X.L. Concrete-filled circular steel tubes subjected to local bearing force: Finite element analysis. Thin Wall Struct. 2014, 77, 109–119. [Google Scholar] [CrossRef]
  9. Tao, Z.; Wang, Z.B.; Yu, Q. Finite element modelling of concrete-filled steel stub columns under axial compression. J. Constr. Steel Res. 2013, 89, 121–131. [Google Scholar] [CrossRef]
  10. Liu, D.L.; Gho, W.M. Axial load behaviour of high-strength rectangular concrete-filled steel tubular stub columns. Thin Wall Struct. 2005, 43, 1131–1142. [Google Scholar] [CrossRef]
  11. Liu, D.L.; Gho, W.M.; Yuan, H. Ultimate capacity of high-strength rectangular concrete-filled steel hollow section stub columns. J. Constr. Steel Res. 2003, 59, 1499–1515. [Google Scholar] [CrossRef]
  12. Han, L.H.; An, Y.F. Performance of concrete-encased CFST stub columns under axial compression. J. Constr. Steel Res. 2014, 93, 62–76. [Google Scholar] [CrossRef]
  13. Lai, M.H.; Ho, J.C.M. Confinement effect of ring-confined concrete-filled-steel-tube columns under uni-axial load. Eng. Struct. 2014, 67, 123–141. [Google Scholar] [CrossRef]
  14. Han, L.H.; He, S.H.; Liao, F.Y. Performance and calculations of concrete filled steel tubes (CFST) under axial tension. J. Constr. Steel Res. 2011, 67, 1699–1709. [Google Scholar] [CrossRef]
  15. Abed, F.; AlHamaydeh, M.; Abdalla, S. Experimental and numerical investigations of the compressive behavior of concrete filled steel tubes (CFSTs). J. Constr. Steel Res. 2013, 80, 429–439. [Google Scholar] [CrossRef]
  16. Han, L.H.; Liu, W.; Yang, Y.F. Behaviour of concrete-filled steel tubular stub columns subjected to axially local compression. J. Constr. Steel Res. 2008, 64, 377–387. [Google Scholar] [CrossRef]
  17. Evirgen, B.; Tuncan, A.; Taskin, K. Structural behavior of concrete filled steel tubular sections (CFT/CFSt) under axial compression. Thin Wall Struct. 2014, 80, 46–56. [Google Scholar] [CrossRef]
  18. Ho, N.X.; Le, T.T. Effects of variability in experimental database on machine-learning-based prediction of ultimate load of circular concrete-filled steel tubes. Measurement 2021, 176, 109198. [Google Scholar] [CrossRef]
  19. Zhai, Q.; Zhang, J.C.; Xiao, J.H.; Du, G.F.; Huang, Y.S. Feasibility of piezoceramic transducer-enabled active sensing for the monitoring cross-shaped concrete filled steel tubular (CCFST) columns under cyclic loading. Measurement 2021, 182, 109646. [Google Scholar] [CrossRef]
  20. Abdalla, S.; Abed, F.; AlHamaydeh, M. Behavior of CFSTs and CCFSTs under quasi-static axial compression. J. Constr. Steel Res. 2013, 90, 235–244. [Google Scholar] [CrossRef]
  21. Shen, Q.; Wang, J.; Wang, J.; Ding, Z. Axial compressive performance of circular CFST columns partially wrapped by carbon FRP. J. Constr. Steel Res. 2019, 155, 90–106. [Google Scholar] [CrossRef]
  22. Gupta, A.; Mohan, R.; Bisht, H.; Sharma, A. Experimental testing and numerical modelling of CFST columns under axial compressive load. Asian J. Civ. Eng. 2022, 23, 415–424. [Google Scholar] [CrossRef]
  23. Dai, X.H.; Lam, D.; Jamaluddin, N.; Ye, J. Numerical analysis of slender elliptical concrete filled columns under axial compression. Thin Wall Struct. 2014, 77, 26–35. [Google Scholar] [CrossRef]
  24. Ahmadi, M.; Naderpour, H.; Kheyroddin, A. ANN Model for Predicting the Compressive Strength of Circular Steel-Confined Concrete. Int. J. Civ. Eng. 2017, 15, 213–221. [Google Scholar] [CrossRef]
  25. Jayalekshmi, S.; Jegadesh, J.S.S.; Goel, A. Empirical Approach for Determining Axial Strength of Circular Concrete Filled Steel Tubular Columns. J. Inst. Eng. Ser. A 2018, 99, 257–268. [Google Scholar] [CrossRef]
  26. Guneyisi, E.M.; Gultekin, A.; Mermerdas, K. Ultimate capacity prediction of axially loaded CFST short columns. Int. J. Steel Struct. 2016, 16, 99–114. [Google Scholar] [CrossRef]
  27. Mansouri, I.; Chacon, R.; Hu, J.W. Improved predictive model to the cross-sectional resistance of CFT. J. Mech. Sci. Technol. 2017, 31, 3887–3895. [Google Scholar] [CrossRef] [Green Version]
  28. Moon, J.; Kim, J.J.; Lee, T.H.; Lee, H.E. Prediction of axial load capacity of stub circular concrete-filled steel tube using fuzzy logic. J. Constr. Steel Res. 2014, 101, 184–191. [Google Scholar] [CrossRef]
  29. Shapiro, A.F. The merging of neural networks, fuzzy logic, and genetic algorithms. Insur. Math. Econ. 2002, 31, 115–131. [Google Scholar] [CrossRef]
  30. Lyu, F.; Fan, X.Y.; Ding, F.X.; Chen, Z.W. Prediction of the axial compressive strength of circular concrete-filled steel tube columns using sine cosine algorithm-support vector regression. Compos. Struct. 2021, 273, 114282. [Google Scholar] [CrossRef]
  31. Sarir, P.; Shen, S.L.; Wang, Z.F.; Chen, J.; Horpibulsuk, S.; Pham, B.T. Optimum model for bearing capacity of concrete-steel columns with AI technology via incorporating the algorithms of IWO and ABC. Eng. Comput. 2021, 37, 797–807. [Google Scholar] [CrossRef]
  32. Pham, B.T.; Jaafari, A.; Prakash, I.; Bui, D.T. A novel hybrid intelligent model of support vector machines and the MultiBoost ensemble for landslide susceptibility modeling. Bull. Eng. Geol. Environ. 2019, 78, 2865–2886. [Google Scholar] [CrossRef]
  33. Ly, H.-B.; Le, L.M.; Phi, L.V.; Phan, V.-H.; Tran, V.Q.; Pham, B.T.; Le, T.-T.; Derrible, S. Development of an AI Model to Measure Traffic Air Pollution from Multisensor and Weather Data. Sensors 2019, 19, 4941. [Google Scholar] [CrossRef] [PubMed] [Green Version]
  34. Feng, J.Y.; Yuan, B.Y.; Li, X.; Tian, D.; Mu, W.S. Evaluation on risks of sustainable supply chain based on optimized BP neural networks in fresh grape industry. Comput. Electron. Agr. 2021, 183, 105988. [Google Scholar]
  35. Ben Chaabene, W.; Flah, M.; Nehdi, M.L. Machine learning prediction of mechanical properties of concrete: Critical review. Constr. Build. Mater. 2020, 260, 119889. [Google Scholar] [CrossRef]
  36. Cao, Y.; Zandi, Y.; Agdas, A.S.; Wang, Q.F.; Qian, X.M.; Fu, L.J.; Wakil, K.; Selmi, A.; Issakhov, A.; Roco-Videla, A. A review study of application of artificial intelligence in construction management and composite beams. Steel Compos. Struct. 2021, 39, 685–700. [Google Scholar]
  37. Lan, T.; Hu, H.; Jiang, C.; Yang, G.; Zhao, Z. A comparative study of decision tree, random forest, and convolutional neural network for spread-F identification. Adv. Space Res. 2020, 65, 2052–2061. [Google Scholar] [CrossRef]
  38. Khan, M.A.; Memon, S.A.; Farooq, F.; Javed, M.F.; Aslam, F.; Alyousef, R. Compressive Strength of Fly-Ash-Based Geopolymer Concrete by Gene Expression Programming and Random Forest. Adv. Civ. Eng. 2021, 2021, 6618407. [Google Scholar] [CrossRef]
  39. Farooq, F.; Nasir Amin, M.; Khan, K.; Rehan Sadiq, M.; Faisal Javed, M.; Aslam, F.; Alyousef, R. A Comparative Study of Random Forest and Genetic Engineering Programming for the Prediction of Compressive Strength of High Strength Concrete (HSC). Appl. Sci. 2020, 10, 7330. [Google Scholar] [CrossRef]
  40. Han, B.; Wu, Y.; Liu, L. Prediction and uncertainty quantification of compressive strength of high-strength concrete using optimized machine learning algorithms. Struct. Concr. 2022, 1–14. [Google Scholar] [CrossRef]
  41. Sousa-Ferreira, I.; Sousa, D. A review of velocity-type PSO variants. J. Algorithms Comput. Technol. 2016, 11, 23–30. [Google Scholar] [CrossRef]
  42. Thangaraj, R.; Pant, M.; Abraham, A.; Bouvry, P. Particle swarm optimization: Hybridization perspectives and experimental illustrations. Appl. Math. Comput. 2011, 217, 5208–5226. [Google Scholar] [CrossRef]
  43. Wu, Y.; Li, S. Damage degree evaluation of masonry using optimized SVM-based acoustic emission monitoring and rate process theory. Measurement 2022, 190, 110729. [Google Scholar] [CrossRef]
  44. Wu, Y.; Zhou, Y. Prediction and feature analysis of punching shear strength of two-way reinforced concrete slabs using optimized machine learning algorithm and Shapley additive explanations. Mech. Adv. Mater. Struct. 2022, 1–11. [Google Scholar] [CrossRef]
  45. Yaseen, Z.M.; Tran, M.T.; Kim, S.; Bakhshpoori, T.; Deo, R.C. Shear strength prediction of steel fiber reinforced concrete beam using hybrid intelligence models: A new approach. Eng. Struct. 2018, 177, 244–255. [Google Scholar] [CrossRef]
  46. Liu, H.; Liu, J.; Wang, Y.; Xia, Y.; Guo, Z. Identification of grouting compactness in bridge bellows based on the BP neural network. Structures 2021, 32, 817–826. [Google Scholar] [CrossRef]
  47. Tran, V.-L.; Kim, S.-E. A practical ANN model for predicting the PSS of two-way reinforced concrete slabs. Eng. Comput. 2021, 37, 2303–2327. [Google Scholar] [CrossRef]
  48. Wu, Y.; Zhou, Y. Hybrid machine learning model and Shapley additive explanations for compressive strength of sustainable concrete. Constr. Build. Mater. 2022, 330, 127298. [Google Scholar] [CrossRef]
  49. Chen, H.; Li, X.; Wu, Y.; Zuo, L.; Lu, M.; Zhou, Y. Compressive Strength Prediction of High-Strength Concrete Using Long Short-Term Memory and Machine Learning Algorithms. Build. Basel 2022, 12, 302. [Google Scholar] [CrossRef]
  50. Mangalathu, S.; Shin, H.; Choi, E.; Jeon, J.-S. Explainable machine learning models for punching shear strength estimation of flat slabs without transverse reinforcement. J. Build. Eng. 2021, 39, 102300. [Google Scholar] [CrossRef]
  51. Nguyen, M.S.T.; Kim, S.-E. A hybrid machine learning approach in prediction and uncertainty quantification of ultimate compressive strength of RCFST columns. Constr. Build. Mater. 2021, 302, 124208. [Google Scholar] [CrossRef]
Figure 1. Schematic diagram of the CCFST column.
Buildings 12 00698 g001
Figure 2. Distribution of the dataset.
Buildings 12 00698 g002aBuildings 12 00698 g002b
Figure 3. Pearson coefficient matrix of input and output variables.
Buildings 12 00698 g003
Figure 4. Errors of the training set and the test set of different layer nodes.
Buildings 12 00698 g004
Figure 5. Flow chart of PSO-ANN algorithm.
Buildings 12 00698 g005
Figure 6. Comparison of experimental and predicted values. (a) EC4. (b) ANN. (c) PSO-ANN.
Buildings 12 00698 g006aBuildings 12 00698 g006b
Figure 7. Correlation coefficients between experimental and predicted values for different models. (a) Training set. (b) Test set.
Buildings 12 00698 g007aBuildings 12 00698 g007b
Figure 8. Comparison of evaluation metrics under different prediction models. (a) Training set. (b) Test set.
Buildings 12 00698 g008
Figure 9. PSO-ANN interactive graphical user interface.
Buildings 12 00698 g009
Figure 10. Global importance factors based on SHAP.
Buildings 12 00698 g010
Figure 11. Summary plots for the axial capacity of the CCFST column.
Buildings 12 00698 g011
Figure 12. Distribution of each design parameter sample and the corresponding predicted axial compression capacity.
Buildings 12 00698 g012
Figure 13. Variation in axial compression load capacity caused by each design parameter.
Buildings 12 00698 g013
Table 1. Statistical characteristics of the dataset.
ParameterUnitMaximum
Value
Minimum
Value
Standard DeviationMean Value
Dmm355.67648.565135.971
Tmm12.81.3972.3844.553
fyMPa60520064.3344
fcMPa10614.4415.71042.629
Lmm5400508961.8631722.351
NukN11,460210.71160.6251188.439
Table 2. PSO-BP network parameters used in this study.
ParameterSettings
Neural network
Input layer neurons5
Hidden layer neurons7
Output layer neurons1
Epochs100
Learning rate0.01
Loss functionMSE
Back-propagation algorithmLevenberg-Marquardt
Transfer function in hidden layerTansig
Transfer function in the output layerPurelin
Alpha0.001
Beta0.1
Delata0.01
Gama0.1
Max_fail6
Low_limit0.1
Up_limiit0.5
Particle swarm optimization algorithm
Learning factor C11.5
Learning factor C21.5
Swarm size200
Maxgen100
Lower bound velocity−5
Upper bound velocity5
Table 3. Statistics for random samples of design parameters.
ParameterUnitMean ValueStandard DeviationCoefficient of VariationSample SizeDistribution
Dmm1501510%10,000Normal distribution
Tmm50.510%10,000Normal distribution
Lmm175017510%10,000Normal distribution
fcMPa454.510%10,000Normal distribution
fyMPa3503510%10,000Normal distribution
Publisher’s Note: MDPI stays neutral with regard to jurisdictional claims in published maps and institutional affiliations.

