
CO2 Curing on the Mechanical Properties of Portland Cement Concrete


 ,
,
Abstract
:1. Introduction
2. Experiments
2.1. Concrete Materials and Mix Proportion
2.2. Concrete Samples
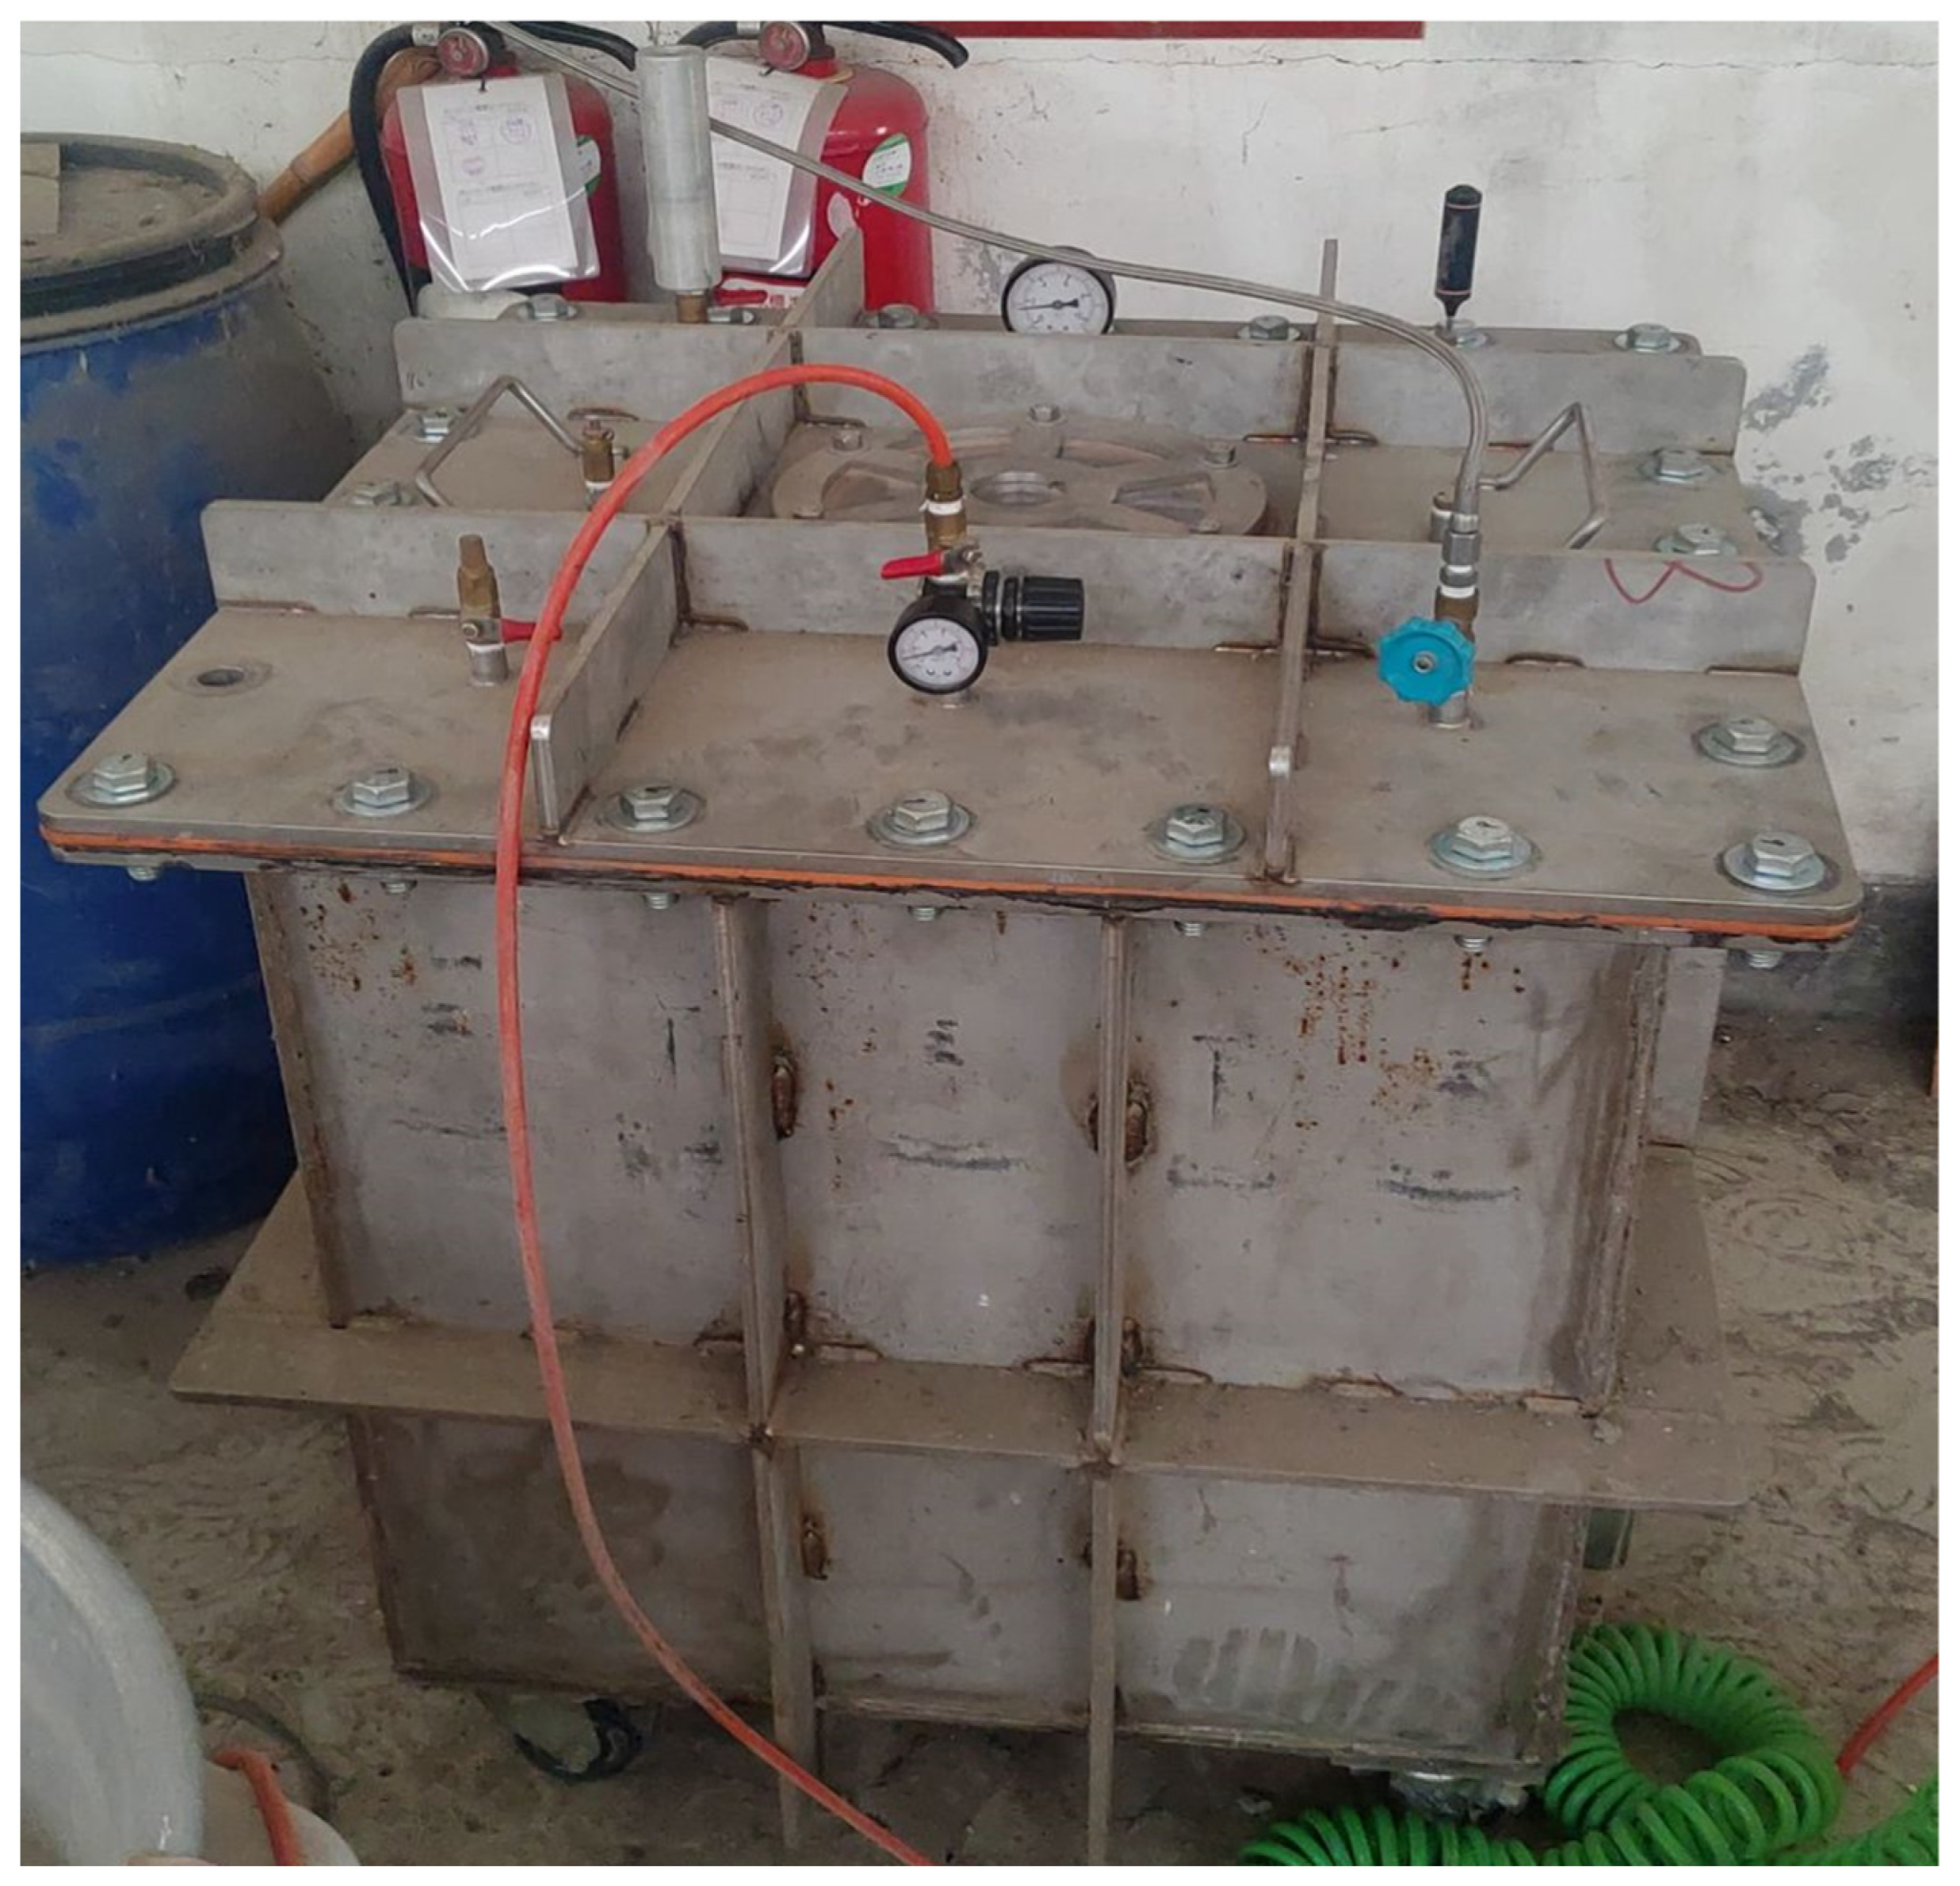
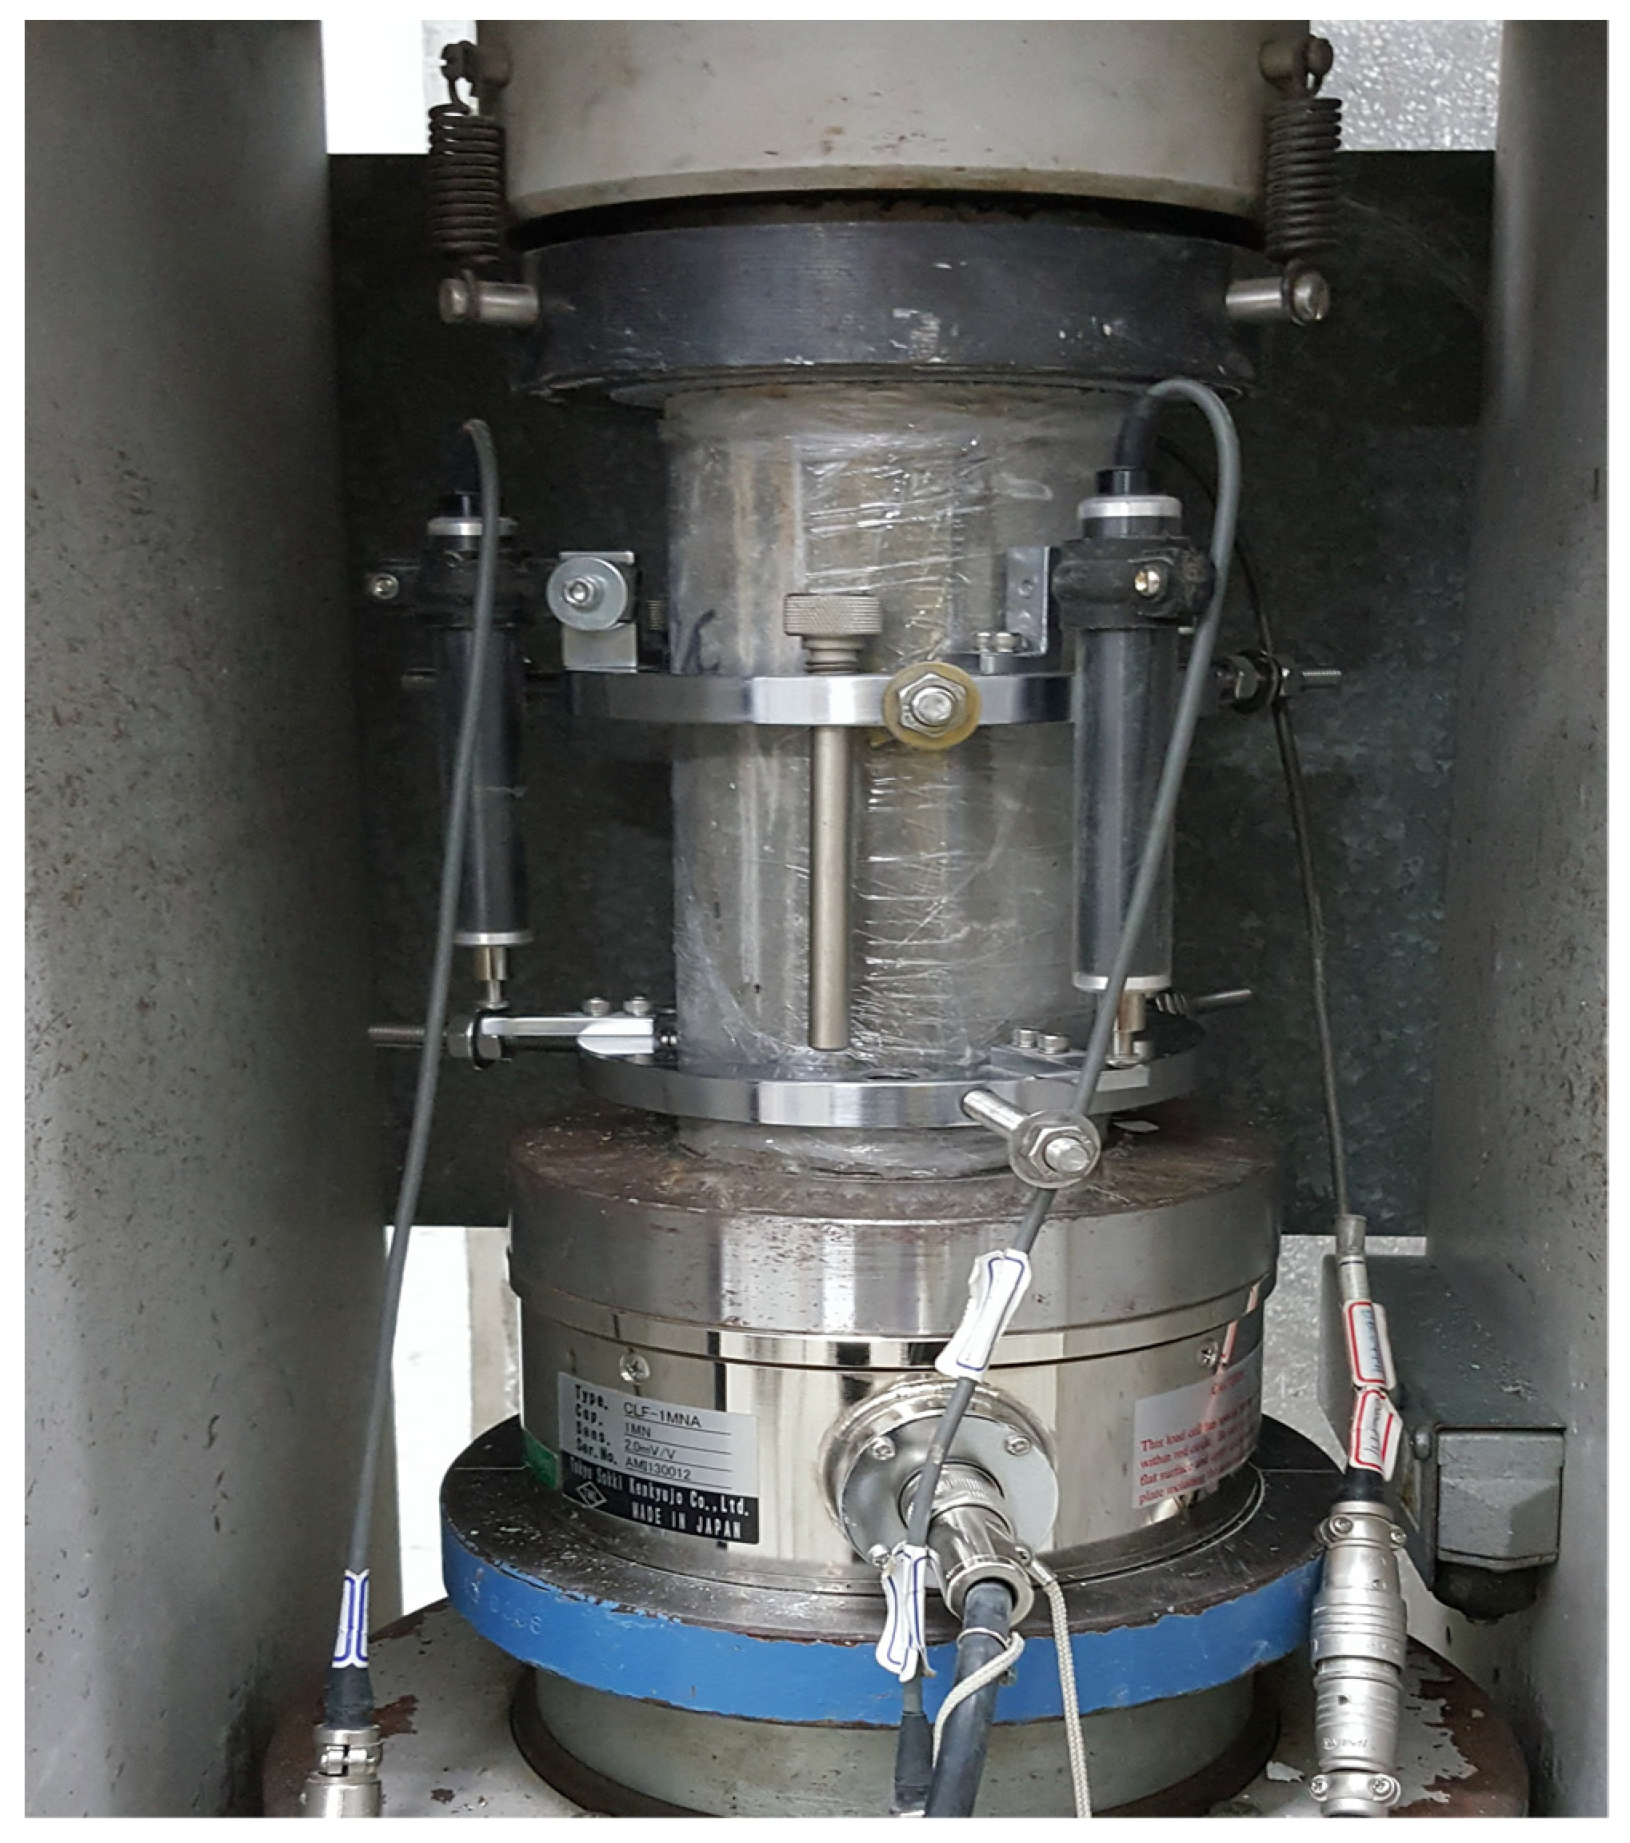
2.3. Concrete CO2 Curing Test
3. Experimental Results
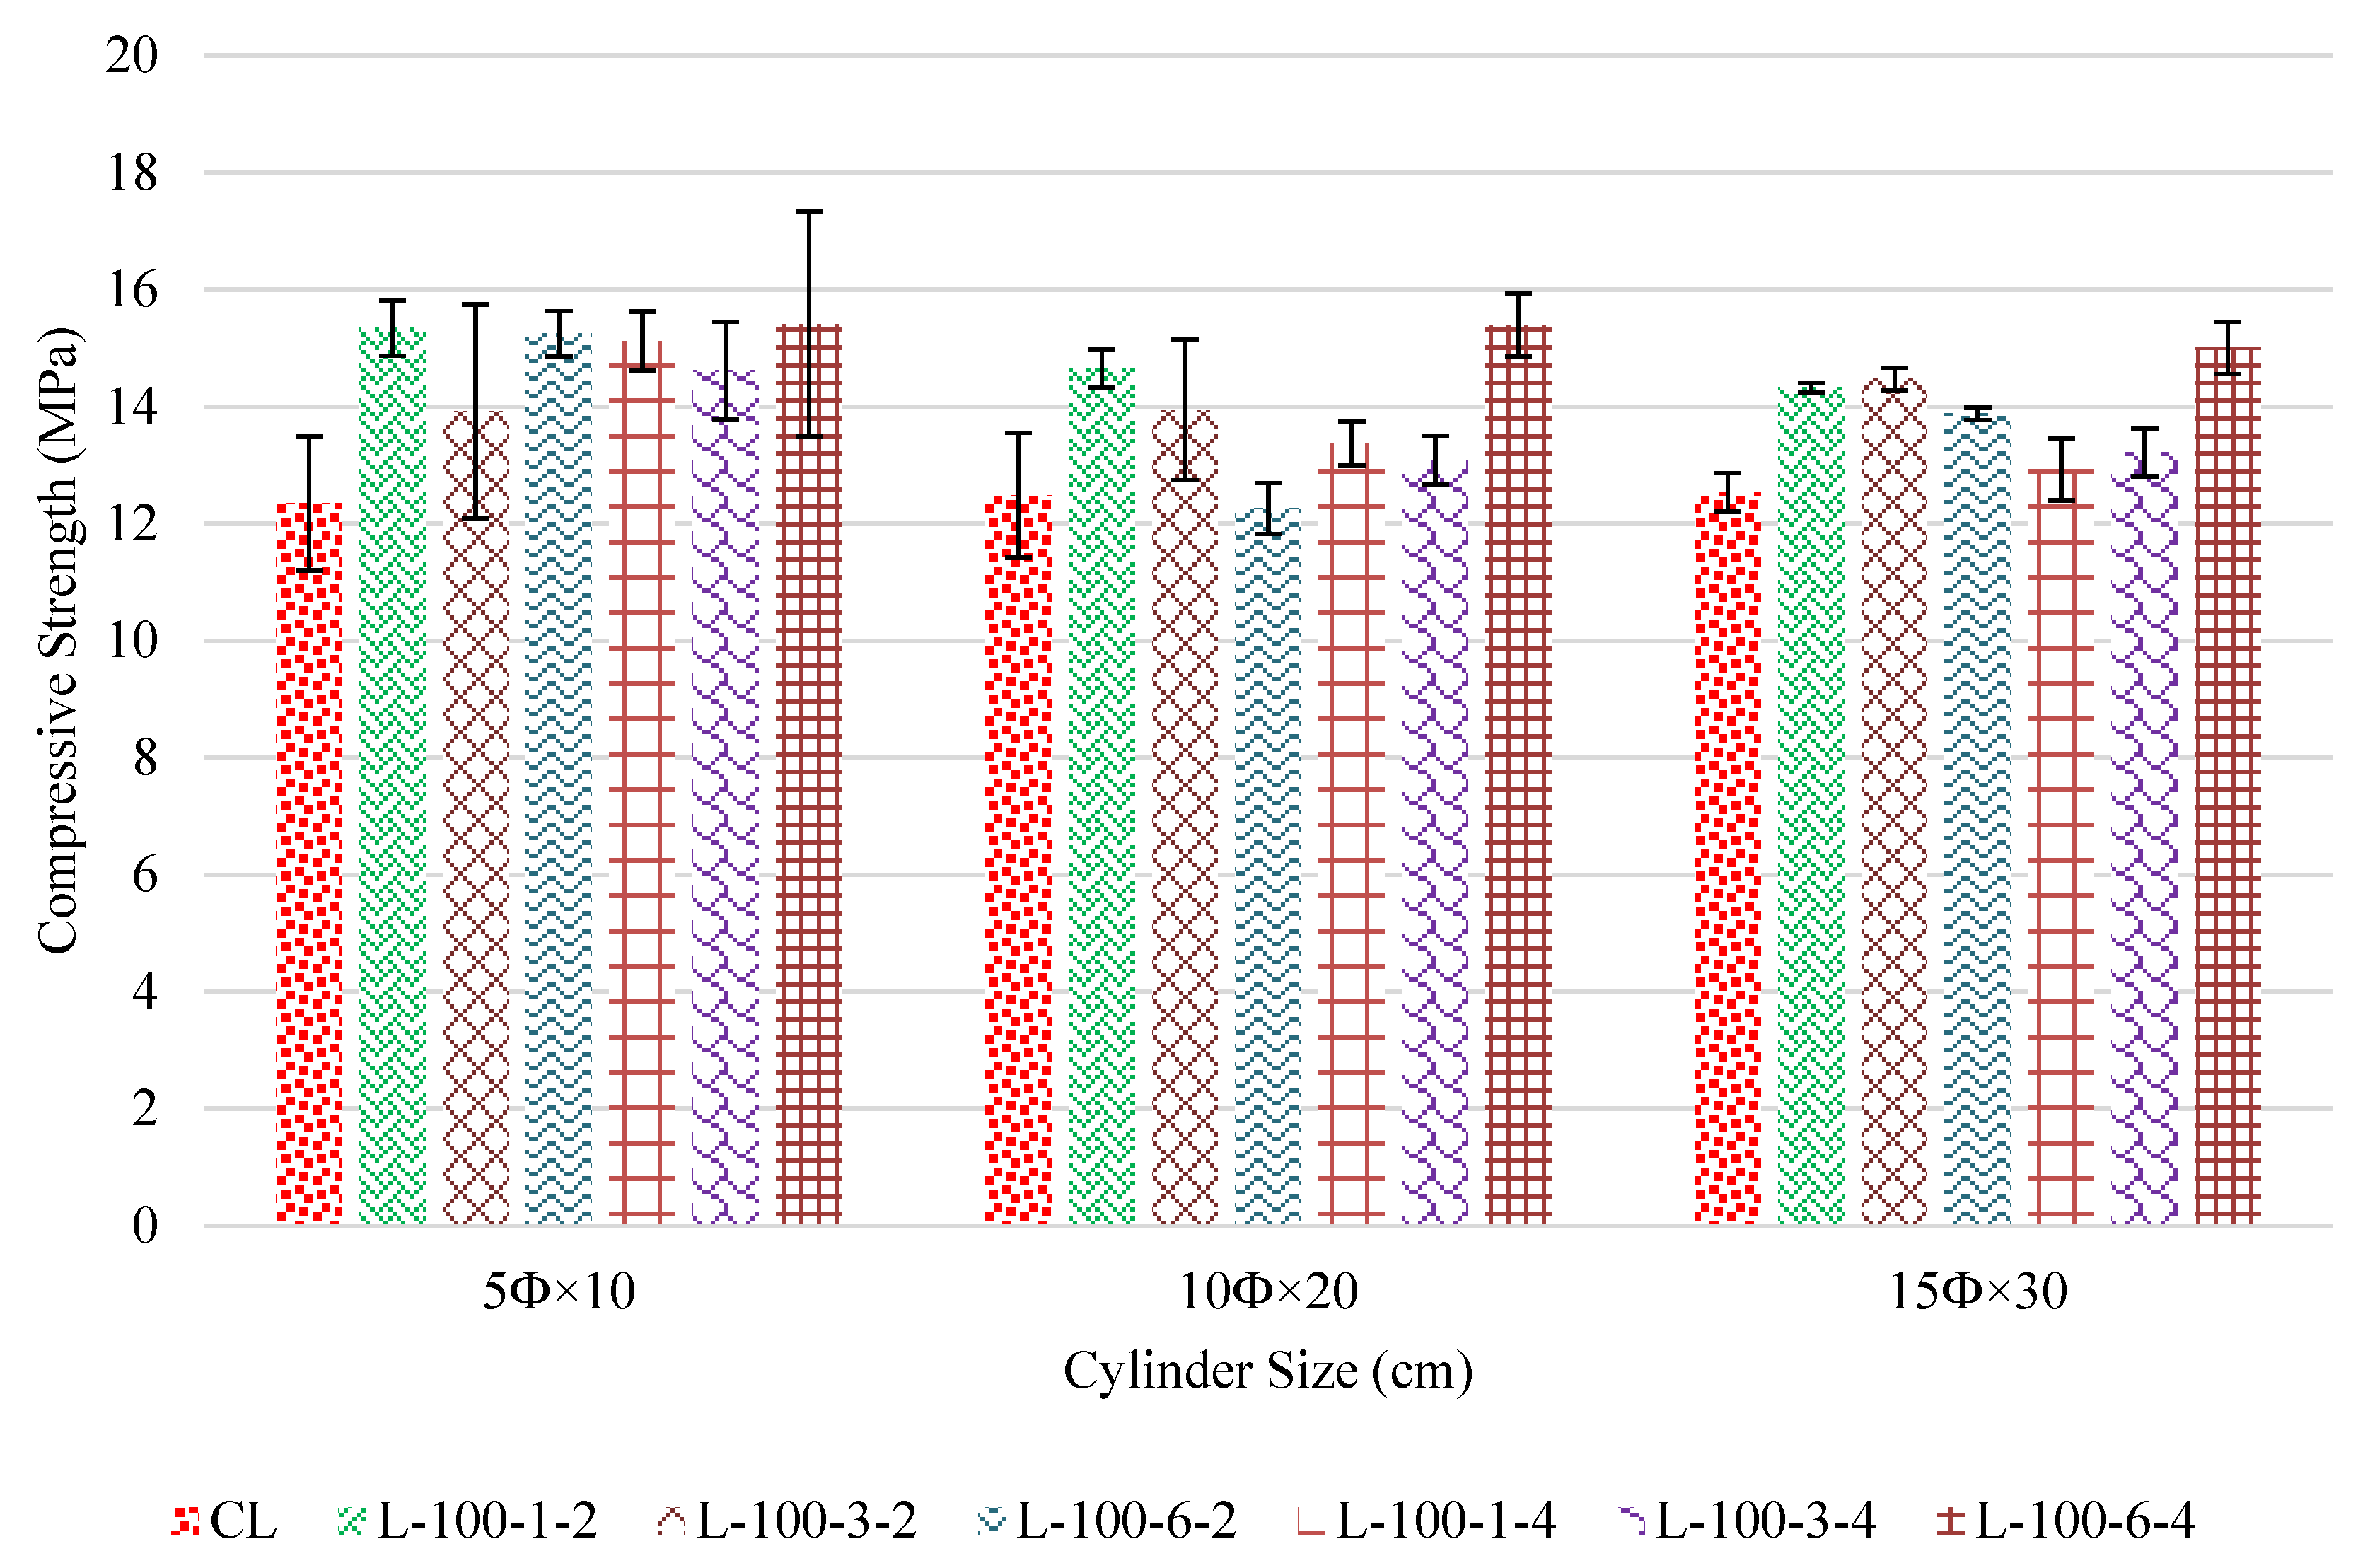
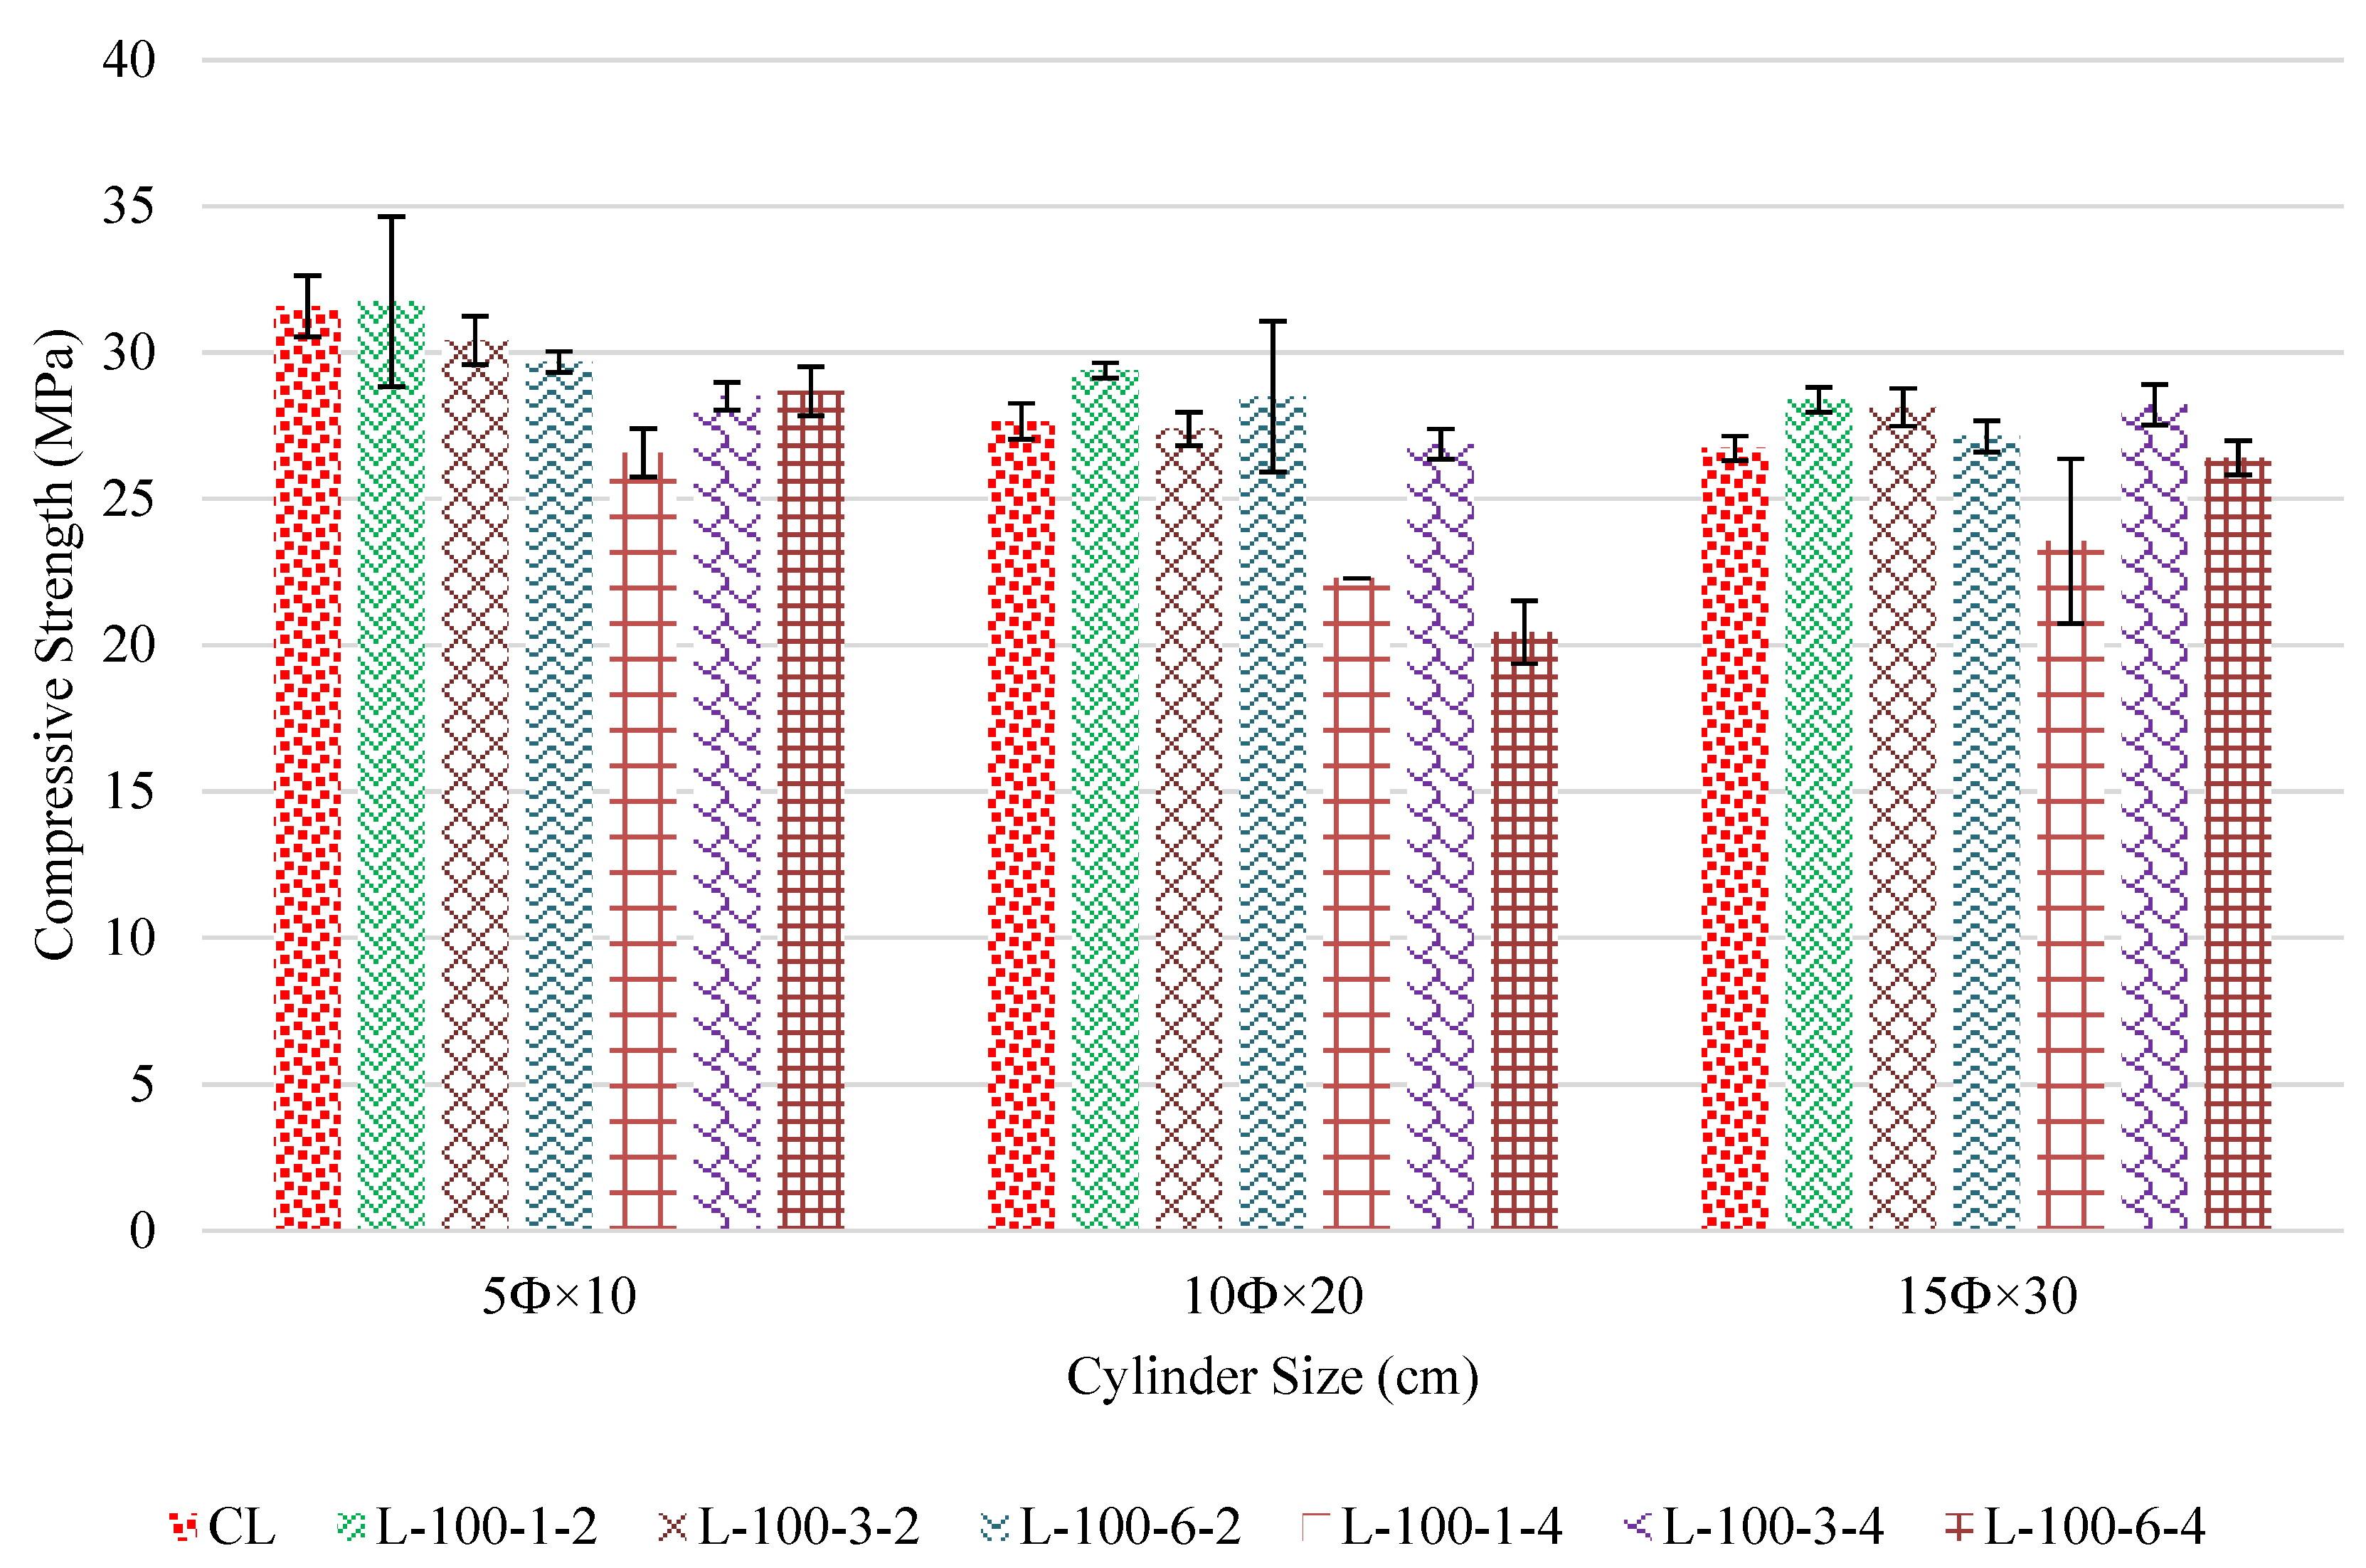
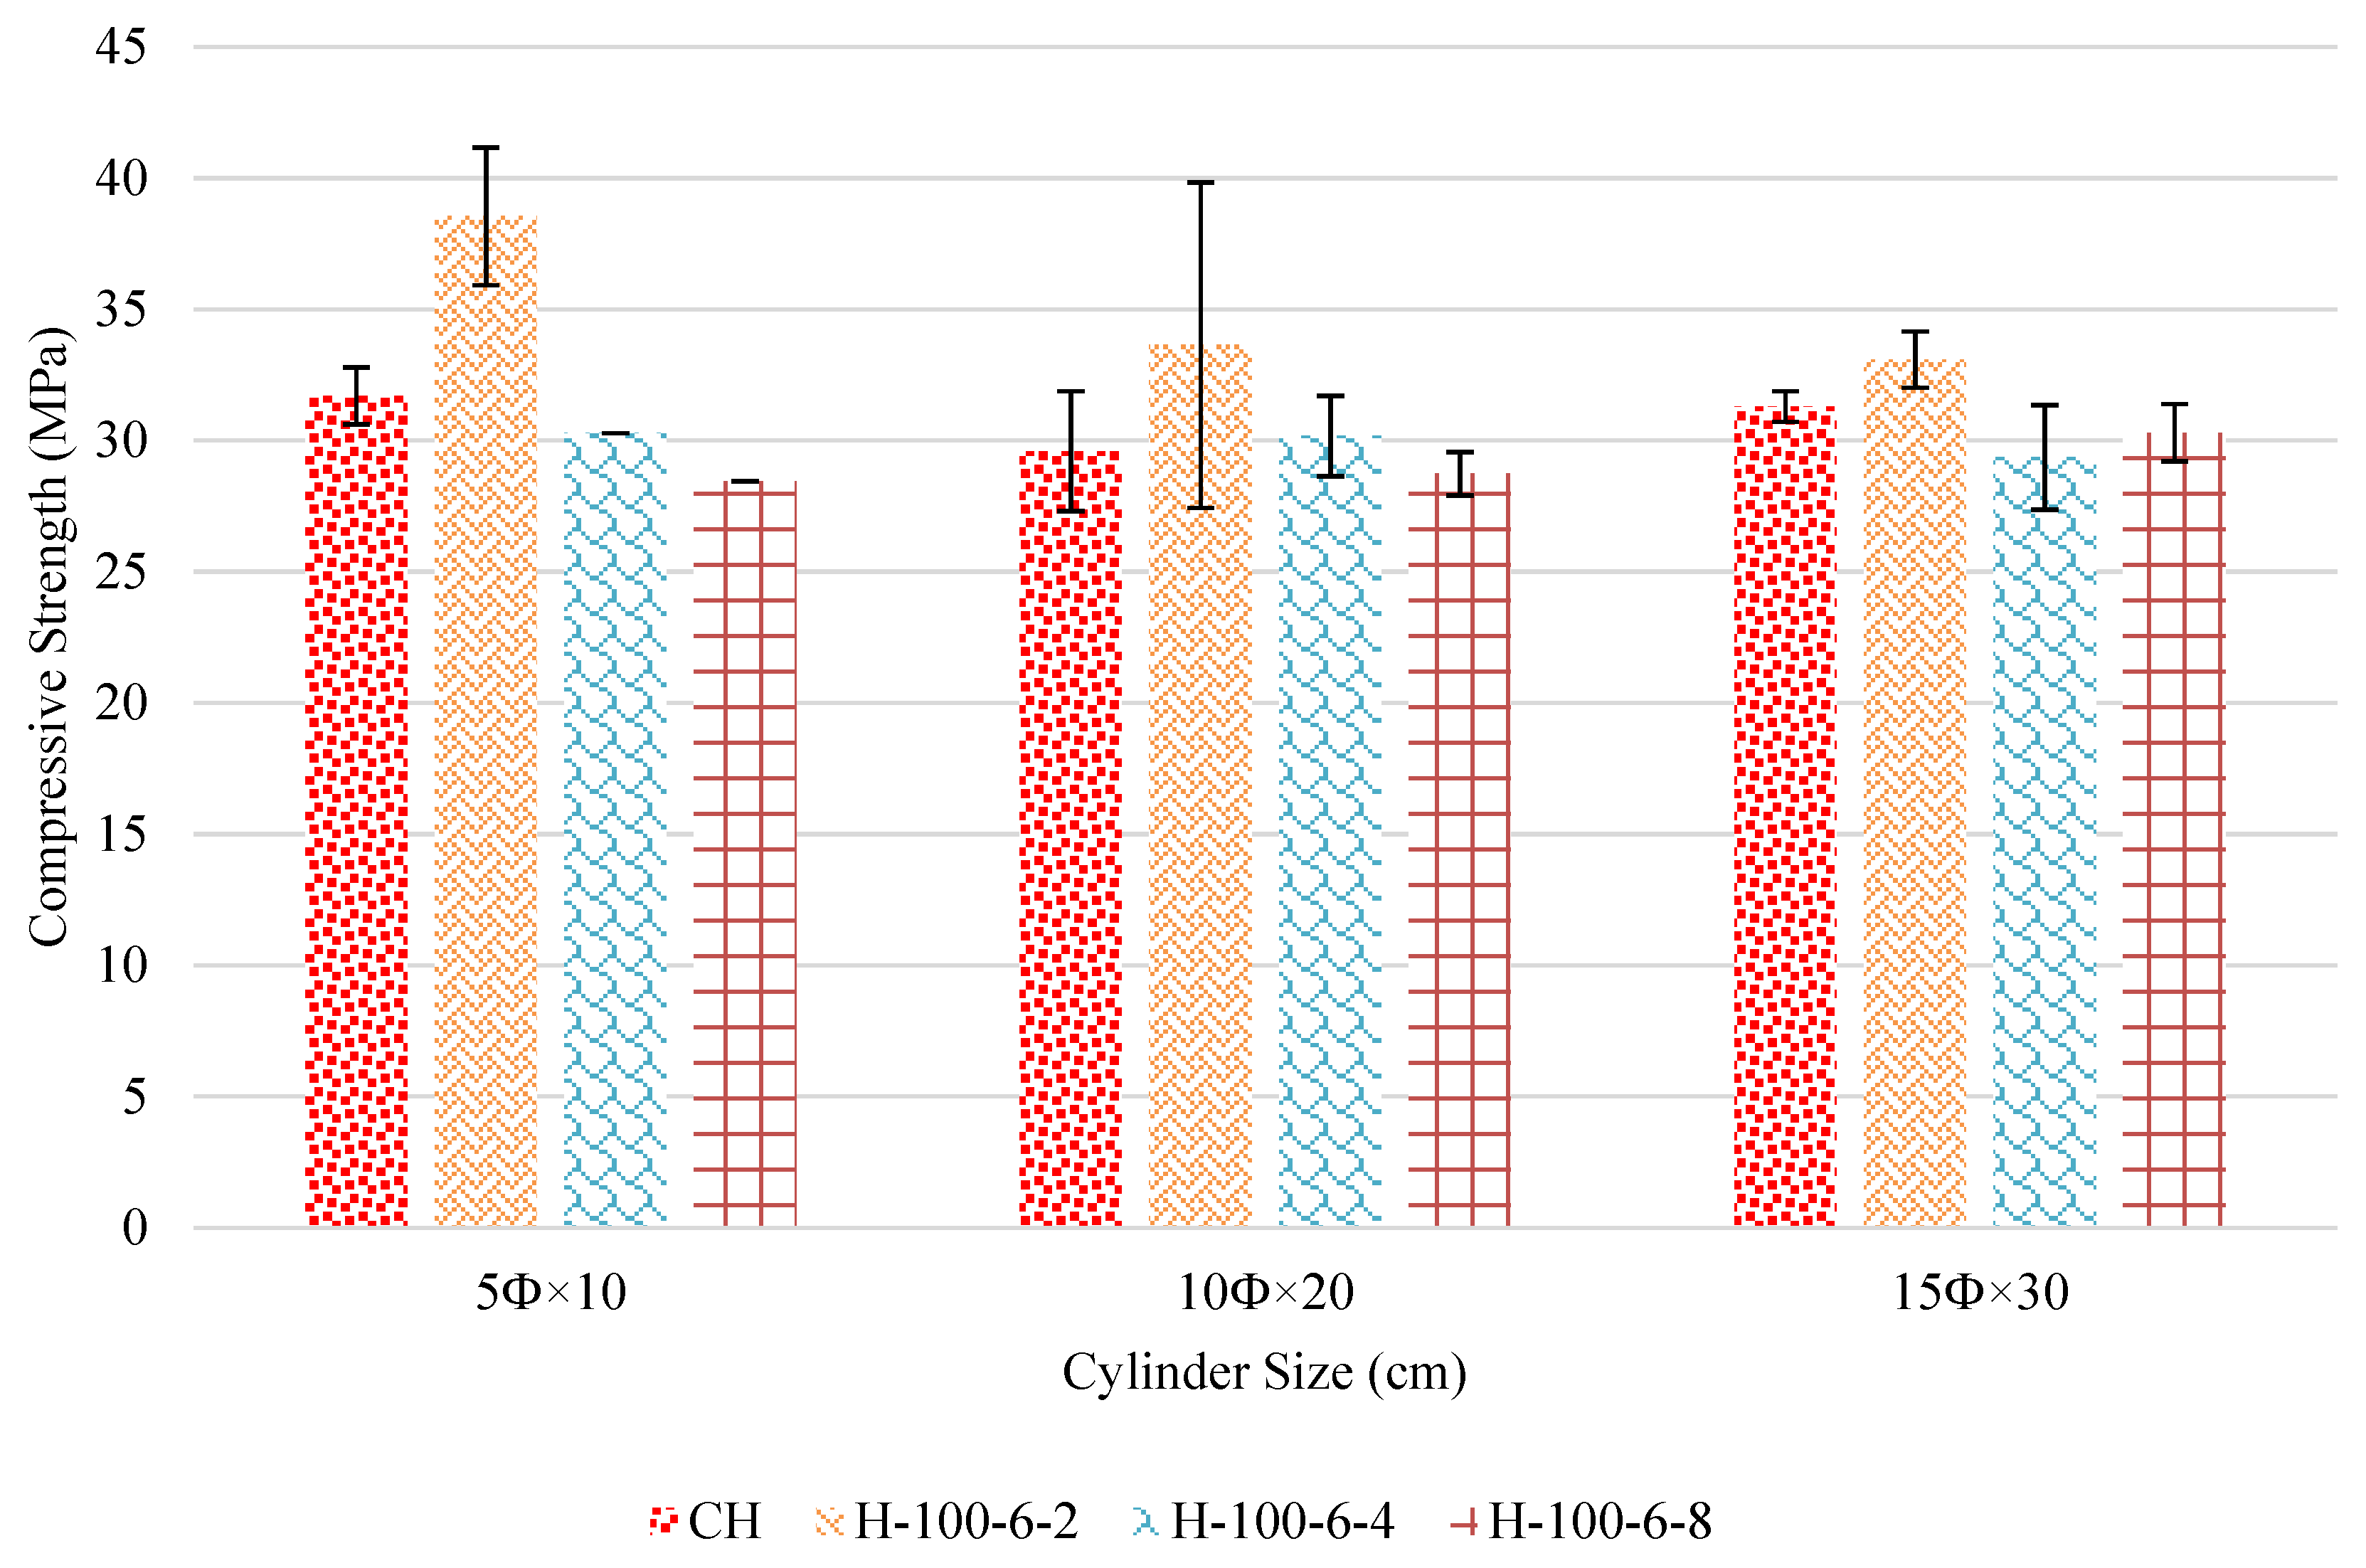
3.1. Effect of CO2 Curing on Concrete Compressive Strength
3.2. Effect of CO2 Curing on Concrete Modulus of Elasticity
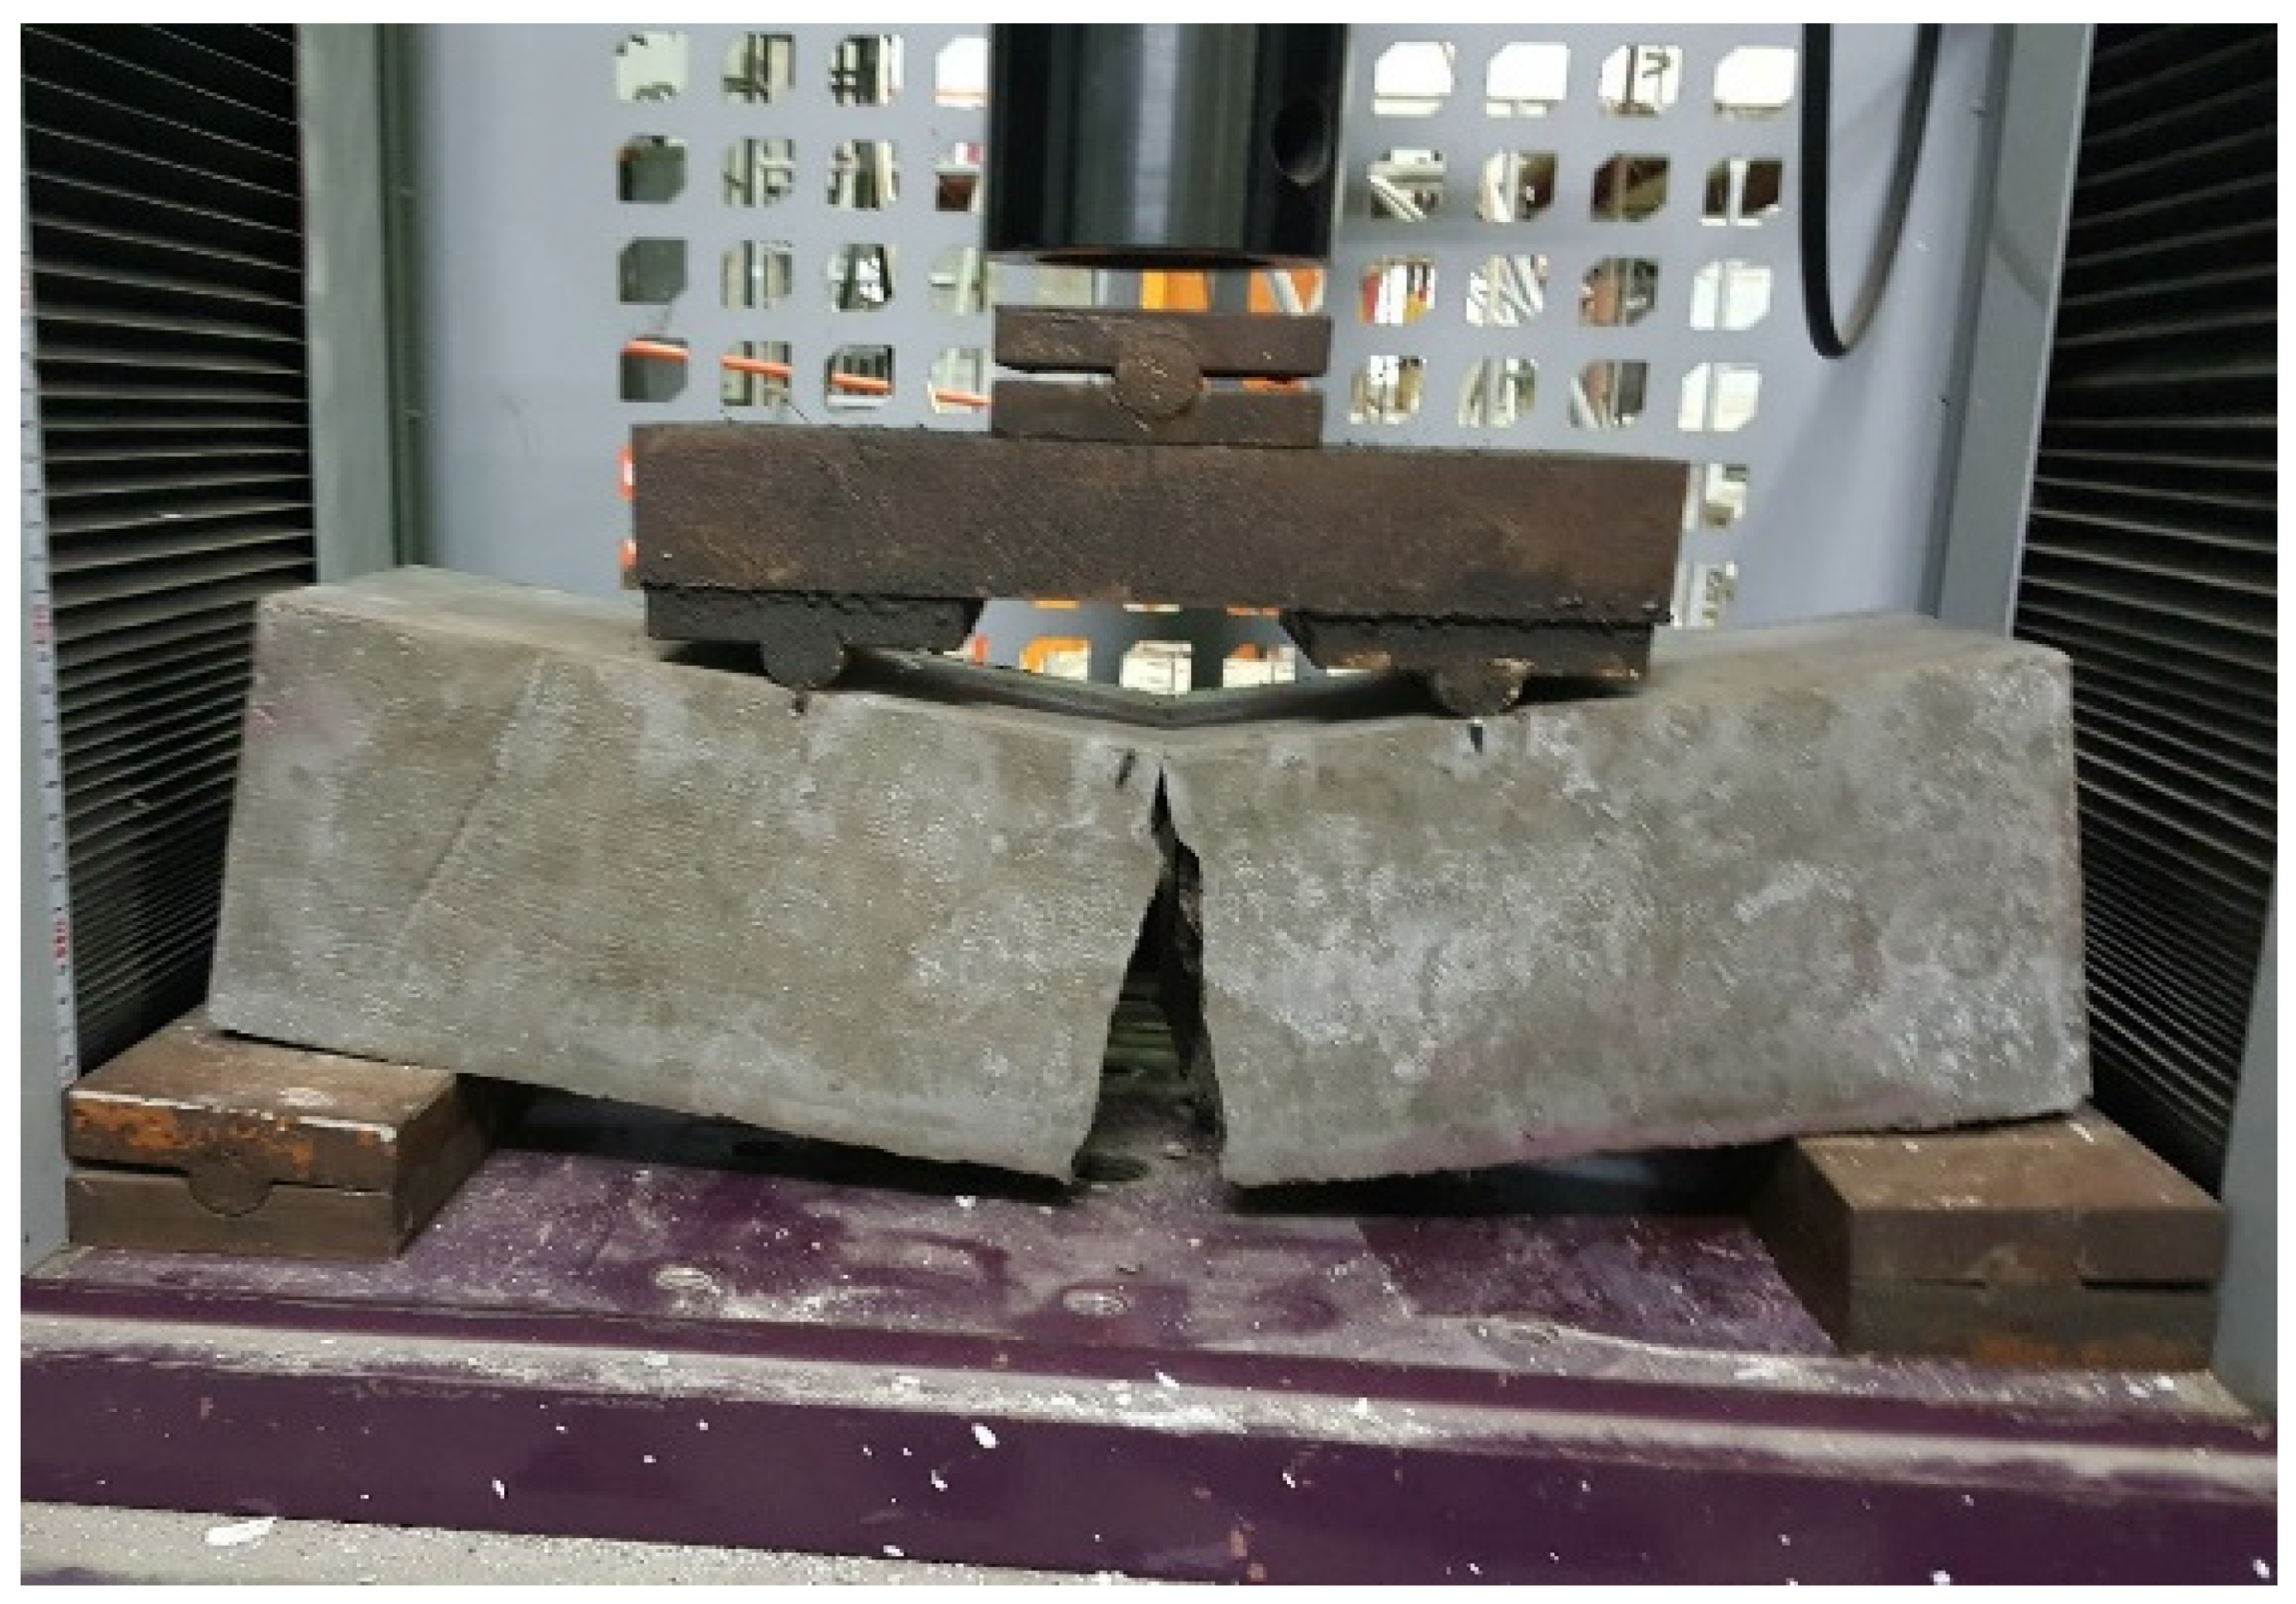
3.3. Effect of CO2 Curing on Rupture Modulus
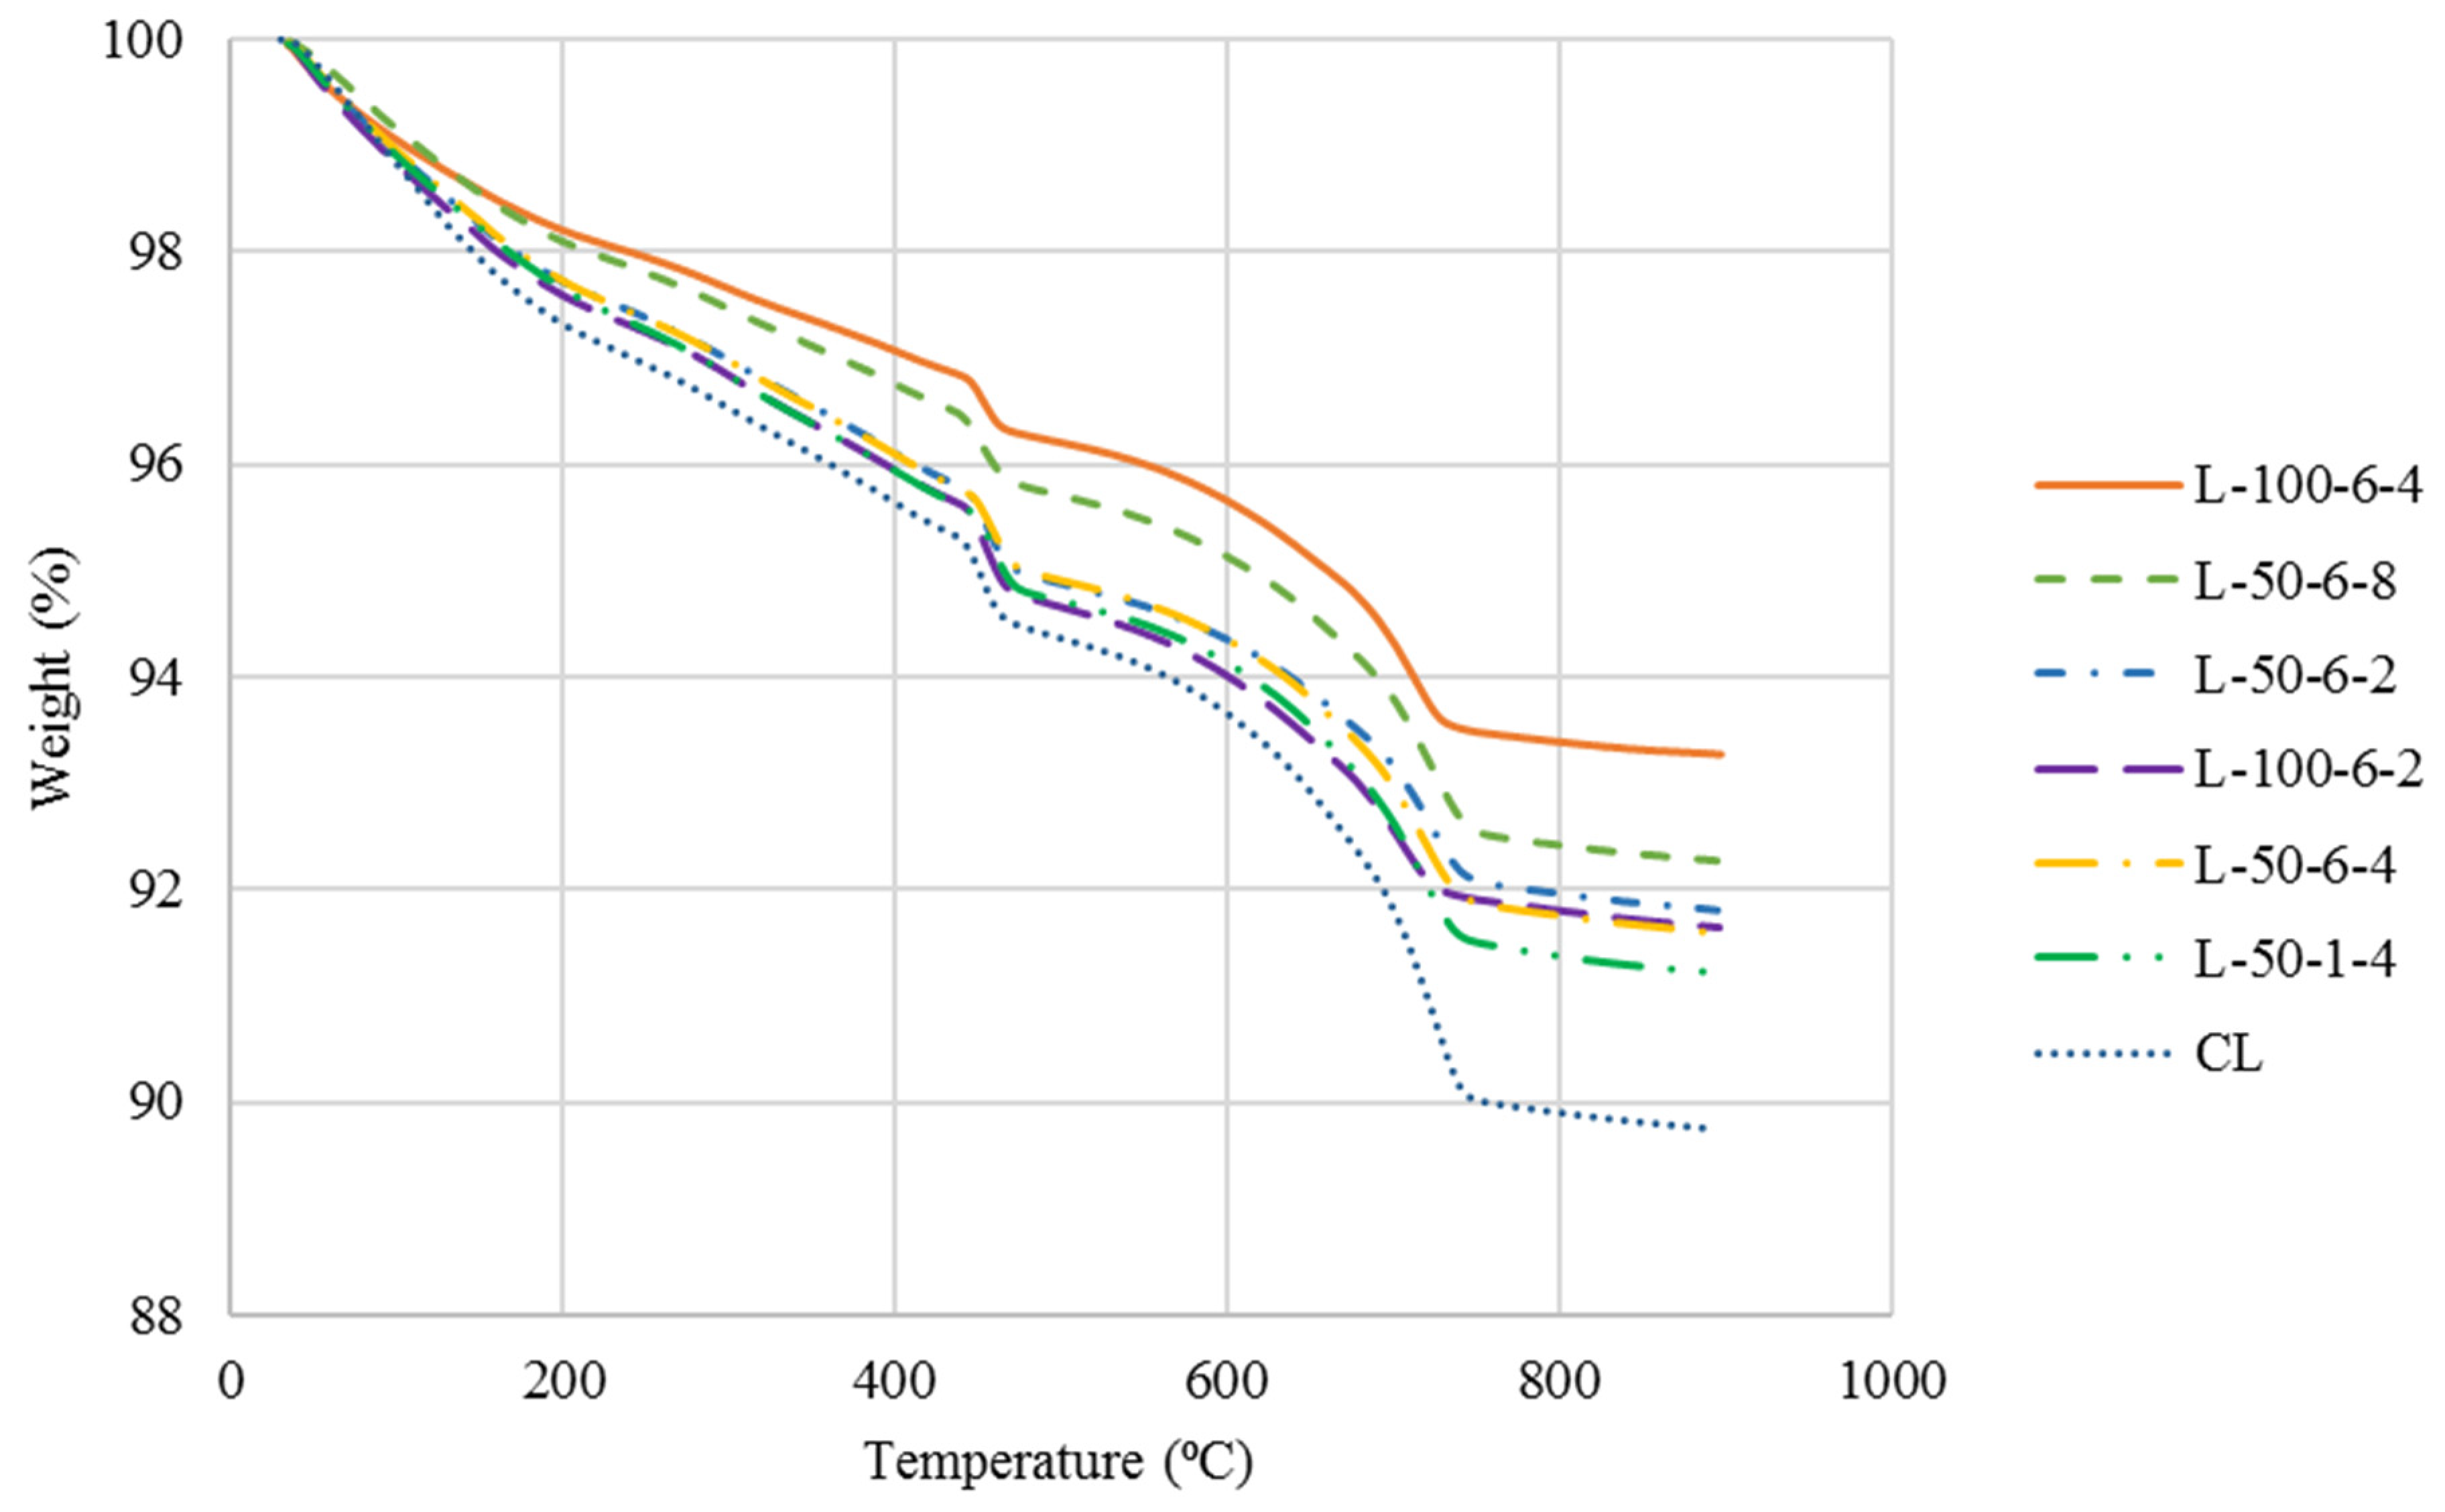
3.4. Thermo-Gravimetric Analysis
3.5. XRD Analysis of Concrete Specimen
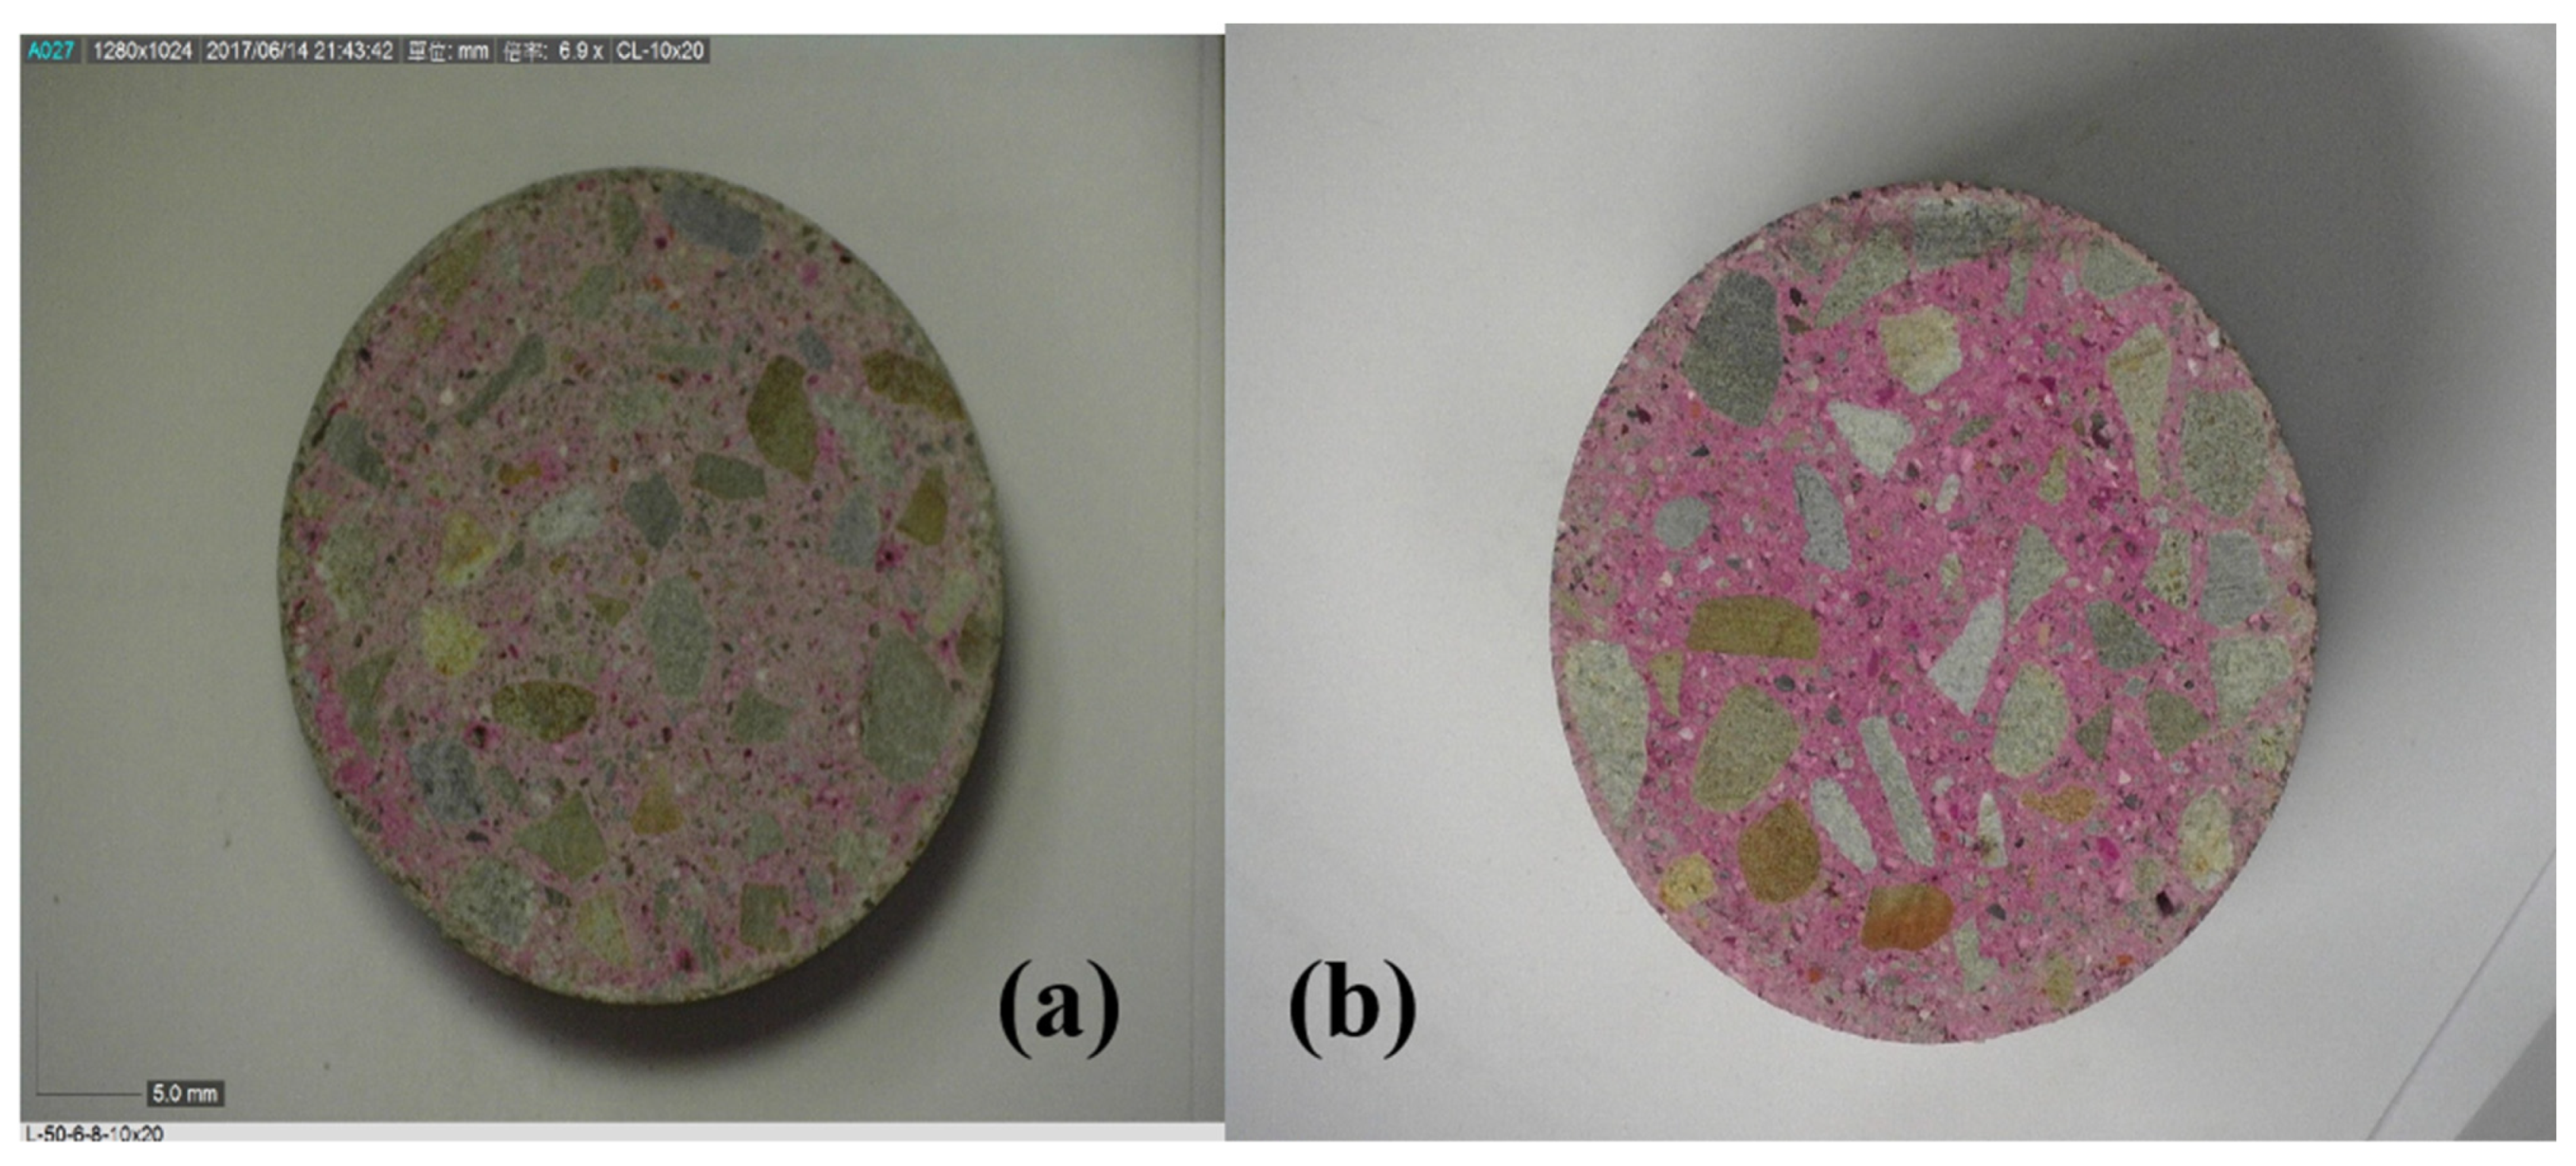
3.6. Carbonation Depth
4. Summary
- (1)
- The early 3-day compressive strength of CO2-cured concrete is higher than that of conventional water-cured concrete. When the age reaches 28 days and 90 days, the compressive strength of CO2-cured concrete is close to that of conventional water-cured concrete. The strength of normal and high-strength concretes increases with concrete age, regardless of CO2 concentration, duration, and pressure. The curing combination of 50-3-2 and 50-1-2 both won 3 first places in compressive strength, indicating that the CO2 pressurized 0.1 to 0.3 MPa concentration of 50%, and two hours of CO2-curing could get better strength.
- (2)
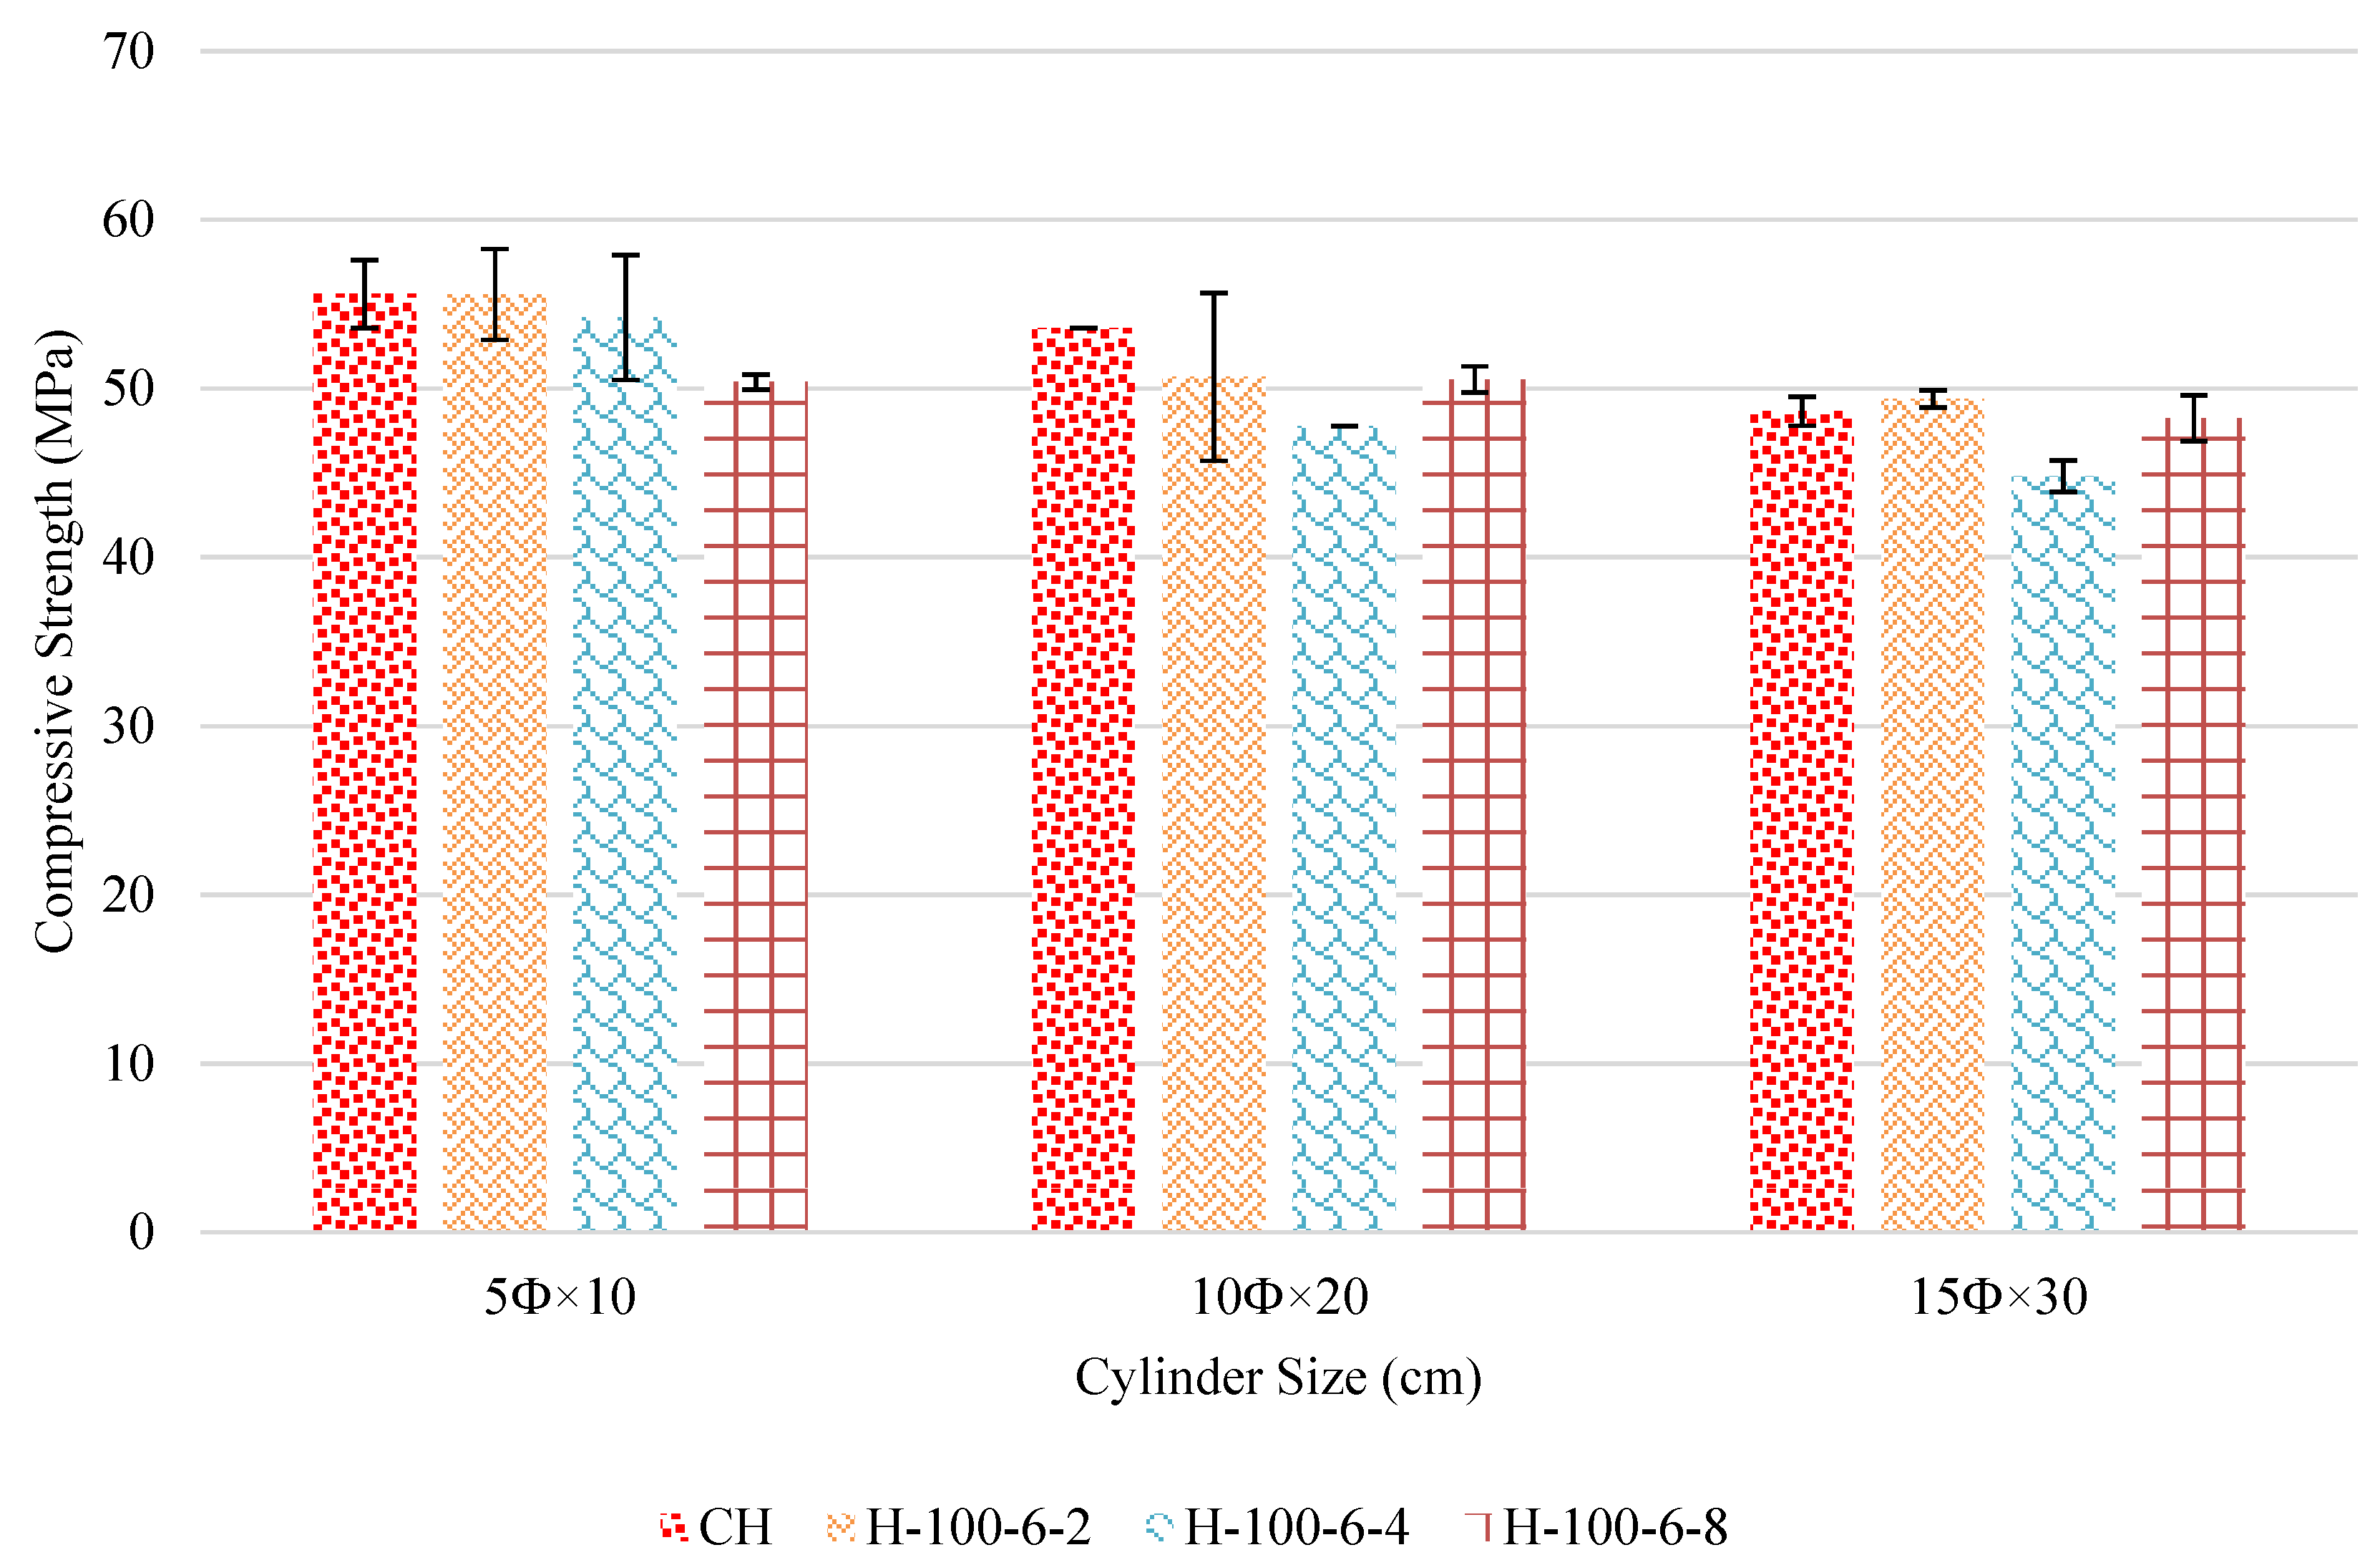
- A 5 × 10 cm cylinder of normal-strength or high-strength concrete is significantly stronger at each age than a 10 × 20 cm or 15 × 30 cm cylinder. Furthermore, the difference in strength between the 5 × 10 cm and 15 × 30 cm cylinders is large, with ks values as high as 1.18. However, the results showed no difference between 10 × 20 cm and 15 × 30 cm cylinders in normal strength concrete.
- (3)
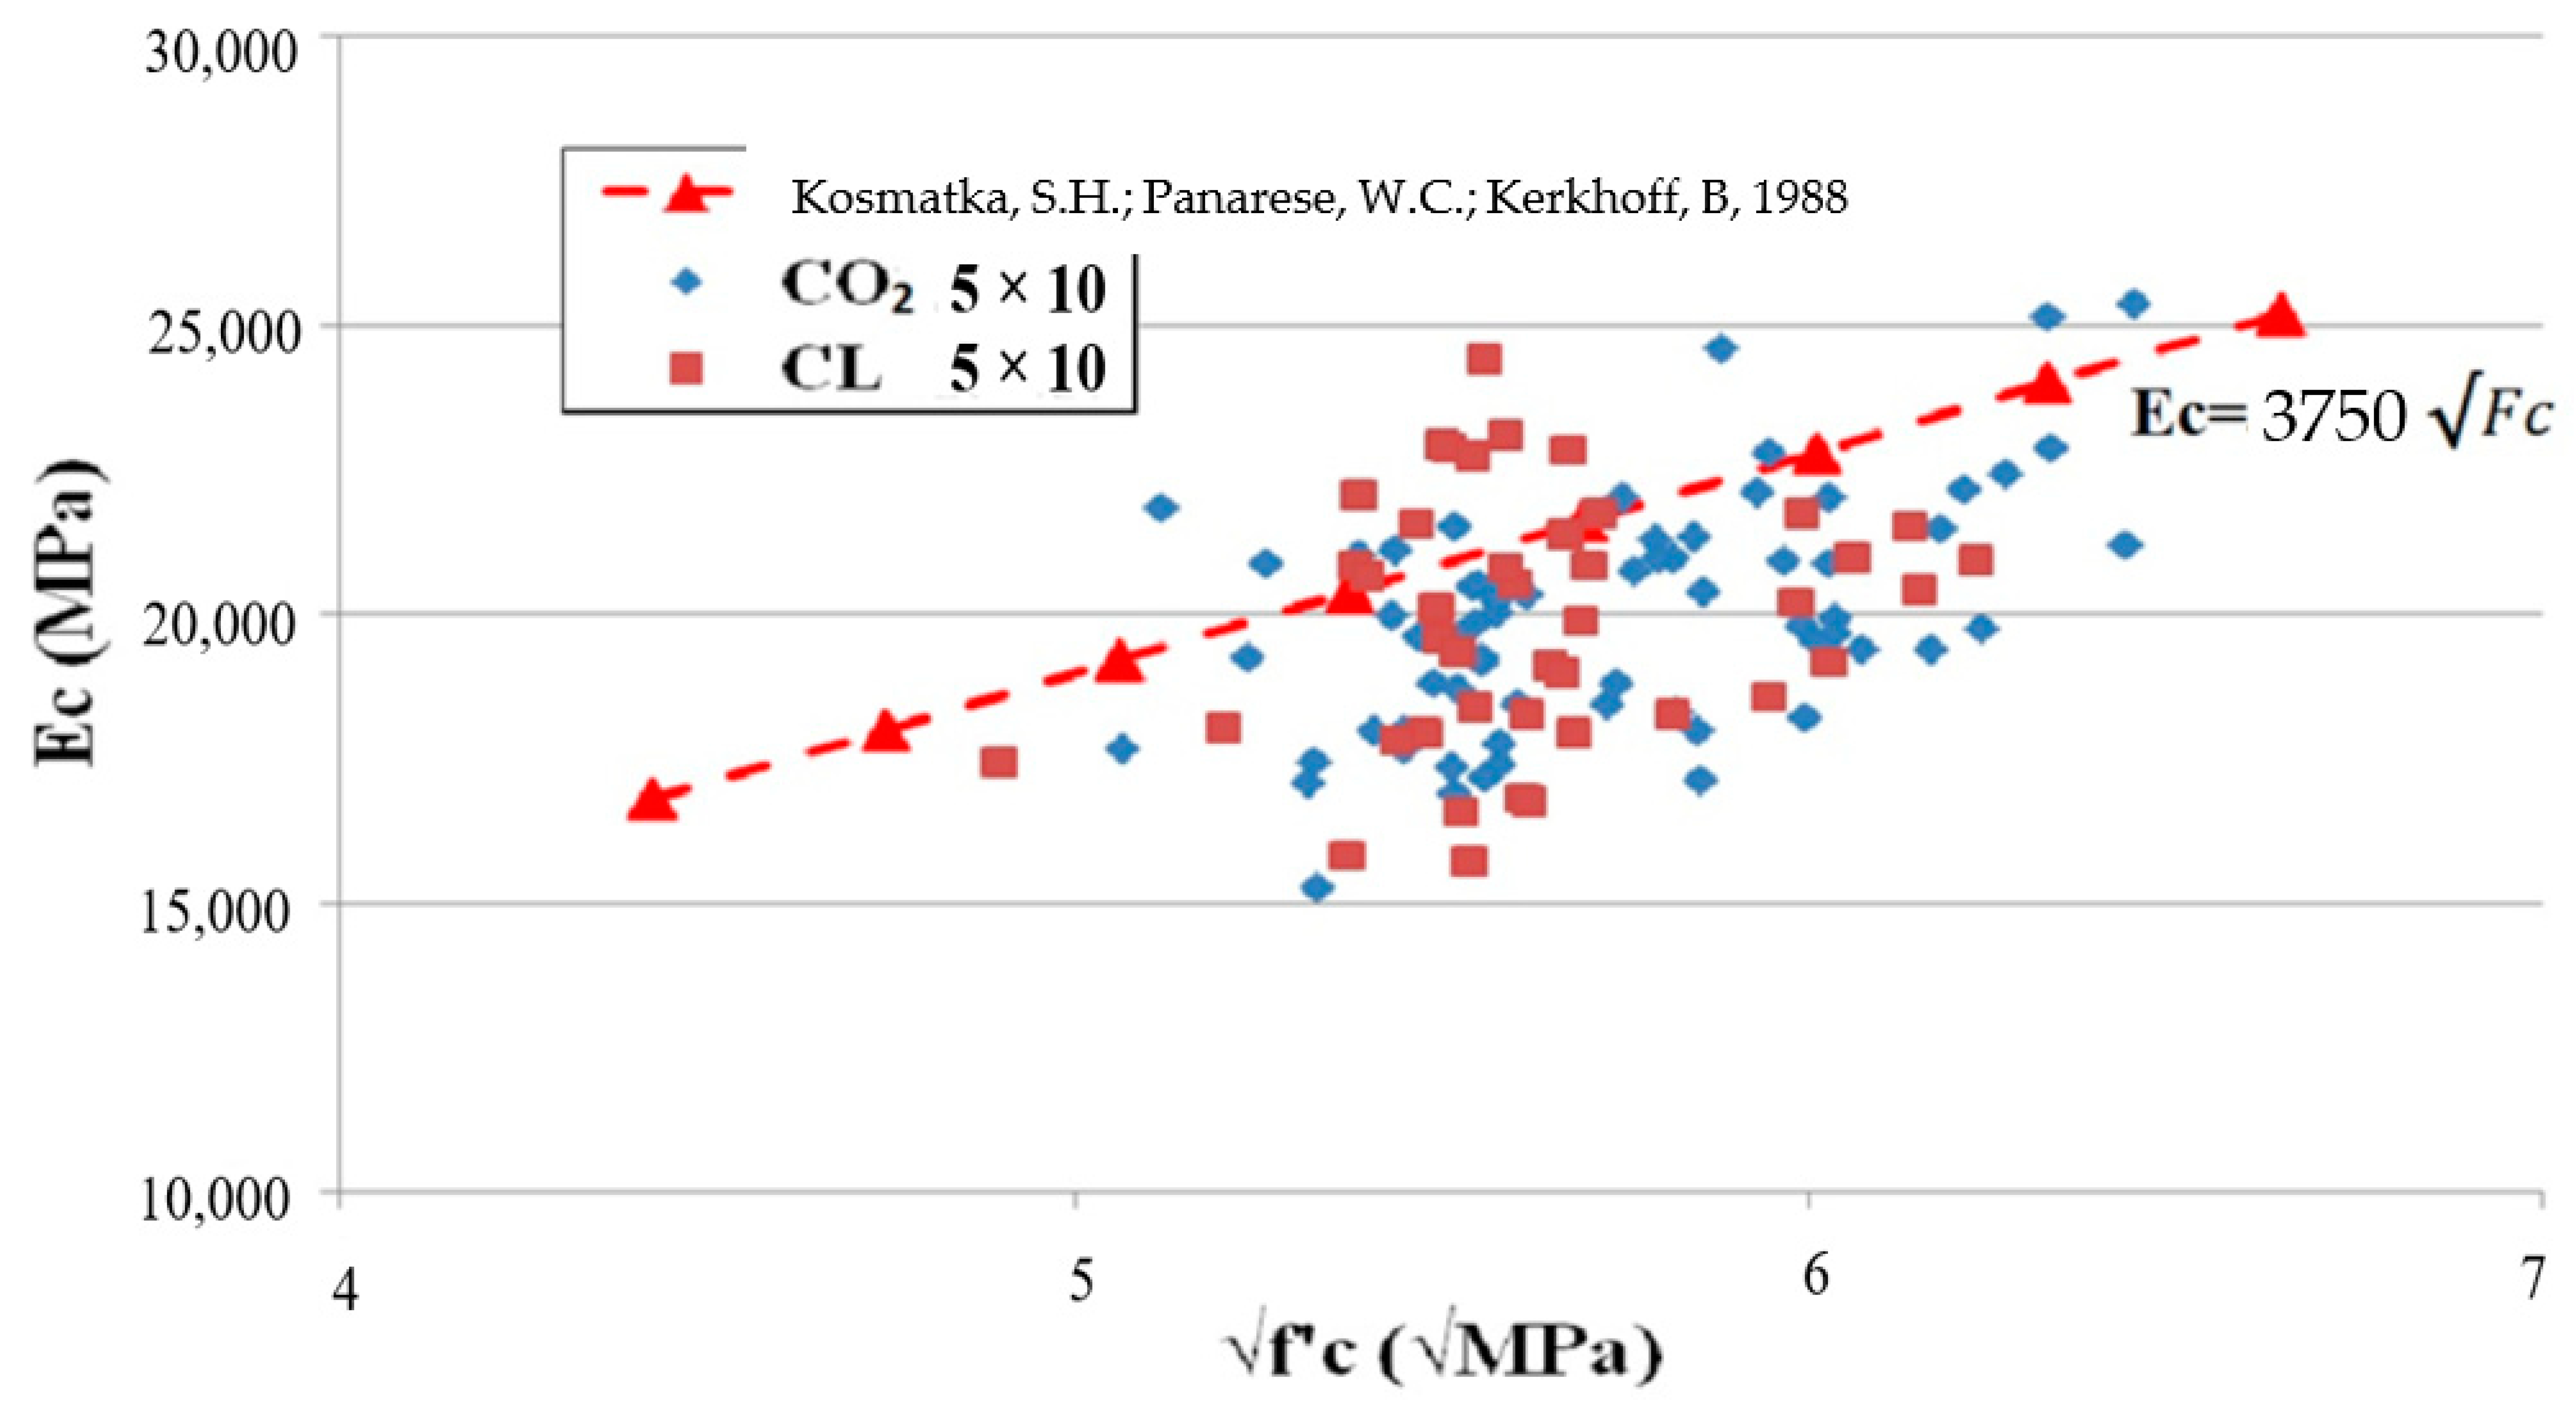
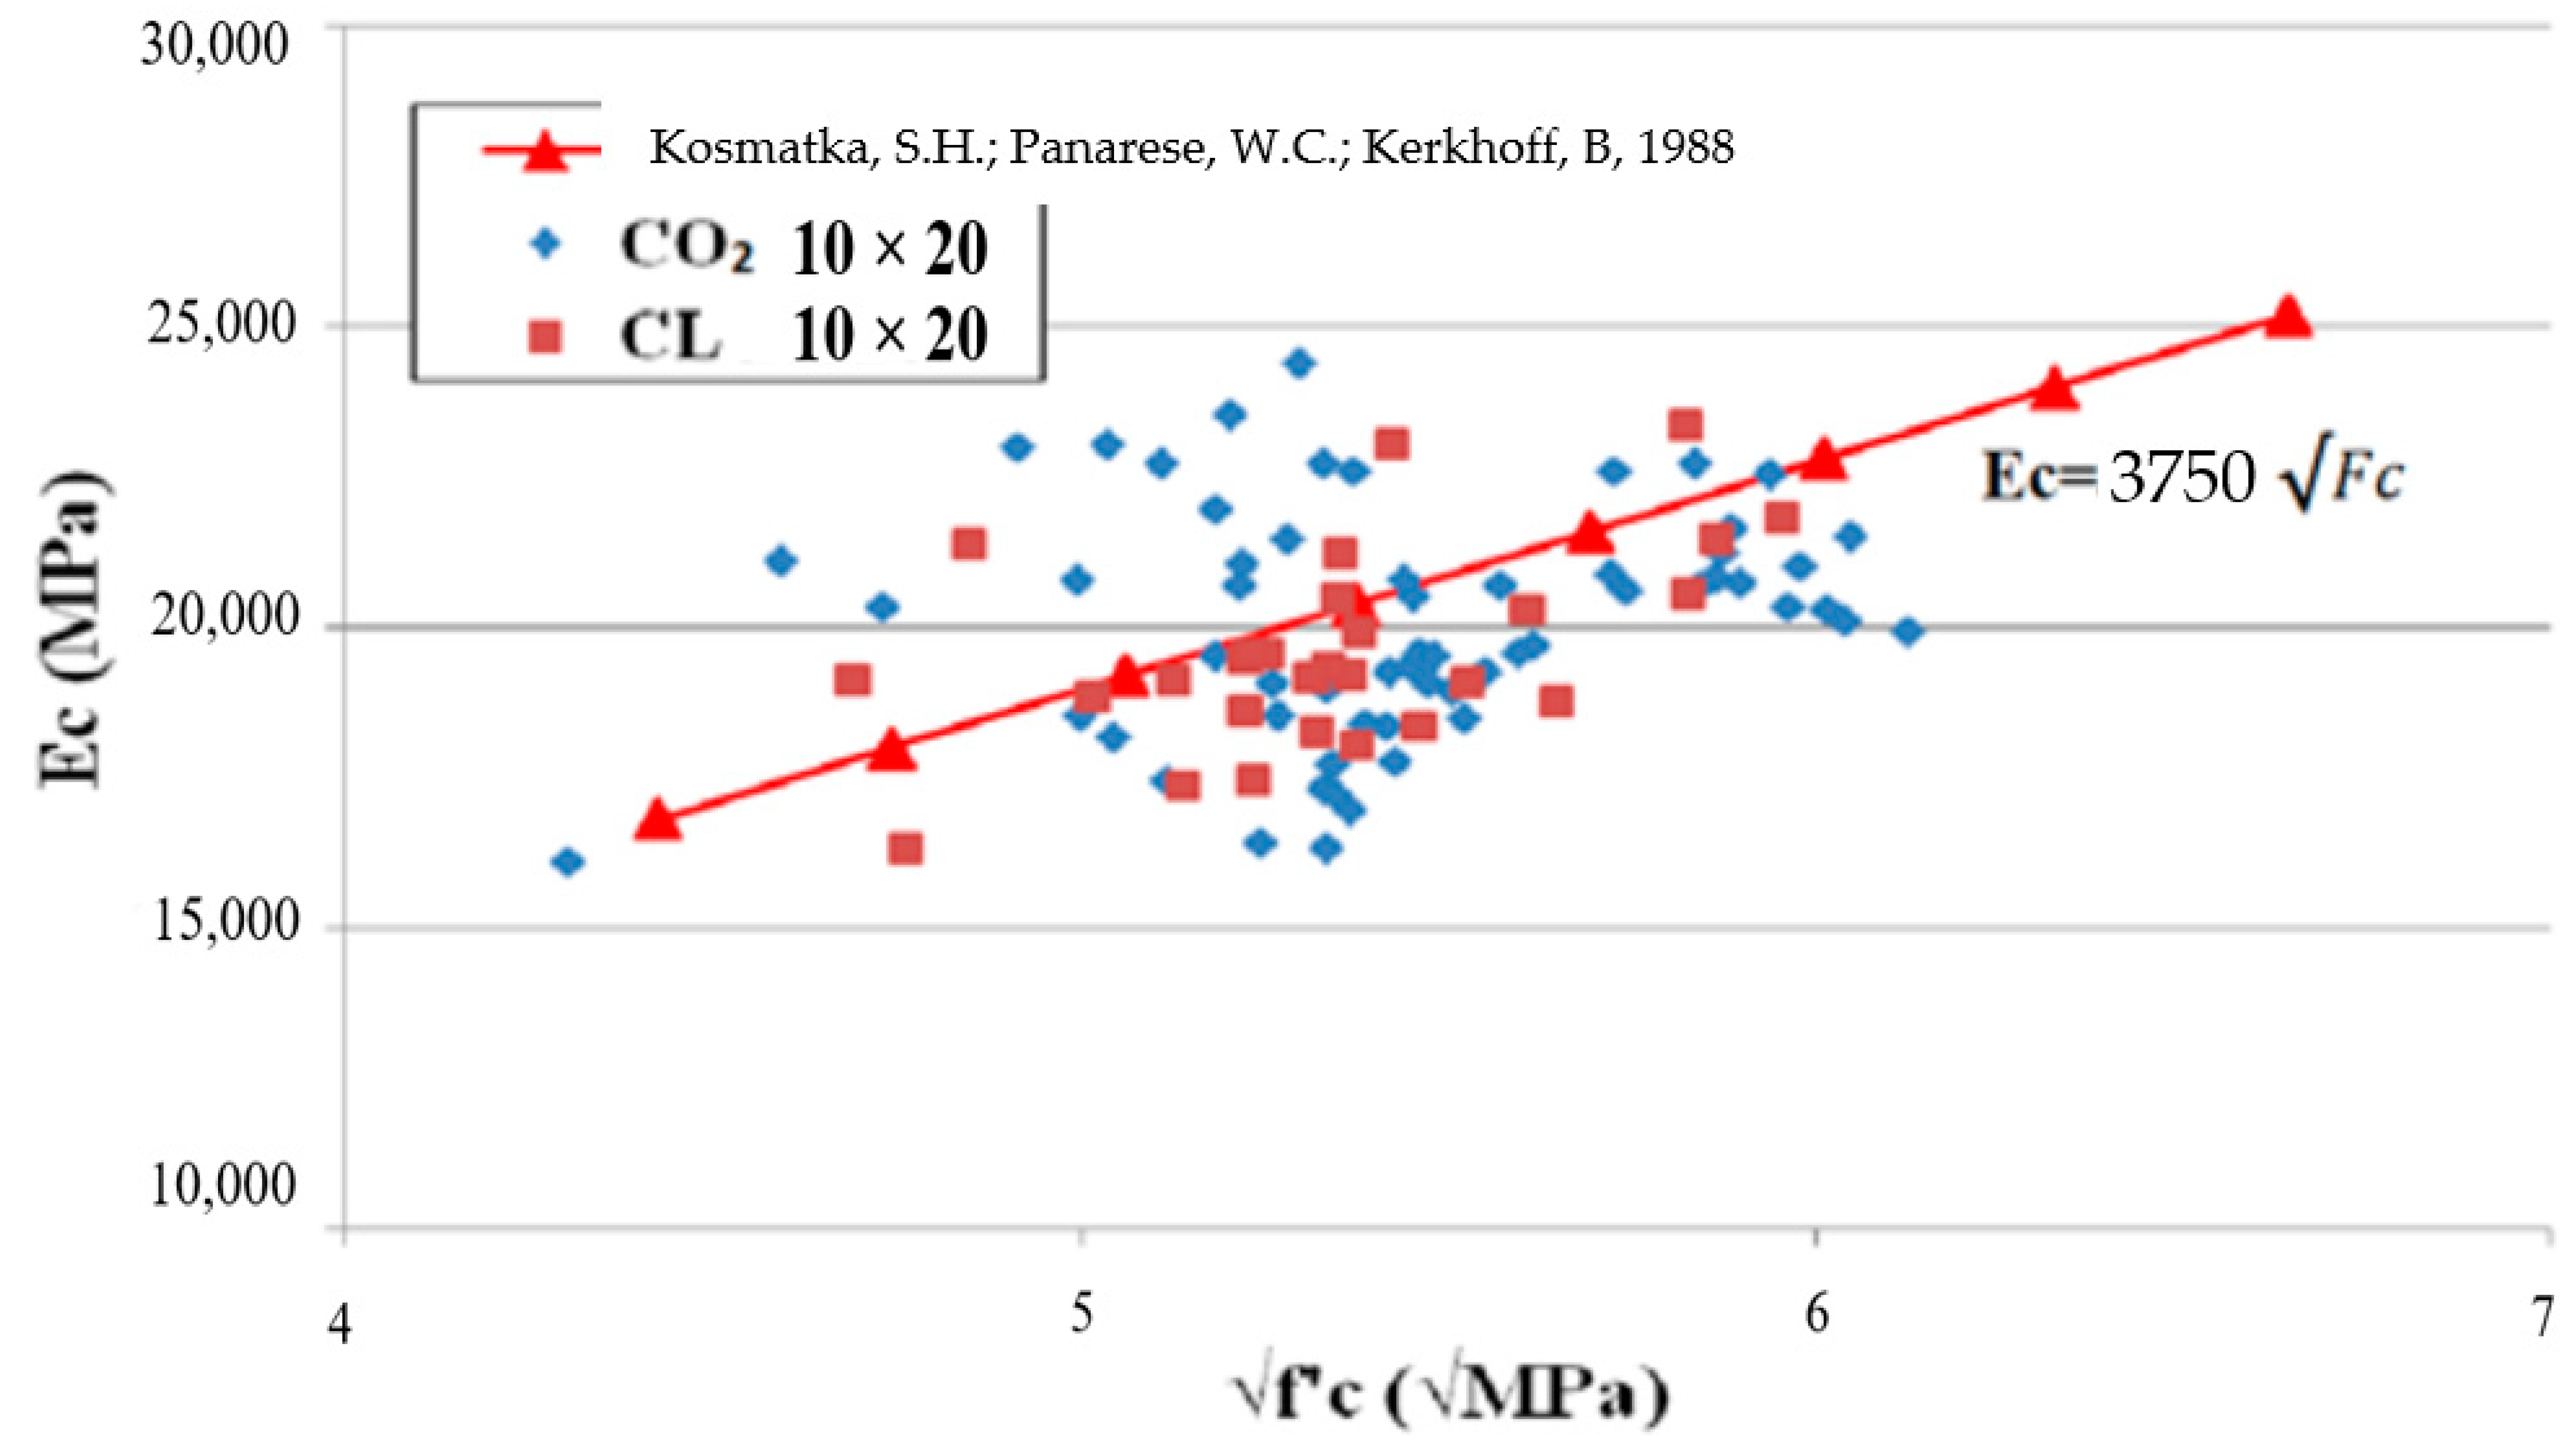
- Compared with conventional water-cured concrete, the elastic modulus of carbon dioxide-cured concrete also increases continuously in proportion to the square root of the compressive strength. Choosing the most appropriate type of CO2 curing for fresh concrete will have a significant impact on the modulus of elasticity.
- (4)
- There is only a minor difference in four Ec empirical equations obtained from 5 × 10 cm or 10 × 20 cm cylinders by CO2 or water curing, whereas the 10 × 20 cm cylinders obtained larger elastic modulus coefficients. The average COVs of the elastic modulus Ec from 5 × 10 cm and 10 × 20 cm cylinders are 10.1% and 9.2%, respectively.
- (5)
- The results of neutralization depth showed that the highest neutralization depth of carbon curing specimen only penetrated 1.71 mm, and the degree of neutralization was 6.68%. This also shows that the chromatograms of the seven CO2-cured samples are very similar, and there is no obvious difference due to the low neutralization degree.
Author Contributions
Funding
Institutional Review Board Statement
Informed Consent Statement
Data Availability Statement
Conflicts of Interest
References
- Young, J.F.; Berger, R.L.; Breese, J. Accelerated Curing of Compacted Calcium Silicate Mortars on Exposure to CO2. J. Am. Ceram. Soc. 1974, 57, 394–397. [Google Scholar] [CrossRef]
- Zhan, B.; Poon, C.S.; Liu, Q.; Kou, S.; Shi, C. Experimental study on CO2 curing for enhancement of recycled aggregate properties. Constr. Build. Mater. 2014, 67, 3–7. [Google Scholar] [CrossRef]
- Ye, G. Carbon Dioxide Uptake by Concrete through Early Age Curing. Master’s Thesis, University of McGill University, Montréal, QC, Canada, 2003. [Google Scholar]
- Lee, M.G.; Wang, W.-C.; Huang, Y.; Su, Y.-M.; Jiang, Q. Effect of carbon dioxide curing on strength development of cement mortar. Key Eng. Mater. 2017, 748, 323–327. [Google Scholar] [CrossRef]
- Zhan, B.; Poon, C.S.; Shi, C. Materials characteristics affecting CO2 curing of concrete blocks containing recycled aggregates. Cem. Concr. Compos. 2016, 67, 50–59. [Google Scholar] [CrossRef]
- Kashef-Haghighi, S.; Shao, Y.; Ghoshal, S. Mathematical modeling of CO2 uptake by concrete during accelerated carbonation curing. Cem. Concr. Res. 2015, 67, 1–10. [Google Scholar] [CrossRef]
- Berger, R.L.; Young, J.F.; Leung, K. Acceleration of Hydration of Calcium Silicates by Carbon Dioxide Treatment. Nat. Phys. Sci. 1972, 240, 16–18. [Google Scholar] [CrossRef]
- Shaikh, F.U.A.; Supit, S.W.M. Mechanical and durability properties of high volume fly ash (HVFA) concrete containing calcium carbonate (CaCO3) nanoparticles. Constr. Build. Mater. 2014, 70, 309–321. [Google Scholar] [CrossRef]
- He, P.; Shi, C.; Tu, Z.; Poon, C.S.; Zhang, J. Effect of further water curing on compressive strength and microstructure of CO2-cured concrete. Cem. Concr. Compos. 2016, 72, 80–88. [Google Scholar] [CrossRef]
- Zhang, D.; Cai, X.; Jaworska, B. Effect of pre-carbonation hydration on long-term hydration of carbonation-cured cement-based materials. Constr. Build. Mater. 2020, 231, 117122. [Google Scholar] [CrossRef]
- Zhang, D.; Wu, H.; Li, V.C.; Ellis, B.R. Autogenous healing of engineered cementitious composites (ECC) based on MgO-fly ash binary system activated by carbonation curing. Constr. Build. Mater. 2020, 238, 117672. [Google Scholar] [CrossRef]
- Zhang, D.; Liu, T.; Shao, Y. Weathering carbonation behavior of concrete subject to early-age carbonation curing. J. Mater. Civ. Eng. 2020, 32, 04020038. [Google Scholar] [CrossRef]
- He, Z.; Wang, S.; Mahoutian, M.; Shao, Y. Flue gas carbonation of cement-based building products. J. CO2 Util. 2020, 37, 309–319. [Google Scholar] [CrossRef]
- Qin, L.; Gao, X.; Su, A.; Li, Q. Effect of carbonation curing on sulfate resistance of cement-coal gangue paste. J. Clean. Prod. 2021, 278, 123897. [Google Scholar] [CrossRef]
- Zhang, D.; Shao, Y. Effect of early carbonation curing on chloride penetration and weathering carbonation in concrete. Constr. Build. Mater. 2016, 123, 516–526. [Google Scholar] [CrossRef]
- Rostami, V.; Shao, Y.; Boyd, A.J. Durability of concrete pipes subjected to combined steam and carbonation curing. Constr. Build. Mater. 2011, 25, 3345–3355. [Google Scholar] [CrossRef]
- Rostami, V.; Shao, Y.; Boyd, A.J. Carbonation curing versus steam curing for precast concrete production. J. Mater. Civ. Eng. 2012, 24, 1221–1229. [Google Scholar] [CrossRef]
- Zhan, B.; Xuan, D.; Poon, C.S.; Shi, C. Effect of curing parameters on CO2 curing of concrete blocks containing recycled aggregates. Cem. Concr. Compos. 2016, 71, 122–130. [Google Scholar] [CrossRef]
- Jang, J.; Lee, H. Microstructural densification and CO2 uptake promoted by the carbonation curing of belite-rich Portland cement. Cem. Concr. Res. 2016, 82, 50–57. [Google Scholar] [CrossRef]
- Mo, L.; Zhang, F.; Deng, M. Mechanical performance and microstructure of the calcium carbonate binders produced by carbonating steel slag paste under CO2 curing. Cem. Concr. Res. 2016, 88, 217–226. [Google Scholar] [CrossRef]
- Zhang, D.; Cai, X.; Shao, Y. Carbonation curing of precast fly ash concrete. J. Mater. Civ. Eng. 2016, 28, 04016127. [Google Scholar] [CrossRef]
- Su, A.; Chen, T.; Gao, X.; Li, Q.; Qin, L. Effect of carbonation curing on durability of cement mortar incorporating carbonated fly ash subjected to Freeze-Thaw and sulfate attack. Constr. Build. Mater. 2022, 341, 127920. [Google Scholar] [CrossRef]
- Pan, X.; Shi, C.; Farzadnia, N.; Hu, X.; Zheng, J. Properties and microstructure of CO2 surface treated cement mortars with subsequent lime-saturated water curing. Cem. Concr. Compos. 2019, 99, 89–99. [Google Scholar] [CrossRef]
- Zhang, D.; Shao, Y. Enhancing chloride corrosion resistance of precast reinforced concrete by carbonation curing. ACI Mater. J. 2019, 116, 3–12. [Google Scholar] [CrossRef]
- Saito, T.; Khamhou, S.; Yumoto, T.; Otsuki, N. Permeability of sulfate ions in cementitious materials containing γ-Ca2SiO4 after autoclave curing and accelerated carbonation. J. Adv. Concr. Technol. 2011, 9, 223–230. [Google Scholar] [CrossRef] [Green Version]
- Mo, L.; Panesar, D.K. Effects of accelerated carbonation on the microstructure of Portland cement pastes containing reactive MgO. Cem. Concr. Res. 2012, 42, 769–777. [Google Scholar] [CrossRef]
- Sharma, D.; Goyal, S. Accelerated carbonation curing of cement mortars containing cement kiln dust: An effective way of CO2 sequestration and carbon footprint reduction. J. Clean. Prod. 2018, 192, 844–854. [Google Scholar] [CrossRef]
- Liu, M.; Hong, S.; Wanga, Y.; Zhang, J.; Hou, D.; Dong, B. Compositions and microstructures of hardened cement paste with carbonation curing and further water curing. Constr. Build. Mater. 2021, 267, 121724. [Google Scholar] [CrossRef]
- Seo, J.H.; Park, S.M.; Lee, H.K. Evolution of the binder gel in carbonation-cured Portland cement in an acidic medium. Cem. Concr. Res. 2018, 109, 81–89. [Google Scholar] [CrossRef]
- Liu, Y.; Zhuge, Y.; Chow, C.W.K.; Keegan, A.; Li, D.; Pham, P.N.; Huang, J.; Siddique, R. Properties and microstructure of concrete blocks incorporating drinking water treatment sludge exposed to early-age carbonation curing. J. Clean. Prod. 2020, 261, 121257. [Google Scholar] [CrossRef]
- Xuan, D.; Zhan, B.; Poon, C.S. Development of a new generation of eco-friendly concrete blocks by accelerated mineral carbonation. J. Clean. Prod. 2016, 133, 1235–1241. [Google Scholar] [CrossRef]
- Ravikumar, D.; Zhang, D.; Keoleian, G.; Miller, S.; Sick, V.; Li, V. Carbon dioxide utilization in concrete curing or mixing might not produce a net climate benefit. Nat. Community 2021, 12, 855. [Google Scholar] [CrossRef]
- Day, R.L. Strength Measurement of Concrete Using Different Cylinder Sizes: A Statistical Analysis. Cem. Concr. Aggreg. 1994, 16, 21–30. [Google Scholar]
- Lee, M.; Wang, Y.C.; Xiao, W.X.; Lee, M.J.; Huang, T.Y. Effect of CO2 Curing on the Strength of High Strength Pervious Concrete. Key Eng. Mater. 2020, 846, 207–212. [Google Scholar] [CrossRef]
- Lee, M.-G.; Wang, Y.-C.; Su, Y.-M.; Kao, S.-H. Effect of cylinder size on the Compressive Strength of concrete CO2 curing. In GeoChina 2018: Transportation and Geotechniques: Materials, Sustainability and Climate; Springer: Cham, Switzerland, 2019; pp. 33–42. [Google Scholar]
- Malhotra, V.M. Are 4 by 8-in Concrete Cylinders as Good as 6 by 12-in Cylinders for Quality Control of Concrete? ACI J. 1976, 73, 33–36. [Google Scholar]
- Lee, B.J.; Kee, S.-H.; Oh, T.; Kim, Y.-Y. Effect of Cylinder Size on the Modulus of Elasticity and Compressive Strength of Concrete from Static and Dynamic Tests. Adv. Mater. Sci. Eng. 2015, 2015, 580638. [Google Scholar] [CrossRef] [Green Version]
- ASTM C150−07; Standard Specification for Portland Cement, Annual Book of ASTM Standards. ASTM International: West Conshohocken, PA, USA, 2007; pp. 1–8.
- ASTM C211.1−91; Standard Practice for Selecting Proportions for Normal, Heavyweight, and Mass Concrete. Annual Book of ASTM Standards. ASTM International: West Conshohocken, PA, USA, 2009; pp. 1–38.
- ASTM C39/C39M−16; Standard Test Method for Compressive Strength of Cylindrical Concrete Specimens. ASTM International: West Conshohocken, PA, USA, 2016; pp. 1–8.
- Kosmatka, S.H.; Panarese, W.C.; Kerkhoff, B. Design and Control of Concrete Mixtures; Portland Cement Association: Skokie, IL, USA, 1988. [Google Scholar]
- Liao, W.; Lin, Z.; Zhan, Y. Research on the Proposed Formula for Elastic Modulus of Concrete in Taiwan. Struct. Eng. 2016, 31, 5–31. [Google Scholar]
- ACI 318-19; Building Code Requirements for Structural Concrete and Commentary. American Concrete Institute: Indianapolis, IN, USA, 2019; pp. 1–623.
- ACI 363-10; Report on High-Strength Concrete. American Concrete Institute: Indianapolis, IN, USA, 2010; pp. 1–65.
- ASTM C78/C78M-18; Standard Test Method for Flexural Strength of Concrete (Using Simple Beam with Third-Point Loading). ASTM International: West Conshohocken, PA, USA, 2018; pp. 1–5.
- Lee, M.-G.; Wang, Y.-C.; Kao, S.-H.; Su, Y.-M.; Huang, T. Effect of Concrete Properties by Carbon Dioxide Curing. Chin. J. Civ. Hydraul. Eng. 2019, 31, 263–271. [Google Scholar]
- Dixit, A.; Du, H.; Dai Pang, S. Carbon capture in ultra-high performance concrete using pressurized CO2 curing. Constr. Build. Mater. 2021, 288, 123076. [Google Scholar] [CrossRef]


| Advantages of Concrete CO2 Curing | Disadvantages of Concrete CO2 Curing |
|---|---|
| 1. Fast strength gain. 2. A stable solid product is produced due to the carbonization process. 3. CO2 is an important greenhouse gas and its use in concrete curing consumes and reduces the carbon content of the atmosphere. 4. Reduction of porosity, permeability, and ettringite formation. 5. Increased resistance to external sodium and magnesium sulfate, acid attack. 6. Increased the resistance to attack by weathering carbonation, damage from freeze–thaw, and drying shrinkage. 7. Reduce chloride ions penetration. | 1.The reaction of CO2 with the concrete elements lowers the pH value. Therefore, it may cause corrosion of steel bars in reinforced concrete. 2.For precast units only and not suitable for reinforced structure. |
| Mix Proportion | W/C | Cement | Aggregate | Sand | Water |
|---|---|---|---|---|---|
| Normal concrete | 0.68 | 302 | 885 | 1021 | 205 |
| High-strength concrete | 0.41 | 500 | 885 | 881 | 205 |
| Water–Cement Ratio | Pressure (MPa) | CO2 (%) | Time (Hour) |
|---|---|---|---|
| Normal concrete (0.68) High-strength concrete (0.41) | 0.2 0.4 0.8 | 50 75 100 | 1 3 6 |
| Age of Hardening | Specimen ID | Φ5 × 10 | Specimen ID | Φ10 × 20 | Specimen ID | Φ15 × 30 |
|---|---|---|---|---|---|---|
| 3-day Strength | 50-1-2 | 16.82 | 100-6-4 | 15.40 | 50-1-2 | 16.15 |
| 100-6-4 | 15.41 | 100-1-2 | 14.66 | 50-1-4 | 15.27 | |
| 100-1-2 | 15.35 | 75-3-4 | 14.19 | 100-6-4 | 15.00 | |
| CL | 12.34 | CL | 12.49 | CL | 12.59 | |
| 7-day Strength | 100-6-2 | 22.93 | 50-3-2 | 24.24 | 50-3-2 | 22.61 |
| 50-3-2 | 22.20 | 100-1-2 | 21.81 | 50-1-2 | 22.59 | |
| 100-6-4 | 21.97 | 75-6-2 | 21.12 | 100-1-2 | 21.55 | |
| CL | 19.33 | CL | 15.90 | CL | 16.42 | |
| 28-day Strength | 50-1-2 | 36.05 | 75-6-2 | 29.45 | 50-3-2 | 30.15 |
| 50-3-2 | 34.23 | 50-6-2 | 28.95 | 50-3-4 | 29.83 | |
| 75-1-4 | 32.22 | 50-3-2 | 28.94 | 50-1-2 | 28.71 | |
| CL | 31.58 | 75-3-2 | 27.65 | 100-1-2 | 26.73 | |
| 90-day Strength | L-50-1-2 | 40.95 | L-50-3-2 | 36.62 | L-50-1-2 | 33.52 |
| L-100-1-2 | 39.16 | L-100-6-2 | 36.49 | L-100-6-2 | 33.26 | |
| L-100-6-2 | 38.49 | L-75-3-4 | 36.13 | L-100-1-2 | 33.22 | |
| CL | 34.06 | CL | 30.02 | CL | 30.12 |
| Type of Concrete/Age | Φ5 × 10 cm | Φ10 × 20 cm | Φ15 × 30 cm | ks5(fc5/fc15), ks10(fc10/fc15) |
|---|---|---|---|---|
| Normal concrete/3 day | 12.34 | 12.49 | 12.53 | 0.98, 0.99 |
| Normal concrete/7 day | 19.33 | 15.90 | 16.42 | 1.18, 0.97 |
| Normal concrete/28 day | 31.59 | 27.65 | 26.73 | 1.18, 1.03 |
| Normal concrete/90 day | 34.06 | 30.02 | 30.12 | 1.13, 1.00 |
| High strength concrete/3 day | 31.70 | 29.59 | 31.29 | 1.01, 0.95 |
| High strength concrete/7 day | 45.80 | 41.46 | 41.72 | 1.10, 0.99 |
| High strength concrete/28 day | 55.60 | 53.58 | 48.64 | 1.14, 1.10 |
| High strength concrete/90 day | 65.43 | 53.78 | 56.20 | 1.16, 0.96 |
| Cylinder Size + Curing | Empirical Equation | Standard Deviation | COV (%) |
|---|---|---|---|
| Φ5×10 cm + CO2 Cured | Ec = 3498.5(f ′c) 0.5 | 322.8 | 9.2 |
| Φ5×10 cm + H2O Cured | Ec = 3536.6(f ′c) 0.5 | 385.3 | 10.9 |
| Φ10×20 cm + CO2 Cured | Ec = 3704.8(f ′c) 0.5 | 405.8 | 10.9 |
| Φ10×20 cm + H2O Cured | Ec = 3673.1(f ′c) 0.5 | 273.6 | 7.5 |
| ACI 318 empirical equation | Ec = 3750 (f ′c) 0.5 recommend for use in Taiwan. | ||
| Specimen ID | P | L | b | d | R (Rupture Moduli) | f′c | K | √f′c | K(Average) |
|---|---|---|---|---|---|---|---|---|---|
| CH (water curing) | 4505.2 | 50 | 15 | 15 | 6.54 | 45.55 | 3.10 | 6.75 | 2.92 |
| 3984.38 | 5.79 | 2.74 | |||||||
| 4183.26 | 6.08 | 2.88 | |||||||
| 4293.79 | 6.23 | 2.95 | |||||||
| H-100-6-4 (CO2 curing) | 3972.82 | 50 | 15 | 15 | 5.77 | 46.17 | 2.71 | 6.79 | 2.95 |
| 3714.49 | 5.40 | 2.54 | |||||||
| 4733.96 | 6.88 | 3.23 | |||||||
| 4888.19 | 7.10 | 3.34 |
| Specimen ID | 650 °C (%) | 900 °C (%) | 650~900 °C (%) |
|---|---|---|---|
| CL (water curing) | 92.92 | 89.74 | 3.18 |
| L-50-1-4 | 93.54 | 91.21 | 2.33 |
| L-50-6-8 | 94.59 | 92.27 | 2.32 |
| L-50-6-4 | 93.8 | 91.58 | 2.22 |
| L-50-6-2 | 93.86 | 91.8 | 2.06 |
| L-100-6-4 | 95.13 | 93.27 | 1.86 |
| L-100-6-2 | 93.41 | 91.64 | 1.77 |
| Specimen ID | Carbonation Depth (mm) | Neutralization Degree (%) |
|---|---|---|
| L-50-6-8 | 1.71 | 6.68 |
| L-75-3-4 | 1.36 | 5.38 |
| L-100-3-4 | 1.35 | 5.33 |
| L-75-3-2 | 1.29 | 5.03 |
| L-75-6-4 | 1.22 | 4.67 |
| CL (water curing) | 0.00 | 0.00 |
Publisher’s Note: MDPI stays neutral with regard to jurisdictional claims in published maps and institutional affiliations. |
© 2022 by the authors. Licensee MDPI, Basel, Switzerland. This article is an open access article distributed under the terms and conditions of the Creative Commons Attribution (CC BY) license (https://creativecommons.org/licenses/by/4.0/).
Share and Cite
Wang, Y.-C.; Lee, M.-G.; Wang, W.-C.; Kan, Y.-C.; Kao, S.-H.; Chang, H.-W. CO2 Curing on the Mechanical Properties of Portland Cement Concrete. Buildings 2022, 12, 817. https://doi.org/10.3390/buildings12060817
Wang Y-C, Lee M-G, Wang W-C, Kan Y-C, Kao S-H, Chang H-W. CO2 Curing on the Mechanical Properties of Portland Cement Concrete. Buildings. 2022; 12(6):817. https://doi.org/10.3390/buildings12060817
Chicago/Turabian StyleWang, Yung-Chih, Ming-Gin Lee, Wei-Chien Wang, Yu-Cheng Kan, Shih-Hsuan Kao, and Hsien-Wen Chang. 2022. "CO2 Curing on the Mechanical Properties of Portland Cement Concrete" Buildings 12, no. 6: 817. https://doi.org/10.3390/buildings12060817
APA StyleWang, Y.-C., Lee, M.-G., Wang, W.-C., Kan, Y.-C., Kao, S.-H., & Chang, H.-W. (2022). CO2 Curing on the Mechanical Properties of Portland Cement Concrete. Buildings, 12(6), 817. https://doi.org/10.3390/buildings12060817