Abstract
The high risk of financing, building, and operating Public–private partnerships (PPPs) often results from the event that participants can barely obtain expected economic returns, thus inhibiting private enterprises’ willingness to participate in PPPs. To increase private enterprises’ desire to participate, this study constructed an evolutionary game model of private enterprises’ participation in PPPs, focusing on the perspective of the mode of incentive. This model revealed the evolutionary law of private enterprises’ participation behavior under different modes of incentive. The results indicate that: First, there is a positive correlation between the intensity of government incentive, the investment return rate, and the probability of private enterprises choosing to participate in PPPs. Specifically, the impact of the investment return rate is more sensitive than the other factors. Second, the cost rate of financing and the risk cost of project uncertainty are negatively correlated with the probability of private enterprises choosing to participate in PPPs, and the impact of the project risk cost is more sensitive than the other factors in this case.
1. Introduction
Public–private partnerships (PPPs) are a form of cooperation in which public organizations and private organizations combine to provide public goods or services [1]. Compared with traditional procurement, PPPs can allow the public and private sectors’ complementary advantages to complement each other, thereby improving infrastructure efficiency and quality [2]. Since 1982 when Britain first adopted PPPs in public infrastructure, PPPs have been developed and applied on a large scale all over the world [3,4]. In 2014, China experienced the beginning of a new round of PPPs. The State Council, the National Development and Reform Commission, and the Ministry of Finance successively issued more than 100 relevant policy documents to encourage and guide private enterprises in participating in PPPs. Since the implementation of the Belt and Road Initiative, the promotion of the Rural Revitalization Strategy, and the acceleration of the construction of “new infrastructure and urbanization initiatives”, China’s public infrastructure projects operating through PPPs are showing unprecedented levels of construction, and private enterprises are embracing the strong development opportunities [5]. However, after more than seven years of implementation, according to data released by the Ministry of Finance, the participation rate of private enterprises is not high [6], and the phenomenon of “the state-owned enterprises enter into, but the private enterprises exit” can be seen [7]. As of 20 May 2022, the cumulative investment of PPP projects nationwide was 21.1 trillion yuan, and the number of transactions was 12,853. Of these figures, investments by private enterprises accounted for 15.92% of the total, and the number of private enterprises accounted for 32.50% of the total. As it is well-known that the capital needs of PPPs are gigantic, since state-owned enterprises have ample funds and a strong ability to take risks when it comes to cash flow streams, they are more suitable to participating in PPPs. Currently, state-owned enterprises are indeed involved in 70% of PPPs. However, if the number of state-owned enterprises participating in PPPs is too large, this does not help to share the financial pressure of the government. Worse, in Chinese PPPs, state-owned businesses frequently use the benefits of control and relational relationships based on mutual confidence and shared values to implement tunneling behavior, which harms the projects’ overall interests and is even detrimental to the long-term development of PPP schemes [8]. Therefore, improving the participation rate of private enterprises is an essential prerequisite for the effective implementation of PPPs.
Scholars who have examined PPPs have found that the low participation rate of private enterprises in PPPs is caused by external environmental risk factors such as the economy, the system, the society, and the project itself [9]. Osei-Kyei and Chan also found that the three critical factors in attracting private companies to participate in PPPs are government support and recognition, positive government attitudes, and political stability [10]. In addition, other critical factors or barriers inhibiting the involvement of the participation of private sectors were also explored, such as project changes [11], government attention and intervention [6], and delivery modes [12]. In fact, the balance of risk and return is among the most important factor for private enterprises participating in PPPs [13]. Generally, governments procure infrastructure PPPs through tendering processes and select potential participants. The successful bidder then creates a special purpose vehicle (SPV), which is in charge of developing the project [13,14]. According to Dixon et al. [15], there is a direct relationship between PPP project risks assumed by the SPV and the cost of finance. From a private sector perspective, a PPP project is an investment opportunity with a long-term contract and some related risks [14]. When the project is granted, a comparison can be drawn between the project’s internal rate of return and the price the public sector pays for the risks transferred to the private sector. In the survey conducted by Demirag et al. [16], three-quarters of respondents to the specific question of target returns reported rates between 9 and 15%. However, in China, the average rate of return is only 6.5% in PPPs [17]. There has been relatively little research into the relationship between the expected profit and the participation behavior of private enterprises during the decision stage of PPPs. More importantly, the existing literature have rarely been concerned with the interaction between incentive modes of the public and strategic behaviors of private enterprises. Specifically, private sectors care about the expected returns under specific incentive or compensation modes. For instance, they may compare target returns with potential risks based on the incentive strategies of public organizations. If the expected return is higher than the risk reward, they would then participate in the PPP project. If the expected return is lower than the risk reward, they would not participate in the PPP project. When taking risk management into consideration, the returns are directly linked to incentive patterns. In this process, since the information about returns and risks is incomplete and strategic interaction between the public and the private is dynamic, the process of strategy selection can be perceived as an evolutionary game.
To increase the willingness of private enterprises to participate in the decision stage of PPP projects, this study aimed to quantify the returns under different incentive modes, taking the return as the criterion for whether private enterprises would participate in PPPs. Furthermore, it analyzed how the behaviors of both parties evolved dynamically with the differences. The remainder of this article is organized as follows. First, a comprehensive literature review concerning cooperation and decision-making in PPPs is presented, along with an account of evolutionary game theory and the participation behavior of private enterprises. Next, an evolutionary game model and the related model solution are constructed and conducted. The dynamic evolution of equilibrium positions and the probability of participation through government incentives are then discussed. Subsequently, the factors and their sensitivities are explained through a numerical example. Finally, the article concludes by stating the implications of the research for private enterprises’ participation in PPPs.
2. Theoretical Background
2.1. Cooperation and Participation in PPPs
Infrastructure projects can provide a range of societal, environmental, and economic benefits for many entities. In China, PPPs are common ways of handling such projects for two reasons. First, limitations to public funding have led governments to encourage the private sector to engage in various long-term arrangements for capital-intensive projects. Second, a comprehensive approach for the whole area may be more efficient and profitable than piecemeal development via individual owners’ interventions [18]. Thus, a key characteristic of PPPs is that the three tasks of financing, building a facility, and subsequently operating it are bundled and delegated to a group of private partners. Such a group associated with a bidding consortium is selected as preferred participants through tendering processes [14]. The group of private partners then create the SPV and are the main equity investors that manage and develop the PPP project [13], and the main investors assume the risks of financing, building, and operating an infrastructure asset in exchange for suitable economic returns [19]. However, due to the uncertain, asset-specific, and complex issues associated with PPPs, private sectors grouped in SPVs are also vulnerable to multiple long-term returns and risks challenges [20]. Thus, diverse strategies, including whether to adopt a specific PPP or the traditional contracting approach for a specific project [21], how the decision of bundling the financing, building, and operating stages affects the incentives in PPP [22], and how to allocate risk among participants involved in PPP projects [23,24], might result in the distinct economic returns of the participants. Additionally, the risk preference, profit sharing, government attention, and delivery modes would affect the involvement of the private sectors. Therefore, the cooperation of the public and private sectors requires them to negotiate conflicting goals, and each participant in the system would adopt strategic interactions due to differences in their excepted returns.
2.2. Evolutionary Game Theory
In general, game theory is used to analyze strategy selection in terms of expected payoffs [25]. From the point of view of economic optimization, this theory provides a mathematical framework to model strategic behavior and demonstrate resulting decisions [26]. Therefore, game theory is the most effective theory of decision-making. It is an economic tool for studying cooperation, conflict, and strategic interaction in the decision-making process [27].
Furthermore, evolutionary game theory (EGT) explains the process by which entities learn, compete, and adapt to each other in biological evolution [28]. Unlike traditional game theory that focuses on perfect rationality, in EGT, participants are assumed to possess bounded rationality and be under the conditions of imperfect information. The theory emphasizes the dynamic process of changing strategies, rather than static equilibrium. The EGT can fully reflect the relationship between strategy change and payoff fluctuation, and this advantage has led the EGT to be applied in different research fields [29]. It has penetrated many areas of research that deal with social and economic systems [30]. The potential is great in economic applications, especially [31].
Economic conflicts and strategic interactions are common in terms of PPP applications, and private enterprises are not always entirely rational. Simultaneously, they attempt to maximize expected payoffs, but information and risks are not complete. This is especially true in complicated market competition, in which decision-makers seek evolutionarily stable strategies (ESS) through constant trial and error, imitation, and learning [32,33]. Therefore, the EGT is suitable for analyzing the cooperation strategies of the leading participants in PPPs. In the next section, we describe the model and its assumptions.
3. Modeling
3.1. Description of the Model
PPPs are a way of financing projects and an innovative way to marketize the supply of public services. PPPs allow all participants to cooperate to form a complementary decision-making mechanism. They break the double puzzles of government failure and market failure in public projects. They promote reforms to the supply side of the social structure in the field of public services. Participants in PPPs have different goals, especially given that those participants can be government departments and private enterprises. They must constantly interact and play games when they participate in PPPs. To maximize their expected payoffs, they may choose cooperation or non-participation strategies, and their behavioral choices will show bounded rationality under uncertain situations. The evolutionary game model can be used to analyze the decision-making mechanisms of governments and private enterprises as they cooperate in PPPs.
3.2. Assumptions and Parameters
The assumptions are hypothesized as follows: Assumption 1. The game environment for public organizations and private enterprises is one of incomplete information. Both parties are bounded rational decision-makers, and each party independently and dynamically chooses their behavior strategy. Both parties make decisions or take actions to maximize their profits based on past experiences or practices [31].
Assumption 2. The set of strategies of the private enterprises is = (Participation, Non-participation), in which the probability of adopting the “participation” strategy is and the probability of adopting the “non-participation” strategy is . The set of strategies of the public organizations is = (Incentive, Neutrality), in which the probability of adopting the “incentive” strategy is , and the probability of adopting the “neutrality” strategy is .
Assumption 3. To encourage private enterprises to participate in PPPs, when a public organization chooses the “incentive” strategy, it will give private enterprises preferential policies such as tax exemptions and reduced interest. If the incentive cost for the public organization is , then the economic incentive for the private company is , which is the incentive intensity. At the same time, let the public benefit of the PPP be ; that is, under the encouragement of the public sector, private enterprises can provide better public services, and the public benefit at this time is . If the public sector maintains a neutral attitude towards private enterprises participating in PPPs or has potential thresholds such as “glass doors” or “revolving doors”, which increase the institutional transaction costs of a private enterprise participating in a PPP, the public benefit is then , , and the public sector will suffer certain losses of reputation.
Assumption 4. Under a given contract, it is reasonable to anticipate that the private sector will adopt a cost-cutting strategy while retaining an acceptable level of participation to avoid high-risk damage [34]. It is assumed that the total investment of private enterprises in PPP projects is , the investment return rate is , the financing cost rate is , the project risk cost is , and the basic income of private enterprises is . If the public sector chooses the “incentive” strategy, private enterprises will increase their income . Currently, the private sector’s net income is , and the government’s net income is . If the public sector chooses the strategy of “neutrality”, the institutional transaction costs of private sectors, , will increase. Currently, the net income of private enterprises is , and the government’s net income is .
3.3. Basic Model
The payoff matrix can be obtained based on the preceding assumptions and analyses, as shown in Table 1.

Table 1.
Payoff matrix between the public and private enterprises.
- 1.
- The expected payoffs of private enterprise (E)
The payoffs of private enterprise adopting the strategy of “active participation” are:
The payoffs of private enterprise adopting the “non-participation” strategy are:
The expected payoffs of private enterprise (E) adopting a mixed strategy are:
According to the Malthusian dynamic equation principle, the speed of the dynamic change of strategy of a private enterprise can be expressed by a dynamic differential equation, and the replication dynamic equation of the private enterprise can be obtained as follows:
- 2.
- The expected payoffs for the public organization (P)
The payoffs of the public organization adopting the “incentive” strategy are:
The payoffs of the public organization adopting the “neutral” strategy are:
The expected payoffs of the public organization adopting a mixed strategy are:
The replication dynamic equation of the public (P) is:
3.4. Model Solution: Replicator Dynamics
To sum up, a two-dimensional dynamic system can be obtained. By solving two duplicate dynamic equations and simultaneously, we learn that (0,0), (0,1), (1,0), (1,1), and are the five local equilibrium points of this two-dimensional dynamic system, among which:
4. Model Analysis
4.1. Dynamic Evolution Analysis of Equilibrium Points
According to the local stability analysis method proposed by Freedman [35], the stability of equilibrium points for an evolutionary system can be calculated using a Jacobian matrix. The specific method of judging is as follows: if the determinant of the Jacobian matrix of the equilibrium point is and the trace is , it can be judged that the corresponding equilibrium point has asymptotic stability. This is called the ESS point. If and , it can be assumed that the related equilibrium point is unstable. If , it can be judged that the corresponding equilibrium point is a saddle point. Therefore, according to the replicated dynamic Equations (4) and (8), the Jacobian matrix of participatory decision-making in PPPs is shown by Equation (11):
where ; ; ; .
As for Equation (11), its determinant equation is , and the trace of this Jacobian matrix is . The determinants and traces of the four equilibrium points (0,0), (0,1), (1,0), and (1,1) are shown in Table 2.
Table 2.
Determinants and traces of Jacobian matrix at the equilibrium points of participation behavior decision in PPPs.
Through an analysis of the equilibrium points of private enterprises’ participation behavior, the local stability of the equilibrium point can be obtained, as shown in Table 3. The local stability of the equilibrium point is closely related to the initial state of each parameter. In other words, the strategy of private enterprises’ participation changes based on changes in the expected income and cost.
Table 3.
Local stability analysis of equilibrium points of participation behavior.
4.2. Discussion of Influencing Factors
When and , the evolutionary system has five equilibrium points, which are (0,0), (0,1), (1,0), (1,1), and . The group replication dynamics between the public and private enterprises are shown in Figure 1, and there are two stable points: (0,0) and (1,1). The broken line in Figure 1 divides the plane area into two parts: the cooperation area (Participation, Incentive) and the non-cooperation area (Non-participation, Neutrality). If the initial state of the public organization P and the private enterprise E falls in the cooperation area , the strategic choice of both parties will eventually converge to (1,1). In contrast, if the initial state of the public organization P and the private enterprise E falls in the non-cooperative zone , both parties’ strategies will then eventually evolve to (0,0). The parameters of the initial state directly affect the final convergence results of both strategies. Each influence factor will be analyzed in detail below.
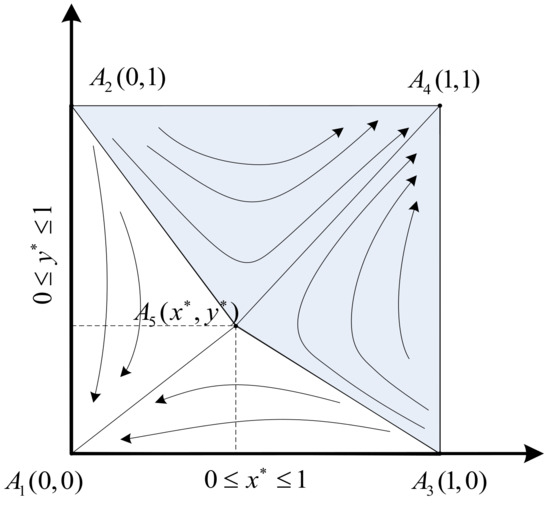
Figure 1.
Dynamic of group replication between the public and enterprises.
- The impact of the incentive intensity of the public sector
From the geometric meaning of probability in Figure 1, it can be seen that the probability that the initial state of the private enterprise E and the public organization P after negotiation falls within the (Participation, Incentive) area is equal to its area (shaded part in Figure 1), namely:
For the first-order derivative , there are:
It can be concluded that the correlation between the incentive intensity (through tax reduction or limits on interest) and the region is related to whether the expected income of private enterprises can cover the expected cost. This is specifically true when other parameter scenarios are fixed, for example, when (the income of private enterprises does not cover the cost), is larger, and the probability that the initial state falls within the region is greater. This means that the probability is greater that the public organization P adopts the “incentive” strategy, and the private enterprise E adopts the “participation” strategy. Additionally, when (the income of private enterprises is greater than the cost), is larger, and the probability of the initial state falling within the region is smaller. This means that the probability is smaller that the public organization P adopts the “incentive” strategy, and the private enterprise E adopts the “active participation” strategy.
- 2.
- The impact of the investment return rate of a private enterprise
For the first-order derivative , there are:
It can be concluded that the investment return rate is positively correlated with the region . When other parameter scenarios are fixed and is large, a public organization is more likely to adopt the “incentive” strategy. At the same time, the probability of a private enterprise adopting participation behavior increases.
- 3.
- The impact of the financing cost of a private enterprise
For the first-order derivative , there are:
Therefore, the financing cost of private enterprises is negatively correlated with the region . When other parameter scenarios are fixed and is large, a public organization is more inclined to adopt the “incentive” strategy. At the same time, the probability of a private enterprise adopting participation behavior decreases.
- 4.
- The impact of the cost of risk for the project
For the first-order derivative , there are:
It can be concluded that the risk cost is negatively correlated with the area . When other parameter scenarios are fixed and is large, a public organization is more inclined to adopt the “incentive” strategy. At the same time, the probability of a private enterprise adopting participation behavior decreases.
4.3. Sensitivity Analysis of Influencing Factors
There are many parameters involved in the above model. To better reflect the influencing factors and the effects of private enterprises’ participation in PPPs, this study took an infrastructure PPP project in a high-tech part of a city as an example. It analyzed the influence of the mode of incentive, the cooperation costs, and the risk costs. There were three parts to the PPP: municipal road construction, landscape engineering, and an underground utility tunnel. Private enterprises invested capital million; the investment return rate was ; the financing cost rate was ; the risk cost was million; the institutional transaction cost was million; the benefits for the public were million and million; the incentive intensity was ; the incentive cost was million; and the public loss was million. In this scenario, the initial state of the private enterprises participating in the PPP is shown in Figure 2a. In this scenario, it was assumed that the probability of each strategy chosen by the public and private enterprises was 0.5. The sensitivity of each influencing factor is discussed in turn.
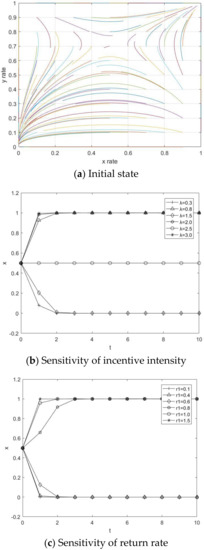
Figure 2.
Sensitivity of key factors of private enterprises’ participation behavior.
- The sensitivity of the incentive intensity
From the scenario in Figure 2a , the incentive intensity was set to , , and , and the other parameters remained unchanged. The dynamic evolution of private enterprises choosing the strategy of “Participation” is shown in Figure 2b. When , the incentive intensity was greater, and the private enterprises were more likely to select the strategy of “Participation” more quickly.
- 2.
- The sensitivity of the investment return rate
From the scenario in Figure 2a, the investment return rates of private enterprises were set as , 0.4, 0.6, 0.8, 1.0, 1.5. The other parameters were unchanged. The dynamic evolution of private enterprises choosing the strategy of “participation” is shown in Figure 2c. It can be seen from Figure 2c that the greater the investment return rate of private enterprises, the greater the probability that private enterprises would choose the strategy of “participation”, and the faster the evolution would be. This result further proves that there is a positive correlation between investment return rate and private enterprises’ adoption of the “participation” strategy.
- 3.
- The sensitivity of the financing cost rate
From the scenario in Figure 2a, the financing cost rates of private enterprises were set as , 0.3, 0.5, 0.7, 0.9, 1.5. The other parameters were unchanged. The dynamic evolution of private enterprises choosing to participate is shown in Figure 3a. The higher the financing cost ratio, the lower the probability that private enterprises would choose “participation”. The final result of the evolution was that groups chose not to participate in PPPs. This further proves that there is a negative correlation between the financing cost rate and private enterprises’ “participation” strategy choices.
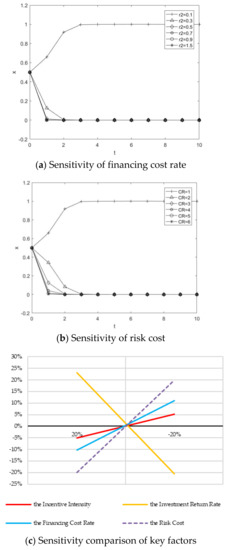
Figure 3.
Sensitivity of key factors of participation behavior.
- 4.
- The sensitivity of the risk cost
From the scenario in Figure 2a, the risk costs were set at , 2, 3, 4, 5, and 6. The other parameters were unchanged. The dynamic evolution of private enterprises choosing to participate is shown in Figure 3b. This shows that the greater the risk cost, the less likely private enterprises were to choose the “participation” strategy. With the continuous increase , the evolution accelerated and finally converged on groups choosing not to participate in PPPs. The result further proves that the risk cost of a project is negatively correlated with a private enterprise’s decision to participate in PPPs.
- 5.
- A comparative analysis of the sensitivity of key factors
From the sensitivity chart of each influencing factor (see Figure 3c), it can be seen that although the incentive intensity, the investment return rate of private enterprises, and the participation probability of private enterprises are all positively correlated, the influence effect of investment return rate of private enterprises is the most sensitive. In contrast, the financing cost rate, the risk cost, and the participation probability of private enterprises are negatively correlated, and the effect of the risk cost is the most sensitive.
5. Conclusions and Implications
To encourage private enterprises to actively participate in PPPs, this study constructed a decision-making model of participation behavior for private enterprises in PPPs based on evolutionary game theory. It analyzed the influencing factors and their sensitivity, and it verified the relevant conclusions regarding the theoretical model through simulation. Through the above discussion and analysis, it can be concluded that: First, the incentive intensity and investment return rate are positively correlated with the probability of private enterprises choosing the “participation” strategy, and the influencing effect of the investment return rate of private enterprises is the most sensitive. Second, the financing cost rate, the risk cost, and the probability of private enterprises selecting the “participation” strategy are negatively correlated, and the influencing effect of the risk cost is the most sensitive.
The implications for management that can be taken from the above conclusions is the following:
- (1)
- Government guarantees. Government guarantees involve government incentives, perfecting laws and regulations, standardizing supervision and support mechanisms, and transforming the role of the government. The implementation of PPPs in China is still in the early stages. To allow PPPs to be as effective as possible, it is necessary to improve laws and regulations, establish a superior supervision mechanism, and clarify the scope of the powers, responsibilities, and interests of the government departments and agencies responsible for implementing PPPs.
- (2)
- Ensure a strong rate of return on investment and reduce the financing cost. Private enterprises aim to make profits, and they will only participate in PPPs if they can get a return on their investment. At the same time, the scale of investment in PPPs is large, and there are problems with financing difficulties and expensive financing that make it difficult for private enterprises to participate in PPPs. Compared with state-owned enterprises, the financial strength of private enterprises is relatively weak. The high cost of financing directly dampens the enthusiasm of private enterprises to participate in PPPs. On the one hand, public bodies can increase the profit margins of private enterprises through tax reductions, interest bonuses, financial subsidies, and bundled development. On the other hand, it is necessary to improve the financial market, provide diversified financing tools, and develop low-cost financing channels so that private enterprises will participate in PPPs.
- (3)
- Clarity and controllability of projects are key to attracting private enterprises. The risk of uncertainty is the biggest obstacle for private enterprises when it comes to participating in PPPs. For large-scale, uncertain projects, private enterprises should establish a consortium or cooperative alliance to limit the risks. This can create synergy and allow the companies to provide mutual assistance effectively while still obtaining the expected benefits. This can help them to increase their market share, leading to a win-win situation.
Author Contributions
Conceptualization and methodology, Y.Z.; formal analysis, H.Y.; writing—original draft preparation, Y.Z. and H.Y.; writing—review and editing, H.X. and J.Z.; supervision and funding acquisition, Y.W. All authors have read and agreed to the published version of the manuscript.
Funding
This research was funded by the Applied Basic Project of Yunnan Province (Grant Nos. 202101AT070088 and 2019FB084), the Youth Program of Humanities and Social Sciences, Ministry of Education (Grant No. 19YJCZH260), the National Natural Science Foundation of China (Grant Nos. 71761021 and 71701083), and Guangxi Philosophy and Social Science Planning Project (Grant No. 20FJL001).
Institutional Review Board Statement
Not applicable.
Informed Consent Statement
Not applicable.
Data Availability Statement
The data presented in this study are available on request from the corresponding author.
Conflicts of Interest
The authors declare no conflict of interest.
References
- Solheim-Kile, E.; Lædre, O.; Lohne, J. Public-private partnerships: Agency costs in the privatization of social infrastructure financing. Proj. Manag. J. 2019, 50, 144–160. [Google Scholar] [CrossRef]
- Wang, H.; Xiong, W.; Wu, G.; Zhu, D. Public-private partnership in public administration discipline: A literature review. Public Manag. Rev. 2017, 20, 293–316. [Google Scholar] [CrossRef]
- Acerete, J.B.; Shaoul, J.; Stafford, A.; Stapleton, P. The cost of using private finance for roads in Spain and the UK. Aust. J. Public Adm. 2010, 69, S48–S60. [Google Scholar] [CrossRef]
- Hwang, B.G.; Zhao, X.; Gay, M.J.S. Public private partnership projects in Singapore: Factors, critical risks and preferred risk allocation from the perspective of contractors. Int. J. Proj. Manag. 2013, 31, 424–433. [Google Scholar] [CrossRef]
- Zhang, S.; Gao, Y.; Feng, Z.; Sun, W. PPP application in infrastructure development in China: Institutional analysis and implications. Int. J. Proj. Manag. 2015, 33, 497–509. [Google Scholar] [CrossRef]
- Wang, L.; Yan, D.; Xiong, Y.; Zhou, L. A review of the challenges and application of public-private partnership model in Chinese garbage disposal industry. J. Clean. Prod. 2019, 230, 219–229. [Google Scholar] [CrossRef]
- Zeng, L.; Luo, S. Research on the participation of private enterprises and its influencing factors in Chinese PPP Practice—Empirical analysis based on 731 county samples. Soft Sci. 2020, 34, 33–38. (In Chinese) [Google Scholar]
- Gao, R.; Hu, J.; Liu, J. Tunnelling analysis of state-owned enterprises in PPP projects. Oper. Res. Manag. Sci. 2021, 226–231. (In Chinese) [Google Scholar]
- Tan, J.; Zhao, J.Z. Explaining the adoption rate of public-private partnerships in Chinese provinces: A transaction cost perspective. Public Manag. Rev. 2019, 23, 590–609. [Google Scholar] [CrossRef]
- Osei-Kyei, R.; Chan, A.P.C. Factors attracting private sector investments in public-private partnerships in developing countries: A survey of international experts. J. Financ. Manag. Prop. Constr. 2017, 22, 92–111. [Google Scholar] [CrossRef]
- Chan, A.P.C.; Lam, P.T.I.; Wen, Y.; Ameyaw, E.E. Cros-sectional analysis of critical risk factors of PPP water projects in China. J. Infrastruct. Syst. 2015, 21, 04014031. [Google Scholar] [CrossRef]
- Xiong, W.; Chen, B.; Wang, H.; Zhu, D. Public-private partnerships as a governance response to sustainable urbanization: Lessons from China. Habitat Int. 2020, 95, 102095. [Google Scholar] [CrossRef]
- Carrillo de Albornoz, V.A.; Molina Millán, J.; Sánchez Soliño, A. Managing a portfolio of public–private partnerships: Concessionaire perspective. J. Manag. Eng. 2018, 34, 04018044. [Google Scholar] [CrossRef]
- Guevara, J.; Herrera, L.; Salazar, J. Interorganizational sponsor networks in road and social infrastructure PPP equity markets. J. Constr. Eng. Manag. 2022, 148, 04022009. [Google Scholar] [CrossRef]
- Dixon, T.; Pottinger, G.; Jordan, A. Lessons from the private finance initiative in the UK: Benefits, problems and critical success factors. J. Prop. Invest. Financ. 2005, 23, 412–423. [Google Scholar] [CrossRef]
- Demirag, I.; Iqbal, S.; Stapleton, P.; Stevenson, C. Public Private Partnership Financiers’ Perceptions of Risks; The Institue of Chartered Accountants of Scotland: Edinburgh, UK, 2010. [Google Scholar]
- Bridata. ROI Trend for the Closed PPP Projects. Available online: http://www.bridata.com/project?type=tzhb&in_cpppc=1. (accessed on 20 May 2022).
- Glumac, B.; Han, Q.; Schaefer, W.; van der Krabben, E. Negotiation issues in forming public-private partnerships for Brownfield redevelopment: Applying a game theoretical experiment. Land Use Policy 2015, 47, 66–77. [Google Scholar] [CrossRef]
- Nguyen, D.A.; Garvin, M.J.; Gonzalez, E.E. Risk allocation in U.S. public-private partnership highway project contracts. J. Constr. Eng. Manag. 2018, 144, 04018017. [Google Scholar] [CrossRef]
- Burke, R.; Demirag, I. Risk management by SPV partners in toll road public private partnerships. Public Manag. Rev. 2018, 21, 711–731. [Google Scholar] [CrossRef]
- Anastasopoulos, P.C.; Islam, M.B.; Volovski, M.; Powell, J.; Labi, S. Comparative evaluation of public-private partnerships in roadway preservation. Transp. Res. Rec. J. Transp. Res. Board 2011, 2235, 9–19. [Google Scholar] [CrossRef]
- Hoppe, E.I.; Schmitz, P.W. Public-private partnerships versus traditional procurement: Innovation incentives and information gathering. RAND J. Econ. 2013, 44, 56–74. [Google Scholar] [CrossRef] [Green Version]
- Ke, Y.; Wang, S.; Chan, A.P.C.; Lam, P.T.I. Preferred risk allocation in China’s Public-Private Partnership (PPP) projects. Int. J. Proj. Manag. 2010, 28, 482–492. [Google Scholar] [CrossRef]
- Shrestha, A.; Chan, T.-K.; Aibinu, A.A.; Chen, C.; Martek, I. Risk allocation inefficiencies in Chinese PPP water projects. J. Constr. Eng. Manag. 2018, 144, 04018013. [Google Scholar] [CrossRef]
- Nash, J. The bargaining problem. Econometrica 1950, 18, 155–162. [Google Scholar] [CrossRef]
- Gao, R.; Liu, J. Selection of government supervision mode of PPP Projects during the operation stage. Constr. Manag. Econ. 2019, 37, 584–603. [Google Scholar] [CrossRef]
- Rosas, A. Evolutionary game theory meets social science: Is there a unifying rule for human cooperation? J. Theor. Biol. 2010, 264, 450–456. [Google Scholar] [CrossRef] [Green Version]
- Taylor, P.D.; Jonker, L.B. Evolutionary stable strategies and game dynamics. Math. Biosci. 1978, 40, 145–156. [Google Scholar] [CrossRef]
- Ji, P.; Ma, X.; Li, G. Developing green purchasing relationships for the manufacturing industry: An evolutionary game theory perspective. Int. J. Prod. Econ. 2015, 166, 155–162. [Google Scholar] [CrossRef]
- Badu, S.; Mohan, U. An integrated approach to evaluating sustainability in supply chains using evolutionary game theory. Comput. Oper. Res. 2018, 89, 269–283. [Google Scholar] [CrossRef]
- Friedman, D. On economic applications of evolutionary game theory. J. Evol. Econ. 1998, 8, 15–43. [Google Scholar] [CrossRef] [Green Version]
- Xiong, W.; Zhao, X.; Wang, H. Information asymmetry in renegotiation of public-private partnership projects. J. Comput. Civ. Eng. 2018, 32, 04018028. [Google Scholar] [CrossRef]
- Ho, S.P. Model for financial renegotiation in public-private partnership projects and its policy implications: Game theoretic view. J. Constr. Eng. Manag. 2006, 132, 678–688. [Google Scholar] [CrossRef]
- Shang, L.; Aziz, A.M.A. Stackelberg game theory-based optimization model for design of payment mechanism in performance-based PPPs. J. Constr. Eng. Manag. 2020, 146, 04020029. [Google Scholar] [CrossRef]
- Freedman, D.A. Statistical models and shoe leather. Sociol. Methodol. 1991, 21, 291–313. [Google Scholar] [CrossRef]
Publisher’s Note: MDPI stays neutral with regard to jurisdictional claims in published maps and institutional affiliations. |
© 2022 by the authors. Licensee MDPI, Basel, Switzerland. This article is an open access article distributed under the terms and conditions of the Creative Commons Attribution (CC BY) license (https://creativecommons.org/licenses/by/4.0/).