Article

A Real Estate Early Warning System Based on an Improved PSO-LSSVR Model—A Beijing Case Study

1
School of Civil and Transportation Engineering, Hebei University of Technology, Tianjin 300401, China
2
Hebei Civil Engineering Technology Research Center, Tianjin 300401, China
3
School of Economics and Management, Hebei University of Technology, Tianjin 300401, China
*
Authors to whom correspondence should be addressed.
Buildings 2022, 12(6), 706; https://doi.org/10.3390/buildings12060706
Submission received: 13 April 2022 / Revised: 15 May 2022 / Accepted: 19 May 2022 / Published: 24 May 2022
(This article belongs to the Special Issue Tradition and Innovation in Construction Project Management)

Abstract

:
The real estate market is vital for national economic development, and it is of great significance to research an early warning method to identify an abnormal status of the real estate market. In this study, a real estate early warning system based on the PSO-LSSVR model was created to train and test the indicator data of Beijing from 2000 to 2020, and to predict the early warning indicator of the Beijing real estate market from 2021 to 2030. The results showed that the warning status of the Beijing real estate market went from a fluctuation status to a stable “Normal” status from 2000 to 2020, and the warning status is expected to be more stable under a “Normal” status in the next decade under the same political and economic environment. The PSO-LSSVR model was found to have accurate prediction ability and demonstrated generalization ability. Furthermore, the warning status of the Beijing real estate market was analyzed in combination with national historical policies. Based on the results, this paper proposes policy recommendations to promote the healthy and sustainable development of the real estate market.

1. Introduction

1.1. Background

Over the past few decades, the rapid development of China’s real estate market has actively contributed to the rapid growth of China’s GDP, especially after the 2008 global economic crisis. Moreover, the rapid development of the real estate industry has also led to the development of the construction industry, decoration, home appliances, furniture industry and so on. According to the China Statistical Yearbook 2021, the GDP of the real estate industry accounted for 7.3 percent of the country’s total GDP, and the property-related construction industry accounted for 7.2 percent of the country’s total GDP in the year 2020 [1]. On the other hand, the real estate industry has become an important part of fixed asset investments, where fixed asset investments are one of the troikas for economic growth (investment, export and consumption). Hence, the developing real estate industry has become one of the important economic pillars of China’s economic development. However, the excessive development of any industry will bring negative effects on society.
First, when the real estate boom is excessively prosperous, there will be a large number of excess funds, bank loans and corporate funds flowing into the real estate market, which will lead to the phenomenon of “industry emptiness” (the decline in the development level of the primary and secondary industry lead to the unbalanced structural proportion of national economic demand and the continuous shrinkage of domestic investment, which, in turn, lead to the substantial reduction in employment opportunities and social problems, such as a rising unemployment rate) [2].
Second, the development of the real estate market is closely related to the macroeconomy. Excessive development of the real estate market promotes the investment flow into related industries, which leads to a shortage of resources supplied to other industries [3]. To solve such conditions, the government usually restrains the development of the real estate industry through credit regulation and land regulation policies, which leads to the rapid cooling of the real estate industry and economic recession [4]. The excessive development of the real estate industry and the drastic macro-control will lead to excessive fluctuations in the macroeconomy [5].
Last, but not least, the rapid development of the real estate industry has introduced a large amount of investment of capital and the public. Excessive investment will lead to the market price being greater than the actual price, which leads to economic bubbles in the real estate industry [6]. When the bubble bursts, the loans from financial institutions and banks to real estate enterprises will turn into bad debts, which will lead to the occurrence of an economic crisis and financial crisis in serious cases, and then lead to industrial depression, the sharp increase in unemployment and crime rate, and other social problems [7]. The economic depression caused by the bursting of the real estate bubble will bring enormous harm to the national development and living quality, as the U.S. real estate bubble burst in the late 1980s led to the bank crisis, and at the beginning of the 21st century, the U.S. real estate bubble burst led to the subprime mortgage crisis and the biggest financial crisis since 1930. The real estate bubble burst in Japan in the 1980s set off a decades-long economic recession. These classic real estate bubble bursts offer warnings for other countries’ real estate developments.
In contrast, if the real estate industry appears excessively depressed, the public, capital and government will lose confidence in the real estate industry, which will further affect the development of the real estate industry and the development of the macroeconomy [8]. Moreover, the construction industry, which is closely related to the real estate industry, and the back-end industries will be seriously affected [9]. Therefore, it is necessary to establish an early warning system for the real estate market to prevent the bubble and further enormous harm to the national and social development. A real estate market early warning system can also help the urban government and supervisory agencies to reduce the risk of bubbles in advance [10]. Furthermore, a real estate market early warning system can provide a scientific basis for the government’s macro-control and correctly guide investors away from irrational investment and consumption in the real estate market to promote the healthy and stable development of the market [11].

1.2. Literature Review

The real estate industry has the characteristics of information asymmetry, fixedness and transaction dispersion [12,13], and the effective balance of the general industrial structure and supply–demand relationship of the real estate industry cannot be achieved only through market forces [14]. Hence, research on the real estate market is complicated and diverse. With the continuous development of science and technology, more and more automatic methods were applied to the sustainable development of the real estate market, such as artificial intelligence [15] and machine learning [16]. However, from previous studies, we can still find some research ideas and theories, which are conducive to the comprehensive development of relevant research.
In a previous study, Pyhrr et al. observed the cyclical phenomenon of the Western real estate market since the 1960s and then researched the change laws and periodic mechanism of the real estate market [17,18]. With the in-depth study of the real estate cycle, scholars gradually realized the importance of early warning for the real estate market. In the 1990s, Nieboer et al. first established a real estate market early warning system based on the housing vacancy rate by studying the relationship between the housing vacancy rate and the trend of the real estate market in the Netherlands [19]. Subsequently, as a country with a well-developed real estate market, the United States found the real estate downturn signal of the Chicago community by observing the fluctuation and mechanism of the real estate cycle, and then detecting seven abnormal change indicators and establishing the original real estate early warning model [20]. With the proposal of the Case–Shiller (CS) housing price index, scholars used to research the relationship between the real estate market and macroeconomic phenomena by combining the Case–Shiller housing price index and early warning leading indicators [21,22]. Huang et al. adopted the deep learning method in the Time-Varying Parameter-Vector Autoregression (TVP-VAR) model to research the monitoring and early warning of systemic financial risk, where the results showed that the real estate market is closely related to the country’s systemic financial risk [23].
In addition, scholars in different fields researched the methods and applications of early warning systems [24]. With the development of the research field, the concept and methods of early warning systems have been widely introduced into the aerospace study [25,26], ecological systems research [27], seismic research [28,29], transportation study [30,31], medical study [32,33] and real estate study [34].
With the rapid development of science and technology, more methods have been adopted in the research of early warning systems. Begusic et al. adopted the system dynamics to research the system risk in the financial market and real estate market, which was achieved by researching the spatio-temporal spillover effect of system information feedback to obtain early warning signals of the market [35]. Huang and Feng proposed an early warning method based on the monitor indicators and statistical method and simulated the policy regulation of the real estate market in Shenzhen by combining system dynamics [36]. Yang used computer technology based on the principle of the PROBIT model to design an early warning system to analyze risk verification in the real estate market and the results showed that the early warning system had an approximately 85% early warning rate [37]. Kholodilin and Michelsen used modern machine learning methods to forecast the real estate market bubbles in Germany and presented an early warning model to analyze the speculative risk in the real estate market; furthermore, they provided some market intervention suggestions for the German government [38]. Wang et al. analyzed the real estate market in Beijing by establishing an early warning model based on multi-class support vector machines and put forward policy suggestions for the healthy operation of the real estate market [34]. Based on previous research on the real estate market, it was found that the machine learning model has better processing capacity than the transmission statistical model for solving nonlinear problems [39,40]. In recent years, scholars established early warning index systems for the real estate market through different methods, and conducted early warning research through qualitative and quantitative methods, promoting the research of early warning index systems to gradually reach a mature stage of development.
Based on the relatively mature development of the real estate early warning indicators research, further research of indicator selection should take into account the market supply–demand relationship, internal coordination, external economic factors and so on. The methods for early warning systems were developed from basic index analysis research methods to statistical research methods and then to comprehensive early warning models. Moreover, with the in-depth research, the early warning research of the real estate market has changed from qualitative research to a combination of qualitative and quantitative research. With the rapid development of computer science and artificial intelligence, more and more theories and methods were introduced into the real estate early warning model, and new research ideas were developed [41]. However, in the current research on the real estate market early warning, the problems of a small sample, overall generalization ability and nonlinearity cannot be solved easily.
Due to the complexity of the real estate market system and the lack of historical data, there will be insufficient training, unstable performance and overlearning when the neural network is training. All of these factors will lead to unsatisfactory prediction results. As a result, Cortes [42] proposed the support vector regression (SVM), which has demonstrated excellent performance in solving small-sample, nonlinear, high-dimensional problems. That is why SVR, the regression version of SVM, is widely used in energy research [43]. SuyKens et al. [44] improved least-squares support vector regression (LSSVR) in 1999, the least-squares formulation of SVR, which has better generalization abilities and powerful computation. Chou et al. [45] found that LSSVR is more accurate than regression analysis and neural networks for building energy consumption. However, there are still disadvantages to LSSVR due to the choice of kernel and regularization parameters; therefore, particle swarm optimization (PSO) was introduced to improve the LSSVR. PSO-LSSVR was successfully employed in many fields, especially in the evaluation of engineering projects. For this reason, some scholars specifically analyzed and examined its operating principle [46,47]. In addition, the LSSVR model has the characteristics of a fast training speed, which is helpful to obtain a more effective regression model in a complex system. The PSO model has the characteristic of a fast convergence speed, which can further improve the accuracy of the prediction. Through continuous iteration of the PSO model, the most appropriate prediction parameters can be quickly found. The most important point is that the LSSVR model is suitable for exploring potential lows from historical data and predictions, while the PSO model has relatively low requirements for optimization functions; therefore, the PSO-LSSVR model is more suitable for the research of the real estate market with small data [48]. However, PSO-LSSVR in real estate market prediction has not been widely applied.
As the political, economic and cultural center of China, Beijing has a large population inflow and a high housing demand [49]. The real estate market in Beijing has the characteristics of a mass market, high land prices and high commercial housing prices, which are related to urban and economic sustainable development [50]. Based on the particularity and activity of the Beijing urban real estate market, it is vital to research the ability to provide an early warning of an abnormal status of the Beijing real estate market to ensure the stable and sustainable development of the Beijing real estate market. Furthermore, the sustainable development of the real estate market plays an important role in promoting the steady development of the urban economy and society. This study considered multiple indicators of the real estate market and adopted the PSO-LSSVR model to test and predict the early warning status of the Beijing real estate market. This study can make the real estate market early warning system research richer; furthermore, a PSO-LSSVR model can enrich the research on prediction methods more generally. The rest of this paper is arranged as follows. Section 2 establishes the PSO-LSSVR model and discusses the early warning system indicators. Section 3 presents the results of an empirical analysis of data of the Beijing real estate market from 2000 to 2020 and establishes the early warning system based on the analysis. Section 4 discusses the results of the Beijing real estate early warning system and presents early warning predictions for the Beijing real estate market for 2020, further providing policy implications. Section 5 concludes the paper.

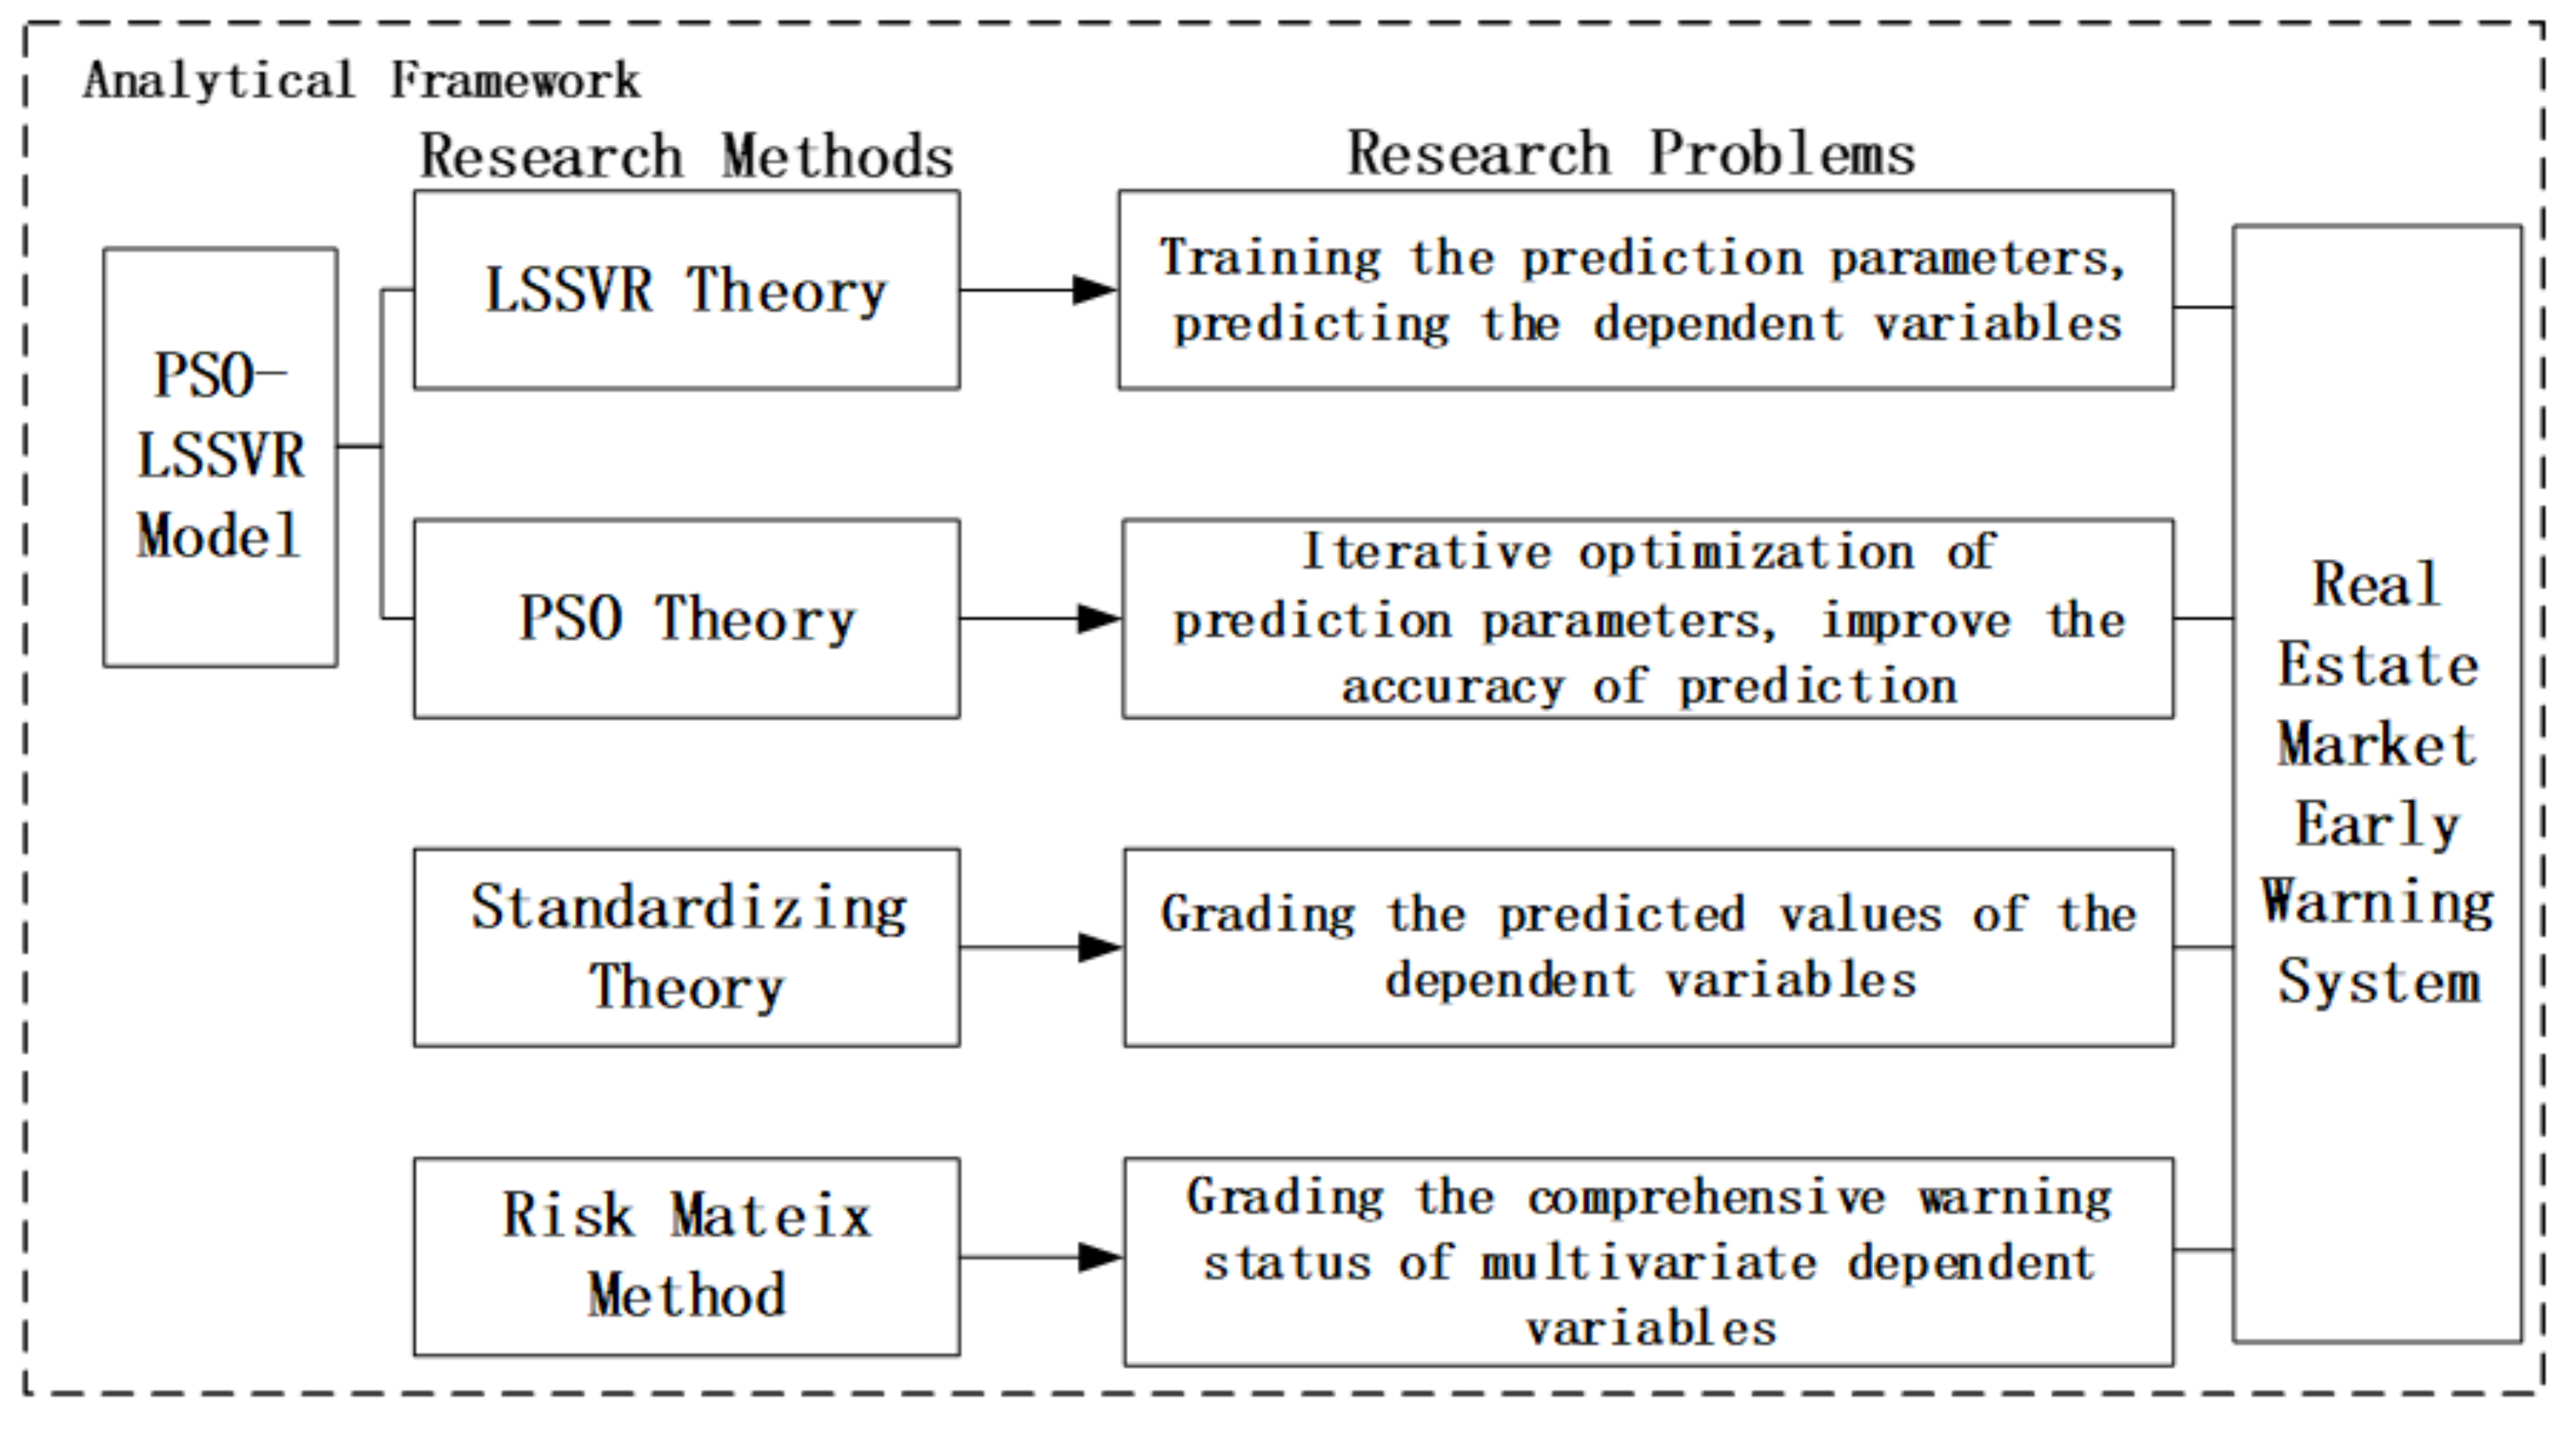
2. Materials and Methods

In this section, the related theories and methods for the construction of the real estate market early warning system are introduced. The least-squares support vector regression (LSSVR) theory was used to train the sample data and make a prediction by finding the required parameters. Particle swarm optimization (PSO) theory was used to optimize the model parameters and find a combination of parameters with a higher accuracy via continuous iterations. To reflect the prediction mechanism of the PSO-LSSVR model, a flow chart was made, as shown in Figure 1.
The standardization method was used to make the values of the influencing factors dimensionless and convert the influencing factors from obeying the normal distribution to obeying the standard normal distribution, which could divide the predicted market status based on the standard normal distribution. The risk matrix method was used to analyze the situation of the real estate market, according to the market status of the different predicted factors, and provide an early warning of an abnormal market status.

2.1. Least-Squares Support Vector Regression (LSSVR) Theory

In this section, the principle of LSSVR is described briefly: Let S = x k , y k | k = 1 , 2 , , n be a set of training sample points, where x k ϵ R n is the input vector, and y k ϵ R n is the output vector. With a nonlinear map φ · the sample from the original space R n is mapped into the feature space φ x k . The optimal decision function is defined as follows:
y x = ω T · φ x + b
where ω is the weighted vector, φ x is the kernel space mapping function and b is a constant. Usually, coefficients ω and b are obtained by minimizing the upper bound of generalization error.
According to the principle of structural risk minimization, the regression problem can be transformed into an optimization problem with constraints. The target function and constraint are formulated as follows:
min ω , b , e ω , e = 1 2 ω T ω + 1 2 γ k = 1 n e k 2
s.t.
y k = ω T φ x k + b + e k
where k = 1 ,   2 , , n ; γ is the regularization parameter; and e k is the slack variable.
To solve the problem, the Lagrange function is defined as follows:
L ω , b , e , α = ϕ ω , e k = 1 n α k ω T φ x + b + e k y k
where α k is the Lagrange multiplier. According to the Karush–Kuhn–Tucker condition, the conditions for optimality are
ω = k = 1 n α k φ x k k = 1 n α k = 0 α k = e k γ ω T φ x k + b + e k y k = 0
Equation (4) can be transformed into linear equations:
0 1 1 1 K x 1 , y 1 + 1 γ K x l , y l 1 K x l , y l K x l , y l + 1 γ b α 1 α l = 0 y 1 y l
Once the values of α and b are found, the fitting function is represented as follows:
f x = k = 1 l α k K x , x i + b
where K x , x i = φ x T · φ x l is the Kernel function, which expresses a nonlinear mapping from a low-dimensional to a high-dimensional space.
In this study, the radial basis function (RBF) was selected as the kernel function, which can be expressed as K x , x i = exp x x i 2 2 σ 2 , where x is an m-dimensional input vector, xi is the center of the ith RBF, σ 2 is the length of the Kernel function and x x i is the norm of a vector, which is the distance between x and xi.
It can be seen from the model that the LSSVR model transforms the original inequality constraints of the SVR model into equality constraints, which can improve the efficiency of operation, and further simplify the problem by solving equality constraints and least-squares problems.

2.2. Particle Swarm Optimization (PSO) Theory

The PSO, which simulates the hunting activities of birds and fish, is a random search algorithm that is able to solve the global optimal solution. The PSO is initialized with a random population of m particles, which is X = X 1 , X 2 , , X m . Each particle is a point in a D-dimensional space and a feasible solution in the solution space. Particles change their position by moving in the solution space until arriving at the optimal solution. The position of the ith particle is X i = x i 1 , x i 2 , , x i d i = 1 ,   2 , , m and the velocity of the ith particle is V i = v i 1 , v i 2 , , v i d i = 1 ,   2 , , m . P b e s t i is the local best position, and G b e s t is the global best position. The position of the ith particle in the kth iteration is computed using
x i d k + 1 = x i d k + v i d k + 1
The velocity of the ith particle in the kth iteration is computed using
v i d k + 1 = w v i d k + c 1 r 1 ( P b e s t i x i d k ) c 2 r 2 ( G b e s t x i d k )
where r 1 and r 2 are two random numbers in a range of [0,1]; c 1 = c 2 = 2 are acceleration coefficients; and w is the inertia weight factor, which is determined using Equation (9).
w = w max w max w min n i n max
The velocity of each particle at the kth iteration depends on three components:
(1)
The inertia term w · v i d k is affected by the constant inertia weight w and the previous step velocity term.
(2)
The cognitive learning term c 1 r 1 · ( P b e s t i x i d k ) is the distance between the particle’s best position so far found (called P b e s t i ) and the particle current position (called x i d k ).
(3)
The social learning term c 2 r 2 · ( G b e s t x i d k ) is the distance between the global best position found thus far in the entire swarm (called G b e s t ) and the particle’s current position.
PSO implementation involves the following steps:
Step 1: Set the parameters of the PSO algorithm, such as the particle swarm size, inertial weight factor w, learning factors c 1 and c 2 , and random numbers r 1 and r 2 .
Step 2: Randomly initialize the velocity and position of the particles.
Step 3: Compute the fitness of the ith particle and obtain the local best position P b e s t i and the global best position G b e s t .
Step 4: Update the local best position P b e s t i and the global best position G b e s t .
Step 5: Update the velocity and position of the particles via Equations (7) and (8).
Step 6: If the maximum number of iterations is achieved or the optimal solution is found, then we may obtain the global best position; otherwise return to step 3.
Using different parameters as input combinations in LSSVR can produce a different model forecasting accuracy. Therefore, more importance is attached to the PSO-LSSVR model since it can select optimization parameters while modeling. The PSO algorithm optimizes the Kernel parameter σ 2 and regularization parameter γ in LSSVR, which can improve the prediction accuracy and reduce the uncertainty and randomness of the model results.
From the calculation process of the PSO model, the PSO model does not require the optimized function to have certain mathematical properties, such as being continuous, differentiable and derivable, which is especially suitable for small data samples, such as real estate markets.

2.3. Standardization Risk Matrix Method

The risk matrix method is a qualitative risk assessment analysis method that can comprehensively evaluate the risk of the possibility of danger and the severity of the injury [51]. Similarly, this method can be extended to all two-factor evaluation grading. This study divided the degree levels of the two factors at first and expresses them in the form of a matrix. According to the research needs, the result area is divided into different grades based on the effective diagonal line by using the risk matrix method for reference. When dividing the level of influencing factors, the influencing factors can be standardized. According to the distribution function of the standard normal distribution, the corresponding division points are determined, and the standardized influencing factors are divided based on the standard normal distribution.
The standardization risk matrix method implementation involves the following steps:
Step 1: Standardize the values of influencing factors according to historical data using the standardized formula.
x ' = x μ σ N 0 , 1
Step 2: According to the required classification number, find the corresponding classification points of the two influencing factors by the standard normal distribution table.
Step 3: Establish a risk matrix according to the levels of two factors.
Step 4: Classify the different units of the risk matrix using the diagonal lines.
Step 5: Substitute the standardized influencing factor values into the risk matrix and obtain the final grading.
Based on the research design, this study established an analytical framework to sort out selected research methods and research questions, as shown in Figure 2.

3. Results

3.1. Choice of Urban Early Warning Indicators

The real estate market is a complex system, which is related to the constraints of urban development, urban residential economic behaviors and other fields; therefore, it is impossible to simply determine the relevant influencing indicators. In this study, considering the relationship between the real estate market and the national economy, the investment, gross domestic product (GDP), people’s living standards and commercial housing prices were taken into account. On the other hand, the relationship between supply and demand in the real estate market is one of the key factors affecting the stable development of the real estate industry. Therefore, the sales of commercial housing, residential area per capital, Engels coefficient and housing income ratio were all taken into account. In addition, this study considered the coordination relationship within the real estate industry, extraction of construction area, completed area, residential and commercial housing construction investment ratio and other factors for analysis. Furthermore, the better-balanced development of measurement capabilities of relative indicators was considered rather than absolute indicators. Hence, most of the early warning indicators selected in this study were relative indicators. Furthermore, 16 indicators were initially selected as the early warning indicators for the urban real estate market from previous studies [52,53,54,55,56,57,58,59,60,61,62,63].
The indicator system of this study consisted of 2 variable types, 4 kinds of indicators and 16 sub-indicators, which can be seen in Table 1. To clearly show the details of the indicator system, the related factors and computation methods of the sub-indicators are listed below.
N1: Real estate development investment/GDP;
N2: Real estate investment/fixed-asset investment;
N3: Real estate development self-raised funds/real estate investment;
N4: Commercial housing price growth rate/urban residents’ disposable income growth rate;
N5: Growth rate of real estate land area purchased/GDP growth rate;
N6: Commercial housing sales/real estate investment;
N7: Sales area/completed area;
N8: Per capita residential area/Engel coefficient;
N9: Commercial housing prices/urban residents’ disposable income;
N10: Residential investment/commercial housing construction investment;
N11: Residential sales/all commercial housing sales;
N12: Completed residential area/completed area of all commercial housing;
N13: New construction area of commercial housing/construction area;
N14: Construction area/completed area.
For the dependent variables, the selection should consider the directness and speed of the reaction of factors. To reflect the situation of the real estate market comprehensively, it is necessary to analyze it from both the demand and supply aspects. From the demand aspect, housing consumption is one of the large types of asset consumption. Housing demand is highly sensitive to price, and the changes in housing prices are more likely to bring changes in the housing demand. Therefore, commercial housing price growth can be taken as one of the dependent variables to judge the status of the real estate market. From the supply aspect, the supply of land will largely determine the supply of the real estate market; therefore, the growth rate of the land area of commercial housing sales can also be taken as one of the dependent variables to judge the status of the real estate market.
The statistical data for the calculations were obtained from the China Statistical Yearbook (2001–2021) (National Bureau of Statistics), the China City Statistical Yearbook (2001–2021) (National Bureau of Statistics), the Beijing Statistical Yearbook, the China Entrepreneur Investment Club (CEIC) database and the China Real Estate Information Corporation (CRIC) database [1,64,65,66], while the 2008–2020 statistical data came from the National Health and Family Planning Commission Migrant Population Service Centre. The data collected by these databases are highly accurate. As the capital and the political center of China, Beijing attaches great importance to the need for social stability. As a major factor affecting social stability, the housing problem has attracted the attention of the local government and society. Therefore, it is particularly necessary to establish an early warning system for the real estate market in Beijing. At the same time, Beijing is also one of the megacities with economic development in China, and the development of its real estate market is relatively thorough. However, China’s real estate market originated in the 1990s of the last century, and various market mechanisms did not take shape until the 21st century, with the market gradually becoming mature. On this basis, according to the exploitability of data, the time frame of the research was determined as 2000–2020. The detailed data of early warning indicators for the Beijing real estate market from 2000 to 2020 are shown in Table 2.
In order to better analyze the data of indicators N1 to N16 from 2020 to 2020, the mean, standard deviation (SD) and coefficient of variation (CV) of the indicators are listed in Table 2. The CVs of N1, N2, N3, N7, N9, N10, N11, N12 and N13 were less than 0.3. which indicated that the changes in these indicators were stable. In addition, according to Rayda’s criterion, p μ 2 σ X i μ + 2 σ = 0.9544 , data with a difference of more than two standard deviations (SDs) from the mean can basically be regarded as abnormal data. Therefore, it can be seen that the value of N4 was abnormal in 2007 and that of N5 was abnormal in 2009. Among other indicators, except for 2008, the value of N6 had a relatively obvious downward trend, the value of N8 has a relatively obvious upward trend, and the value of N14 had a relatively obvious improvement after 2017.

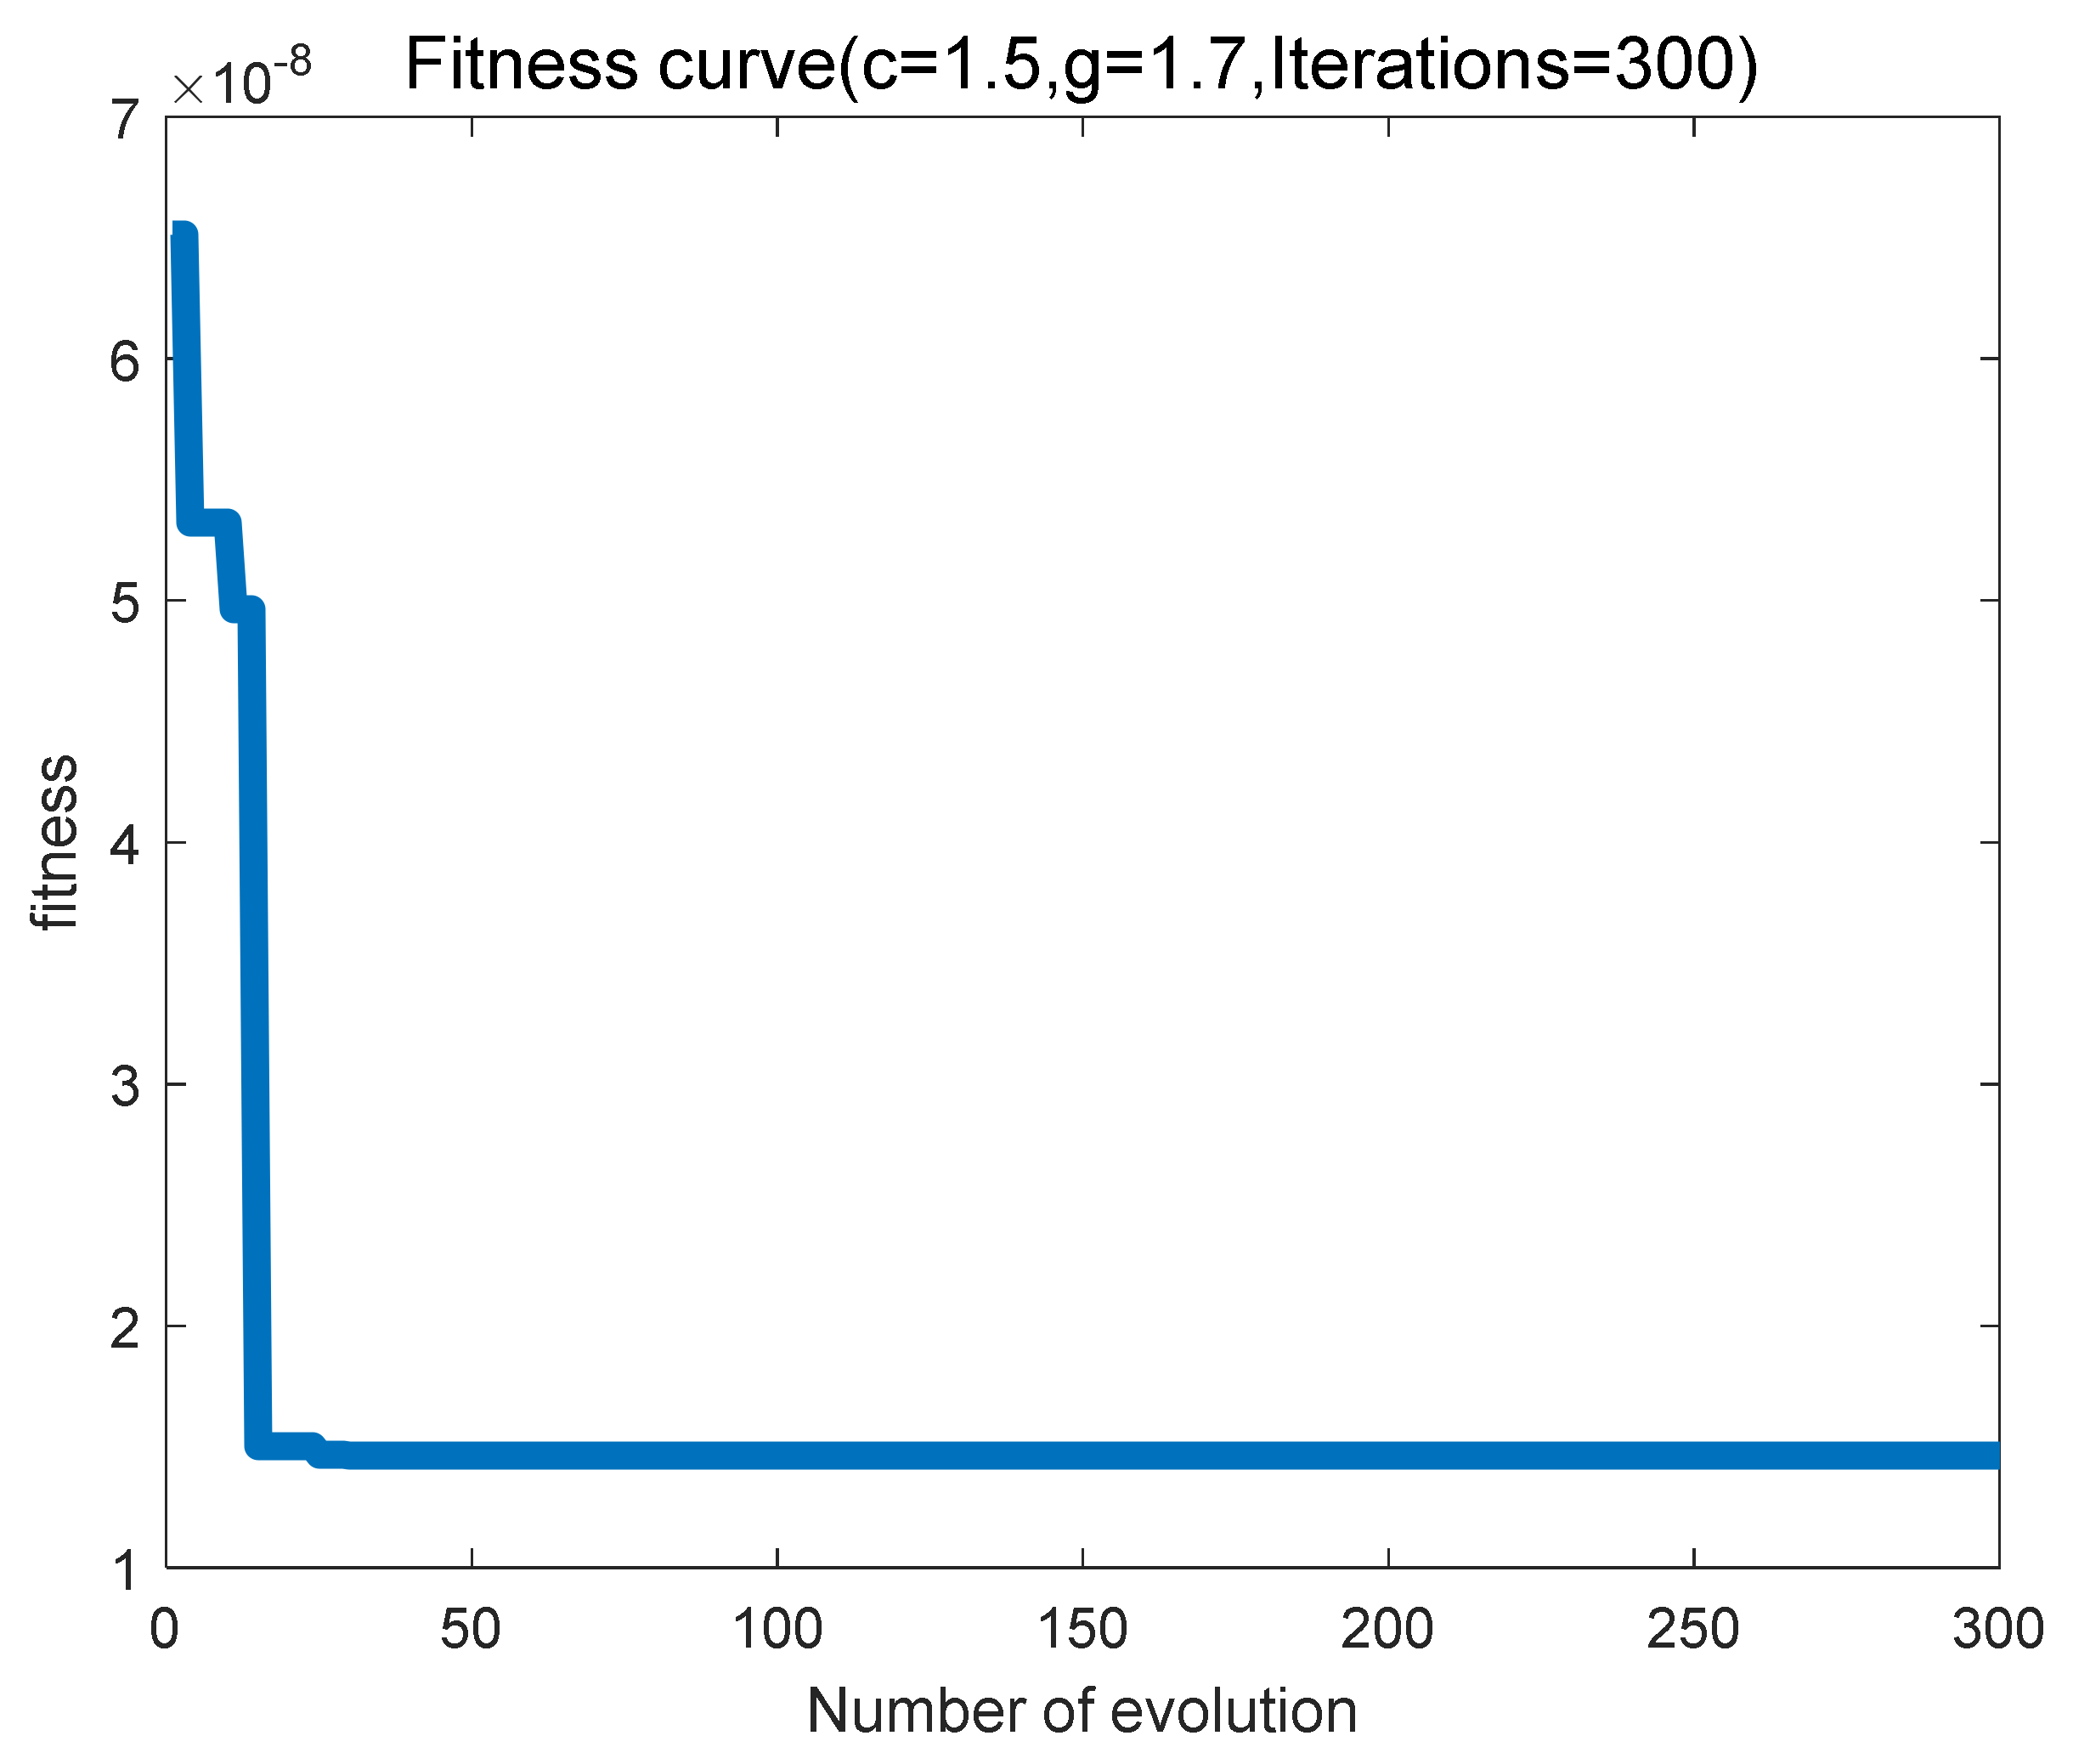
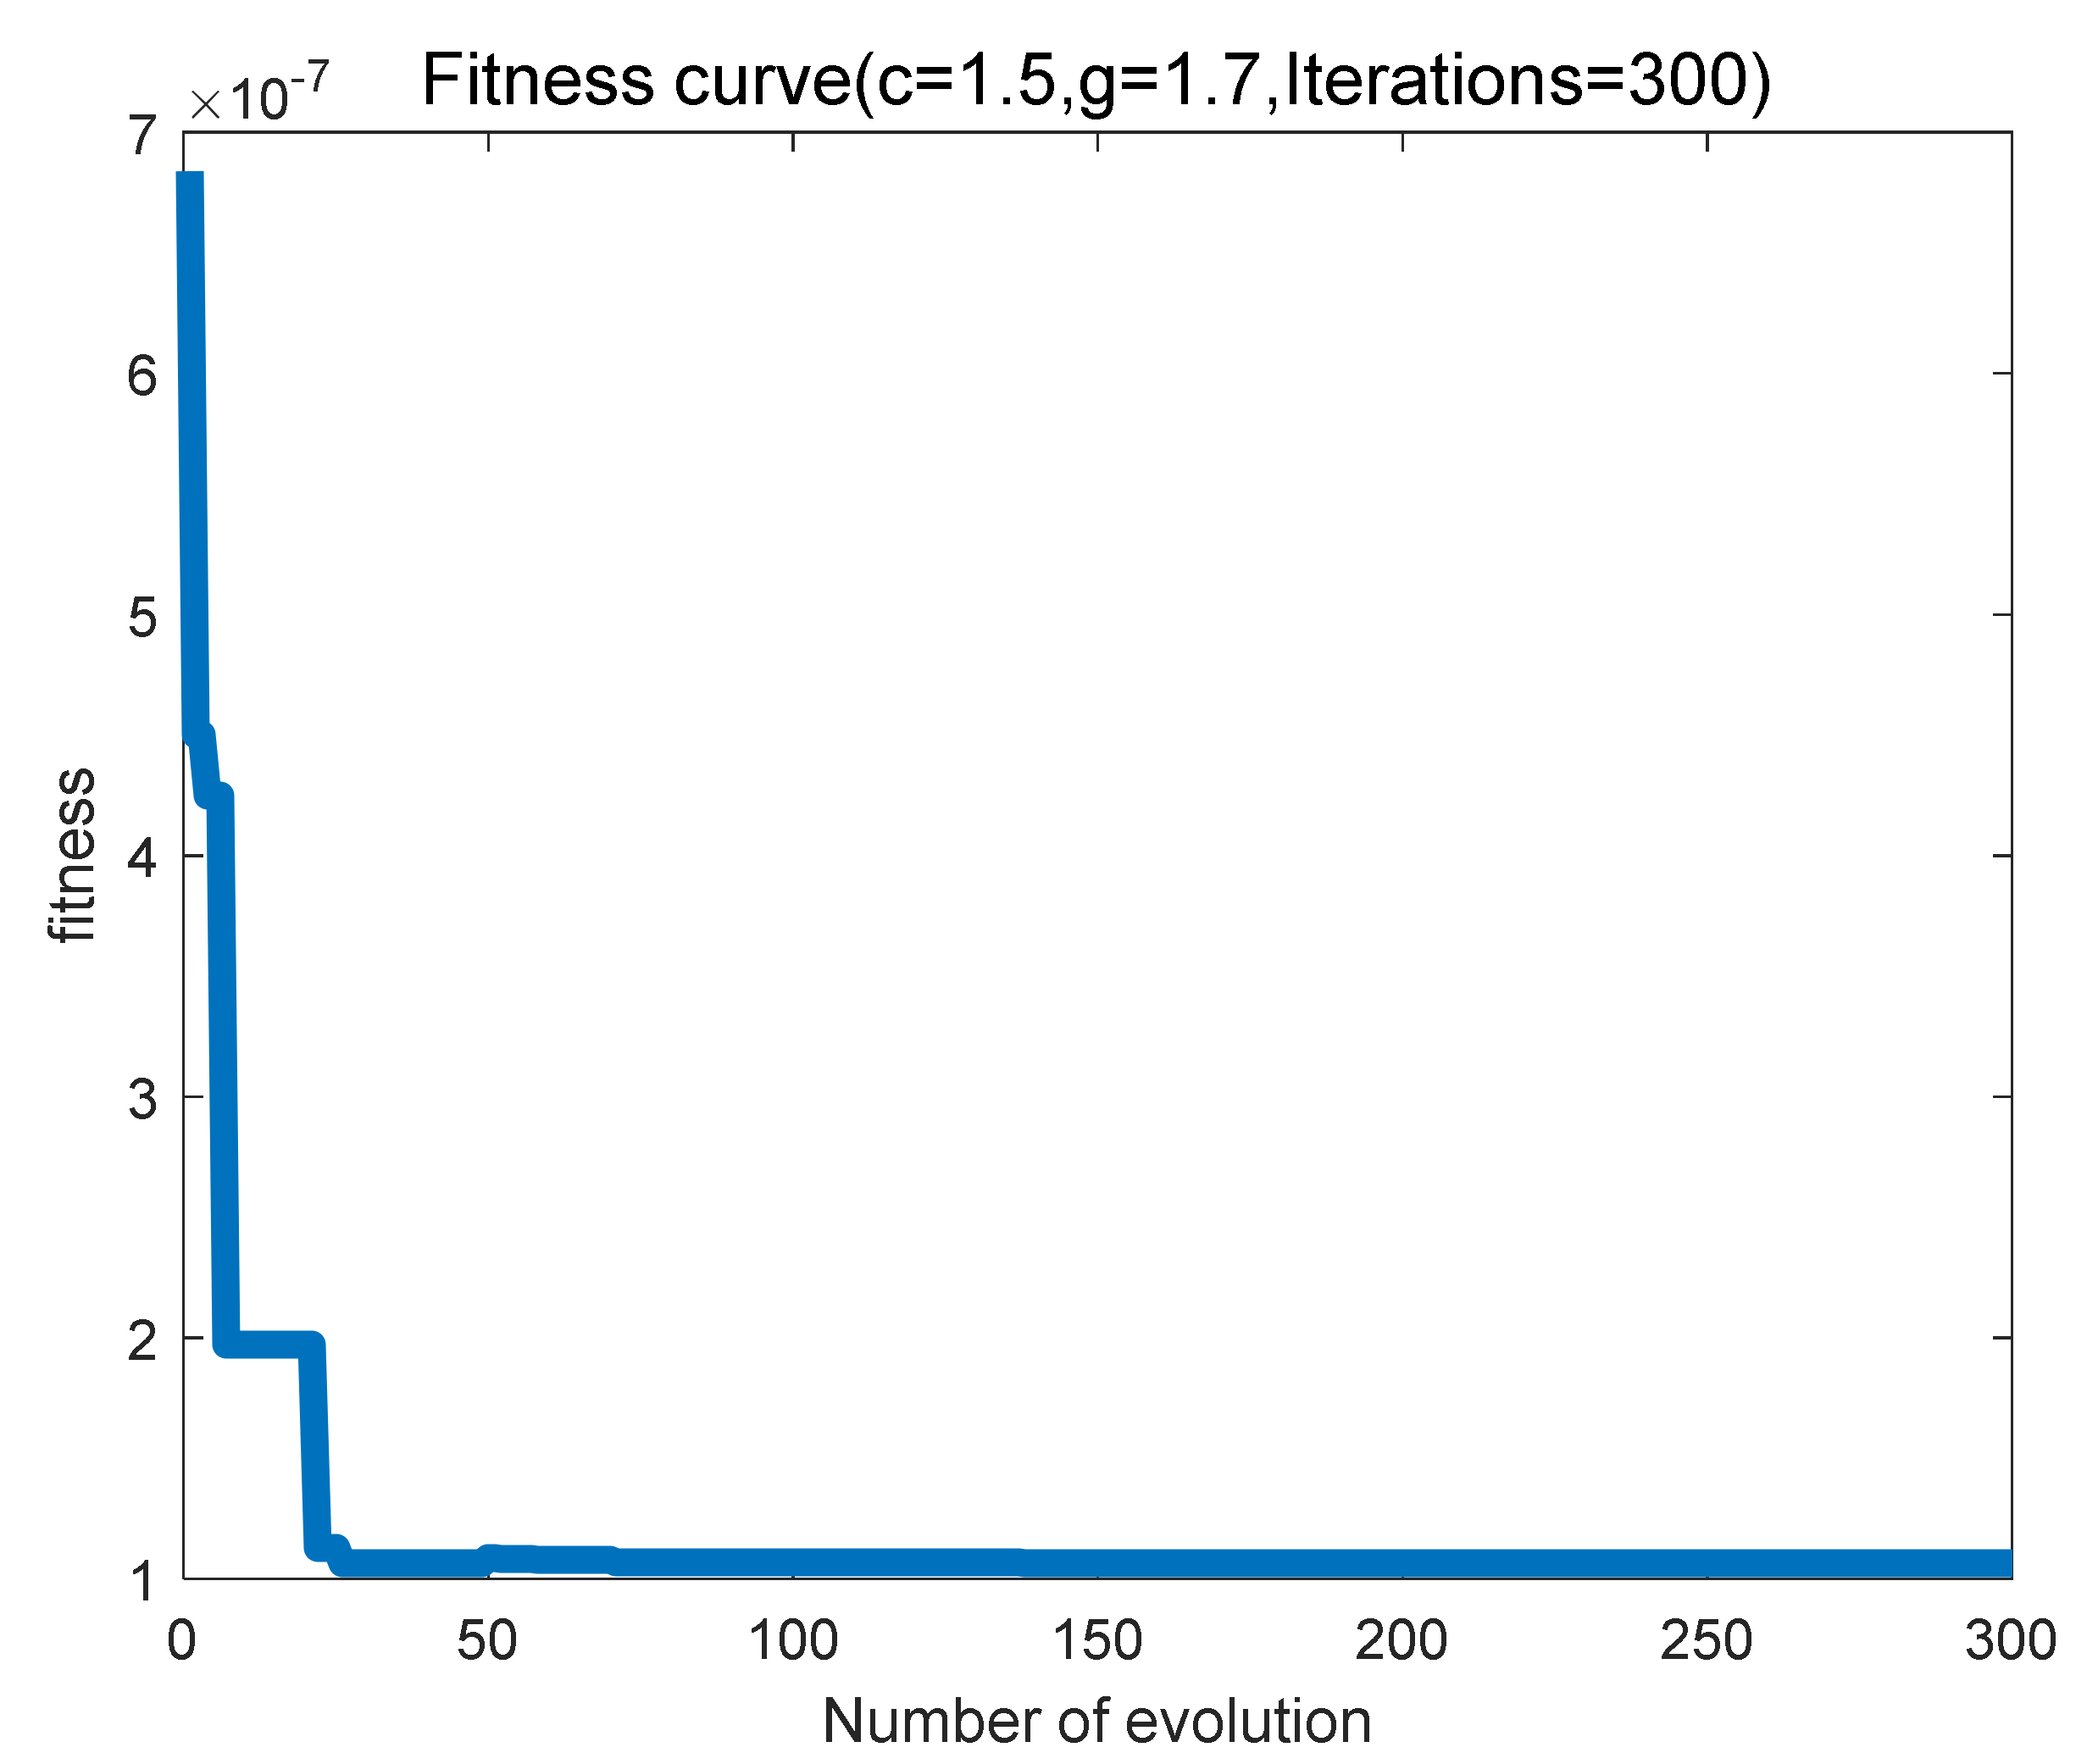
3.2. Training and Testing of PSO-LSSVR

The PSO algorithm has the advantages of fast convergence speed, collaborative search and can easily leap over local optimal information. It can balance the global detection and local mining ability of the LSSVR algorithm and dynamically adjust the parameters of the LSSVR model linearly (or nonlinearly) according to the iterative process and particle flight. To balance the global search and convergence speed, in this study, the upper limit of the adjustment iterations was set at 300. Through further optimization of the LSSVM model, the accuracy of the prediction model was further improved. The iteration processes of the PSO model for indicators N15 and N16 are shown in Figure 3 and Figure 4, respectively.
Figure 3 and Figure 4 are the fitting curves of the indicators N15 and N16 in the training of the PSO-LSSVR model, respectively. It can be seen from the curve that the indicators N15 and N16 both tended to converge above the 300-fold fitting degree. It shows that the PSO model was better for the optimization of the LSSVR model. After the optimization of the PSO model, its prediction accuracy was greatly improved. Furthermore, the PSO-LSSVR model was used to train and test the indicators data of the Beijing real estate market, and Figure 5 and Figure 6 were obtained for N15 and N16, respectively.
Figure 5 and Figure 6 are graphs that reflect the comparison between the training values and actual values obtained in the PSO-LSSVR model of the indicators N15 and N16, respectively. The blue points in the figure represent the results of the training values, and the red points represent the actual values. It can be seen from the figure that the training values obtained in the PSO-LSSVR model were highly consistent with the actual values. This situation showed that the prediction accuracy of the PSO-LSSVR model was very high, and the model could be used to predict the urban real estate market over the next ten years.

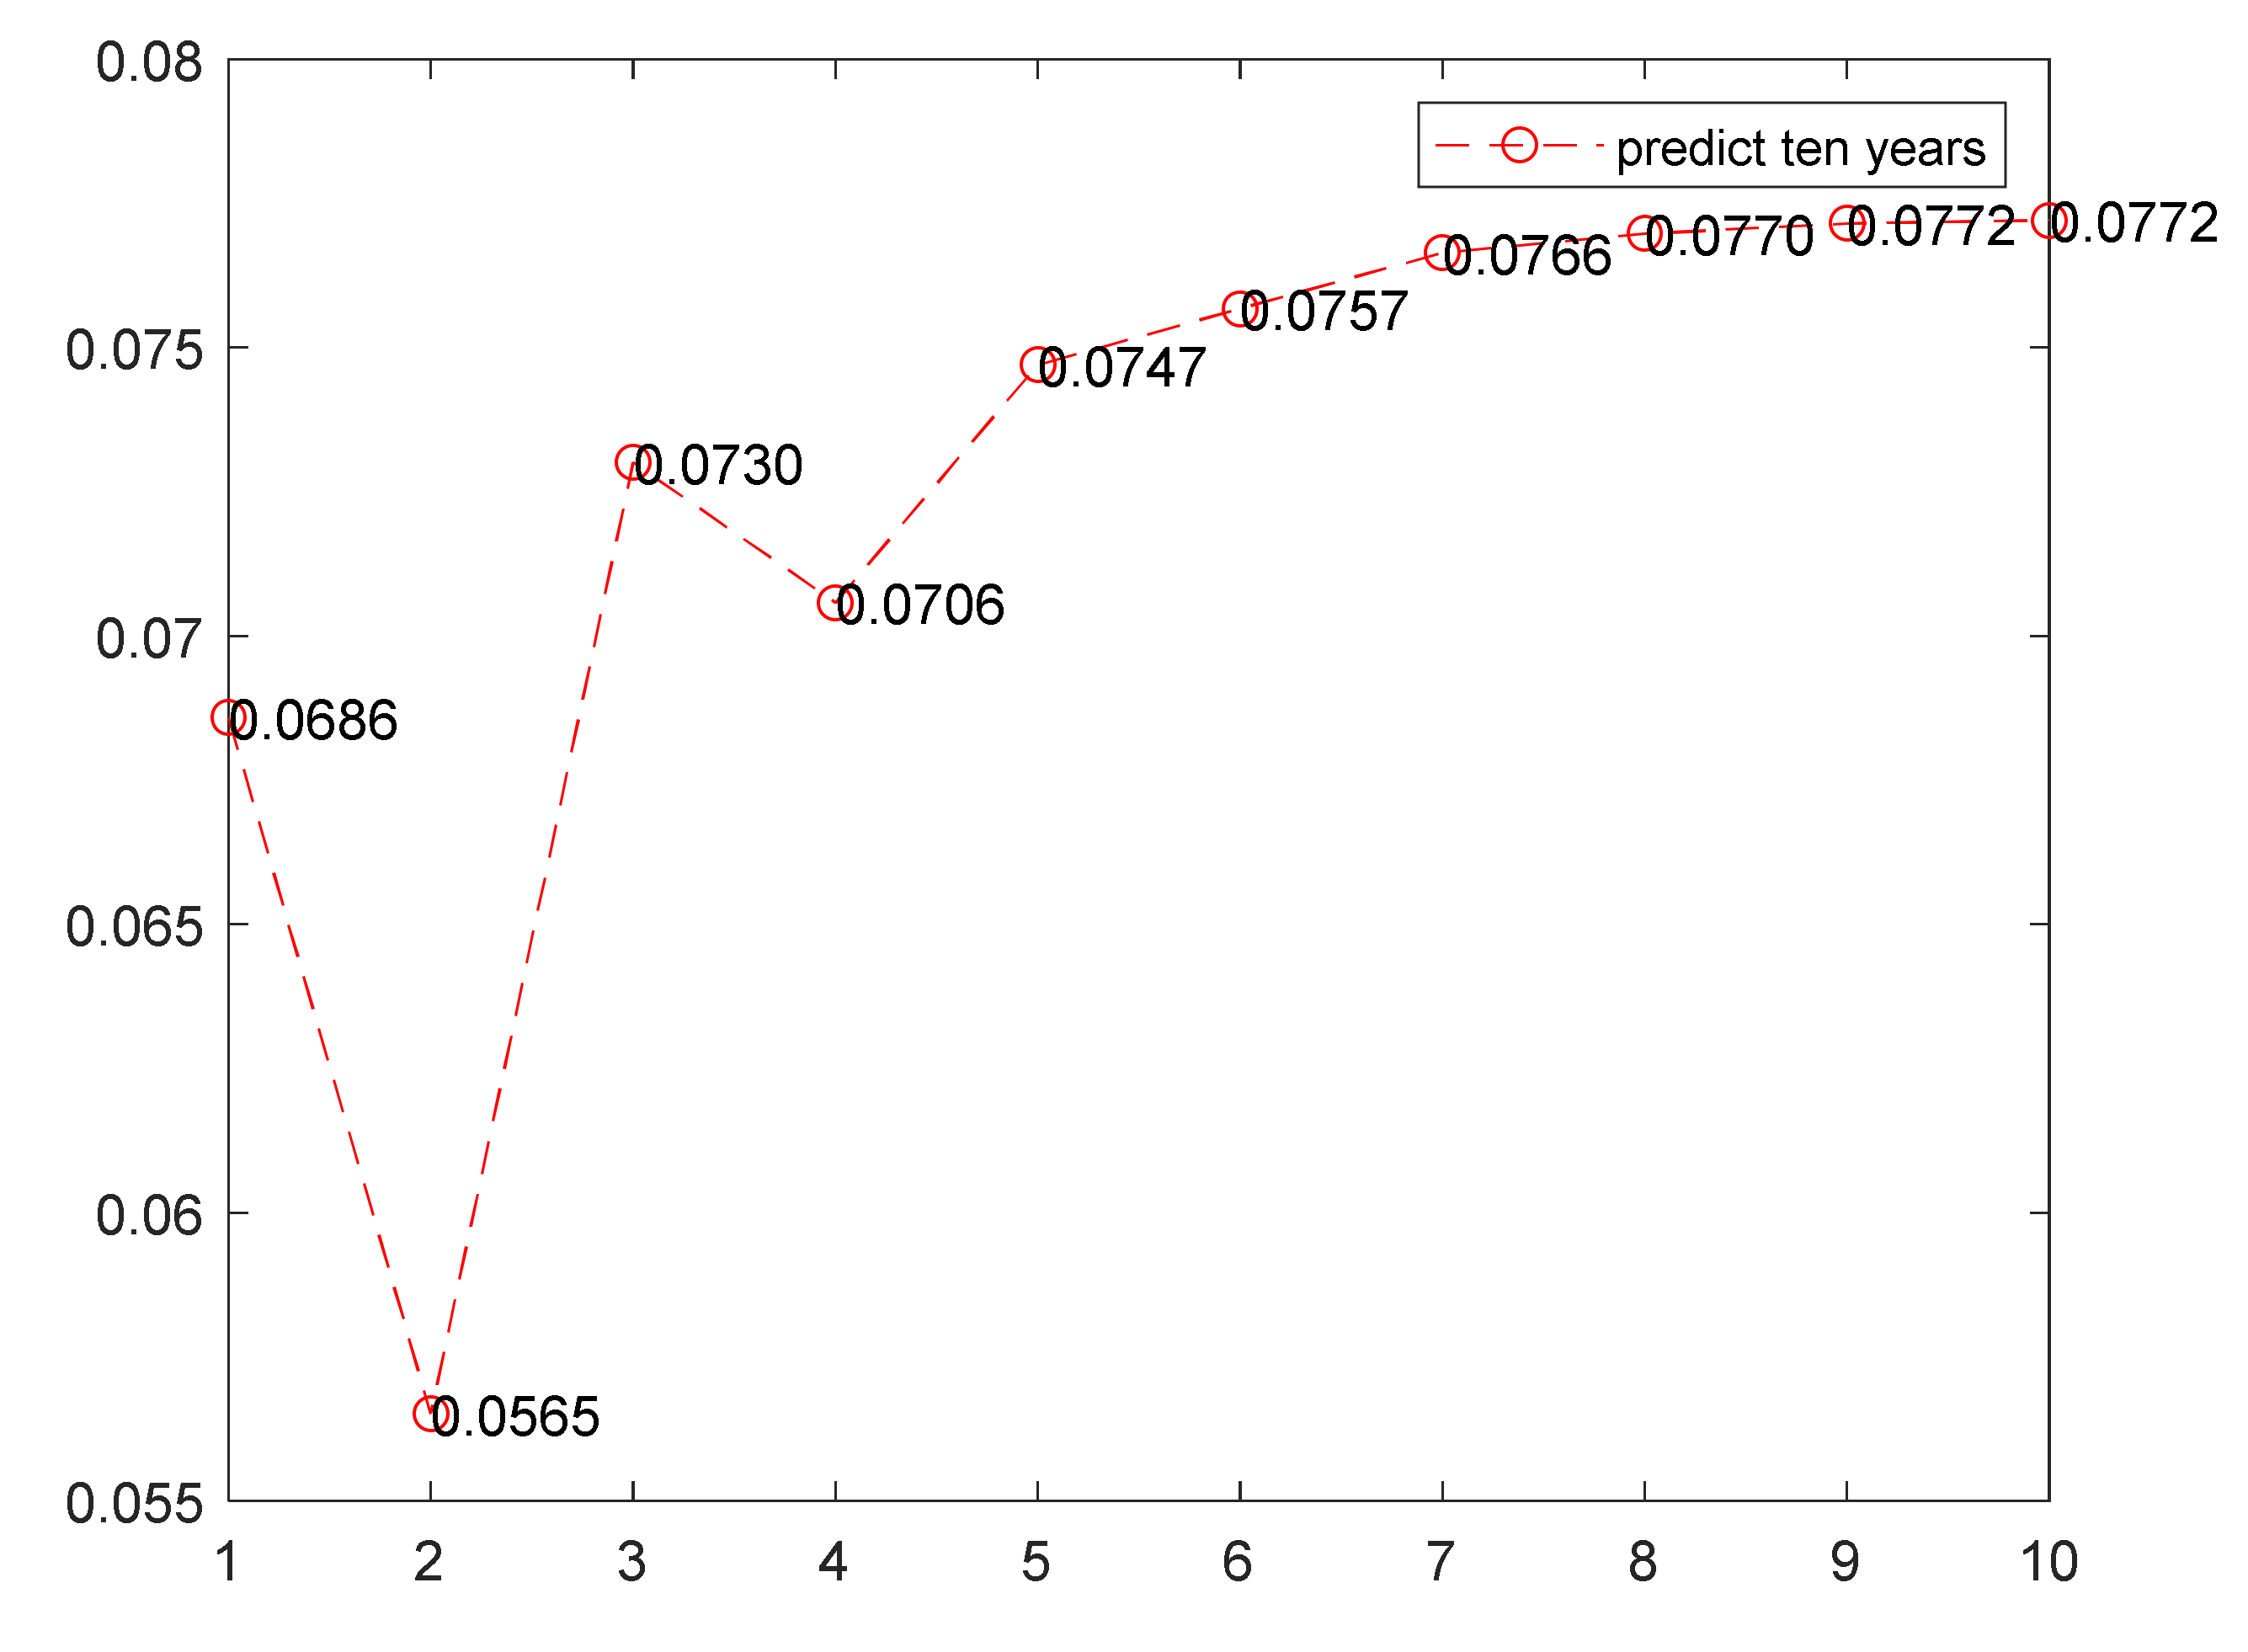
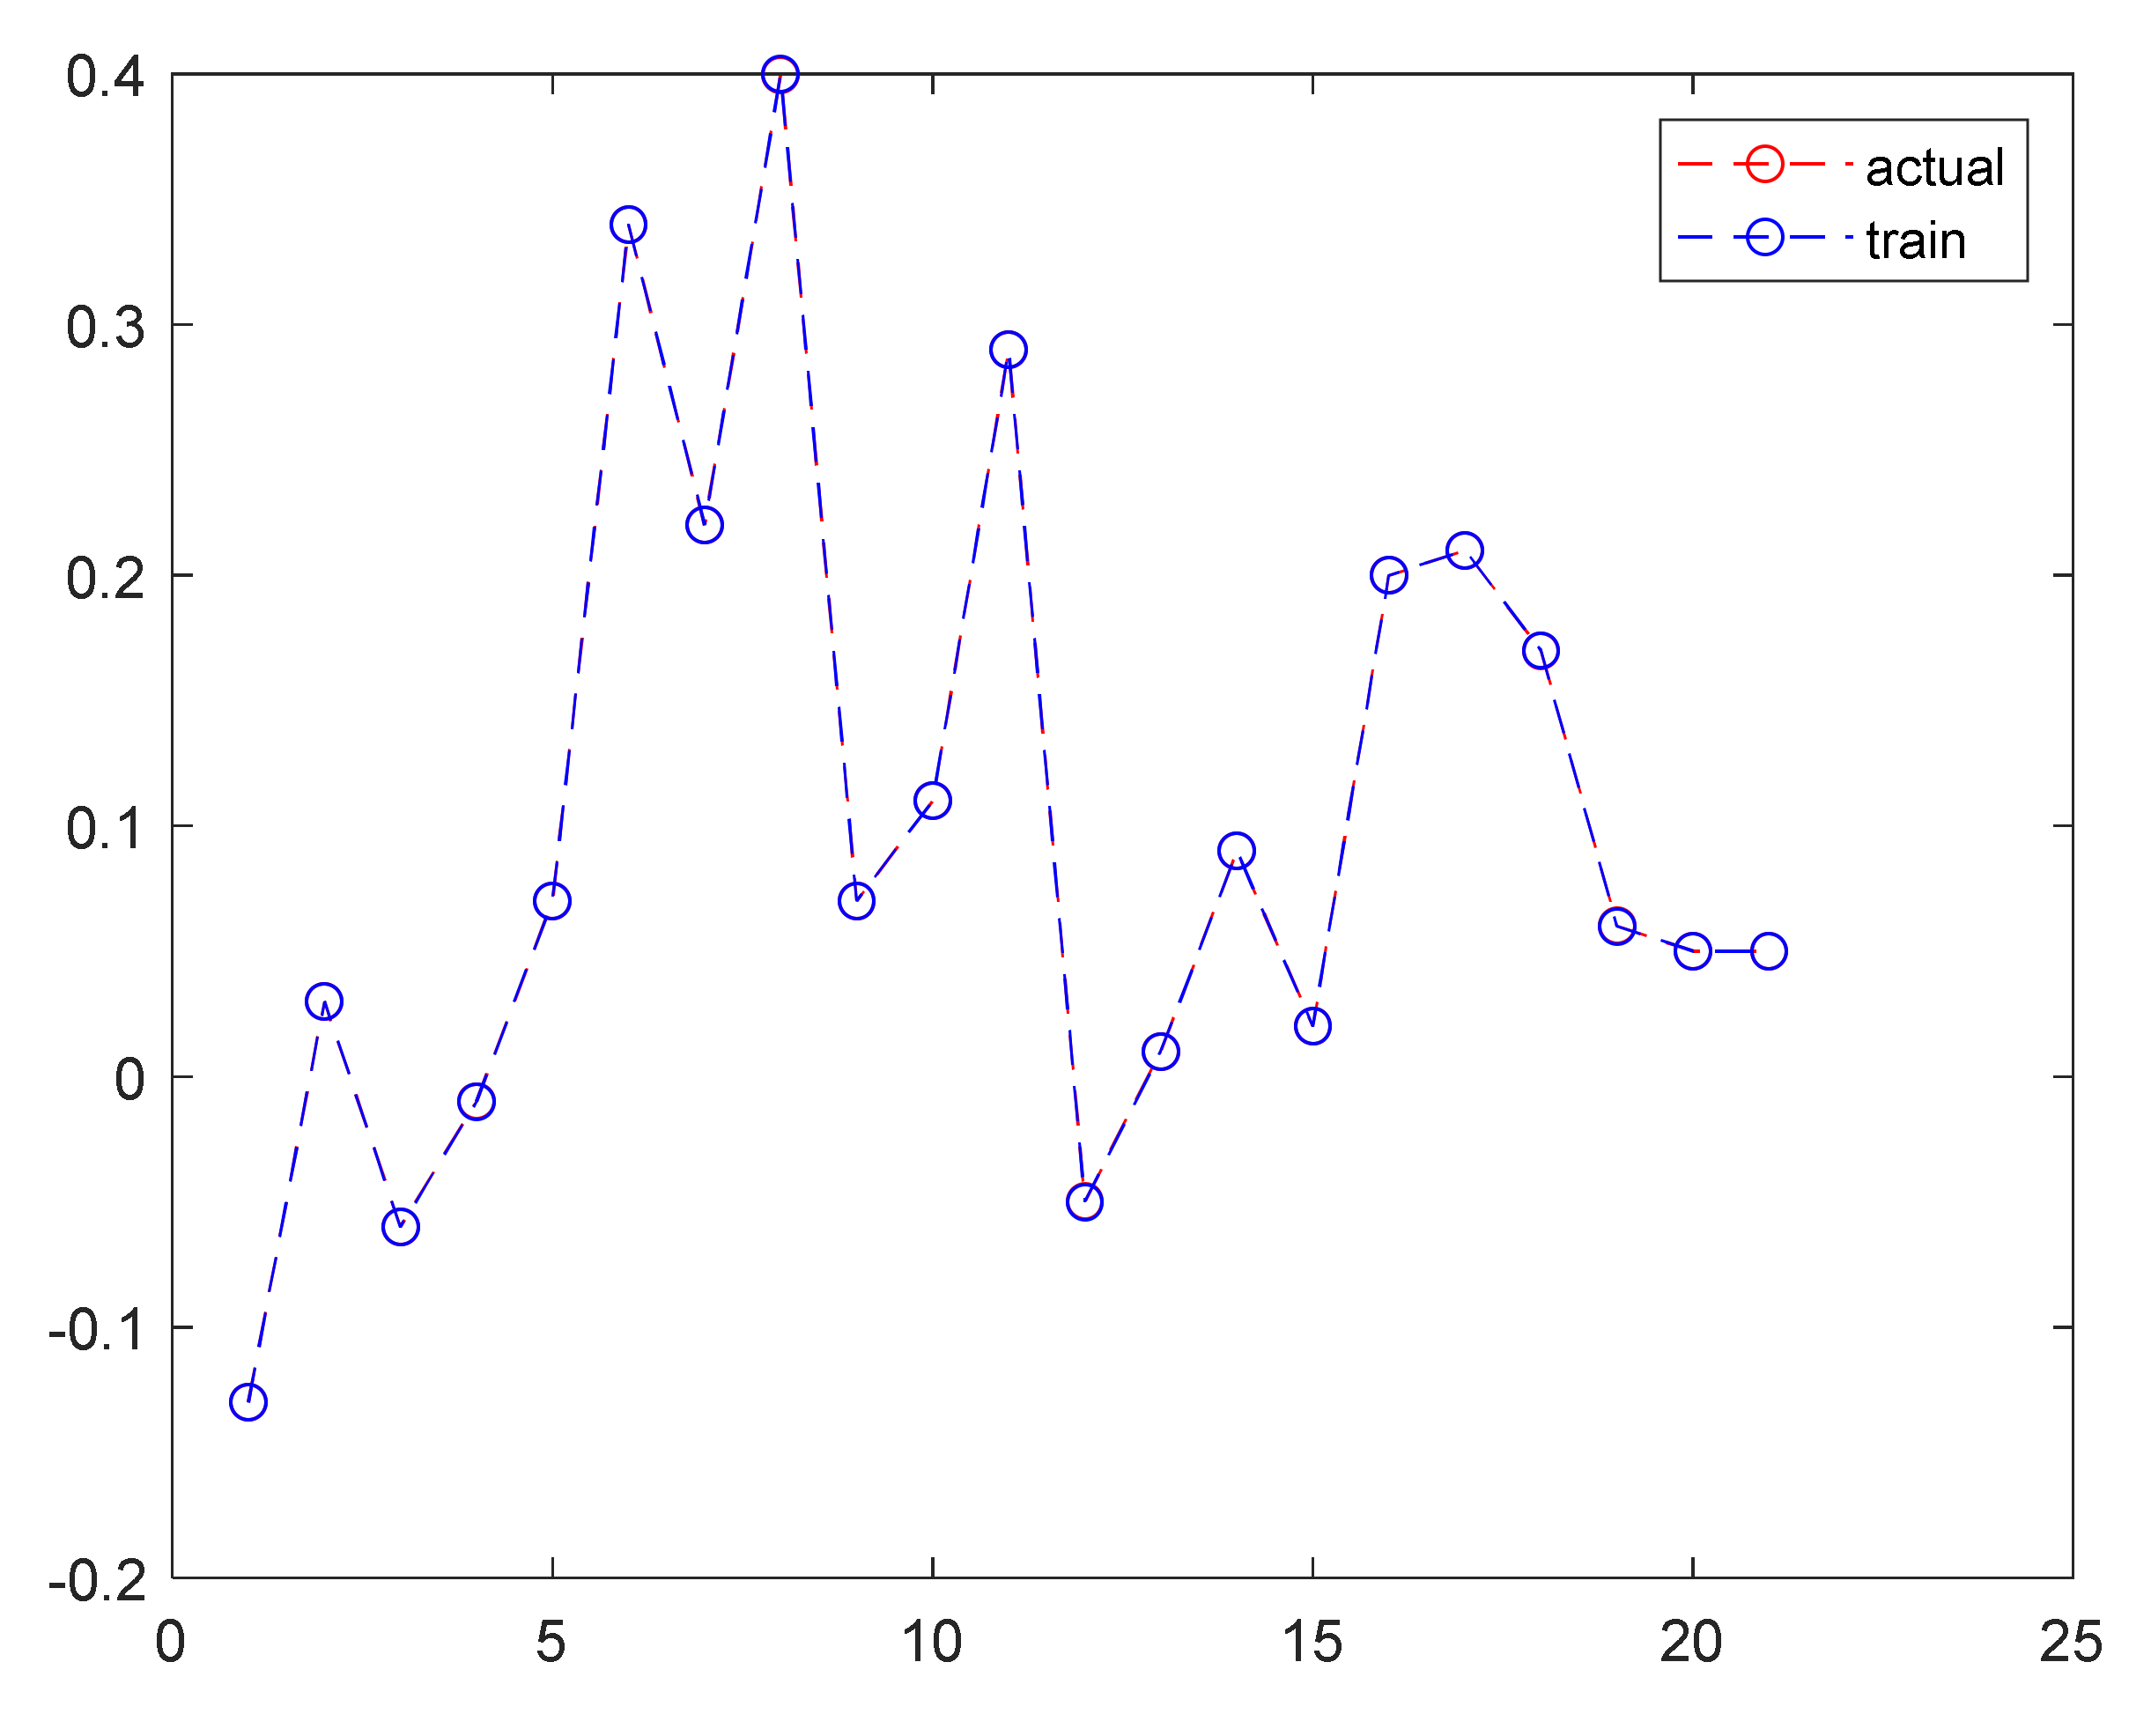
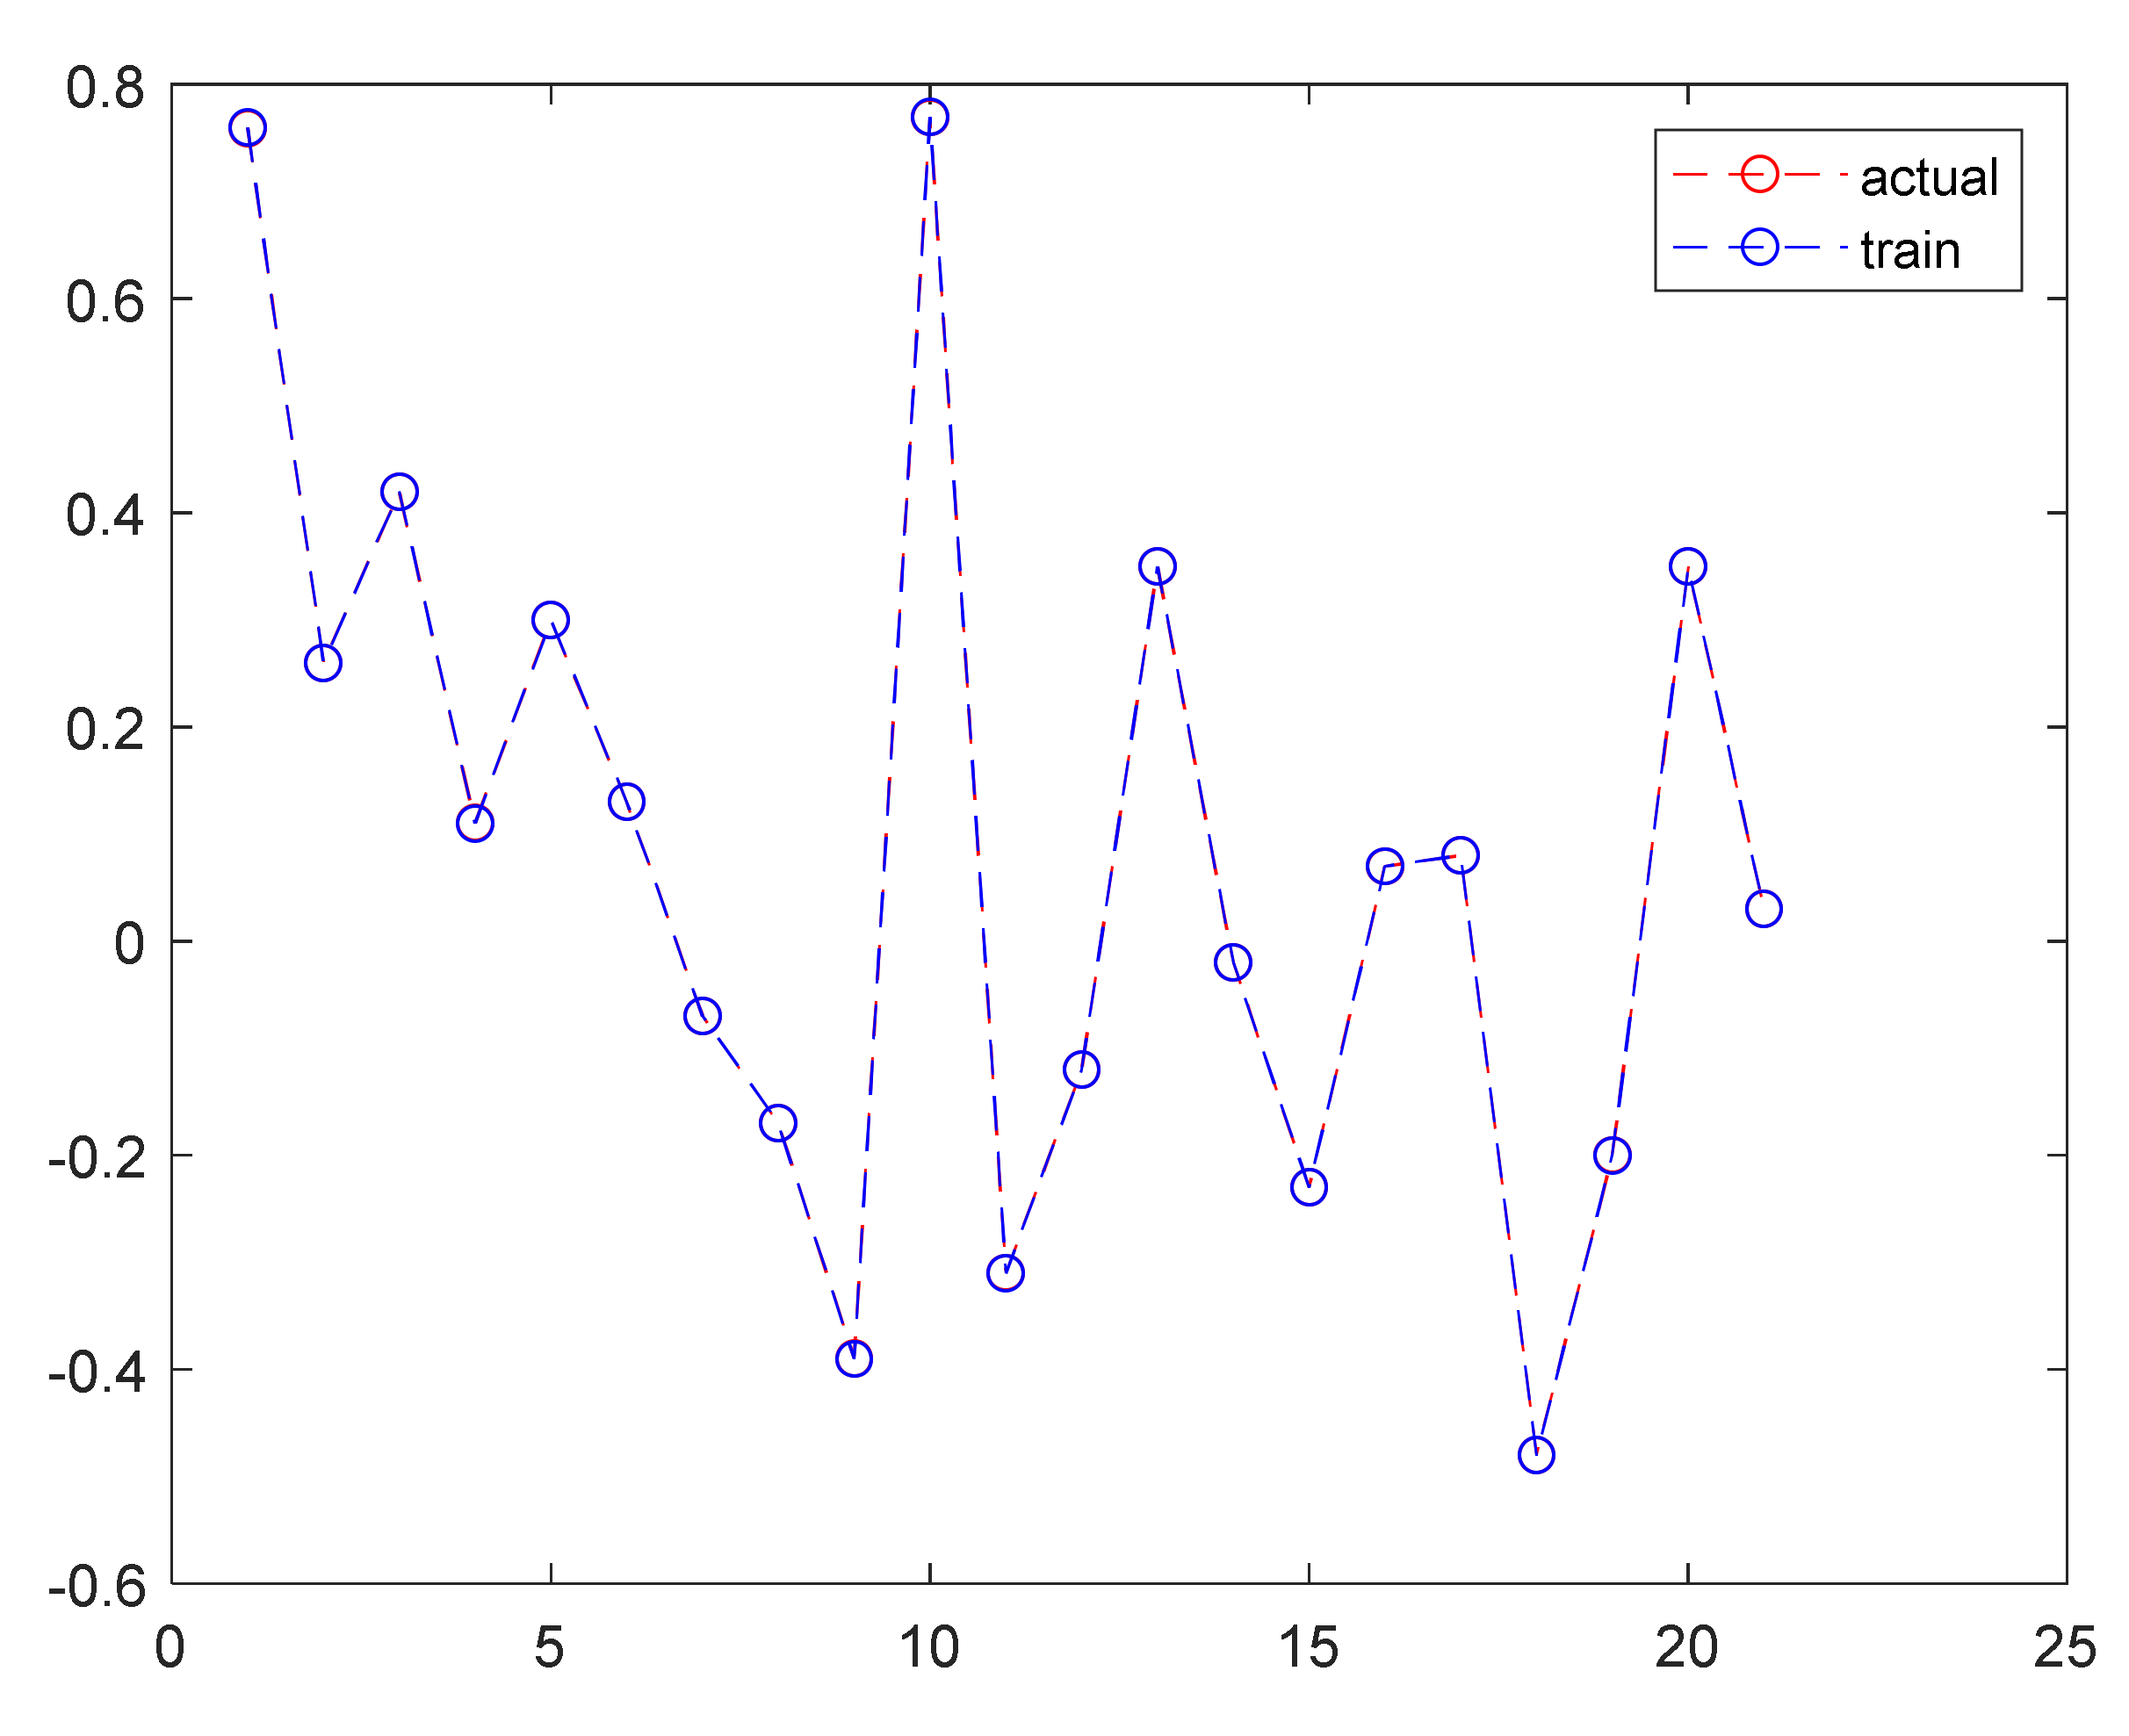
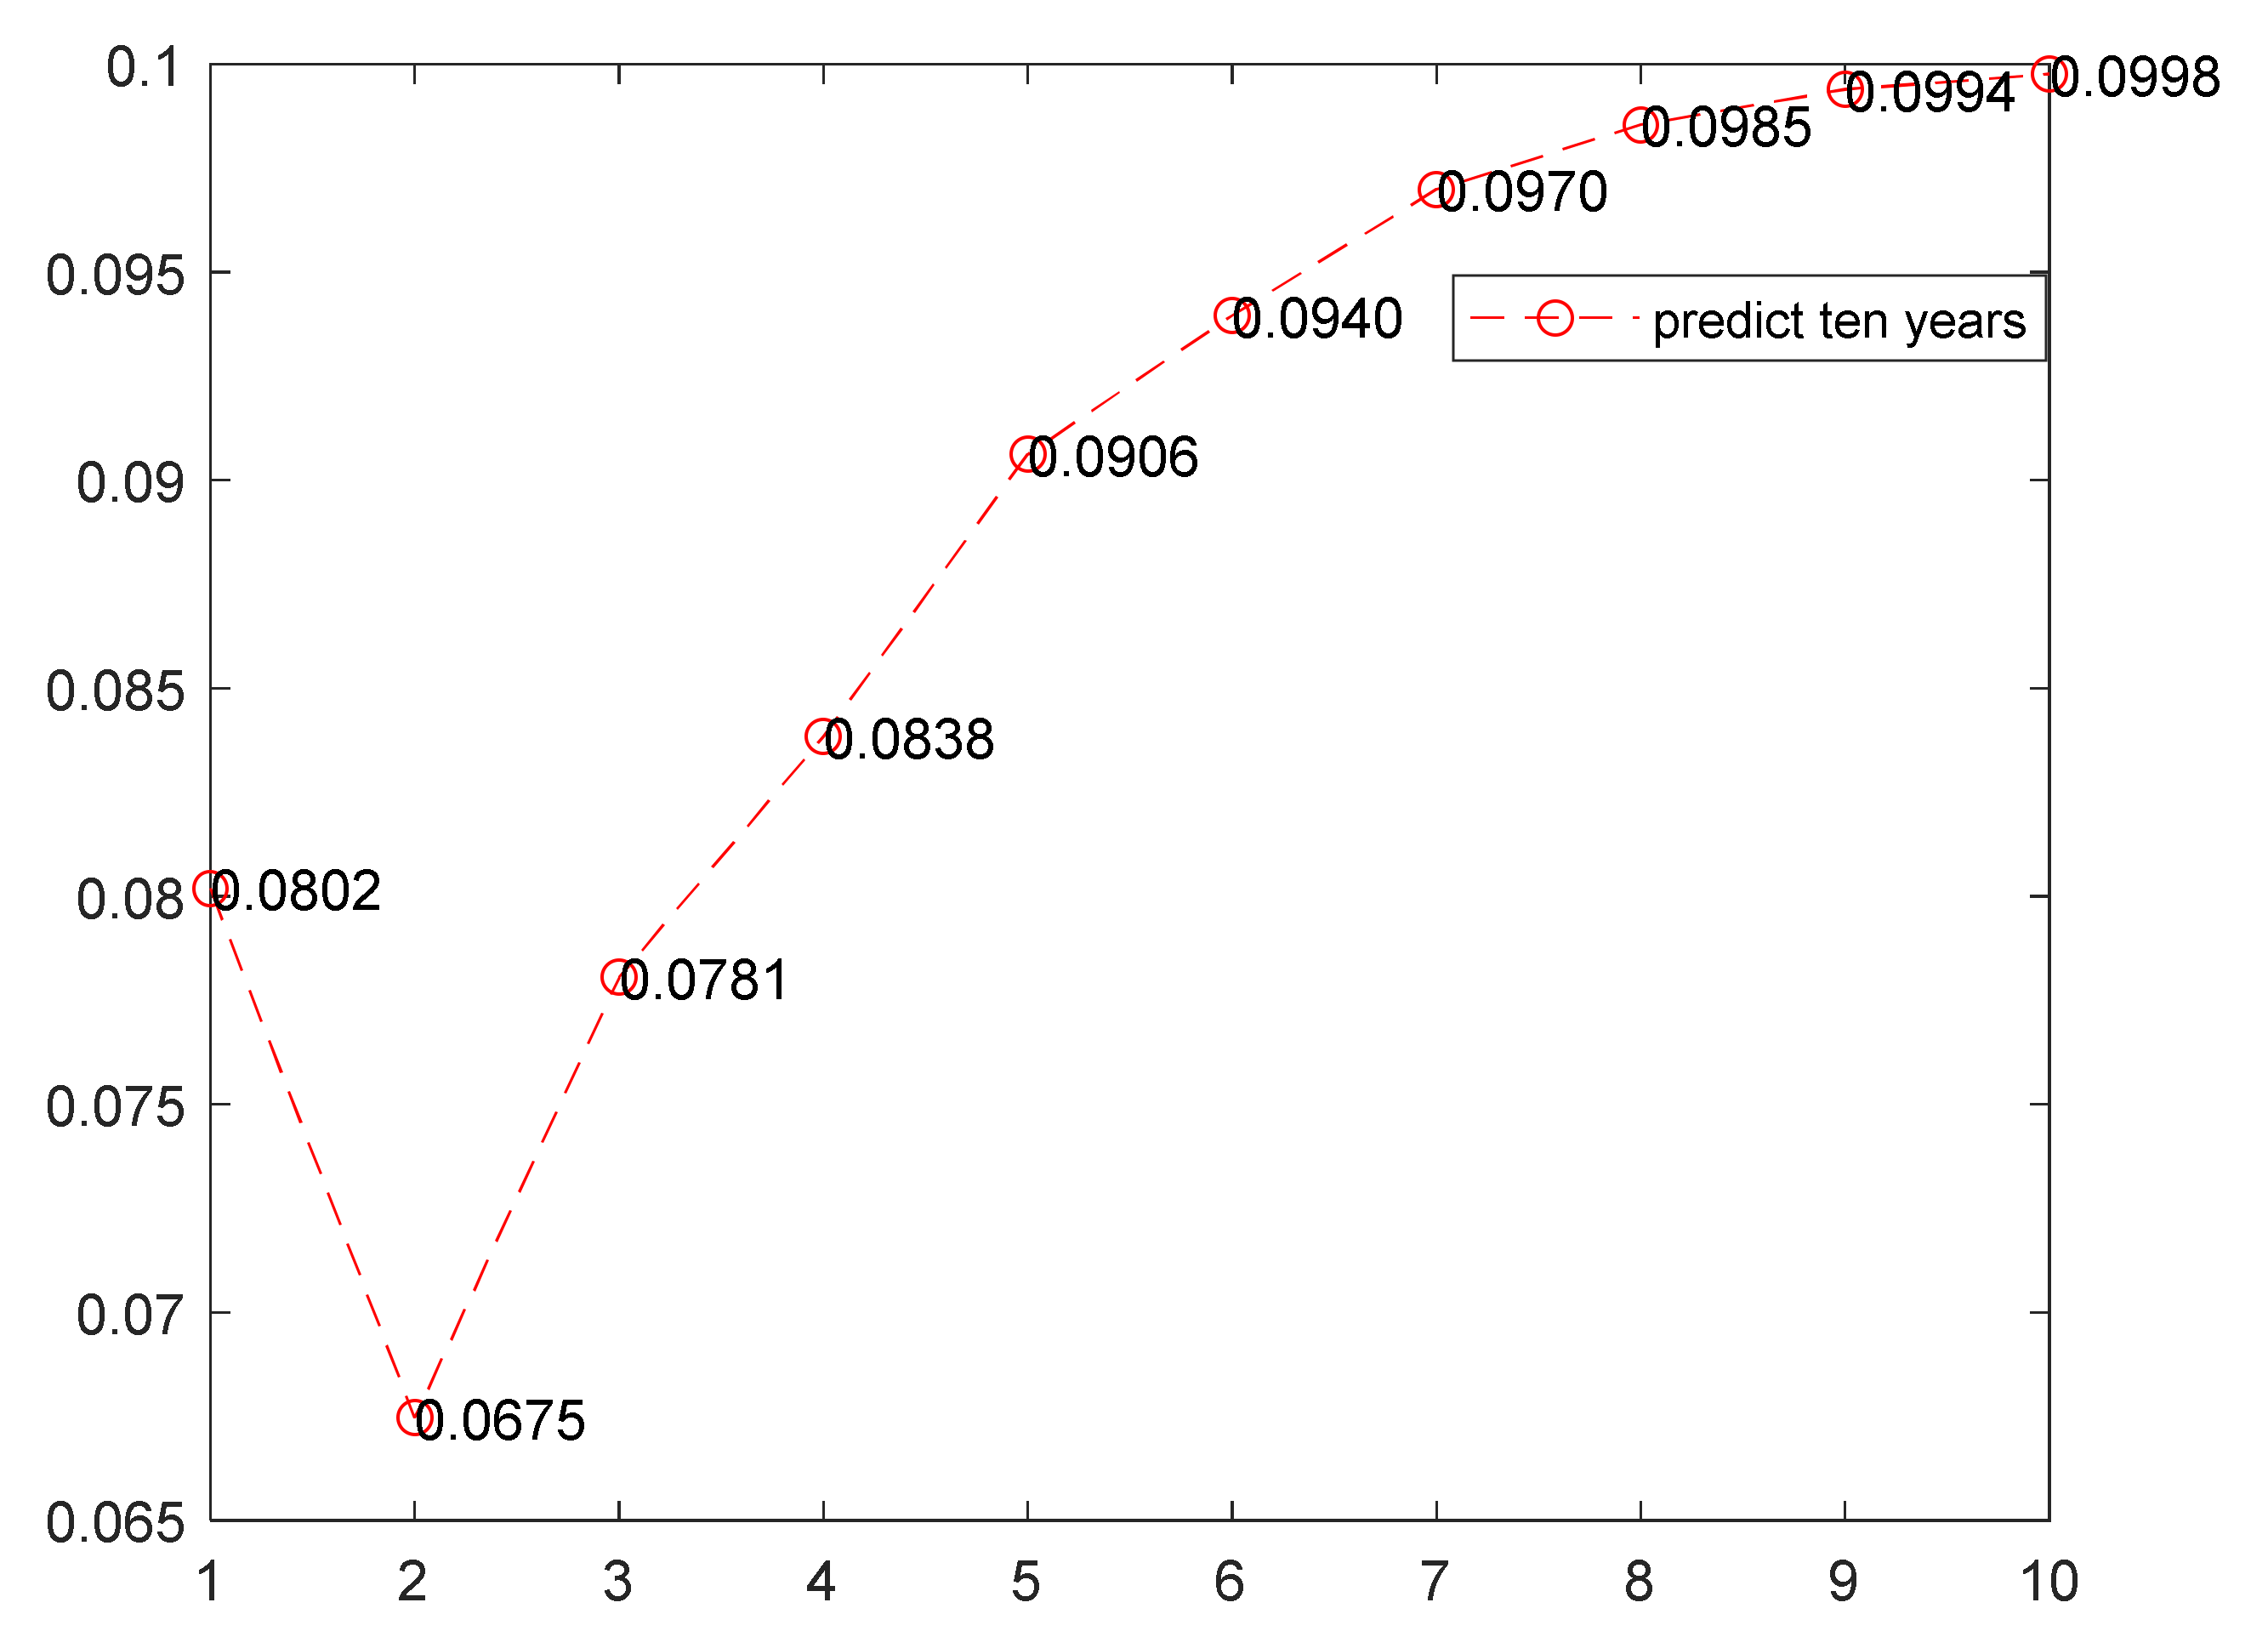
3.3. Prediction for Indicators N15 and N16 Based on PSO-LSSVR

In this study, the PSO-LSSVR model was constructed to predict the results of the early warning indicators N15 and N16 for the next ten years. First, the trend extrapolation method was adopted to extrapolate the results of the training indicators N1 to N14 over the next ten years. Then, the PSO-LSSVR model was used to predict the values for the next ten years, as shown in Table 3.
The values in Table 3 are collated into Figure 7 and Figure 8 to show the numerical trend of indicators N15 and N16 for the next ten years more clearly.
Figure 7 and Figure 8 respectively reflect the predicted values of the indicators N15 and N16 for the next ten years. It can be seen from the prediction results that the indicators N15 and N16 are expected to both show an overall upward trend for the next 7 years. However, in the fourth year, N15 is expected to continue its upward trend, while N16 is expected to decline. The following table reflects the predicted values of the influencing factors N15 and N16 for the next ten years.

3.4. Early Warning Degree of Beijing Real Estate Market

In this study, the status of the urban real estate market was divided into three categories, namely, “cold”, “normal” and “hot”, where the ranges of the factor standard values were used to determine the three categories. Considering the related research, the intervals for this study could be determined as one standard deviation above and below the 0; therefore, the state space could be divided into three intervals as , 1 , 1 , 1 , 1 , [34]. Subsequently, the three states of indicators N15 and N16 were divided into a matrix. According to the Guidelines for Tunneling Risk Management, the triangle of the risk matrix represents the line of two elements in the median status of one dimension and the extreme status of the other dimension represents one status. Since N15 and N16 are both factors reflecting the market conditions of the real estate market, there should not be a mixed “cold” and “hot” status. However, it is considered abnormal that two dependent variables exhibit diametrically opposite judgments; therefore, such states can be remarked as “abnormal”. Based on the above analysis, the states where both factors were cold or there was a mixture of normal and cold were marked as “cold”, the states where both factors were hot or there was a mixture of normal and hot were marked as “hot”, the states where the two factors were a mixture of cold and hot were marked as “abnormal” and the remaining condition with both factors being normal was marked as “Normal”. The results grading table was obtained as shown in Table 4 below.
After standardizing the original data and prediction results of indicators N15 and N16 from 2000 to 2030 in Section 3.3, the results are shown in Table 5 and Table 6. The indicator data column represents the raw data collected and the standardized value column represents the raw data normalized using the standardized formula x = x μ σ .
From Table 5, the warning statuses of the Beijing real estate market from 2000 to 2020 can be obtained. From 2000 to 2011, the warning statuses were chaotic, with the exception of the years 2001, 2003, 2004 and 2006. After the year 2011, the warning status gradually approached the “Normal” status, except for the year 2017, when it was “Cold”.
From Table 6, the warning statuses of the Beijing real estate market from 2021 to 2030 can be obtained. The warning degrees of indicators N15 and N16 from 2021 to 2030 were all “Normal”, and the warning statuses of the Beijing real estate market were also “Normal”.

4. Discussion

4.1. The Validation of PSO-LSSVR Model

From the training of the PSO-LSSVR model on historical data of the Beijing real estate market, it can be seen that the training values had a high fitting degree to the historical data. From Figure 3 and Figure 4, the results showed that the PSO optimization achieved the corresponding accuracy and stability quickly. The fitting degree illustrated that the PSO-LSSVR model had strong prediction accuracy and could effectively predict the information related to the real estate market.

4.2. Analysis of the Early Warning Status from 2000 to 2020

From the warning status from 2000 to 2020, it can be seen that the statuses of indicator N16 were relatively stable, where the warning statuses were basically in the “Normal” state, except for the fluctuation around 2010. For indicator N15, the warning statuses before 2012 were chaotic, with “Cold” or “Hot” states for many years, and after 2012, the statuses of indicator N15 tended to be stable. Reviewing the timing of the release and implementation of the relevant national real estate market regulation policies, it can be found that the General Office of the State Council published a Notice on Promoting the Steady and Healthy Development of the Real Estate Market in January 2010, which set out requirements and policies for housing price regulation and land supply management [67]. From the warning degrees of the Beijing real estate market, it can be seen that after a short policy lag period, the warning status tended to be stable.

4.3. Analysis of the Early Warning Status from 2021 to 2030

From the predicted early warning statuses of the Beijing real estate market from 2021 to 2030, there were slight fluctuations in the prediction results of both indicators N15 and N16. However, from the overall prediction results for the next decade, in the absence of major macro policy changes, the growth rates of N15 and N16 are expected to gradually slow down and eventually become stable. The warning degrees of the Beijing real estate market are expected to be in a stable “Normal” status.
On the other hand, the outbreak of COVID-19 at the end of 2019 had a great impact on the national economy and industry, including the real estate market. In fact, the slowdown of the material supply chain and the downturn of the consumer market is expected to lead to a certain slowdown in the growth rate of land sales and housing prices. It may lead to a “cold” status in the real estate market, and the government should put forward corresponding promotion strategies to manage the “cold” status of the real estate market during the epidemic.

5. Conclusions

In this study, a real estate early warning system was established based on the PSO-LSSVR method, which has good generalization ability and performance in the processing of small sample data. In the original sample data, the results for the years 2007, 2008, 2009 and 2010 were in an abnormal status because of frequent state policies regarding land supply, interest rates being reduced five times by the central bank in 2008, etc. Hence, the real estate market in Beijing showed continuous fluctuation from containment to stimulation and then to containment. By comparing the predicted values with the actual values, it was found that the prediction status of the model was very good; furthermore, the prediction values for N15 and N16 over the next five years were calculated using the prediction model combined with the trend extrapolation method. The results showed that the status of the real estate market in Beijing is expected to be “normal” from 2020 to 2024. The current policy theme of China’s real estate market is to maintain the stability of the market. However, although China’s real estate market is currently in a relatively stable state, it still needs to be constantly improved in terms of the system construction, financing channels and supervision system. In addition, it is necessary to emphasize the property of housing as consumer goods rather than investment goods, promote a people-oriented development policy, ensure the healthy and stable development of the real estate market, and prevent the formation of real estate market bubbles.
1.
Balance regional housing supply and demand while promoting real estate marketization
The government’s encouraging policies and reasonable planning for the real estate market are the premise to ensure its healthy and stable development. In the process of long-term planning of the urban real estate market, the development trend of population flow and the urbanization process should be analyzed, and the market demand should be predicted. Furthermore, a reasonable supply of land is vital for housing supply and demand; therefore, the urban government should plan reasonable land consolidation based on the market demand and expectations. In addition, the regularization management of the housing rental market is also one of the key points for promoting the regulation of urban housing supply and demand. Moreover, the reasonable supply of affordable housing is a key factor to guarantee the housing demand of middle- and low-income groups, and also a part of the balance between urban housing supply and demand.
2.
Construct the long-term mechanism to promote the healthy development of the real estate market
From the analysis, the investment and the consumption of the real estate market are related to the development of the national economy. The government should balance the inner relationship through regulatory measures to prevent the market from overheating or overcooling. Furthermore, a long-term mechanism must be the foundation to ensure the healthy and sustainable development of the real estate market. The macroeconomic regulation and control strategies should ensure compliance with market rules. The government should also clarify the detailed issues of housing security based on specific laws. Moreover, a scientific and reasonable housing security system is vital, where the object of protection and its scope of protection should be explicit. The housing security system with diversified supply is a vital part of the housing structure system.
3.
Expand financing channels in the real estate market and regulate financing behaviors in the real estate market
In order to better improve the mechanism of the urban real estate market, it is necessary to strengthen management from the perspective of financing. For affordable housing projects, the urban government should encourage financial organizations to provide multifaceted financing methods and encourage developers to build affordable housing by means of policy support. For the housing security system, it is important to enhance low-income people’s ability to finance and pay by coordinating the housing security system with the housing provident fund, subsistence allowances for urban residents, unemployment insurance, old-age insurance and other social security systems. Simultaneously, the urban government should resolutely curb the purchase of houses for investment and speculation purposes to promote the steady and healthy development of the real estate market.
4.
Strengthen supervision policies in the real estate market
To further strengthen the real estate market supervision, the government should standardize the market order, purify the market environment, curb unreasonable sales behaviors of developers and control property speculation by all parties to ensure the steady and healthy development of the real estate market. For the sale of commercial housing projects, all kinds of ways to collect deposits, advance payments and other charges, as well as the requirement of bank-verified certificates of buyers, should be strictly regulated and controlled. Real estate development enterprises should set reasonable prices according to market demand and standardize the price behavior of the commodity housing market. The provisions of the clearly marked price should be strictly implemented, and the sales price publicized should be completely consistent with the price department’s record price.
As a complex industry, the development of the real estate market is associated with many related industries, such as the construction, decoration and materials industries. The real estate market as an indispensable part of urban development is also related to regional economic development, population flow, and social health and stability. In order to further promote the healthy and stable development of the real estate market, researchers should conduct a comprehensive system and analyze the dynamic trends to study the impact of relevant policy regulations on the trends of the real estate market.

Author Contributions

Methodology, L.M.; software, Z.C.; validation, L.W., X.R. and L.M.; formal analysis, Z.C.; investigation, L.W.; resources, L.M.; data curation, S.J.; writing—original draft preparation, L.W.; writing—review and editing, L.M.; supervision, X.R.; funding acquisition, L.M. and X.R. All authors have read and agreed to the published version of the manuscript.

Funding

This research was funded by “the National Natural Science Foundation of China (NSFC), grant number: 71904042“; “the Social Science Foundation of Hebei Province, grant number: HB17GL030”; and “the Social Science Development Research Project of Hebei Province, grant number: 20210101021”.

Institutional Review Board Statement

Not applicable.

Informed Consent Statement

Not applicable.

Data Availability Statement

Not applicable.

Conflicts of Interest

The authors declare no conflict of interest.

References

  1. Statistics Bureau of the People’s Republic of China, China Statistical Yearbook. 2021. Available online: http://www.stats.gov.cn/ (accessed on 18 March 2022). (In Chinese)
  2. Yan, J.Z.L. Empirical Researches on Macroeconomic Influence Factors in Real Estate Based on Data Mining (DM). Agro Food Ind. Hi-Tech 2017, 28, 2729–2732. [Google Scholar]
  3. Kuil, P.; Wellner, K. The Imperatives of the Real Estate Industry and its Effects on Architecture and the Built Environment; Case Studies Presentation. In Proceedings of the 24th Annual European Real Estate Society Conference, Delft, The Netherlands, 30 June 2017. [Google Scholar]
  4. Carrasco-Gallego, J.A. Real Estate, Economic Stability and the New Macro-Financial Policies. Sustainability 2020, 13, 236. [Google Scholar] [CrossRef]
  5. Jian, C.; Cao, P.; Zhou, X.; Lai, K.K.; Chen, X.; Su, S. The Conductive and Predictive Effect of Oil Price Fluctuations on China's Industry Development Based on Mixed-Frequency Data. Energies 2018, 11, 1372. [Google Scholar]
  6. Brzezicka, J. Towards a typology of housing price bubbles: A literature review. Hous. Theory Soc. 2021, 38, 320–342. [Google Scholar] [CrossRef]
  7. Machaj, M. Can the Taylor Rule be a Good Guidance for Policy? The Case of 2001–2008 Real Estate Bubble. Prague Econ. Pap. 2016, 25, 381–395. [Google Scholar] [CrossRef]
  8. Liow, K.H.; Zhou, X.; Ye, Q. Correlation Dynamics and Determinants in International Securitized Real Estate Markets. Real Estate Econ. 2015, 43, 537–585. [Google Scholar] [CrossRef]
  9. Yan, X.; Lin, X. Business Expanding and Strategic Decision-Making Innovation for Real Estate Valuation Companies Based on Big-Data. In Proceedings of the 20th International Symposium on Advancement of Construction Management and Real Estate; Springer: Singapore, 2017; pp. 1057–1068. [Google Scholar]
  10. Gu, H. Macroeconomic early warning research: Theory, method, history. Econ. Theor. Econ. Manag. 1997, 4, 1–7. [Google Scholar]
  11. Xiao, L. Research on Urban Residential Area Early Warning System Based on Artificial Neural Network. Agro Food Ind. HI-Tech 2017, 28, 2250–2254. [Google Scholar]
  12. Vergara-Perucich, J.; Aguirre-Nunez, C. Housing Prices in Unregulated Markets: Study on Verticalised Dwellings in Santiago de Chile. Buildings 2020, 10, 6. [Google Scholar] [CrossRef] [Green Version]
  13. Echeverri, N.; Jylha, T.; Koppels, P. Searching for Flexibility in Corporate Real Estate Portfolio: Six Co-Working Strategies for User Corporations. Buildings 2021, 11, 115. [Google Scholar] [CrossRef]
  14. Zhao, X.; Gao, Y. Impact of Transaction Characteristics on the Performance of Mergers and Acquisitions (M and A) in Chinese Real Estate Industry. J. Tianjin Univ. (Soc. Sci.) 2017, 19, 119–124. [Google Scholar]
  15. Kang, J.; Lee, H.; Jeong, S.; Lee, H.; Oh, K. Developing a forecasting model for real estate auction prices using artificial intelligence. Sustainability 2020, 12, 2899. [Google Scholar] [CrossRef] [Green Version]
  16. Yu, Y.; Lu, J.; Shen, D.; Chen, B. Research on real estate pricing methods based on data mining and machine learning. Neural Comput. Appl. 2021, 33, 3925–3937. [Google Scholar] [CrossRef]
  17. Pyhrr, S.A.; Born, W.L.; Robinson, R.; Lucas, S.R. Real property valuation in a changing economic and market cycle. Apprais. J. 1996, 64, 14. [Google Scholar]
  18. Pyhrr, S.A. A Computer Simulation Model to Measure the Risk in Real Estate Investment. Real Estate Economics. 2010, 1, 48–78. [Google Scholar] [CrossRef]
  19. Nieboer, N.; Voogd, H. Housing vacancy and early warning systems. Neth. J. Hous. Environ. Res. 1990, 5, 237–249. [Google Scholar] [CrossRef]
  20. Hoffman, A.V.; Belsky, E.S.; Lee, K. The Impact of Housing on Community: A Review of Scholarly Theories and Empirical Research, Joint Center for Housing Studies, Graduate School of Design and John F. Kennedy School of Government; Harvard University: Cambridge, MA, USA, 2006. [Google Scholar]
  21. Chan, K.F.; Treepongkaruna, S.; Brooks, R.; Gray, S. Asset market linkages: Evidence from financial, commodity and real estate assets. J. Bank. Financ. 2011, 35, 1415–1426. [Google Scholar] [CrossRef]
  22. Gonzalez, M.R.; Basse, T.; Kunze, F.; Vornholz, G. Early warning indicator systems for real estate investments: Empirical evidence and some thoughts from the perspective of financial risk management. Z. Für Gesamte Versicher. 2018, 107, 387–403. [Google Scholar] [CrossRef]
  23. Huang, A.; Qiu, L.; Li, Z. Applying Deep Learning Method in TVP-VAR Model under Systematic Financial Risk Monitoring and Early Warning. J. Comput. Appl. Math. 2021, 382, 113065. [Google Scholar] [CrossRef]
  24. Loris, A.B. A Financial Early Warning System for Over-the-Counter Broker-Dealers. J. Financ. 1976, 31, 1201–1217. [Google Scholar]
  25. Caruzzo, A.; Belderrain, M.C.N.; Fisch, G.; Young, G.S.; Hanlon, C.J.; Verlinde, J. Modelling weather risk preferences with multi-criteria decision analysis for an aerospace vehicle launch. Meteorol. Appl. 2018, 25, 456–465. [Google Scholar] [CrossRef] [Green Version]
  26. Burnaev, E.V. On Construction of Early Warning Systems for Predictive Maintenance in Aerospace Industry. J. Commun. Technol. Electron. 2019, 64, 1473–1484. [Google Scholar] [CrossRef]
  27. Clements, C.F.; Mccarthy, M.A.; Blanchard, J.L. Early warning signals of recovery in complex systems. Nat. Commun. 2019, 10, 1681. [Google Scholar] [CrossRef] [PubMed] [Green Version]
  28. Kong, Q.; Allen, R.M.; Schreier, L.; Kwon, Y.-W. MyShake: A smartphone seismic network for earthquake early warning and beyond. Sci. Adv. 2016, 2, e1501055. [Google Scholar] [CrossRef] [PubMed] [Green Version]
  29. Li, Z.; Meier, M.-A.; Hauksson, E.; Zhan, Z.; Andrews, J. Machine Learning Seismic Wave Discrimination: Application to Earthquake Early Warning. Geophys. Res. Lett. 2018, 45, 4773–4779. [Google Scholar] [CrossRef] [Green Version]
  30. Wang, J.; Wang, J. A New Early Warning Method of Train Tracking Interval Based on CTC. IEEE Trans. Intell. Transp. Syst. 2017, 99, 1–7. [Google Scholar] [CrossRef] [Green Version]
  31. Wang, H.; Li, L.; Pan, P.; Wang, Y.; Jin, Y. Early warning of burst passenger flow in public transportation system. Transp. Res. Part C Emerg. Technol. 2019, 105, 580–598. [Google Scholar] [CrossRef]
  32. Kalliomäki, J.; Kontula, T.; Kalliomäki, M.L.; Kivipuro, M.; Tirkkonen, J.; Solin, J.; Pauniaho, S.-L.; Huhtala, H.; Yli-Hankala, A.; Hoppu, S. The national early warning score (NEWS) could not predict secondary transportation to the tertiary hospital in Finnish prehospital care. Resuscitation 2016, 106, e69. [Google Scholar] [CrossRef]
  33. Kovacs, C. Outreach and early warning systems for the prevention of intensive care admission and death of critically ill adult patients on general hospital wards. Int. J. Nurs. Pract. 2016, 22, 523–525. [Google Scholar] [CrossRef] [Green Version]
  34. Wang, X.-J.; Zeng, G.-T.; Zhang, K.-X.; Chu, H.-B.; Chen, Z.-S. Urban real estate market early warning based on support vector machine: A case study of Beijing. Int. J. Comput. Intell. Syst. 2020, 13, 153–166. [Google Scholar] [CrossRef] [Green Version]
  35. Begusic, S.; Kostanjcar, Z.; Kovac, D.; Stanley, H.; Podobnik, B. Information feedback in temporal networks as a predictor of market crashes. Complexity 2018, 2018, 2834680. [Google Scholar] [CrossRef]
  36. Huang, F.; Feng, W. A system for early-warning and forecasting of real estate development. Autom. Constr. 2005, 14, 333–342. [Google Scholar] [CrossRef]
  37. Yang, J. Design of early warning multimedia computer system for real estate market under PROBIT model. Multimed. Tools Appl. 2019, 1–15. [Google Scholar] [CrossRef]
  38. Kholodilin, K.A.; Michelsen, C. High Risk of a Housing Bubble in Germany and Most OECD Countries. DIW Wkly. Rep. 2019, 9, 265–273. [Google Scholar]
  39. Kim, T.Y.; Oh, K.J.; Sohn, I.; Hwang, C. Usefulness of Artificial Networks for Early Warning System of Economic Crisis. Expert Syst. Appl. 2004, 6, 583–590. [Google Scholar] [CrossRef]
  40. Zheng, Y.J.; Chen, S.Y.; Xue, Y. A Pythagorean-Type Fuzzy Deep Denoising Autoencoder for Industrial Accident Early Warning. IEEE Trans. Fuzzy Syst. 2017, 25, 1561–1575. [Google Scholar] [CrossRef]
  41. Park, D.; Ryu, D. A Machine Learning-Based Early Warning System for the Housing and Stock Markets. IEEE Access. 2021, 9, 3077962. [Google Scholar] [CrossRef]
  42. Cortes, C.; Vapnik, V. Support-vector network. Mach. Learn. 1995, 20, 273–295. [Google Scholar] [CrossRef]
  43. Izadyar, N.; Ghadamian, H.; Chong, W.T.; Moghadam, Z.; Tong, C.W.; Shamshirband, S. Appraisal of the support vector machine to forecast residential heating demand for the District Heating System based on the monthly overall natural gas consumption. Energy 2015, 93, 1558–1567. [Google Scholar] [CrossRef]
  44. Suykens, J.; Vandewalle, J. Least Squares Support Vector Machine Classifiers. Neural Process. Lett. 1999, 9, 293–300. [Google Scholar] [CrossRef]
  45. Chou, J.; Ngo, N. Time series analytics using sliding window metaheuristic optimization-based machine learning system for identifying building energy consumption patterns. Appl. Energy 2016, 177, 751–770. [Google Scholar] [CrossRef]
  46. Xue, X.; Xiao, M. Deformation evaluation on surrounding rocks of underground caverns based on PSO-LSSVM. Tunn. Undergr. Space Technol. 2017, 69, 171–181. [Google Scholar] [CrossRef]
  47. Chen, Y.; Zhou, Z.; Chen, Q. The research and application of LS-SVM based on particle swarm optimization. In Proceedings of the IEEE International Conference on Automation and Logistics, Jinan, China, 18–21 August 2007; pp. 1115–1120. [Google Scholar]
  48. Wang, B.; Tang, W.; Song, L.; Bai, G. PSO-LSSVR: A surrogate modeling approach for probabilitic flutter evaluation of compressor blade. Structures 2020, 28, 1634–1645. [Google Scholar] [CrossRef]
  49. Sun, W.; Zheng, S.; Geltner, D.M.; Wang, R. The Housing Market Effects of Local Home Purchase Restrictions: Evidence from Beijing. J. Real Estate Financ. Econ. 2017, 55, 288–312. [Google Scholar] [CrossRef]
  50. Li, Y.; Zhu, D.; Zhao, J.; Zheng, X.; Zhang, L. Effect of the Housing Purchase Restriction Policy on the Real Estate Market: Evidence from a Typical Suburb of Beijing, China. Land Use Policy 2020, 94, 104528. [Google Scholar] [CrossRef]
  51. Degn Eskesen, S.; Tengborg, P.; Kampmann, J.; Veicherts, T.H. Guidelines for tunnelling risk management: International Tunnelling Association, Work Group No.2. Tunn. Undergr. Space Technol. 2004, 19, 217–237. [Google Scholar] [CrossRef]
  52. Yin, S. Research on Early Warning of Real Estate Market in Harbin. Master’s Thesis, Northeast Forestry University, Harbin, China, 2014. [Google Scholar]
  53. Yi, X. China’s Real Estate Market Overheating and Risk Early Warning. Financ. Trade Economics 2005, 5, 14–21. [Google Scholar]
  54. Qian, S. Study on Real Estate Monitoring and Early Warning Model in Beijing Based on Neural Network. Master’s Thesis, University of International Business and Economics, Beijing, China, 2009. [Google Scholar]
  55. Han, L. Research on Urban Real Estate Early Warning System in China. Ph.D. Thesis, Sichuan University, Chengdu, China, 2004. [Google Scholar]
  56. Shi, Y.; Wang, P. Research on Early-warning Index System and Integrated Warning of Real Estate. Stat. Res. 2011, 28, 16–21. [Google Scholar]
  57. Wang, J. Research on Real Estate Market Early Warning System Based on Artificial Neural Network. Master’s Thesis, Zhejiang University, Hangzhou, China, 2006. [Google Scholar]
  58. Tajani, F.; Liddo, F.; Guarini, M.; Ranieri, R.; Anelli, D. An Assessment Methodology for the Evaluation of the Impacts of the COVID-19 Pandemic on the Italian Housing Market Demand. Buildings 2022, 11, 592. [Google Scholar] [CrossRef]
  59. Yang, L. Research on Early Warning System of Real Estate Market. Master’s Thesis, Wuhan, Wuhan University, 2005. [Google Scholar]
  60. Ding, L.; Li, B. Technical Points and Process Design of Early Warning Control System in Real Estate Market. Syst. Eng. Theory Pract. 2002, 4, 58–62. [Google Scholar]
  61. Ullah, F.; Sepasgozar, S. Key Factors Influencing Purchase or Rent Decisions in Smart Real Estate Investments: A System Dynamics Approach Using Online Forum Thread Data. Sustainability 2020, 12, 4382. [Google Scholar] [CrossRef]
  62. He, F. Design and Application of Real Estate Early Warning System Based on BP Neural Network. Master’s Thesis, Huazhong Agricultural University, Wuhan, China, 2011. [Google Scholar]
  63. Su, X.; Qian, Z. State Intervention in Land Supply and Its Impact on Real Estate Investment in China: Evidence from Prefecture-Level Cities. Sustainability 2020, 12, 1019. [Google Scholar] [CrossRef] [Green Version]
  64. Statistics Bureau of the People’s Republic of China, China City Statistical Yearbook. 2021. Available online: https://www.stats.gov.cn/ (accessed on 18 March 2022).
  65. China Entrepreneur Investment Club, China Entrepreneur Investment Club (CEIC) Database. 2021. Available online: https://www.ceicdata.com/zh-hans (accessed on 18 March 2022).
  66. China Real Estate Information Corporation, China Real Estate Information Corporation (CRIC). 2021. Available online: https://cric.dichan.com/system.html (accessed on 18 March 2022).
  67. Chang, L. Historical Review and Prospect of China’s Real Estate Regulation Policy. China Econ. Rev. 2019, 6, 49–53. [Google Scholar]
Figure 1. The operation mechanism for the PSO-LSSVR model.
Buildings 12 00706 g001
Figure 2. Analytical framework for the research methods and research problems.
Buildings 12 00706 g002
Figure 3. The iterative process of the PSO model for the N15 early warning indicator.
Buildings 12 00706 g003
Figure 4. The iterative process of the PSO model for the N16 early warning indicator.
Buildings 12 00706 g004
Figure 5. The training values and actual values of the N15 indicator.
Buildings 12 00706 g005
Figure 6. The training values and actual values of the N16 indicator.
Buildings 12 00706 g006
Figure 7. The prediction results of indicator N15 for the next 10 years.
Buildings 12 00706 g007
Figure 8. The prediction results of indicator N16 for the next 10 years.
Buildings 12 00706 g008
Table 1. Urban real estate market early warning indicators.
TypesIndicatorSub-IndicatorsSerial NumberReferences
Control
variables
Relationship between the real estate market and the national economyReal estate development investment level and urban economic development levelN1[52]
Real estate investment levelN2[53]
Real estate development self-raised financing levelN3[54]
Ratio of commercial housing price growth and urban residents’ income growthN4[55]
Real estate land area purchased levelN5[56]
Relationship between supply and demandCommercial housing sales levelN6[57]
Land sales area levelN7[54]
Per capita residential area levelN8[55,58]
Commercial housing prices and urban residents’ disposable income levelN9[58,59]
Inner relationship of the real estate industryResidential investment level in commercial housing constructionN10[52]
Residential sales levelN11[54]
Residential area completion levelN12[53]
Proportion of new construction area of commercial housingN13[60,61]
Construction and completed area ratioN14[62]
Dependent variablesEarly warning indicatorsCommercial housing price growth rateN15[55,61]
Growth rate of the land area of commercial housing salesN16[56,63]
Table 2. Early warning indicators data of the Beijing real estate market from 2000 to 2020.
YearsN1N2N3N4N5N6N7N8N9N10N11N12N13N14N15N16
20000.160.40.25−0.954.0371.830.700.470.530.550.870.740.642.99−0.130.76
20010.200.510.280.231.4561.540.710.50.490.590.870.820.733.060.030.26
20020.220.550.29−0.682.4281.730.720.60.420.590.880.810.772.6−0.060.42
20030.230.560.31−0.050.671.580.730.660.380.530.880.80.812.7−0.010.11
20040.240.580.290.491.6251.680.810.720.350.530.870.780.762.450.070.30
20050.210.540.41.960.9341.840.740.750.40.510.820.750.762.130.340.13
20060.210.510.321.52−0.4031.520.820.840.430.500.750.690.752.230.22−0.07
20070.190.500.433.53−0.681.090.750.860.540.500.730.640.742.350.40−0.17
20080.160.500.490.55−2.9040.70.520.910.510.490.720.550.712.60.07−0.39
20090.180.480.441.238.3511.010.880.960.520.390.760.600.682.640.110.77
20100.190.530.612.89−1.9130.570.691.080.610.520.710.630.663.320.29−0.31
20110.180.510.58−0.39−0.820.470.641.180.510.590.660.590.673.93−0.05−0.12
20120.170.490.510.093.2750.620.811.180.460.520.740.640.653.860.010.35
20130.160.500.610.83−0.1880.550.711.30.450.500.690.630.653.550.09−0.02
20140.170.490.460.17−2.7530.370.481.310.420.500.770.590.632.940.02−0.23
20150.170.520.542.260.8110.370.591.410.470.450.710.520.653.030.200.07
20160.150.470.492.560.8480.410.701.510.520.480.610.530.583.250.210.08
20170.130.410.461.89−4.5450.230.601.610.560.460.740.410.594.980.17−0.48
20180.120.460.40.70−1.8950.180.451.640.550.480.660.530.724.460.06−0.20
20190.110.470.310.605.0940.240.701.650.530.490.810.430.744.820.050.35
20200.110.470.361.981.650.250.631.550.540.570.830.630.795.930.050.03
Mean0.170.500.421.020.720.890.681.080.490.510.770.630.703.320.100.08
SD0.040.040.111.212.940.610.110.390.070.050.080.120.071.010.140.34
CV0.210.090.271.194.100.690.160.360.140.100.110.190.090.301.334.33
Table 3. The predicted values of the influencing factors N15 and N16 for the next 10 years.
Year2021202220232024202520262027202820292030
N150.08020.06750.07810.08380.09060.09400.09700.09850.09940.0998
N160.06860.05650.07300.07060.07470.07570.07660.07700.07720.0772
Table 4. Two-factor status grading mark table.
HeaderColdNormalHot
ColdColdColdAbnormal
NormalColdNormalHot
HotAbnormalHotHot
Table 5. The warning status of the Beijing real estate market from 2000 to 2020.
YearN15N16Warning Degree
Indicator DataStandardized ValueWarning DegreeIndicator DataStandardized ValueWarning Degree
2000−0.13−1.71Cold0.762.02HotAbnormal
20010.03−0.54Normal0.260.54NormalNormal
2002−0.06−1.19Cold0.421.01NormalCold
2003−0.01−0.80Normal0.110.09NormalNormal
20040.07−0.26Normal0.300.67NormalNormal
20050.341.78Hot0.130.17NormalHot
20060.220.87Normal−0.07−0.44NormalNormal
20070.402.17Hot−0.17−0.72NormalHot
20080.07−0.20Normal−0.39−1.38ColdCold
20090.110.07Normal0.772.05HotHot
20100.291.38Hot−0.31−1.14ColdAbnormal
2011−0.05−1.14Cold−0.12−0.59NormalCold
20120.01−0.68Normal0.350.81NormalNormal
20130.09−0.09Normal−0.02−0.29NormalNormal
20140.02−0.64Normal−0.23−0.92NormalNormal
20150.200.74Normal0.07−0.04NormalNormal
20160.210.83Normal0.080.00NormalNormal
20170.170.49Normal−0.48−1.65ColdCold
20180.06−0.30Normal−0.20−0.84NormalNormal
20190.05−0.37Normal0.350.80NormalNormal
20200.05−0.39Normal0.03−0.13NormalNormal
Mean0.10--0.08---
SD0.14--0.34---
Table 6. The predicted warning status of the Beijing real estate market from 2020 to 2030.
YearN15N16Warning Degree
Indicator DataStandardized ValueWarning DegreeIndicator DataStandardized ValueWarning Degree
20210.08−0.16Normal0.07−0.03NormalNormal
20220.07−0.26Normal0.06−0.06NormalNormal
20230.08−0.18Normal0.07−0.02NormalNormal
20240.08−0.14Normal0.07−0.02NormalNormal
20250.09−0.09Normal0.07−0.01NormalNormal
20260.09−0.06Normal0.08−0.01NormalNormal
20270.10−0.04Normal0.080.00NormalNormal
20280.10−0.03Normal0.080.00NormalNormal
20290.10−0.02Normal0.080.00NormalNormal
20300.10−0.02Normal0.080.00NormalNormal
Publisher’s Note: MDPI stays neutral with regard to jurisdictional claims in published maps and institutional affiliations.

