Abstract
Prefabricated buildings that are more environmentally friendly have been vigorously promoted by the Chinese government because of the reduced waste and carbon emissions during the construction process. Most of the construction processes of prefabricated buildings are completed in the prefabricated component factory, but the safety risks during the hoisting process cannot be ignored. In this paper, the initial framework of a Bayesian Network (BN) is obtained from the combination of the improved Human Factors Analysis and Classification System Model (HFACS) and BN. The improved similarity aggregation method (SAM) is used to calculate the prior probability of BN, which can better summarize and deal with the fuzzy judgment of experts on risk accidents. The improved SAM can consider both the weight of experts and the relative consistency of their opinions, which is of great significance for improving the reliability of BN inputted data. This paper uses the construction project in Sanya, Hainan Province, to verify the validity of the model. The results show that the calculation results of the model are basically consistent with the actual situation. The safety risk of this project is relatively low, and the premise of unsafe behaviors and unsafe supervision are the key risk factors of the project. In addition to maintaining good construction conditions and workers’ healthy states, it is also necessary to carefully check the performance of tower cranes and equipment such as spreaders. During the operation process of the tower crane, workers should avoid walking or staying within the hoisting range.
1. Introduction
Prefabricated buildings have been vigorously promoted by the Chinese government because of the advantages of producing less construction waste [1] and carbon emissions [2], and faster construction [3]. In the past few years, the areas of newly built prefabricated buildings have been increasing [4], and the proportion of newly built prefabricated buildings in 2021 has reached 20.5% of the new buildings in China [5]. The “Opinions on Promoting the Green Development of Urban and Rural Construction” issued by the General Office of the Central Committee of the Communist Party of China and the General Office of the State Council pointed out [6] that it is necessary to vigorously develop prefabricated buildings and focus on promoting the construction of steel-structure prefabricated buildings, so as to continuously improve the standardization level of components and promote the formation of a complete industrial chain, thus increasing the coordinated development of intelligent construction and building industrialization. Therefore, local governments have actively responded to the call of the central government through the issues of various planning policies for the development of prefabricated buildings [7,8]. For example, Beijing clearly required steel structures to be used in new public buildings [9]. By 2022, the area of prefabricated buildings will account for more than 35% of that of the new constructions; Guangdong Province clearly pointed out that by 2025, the proportion of urban prefabricated buildings in the Pearl River Delta will account for more than 35% of the new construction area, and more than 30% of the prefecture level downtown areas in eastern and northwestern Guangdong with a permanent resident population of more than 3 million, and more than 20% in other areas. Hainan Province has higher requirements: by the end of 2025, prefabricated buildings should account for more than 80% of new constructions, and two national-level prefabricated building demonstration cities should be built. It is also vital to balance the supply and demand of the annual production capacity of prefabricated components. The introduction of these policies demonstrates that prefabricated buildings will be an important and even main construction method in China [10].
The construction process of prefabricated buildings can be roughly divided into five stages: component production [11], transportation [12], on-site storage, hoisting, splicing, and installation [13,14]. The component production is mainly carried out in the prefabricated component factory, in which the corresponding prefabricated components are produced according to the design instructions and the production standards [15]. Then, the prefabricated components will be transported to the construction site for storage. When the construction starts, the construction unit will transport the prefabricated components to the corresponding position through the tower crane. During the hoisting process, the tower crane driver and the ground workers (signalmen and riggers) must cooperate with each other to better promote construction safety because of their different sights [16]. After the prefabricated components are hoisted to the corresponding position, the tower crane driver and the installers also need to cooperate with each other. The installers set up temporary supports to completely fix the prefabricated components, then the connection between the components and the tower crane can be removed [17].
By repeating the above process, a prefabricated building can be built [18]. It is obvious to find that the main process of the prefabricated building at the construction site is to hoist the prefabricated components. A more specific description of the hoisting process of the prefabricated components is shown in Figure 1 (referring to the actual prefabricated construction project, the solid line frame is the basic process of hoisting the prefabricated components; the dotted line frame is the preparation and perfection).
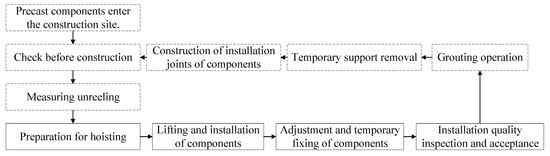
Figure 1.
Specific construction procedures for hoisting of prefabricated components.
In Figure 1, “component lifting and installation” and “component adjustment and temporary fixation” are the two links with the longest construction time and are the most likely to lead to safety accidents [19]. Before hoisting the prefabricated components, the positioning traction ropes should be fastened onto the components to ensure safety and firmness; the special spreader shall be installed and hung on the hook of the tower crane and connected with the hanging point on the component. The workers should check whether it is firm. After the prefabricated components are hoisted and before installation, the sling should be kept balanced, and the components should be lowered when it is safe. When lowering the prefabricated components, the installers should use the traction rope to control the position and direction to make the whole process smooth and slow. After the installation is completed, the position without force or unbalanced force shall be adjusted in time [20]. In summary, the hoisting construction of prefabricated buildings is very complex. It is necessary to analyze the construction risks in hoisting construction to avoid safety accidents.
The rest of this paper is structured as follows: Section 2 is the relevant literature. Section 3 introduces the methodology and establishes a model for the problem of this paper. Section 4 validates the model with real cases and conducts sensitivity analysis. Section 5 discusses the model and puts forward relevant management suggestions. Section 6 summarizes the full text and gives an outlook for future research.
2. Literature Review
2.1. Safety Risk Analysis of Construction Project
Construction safety risk analysis has always been the focus of academic research. The analysis can be divided into two aspects: the overall construction risks analysis and the risk analysis in the specific construction process.
From the overall construction risks, many scholars are keen to study the construction risks of subway projects. Zhou [21] established an intelligent model based on random forest for the risk prediction of subway construction. The prediction model can be used as the basis for the implementation of subway foundation pit safety risk prediction, helping to implement emergency measures in advance. Based on the BP neural network, Li [22] has carried out intelligent identification of the safety risks of subway construction from the aspects of human factors and managements, which can ensure that the construction unit finds the risks and takes measures in time. In order to determine the success factors of construction safety management, Liu [23] established an interpretative structural model (ISM) through a literature review and questionnaire to find out the relationship between different factors, which is helpful to improve the safety performance in the process of subway construction and reduce the safety accidents. Many scholars have also conducted research on prefabricated buildings. Through the analytic hierarchy process (AHP) and entropy weight method, Liu [24] proposed an evaluation method of prefabricated buildings’ construction safety based on a cloud model, which provides a new perspective to objectively evaluate the safety of prefabricated projects. Based on an ISM and the analytical network process (ANP), Xu [25] evaluated the safety factors of prefabricated building construction, which is of great significance to reduce the safety risks in prefabricated building construction.
From the perspective of specific construction risks, many scholars believe that the hoisting is the most risky. Liu [26] thought that some of the existing pieces of research do not consider the interaction of risk factors in the hoisting stage, so he proposed a security risk analysis method that integrates the Internet of Things, a building information model, the Apriori algorithm, and a complex network, in order to achieve effective security management and decision-making. Lu [27] established a comprehensive prefabricated construction site layout model, which integrated the hoisting efficiency, construction risks, and transportation costs of the prefabricated components, and obtained the Pareto optimal solution by a genetic algorithm. This model helps to solve the site layout problem of prefabricated building construction.
In summary, the hoisting construction is the key point in the safety management of prefabricated buildings. This paper will further analyze the relationship between the safety risks of prefabricated building hoisting construction and propose new management suggestions.
2.2. HFACS Model
The traditional theory of accident causes is mostly analyzed separately from the four aspects of human, object, management, and environment, without considering the internal relationship between the factors [28]. The HFACS frame takes into account the transitive impact of organizational factors on unsafe behaviors at the individual level, which is more comprehensive and scientific than the independent analysis. The HFACS model was first proposed by scholars such as SHAPPELL in 2000 [29], and it is still used by researchers in various academic fields. The specific analysis of the model includes four levels: unsafe behavior, the premise of unsafe behavior, unsafe supervision, and organizational impact. As shown in Figure 2.
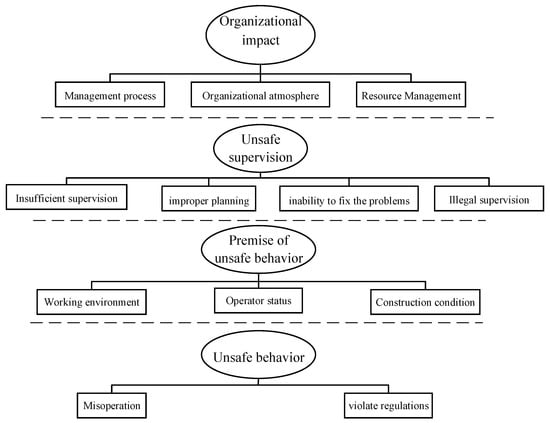
Figure 2.
HFACS frame.
Since 2000, many scholars have promoted and applied the HFACS model. For example, Reinach and Viale [30] firstly modified the HFACS frame by adding external factors and established the HFACS-RR frame suitable for railway accidents. Chauvin [31] constructed a HFACS-Cloo frame for marine collision accidents and proved its rationality by analyzing 27 typical marine collision accidents. Spiess [32] applied the HFACS frame to the analysis of medical malpractice by adding health education and proved that it can improve the health condition of patients. Patterson and Shappell [33] introduced the HFACS frame into the safety analysis of the coal mining industry and verified the applicability and rationality of the frame with 508 typical accidents in the coal mining industry. In conclusion, the HFACS frame has strong extensibility and practicability. The extension and application of HFACS to the safety risk analysis of prefabricated building hoisting construction will contribute to different conclusions from the previous research. The specific extended application in this paper is detailed in Chapter 3 Methodology and Chapter 4 Case Analysis.
2.3. Fuzzy Bayesian Network
The HFACS frame can determine the specific risk factors of safety accidents and their interrelationships, but it cannot confirm the weight and control focus of each risk factor in detail [34]. Therefore, in order to further sort out and determine the impact of risk factors, the author mapped the HFACS frame to a BN. Liu [35] constructed the HFACS-CM frame of coal mine accidents and analyzed it combined with structural equation model (SEM), thus obtaining the main risk factors that will lead to safety accidents for miners. Xia [36] constructed the HFACS-BN model to actively predict the safety performance of construction projects and provide some suggestions for the safety risk management. Rostamabadi [37] proposed an accident analysis model that combines BN and the fuzzy best worst method (fuzzy BWM) into the HFACS frame. This method can effectively analyze and predict the safety risks in accidents. Based on the literature analysis and the characteristics of high-altitude crashes during construction, Luo [38] established the HFACS-BN model and put forward management opinions on high-altitude crash events. When constructing a BN and analyzing the risk probability, the prior probability of the accident must be determined by integrating the opinions of experts. There are many methods of integrating experts’ opinions, such as the arithmetic mean method of reserve calculation [39], the Delphi method [40], the similarity aggregation method (SAM) [41], and the fuzzy analytic hierarchy process (FAHP) [42]. Among them, the arithmetic mean method of reserve calculation is just a simple arithmetic average of experts’ opinions; the Delphi method considers the maximum uncertainty of experts; and FAHP is an extension of traditional AHP, which uses fuzzy language to deal with the experience and knowledge of each expert, so as to obtain the objective weight; while SAM can comprehensively consider the weight of each expert and the consistency between different experts.
The above-mentioned experts’ opinions and methods have their own characteristics and scopes of application, and most of them pay attention to the evaluation value of high-weight experts, while ignoring the opinions of low-weight experts. If the opinions of most low-weight experts are similar, the results will be biased, because authoritative experts may also make inaccurate judgments. Among the above methods, only SAM considers both the expert weight and consistency. However, the traditional SAM method ignores the influence of expert weight on consistency; therefore, this paper improves the traditional SAM by integrating the influence of expert weight on consistency. The improved SAM method can make the aggregation results more scientific. Using this method to calculate the prior probability of a BN can reduce the uncertainty and identify the probabilities of key accidents more reliably.
3. Methodology
3.1. HFACS Frame for Hoisting Construction of Prefabricated Building Components
The traditional HFACS frame is mostly used in the aviation industry [43]. Compared with the hoisting construction of prefabricated components studied in this paper, the working conditions, workers, management, and many other factors are different, which brings different transmission process of risks. Therefore, it is not suitable to directly apply the HFACS frame for the aviation industry to the hoisting construction of prefabricated components. This paper extracts the process and causes of the accidents from the investigation report and cases of safety accidents in hoisting construction of prefabricated components in recent years [44] and modifies the original HFACS frame to adapt to the environmental characteristics of prefabricated component hoisting construction accidents. The revised HFACS frame is shown in Figure 3. With reference to literature [44,45] and specific hoisting construction accidents of prefabricated buildings, and combined with the construction characteristics of prefabricated buildings, the specific causative factors are obtained and shown in Table 1.
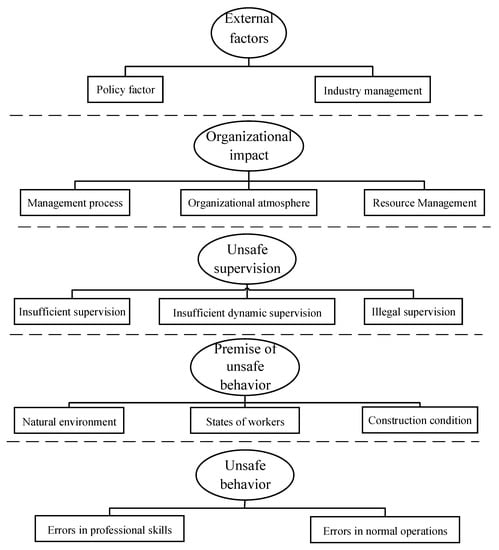
Figure 3.
Prefabricated building hoisting construction HFACS frame.

Table 1.
Causation factors of prefabricated building hoisting construction accidents based on improved HFACS frame.
Considering the current situation of China’s construction industry and the characteristics of prefabricated building construction, the following improvements are made on the basis of the original HFACS frame [46,47]:
- (1)
- External environment factor that includes policy factors and industry management is added. Policy factors include two aspects: imperfect technical safety standards for hoisting constructions and imperfect management methods of special operation workers. If the government cannot issue perfect management methods, it is not conducive to standardizing the behaviors of the construction unit and construction safety.
- (2)
- In terms of unsafe supervision, improper planning, and inability to fix the problems are combined into insufficient supervision. Improper planning corresponds to the behavior before supervision, and unable to fix the problems corresponds to the behaviors after the accidents, both of which can be summarized in insufficient supervision. Insufficient dynamic supervision is added. Tower crane construction needs to consider the cooperation between workers in construction space and on the ground. The tower crane hook visualization system and safety monitoring system for collision avoidance of tower crane can effectively reduce the probability of mishook and collision accidents.
- (3)
- In terms of the premise of unsafe behavior, the operators’ states and personnel factors are merged into the states of workers. As mentioned above, tower crane construction workers mainly include tower crane drivers and ground workers whose situation should be taken into account. The factor of construction conditions is added. The natural environment is uncontrollable, and the construction conditions are artificially determined, including unreasonable stacking of prefabricated components on the ground and the height of tower crane.
- (4)
- Unsafe behaviors are divided into two major aspects: professional skill errors such as invalid communication between tower crane drivers and ground workers, and errors in normal operations such as multitasking.
3.2. Bayesian Networks (BN)
According to the above-established HFACS frame for hoisting construction of prefabricated buildings, the identified factors are converted into nodes in the BN, and the HFACS frame is mapped to the BN structure, as shown in Figure 4. H is the leaf node of BN, that is, the node where the accident happens.
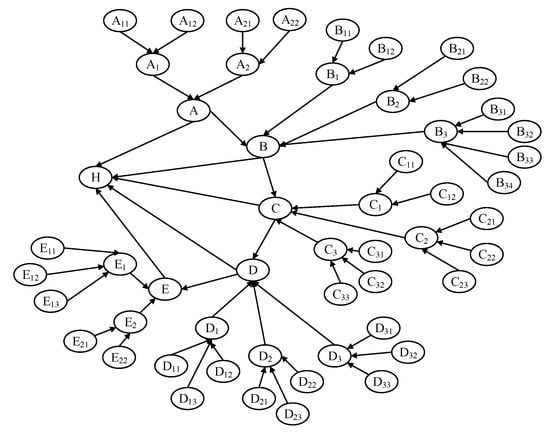
Figure 4.
BN structure of prefabricated building hoisting construction.
Considering that the occurrence of variables requires certain conditions, the joint probability distribution [48] of the variable in the BN can be expressed as:
In the above formula, is the superset of . When , the probability of will be defined as:
BN uses the observation result (defined as E) before the update of Bayesian theorem, that is, the prior probability of variables to produce a posterior probability [49]. As shown in formula (3):
The above prior probabilities are often obtained through expert interviews or questionnaires [42]. As described in the literature review, most scholars have adopted various methods to deal with experts’ estimates, and different methods have different advantages and scope of application. Considering that experts will give different, or even opposite results, the reliability of the research may be greatly reduced. In order to consider the weight importance of experts and the relative consistency of the opinions, this paper intends to consider the use of an improved SAM method to aggregate experts’ judgments, thus getting more reliable results.
3.3. Improved SAM
The method of aggregating experts’ opinions adopted by previous scholars is to make the weight of experts the only indicator to show the reliability of the estimated values [50], that is, the opinions of experts with high weight tend to be more influential than those of low-weight experts. SAM can not only consider the relative importance of experts, but also the relative consistency of their opinions. However, the original SAM integrates these two factors only through simple linear addition. Therefore, the main goal of this chapter is to improve the original SAM and take the weight of experts and the consistency of their opinions into consideration (see details in formula (5)). In addition, it is unreasonable to judge experts’ weights only by the educational background or professional title. This paper comprehensively considers the experts’ professional title, work experience, educational background, and age [41,51]. The specific parameters and scores are shown in Table 2.
Table 2.
Experts’ weight and corresponding scores.
If there is a 45-year-old expert with the title of associate professor with a Ph.D. and 20 years of work experience, his score is . After synthesizing all the scores, his expert weight is the result of dividing his weight score by the scores of all experts. The specific steps of obtaining the prior probability by the improved SAM method are as follows:
Firstly, calculate the similarity of opinions between each pair of experts. and represent the judgments of expert a and b on fuzzy events. The specific weight values of expert a and b are, respectively, defined as , . The calculation formula of [49] is:
The similarity of the two experts’ opinions can be judged by calculating the differences between the professional titles, work experience, educational background, and age.
Secondly, calculate the weighted agreement degree of expert a. The weights of expert a and b are defined as and . The calculation formula to define the weighted agreement of expert a is:
Then, calculate the degree of relative consistency () of the experts [52], defined as:
Then, calculate the Consensus Coefficient (CC) of each expert [52], defined as:
in the above formula is the relaxation coefficient, which is the key factor to balance the importance of and , so this needs to be decided by the decision makers.
Finally, the opinions of experts can be aggregated, and the final fuzzy number can be obtained, which is defined as:
In order to turn the fuzzy number into a fuzzy possibility score (FPS), this paper adopts the CoA fuzzification technology. is a standard trapezoidal number, and its member function is defined as:
Defuzzification of trapezoidal fuzzy numbers is as follows:
In order to convert into the corresponding fuzzy failure probability (), this paper adopts the commonly used Onisawa function [53]. The conversion of fuzzy into is as follows:
This paper defuzzifies the obtained fuzzy possibility to obtain , and then converts it into , so that a quantified probability value, that is, a prior probability value, can be obtained. Through the calculation of the formulas (4)–(11), the prior probability of the BN can be obtained, and by inputting the prior probability into the BN, the posterior probability, that is, the possibility of an accident, can be obtained. Validation studies with real cases will be analyzed in the next chapter.
4. Case Analysis
4.1. Project Overview and Data Sources
The Hongye Haitang Residential Community Project is located in the east of Sanya City, Hainan Province, China, with a total construction area of 36,911.4 m2 and a prefabricated construction area of 21,438.92 m2, including 11 six-story residential buildings and one commercial supporting building. The prefabricated components are prefabricated stairs, prefabricated laminated floor slabs, and prefabricated lightweight interior partition walls. The building height is 19.6m. The BN structure in this paper is shown in Figure 4. In order to figure out the prior probability of each accident during the construction, it is necessary to investigate with experts to determine the probability of the accidents. This paper selects an expert engaged in the construction of prefabricated buildings, an expert engaged in the research of tower crane construction in universities, and one safety manager on the construction site to collect their evaluation indicators of the project by means of telephone interview and questionnaire. The data are collected in the form of fuzzy numbers [51]. The specific fuzzy language terms are shown in Table 3. Taking “Very low” as an example, the fuzzy number is (0, 0, 0.1, 0.2), which corresponds to the judgment of expert a in formula (4). If expert a believes that the probability of the accident leading to the final result is very low, and then .
Table 3.
Fuzzy number set.
The detailed data of the three experts involved in this study are shown in Table 4. Taking Expert One as an example, referring to the standard in Table 2, its weight score calculation formula is . After the scores of all experts are obtained, the weight ratio of experts can be calculated by dividing the scores of individual experts by the sum of the total scores of experts.
Table 4.
Experts’ information and weight.
After calculating the weight ratio of each expert and collecting the judgment of each expert on the node accident, the prior probability of each node accident can be calculated through the above formulas (4)–(11). Showing the process of calculating all 34 nodes in this study will lead to a cumbersome paper, so the researcher selected node “without using the tower crane hook visualization system” for the example calculation. The judgments of the three experts on node are (high, low, and lower). The detailed calculation process is shown in Table 5.
Table 5.
The detailed calculation process of the prior probability of node .
The calculation of other nodes is similar to the calculation process in Table 5, so it is not repeated. Through the above process, the prior probability of other nodes can be calculated. The prior probabilities of all nodes are shown in Table 6.
Table 6.
Prior probability and ranking of all nodes.
Summarize the opinions of experts and calculate the prior probability of each node. The posterior probability can be obtained by further analysis by establishing a hoisting construction safety evaluation model.
4.2. Construction of Safety Evaluation Model for Hoisting Construction
According to the BN constructed in Section 3.2, the BN structure of the safety risk of the prefabricated building hoisting construction was established in the graphical view interface of GeNIe2.3. The forward and reverse reasoning are performed on the BN. Through forward reasoning, the prior probability of intermediate nodes and accident nodes can be obtained, that is, the probability of accidents during the hoisting process of prefabricated components. Through reverse reasoning, the posterior probability of the initial node can be obtained, and the key risk factors can be identified. Input the prior probability of each node obtained in Section 4.1 and calculate the data by GeNIe2.3. The result is shown in Figure 5.
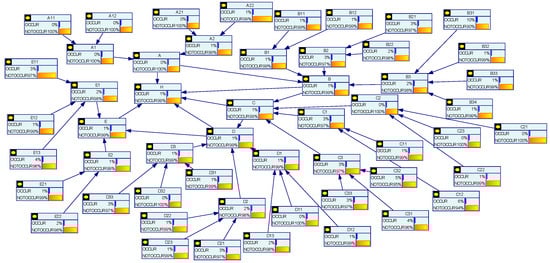
Figure 5.
BN forward reasoning of safety accidents in hoisting construction of prefabricated components.
The results show that the probability of safety accidents in the hoisting construction of prefabricated components of the project is 1%, which is consistent with the operation of the project. No safety accidents occurred during the hoisting of the prefabricated components of the project, mainly because the buildings are not very high, and the construction is not difficult. In order to analyze the key points of control in the hoisting construction of prefabricated components, the author assumed that a safety accident has occurred (i.e., the probability of the occurrence of accident node H is 100%) and obtained the posterior probability of each risk factor through GeNIe2.3. The results are shown in Figure 6.
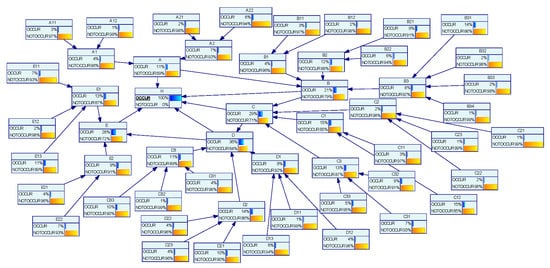
Figure 6.
BN reverse reasoning of safety accidents in hoisting construction of prefabricated components.
It can be seen from the above that the posterior probabilities of A, B, C, D, and E are 0.11, 0.21, 0.29, 0.36, and 0.28, respectively, indicating that if a safety accident occurs in the hoisting construction of prefabricated components, the unsafe supervision, the premise of unsafe behaviors, and unsafe behaviors are most likely to have something wrong. This may because that the operation of the tower crane driver and the ground workers and their cooperation as well as the supervision are the necessary prerequisites for the safe construction of the tower crane. Further diagnosis and reasoning are carried out on the three factors to obtain the possible factors that need to be checked after the factors with a high posterior probability have problems. Let the occurrence probability of node C unsafe supervision, node D the premise of unsafe behavior, and node E unsafe behavior be 100%, respectively, and input them into the model. The risk probability of the factors affecting the root nodes of nodes C, D, and E is obtained as shown in Table 7, Table 8 and Table 9.
Table 7.
Posterior probability of reasoning on node C.
Table 8.
Posterior probability of reasoning on node D.
Table 9.
Posterior probability of reasoning on node E.
4.3. Sensitivity Analysis
In order to measure the importance of the root nodes in the BN structure, this paper calculates the sensitivity of the root node to the leaf nodes through the Ratio of Variation (RoV) of failure probability. The detailed calculation formula is as follows:
Among them, and are the posterior probability and prior probability of the root nodes. The larger the value of the , the stronger the probability dependence of the leaf node on the root node. The author sets node H as the target node and calculates the sensitivity of each safety risk factor by formula (12). The results are shown in Table 10, Table 11, Table 12 and Table 13.
Table 10.
Risk factor sensitivity and ranking of each node (third-level indicators).
Table 11.
Risk factor sensitivity and ranking of each node (second-level indicators).
Table 12.
Risk factor sensitivity and ranking of each node (first-level indicators).
Table 13.
Ranking of the sensitivity of each indicator at the three levels.
It can be seen from Table 10 that the key safety risk factors of prefabricated building hoisting construction mainly include: Multitasking of tower crane drivers and ground workers, Height of tower cranes, Safety defects of imported the tower cranes, spreaders, slings, hoisting baskets, and claps, Incomplete safety inspection of tower cranes by maintainers and drivers, In-site workers move or stay within the hoisting range, and No temporary supports.
This shows that the hoisting construction of prefabricated buildings should focus on the management of the tower crane drivers and ground workers on the construction site and improve their safety awareness. The imported tower cranes and the tools should be carefully checked, and perfect equipment management measures should be established. The training and assessment of construction workers are also of great importance, especially the training about technologies related to temporary support and the installation of prefabricated components. It can be seen from Table 12 that from a macro perspective, the risk factors affecting the hoisting and construction of prefabricated buildings are the unsafe supervision, organizational influence, unsafe behavior, external factors, and premise of unsafe behavior, which are consistent with the prior probability calculation. The same results indicate that the prefabricated building hoisting construction should pay attention to the premise of unsafe behavior at the macro level and improve the safety supervision system.
5. Discussion
5.1. Model Analysis
The prior probabilities of BN in this paper are calculated by the improved SAM. There is a relaxation coefficient in the improved SAM, which is a key factor to balance the importance of and . In this paper, but the actual value is not necessarily 0.5. Take node “without using the tower crane hook visualization system” an example calculation. Make be 0.2, 0.5, and 0.8, and calculate the prior probability of node again.
- (1)
- Make , where the calculation of are not affected.
- (2)
- Make
- (3)
- Make
It can be seen from the above that , that is, if the value of is increased, the value of will be more inclined to the judgment of high-weight experts. While reducing the value of and increasing , the value of will be more inclined to the result chosen by the majority of experts. Therefore, when decision makers use the above formulas to calculate the prior probabilities of BN, they should first clarify their risk preferences, whether they are willing to trust experts with a larger weight proportion and are more reliable, or to trust the choices of the majority.
5.2. Key Findings and Management Suggestions
In Section 4.3, the author conducts a sensitivity analysis on the different indicators of the three levels. The top five most sensitive indicators at each level are summarized in Table 13.
Based on the IHFACS frame, this paper establishes a safety risk evaluation indicator system for the hoisting construction of prefabricated buildings. The system includes 5 first-level indicators such as the premise of unsafe behaviors, 13 second-level indicators such as policy factors, industry management, and the natural environment, and 34 third-level indicators such as the multitasking of tower crane drivers and ground workers and tower cranes’ height. By analyzing the sensitivity results of various security risk factors shown in Table 13, the author can obtain the following key findings and put forward some management suggestions:
From a macro perspective, the premise of unsafe behavior and unsafe supervision are the most critical factors, which are largely determined by the contractor. According to the IHFACS frame, the premise of unsafe behaviors will be affected by unsafe supervision, therefore the contractor should strengthen daily supervision and management to avoid illegal supervision and introduce dynamic supervision methods for hoisting construction. In addition, The Contractor shall fully consider the natural environment of the construction site to avoid the impact on the construction process, provide good construction conditions for the workers, pay attention to the health of the workers, and establish a safety technical support system. In addition, strengthen the management of tower cranes, drivers, and ground workers, avoid the situation of relevant personnel working without certificates, and prevent the tower crane from continuing to work in the presence of potential safety hazards.
At the medium level, in addition to paying attention to the natural environment, maintaining good construction conditions, and the state of workers, policy factors and industry management factors should also be considered. However, policy factors and industry managements are not determined by contractors. Incomplete policies and regulations and unreasonable industry management often make contractors put their own interests first without considering the potential safety risks of construction. The contractors often take actions that are not conducive to construction safety in order to catch up with the construction period and seek more benefits. Therefore, it is necessary for the government to strengthen the management of the industry and formulate relevant policies to ensure construction safety.
At the micro level, the key safety risk factors are the Multitasking of tower crane drivers and ground workers, the Height of tower crane, the Safety defects of introduced tower cranes, spreaders, slings, hoisting baskets, and claps, and so on. Contractors should attach importance to the management and safety education of the tower crane drivers and ground workers, and implement the safety responsibility distribution system step by step. A good safety awareness of the tower crane drivers and ground workers should be cultivated so that they can concentrate on the construction. During the contractors’ daily supervision, the performance of the tower cranes’ spreaders, slings, hanging baskets, and hooks should be carefully checked. The contractor should establish a daily maintenance and inspection system for tower cranes, which not only urges maintainers and tower crane drivers to conduct daily inspections and maintenance of tower cranes, but also needs to check maintenance records to avoid staffs’ perfunctory effort. During the construction of the tower crane, workers should avoid walking or staying within the hoisting range.
6. Conclusions
Compared with the previous research on construction risk analysis, this paper adopts an improved HFACS model and considers the influence of external factors to integrate the factors of the original HFACS model, which makes the model more suitable for the research in this paper. In this paper, an improved SAM is proposed to calculate the prior probability in BN, and the improved SAM and BN are combined to evaluate the construction risks of prefabricated building hoisting. The improved SAM can better summarize the fuzzy opinions and truly reflect the judgments of the experts. Through the relaxation coefficient , it can effectively balance the relationship between the experts’ weight and consistency. The larger is, the more it favors the opinions of high-weight experts, and the smaller is, the more it favors the opinions chosen by the majority of experts. Compared with the previous SAM, the improved one reduces the weight of high-weight experts’ opinions and increases the weight of the opinions selected by more experts, which can effectively avoid the judgment errors of high-weight experts.
For the cases selected in this paper, the overall safety risk probability level of the project is obtained through the forward reasoning of the BN. Through reverse reasoning, the key risk factors of the project were identified. The evaluation results of the Hongye Haitang Residential Community Project are basically consistent with the actual situation on the construction site, which proves the validity of the model. Since the buildings of the project selected in this paper are not very high and the construction is not difficult, it may be considered to use a project with more construction difficulty for case analysis in the future.
Through the analysis of this paper, the most sensitive factors are determined from the macro, medium, and micro levels. Macro level: Premise of unsafe behavior, Unsafe supervision, Organizational impact, Unsafe behavior, and External factor; Medium level: Policy factors, Industry management, Natural environment, Construction conditions, and State of workers; Micro level: Multitasking of tower crane drivers and ground workers, Height of tower crane, Safety defects of the tower cranes, spreaders, slings, hoisting baskets, and claps, Incomplete safety inspection of tower cranes by maintainers and drivers, and In-site workers move or stay within the hoisting range. By strengthening the management of the above-mentioned factors, it is possible to effectively avoid safety accidents during the hoisting construction of prefabricated buildings, which is beneficial for contractors to achieve optimal resources allocation with limited resources and carry out risk managements.
This study also has some limitations. Although the model constructed in this paper can summarize and deal with the fuzzy judgments of experts on risk accidents well, the subjectivity of experts’ judgments still has an impact on the results. Subjective judgments combined with objective construction data can obtain more accurate results. In addition, for the purpose of acquiring more complete conclusion, it is necessary to consider more factors that affect prefabricated building hoisting construction accidents.
Author Contributions
Conceptualization, J.W.; Data curation, X.H. and C.Y.; Formal analysis, Y.S.; Funding acquisition, J.W. and C.Y.; Investigation, Y.S. and C.Y.; Methodology, Y.S. and F.G.; Software, F.G.; Supervision, J.W.; Validation, X.H. and F.G.; Visualization, Y.S.; Writing—original draft, F.G.; Writing— review and editing, Y.S. and Y.L. All authors have read and agreed to the published version of the manuscript.
Funding
This study was supported by the National Key R&D projects (grant number 2018YFC0704301); Science and Technology Project of Wuhan Urban and Rural Construction Bureau, China (201943); Research on theory and application of prefabricated building construction management (20201h0439); Wuhan Mo Dou Construction Consulting Co., Ltd. (20201h0414); and Preliminary Study on the Preparation of the 14th Five-Year Plan for Housing and Urban–Rural Development in Hubei Province (20202s0002).
Institutional Review Board Statement
Not applicable.
Informed Consent Statement
Informed consent was obtained from all subjects involved in the study.
Data Availability Statement
The case analysis data used to support the findings of this study are available from the corresponding author upon request.
Conflicts of Interest
The authors declare no conflict of interest. The funders had no role in the design of the study; in the collection, analyses, or interpretation of data; in the writing of the manuscript, or in the decision to publish the result.
References
- Minunno, R.; O’Grady, T.; Morrison, G.M.; Gruner, R.L.; Colling, M. Strategies for Applying the Circular Economy to Prefabricated Buildings. Buildings 2018, 8, 125. [Google Scholar] [CrossRef] [Green Version]
- Li, X.J.; Wang, C.; Alashwal, A.; Bora, S. Game analysis on prefabricated building evolution based on dynamic revenue risks in China. J. Clean. Prod. 2020, 267, 121730. [Google Scholar] [CrossRef]
- Tavares, V.; Soares, N.; Raposo, N.; Marques, P.; Freire, F. Prefabricated versus conventional construction: Comparing life-cycle impacts of alternative structural materials. J. Build Eng. 2021, 41, 102705. [Google Scholar] [CrossRef]
- Liu, S.; Li, Z.F.; Teng, Y.; Dai, L.R. A dynamic simulation study on the sustainability of prefabricated buildings. Sustain. Cities Soc. 2022, 77, 103551. [Google Scholar] [CrossRef]
- Zhao, W.S.; Chen, Y.T. Study on Large-Scale Promotion of Prefabricated Buildings in Anhui Province Based on SEM and IoT. Sci. Program.-Neth. 2022, 2022, 6947365. [Google Scholar] [CrossRef]
- General Office of the Central Committee of the Communist Party of China, General Office of the State Council. Opinions on Promoting the Green Development of Urban and Rural Construction. 2021. Available online: https://www.gov.cn/ (accessed on 21 October 2021).
- Wang, Y.N.; Xue, X.L.; Yu, T.; Wang, Y.W. Mapping the dynamics of China’s prefabricated building policies from 1956 to 2019: A bibliometric analysis. Build. Res. Inf. 2021, 49, 216–233. [Google Scholar] [CrossRef]
- Du, H.; Han, Q.; Sun, J.; Wang, C.C. Adoptions of prefabrication in residential sector in China: Agent-based policy option exploration. Eng. Constr. Archit. Manag. 2022. ahead-of-print. [Google Scholar] [CrossRef]
- Beijing Municipal People’s Government. Further Development of the Implementation of Assembled Buildings. 2022. Available online: https://www.beijing.gov.cn/ (accessed on 25 April 2022).
- Du, Q.; Hao, T.T.; Huang, Y.D.; Yan, Y.Q. Prefabrication decisions of the construction supply chain under government subsidies. Environ. Sci. Pollut. Res. 2022. ahead-of-print. [Google Scholar] [CrossRef]
- Yazdani, M.; Kabirifar, K.; Fathollahi-Fard, A.M.; Mojtahedi, M. Production scheduling of off-site prefabricated construction components considering sequence dependent due dates. Environ. Sci. Pollut. Res. 2021, 1–17. [Google Scholar] [CrossRef]
- Zhang, H.; Yu, L. Dynamic transportation planning for prefabricated component supply chain. Eng. Constr. Archit. Manag. 2020, 27, 2553–2576. [Google Scholar] [CrossRef]
- Han, Q.Y.; Chang, J.J.; Liu, G.W.; Zhang, H. The Carbon Emission Assessment of a Building with Different Prefabrication Rates in the Construction Stage. Int. J. Environ. Res. Public Health 2022, 19, 2366. [Google Scholar] [CrossRef] [PubMed]
- Xiao, M.F.; Zhou, X.H.; Pan, X.X.; Wang, Y.A.; Wang, J.; Li, X.L.; Sun, Y.; Wang, Y. Simulation of emergency evacuation from construction site of prefabricated buildings. Sci. Rep. 2022, 12, 2732. [Google Scholar] [CrossRef]
- Zhang, J.S.; Xiang, P.C.; Zhong, J.; Zhang, J.; Wu, Z.Z.; Antwi-Afari, M.F. Exploring Key Factors for Contractors in Opening Prefabrication Factories: A Chinese Case Study. Front. Public Health 2022, 10, 837350. [Google Scholar] [CrossRef] [PubMed]
- Liu, Z.S.; Li, A.X.; Sun, Z.; Shi, G.L.; Meng, X.T. Digital Twin-Based Risk Control during Prefabricated Building Hoisting Operations. Sensors 2022, 22, 2522. [Google Scholar] [CrossRef] [PubMed]
- Zhao, Y.H.; Cao, C.F.; Liu, Z.S. A Framework for Prefabricated Component Hoisting Management Systems Based on Digital Twin Technology. Buildings 2022, 12, 276. [Google Scholar] [CrossRef]
- Zhao, W.S.; Zhang, B.B.; Yang, Y. Empirical study of comprehensive benefits for prefabricated buildings: A case study of Hefei city. Int. J. Electr. Eng. Educ. 2020, 0020720920928465. [Google Scholar]
- Zhang, Y.; Yi, X.; Li, S.; Qiu, H. Evolutionary game of government safety supervision for prefabricated building construction using system dynamics. Eng. Constr. Archit. Manag. 2022. ahead-of-print. [Google Scholar] [CrossRef]
- Fard, M.M.; Terouhid, S.A.; Kibert, C.J.; Hakim, H. Safety concerns related to modular/prefabricated building construction. Int. J. Inj. Control. Saf. Promot. 2017, 24, 10–23. [Google Scholar] [CrossRef]
- Zhou, Y.; Li, S.Q.; Zhou, C.; Luo, H.B. Intelligent Approach Based on Random Forest for Safety Risk Prediction of Deep Foundation Pit in Subway Stations. J. Comput. Civ. Eng. 2019, 33, 05018004. [Google Scholar] [CrossRef]
- Li, M.C.; Wang, J.C. Intelligent Recognition of Safety Risk in Metro Engineering Construction Based on BP Neural Network. Math. Probl. Eng. 2021, 2021, 1–10. [Google Scholar] [CrossRef]
- Liu, P.; Li, Q.M.; Bian, J.; Song, L.L.; Xiahou, X.E. Using Interpretative Structural Modeling to Identify Critical Success Factors for Safety Management in Subway Construction: A China Study. Int. J. Environ. Res. Public Health 2018, 15, 1359. [Google Scholar] [CrossRef] [PubMed] [Green Version]
- Liu, J.K.; Gong, E.Q.; Wang, D.; Teng, Y. Cloud Model-Based Safety Performance Evaluation of Prefabricated Building Project in China. Wirel. Pers. Commun. 2018, 102, 3021–3039. [Google Scholar] [CrossRef]
- Xu, G.M. The Construction Site Management of Concrete Prefabricated Buildings by ISM-ANP Network Structure Model and BIM under Big Data Text Mining. Int. J. Interact. Multimed. Artif. Intell. 2020, 6, 138–145. [Google Scholar] [CrossRef]
- Liu, Z.S.; Meng, X.T.; Xing, Z.Z.; Jiang, A.T. Digital Twin-Based Safety Risk Coupling of Prefabricated Building Hoisting. Sensors 2021, 21, 3583. [Google Scholar] [CrossRef]
- Lu, Y.; Zhu, Y.Q. Integrating Hoisting Efficiency into Construction Site Layout Plan Model for Prefabricated Construction. J. Constr. Eng. Manag. 2021, 147, 04021130. [Google Scholar] [CrossRef]
- Cheng, L.H.; Jiang, B.L.; Guo, H.M. Modeling the causes of accidental gas explosions from the perspective of safety information loss. Process Saf. Prog. 2022. ahead-of-print. [Google Scholar] [CrossRef]
- Diller, T.; Helmrich, G.; Dunning, S.; Cox, S.; Buchanan, A.; Shappell, S. The Human Factors Analysis Classification System (HFACS) Applied to Health Care. Am. J. Med. Qual. 2014, 29, 181–190. [Google Scholar] [CrossRef]
- Reinach, S.; Viale, A. Application of a human error framework to conduct train accident/incident investigations. Accid. Anal. Prev. 2006, 38, 396–406. [Google Scholar] [CrossRef]
- Chauvin, C.; Lardjane, S.; Morel, G.; Clostermann, J.P.; Langard, B. Human and organizational factors in maritime accidents: Analysis of collisions at sea using the HFACS. Accid. Anal. Prev. 2013, 59, 26–37. [Google Scholar] [CrossRef]
- Spiess, B.D.; Rotruck, J.; McCarthy, H.; Suarez-Wincosci, O.; Kasirajan, V.; Wahr, J.; Shappell, S. Human factors analysis of a near-miss event:oxygen supply failure during cardiopulmonary bypass. J. Cardiothorac. Vasc. Anesth. 2015, 29, 204–209. [Google Scholar] [CrossRef]
- Patterson, J.M.; Shappell, S.A. Operator error and system deficiencies: Analysis of 508 mining incidents and accidents from Queensland, Australia using HFACS. Accid. Anal. Prev. 2010, 42, 1379–1385. [Google Scholar] [CrossRef] [PubMed]
- Yang, J.; Kwon, Y. Human factor analysis and classification system for the oil, gas, and process industry. Process Saf. Prog. 2022. ahead-of-print. [Google Scholar] [CrossRef]
- Liu, R.L.; Cheng, W.M.; Yu, Y.B.; Xu, Q.F.; Jiang, A.W.; Lv, T. An impacting factors analysis of miners’ unsafe acts based on HFACS-CM and SEM. Process Saf. Environ. 2019, 122, 221–231. [Google Scholar] [CrossRef]
- Xia, N.N.; Zou, P.X.W.; Liu, X.; Wang, X.Q.; Zhu, R.H. A hybrid BN-HFACS model for predicting safety performance in construction projects. Saf. Sci. 2018, 101, 332–343. [Google Scholar] [CrossRef]
- Rostamabadi, A.; Jahangiri, M.; Zarei, E.; Kamalinia, M.; Banaee, S.; Samaei, M.R. A Novel Fuzzy Bayesian Network-HFACS (FBN-HFACS) model for analyzing Human and Organization Factors (HOFs) in process accidents. Process Saf Environ. 2019, 132, 59–72. [Google Scholar] [CrossRef]
- Luo, X.X.; Liu, Q.L.; Qiu, Z.X. The Influence of Human-Organizational Factors on Falling Accidents From Historical Text Data. Front. Public Health 2022, 9, 783537. [Google Scholar] [CrossRef]
- Detyniecki, M. Mathematical Aggregation Operators and Their Application to Video Querying. Ph.D. Thesis, Université Pierre et Marie Curie, Paris, France, 2000. [Google Scholar]
- Ishikawa, A.; Amagasa, M.; Shiga, T.; Tomizawa, G.; Tatsuta, R.; Mieno, H. The max-min Delphi method and fuzzy Delphi method via fuzzy integration. Fuzzy Sets Syst. 1993, 55, 241–253. [Google Scholar] [CrossRef]
- Hsu, H.-M.; Chen, C.-T. Aggregation of fuzzy opinions under group decision making. Fuzzy Sets Syst. 1996, 79, 279–285. [Google Scholar] [CrossRef]
- Yazdi, M.; Kabir, S. A fuzzy Bayesian network approach for risk analysis in process industries. Process Saf. Environ. Prot. 2017, 111, 507–519. [Google Scholar] [CrossRef]
- Wiegmann, D.A.; Shappell, S.A. Human error analysis of commercial aviation accidents: Application of the human factors analysis and classification system (HFACS). Aviat. Space Environ. Med. 2001, 72, 1006–1016. [Google Scholar]
- Song, Y.H.; Wang, J.W.; Liu, D.H.; Guo, F. Study of Occupational Safety Risks in Prefabricated Building Hoisting Construction Based on HFACS-PH and SEM. Int. J. Environ. Res. Public Health 2022, 19, 1550. [Google Scholar] [CrossRef] [PubMed]
- Sadeghi, S.; Soltanmohammadlou, N.; Rahnamayiezekavat, P. A systematic review of scholarly works addressing crane safety requirements. Saf. Sci. 2021, 133, 105002. [Google Scholar] [CrossRef]
- Wu, J.S.; Zhang, L.L.; Bai, Y.P.; Reniers, G. A safety investment optimization model for power grid enterprises based on System Dynamics and Bayesian network theory. Reliab. Eng. Syst. Saf. 2022, 221, 108331. [Google Scholar] [CrossRef]
- Vithanage, S.C.; Sing, M.C.P.; Davis, P.; Newaz, M.T. Assessing the Off-Site Manufacturing Workers’ Influence on Safety Performance: A Bayesian Network Approach. J. Constr. Eng. Manag. 2022, 148, 04021185. [Google Scholar] [CrossRef]
- Ali, M.S.; Kitali, A.E.; Kodi, J.; Alluri, P.; Sando, T. Quantifying the Safety Benefits of Transit Signal Priority Using Full Bayes Before-After Study. J. Transp. Eng. Part A: Syst. 2022, 148, 04021102. [Google Scholar] [CrossRef]
- Sun, M.; Zhou, R.G.; Jiao, C.W.; Sun, X.D. Severity Analysis of Hazardous Material Road Transportation Crashes with a Bayesian Network Using Highway Safety Information System Data. Int. J. Environ. Res. Public Health 2022, 19, 4002. [Google Scholar] [CrossRef]
- Ramzali, N.; Lavasani, M.R.M.; Ghodousi, J. Safety barriers analysis of offshore drilling system by employing Fuzzy Event Tree Analysis. Saf. Sci. 2015, 78, 49–59. [Google Scholar] [CrossRef]
- Onisawa, T. An approach to human reliability in man-machine systems usingerror possibility. Fuzzy Sets Syst. 1988, 27, 87–103. [Google Scholar] [CrossRef]
- Wang, Y.Z.; Yin, H.J.; Guo, X.W.; Zhang, W.G.; Li, Q.K. Distributed ANN-bi level two-stage stochastic fuzzy possibilistic programming with Bayesian model for irrigation scheduling management. J. Hydrol. 2022, 606, 127435. [Google Scholar] [CrossRef]
- Otsubo, Y.; Otani, N.; Chikasue, M.; Nishino, M.; Sugiyama, M. Root cause estimation of faults in production processes: A novel approach inspired by approximate Bayesian computation. Int. J. Prod. Res. 2022, 2022, 1–19. [Google Scholar] [CrossRef]
Publisher’s Note: MDPI stays neutral with regard to jurisdictional claims in published maps and institutional affiliations. |
© 2022 by the authors. Licensee MDPI, Basel, Switzerland. This article is an open access article distributed under the terms and conditions of the Creative Commons Attribution (CC BY) license (https://creativecommons.org/licenses/by/4.0/).