Abstract
As many European countries, the Portuguese territory is a region of moderate seismicity, and a large part of its building stock includes reinforced concrete (RC) buildings built before the introduction of modern seismic codes (<1983s). Currently, the Lisbon building stock is composed of 45% of RC buildings, of which 71% were built in such a construction period. Being designed to only sustain gravitational loads and without adequate lateral load resistance, these buildings are likely to be severely damaged during an earthquake. This highlights the need to propose reliable seismic risk assessment and earthquake loss models for such structures. In this context, the development of an exposure model which quantifies the building stock susceptible to be seismically damaged, in terms of structural characteristics, spatial location, and occupancy, is of major importance. The main purpose of this paper is to contribute the definition of a building exposure model for the city of Lisbon, focusing on a detailed structural characterization of these typologies. It starts with an extensive collection and analysis of design blueprints of existing buildings in two Lisbon’s neighborhoods: Alvalade and Benfica, which were found to be representative of the RC building stock in the city. Then, the information collected is scrutinized and statistically post-processed through probability distributions that provide a clear insight on the RC typologies and their structural characteristics. These results can be used in the future for the development of a numerical models and to derive fragility and vulnerability models, fundamental to conducting seismic risk analyses.
1. Introduction
Seismic activity in Portugal has been relatively low in recent decades, despite having negatively marked the country′s history with high loss of human life and material goods [1]. The Portuguese territory is classified with low to moderate seismic activity, but some regions, such as Lisbon, Algarve and Azores present moderate to high seismic hazard [2]. In the last four decades of the 20th century the city of Lisbon has observed a substantial population growth, which led to a large number of residential buildings at a time when construction regulations had little or no information concerning the design of structures subject to seismic action [3]. In Portugal, the first regulations to consider simple seismic provisions were the RSCCS [4] and the RSEP [5], followed by the REBA [6]. It was only in 1983 that a new and more demanding code was introduced, the RSA [7], the first regulation that established adequate and restrictive seismic performance requirements and is still used nowadays along with Eurocode 2—Design of Concrete Structures [8] and Eurocode 8—Design of Structures for Earthquake Resistance [9]. Considering that there is a large percentage of buildings in Lisbon built before 1983, the need to identify, characterize and assess their seismic performance [3] is of utmost importance. In this context, RC buildings built between 1950 and 1980 are brought to attention since they are characterized by several deficiencies, such as non-ductile structural elements, irregularities in height and plan, presence of indirect beam-beam support, insufficient ratio of longitudinal and transverse reinforcement and smooth reinforcement steel bars (mostly for buildings built up to the 70s) [10,11,12,13,14,15]. Seismic vulnerability assessment at urban centers is a challenging issue that needs to be faced within earthquake risk and seismic mitigation of large territorial areas. Assessing the seismic vulnerability of a large number of buildings is an appropriate strategy but requires high human resources and computational capacity. Alternatively, the attention could be focused on a limited number of buildings that are deemed representative of the total building stock, which allows the performance of more advanced analyses and the extension of the sample results obtained to the entire urban center [16]. Hence it is necessary to identify the most vulnerable areas to seismic action and to proceed with the acquisition of up-to-date building data. This information can be gathered quickly from national data (i.e., census), conducted in most countries and often contain useful information to estimate the buildings seismic performance, or from structural surveys, which is a more resource-intensive method [17]. The first step of a seismic risk analysis is the development of an earthquake exposure model, which consists of a detailed database that describes the assets that are exposed to seismic activity and are susceptible to be damaged. This is a challenging task due to the variety of building practices, materials, and configurations but mostly due to the complex process of gathering data [18,19]. A common approach entails the use of pre-defined building typologies that have been developed in order to classify and characterize building inventories in standardized and comparable ways. Those are often divided in two types: specific risk-oriented taxonomy schemes, such as the 1998 European Macroseismic Scale [20], ATC-13 Earthquake Damage Evaluation Data for California [21], FEMA P-154 [22], FEMA 178 [23], HAZUS taxonomy [24] and PAGER-STR [25], among others, and faceted taxonomies, such as the SYNER-G project [26], Word House Encyclopedia (WHE) [27] and the Global Earthquake Model (GEM) Building Taxonomy v2.0 [28]. Worldwide, several research projects have been conducted, employing these pre-defined taxonomies, concerning the exposure model of certain countries or regions, such as Croatia [19], Greece [29], Portugal [30], México [31], Asia [32], Italy [33], Algeria [34], and others. Another approach to characterize the building stock of a certain region is the performance of a structural survey with the aim of gathering detailed and complex information regarding the structural properties of the buildings. In Portugal, several studies were conducted with the aim of characterizing the Portuguese RC building stock: Silva et al. (2015) [35] analysed several structural design projects of RC buildings in Portugal mainland to estimate the probabilistic distribution of a set of geometric and material properties with the aim of generating frames capable of reproducing the structural characteristics of the Portuguese buildings. The study allowed the development of vulnerability functions for the different typologies of structures analysed. Vicente et al. (2015) [36] proceeded with the characterization of Bairro Ribeirinha in Faro, with the aim of evaluating its seismic vulnerability. Furtado et al. (2015) [37] analysed a set of RC buildings with masonry infills in Portugal and compared the observed data with similar studies carried out in Italy and Turkey. That study allowed to compare the characteristics of the observed buildings as a function of the buildings spatial distribution, year of construction and period of construction. In other Mediterranean countries, similar studies were also developed: Bal et al. (2008) [38] carried out the characterization of RC buildings in the region of Marmara, Turkey, for the use of risk and loss assessment models (including the study effect of repair and reinforcement solutions). Meral (2019) [39] analysed an extensive inventory data composed by 8850 beams, 26,963 columns and 2311 RC walls from 506 existing residential buildings with the aim to generate statistics of structural properties about Turkish building stock which are effective on the seismic response of existing RC buildings. Ozmen et al. (2015) [40] provided statistical information of structural parameters about the Turkish building stock for proper modelling using a detailed inventory study including 475 low and mid-rise RC building with 40,351 columns and 3128 beams for member properties. The comparison between available studies is important to identify common structural characteristics, derive common properties for the Mediterranean countries, and use common databases. This can be useful to define representative experimental specimens and numerical simulation to conduce seismic risk assessment [41]. With the above in mind, this research conducts an in-depth analysis of the material, geometric and structural characteristics of RC buildings in Lisbon, where approximately 1300 drawings and design specifications have been collected in cooperation with the Public Municipal Archives. The purpose is first to assess the structural design and construction practices employed in different construction periods and different areas of Lisbon and then, provide statistical information of structural parameters about the Lisbon RC building stock.
In the first part, the RC building stock of Lisbon is disaggregated based on four periods of construction and the design code in force during each period. In the second part, the drawings and design specification of around 1300 RC buildings collected in two civil parishes of (Alvalade and Benfica) are collected and analyzed to develop an exposure model applying the updated version of the GEM taxonomy scheme [28], which allows buildings to be classified according to a number of structural attributes such as the main construction material, the lateral load resisting system, the number of storeys, the period of construction and the ductility level [29]. Finally, the third part consists of an in-depth analysis of the material, geometric and structural characteristics of RC buildings in these parishes of Lisbon. The purpose is to evaluate the variability of structural design and construction practices employed in different construction periods and different areas. In this way, the data of various parameters is scrutinized to assess the eventual correlation between certain geometric and reinforcement properties and the construction date and/or the number of storeys.
2. Lisbon RC Building Stock
2.1. Characteristics of RC Buildings
The building stock of Lisbon is essentially composed of masonry and RC buildings. The latter, which is the focus of this study, can be classified into four different groups, concerning the period of construction [14]:
- (i)
- transition buildings or mixed masonry-RC buildings, built until the beginning of 1950.
- (ii)
- first phase RC buildings, built before the introduction of seismic resistance codes, until around 1958.
- (iii)
- second phase RC buildings, built between around 1958 and 1983.
- (iv)
- modern RC buildings, built after 1983.
The first category, which is beyond the scope of this study, together with the first phase of RC buildings, are the ones that raise more awareness regarding their seismic behavior, mostly because these buildings were designed without any seismic resistance considerations [14].
The first phase RC buildings (Figure 1) started being built around 1950 and were mainly moment-resisting frames structures, mostly designed to sustain gravity loads and are characterized by geometric irregularities, namely: vertical irregularities where all the columns′ cross-section decreases along the height in the same storey; horizontal irregularities, due to the irregular and asymmetric column′s distribution in the plan and the frames predominantly oriented in one direction; structural irregularities, i.e., presence of indirect beam-beam supports, insufficient longitudinal and transverse reinforcement, beams frame eccentrically to columns, smooth rebars for pre-1970 buildings, insufficient length of embedment for the anchorage of the vertical reinforcement into the foundations; and materials with poor mechanical properties [10,15].
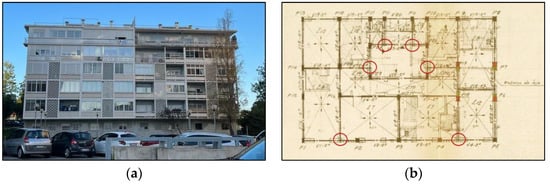
Figure 1.
First-phase buildings: (a) RC buildings built in the end of 1950′s in Alvalade and (b) its plan with the indication of the presence of indirect supports beam-beam [42].
The RSCCS (Regulamento de Segurança das Construções contra os Sismos) [4] was introduced in 1958 as the first regulation that specifically defines the seismic action to be considered in the design of the structures in Portugal, which led to the use of RC walls around stairs and lifts, as well as flat slabs [15]. Nevertheless, the levels of seismic action prescribed in the RSCCS are low when compared to the potential seismicity of some areas of mainland Portugal and when compared to the current regulation (Eurocode 8) [15]. Buildings from this construction period are also characterized by the absence of masonry infills on the ground-storey due to architectural aesthetics [43], as shown in Figure 2a. This characteristic introduces a source of irregularity that can trigger torsional and/or soft-storey effects, especially when no capacity design has been employed in the bare frame, which reduces the structure′s seismic capacity [44,45]. The role of masonry infills on the seismic performance of existing RC buildings has been extensively analyzed and documented such in many past studies, such as [45,46,47].
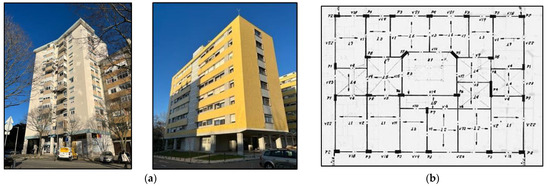
Figure 2.
Second-phase buildings: (a) RC buildings built at the end of 1960′s with RC walls and pilotis and (b) typical plan of this construction period.
The fourth and more recent typologies of RC buildings (Figure 3) had origin in 1983 with the publication of RSA (Regulamento de Segurança e Ações) [7] and REBAP (Regulamento de Estruturas de Betão Armado e Pré-Esforçado) [48], in which seismic action plays a relevant part in the design of RC structures. It is important to mention that this year marks the introduction of the RC building design codes (REBAP) considering the effect of seismic action on the structure very similar to the design currently in practice (Eurocode 8).
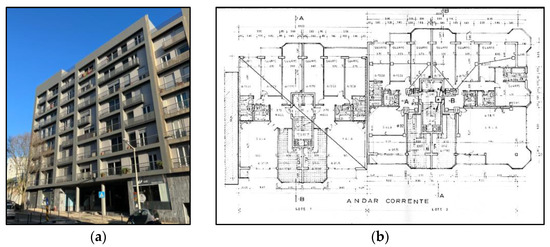
Figure 3.
Modern buildings: (a) Modern RC building located in Benfica and (b) typical plan for this period of construction.
The buildings designed according to these codes are characterized by high-performance concrete, sometimes even prestressed, in residential buildings. There is also an increase on what concerns the distribution of structural stiffness and a limitation of mass and stiffness asymmetries (intending to reduce the secondary effects of seismic action). Nevertheless, the vulnerability of those buildings can be highly variable since no quality control for design and construction was assured, unless specified by the owner [43].
Table 1 presents a summary of the main characteristic of the RC typologies found in Lisbon based on all the data gathered for this study and in work developed by Appleton (2001, 2008) [14,43] and Costa and Providência (2019) [10].

Table 1.
Summary of the RC typologies found in Lisbon.
2.2. Census Data
National censuses are conducted every 10 years in the member states of the European Union and EFTA (Iceland, Liechtenstein, Norway, and Switzerland) in which information regarding the characterization and number of buildings among other attributes is collected. However, available census data varies across each country and may not contain the information on structural characteristics of the existing buildings stock. Nevertheless, countries located along the Mediterranean and the Balkans, such as Portugal, provide the number of buildings and detailed information on building characteristics, such as the construction material (masonry, reinforced concrete, and others), the number of storeys, construction age, and occupancy. This data is disaggregated at the parish level (nuts III) which makes it possible to determine the distribution of building typologies in terms of material, construction age, and number of storeys [33]. These characteristics can be used to support the seismic vulnerability assessment of building classes, where the distribution of these buildings can be used to perform risk assessment studies and to estimate the expected losses across a given region or country.
In 2021, a new Census Survey was conducted in Portugal. Even though some provisional results are already available, the definitive inventory of residential buildings will be accessible during 2022. Hence, the results herein presented have been obtained from the database of the 2011 Census [49]. According to the latter, RC buildings represent about 50% of the total building stock in the country [35]. Moreover, 49% of these buildings were constructed without adequate seismic provisions and based on early seismic codes [35]. The results for the Lisbon area indicate that 45% of the total building stock corresponds to RC buildings, of which 71% were built before the introduction of modern seismic codes, as presented in Figure 4a. Figure 4b shows the disaggregation of data in terms of typology and for four construction periods, illustrating the different phases of construction observed in Portugal, as mentioned before. Before 1946, masonry constructions (with and without RC elements) is predominant. After this, an evident expansion of RC buildings is observed until nowadays, alongside a decrease in the construction with masonry.
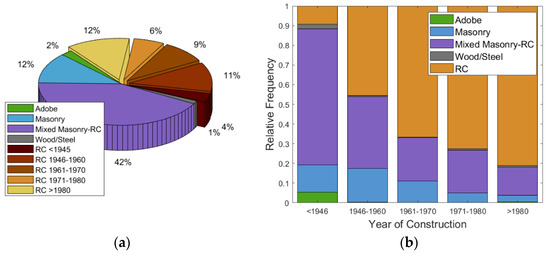
Figure 4.
Distribution of Lisbon building stock based on the (a) building typology and (b) building typology and construction period.
Focusing on the RC typology, Figure 5 shows the distribution of RC buildings across the various parishes of Lisbon. The parish of Alvalade, Benfica, Lumiar, Olivais, and São Domingos de Benfica stand out due to their contribution with the RC buildings being analyzed (almost 50% in each period of construction starting from the end of the 40′s) to the total RC building stock in Lisbon. The increase in the construction with reinforcement concrete (first phase RC buildings) had a greater start in Alvalade (20% of the total RC building stock built between 1946 and 1960) as well as, even though with less contribution, in Benfica and Olivais. In contrast, these parishes exhibit a greater construction of second phase RC buildings from 1961 to 1980 and modern buildings from 1980. It is thus concluded that a huge number of RC structures are worth studying in Alvalade, Benfica and Olivais.
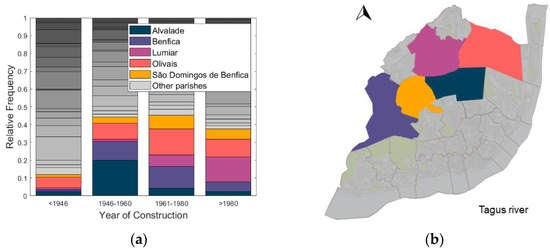
Figure 5.
(a) Disaggregation of RC building stock across the various parishes of Lisbon and (b) spatial location of these parishes in Lisbon district.
This supports the idea that: (i) a detailed analysis of the building stock of these parishes can help to extrapolate results for other parishes in Lisbon; (ii) Alvalade and Benfica are the critical parishes, presenting the highest percentages of oldest RC buildings.
2.3. Benfica and Alvalade Parishes as Representative of the Lisbon Building Stock
As mentioned before, the parishes of Alvalade, Benfica and Olivais have the highest number of RC buildings in Lisbon. However, it was decided to collect data only from Alvalade and Benfica due to the huge resources and time needed to do it for all of them. Additionally, these two parishes also have a high percentage of the oldest RC buildings. This section presents the historical context of these parishes and of what makes them so valuable to the city.
Alvalade was largely characterized by fields, farms, and gardens, used for the summer holidays of the nobles and as recreational and leisure spaces for the population. In the 1930s, Alvalade had the largest period of development, with major architectural projects integrated into the city, such as “Plano de Urbanização da Zona Sul da Avenida Alferes Malheiro”, which include the main avenues and neighborhoods of Lisbon. In the 1970s, several subway stations were built (one of the city′s main transport networks) along with new avenues, areas, and resources. For these reasons, Alvalade is considered a symbol of modern Lisbon [50]. Benfica was initially a rural village distant from the center of Lisbon, which merged naturally with the city after the demographic growth and historical evolution [51]. In the mid of the 18th century, there was a demographic increase of new affluent social classes due to the attraction of Monsanto Mountain, the proximity to the city, the accessibility to the coastline commerce and the benefits of the construction of a water supply aqueduct. The high ageing of the local population and the emergence of new job opportunities at the end of the 20th century led to an increasing migration rate of the younger population from the city center to the suburban areas [52].
As is the case of Lisbon, the evolution of the urban area of a large city is summarized by suburbanization and peri-urbanization, gentrification, industrial relocation, deconcentrating of economic activities and the improvement of transportation networks [53]. In conclusion, Lisbon history inevitably goes back to the past of these two territories.
3. Exposure Model for the Lisbon Residential RC Building Stock
An exposure model requires the division of the building stock in different taxonomy groups regarding the characteristics related to the vulnerability of the buildings to seismic hazard [54]. The application of these taxonomies consists in the division of structures according to the main characteristics that govern their seismic behavior and are usually supported by a combination of authoritative data (i.e., census) and expert judgment or on the collection of data in the field [55]. The accuracy of building taxonomies strongly depends on the reliability and precision of the information in the corresponding databases [19,54].
3.1. Buildings Taxonomies
Building taxonomies are often divided in two types: specific risk-oriented taxonomies or faceted taxonomies.
The first is usually employed for large-scale assessments and is used to assign a vulnerability model to individual buildings based on predefined typological classes connecting similar structural features. Hence, the buildings belonging to each class are expected to present similar seismic behavior. Several types of risk-oriented buildings taxonomies have been proposed in the literature: the 1998 European Macroseismic Scale [20] has been used in several European countries for risk assessment purposes; in the USA, ATC-13 Earthquake Damage Evaluation Data for California [21] was developed as a facility classification scheme for California which has latter evolved to form FEMA P-154, which is still in use today in an updated version (FEMA P-154 [22]); the HAZUS taxonomy [24] which is based on FEMA 178 [23] was developed to describe the building stock in the USA and has been extensively employed to model building inventories in America; and PAGER-STR [25] was developed as a global database of building inventories using a taxonomy of global building types for use in near-real-time post-earthquake loss estimation and pre-earthquake risk analysis. One of the main disadvantages of this method is the limited geographical scope since most of these taxonomies have been proposed for a specific area. The employment of a taxonomy for a different geographic location may increase the uncertainty of the subsequent vulnerability calculations since a specific building may not comply with the assumptions provided by the class itself [25].
The second type, which has been recently proposed, is composed by a set of attributes whose function is to describe individual buildings′ characteristics related to seismic vulnerability at wide geographical scales [56]. However, while this taxonomy fills the gap found in the risk-oriented taxonomy, such as the lack of conceptual clarity, compactness, and scalability databases [19,56], the data collected is highly detailed, and not directly related to building classes expectedly homogenous in terms of vulnerability, making it not feasible to use in large-scale risk-assessment [19,55]. Pavić et al. (2020) [19] provided an extensive discussion on the advantages and disadvantages of both taxonomies. A thorough literature review of existing taxonomies (both risk-oriented or faceted) can be found in GEM [28].
Among the available faceted taxonomies, such as the one in the SYNER-G project [26] or the Word House Encyclopedia (WHE) [27], the Global Earthquake Model (GEM) Building Taxonomy v2.0 [28] was designed to be applicable worldwide and has been employed in several studies [32,57,58]. This taxonomy is defined by 13 main expandable attributes and each attribute describes a specific building or class of buildings characteristic that affects their seismic performance [59]. These attributes include: 1. Direction; 2. Material of the lateral load resisting system; 3. Lateral-load resisting system; 4. Height; 5. Date of construction/retrofit; 6. Occupancy; 7. Building position within a block; 8. Shape of the building plan; 9. Structural irregularity; 10. Exterior walls; 11. Roof; 12. Floor and 13. Foundation system. More information on the GEM Building Taxonomy Version 2.0 can be found in the technical report [28].
3.2. RC Exposure Model
The exposure model developed in this study was based on the updated version of the GEM taxonomy [28] and only focus, as already mentioned, on the RC residential building stock of two parishes: Alvalade and Benfica, which includes 1306 RC buildings. To develop a building-by-building exposure model, the drawings and design specifications of all these 1306 RC buildings have been collected and analyzed.
The GEM taxonomy is widely known, however, its list of attributes is highly complex and arguably possible to fully collect in practice. Nevertheless, it has been recently used to develop an exposure model without including all the attributes [60], a strategy that can also be adopted in the future for the Lisbon area, using the data presented in this study. Such an approach is also in agreement with the collection of only some of the GEM taxonomy attributes for the RC residential building stock in Lisbon, carried out in this study, as described in Table 2. Each attribute is defined by one or two levels of detail (Level 1 and Level 2, respectively) which differ in complexity. Attributes such as the building occupancy, which do not have a direct impact on the seismic behavior of these buildings but on the number of deaths or injuries in the case of a seismic event, were not considered. Furthermore, since this study focused only on gathering data from RC buildings, the only material of lateral load-resisting system considered was reinforced concrete cast-in-place. For the lateral load resisting system, two types were considered: dual frame-wall system (LDUAL) and moment-frame (LFM). The orientation of the load-bearing walls was not considered.
Table 2.
Attributes of GEM Building Taxonomy used to describe Lisbon RC Buildings.
The ductility of the lateral load resisting system was defined considering the design code in use at the time of construction, following the recommendations of the SERA Project [59]. Pre/low code RC buildings are assigned with no ductility, moderate code RC buildings are assigned with low ductility and high code RC buildings are assigned with medium to high ductility. Regarding height, two characteristics were considered: the number of storeys above ground and the height of the ground floor. The first attribute helps to determine the dynamic characteristics of the buildings. Higher buildings are usually more flexible and have larger mass, therefore have a longer period of vibration. On the contrary, shorter buildings generally have shorter periods of vibration. The data regarding the number of storeys above ground floor was disaggregated in four classes: 1 to 4 (HBET:4,1), 5 to 7 (HBET:7,5), 9 to 8 (HBET:9,8) and 10 or more storeys (HBET:10+). Regarding the second option, in Portuguese RC buildings, it is expected that the ground-storey height is different from the remaining stories due to the requirement of wider spaces (for commercial purposes or garages). According to Portuguese regulation, since 1975, the minimum clear headroom for residential areas and for commercial establishments or public areas is 2.40 and 3.00 m, respectively. The data was disaggregated in three intervals: 2.00 to 3.00 (HFBET:3,2), 3.01 to 4.00 (HFBET:4,3.01) and 4.01 to 6.00 (HFBET:6,4.01) meters. Finally, the presence of structural irregularities in plan or height, such as the potential for the formation of soft-storeys, was also assessed due to their influence on the seismic response of RC buildings and separated in regular (IRRE) or irregular (IRIR). Figure 6 presents the schematic diagram of the proposed building taxonomies defined to characterize the Lisbon RC building stock. In total, 144 different typologies of RC buildings were defined.

Figure 6.
Schematic diagram of the proposed building classes defined for Lisbon RC building stock.
The distribution of buildings as a function of the lateral load resisting system and the period of construction or number of stories is shown in Figure 7a,b, respectively. Figure 7c merges the data of Figure 7a,b. It can be observed that most RC buildings were built before 1970. This is mostly observed for the parish of Alvalade, where a major part of its building stock was built before 1970, with a focus on the LFM building typology. In the case of Benfica, even though most buildings were built prior to 1970, an expansion of the RC building stock in this parish is also evident for latest periods of construction.
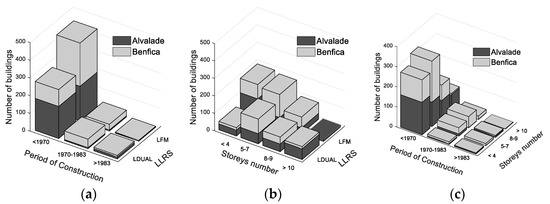
Figure 7.
Distribution of buildings as a function of: (a) lateral load resisting system (LLRS) and period of construction, (b) LLRS and number of storeys and (c) period of construction and number of storeys.
Regarding the number of storeys, there is a tendency to use LFM structures for low/medium height buildings and LDUAL structures for taller buildings in both parishes. The seismic resistance of LDUAL structures is guaranteed by the interaction forces of the frame-wall effect, while in the LFM structures, the seismic resistance is associated essentially to the capacity in bending and shear of columns and beams. As expected, there is a tendency for the tallest buildings to adopt the LDUAL as a lateral load resisting system, to take advantage of the benefits of RC walls and the frame-wall effect along the building height. Moreover, an increase in taller buildings in Benfica is observed from 1970 onwards.
Regarding the period of construction before 1970, more building constructions are found in both areas, with the appearance of LDUAL buildings with 8 to 9 storeys (which are considered very tall for that period). From 1970 to 1983, a discontinuity of LFM buildings in favor of LDUAL building was observed. This period of construction is associated with major modifications and development of design rules and the necessity to build in height to take advantage of the in-plan area available within the city. From 1983 onwards, even though a decrease in the number of new constructions is observed, preference is given to LDUAL structures regardless of the building height.
Figure 8a,b show the distribution of buildings as a function of the ground-storey height (GS Height) and period of construction, and as a function of the GS height and lateral load resisting system (LLRS), respectively. When different from the remaining storeys, the GS height can have implications on the structural behavior of the buildings, mostly if it is characterized by the absence of masonry walls, which can lead to the formation of soft-storey mechanisms. RC buildings in Avalade prior to 1970 are characterized by higher ground-storey heights, while the distribution in Benfica is independent of the ground-storey height. The distribution of buildings in terms of the configuration type is roughly the same regardless of the ground-storey height.
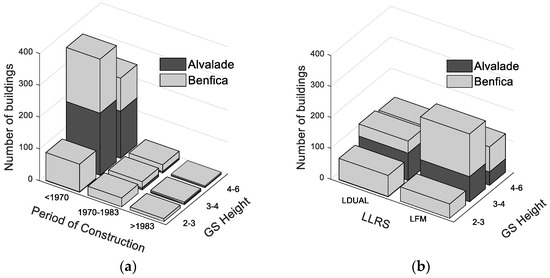
Figure 8.
Distribution of buildings in function of the ground-storey (GS) height, in meters, and (a) period of construction and (b) lateral load resisting system.
Figure 9 presents the data collected about the potential for the formation of soft-storeys in the observed RC buildings. It shows that most buildings that are prone to the development of soft-storeys were built before 1970 in both parishes, presenting a sharped decrease onwards. This is related to the introduction of regulations that limited the use of storeys without masonry infills. Still, these buildings represent nearly one-third of the total RC building stock analyzed. Concerning the relationship between the lateral load resisting system and the presence of taller ground-storeys (Figure 9b) no significant trend can be observed. Moreover, different distributions can be found in the two parishes: in Alvalade, the presence of taller ground-storeys happens for LDUAL buildings, while in Benfica, it is not possible to see such a direct relationship.

Figure 9.
Distribution of buildings in function of the presence of a soft-storey and (a) period of construction and (b) lateral load resisting system.
Figure 10 shows the data regarding the regularity in elevation according to EC2 [8]. Notice that the Alvalade parish has the most irregular buildings in elevation, unlike Benfica, where the majority are regular. Furthermore, as for the soft-storey data, after 1970 the building′s configuration tends to be all regular (although there is a decrease in their construction number).
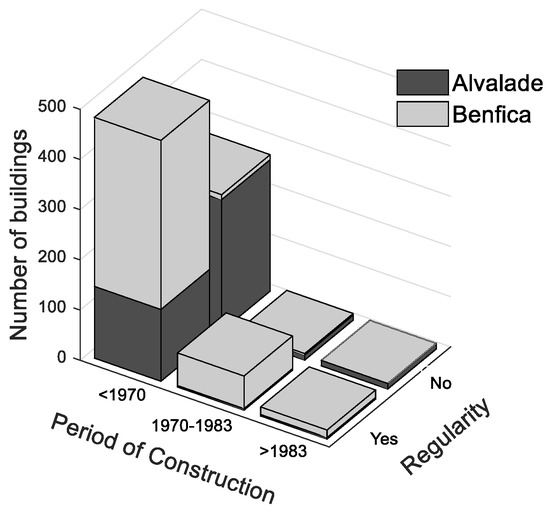
Figure 10.
Distribution of buildings in function regularity in elevation.
Figure 11, Figure 12 and Figure 13 show the geographic distribution of buildings in Alvalade and Benfica regarding the lateral load resisting system, number of storeys and period of construction, respectively. These figures allow to spatially analyze these three distinct categories together. The collection of data was performed through the analysis of approximately 1300 drawings and design specifications in collaboration with the Public Municipal Archives and not from the Census data. For some drawings, no available data was found for all the parameters under study, hence the irregular distribution of “no available data” buildings in the following figures. To address this lack of information, the probabilistic distributions of each variable, together with the correlation models between variables, can be employed to properly sample the missing data for some of the buildings.
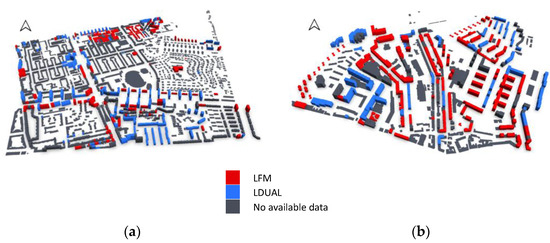
Figure 11.
Lateral load resisting system thematic map of (a) Alvalade and (b) Benfica.
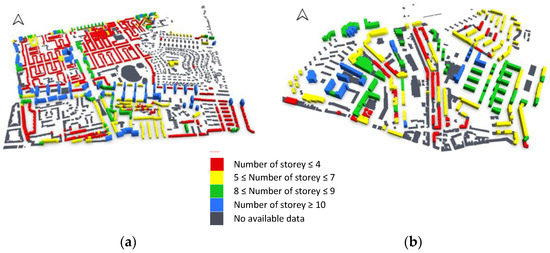
Figure 12.
Number of storeys thematic map of (a) Alvalade and (b) Benfica.
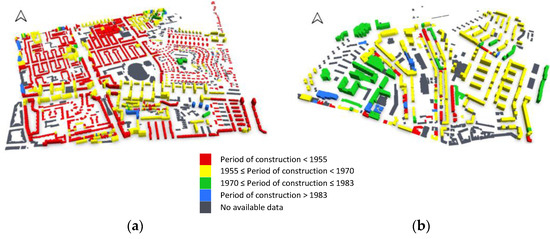
Figure 13.
Period of construction thematic map of (a) Alvalade and (b) Benfica.
4. Structural Characterization
In this section, the material, geometric and structural characteristics gathered for the RC building stock available in the parishes of Alvalade and Benfica are presented to evaluate the variability of structural design and construction practices employed in different construction periods and in different areas of Lisbon. The collected data (Table 3) was grouped as a function of the type of lateral load resisting system and period of construction to assess whether certain geometric and reinforcement properties were directly related to these attributes.
Table 3.
Attributes collected and inserted in the database for each RC building.
For each building′s blueprint, the main frames in the structure that would resist lateral loads were chosen to measure the following set of geometric parameters: ground and upper storey heights, column widths and depths, RC walls widths and depths, beam widths and depths, and slab thickness. Each set of attributes was fitted to different probabilistic distributions (normal, lognormal, exponential, gamma, beta and weibull) and the statistical probability parameters were obtained through maximum likelihood estimation. To consolidate the approximation, the mean and the coefficient of variation (COV) were calculated. Finally, the quality of the distribution fit was evaluated with the Pearson′s chi-square test (Χ2) for significance levels of 1%, 5%, and 10%. For some cases, the mode, which is the value that appears more often, was also introduced. The obtained set of probabilistic distributions can be used in subsequent studies to randomly generate building models within each building typology, to be used to produce regional seismic vulnerability or risk models, as performed in many past projects [17,61,62].
A good approximation of probability distribution requires a significant sample size. Thus, for those attributes where a small sample size was obtained and, consequently, considered non-valid, no probability distribution was applied. The statistical treatment of the sample obtained for each attribute described in Table 3 was compared with some of the values indicated in Eurocode 2 [8] and with similar studies.
4.1. Construction Material
This study analyzed several characteristics of the construction materials used in each building, along with an attempt to study a probabilistic distribution of all Portuguese building′s properties.
The knowledge of the construction materials is essential when studying a building stock since it allows the estimation of load values for any calculations (e.g., dead loads), predict material degradation or even assess the behavior of each structure (i.e., determine the mechanical properties of RC). To estimate the concrete and steel mechanical properties, ideally, many buildings should be randomly selected, and in-situ tests should be performed to determine the concrete compressive strength and steel rebar yielding and ultimate strength. Though, this is a time-consuming and costly procedure, and these parameters were determined from the original design projects, design codes in force at the time of construction of these buildings and from other similar studies.
Regarding the concrete specifications, the first regulation that implemented a minimum requirement for compressive strength was implemented in 1918 which allowed the use of concrete with relatively low resistance. With the introduction of REBA [6], the concept of concrete resistance classes, with characteristic compressive strength ranging between 18 MPa and 40 MPa, was introduced. Finally, with the RSA code [7], published in 1983 and, more recently, with Eurocode 2 [8], the concrete classes were adjusted to the international units and then extended to high compressive strength values. From a past study [35] experimental core drilling tests were employed in buildings located mainly in the center and north of Portugal to estimate the probabilistic distribution of concrete compressive strength which resulted in a gamma distribution with a mean value of 23.8 MPa. A limited amount of the analyzed blueprints had information regarding the concrete compressive strength: 4% and 8% of the total number of buildings analyzed for Alvalade and Benfica, respectively. Nevertheless, the average value obtained for Alvalade and Benfica was, respectively, 25.1 MPa and 22.5 MPa, which are in accordance with the study mentioned before.
Regarding the steel rebars, the first regulations date back to 1918 and 1935, requiring the ultimate tensile strength of smooth steel bars to be greater than, respectively, ≈387 MPa and ≈377 MPa. With the introduction of REBA [6] in 1967, three steel resistance classes were adopted, each characterized by its characteristic yielding tensile strength (fyk) which were later updated to MPa and introduced in Eurocode 2 [8,35]. According to Silva et al. (2015) [35], most buildings were designed with steel ribbed rebars with a nominal strength of 400 MPa and 500 MPa, and a smaller fraction with smooth bars with a lower resistance, mainly in RC buildings constructed prior to the 1970s [35]. From the limited available data regarding the steel properties of the buildings, the average steel yielding strength obtained for Alvalade and Benfica was 400 MPa (with 85% of the RC buildings have smooth rebars).
Table 4 provides a summary of the observed information regarding the construction materials. Since this information is a non-numerical sample, emphasis is given to the most common data observed.
Table 4.
Summary of construction materials for the RC building stock of each parish.
4.2. Storey Heights
In RC buildings located in Portugal, it is common for the ground-storey height to be different from the remaining regular storeys due to the requirement of wider spaces (for commercial purposes or garages). Since no relevant difference was observed in the statistical analysis when disaggregating the data according to the period of construction or the number of storeys, the information was compiled for the best distribution fit. Figure 14 shows the histograms and the associated probabilistic distribution of these parameters. The ground storey height was found to follow a lognormal distribution with a mean of 3.69 m and a COV of 21%, whilst the regular storey height was found to follow a lognormal distribution with a mean of 2.93 m and a COV of 7%. None of the distributions satisfied the chi-square test for all significance levels.
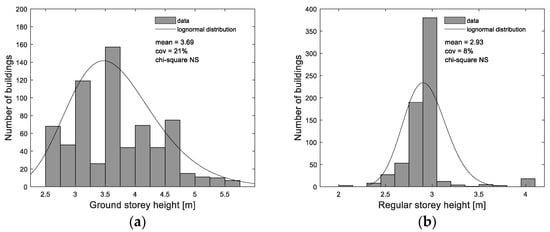
Figure 14.
Distribution of ground storey (a) and regular storey (b) heights for all RC buildings.
Table 5 show the probabilistic distribution of ground-storey and regular storey height, disaggregated by parish. As expected, the ground-storey height is higher. Taller buildings are usually built with a LDUAL structural system due to the benefits of the interaction forces of the frame-wall along the building′s height, as shown before in Figure 7 and now with Table 5. In fact, RC buildings located in Alvalade tend to be taller, which is supported by the fact that there are as many dual-frame wall (LDUAL) buildings as moment-frame (LFM) buildings in Alvalade (unlike Benfica, where there are more LFM than LDUAL buildings). This data is relevant when compared with other categories (i.e., presence of soft-storeys, number and type of openings, distribution of interior walls or even cross-section of the RC elements).
Table 5.
Probabilistic distribution of ground and regular storey height for the RC building stock of each parish.
4.3. Slab Thickness
RC buildings in Portugal usually feature two types of slabs: clay hollow blocks with concrete topping layer and RC slabs. Both slab types are frequently found in central and northern areas of Portugal [35]. The data collected concludes that there are indeed both types of slabs, but the most frequently observed is the RC slab. The slab thickness and type are both important characteristics to analyze, since they allow the identification of the buildings′ data, how they relate to the stiffness of the floors in its plane and, consequently, the impact they have on the structure′s seismic performance. Note that these parameters also influence the estimation of the gravity loads.
Due to the limited information regarding the slab type of the analized buildings (only 59% of the total buildings), the sample size for hollow blocks slabs was insufficient (10% of the total buildings) and no probability distribution was applied. Nevertheless, the average thickness of hollow blocks slabs from the available data is 0.18 m. These results refer only to Alvalade, as no data about hollow block slabs was gathered in Benfica.
Regarding RC slabs, no relevant difference was found in slab thickness between LDUAL and LFM buildings which allowed to group all data. Figure 15 shows the histogram and the associated probabilistic distribution of RC slab thickness of all buildings (located in Alvalade and Benfica). The slab thickness follows a lognormal distribution with a mean of 0.14 m and a COV of 24%. Comparing the data, although limited, for both types of slabs, hollow block slabs tend to be thicker than RC slabs, mainly due to the height of the hollow blocks.
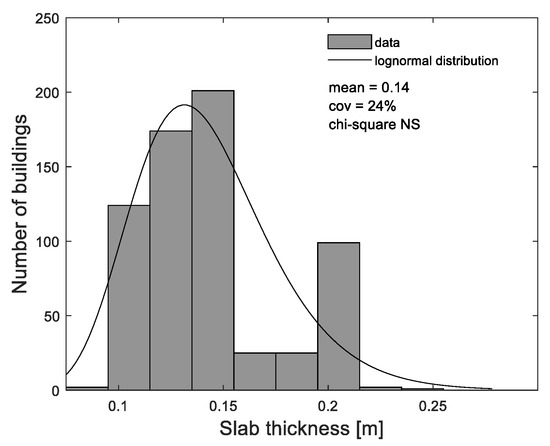
Figure 15.
Distribution of slab thickness for all RC buildings.
Data collected for the slab thickness in both parishes have shown to follow a lognormal distribution with a mean value of 0.12 m and 0.15 m for Alvalade and Benfica parish respectively (Table 6). Silva et al. (2015) [35] has found, for RC slabs of buildings built before 1983 in Portugal, an average thickness of 0.17 m and a COV of 19%, which agrees with the obtained results.
Table 6.
Probabilistic distribution of slab thickness for the RC building stock of each parish.
4.4. Elements′ Cross-Section
Whilst the collection of data, it was often seen in the building design that RC frames and RC walls were the only structural elements considered for the lateral resistant capacity which allowed neglecting all elements that were built mainly for aesthetic purposes or as support to secondary elements (i.e., balconies).
Regarding the cross-section dimensions of the RC elements, the collected data was analyzed as a function of the number of storeys and period of construction.
For the column cross-sections, the data disaggregation revealed a strong correlation with the number of storeys. The correlation with the building height is undoubtedly due to the higher axial load levels in taller buildings, leading to columns with larger cross-sections. This influence mainly affects the columns′ cross-section depth (Table 7). The mean values slightly increase with the number of storeys because they would have to sustain higher seismic internal forces. By contrast, no influence of the number of storeys is observed on the columns′ cross-section width (Table 8) once these buildings were designed only in one direction, and hence the smallest side of the cross-section of the columns was comprised within a low value. Concerning the construction period, a strong adjustment on the columns′ cross-section is verified for buildings designed after 1983. This modification is due to the implementation in 1983 of the seismic code REBAP [48], which resulted in higher bending moments in the design process, thus leading to larger sections, as was also verified for the beam depth.
Table 7.
Probabilistic distribution of RC columns′ depth in function of the lateral load resisting system (LLRS) and number of storeys.
Table 8.
Probabilistic distribution of RC columns′ width in function of the lateral load resisting system (LLRS) and number of storeys.
LDUAL buildings are generally characterized by fewer columns but with larger cross-sections and RC walls located symmetrically in the center of the storey plan. By increasing the walls′ cross-section dimensions, it was possible to reduce the number of columns. Conversely, LFM buildings often shows a high number of columns, uniformly distributed and symmetrically in plan, with smaller cross-sections. Table 9 provides the cross section of the RC wall dimensions, without any relation with the number of storeys or period of construction.
Table 9.
Probabilistic distribution of RC walls and beams′ cross section for each parish.
Comparatively to columns, data obtained for beams′ cross section (Table 9) it is not influenced by the construction period or the number of storeys. The beam cross-section height is mainly influenced by architectural requirements (clear headroom for residence areas) while beam width is, in general, influenced by the thickness of the interior walls. The data analysis showed that the beam design in more recent buildings has a significant variety of cross-sections. In contrast, for older buildings (roughly before 1970s), it was frequent to adopt the same cross-sections for all beams regardless of their location (changing only, if necessary, the reinforcement ratio value).
4.5. Reinforcement Details
For the reinforcement details, all the data gathered from the two selected parishes was analyzed both together and separately. All reinforcement ratios were calculated according to the current regulations, and, for the transverse reinforcement ratio, the largest cross-section dimension was used to obtain the most conditioning reinforcement ratios, as described in EC2-1 (§9.2.2, §9.5.3 and §9.6.4) [8].
4.5.1. Columns
With a view to characterize the reinforcement details of the RC columns present in the analyzed buildings, the data collected is related to the most common and the largest column′s in-plan cross-section. Since the results of these two types of columns are the similar, all data was grouped into a single sample.
Figure 16a presents the distribution fitting of the longitudinal reinforcement ratio data (longitudinal reinforcement area divided by the cross-section area) of both column type. In this figure, the reference values for the minimum and maximum longitudinal reinforcement ratio (As,min and As,max, respectively) according to EC2-1 (§9.5.2) [8] are also plotted to verify the conformity with the current regulation. These limits were calculated with the component related to the cross-section area since not enough data was collected to consider all the EC2 conditions. Regarding these limits, it is observed that the columns of 7 buildings (0.5% of the analyzed buildings) are characterized by longitudinal reinforcement ratios lower than the minimum required, while the columns from 13 buildings (1% of the analyzed buildings) have longitudinal reinforcement ratios higher than the maximum required. It was thus concluded that about 1.5% of all RC buildings analyzed are in nonconformity with EC2 [8].
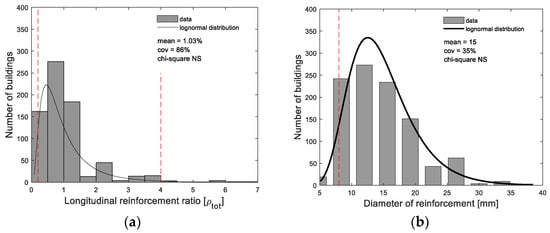
Figure 16.
Distribution fitting of buildings regarding columns′ (a) longitudinal reinforcement ratio (%) and (b) diameter value of longitudinal reinforcement for all RC buildings.
Figure 16b shows the distribution of the longitudinal reinforcement diameter. It also includes the minimum diameter limit imposed by the current regulations, which is 8 mm according to EC2-1 (§9.5.2 (1) [8]. The diameter of the steel bars had to be converted from imperial (inches) to metric (millimeters) units, and the smallest diameter observed is equal to 4.76 mm (that corresponds to a steel bar with Ø 3/16″). Figure 16b shows that about 3% of the analyzed buildings (32 buildings) are characterized by RC columns with longitudinal reinforcement bar diameters equal to or below the minimum required by EC2 [8]. According to a study conducted by Furtado et al. (2015) [37], in which 500 columns of RC buildings located in Lisbon were analyzed, the average value of the longitudinal reinforcement ratio observed was equal to 0.61% with a COV of 32%. This reduced value can be justified by the minimum reinforcement ratios required by REBA (1967) [6] and REBAP (1983) [48], which are, respectively, 0.4% for A24 (actual A235) and 0.3% for A400 and A500. In another study conducted by Sousa et al. (2019) [63], in which 500 columns from RC buildings built between 1950 and 2000 in Lisbon were observed, significantly higher values were observed with an average longitudinal reinforcement ratio of 1.27% and a COV of 40%. Both are consistent with the values obtained for this study, as presented in Figure 16.
Table 10 shows the probabilistic distributions of the RC columns′ longitudinal reinforcement ratio as a function of the LLRS and period of construction.
Table 10.
Probabilistic distribution of RC columns′ longitudinal reinforcement ratio (ρtot) in function of the lateral load resisting system (LLRS) and period of construction.
An increase of the mode and mean values of the longitudinal reinforcement ratio is visible from each period, apart from buildings constructed after 1983, where the sample size is too small to draw conclusions. This is due to the introduction of more strict requirements for the design of reinforcement ratio with the evolution of design codes.
Figure 17a shows the distribution fitting of the transverse reinforcement ratio of all RC columns, which tends to follow a lognormal distribution with a mean of 0.13% and a COV of 66%. As mentioned before, the transverse reinforcement ratio was calculated in order to obtain the lowest and most constraining values (in the direction in which the cross section of the element is largest).
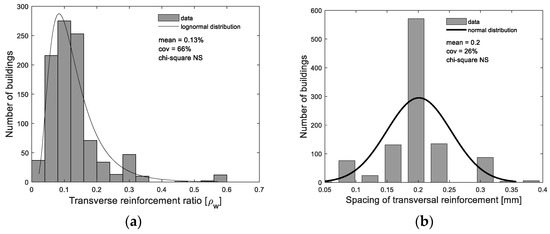
Figure 17.
Distribution of buildings regarding columns′ (a) transverse reinforcement ratio (%) and (b) transverse reinforcement spacing for all RC buildings.
From the analysis of the building blueprints, it was noted that in buildings designed prior to 1970, the transverse reinforcement design had insufficient detailing (with a low diameter and large spacing) for different structural elements since the buildings were not designed to resist lateral loads (same transverse reinforcement area for different structural RC elements). This fact explains the lack of relevant differences in the transverse reinforcement ratios between different columns in the same building, as well as in the RC walls and beams (see following sections). However, it is important to note that from around 1970 onwards, the average transverse reinforcement ratios value have increased twofold. This is justified with the introduction of REBA [6] in 1967, which introduced, for the first time, a more stringent requirement for the transverse reinforcement design to prevent the buckling of the longitudinal reinforcement bars and to ensure the concrete confinement.
Figure 17b shows the distribution of transverse reinforcement spacing, which follows a normal distribution with a mean of 0.20 m and a COV of 26%. In summary, comparing the maximum spacing data observed with the conditions of EC2 [8], it is verified that, despite assuming a relatively high value, the stirrups spacing is in accordance with the current regulations.
Table 11 shows the probabilistic distributions of the RC columns′ transverse reinforcement ratio as a function of the LLRS and period of construction. Similar to the results obtained in Table 10, the transverse reinforcement ratio presents an increase over periods of construction, which is directly connected to the introduction of more strict design rules and a concern to build elements with higher confinement levels and, consequently, more ductile structures.
Table 11.
Probabilistic distribution of RC columns′ transverse reinforcement ratio (ρw) in function of the lateral load resisting system (LLRS) and period of construction.
4.5.2. RC Walls
RC walls play a key role in LDUAL structures and should be designed as ductile, as recommended in EC8-1 [9] and EC8-3 [64]. The walls should be properly confined with stirrups (as the columns), and extra detailing is necessary at the cross-section extremity of the walls that are not interconnected to other perpendicular walls. Figure 18a presents the longitudinal reinforcement ratio of RC walls observed in the parish of Benfica, with the indication of the minimum ratio recommended by EC2-1 (§9.6.2) [8]. This value follows a lognormal distribution with a mean ratio of 0.45% and a COV of 93%. From this analysis, it was stated that around 32% of LDUAL buildings have RC walls with longitudinal reinforcement ratios lower than the minimum requirement of EC2-1 [8].
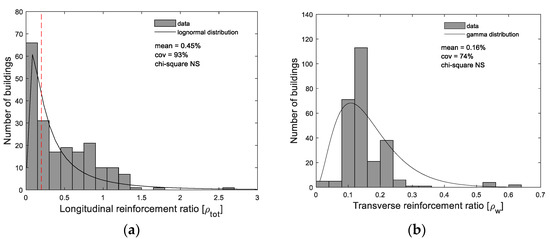
Figure 18.
Distribution of buildings regarding RC walls′ (a) longitudinal reinforcement ratio (%) and (b) transverse reinforcement ratio (%).
Regarding the transverse reinforcement ratio, the results obtained are shown in Figure 18b where a Gamma distribution with a mean ratio of 0.16% and a COV of 74% has been obtained.
The analysis of the structural blueprints showed that, the RC walls were not well detailed and were not prone to the same attention from designers in comparison to other elements (i.e., columns). For most buildings, the same reinforcement design is kept for different walls, which leads to different cross-section RC walls having the same longitudinal reinforcement area.
Table 12 shows the probabilistic distribution of the longitudinal and transverse reinforcement ratio of the RC walls present in LDUAL buildings in Benfica as a function of the period of construction. The influence of the period of construction is clearly seen on the mean values of both longitudinal and transverse reinforcement ratios since an increase of the later is observed with the evolution of structural design codes. Results are similar to the ones obtained for the RC columns, where the average longitudinal reinforcement ratio is relatively smaller in buildings built before 1970, increasing significantly (roughly half) after this year (following the implementation of REBA [6].)
Table 12.
Probabilistic distribution of longitudinal (ρtot) and transverse (ρw) reinforcement ratio of Benfica′s RC walls in LDUAL buildings as a function of period of construction.
4.5.3. Beams
Regarding the beams statistical analysis, a comparison between the edge beams and interior beams was performed, since, normally, the design of the interior beam cross-sections has restrictions on the height dimensions due to the compliance with the clear headroom. Note that, the longitudinal and transverse reinforcement ratios values were calculated at the mid-span of all beams (in both regions) and the sample of beam from Benfica region is about seven times bigger than Alvalade.
Figure 19 presents the observed data of the longitudinal reinforcement ratio in edge beams and interior beams. The data for both types of beams follow a gamma distribution, with the edge beams presenting an average transverse reinforcement ratio of 0.62% and a COV of 88% while the interior beams present an average transverse reinforcement ratio equal to 0.56% and a COV of 70%.
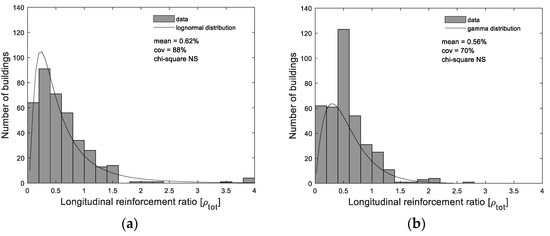
Figure 19.
Distribution of buildings regarding longitudinal reinforcement ratio (%) for (a) edge beams and (b) interior beams for all RC buildings.
Table 13 shows the statistical analysis of the longitudinal reinforcement ratio of beams, measured at the element′s mid-span and similar to the results obtained for the cross section of these elements, the longitudinal reinforcement ratio has shown no influence with the number of storeys or construction period.
Table 13.
Probabilistic distribution of RC beams′ longitudinal reinforcement ratio for each parish.
The transverse reinforcement ratio does not differ between the two types of beams-mean of 0.19% and COV of 115% for edge beams and mean of 0.21% and COV of 165% for interior beams as it can be seen in Figure 20. Both types follow the trend of a lognormal distribution (without satisfying the chi-square test). As for the longitudinal reinforcement, it does not vary depending on the beam location. In addition, it was found that it was common to bend the beam longitudinal steel bars from the lower to the upper zone near the supports and use high constant stirrup spacing along the beam (instead of reducing it near the beam-column joints). This has a large influence on the beam′s performance during an earthquake since in case of a shear stress inversion due to the seismic action, the number of stirrups is not enough to guarantee the development of the required ductility level [11].

Figure 20.
Distribution of buildings regarding transverse reinforcement ratio (%) for (a) edge beams and (b) interior beams for all RC buildings.
Table 14 shows the statistical analysis of transverse reinforcement ratio of the beams, measured at the support of these elements (beam-column joints). The results obtained show lower values when compared to modern practices. However, these results are justified by the design practices at the beams′ end as mentioned above, where the longitudinal reinforcement was bended in diagonal and no attention was given to the spacing of stirrups.
Table 14.
Probabilistic distribution of RC beams′ transverse reinforcement ratio for each parish.
4.5.4. Discussion of Results—Reinforcement for Vertical Structural Elements
The ranges of values obtained for longitudinal and transverse reinforcement ratios of experimental databases available in the literature are presented here for comparison purposes. Table 15 shows the ranges of longitudinal and transverse reinforcement ratios of columns from some of the experimental databases deemed representative of lightly reinforced concrete columns, characteristic of old existing RC buildings constructed prior to the introduction of modern seismic codes.
Table 15.
Ranges of longitudinal and transverse reinforcement ratios of experimental databases (adapted from [65]).
Comparing the values in Table 15 with the data obtained from the RC columns and walls in Lisbon analyzed in this study (presented in Table 10 and Table 11), it is observed that both minimum and maximum mean values observed in previous studies are well above the mean ratios obtained herein (Table 10 and Table 11). As far as the transverse reinforcement ratio for columns is concerned, the mean values for Alvalade and Benfica buildings are of about 0.10% and 0.14%, respectively. Both mean values are well below the mean transverse ratios described in Table 15, which are between 0.23% and 0.55%.
It is worth noting that, based on the experimental database identified in Table 15, analytical shear models were developed and are available in the literature [65]. Nevertheless, these models were based on experimental results of specimens with higher transverse reinforcement ratios, assuming that shear failure can occur only after flexural yielding. For this reason, these approaches are not adequate to simulate the type of shear failure that is expected to occur in typical old RC buildings in Lisbon, in which the low values of the transverse reinforcement ratios of these vertical structural elements indicate that shear failure can develop before flexural yielding and without the development of inelastic deformations [65]. Special attention should thus be paid to the modelling approaches used for the seismic vulnerability assessment of old RC buildings representative of the Lisbon building stock, as they are characterized by extremely low transverse reinforcement ratios.
5. Conclusions
This study presents and describes in detail an extensive collection and analysis of structural characteristics of reinforced concrete (RC) buildings located in two representative and historical neighborhoods of Lisbon: Alvalade and Benfica. The main objective is to provide statistical information on the representative Lisbon RC building stock that allows the development of exposure models which can be used in risk and loss assessment models.
In the first part of the study, the results from the last Census performed and available in Portugal were examined with the purpose of evaluating the distribution of RC buildings in the Lisbon area. It was observed that most RC buildings are located in the parishes of Alvalade, Benfica and Olivais. However, only the buildings located in Alvalade and Benfica were fully analyzed, given the fact that these are the ones that can be used as representative and whose data can be used as proxies to characterize the entire district of Lisbon. In the second part, the updated version of a popular taxonomy scheme, proposed by the Global Earthquake Model (GEM) initiative, was employed to disaggregate the analyzed buildings into pre-defined taxonomy groups with a view to the development of a seismic exposure model. Accordingly, a large number of building attributes were observed and collected, enabling accurate descriptions of the structures and their classification within the proposed taxonomy.
Based on the extensive data that was collected and analyzed, it is concluded that most RC buildings were built before 1970, which emphasize the potential high seismic risk associated with this building stock.
Furthermore, it was also found that there is a tendency to use moment-frame (LFM) structures for low/medium height buildings and dual frame-wall system (LDUAL) structures for taller buildings in both parishes. Moreover, RC buildings in Alvalade until 1970 present more irregularities in elevation when compared to RC buildings in Benfica.
Finally, an in-depth analysis of the material, geometric and structural characteristics of the RC buildings located in the two selected parishes was performed, to evaluate the variability of structural design and construction practices employed in different construction periods and different areas of Lisbon. In this way, the data of various parameters was disaggregated and correlated to assess whether certain geometric and reinforcement properties are directly related or not to the construction date and/or number of floors.The results obtained for the cross section of RC columns have shown, as expected, a strong influence of the number of storeys, as these buildings were mainly designed considering the gravity load. Regarding the construction period, a strong adjustment on the columns′ dimensions is observed for buildings designed after 1983 due to the implementation of the seismic code REBAP. On the other hand, the cross section of beams is not influenced by the construction period or the number of storeys. Regarding the reinforcement ratios of the RC elements, a strong influence of the period of construction has been seen in RC columns and walls due to the introduction of more strict requirements on the design of reinforcement ratio with the evolution of design codes. Overall, an improvement in most structural elements regarding its design is perceived with the increase in knowledge over the construction periods.
The fitting of the observed data with the probabilistic distributions did not always satisfy the chi-square test, which may point out some cases for which a larger sample is needed to ensure a higher quality of the fit. Most of the collected data and corresponding statistical parameters are in line with the results obtained in past similar studies, which is interesting to observe and encouraging to be extended to other parishes in Lisbon. At the same time, it was also observed how the buildings in Lisbon, constructed before 1983, are characterized by very low transverse reinforcement ratios in all RC elements (low ductility level), soft-storeys and diagonal reinforcement rebars in beams which denotes a clear need for a careful shear capacity evaluation in future seismic risk endeavors for the Lisbon area. Moreover, future research can also address more structural properties, such as the span length of the beams (as a function of its height), which can also play an important role in large-scale seismic risk analyses.
Author Contributions
V.X.: conceptualization, methodology, software, formal analysis, writing—original draft preparation, writing—review and editing. R.C.: conceptualization, methodology, valida-tion, formal analysis, writing—original draft preparation, writing—review and editing. R.M.: validation, writing—review and editing. J.M.C.: validation, writing—review and editing. R.B.: conceptualization, methodology, validation, writing—review and editing, supervision, project administration. All authors have read and agreed to the published version of the manuscript.
Funding
This research was funded by Fundação para a Ciência e a Tecnologia (FCT, Ministério da Educação e Ciência, Portugal) through the FCT Research Program: MitRisk-Framework for seismic risk reduction resorting to cost-effective retrofitting solutions, POCI-01-01456-Feder-031865.
Conflicts of Interest
The authors declare no conflict of interest.
References
- Borges, J.F.; Fitas, A.J.S.; Bezzeghoud, M.; Teves-Costa, P. Seismotectonics of Portugal and its adjacent Atlantic area. Tectonophysics 2001, 331, 373–387. [Google Scholar] [CrossRef]
- Lamego, P.; Lourenço, P.B.; Sousa, M.L.; Marques, R. Seismic vulnerability and risk analysis of the old building stock at urban scale: Application to a neighbourhood in Lisbon. Bull. Earthq. Eng. 2017, 15, 2901–2937. [Google Scholar] [CrossRef]
- Gago, A.; Proença, J. Parque Escolar: Reforço Sísmica de Edificios Escolares; Diário da República: Lisbon, Portugal, 2011; ISBN 9789899610668. [Google Scholar]
- RSCCS. Regulamento de Segurança das Construções Contra os Sismos, Decreto-Lei n.o 41658 de 31 de Maio de 1958; Diário da República: Lisbon, Portugal, 1958. [Google Scholar]
- RSEP. Regulamento de Solicitações em Edifícios e Pontes (RSEP). Decreto n.o 44041 de 18 de Novembro; Diário da República: Lisbon, Portugal, 1961. [Google Scholar]
- REBA-67/76. Regulamento de Estruturas de Betão Armado; Diário da República: Lisbon, Portugal, 1967. [Google Scholar]
- RSA. Regulamento de Segurança e Acções para Estruturas de Edifícios e Pontes. Decreto-Lei n.o 235/83; Diário da República: Lisbon, Portugal, 1983. [Google Scholar]
- CEN. NP EN 1992-1-1: Eurocódigo 2—Projecto de Estruturas de Betão; Parte 1-1: Regras Gerais e Regras Para Edifícios; CEN: Brussels, Belgium, 2004. [Google Scholar]
- CEN. NP EN 1998-1: Eurocódigo 8—Projecto de Estruturas Para Resistência Aos Sismos. Parte 1: Regras Gerais, Acções Sísmicas e Regras Para Edifícios; CEN: Brussels, Belgium, 2010. [Google Scholar]
- Costa, R.; Providência, C. Avaliação e Reabilitação Sísmicas de Edifícios de Betão Armado; ENGEBOOK: Porto, Portugal, 2019; ISBN 9789898927774. [Google Scholar]
- Saraiva, J.P.; Appleton, J. Avaliação da Capacidade Sísmica de Edifícios de Betão Armado de Acordo com o Eurocódigo 8—Parte 3. 4as Jorn. Port. Eng. Estruturas 2006, 1980, 1–15. [Google Scholar]
- Caruso, C.; Bento, R.; Castro, J.M. A contribution to the seismic performance and loss assessment of old RC wall-frame buildings. Eng. Struct. 2019, 197, 109369. [Google Scholar] [CrossRef]
- Couto, R.; Requena-García-Cruz, M.V.; Bento, R.; Morales-Esteban, A. Seismic capacity and vulnerability assessment considering ageing effects. Case study: Three local Portuguese RC buildings. Bull. Earthq. Eng. 2020, 19, 6591–6614. [Google Scholar] [CrossRef]
- Appleton, J. Tipificação do Parque Construído. In Sismos e Edifícios; Orion: London, UK, 2008. [Google Scholar]
- Oliveira, C.S.; Gaspar, J.; Correia, F. Levantamento do Parque Habitacional de Lisboa. Vol. 1—Ficha-inquérito. Apuramento de Resultados na Zona da Alameda D. Afonso Henriques, Freguesias de Alto do Pina, S. João de Deus e S. Jorge de Arroios. Report; LNEC: Lisboa, Portugal, 1985. [Google Scholar]
- Couto, R.; Sousa, I.; Bento, R.; Castro, J.M. Chapter 2. Seismic vulnerability assessment of RC structures: Research and practice at building level. In Seismic Vulnerability Assessment of Civil Engineering Structures at Multiple Scales. From Single Buildings to Large-Scale Assessment; Ferreira, T.M., Rodrigues, H., Eds.; Elsevier: Amsterdam, The Netherlands, 2021; ISBN 9780128240724. [Google Scholar]
- Grigoratos, I.; Monteiro, R.; Ceresa, P.; Di Meo, A.; Faravelli, M.; Borzi, B. Crowdsourcing Exposure Data for Seismic Vulnerability Assessment in Developing Countries. J. Earthq. Eng. 2021, 25, 835–852. [Google Scholar] [CrossRef]
- Pittore, M.; Wieland, M.; Fleming, K. Perspectives on global dynamic exposure modelling for geo-risk assessment. Nat. Hazards 2017, 86, 7–30. [Google Scholar] [CrossRef]
- Pavić, G.; Hadzima-Nyarko, M.; Bulajić, B.; Jurković, Ž. Development of seismic vulnerability and exposure models-A case study of Croatia. Sustainability 2020, 12, 973. [Google Scholar] [CrossRef] [Green Version]
- Grünthal, G. European Macroseismic Scale 1998; European Seismological Commission: Luxembourg, 1998; Volume 15. [Google Scholar]
- Rojahn, C.; Sharpe, R.L.; Scholl, R.E.; Kiremidjian, A.S.; Nutt, R.V. ATC-13 Earthquake Damage Evaluation Datas for California; Redwood City, CA, USA, 1985. Available online: https://www.atcouncil.org/pdfs/atc13.pdf (accessed on 15 December 2021).
- Rojahn, C.; Scawthorn, C.; Anagnos, T.; Wong, K.; Poland, C.D. Rapid Visual Screening of Buildings for Potential Seismic Hazards, Handbook, FEMA 154; CreateSpace Independent Publishing Platform: Redwood City, CA, USA, 2002. [Google Scholar]
- FEMA. FEMA 178—NEHRP Handbook for the Seismic Evaluation of Existing Buildings; FEMA: Washington, DC, USA, 1992.
- Kircher, C.A.; Whitman, R.V.; Holmes, W.T. HAZUS Earthquake Loss Estimation Methods. Nat. Hazards 2006, 7, 45–59. [Google Scholar] [CrossRef]
- Jaiswal, K.; Wald, D.; Porter, K. A global building inventory for earthquake loss estimation and risk management. Earthq. Spectra 2010, 26, 731–748. [Google Scholar] [CrossRef]
- Pitilakis, K.; Franchin, P.; Khazai, B.; Wenzel, H. SYNER-G: Systemic seismic vulnerability and risk assessment of complex urban, utility, lifeline systems and critical facilities: Methodology and Applications. In Geotechnical, Geological and Earthquake Engineering; Springer: Berlin/Heidelberg, Germany, 2014; Volume 31, ISBN 9789401788342. [Google Scholar]
- World Housing Encyclopedia (WHE). Available online: https://www.world-housing.net (accessed on 15 December 2021).
- Brzev, S.; Scawthorn, C.; Charleson, A.W.; Allen, L.; Greene, M.; Jaiswal, K.; Silva, V. GEM Building Taxonomy Version 2.0. GEM Tech. Rep. 2013, 2, 188. [Google Scholar] [CrossRef]
- Riga, E.; Fotopoulou, S.; Karatzetzou, A.; Apostolaki, S.; Ntafloukas, K.; Pitilakis, K. Towards the development of a seismic risk model for greece. In Proceedings of the International Conference on Natural Hazards and Infrastructure, Chania, Greece, 23–16 June 2019. [Google Scholar]
- Ferreira, T.M.; Rodrigues, H.; Vicente, R. Seismic vulnerability assessment of existing reinforced concrete buildings in urban centers. Sustainability 2020, 12, 1996. [Google Scholar] [CrossRef] [Green Version]
- Salazar, L.G.F.; Ferreira, T.M. Seismic vulnerability assessment of historic constructions in the downtown of Mexico City. Sustainability 2020, 12, 1276. [Google Scholar] [CrossRef] [Green Version]
- Wieland, M.; Pittore, M.; Parolai, S.; Begaliev, U.; Yasunov, P.; Tyagunov, S.; Moldobekov, B.; Saidiy, S.; Ilyasov, I.; Abakanov, T. A multiscale exposure model for seismic risk assessment in Central Asia. Seismol. Res. Lett. 2015, 86, 210–222. [Google Scholar] [CrossRef] [Green Version]
- Dolce, M.; Prota, A.; Borzi, B.; da Porto, F.; Lagomarsino, S.; Magenes, G.; Moroni, C.; Penna, A.; Polese, M.; Speranza, E.; et al. Seismic Risk Assessment of Residential Buildings in Italy; Springer: Amsterdam, The Netherlands, 2021; Volume 19, ISBN 0123456789. [Google Scholar]
- Kechidi, S.; Abarca, A.; Marques, M.; Castro, J.M.; Monteiro, R. On the seismic risk assessment of the residential buildings in Northern Algeria. In Proceedings of the 12th Canadian Conference on Earthquake Engineering, Quebec City, QC, Canada, 17–20 June 2019; pp. 1–8. [Google Scholar]
- Silva, V.; Crowley, H.; Varum, H.; Pinho, R.; Sousa, L. Investigation of the characteristics of Portuguese regular moment-frame RC buildings and development of a vulnerability model. Bull. Earthq. Eng. 2015, 13, 1455–1490. [Google Scholar] [CrossRef]
- Vicente, R.; Ferreira, T.M.; Maio, R. Seismic risk mitigation of old urban centres: Characterizationand seismic vulnerability assessment of the Ribeirinha neighborhood of Faro, Portugal. Territorium 2015, 22, 283–290. [Google Scholar] [CrossRef] [Green Version]
- Furtado, A.; Costa, C.; Arêde, A.; Rodrigues, H. Geometric characterisation of Portuguese RC buildings with masonry infill walls. Eur. J. Environ. Civ. Eng. 2015, 20, 396–411. [Google Scholar] [CrossRef]
- Bal, I.E.; Crowley, H.; Pinho, R.; Gülay, F.G. Detailed assessment of structural characteristics of Turkish RC building stock for loss assessment models. Soil Dyn. Earthq. Eng. 2008, 28, 914–932. [Google Scholar] [CrossRef]
- Meral, E. Evaluation of Structural Properties of Existing Turkish RC Building Stock. Iran. J. Sci. Technol.—Trans. Civ. Eng. 2019, 43, 445–462. [Google Scholar] [CrossRef]
- Ozmen, H.B.; Inel, M.; Senel, S.M.; Kayhan, A.H. Load carrying system characteristics of existing turkish rc building stock. Int. J. Civ. Eng. 2015, 13, 76–91. [Google Scholar] [CrossRef]
- Rodrigues, H.; Sousa, R.; Vitorino, H.; Batalha, N.; Varum, H.; Fernandes, P. Characterisation of Portuguese RC Precast Industrial Building Stock. Adv. Civ. Eng. 2020, 2020, 7517205. [Google Scholar] [CrossRef]
- Arquivo Municipal de Lisboa Obra n 33461—Folha 23. In Process. 25114-DAG-PG-1959; Lisbon Municipial Archive: Lisboa, Portugal, 1959.
- Appleton, J. The Seismic Mega-Earthquakes in the XXI Century or the Seismic Vulnerability of Lisbon Constructions. In Reducing the Seismic Vulnerability of the Building Stock; SPES, GECo: Lisbon, Portugal, 2001. [Google Scholar]
- Celarec, D.; Ricci, P.; Dolšek, M. The sensitivity of seismic response parameters to the uncertain modelling variables of masonry-infilled reinforced concrete frames. Eng. Struct. 2012, 35, 165–177. [Google Scholar] [CrossRef]
- Mucedero, G.; Perrone, D.; Monteiro, R. Nonlinear static characterisation of masonry-infilled RC building portfolios accounting for variability of infill properties. Bull. Earthq. Eng. 2021, 19, 2597–2641. [Google Scholar]
- Verderame, G.M.; de Luca, F.; Ricci, P.; Manfredi, G. Preliminary analysis of a soft-storey mechanism after the 2009 L’Aquila earthquake. Earthq. Eng. Struct. Dyn. 2011, 40, 925–944. [Google Scholar] [CrossRef] [Green Version]
- Ruiz-Pinilla, J.G.; Adam, J.M.; Pérez-Cárcel, R.; Yuste, J.; Moragues, J.J. Learning from RC building structures damaged by the earthquake in Lorca, Spain, in 2011. Eng. Fail. Anal. 2016, 68, 76–86. [Google Scholar] [CrossRef]
- REBAP. Regulamento de Estruturas de Betão Armado e Pré-Esforçado. Decreto-Lei n.o 349-C/83 de 30 de Julho; Diário da República: Lisbon, Portugal, 1983. [Google Scholar]
- Instituto Nacional de Estatística. Censos 2011 Resultados Definitivos; Instituto Nacional de Estatística: Lisboa, Portugal, 2012; Volume 26.
- JFA História da Freguesia. Available online: https://www.jf-alvalade.pt/alvalade/historia/ (accessed on 20 December 2021).
- Santos, J. Espaços de Mediação Infraestrutural: Interpretação e Projeto Na produção do Urbano no Território Metropolitano de Lisboa”, Prémio Metrópoles Ciência 2016; Faculdade de Arquitectura de Lisboa: Lisboa, Portugal, 2016. [Google Scholar]
- JFB História da Freguesia. Available online: https://www.jf-benfica.pt/freguesia/junta-de-freguesia/ (accessed on 20 December 2021).
- AML Área Metropolitana de Lisboa—Atas do Seminário “Área Metropolitana de Lisboa-Ambiente Urbano e Riscos”; AML: Lisbon, Portugal, 2013.
- Kohrangi, M.; Bazzurro, P.; Vamvatsikos, D. Seismic risk and loss estimation for the building stock in Isfahan. Part I: Exposure and vulnerability. Bull. Earthq. Eng. 2021, 19, 1709–1737. [Google Scholar] [CrossRef]
- Pittore, M.; Haas, M.; Megalooikonomou, K.G. Risk-oriented, bottom-up modeling of building portfolios with faceted taxonomies. Front. Built Environ. 2018, 4, 41. [Google Scholar] [CrossRef]
- Tzitzikas, Y. Faceted Taxonomy-Based Sources; Springer: Heidelberg, Germany, 2009. [Google Scholar]
- Roeslin, S.; Ma, Q.T.M.; García, H.J. Damage assessment on buildings following the 19th september 2017 puebla, Mexico earthquake. Front. Built Environ. 2018, 4, 72. [Google Scholar] [CrossRef]
- Allen, L.; Brzev, S.; Charleson, A.W.; Scawthorn, C.; Silva, V. GEM Building Taxonomy—An open global building classification system. In Proceedings of the New Zealand Society for Earthquake Engineering Technical Conference & AGM, Rotorua, New Zealand, 10–12 April 2015. [Google Scholar]
- Crowley, H.; Despotaki, V.; Silva, V.; Pitilakis, D.; Pitilakis, K.; Rodrigues, D.; Pitilakis, K.; Pitilakis, D.; Hancilar, U.; Bursi, O.; et al. D26.1 Taxonomy of European Residential, Commercial, Industrial Buildings and Industrial Plants. 2017. Available online: DOCUMENTS/DELIVERABLES/SERA_D26.1_Taxonomy_Buildings_Industry (accessed on 20 December 2021).
- Martins, L.; Silva, V. Development of a fragility and vulnerability model for global seismic risk analyses. Bull. Earthq. Eng. 2021, 19, 6719–6745. [Google Scholar] [CrossRef]
- Grigoratos, I.; Monteiro, R.; Ceresa, P.; Di Meo, A.; Faravelli, M.; Borzi, B. Seismic Vulnerability Assessment of the Urban Building Environment in Nablus—Palestine. Int. J. Archit. Herit. 2018, 12, 1196–1215. [Google Scholar]
- Kechidi, S.; Castro, J.M.; Monteiro, R.; Marques, M.; Yelles, K.; Bourahla, N.; Hamdache, M. Development of Exposure Datasets for Earthquake Damage and Risk Modelling: The Case Study of Northern Algeria; Springer: Amsterdam, The Netherlands, 2021; Volume 19. [Google Scholar]
- De Sousa, R.R.; Costa, A.C.; Costa, A.G. Metodologia Para a Avaliação da Segurança Sísmica de Edifícios Existentes Baseada em Análises de Fiabilidade Estrutural; LNEC: Lisbon, Portugal, 2019. [Google Scholar]
- CEN. NP EN 1998-3: Eurocódigo 8—Projecto de Estruturas Para Resistência ao Sismo. Parte 3: Avaliação e Reabilitação de Edifícios; CEN: Brussels, Belgium, 2017. [Google Scholar]
- Peres, R.; Couto, R.; Sousa, I.; Castro, J.; Bento, R. Modelling and evaluation of brittle shear effects on the seismic performance and loss assessment of RC buildings. Eng. Struct. 2011, 9, 1137–1155. [Google Scholar]
- Priestley, M.J.N.; Seible, F.; Verma, R.; Xiao, Y. Seismic Shear Strength of Reinforced Concrete Columns; University of California: San Diego, CA, USA, 1993. [Google Scholar]
- Pujol, S. Drift Capacity of Reinforced Concrete Columns Subjected to Displacement Reversals; Purdue University: West Lafayette, IN, USA, 2002. [Google Scholar]
- Sezen, H. Seismic Behaviour and Modeling of Reinforced Concrete Building Columns; University of California: Berkeley, CA, USA, 2002. [Google Scholar]
- Elwood, K.; Moehle, J.P. Shake Table Tests and Analytical Studies on the Gravity Load Collapse of Reinforced Concrete Frames; University of California: Berkeley, CA, USA, 2003. [Google Scholar]
- Elwood, K.J.; Moehle, J.P. Drift capacity of reinforced concrete columns with light transverse reinforcement. Earthq. Spectra 2005, 21, 71–89. [Google Scholar] [CrossRef]
- Sezen, H.; Moehle, J. Strength and Deformation Capacity of Reinforced Concrete Columns with Limited Ductility. In Proceedings of the 13th World Conference on Earthquake Engineering, Vancouver, BC, Canada, 1–6 August 2004. [Google Scholar]
- Aslani, H.; Miranda, E. Probabilistic Earthquake Loss Estimation and Loss Disaggregation in Buildings; Stanford University: Stanford, CA, USA, 2005. [Google Scholar]
- Zhu, L.; Elwood, K.J.; Haukaas, T. Classification and Seismic Safety Evaluation of Existing Reinforced Concrete Columns. J. Struct. Eng. 2007, 133, 1316–1330. [Google Scholar] [CrossRef]
- Leborgne, M.R. Modeling the Post Shear Failure Behavior of Reinforced Concrete Columns; University of Texas: Austin, TX, USA, 2012. [Google Scholar]
- LeBorgne, M.R.; Ghannoum, W.M. Calibrated analytical element for lateral-strength degradation of reinforced concrete columns. Eng. Struct. 2014, 81, 35–48. [Google Scholar] [CrossRef]
- Wibowo, A.; Wilson, J.L.; Lam, N.T.K.; Gad, E.F. Drift performance of lightly reinforced concrete columns. Eng. Struct. 2014, 59, 522–535. [Google Scholar] [CrossRef]
- Wilson, J.L.; Lam, N.T.K.; Gad, E.F. Hazard Identification and Behaviour of Reinforced Concrete Framed Buildings in Regions of Lower Seismicity. In Proceedings of the 10th Pacific Conference on Earthquake Engineering, Sydney, Australia, 6–8 November 2015; pp. 6–8. [Google Scholar]
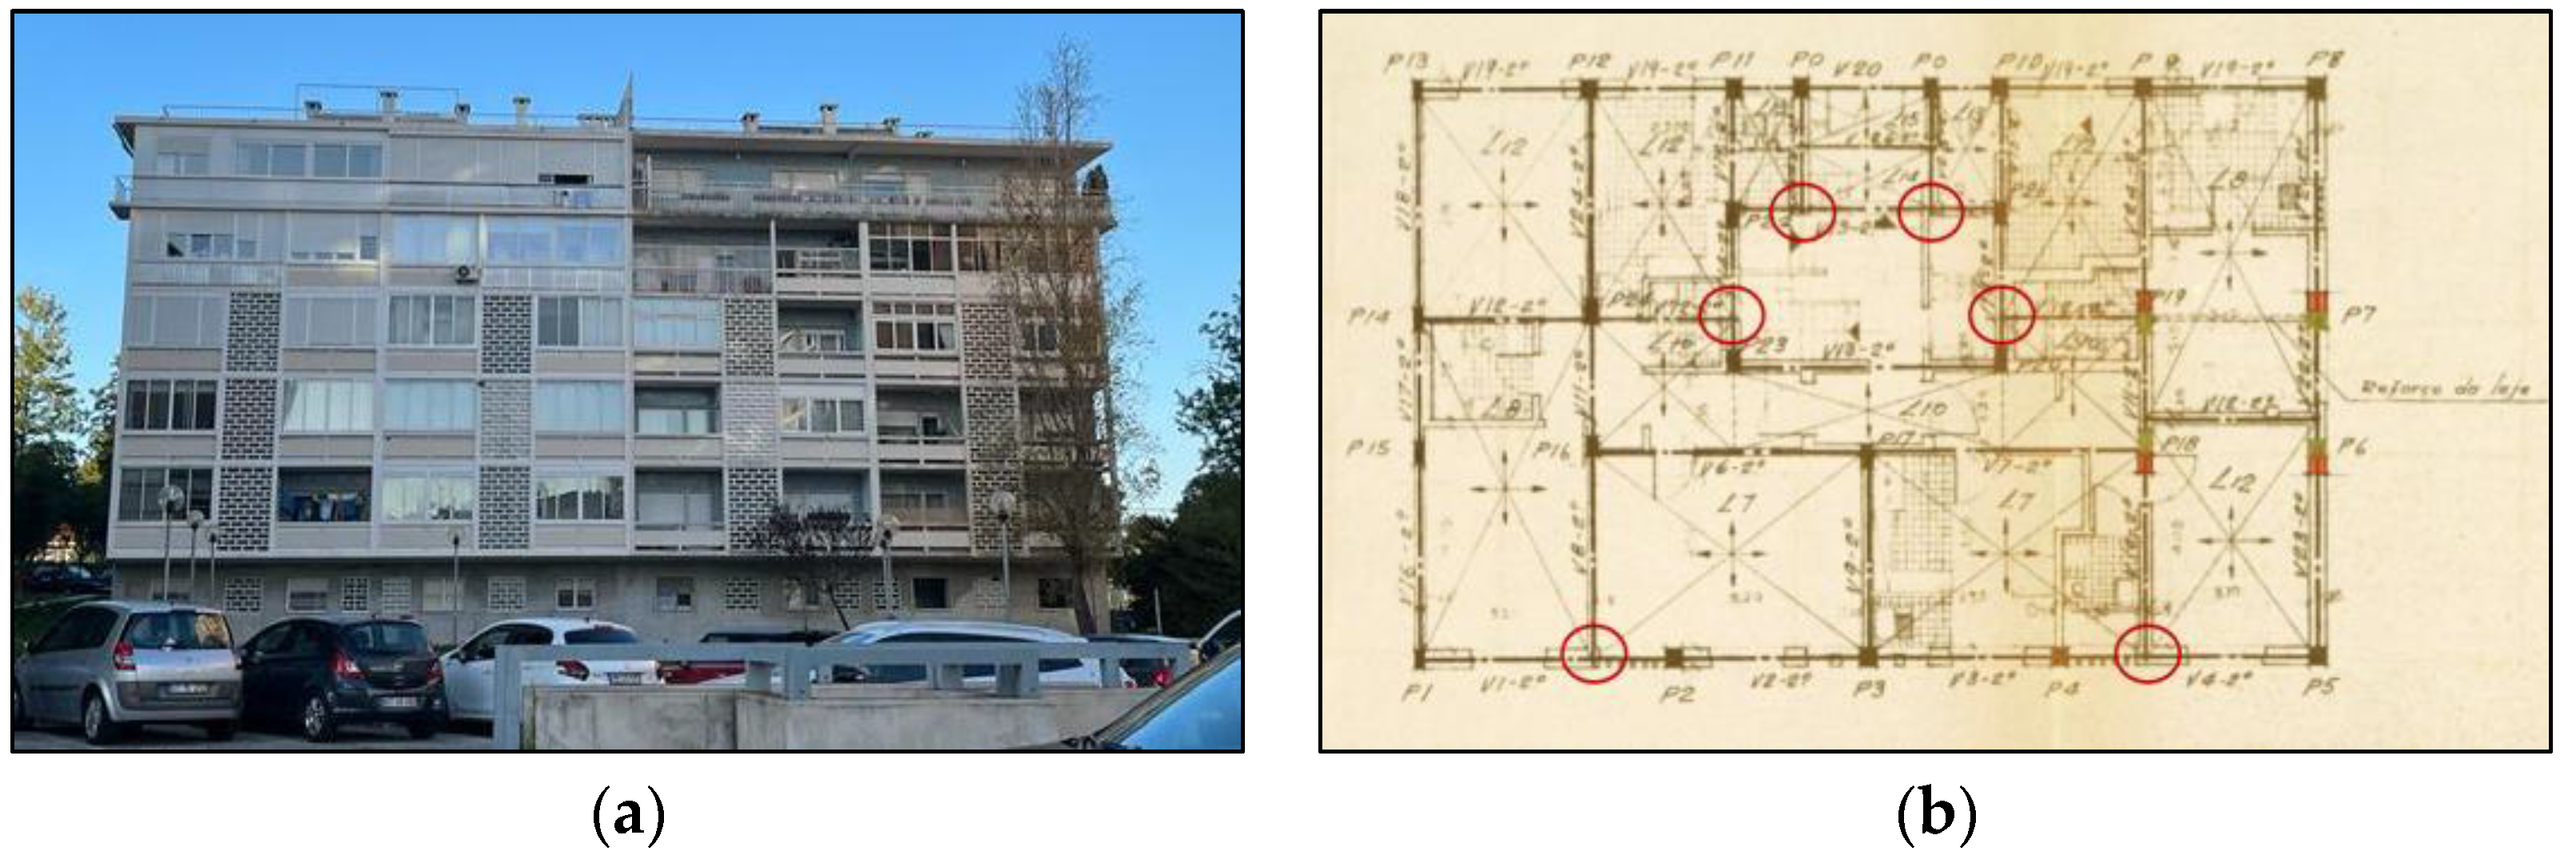
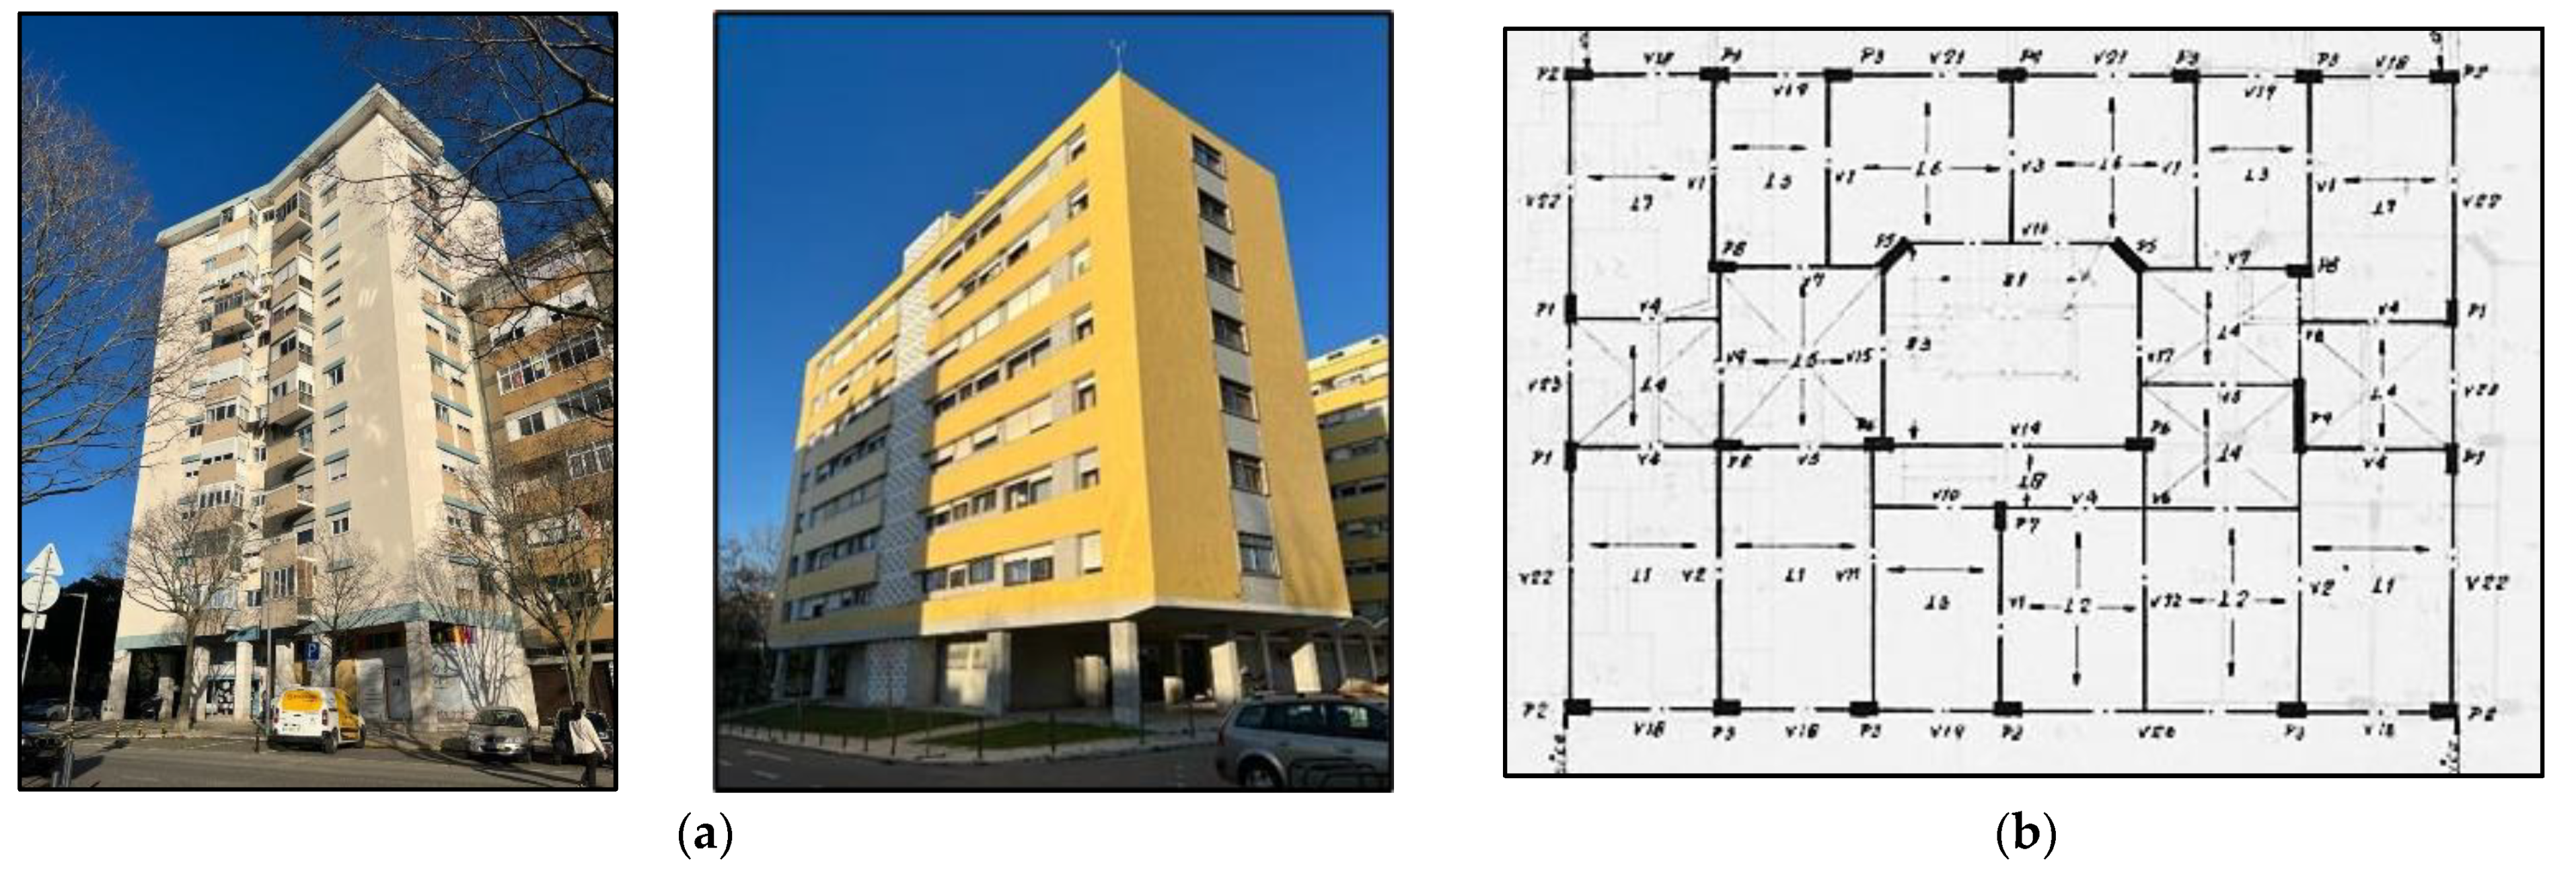
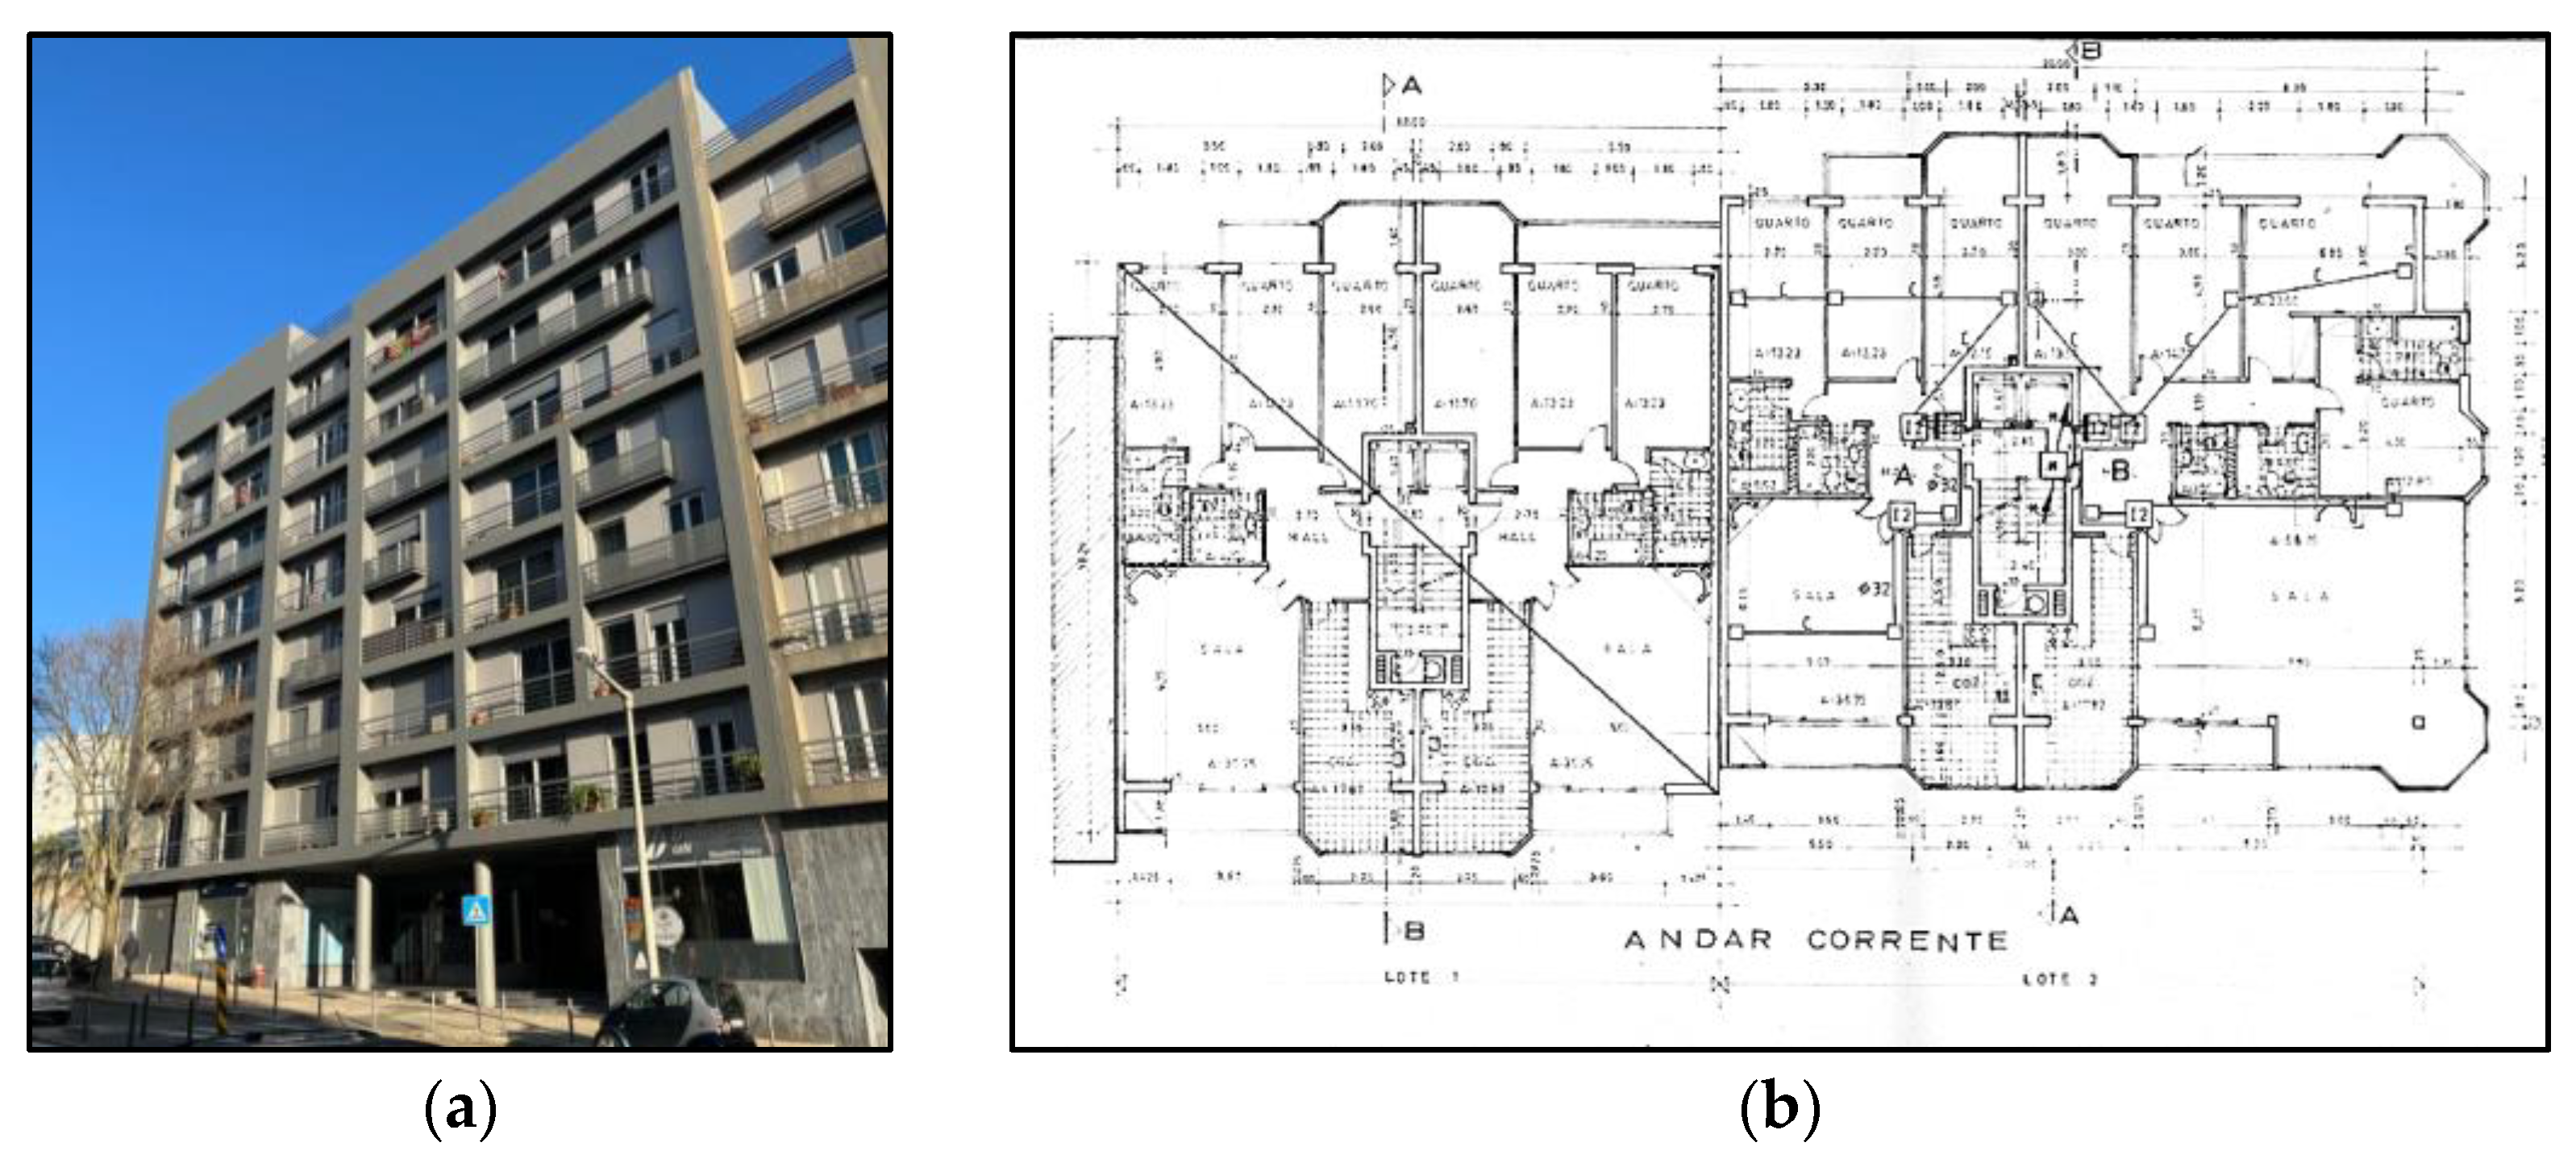


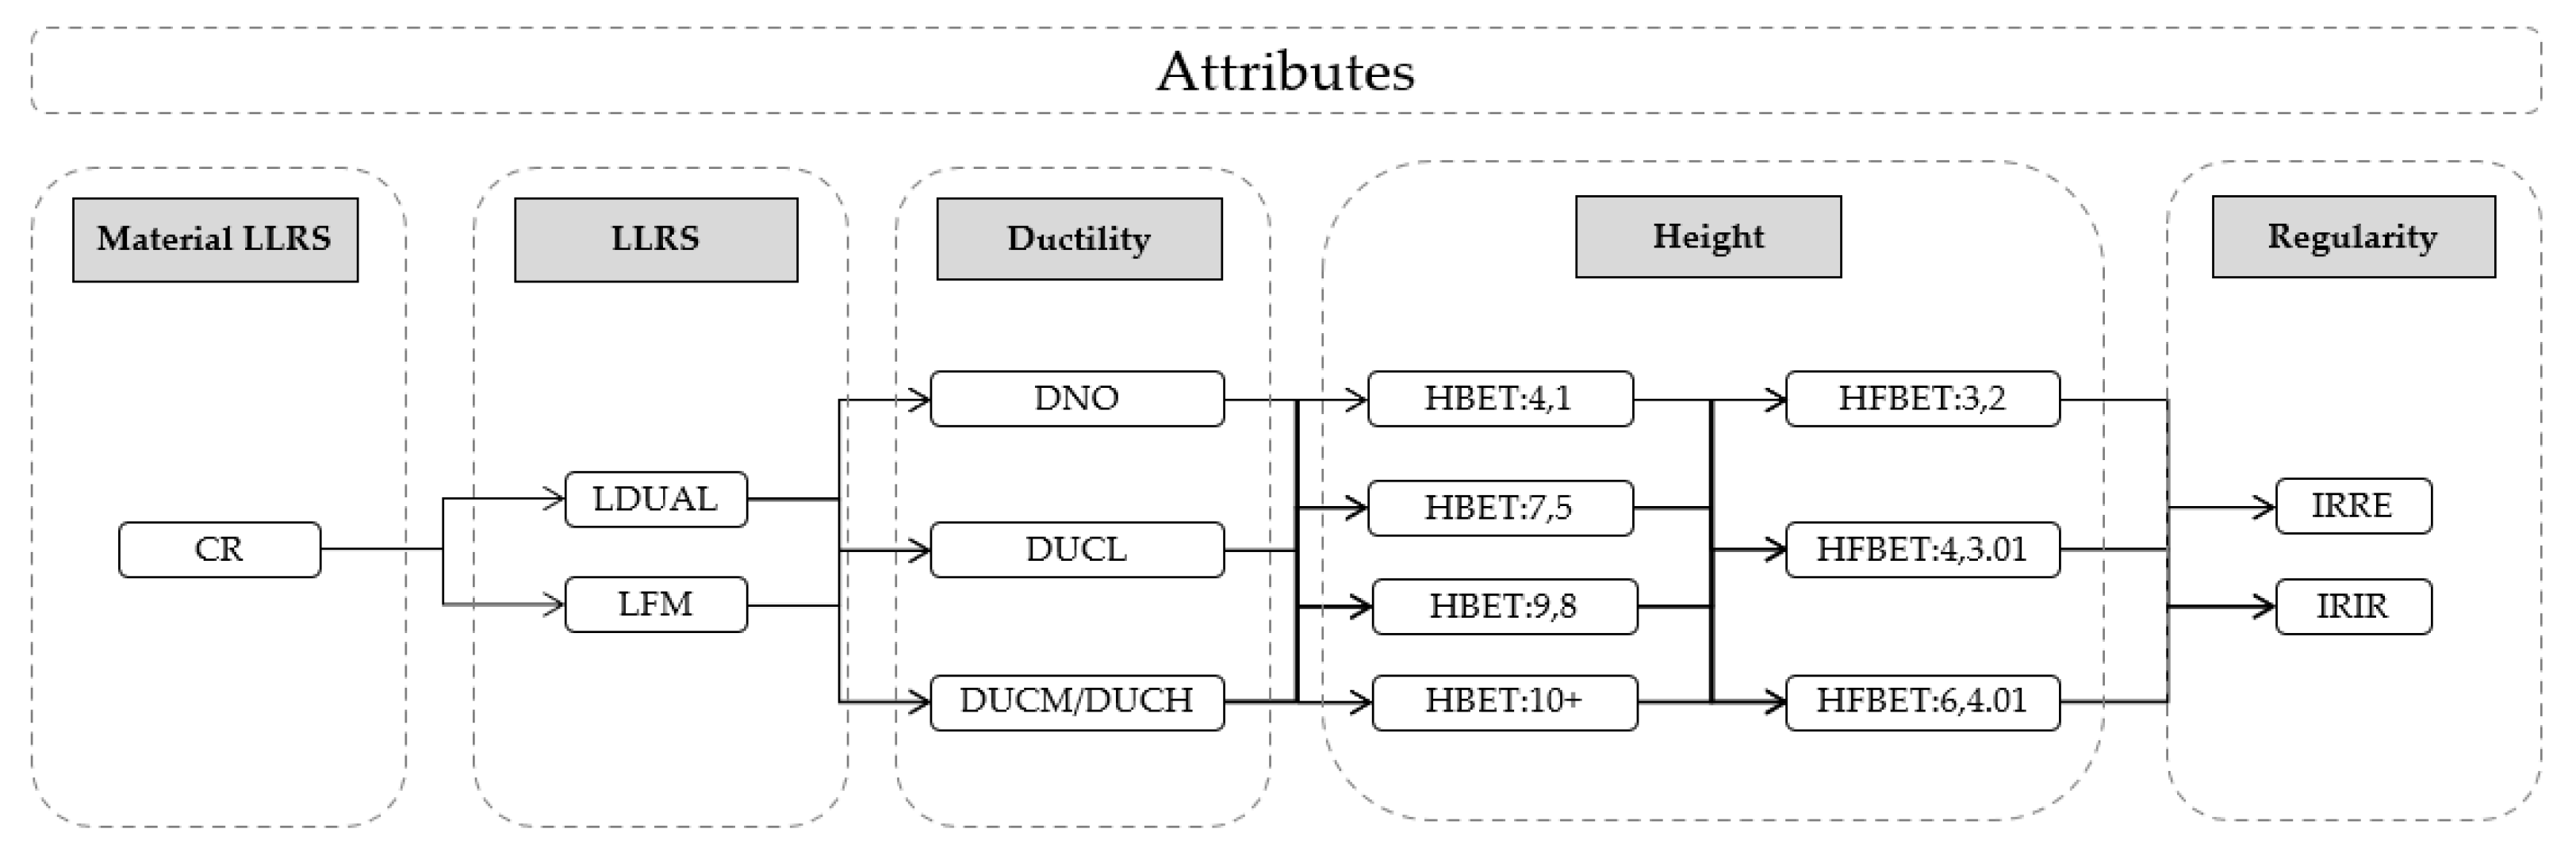


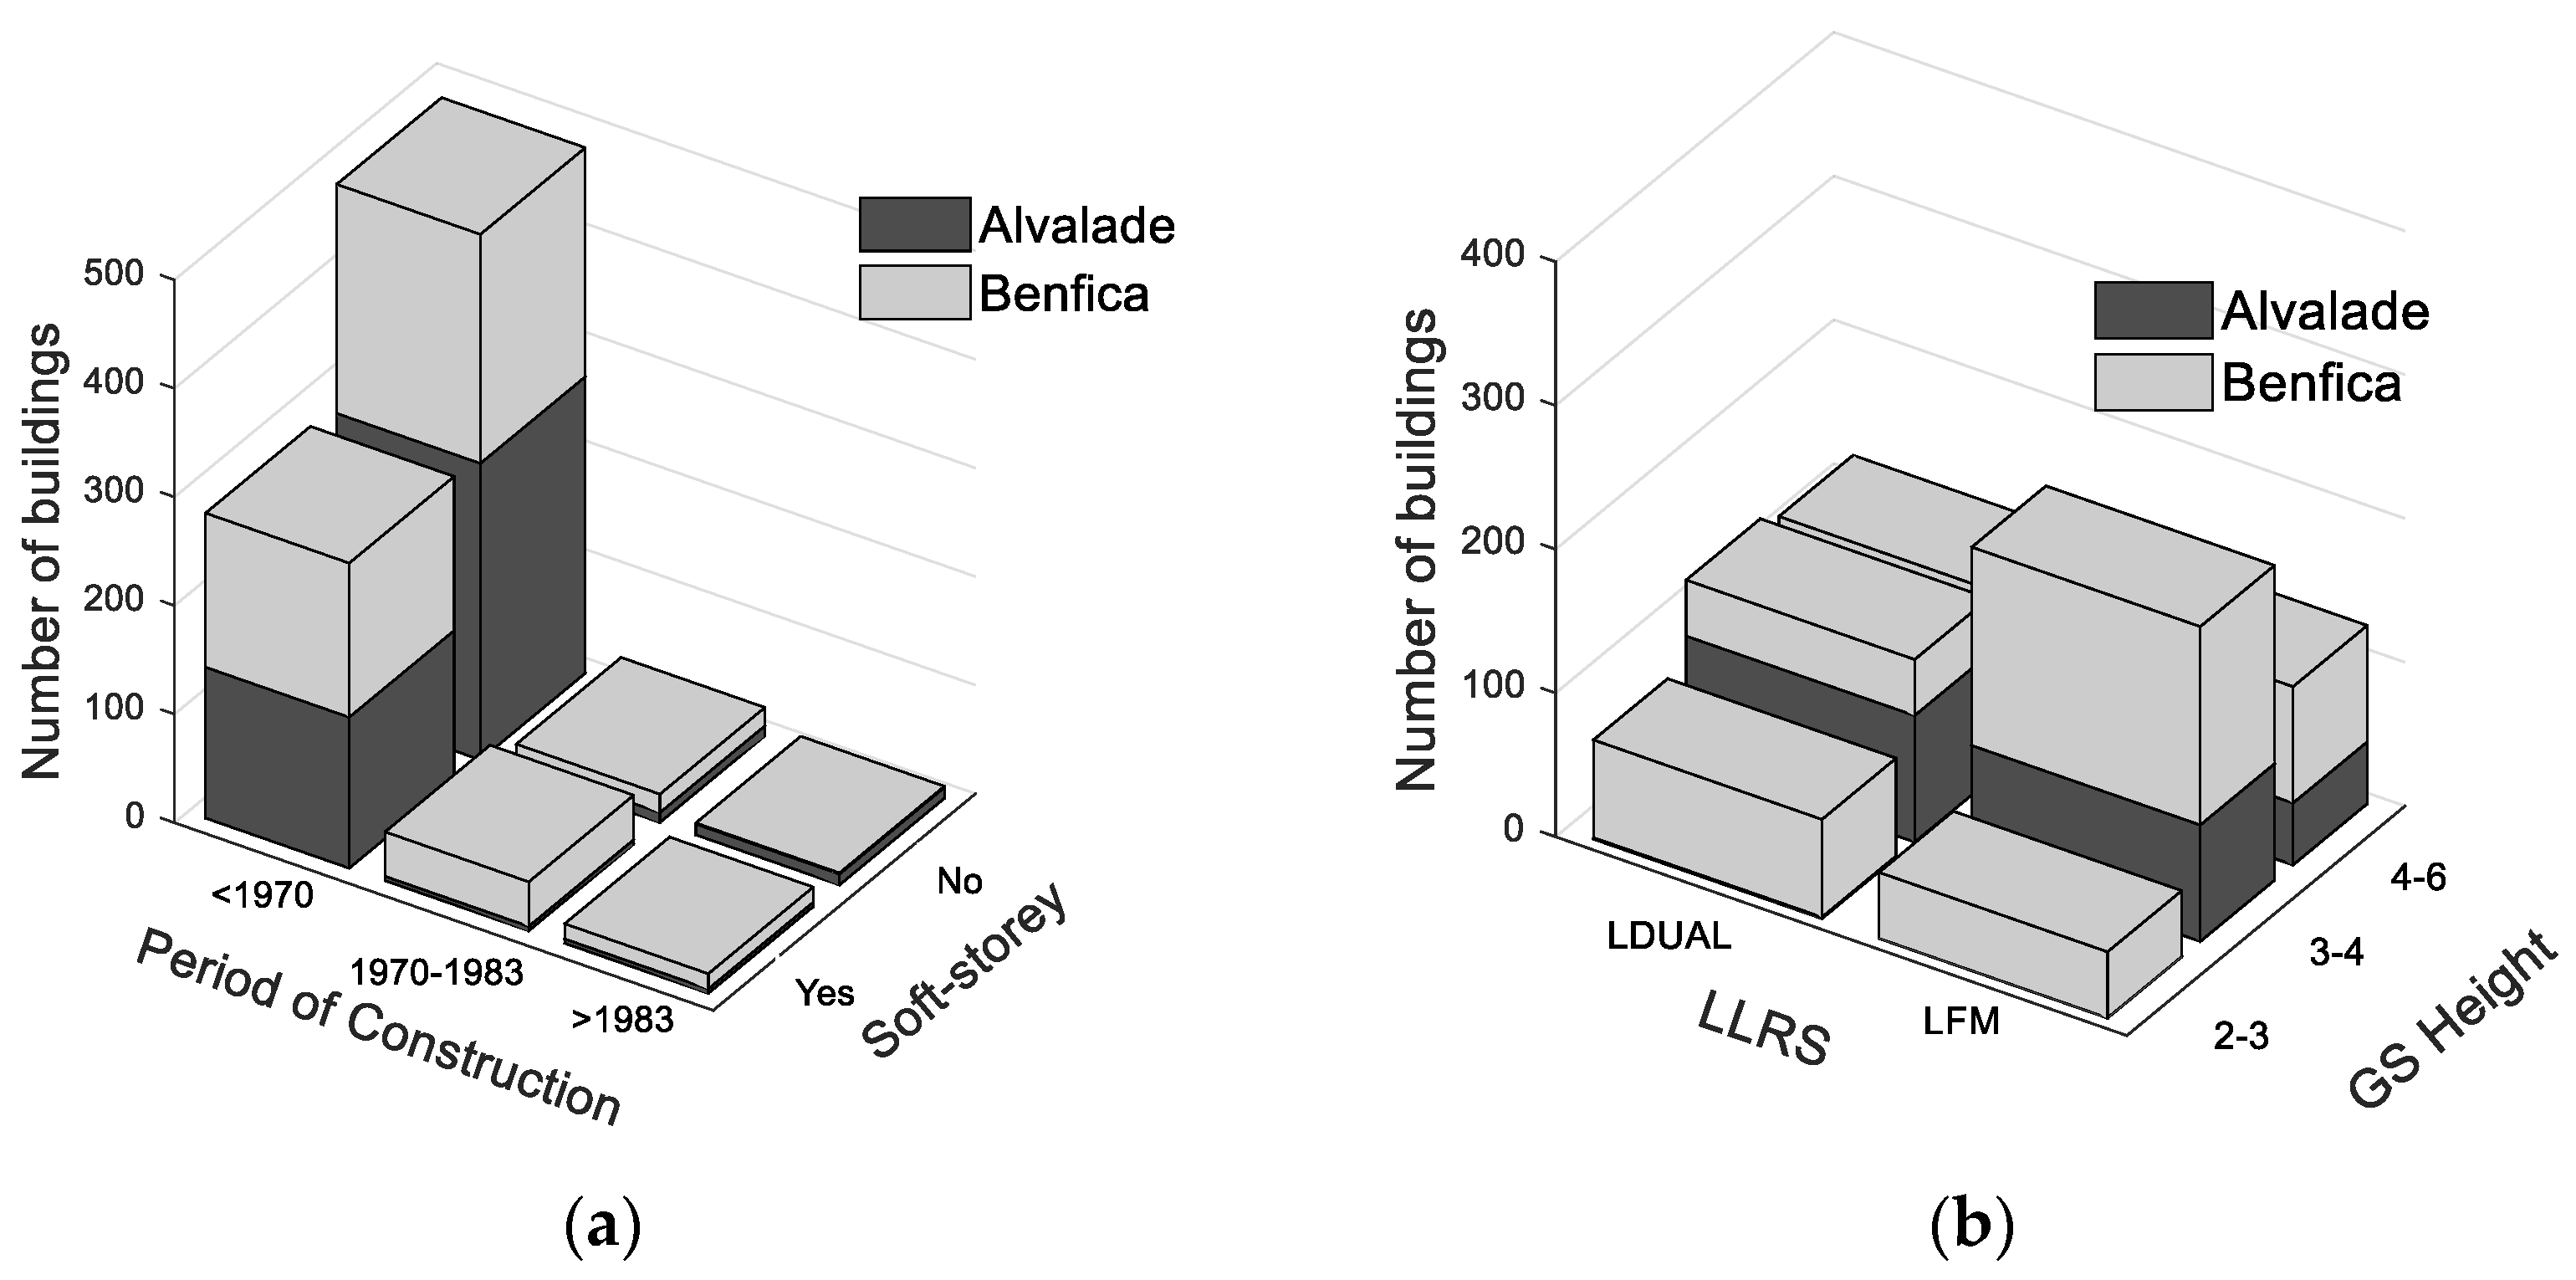
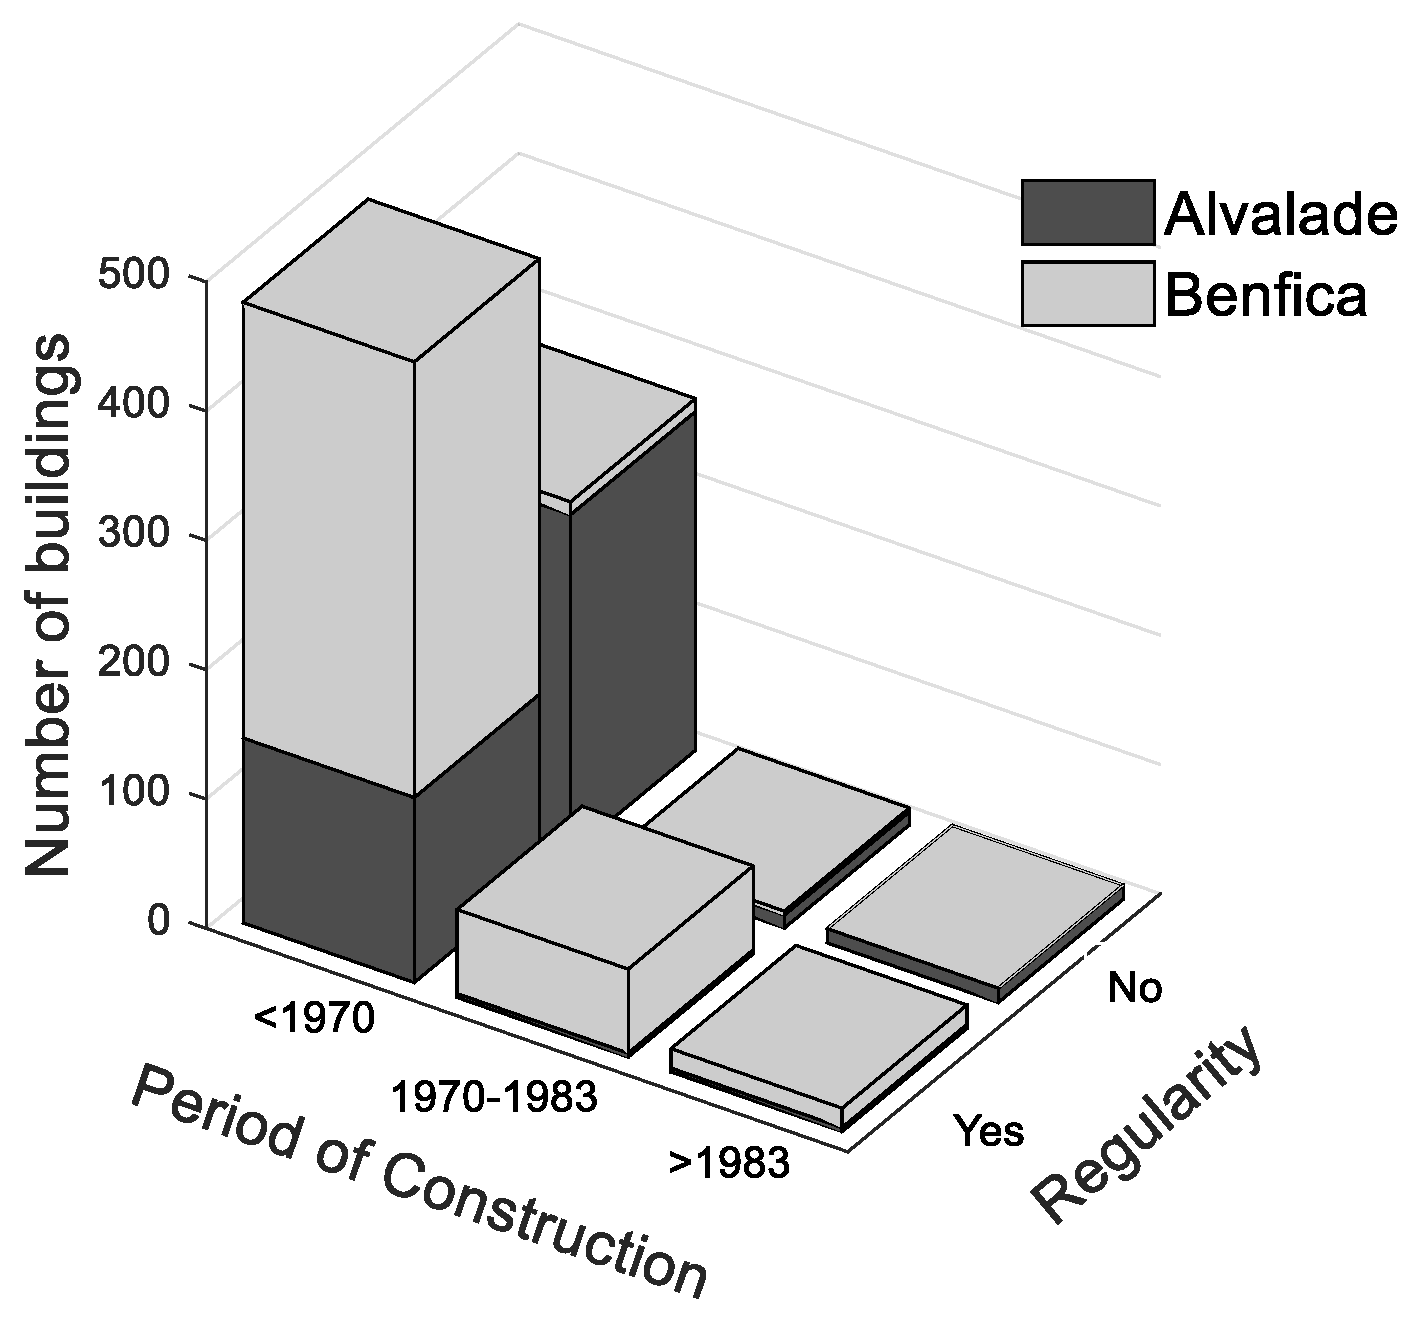


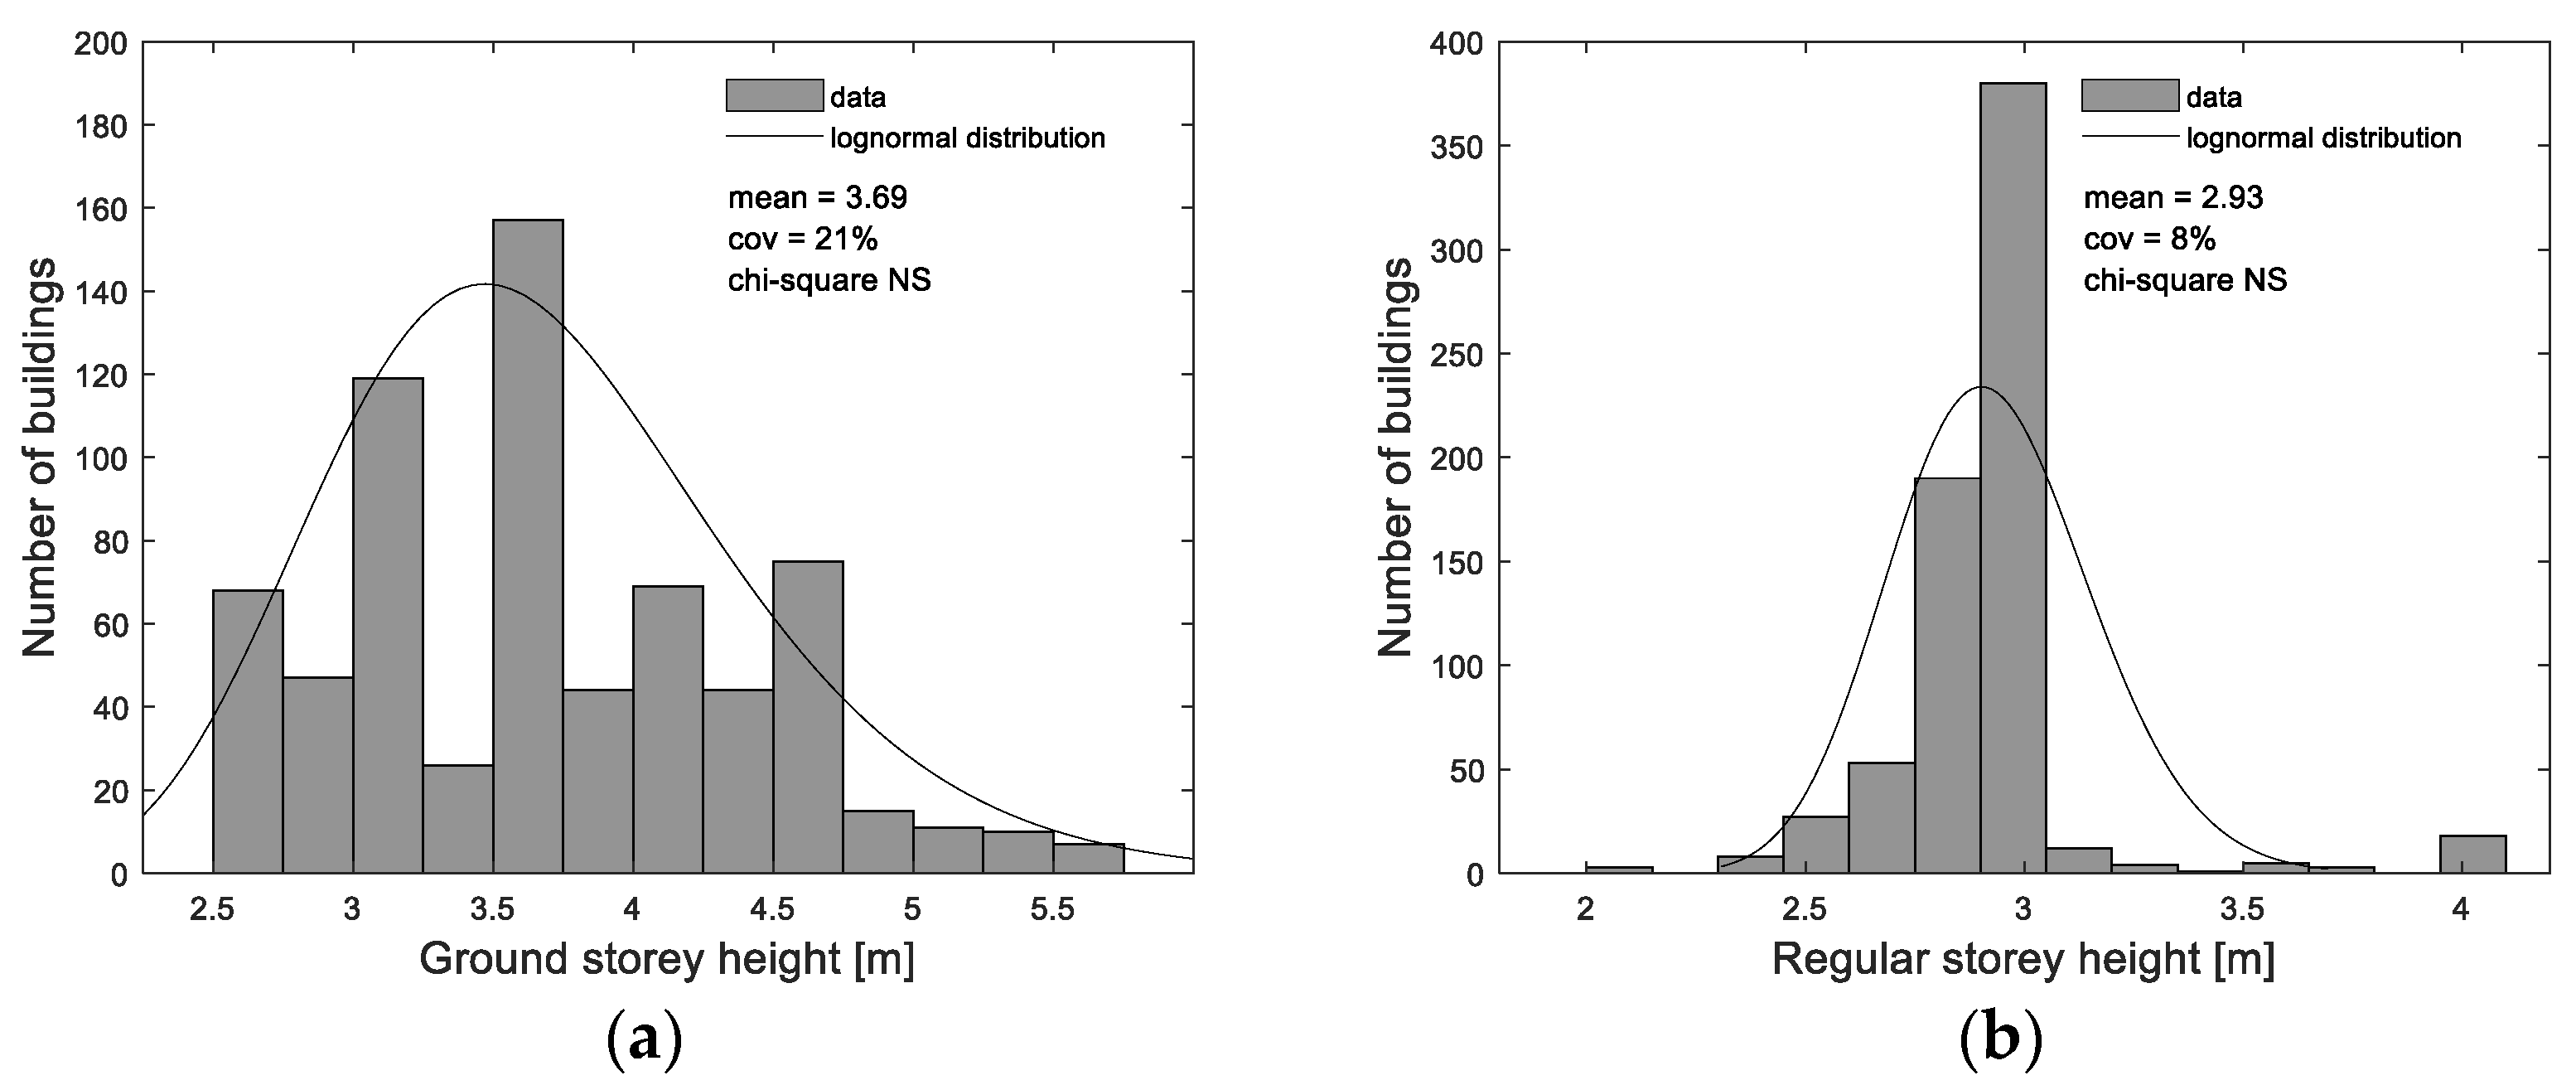

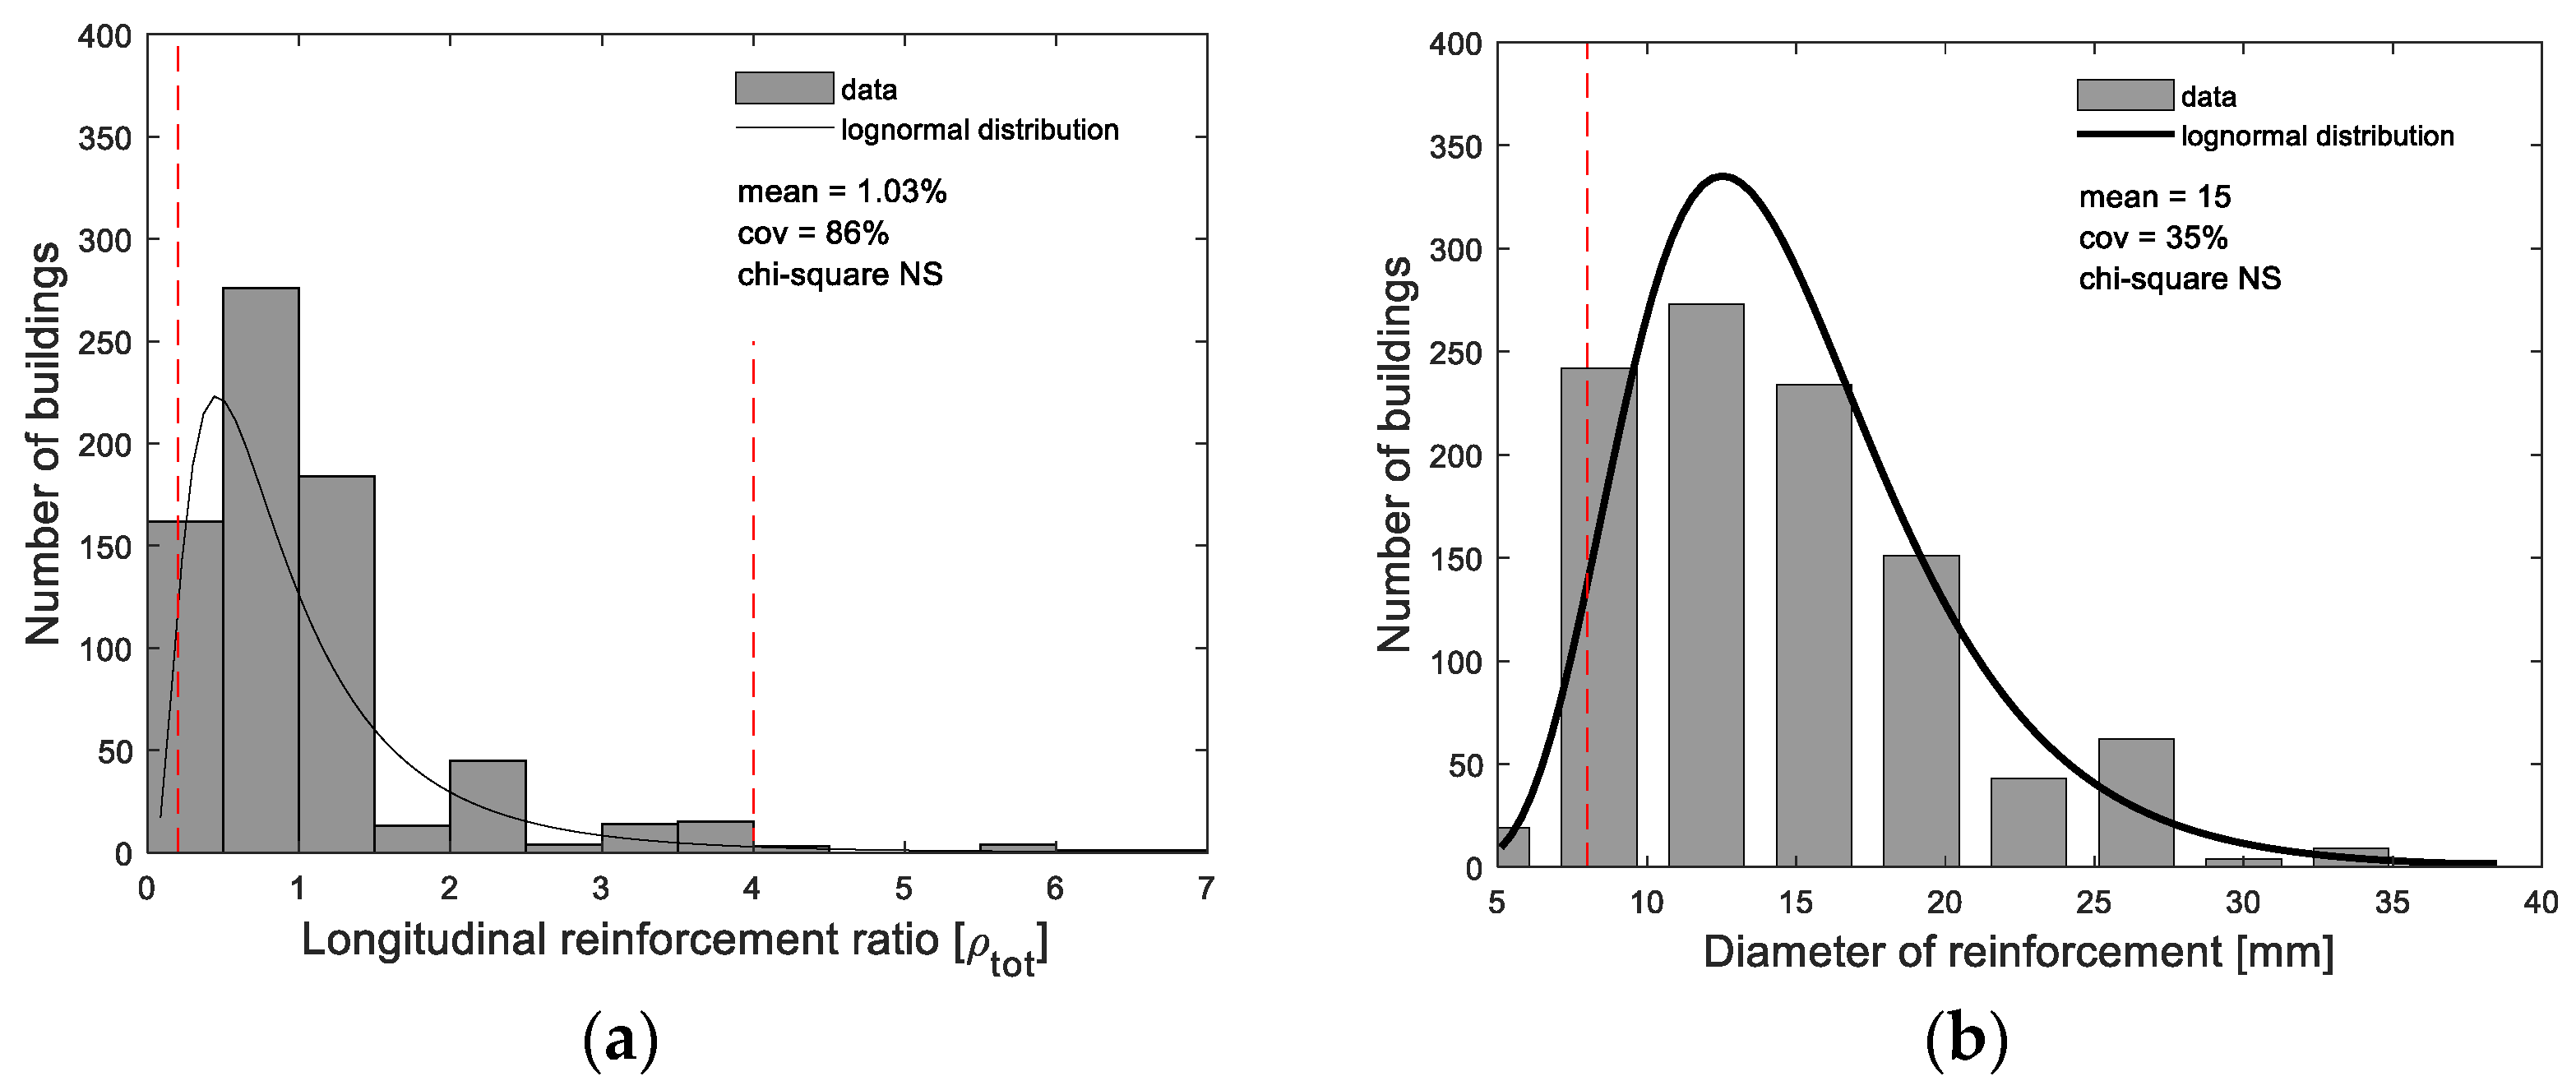
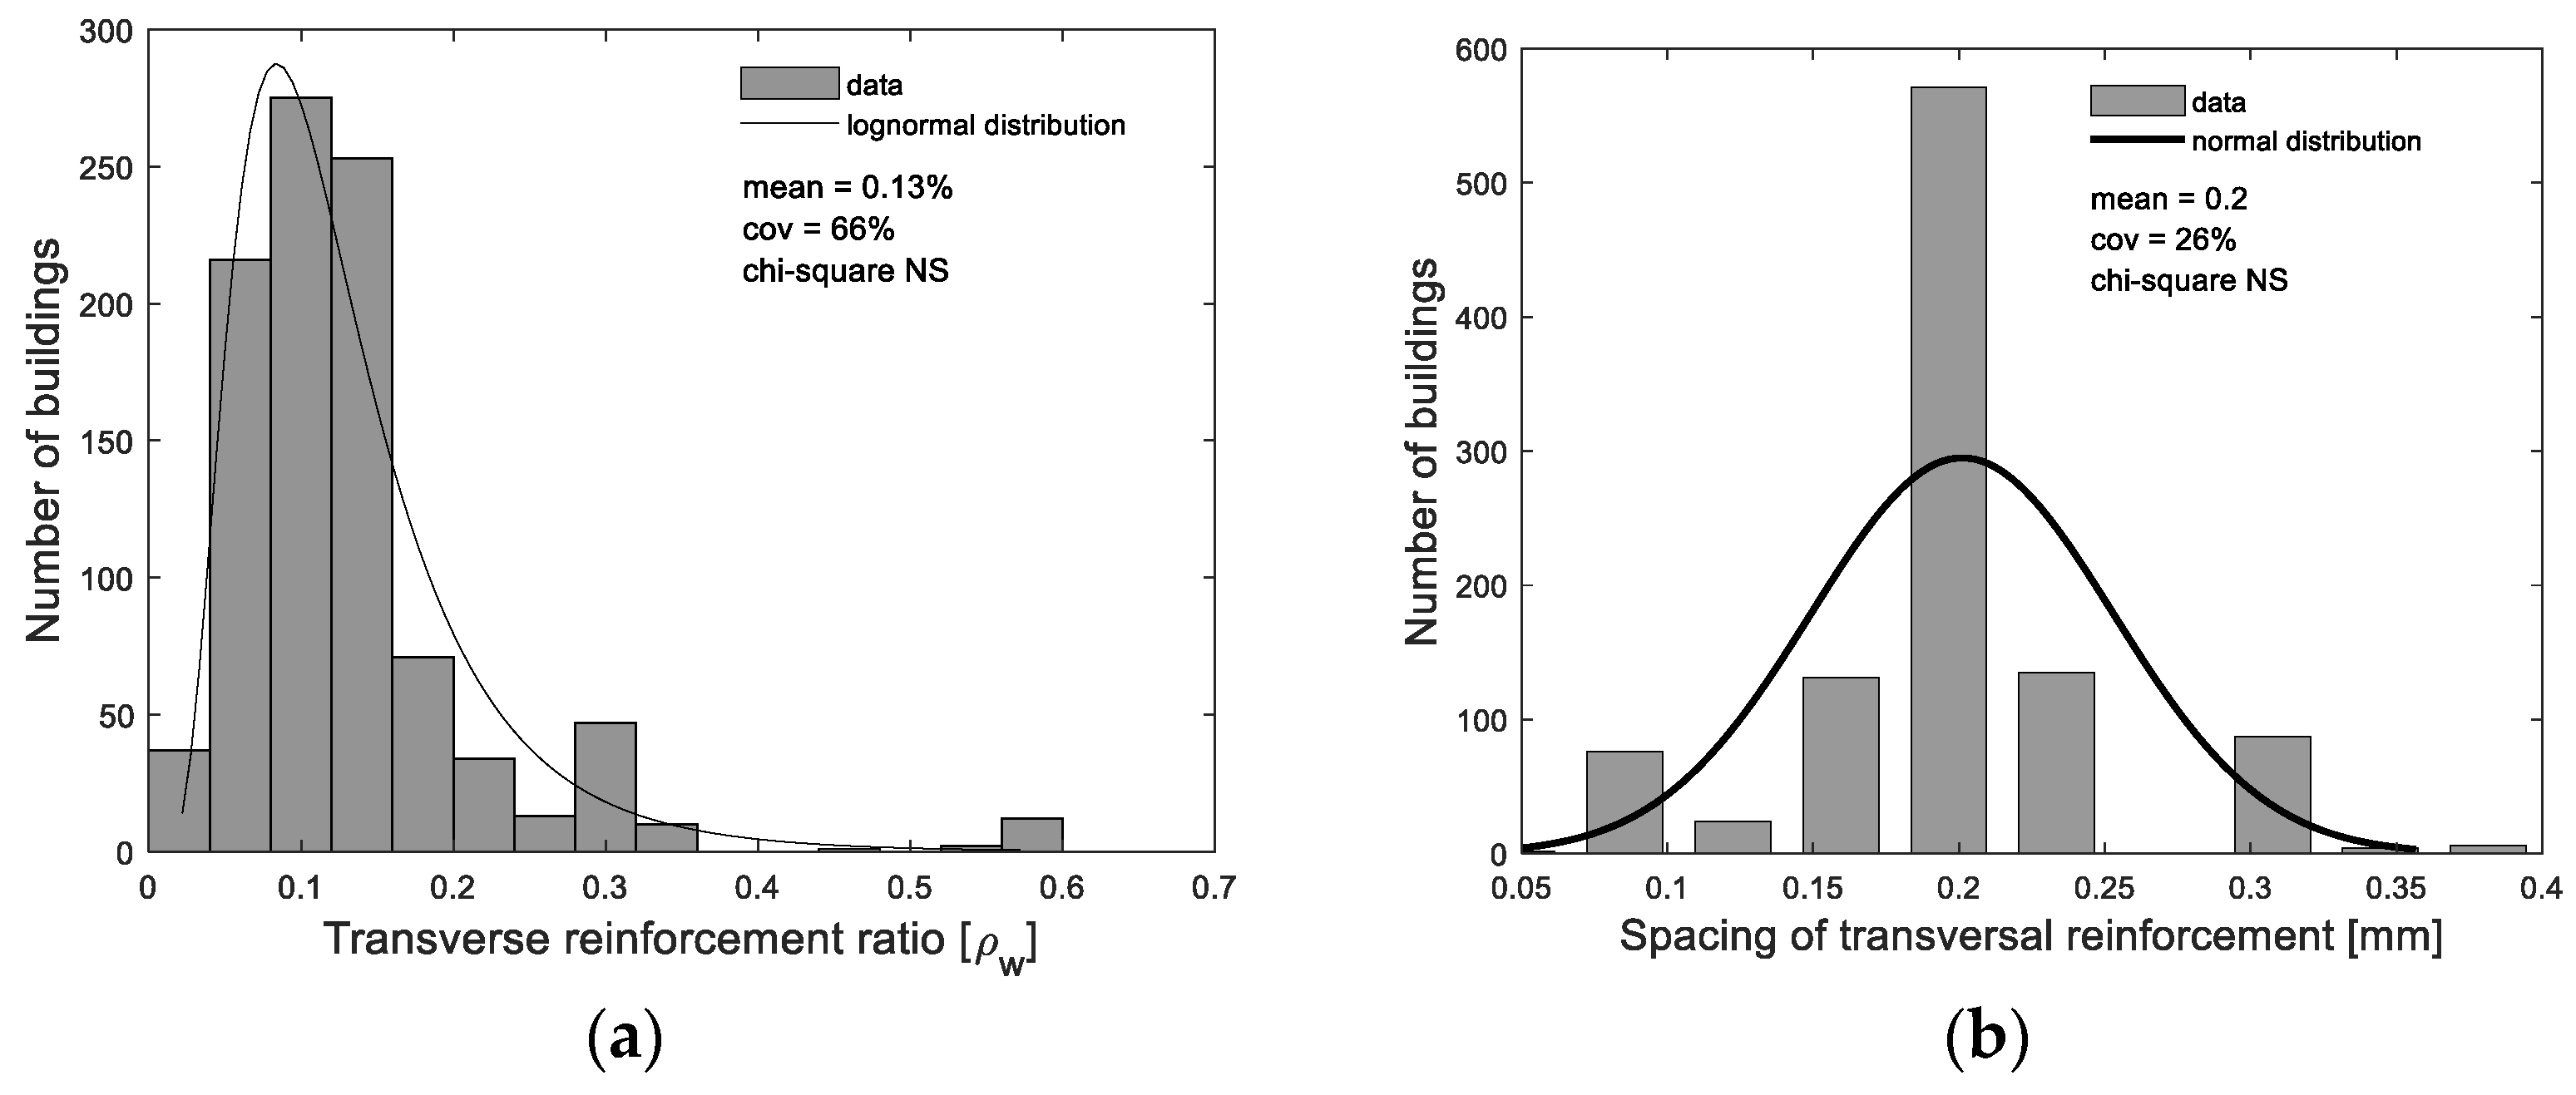
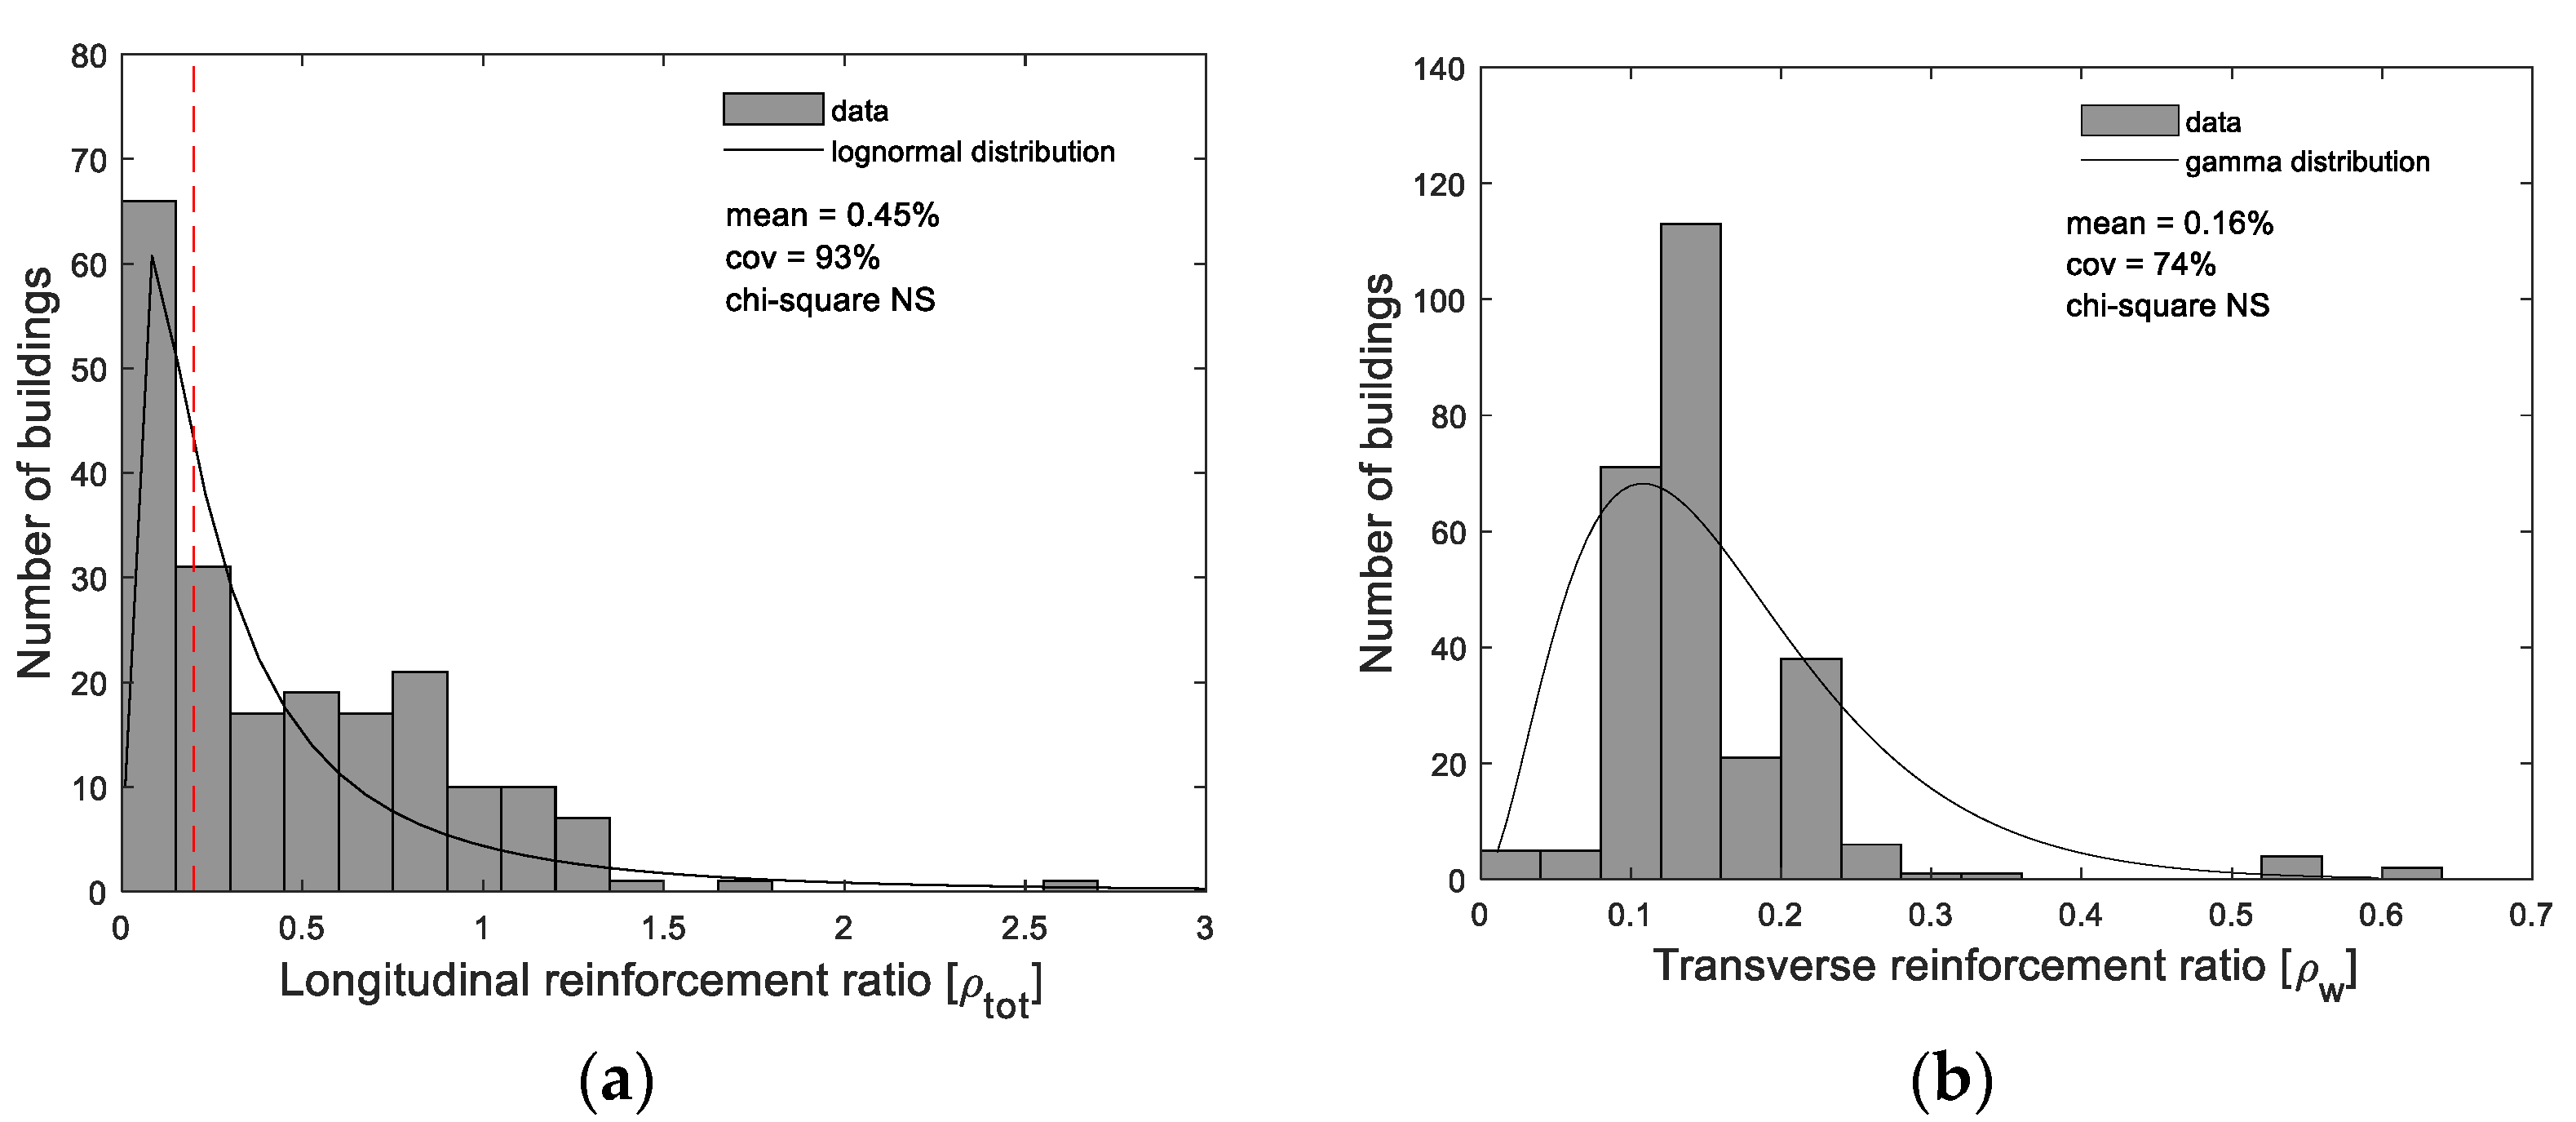

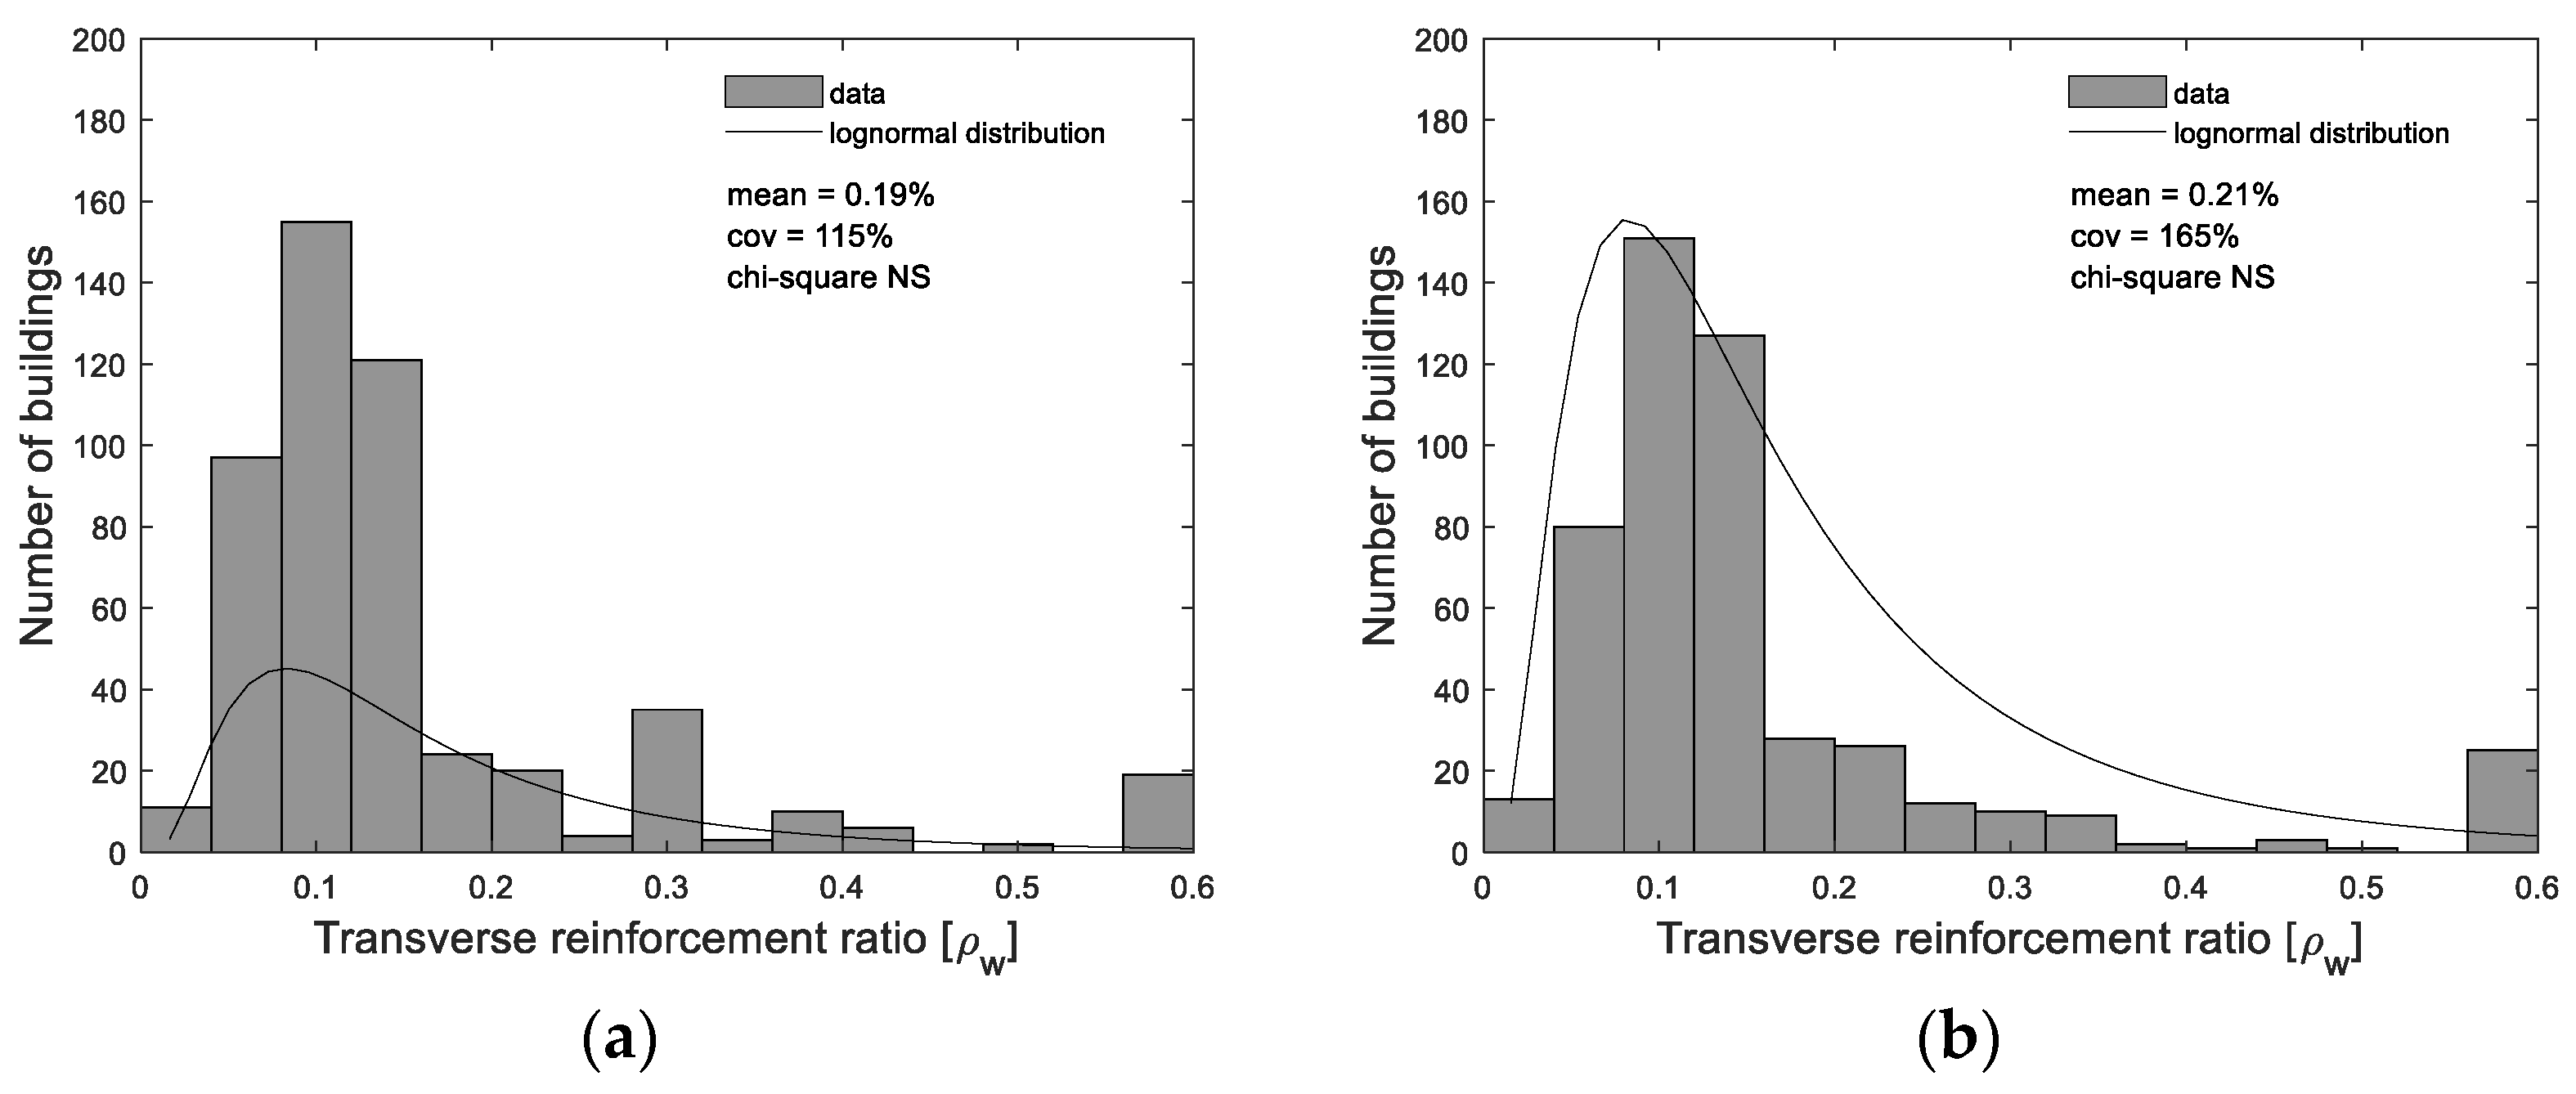
Publisher’s Note: MDPI stays neutral with regard to jurisdictional claims in published maps and institutional affiliations. |
© 2022 by the authors. Licensee MDPI, Basel, Switzerland. This article is an open access article distributed under the terms and conditions of the Creative Commons Attribution (CC BY) license (https://creativecommons.org/licenses/by/4.0/).