Article

Research on the Characteristics of High-Temperature Heat Waves and Outdoor Thermal Comfort: A Typical Space in Chongqing Yuzhong District as an Example

1
School of Architecture and Urban Planning, Chongqing University, Chongqing 400030, China
2
Key Laboratory of New Technology for Construction of Cities in Mountain Area, Chongqing 400030, China
*
Author to whom correspondence should be addressed.
Buildings 2022, 12(5), 625; https://doi.org/10.3390/buildings12050625
Submission received: 24 March 2022 / Revised: 3 May 2022 / Accepted: 5 May 2022 / Published: 9 May 2022

Abstract

:
For the high-density urban space heat wave problem, take the core urban area of the mountainous city of Chongqing as an example, four types of typical urban functional spaces, including commercial areas, residential areas, mountain parks, and riverfront parks, were measured during a heat wave cycle, and the characteristics of high-temperature heat waves in different urban spaces were compared through the analysis of air temperature, surface temperature, relative humidity, solar thermal radiation, and other thermal environment parameters. Combined with the questionnaire research related to the heat comfort of the urban population, the physiological equivalent temperature (PET) was selected to describe the heat sensation of the human body, to summarize the elements and patterns of the influence of heat waves on heat comfort of the population in urban spaces, and to establish a prediction model of outdoor heat comfort in summer. It shows that: (1) temperatures recorded during the heat waves are influenced by urban space elements and are differentiated, with older residential areas recording the highest temperatures, followed by commercial areas, and green park areas comparing favorably with both; (2) crowd thermal comfort is correlated with the thermal environment formed by space elements, PET is significantly positively correlated with air temperature, thermal radiation and surface temperature, and significantly negatively correlated with relative humidity, air temperature and thermal radiation have more influence on thermal comfort has a greater impact, while relative humidity and surface temperature have a relatively small impact; (3) reasonable spatial form and shade planning, vegetation and water body settings, high thermal storage substrate and other design elements can alleviate high-temperature heat waves, reduce the thermal neutral temperature and improve thermal comfort. The research results provide some basis for the investigation of the formation mechanism of high-temperature heat waves in mountainous cities and the optimal design of urban spatial thermal environment.

1. Introduction

The IPCC assessment reports, especially the Fifth Assessment Report (AR5), have proven that there is no doubt about the warming of the climate system [1,2]. In the background of the current global warming, heat waves have become an important factor affecting the human environment in cities [3,4], and at the same time, the rapid urbanization process has aggravated the urban heat island effect (UHI), leading to the frequent occurrence of extreme weather phenomena. The World Meteorological Organization defines a heat wave as “a weather process in which the maximum daily temperature is higher than 32 °C and lasts for more than three days” [5]; in a slightly different way in China, the China Meteorological Administration defines a heat wave as “a high-temperature day with a maximum daily temperature ≥ 35 °C, and a high-temperature day for more than three consecutive days is a high-temperature heat wave” [6]. Some scholars analyzed the mechanism of the UHI effect from the perspective of urban space [7,8,9,10,11] and found that there is a synergistic effect between high-temperature heat waves and UHI effect [12], so it is necessary to study the distribution characteristics of high-temperature heat waves and the influencing factors of UHI from the perspective of the urban spatial thermal environment.
Urban heat waves depend not only on the characteristics of physical processes but also on urban planning methods [13]. There is a strong relationship between the UHI effect and urban configuration [14,15,16]. The wind and thermal environment of cities is influenced by the land use characteristics [17,18]. At the macroscopic scale, the urban climate map (UCmap) is now widely agreed upon and maturely applied to predict the heat island effect, such as the climate zoning proposed by Tokyo and Stuttgart [19], and in terms of studying high-temperature disaster prevention strategies from the perspective of urban planning and architectural design, some scholars have studied the construction of disaster prevention strategies, the optimal application of disaster prevention measures, and the prediction of scenario simulation. The relationship between urban sprawl patterns and hazards under scenario simulation prediction, as well as the evaluation study of existing urban high-temperature disaster prevention systems and urban resilience, have been studied in detail by some researchers. At the mesoscopic and microscopic scales, the interaction between spatial and climatic factors is multi-directional and integrated, where street height to width ratio (H/W), sky view factor (SVF), street orientation, and green cover are the main spatial factors that are generally considered to have an impact on local heat waves. Meteorological experimental observation methods, CFD models, and ENVI-met models are mainly used in this dimension, e.g., Norton et al. [20] studied in detail the utility of different street aspect ratios and different types of green infrastructure for mitigating extreme urban heat waves hazards, while other scholars have studied the climate change mechanisms of urban spaces such as neighborhoods, residential areas, rooftop gardens, public green spaces and regional improvement strategies in urban spaces such as neighborhoods, residential areas, rooftop gardens, and public green spaces [21,22,23,24,25]. In addition, vegetation and water bodies can also ameliorate local high-temperature heat waves through transpiration, due to the release of latent heat from vegetation cover, while increasing the energy used for its purposes. Green areas can properly cool the surrounding areas [26,27], and transpiration from trees decreases the temperature [28,29]. The green cover of vegetation also reduces the intensity of direct solar irradiation and helps to convert the received solar radiation into latent heat. Water bodies are also elements that contribute to the reduction of high urban temperatures due to transpiration and higher specific heat capacity [30]. The UHI effect can also be controlled by reducing anthropogenic heat production [31].
High-temperature heat waves are closely related to people’s outdoor thermal comfort perception [32], and human subjective thermal comfort is an important element in high-temperature heat wave research. The effects of high-temperature heat waves are strongest in densely populated cities [33], with the greatest impact and harm to the elderly, infants, children, and people with chronic diseases [34]. The United Nations Environment Programme, in its latest handbook on urban cooling published in November 2021, mentions that the urban population exposed to high temperatures (i.e., average summer temperatures above 35 °C) is expected to increase by 800% to 1.6 billion by the middle of the century [35]. It is particularly important to evaluate the degree of human perception of high-temperature heat waves and improve urban populations’ thermal comfort through the optimal design of rational urban spaces. Regarding the research on the subjective thermal perception of the population, the research method of integrating two human thermal indicators of temperature and humidity [36], as well as various outdoor thermal comfort evaluation models (UTCI, PET, SET) [37,38], and the correlation effect between the thermal environment of urban space and the thermal comfort perception of the population [39,40,41] have become the focus of current research. Thermal comfort is defined as a psychological state that expresses the human body’s satisfaction with the thermal environment [42]. The current objective indexes for outdoor thermal comfort evaluation mainly contain: Physiological Equivalent Temperature (PET), Outdoor Standard Effective Temperature (OUT_SET), Predicted Mean Voting index (PMV), and Universal Thermal Climate Index (UTCI) [43,44,45,46]. Bedford first proposed that thermal comfort and thermal sensation are the same and classified them into five states subjectively [47], then ASHRAE began to use a 7-level thermal sensory evaluation scale, according to different research objectives and subject sensitivity. Researchers have different choices for the scale, the more major evaluation scales are: thermal comfort voting (TCV), thermal sensory voting (TSV), and thermal preference voting (TPV) [48,49,50]. Since 2000, more and more outdoor studies have begun to focus on the actual thermal response of the human body in specific behaviors or environments [51], in which objective metrics are calibrated against subjective data from populations in different regions. Since 2010, most of the thermal comfort studies have fitted crowd voting with thermal environment parameters to derive different thermoneutral temperatures, reflecting the influence of climate regional differences on thermal comfort [52,53,54], while some researchers have also fitted simulations of crowd voting with thermal comfort indicators to derive prediction equations for their studies [55,56,57], which use the thermal comfort parameters of PET, indicating that it has been widely used for outdoor thermal environment evaluation, and this indicator was also used in this study.
The studies mentioned above have provided a more comprehensive urban heat wave research system and orientation. From the perspective of research methods and objects, major cities and urban agglomerations in China, such as Beijing, Shanghai, and the Guangdong-Hong Kong-Macao Greater Bay Area, have started to study the heat island effect and high-temperature heat hazards in the urban context from a multidisciplinary fusion perspective in the past five years in both temporal and spatial dimensions [58,59,60]. International research on urban heat waves is more advanced and intensive, such as constructing a comprehensive vulnerability evaluation framework and index system under the influence of multiple factors including the natural environment, urban environment, socio-economy, and public resources, which ultimately achieve the purpose of spatial identification of vulnerable populations [61,62]. Mountain cities have outstanding summer heat wave problems due to the compound influence of multiple factors that include their special topography and highly dense urban form, which need to be addressed urgently. However, domestic research on high-temperature heat hazards in mountainous cities, such as Chongqing in China, is relatively scarce compared to that in other countries, with a single research method. The latest remote sensing satellite data for the regional study of heat island effect in Chongqing were retrieved in 2017 [63], while only in 2021, scholars selected natural factors such as the degree of surface relief (RDLS) based on multi-source data from the main urban area of Chongqing and used the spatial analysis method of GIS. Spatial variability of habitat suitability in mountainous areas was quantitatively studied from the perspective of ventilation [64]. However, the study of high-temperature heat waves in functional spaces at the scale of 10m–1km is still insufficient, and there is a lack of comparative exploration between different functional spaces. It is necessary to select thermal environment parameters and spatial morphological elements from the local scale to study the coupling relationship between them. Motivated by the above-mentioned knowledge gaps, this paper aims to study the characteristics of high-temperature heat waves and human thermal comfort at the functional space level in Chongqing, a mountain city, in order to provide a theoretical basis and a methodological approach for improving the thermal comfort of people in mountain cities and better coping with the risk of high-temperature heat waves. The objectives of this study are (1) to describe the thermal environment parameters in four functional areas during a heat wave cycle to analyze local heat wave characteristics and differences; (2) to qualitatively analyze the mitigation effects of different spatial forms on heat waves; (3) to analyze the outdoor population thermal comfort characteristics in Chongqing, a mountainous city, during a heat wave and the relationships influenced by different functional spaces; (4) to establish an outdoor thermal comfort prediction model based on the research data.

2. Materials and Methods

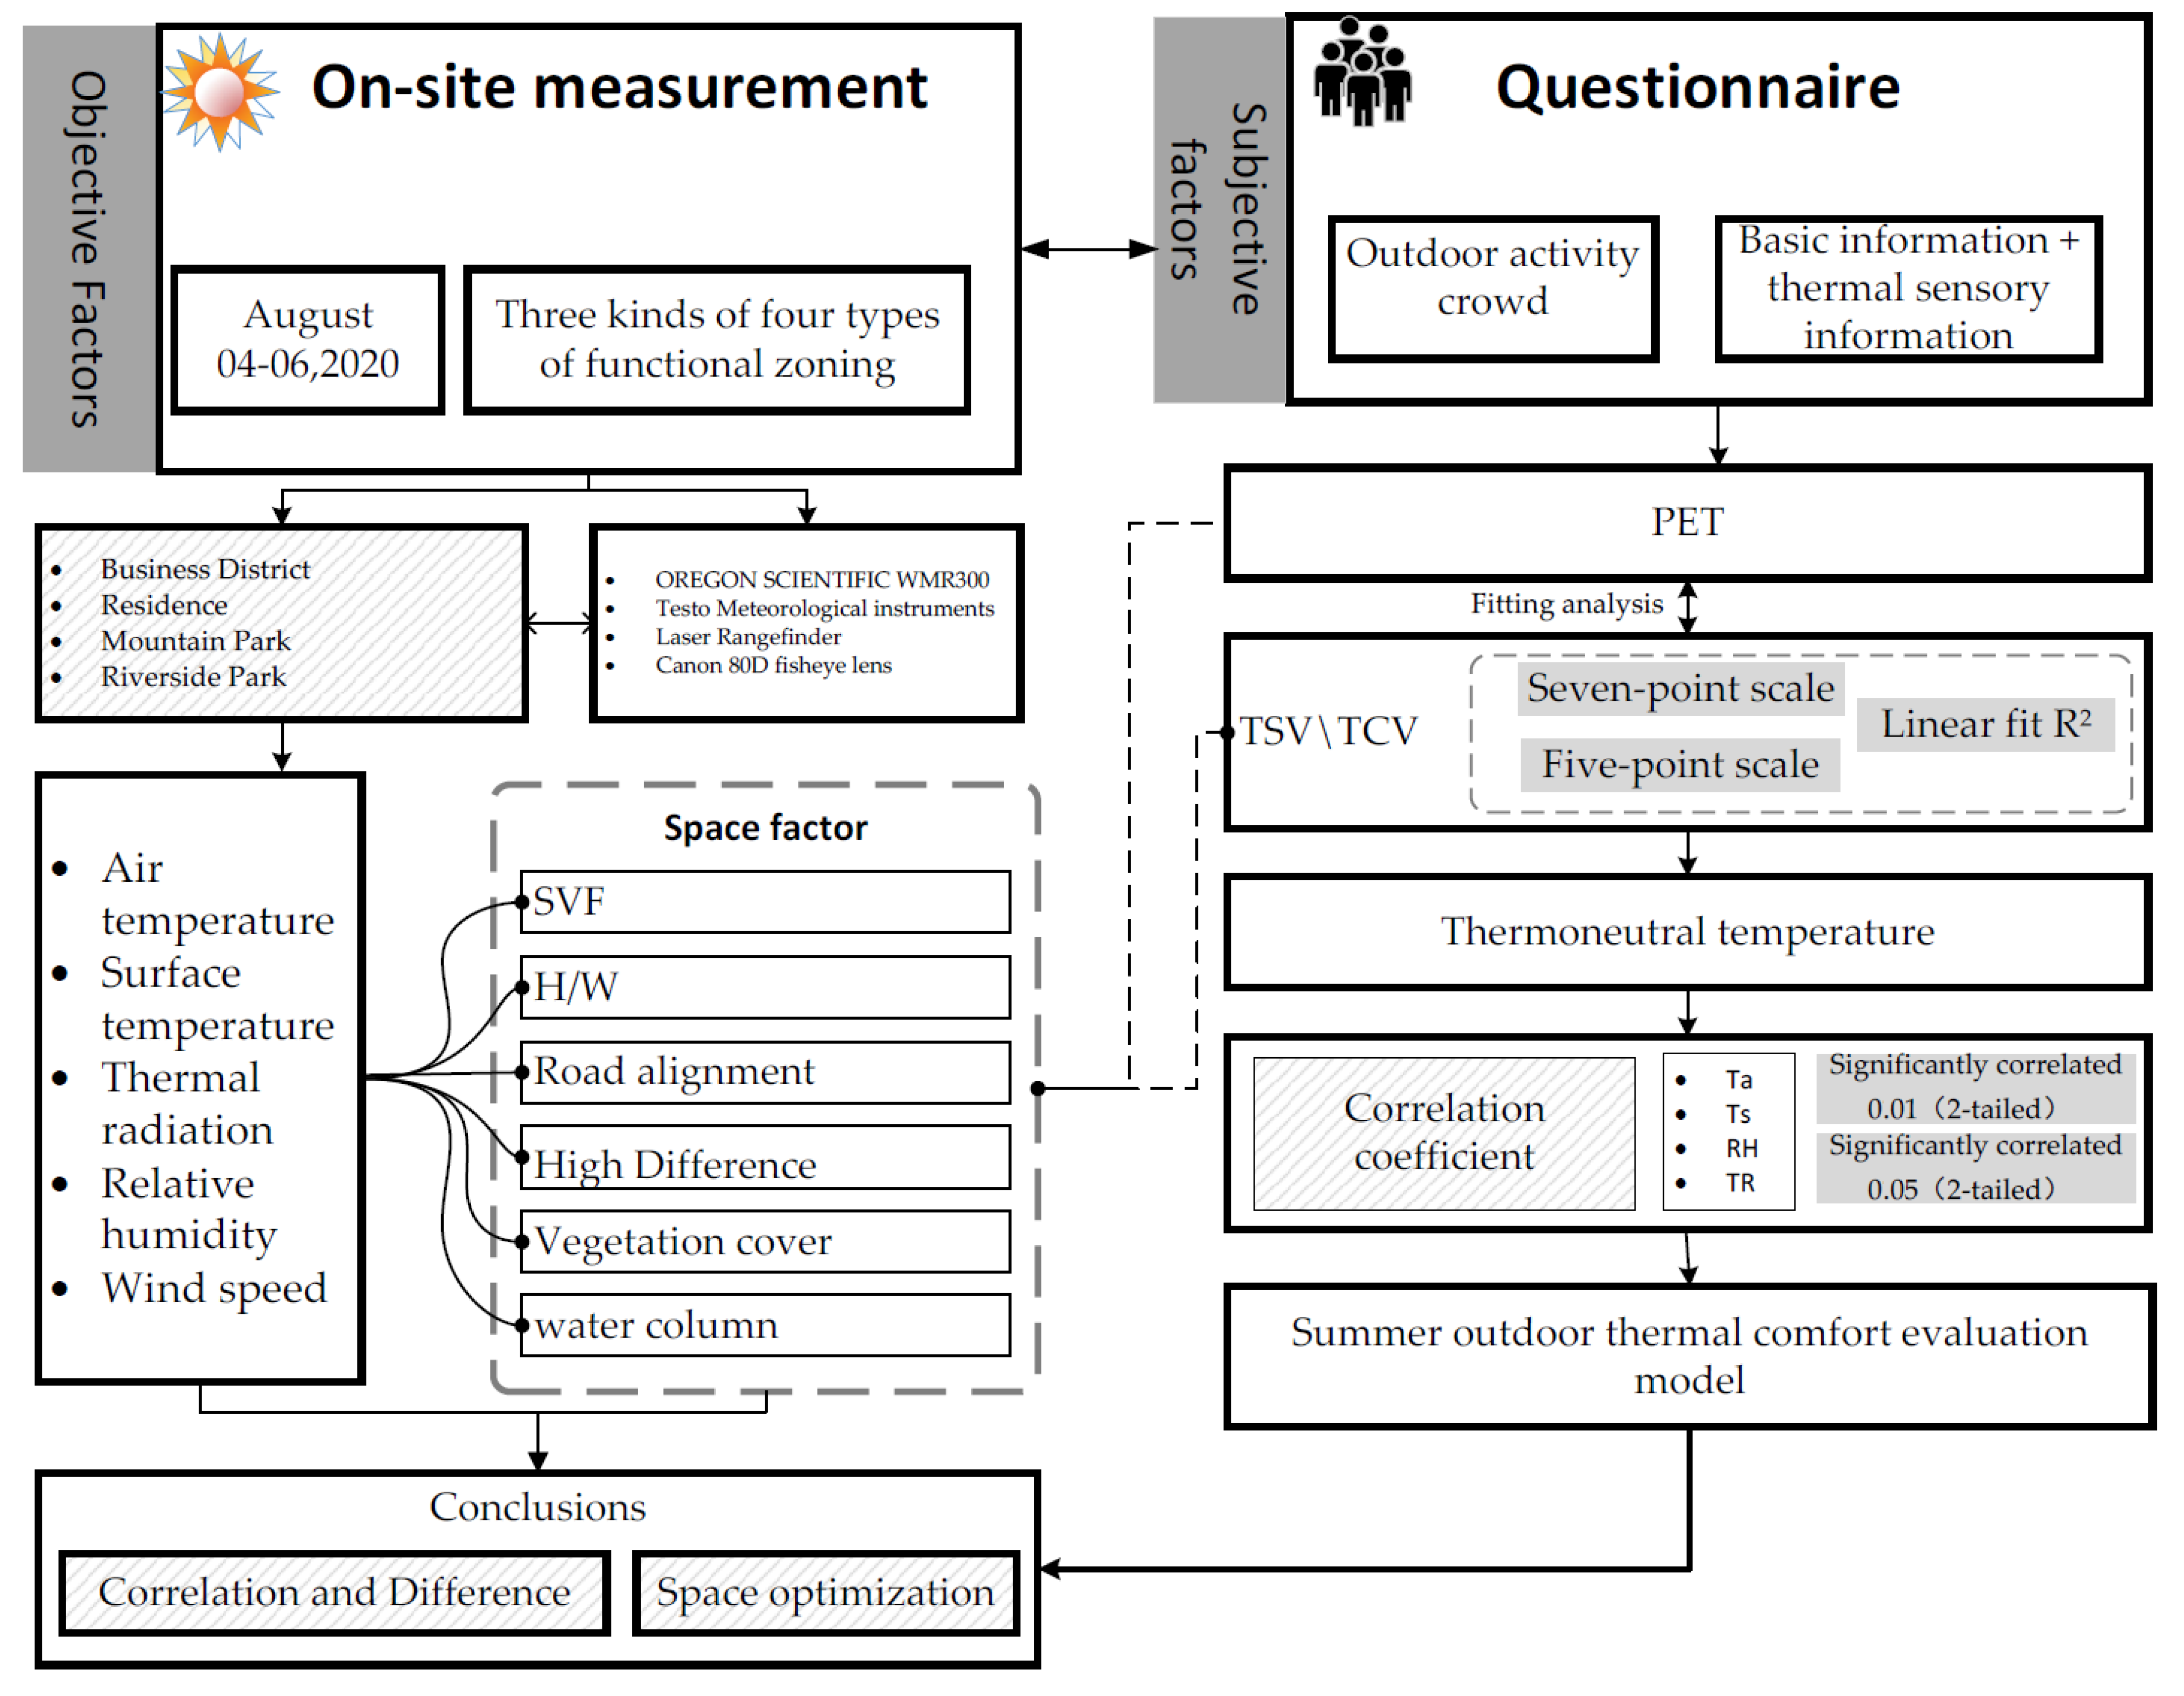
2.1. Methodological Framework

This study concerns the main urban area of Chongqing, a mountainous high-density city, as the research object. We have collected actual measurement data during the high-temperature heat waves, analyzed the thermal environment from the urban spatial perspective, combined the PET human comfort evaluation index, explored the correlation between PET and thermal environment elements at each measurement point, verified the unity of human subjective thermal perception and objective model analysis, calculated the outdoor thermal comfort in summer through a regression fitting range, established the outdoor thermal comfort evaluation model during a summer heat wave in high-density urban centers, investigated the effect of thermal parameters on human thermal comfort, and have drawn final research conclusions. The methodological framework of this study is shown in Figure 1.

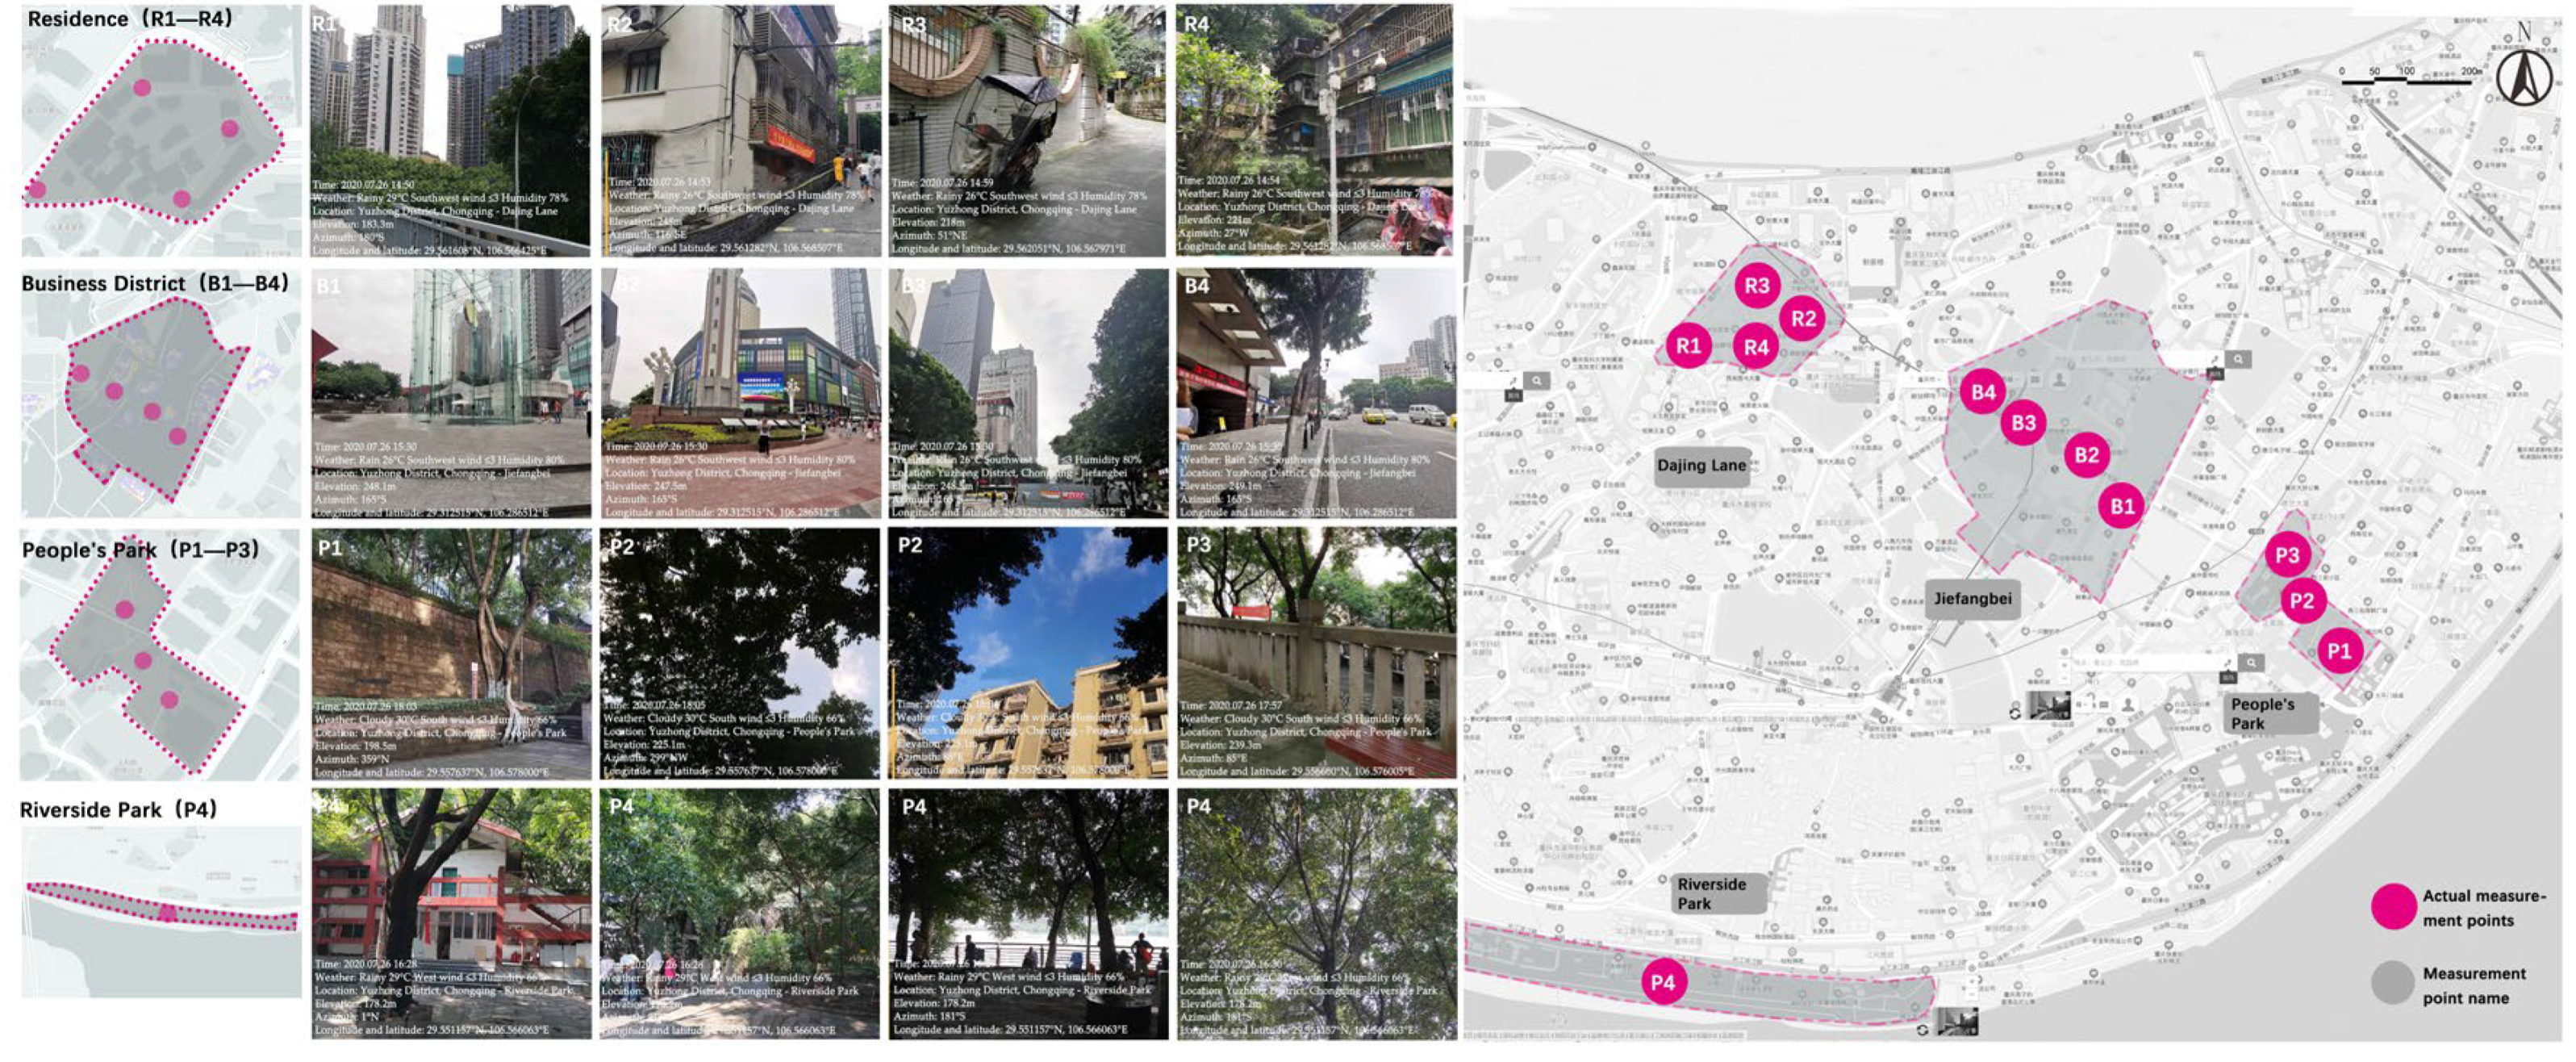
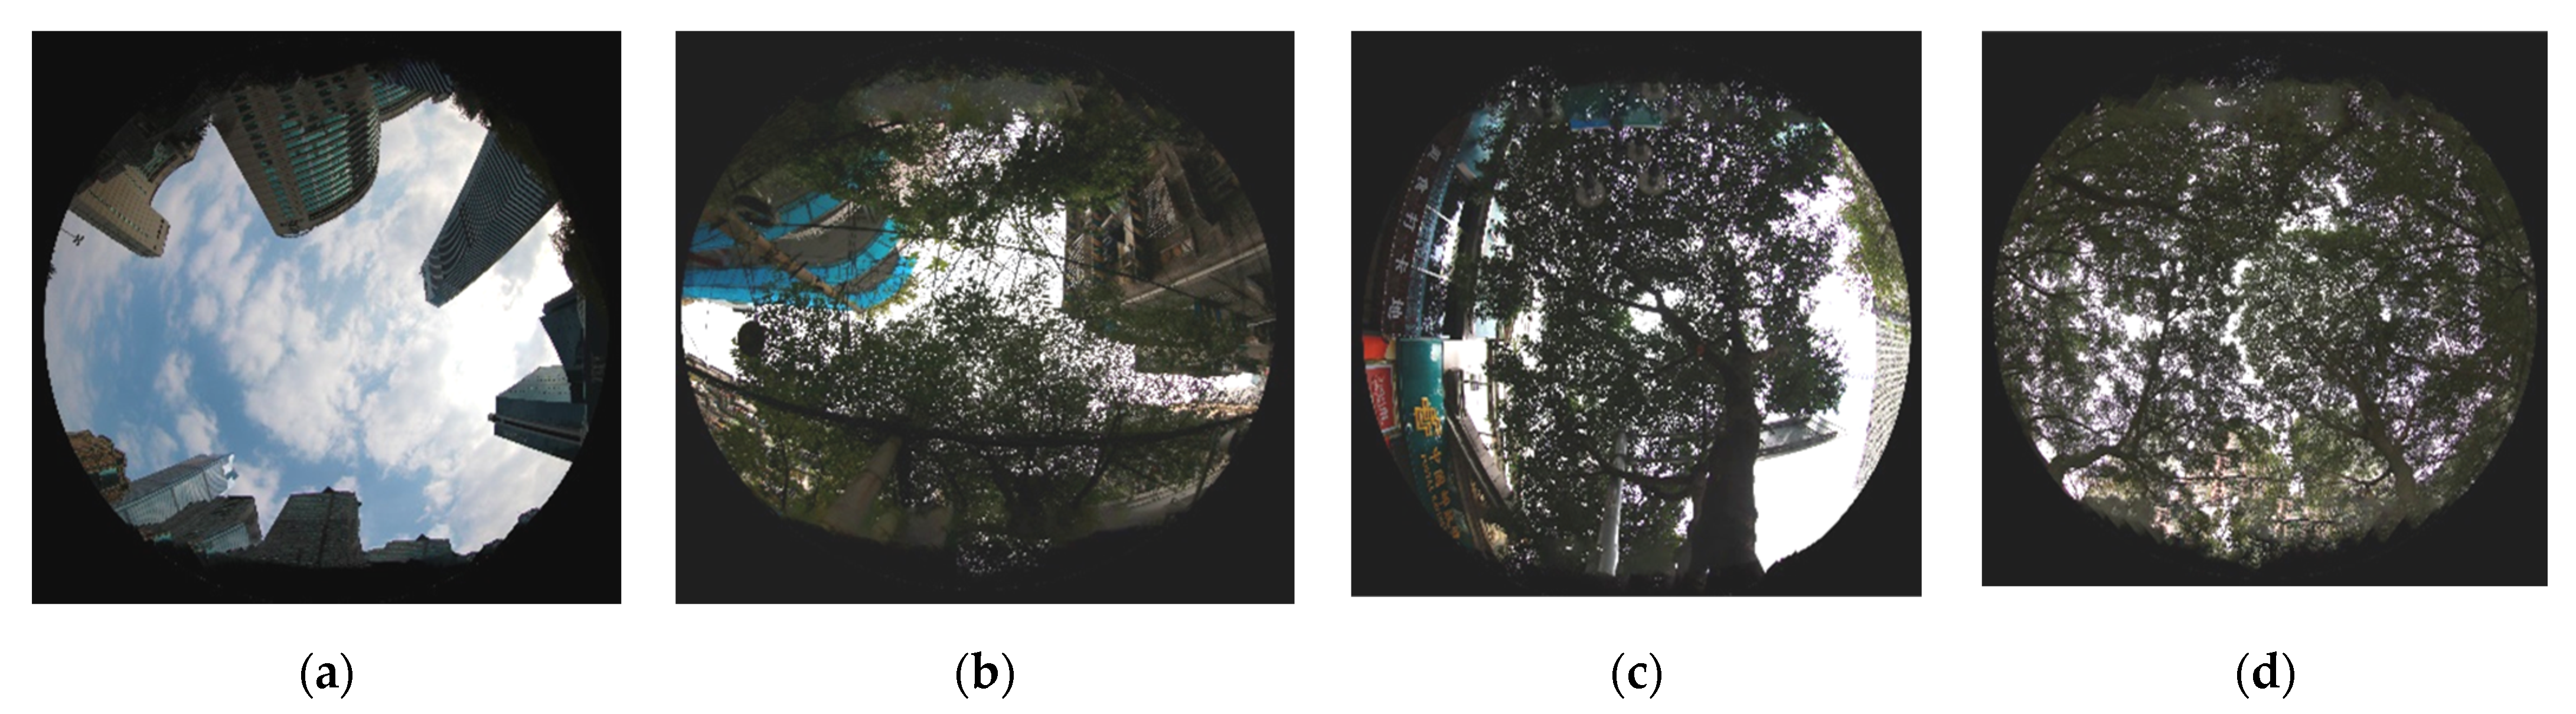
2.2. On-Site Measurement

Chongqing is a subtropical monsoon climate zone, with an average annual temperature of 17.6 °C, extremely high temperature of 42.2 °C, extremely low temperature of −1.8 °C, average annual relative humidity of 70–80%, average annual wind speed of 1.12 M/S, average high temperature of over 33.0 °C in July-August in summer, resulting in hot and humid weather. For 19 days in 2020, the annual temperature exceeded 35 °C, with high temperatures and heat waves in the city. The issue is very serious. The measurement area is the Yuzhong District, which is the core of the main city of Chongqing. The Yuzhong District is surrounded by water to the east, south, and north, connected to the land in the west and is a narrow peninsula running east-west. It reaches 394 m above sea level at Goose Ridge, the maximum point in the district, and 167 m above sea level at Shazuijiao, where the two rivers converge at Chaotianmen, which is the lowest point, with a relative height difference of 227 m. The extremes of climate and special topography make the Yuzhong District a typical mountainous urban area affected by high temperatures and heat waves.
Considering different types of urban functional spaces to determine the measurement points, the twelve experimental measurement points cover four types of urban spaces in three categories: commercial area (Jiefangbei), residential area (Dajing Lane), mountainous park area (People’s Park), and waterfront park area (Riverside Park), the vegetation in the commercial area is sporadically distributed, the vegetation in the residential area is unevenly distributed among the measurement points, and the vegetation in the mountain park area and the waterfront park area are more dense and uniform, as shown in Table 1, Figure 2 and Figure 3 for each measurement point. According to the definition of the high-temperature heat waves by the China Meteorological Administration, the actual measurement of thermal environment data was carried out in a typical high-temperature heat wave cycle in Chongqing (2020.8.4–8.6, with the maximum temperature of 37 °C, 38 °C and 38 °C for three days), and the experimental period was 9:00–20:00. Due to the large number of measurement points and the limited number of instruments, the Dajing Lane measurement point used the American OREGON SCIENTIFIC WMR300 professional meteorological system and thermal radiometer, and the rest of the measurement points used Testo series measuring instruments, in order to ensure that all measurement points were measured simultaneously. Through thermal environment data collection and analysis, the impact of high-temperature heat waves on different urban functional spaces was studied.

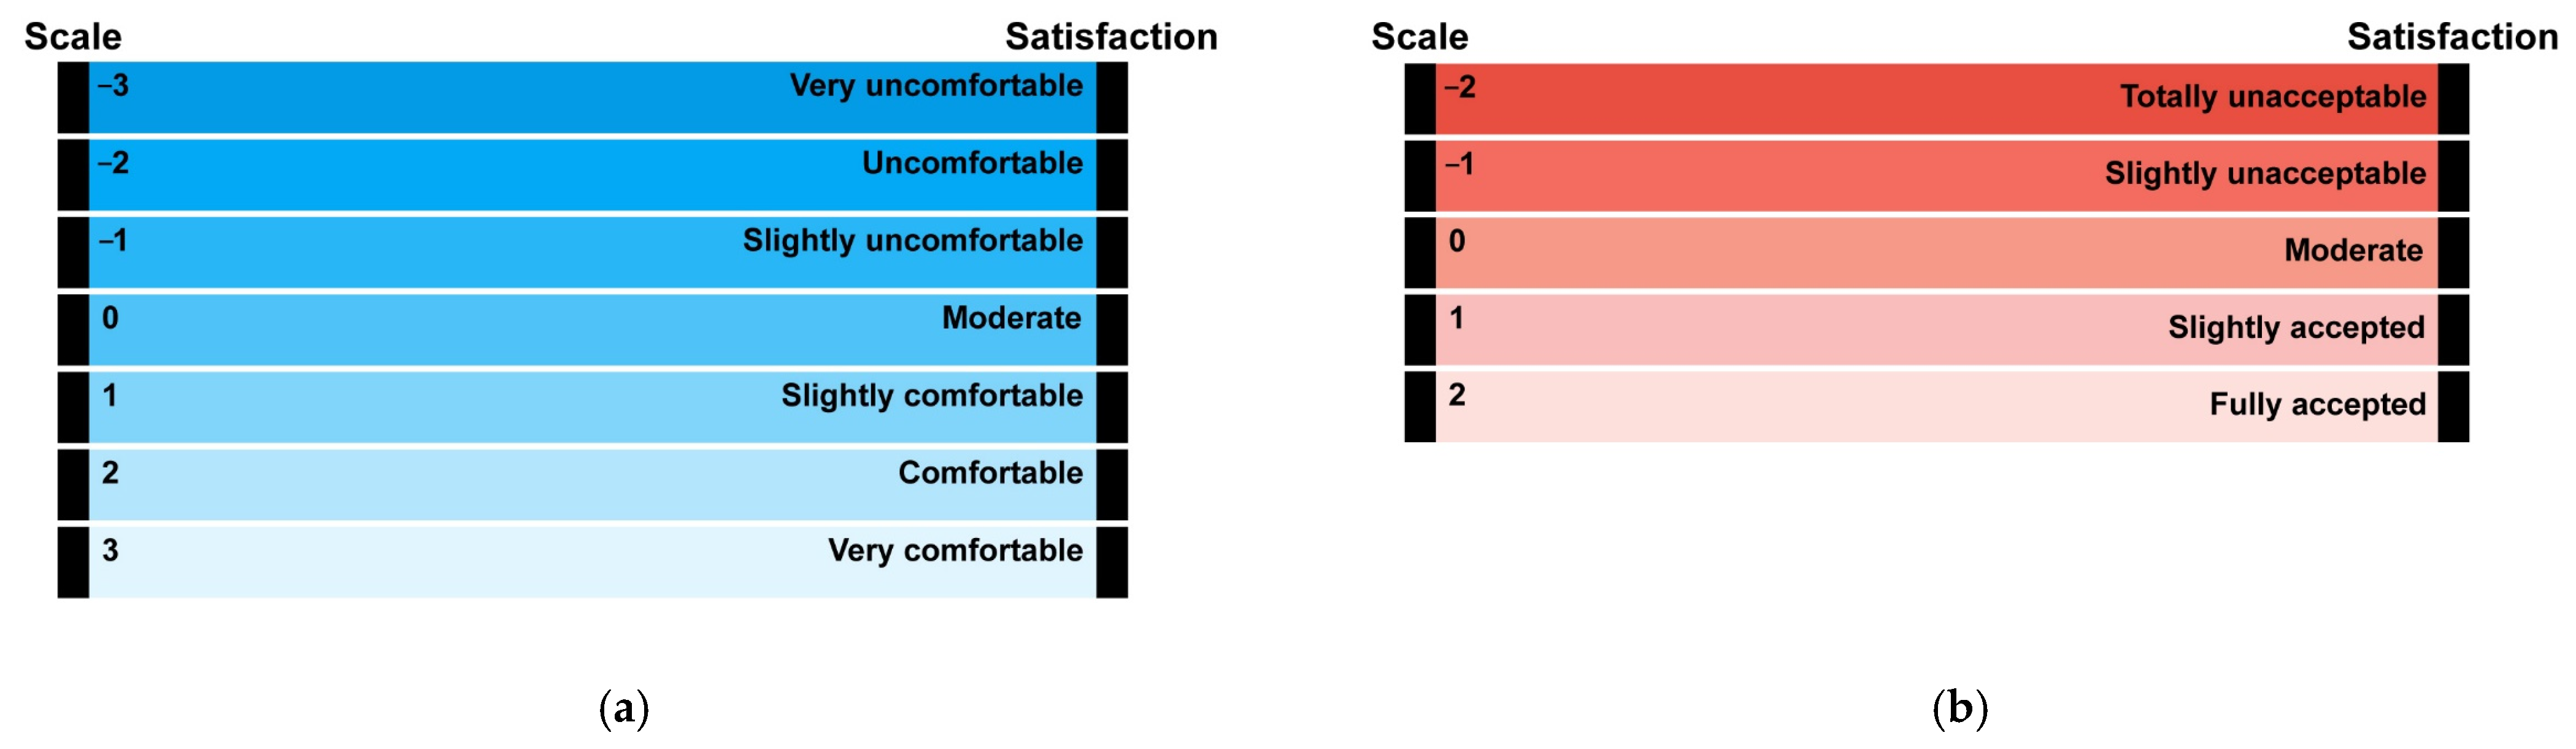
2.3. Evaluation of Outdoor Thermal Comfort in Summer

The PET is the air temperature at which the heat income and expenditure of the human body in a typical indoor environment (without solar radiation and wind) is in equilibrium with the same core and skin temperatures to be evaluated in complex outdoor conditions, being an effective means of evaluating human thermal comfort sensations in complex urban spatial environments [65,66,67]. In this study, questionnaire research was used to obtain subjective human sensory data, and the PET value was calculated based on the thermal environment data using the Rayman model so that the degree of influence of high-temperature heat waves on human thermal comfort could be objectively reflected through thermal comfort, thermal sensory voting and PET fitting analysis.
Questionnaires were conducted at the same time as the field measurements, where the respondents were randomly selected from the measurement site activity population, containing basic information (age, gender, height, weight, clothing, activity status, etc.). Thermal comfort voting (TCV), thermal sensory voting (TSV), etc., where the thermal comfort voting used a seven-point scale and the thermal sensory voting used a five-point scale (the evaluation criteria of each scale is shown in Figure 4) were used to substitute into the thermal environment data calculated using the Rayman model, as shown in Table 2.

2.4. Thermal Comfort Data Statistics and Analysis

In this study, nonlinear regression analysis in SPSS software was used to express the relationship between voting results and PET changes in a regression equation, using PET as the independent variable and TSV and TCV at each measurement point as the dependent variables, in order to clearly demonstrate the relationship between thermal voting and thermal comfort, and to facilitate the derivation of thermoneutral temperature. The correlation between PET and thermal environmental parameters was analyzed using the statistical method of Pearson bivariate correlation coefficient in SPSS. Meanwhile, a multiple logistic regression model in SPSS was used to integrate the effects of each thermal parameter to build an outdoor thermal comfort prediction model.

3. Results

The World Meteorological Organization points out that the human body’s perception of hot and cold is not only dependent on air temperature, but also humidity, wind speed, and solar thermal radiation. Statistical raw measurement data show that wind speed changes irregularly, so this paper mainly analyzes the four thermal environment parameters of thermal radiation, air temperature, surface temperature, and relative humidity, and visually reflects the changes of each parameter during the high-temperature heat waves at each measurement point by drawing a line graph (Figure 5). The calculations yielded the mean intensity of thermal radiation in each measurement area, ranked as follows: Dajing Lane (180.9 W/m2) > Jiefangbei (111.1 W/m2) > People’s Park (98.2 W/m2) > Riverside Park (0 W/m2), the mean air temperature ranked as follows: Jiefangbei (35.8 °C) > Dajing Lane (35.7 °C) > People’s Park (35.1 °C) > Riverside Park (34.8 °C), the mean relative humidity was ranked as follows: Riverside Park (53.4%) > Dajing Lane (52.3%) > People’s Park (48.4%) > Jiefangbei (47.6%). The mean surface temperature was ranked as follows: Dajing Lane (42.1 °C) > Jiefangbei (39.6 °C) > People’s Park (39.4 °C) > Riverside Park (31.5 °C). Overall, the data show functional spatial differentiation, discussing the relationship between urban spatial characteristics and changes in thermal environment parameters for each of the four urban spaces.
Firstly, in the crowd thermal comfort analysis, the TCV and TSV characteristics of each measurement area were analyzed based on the questionnaire survey results. Secondly, the crowd polling and PET of different measurement points were fitted separately to obtain the regression equation and calculate their thermoneutral temperatures. Finally, the connection between PET changes and urban spatial elements at each measurement point was analyzed to calculate the correlation between thermal environment factors and PET, establishing the main urban area of Chongqing summer outdoor thermal comfort prediction model during high-temperature heat waves in the main urban area of Chongqing.

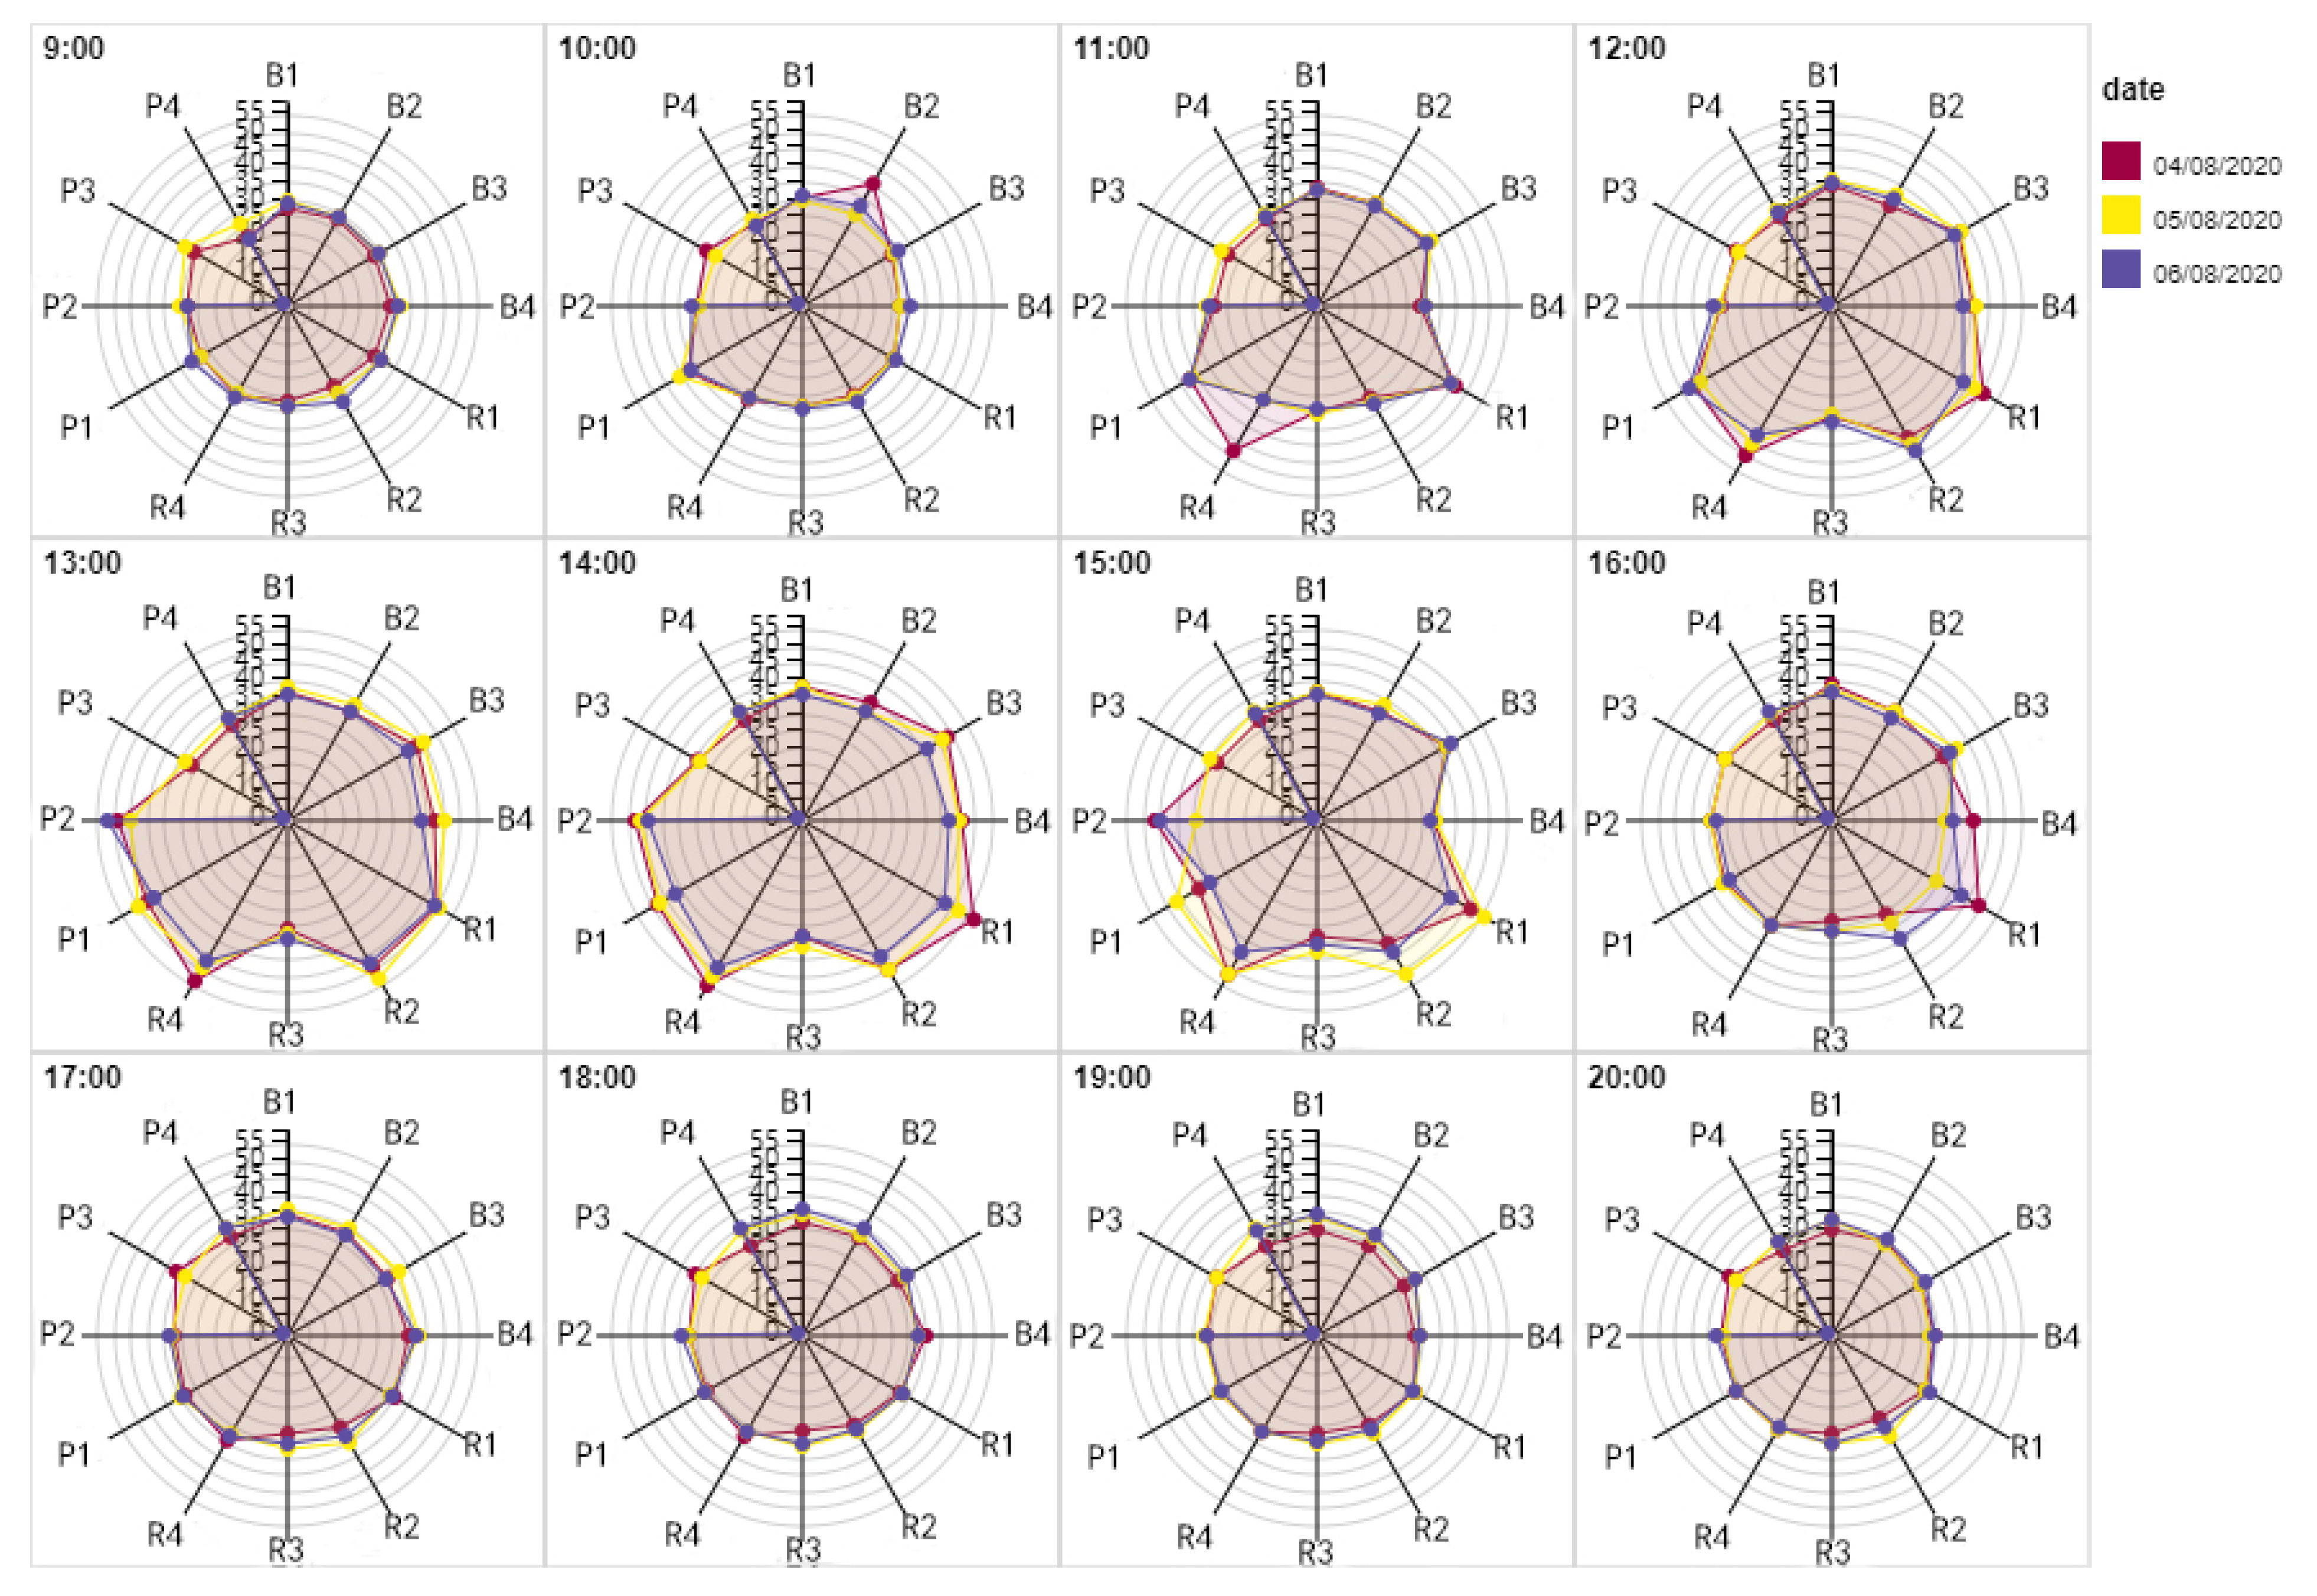
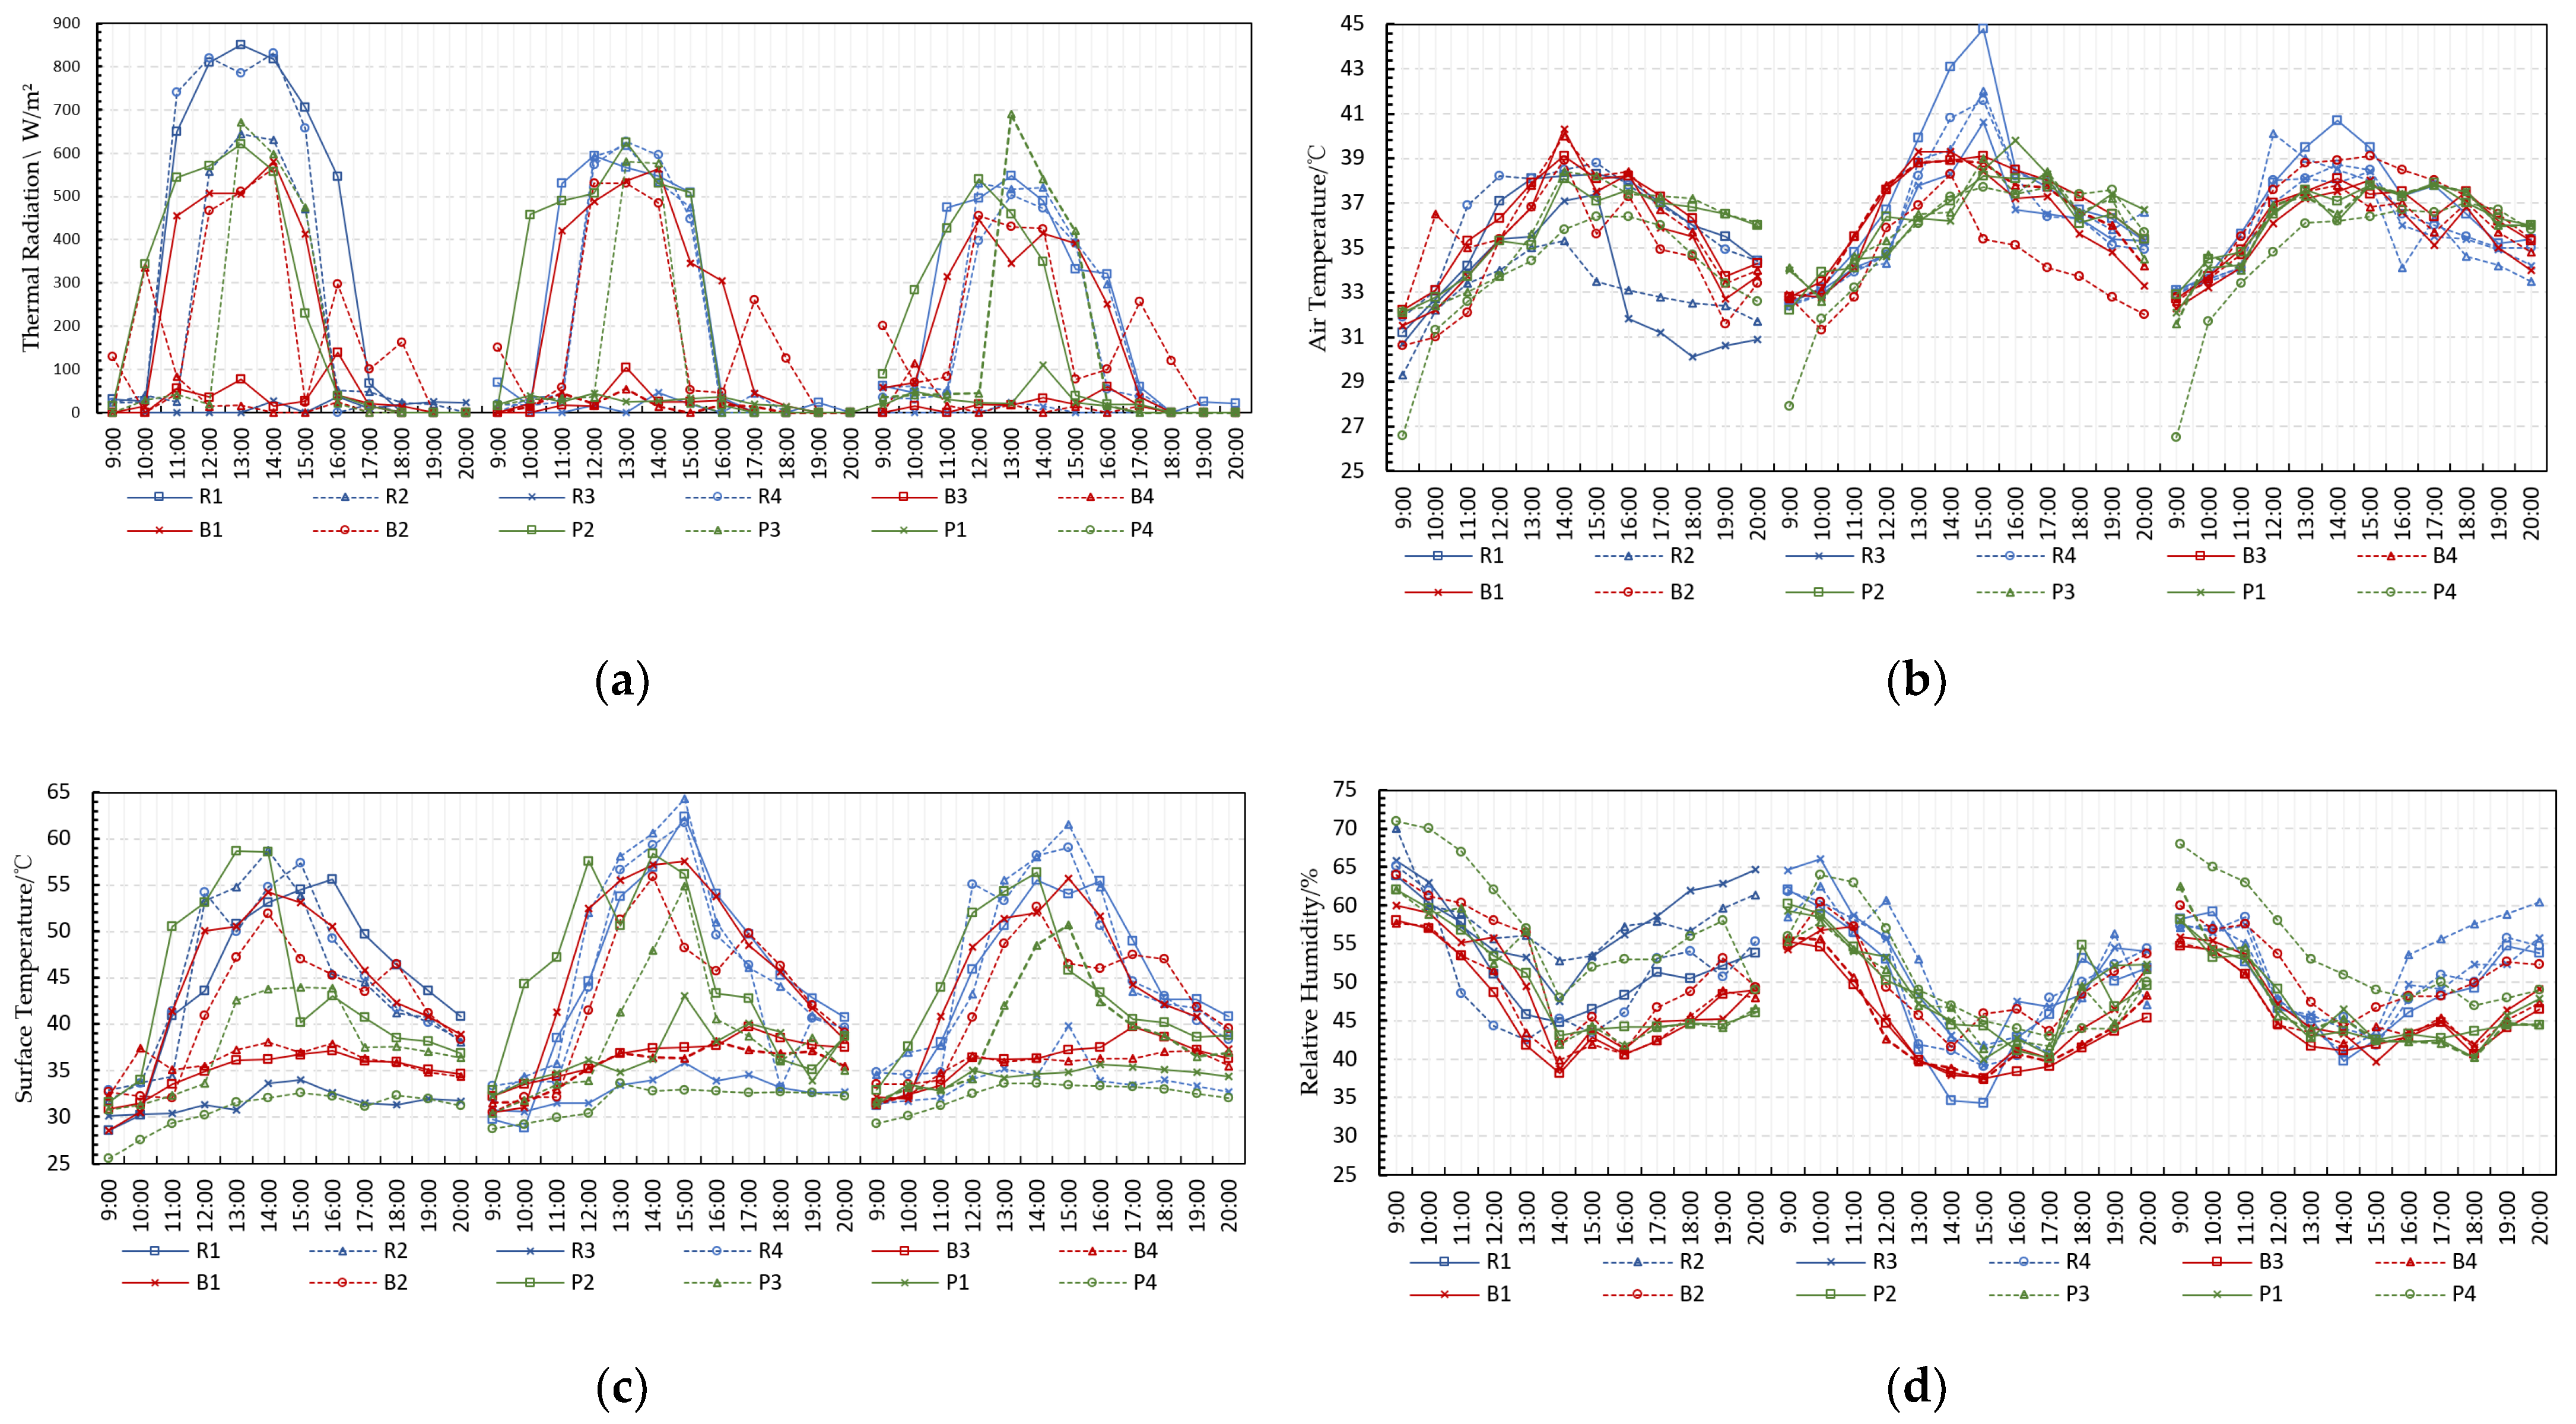
3.1. Thermal Environment Characteristics of Different Measurement Areas

3.1.1. Thermal Environment Results of Business Areas

Jiefangbei has a larger sky openness and street height to width ratio, fewer trees, and a larger area exposed to direct sunlight. The measured results show that the commercial area has the highest overall air temperature, the second highest thermal radiation and surface temperature, and the lowest relative humidity among the four measurement areas; the air temperature and humidity change slowly, while the thermal radiation and surface temperature fluctuate widely. It indicates that the stronger solar irradiation directly affects the air temperature in this area, which in turn intensifies the transpiration of air–water vapor and increases the relative humidity, while its streets are in the NW-SE direction and the buildings on both sides have a certain blocking effect on solar radiation. The surface temperature and thermal radiation show the variability of the measurement points, in which the intensity of high-temperature heat waves at measurement points B1 and B2 are higher than that at measurement points B3 and B4, in particular, the average value of surface temperature is 7.8 °C higher and the average value of thermal radiation is 177.4 W/m2 larger. It is analyzed that it is formed by the absence of any shading around measurement points B1 and B2, the high SVF (0.653 and 0.705), the high heat storage granite sub-bedding surface with high solar radiation, reflected radiation from buildings, and the ground. Whereas measurement points B3 and B4 are slightly less affected by the high-temperature heat wave because of the shading effect of the tree canopy and urban street canyons. In general, the high level of artificiality, high density of buildings and people in the commercial land area, and the high-temperature heat waves are obvious.

3.1.2. Thermal Environment Results of Residential

Due to its 64.7 m site height difference, cramped internal streets, low sky openness, and uneven sub-bedding surface material, the thermal environment parameters of Dajing Lane are more complicated to change. Among the four measurement areas, the residential thermal radiation and surface temperature are the highest, the air temperature and relative humidity are the second highest (the difference with the highest value is small), and the high-temperature heat wave is the most serious. This analysis is due to the early construction of Dajing Lane, which had no underground parking garage, many green areas were changed to hard cement pavement due to the demand for surface parking, poor heat dissipation on the ground, uneven distribution of greenery, and the street direction of the measurement point is close to E-W direction, which is exposed to direct sunlight for a long time, resulting in higher thermal environment parameters. The measurement point R1 has the highest thermal radiation (850 W/m2) and air temperature (44.8 °C), and the largest temperature difference (12.6 °C), which is located at the lowest point of the settlement (elevation 183.3 m), surrounded by very open sky (sky openness 0.821), no trees for shade, and the lower mat surface is hard concrete pavement, which is subject to extremely strong thermal radiation and large fluctuation of air temperature. Measurement point R2 has the highest surface temperature (64.3 °C), and the highest temperature (64.3 °C), this measurement point is located at the entrance of Dajing Lane, the highest point of the settlement (elevation 248 m), the sky openness is medium (0.566), the height to width ratio is large (3.49), there is no vegetation around, the lower bedding surface is made of asphalt pavement (it is exposed to sunlight for a long time), and there is a large fluctuation of surface temperature for three days (temperature difference 32.1 °C) Measurement point R3 is located at the northern end of the settlement, the dense tree crown of the site, it has the smallest sky openness (0.301), and the lowest values of each thermal parameter Measurement point R4 is located in the middle of the settlement elevation difference (elevation 221 m), and the values of each thermal parameter are slightly lower than those of R1 and R2. In summary, Dajing Lane is an old mountain settlement, which is affected by multiple spatial factors such as elevation, sky openness, street height and width ratio, greenery, etc., resulting in large differences in the characteristics of high-temperature heat waves at different measurement points.

3.1.3. Thermal Environment Results of Mountain Park

Most of the vegetation in People’s Park consists of dense and tall trees, and the lower bedding surface is mostly mud and grass bricks, with low SVF and height to width ratio. The overall changes of the thermal environment parameters were smooth and showed a high degree of stability during the measurement period, showing little fluctuation. Reasonable landscape vegetation and the consistency of the substrate in the mountain park are important spatial factors for the formation of thermal stability. Measurement point P1 is surrounded by dense trees and is more shaded, and its mean surface temperature (35.5 °C) and mean thermal radiation (24.2 W/m2) are lower than the other two measurement points. A brief maximum thermal radiation value (690 W/m2) was observed at measurement point P3, which was analyzed as a result of the tree canopy not forming full coverage at this measurement point during the tree placement, resulting in high solar radiation and reflected radiation around it for a certain period. In general, it seems that the high vegetation rate, suitable street height to width ratio, and low SVF together determine a less different thermal environment at each measurement point in People’s Park, which is less affected by high-temperature heat waves than the two types of urban functional spaces, commercial areas, and residential areas, which are highly built up.

3.1.4. Thermal Environment Results of Riverside Park

Within the riverside park, the trees are tall and dense, with a large canopy diameter for good shading, and more mud and grass on the lower bedding surface. Measurement point F4 is near the river, with the lowest elevation (147 m) and the smallest SVF (0.258), which is obviously affected by the river wind. Its surface temperature, air temperature, and heat radiation are the lowest values of all functional areas and measurement points, but the relative humidity is the highest, although the highest value of air temperature is greater than 35 °C for three consecutive days at the high-temperature heat wave effect is not obvious. It indicates that the waterfront park effectively regulates the thermal environment through the high heat storage of the water surface and the reflection effect of solar heat radiation, the heat dissipation effect of river wind on the environment, and the shading effect of tree canopy on solar radiation, etc., to play a certain mitigating effect on the urban high-temperature heat waves.
In summary, the characteristics of high-temperature heat waves in each measurement area vary depending on the spatial elements. Reflection of water surface and high heat storage of water bodies affect the surrounding thermal environment. Tree shading and the degree of street cramp affect the values of each thermal parameter by blocking solar insolation. Hard substrates, such as cement and concrete, have a certain heating effect on air temperature, while soft substrates such as soil and grass bricks have a better mitigation effect on the thermal environment; the higher the elevation, the more heat radiation the measurement point receives. The higher the elevation, the greater the amount of thermal radiation received by the measurement point, as well as the more obvious the high-temperature heat wave effect.

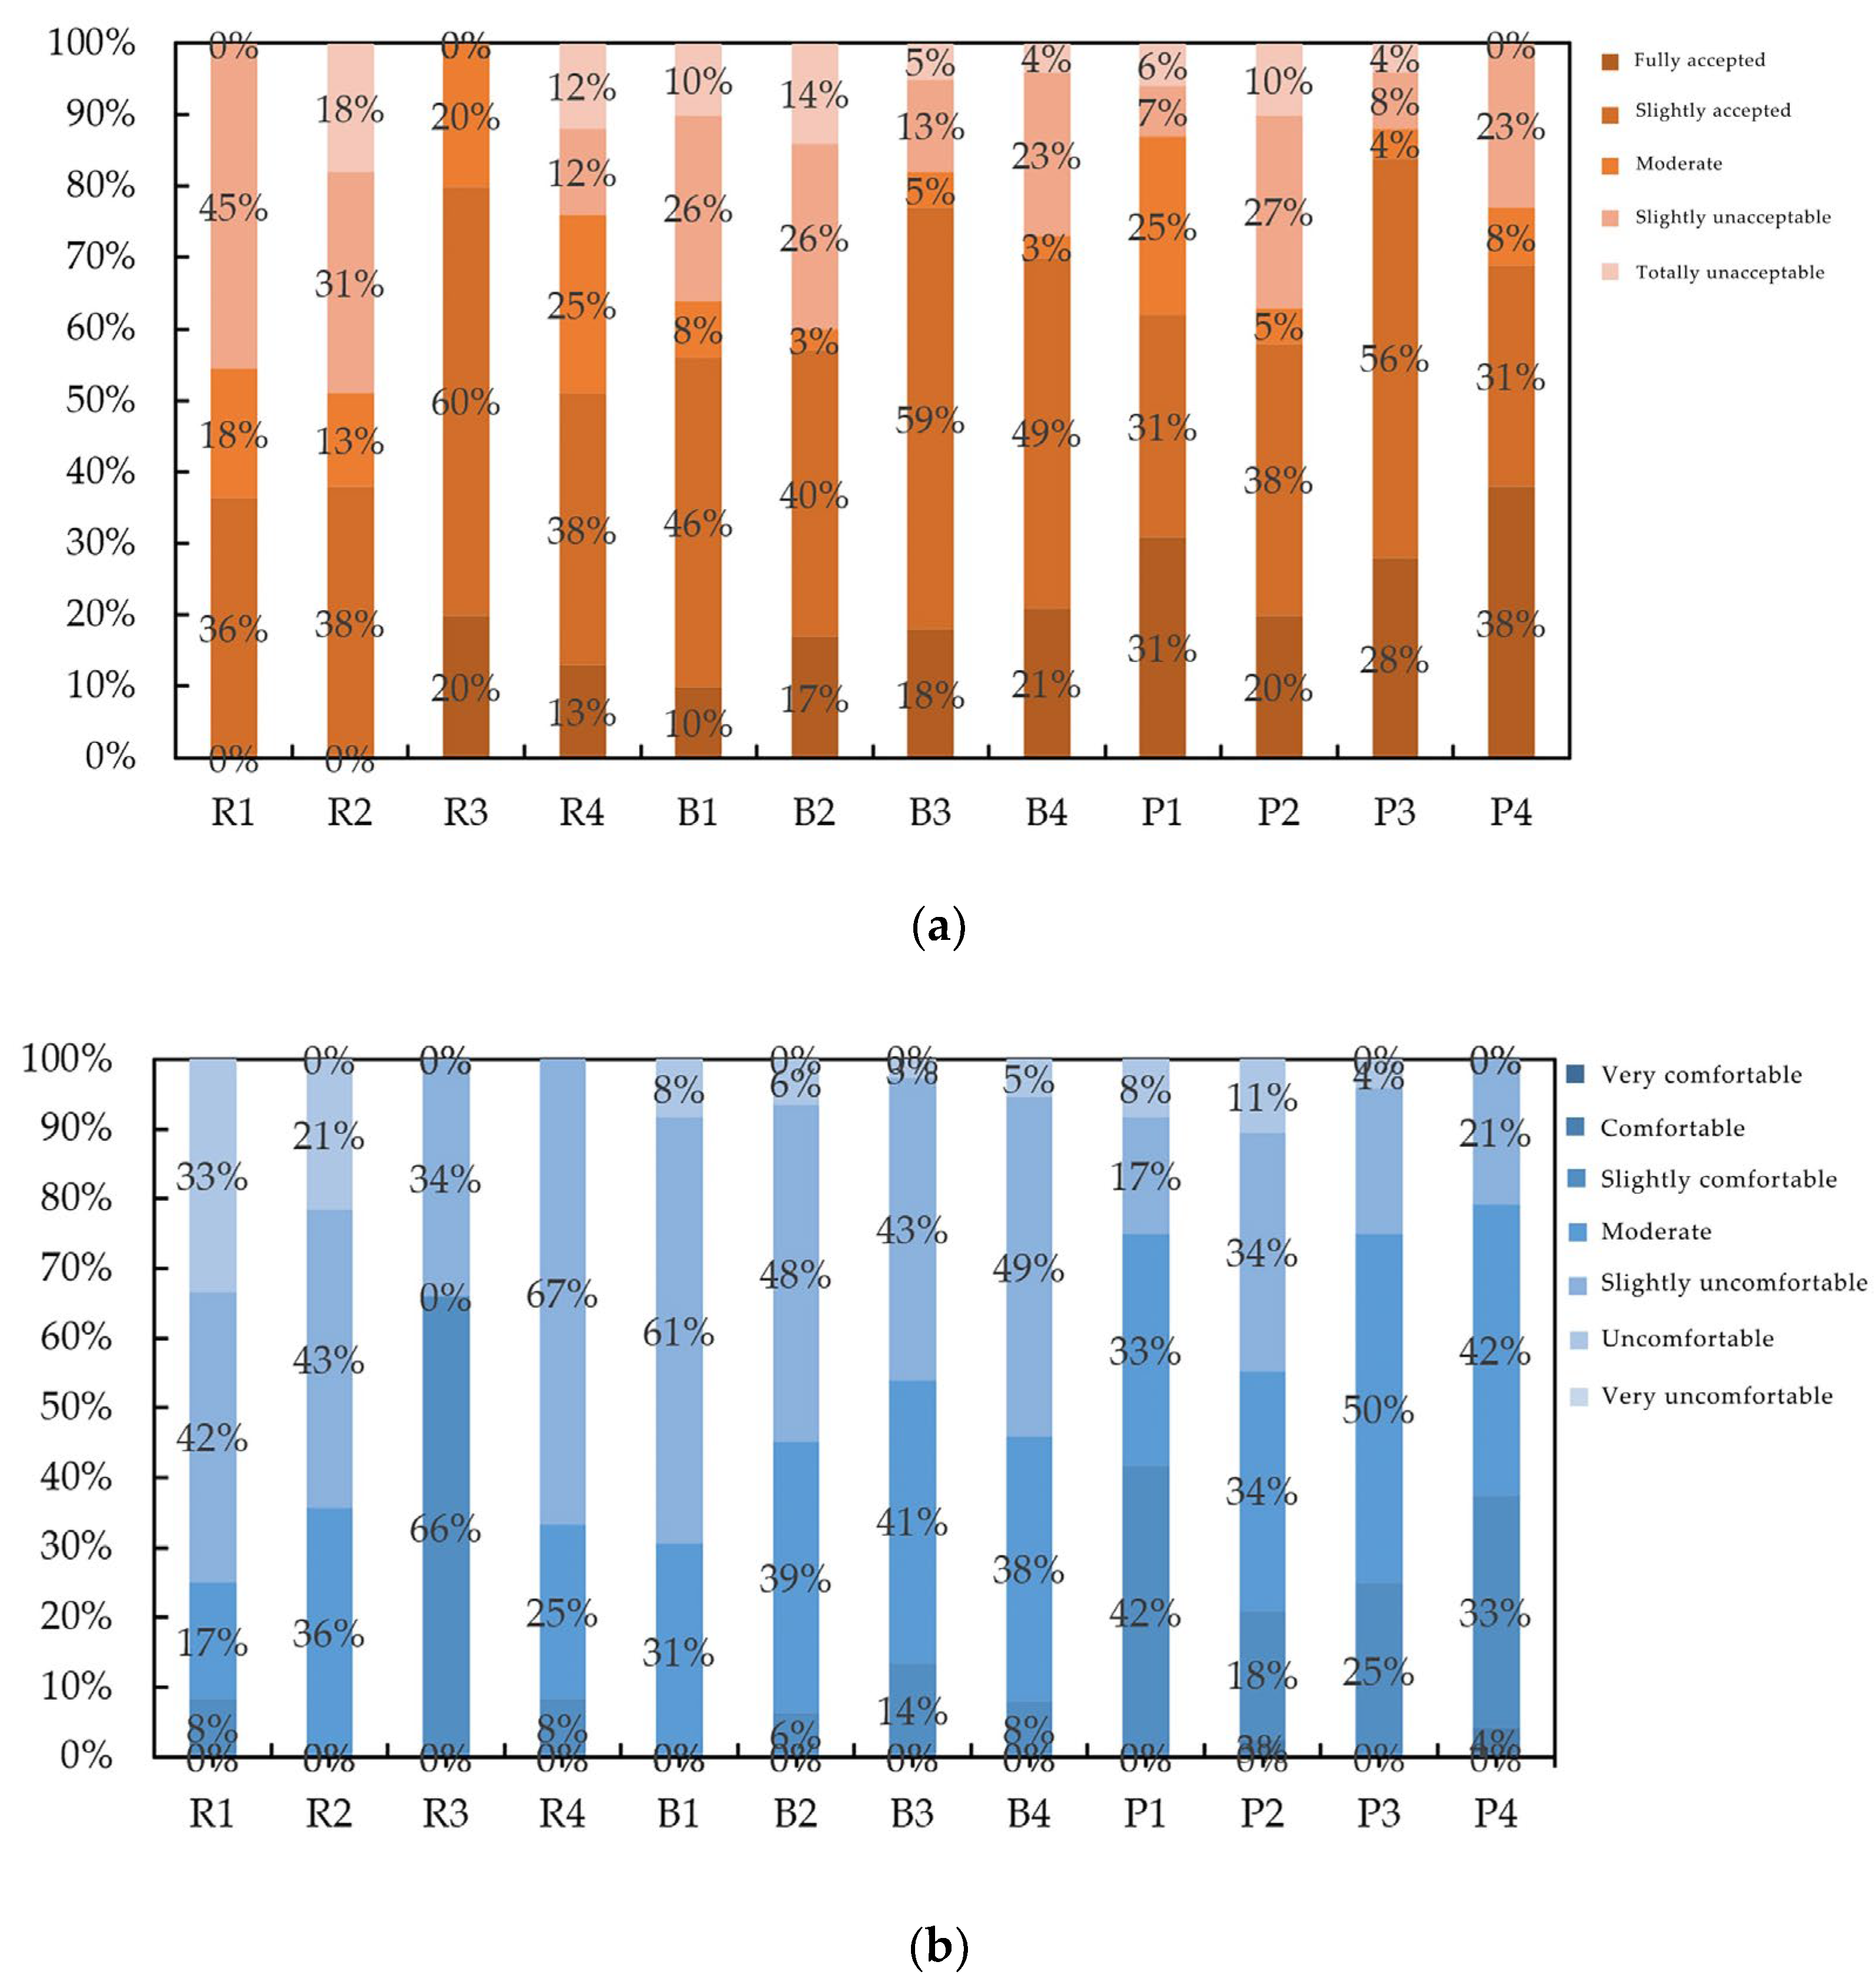
3.2. Summer Outdoor Crowd Voting Analysis

The ages of the questionnaire respondents ranged from 6 to 89 years old, with the majority being between 36–59 years old and the proportion of men and women essentially equal. Figure 6 shows the distribution of thermal comfort votes (TCV), with 46–69% of people voting “slightly uncomfortable” to “uncomfortable” in four measurement points (B1–B4) in Jiefangbei and three measurement points (R1, R2, R4) in Dajing Lane; 52–80% of respondents voted “slightly uncomfortable” in two parks (P1–P4), 52–80% of respondents voted “moderate” and above, and “comfortable” at P2 (3%) and P4 (4%); however, no respondents chose “very comfortable” and “comfortable” at all points. None of the respondents chose “very comfortable” and “very uncomfortable” for all points. Figure 6 shows the distribution of thermal sensory voting (TSV), with Jiefangbei R1 and R2 having the most “slightly unacceptable” and “not at all acceptable” votes, at 45% and 49%, respectively, and Riverside Park P4 having the most “completely acceptable” votes (38%). “Acceptable” accounted for the most (38%). R1 and R2 measurement points of Dajing Lane had no “fully accepted”. This shows that, like the previous thermal environment parameters, the thermal sensation and thermal comfort of the crowd are also affected by different spatial elements. The park provides abundant shade areas, and people feel more comfortable in shady places, while the square in the urban commercial area and the activity site in the residential area have more hard surfaces and less vegetation, and the external air conditioner generates a lot of heat, so most respondents have poor thermal comfort.
Based on the PET data calculated from the thermal environment parameters, the relationship between the mean values of thermal susceptibility voting (TSV) and thermal comfort voting (TCV) and PET was statistically analyzed by SPSS and fitted to obtain the regression curves for each measurement area (Figure 7). The slope of the TSV regression curve was similar in the four measurement areas, with R2 above 0.8, while the correlation between TCV in Jiefangbei and Riverside Park was slightly lower than 0.8. The analysis was performed as the excessive outdoor sunlight in the Jiefangbei measurement area contrasts with the indoor cold air and affects people’s thermal sensation. While the comfort sensation in the Riverside Park measurement area is more stable, the correlation between their thermal sensation and PET is slightly weaker.
A nonlinear fit was performed for the relationship between TCV and PET at different measurement points (Figure 8), and the regression equation was obtained as follows.
TCVRiverside Park = −0.844 + 0.362PET − 0.010PET2 (R2 = 0.773)
TCVDajing Lane = 10.085 − 0.371PET + 0.001PET2 (R2 = 0.845)
TCVJiefangbei = 18.439 − 0.903PET + 0.010PET2 (R2 = 0.695)
TCVPeople’s Park = 6.940 − 0.261PET + 0.0017PET2 (R2 = 0.836)
When TCV = 0, the corresponding PET values of each measurement point are 33.70 °C for Riverside Park, 29.53 °C for Dajing Lane, 31.208 °C for Jiefangbei, and 34.22 °C for People’s Park; when TCV ≥ 1, the corresponding PET thermal comfort range is 33.70 ± 3.64 °C, 29.53 ± 3.17 °C, 31.20 ± 3.21 °C, and 34.22 ± 6.43 °C. The analysis showed that the thermal neutral temperature at the measuring point of Dajing Lane was the lowest and its thermal comfort range was the narrowest; the thermal comfort range of People’s Park was the widest, and the thermal neutral temperature of Riverside Park was close to that of People’s Park.
A fitting analysis of the relationship between TSV and PET (Figure 8) yielded the following regression equation.
TSVRiverside Park = 8.831 − 0.381PET + 0.002PET2 (R2 = 0.828)
TSVDajing Lane = 31.499 − 1.688PET + 0.021PET2 (R2 = 0.848)
TSVJiefangbei = 16.552 − 0.765PET + 0.008PET2 (R2 = 0.812)
TSVPeople’s Park = 10.943 − 0.441PET + 0.0035PET2 (R2 = 0.888)
When TSV = 0, the corresponding PET values of each measurement point are 27.01 °C for Riverside Park, 29.45 °C for Dajing Lane, 33.08 °C for Jiefangbei, and 33.98 °C for People’s Park. When TSV = −0.5~0.5, the corresponding PET thermal neutral ranges are 27.01 ± 1.85 °C, 29.45 ± 1.17 °C, 33.08 ± 2.30 °C, and 33.98 ± 2.57 °C. It can be seen that the thermal neutral temperature of Riverside Park is the lowest, which indicates that the sensitivity of human thermal sensation is the least, because the measurement point here is near the riverside, with dense trees and better heat dissipation and absorption, and shading of thermal radiation so that people are less concerned about thermal sensation and can take the lower PET as a moderate state of feeling. The People’s Park has the highest thermal neutral temperature, which is analyzed because it is located in the city central area, near Jiefangbei, and the elevation is higher, which is strongly influenced by solar thermal radiation and urban thermal radiation, although the vegetation conditions are rich, and the air temperature and thermal radiation are higher according to the previous data, so the crowd takes the higher PET as the thermal comfort state.
In addition, the analysis of the thermally neutral temperature and threshold range of PET at all measurement points compared with the standard PET thermal comfort range (18 °C ≤ PET ≤ 23 °C) shows that its maximum value (36.55 °C) is higher than the standard value by about 14 °C, indicating that the standard of outdoor thermal comfort feeling in summer and the acceptance threshold for high temperature are higher in the main urban area of Chongqing in high density. On the one hand, this is due to the mediation of people who are active outdoors in summer by reducing clothing, wearing shading products, and taking cooling measures, and on the other hand, it also indicates that people’s thermal adaptation ability has improved in their long-term life.

3.3. Thermal Comfort Effect Analysis

Figure 9 visualizes the changes of PET at twelve measurement points in four measurement areas during one day (9:00–20:00). Most of the measurement points showed a trend of increasing and then decreasing, and a few of them showed a flat change during the day, which is consistent with the trend of the measured data of thermal radiation and air temperature above. Within the measurement period, the PET at each point in the typical summer space of Chongqing’s Yuzhong District during the heat wave was the lowest at 20:00, indicating that the human thermal comfort was the best at this time. The highest point appeared at the residential area R1 (57.8 °C), and the lowest point was P4 in Riverside Park (21.3 °C). Compared with other measurement points, the PET values at five measurement points B1, B2, R3, P3, and P4 were lower and more stable, which is consistent with the fact that these sites have good shading conditions and fast heat dissipation on the lower cushion. Site R1 (Dajing Lane residential area) maintained a high index for three days, which is related to its highest elevation, increased direct sunlight and cramped streets. Site P4 (Riverside Park) had a stable and comfortable PET index for three days, and its shading conditions were the best among all sites. It can be seen that there is a corresponding connection between PET values and urban spatial elements.
The Pearson correlations between PET values and thermal environment elements were further calculated using SPSS software and sorted out to obtain Table 3. The correlation between PET, relative humidity and air temperature varied among measurement points, among which R2, P1, P2, P3 measurement points did not have a significant correlation with relative humidity, while P1, P2, P3 measurement points did not have a significant correlation with air temperature. Further comparing the measurement points, the correlation coefficients between PET and thermal environment elements also differed slightly. The correlation coefficients between air temperature and PET at measurement points B1, B2, B3, B4, and R2 with better SVF were significantly larger than those between surface temperature and PET, and the correlation coefficients between thermal radiation and PET at points R4, P1, and P2 with higher elevation and better tree shading were significantly larger than those three points. All the thermal environment factors at P4 showed a strong correlation with PET. It can be seen that PET is directly related to thermal environment factors, and thermal environment factors are closely related to urban spatial elements, so the outdoor thermal comfort of the population in summer is related to urban spatial elements, and human comfort varies in different urban functional areas due to factors such as SVF, elevation, street orientation, and street height to width ratio.

3.4. Summer Outdoor Thermal Comfort Evaluation Model

To further reveal the relationship between the overall comfort of the outdoor environment and thermal environment parameters, a multiple linear regression method was used to establish an outdoor thermal comfort prediction model during the summer heat wave in the main urban area of Chongqing, with air temperature, relative humidity, thermal radiation and surface temperature as independent variables and overall comfort voting value (OCV) as dependent variables, with the following relationship equation.
OCV = −0.547Ta − 0.449R − 0.216RH − 0.146LST + 6.250
where: OCV is the overall comfort voting value, ranging from 1 to 7; Ta is air temperature (°C); R is thermal radiation (W/m2); RH is relative humidity; and LST is the land surface temperature (°C). From the analysis of the above equation, it can be seen that air temperature (Ta), thermal radiation (R), relative humidity (RH), and land surface temperature (LST) are all negatively correlated with thermal comfort, and from the coefficients in the equation, the four independent variables have the following weighting on thermal comfort in descending order: air temperature > thermal radiation > relative humidity > land surface temperature. In the central urban area of Chongqing, air temperature and thermal radiation during the high-temperature heat waves have a greater impact on human thermal comfort. Relative humidity and surface temperature have a relatively small impact on thermal comfort perception, with surface temperature having the smallest impact (only 0.146), which has been analyzed by some scholars because impermeable surfaces in the city retain more heat compared to the atmosphere [68], so changes in surface temperature have little impact on human thermal comfort significantly. It is suggested that even in shaded areas, excessive air temperature and thermal radiation will still make people feel hot and uncomfortable; whereas when the temperature and thermal radiation are constant, excessive relative humidity will also reduce the heat exchange between the human body and the surrounding environment, resulting in the feeling of “hot and humid” [69]. In summary, the mitigation measures for outdoor heat waves in summer should focus on reducing the outdoor temperature and in the meantime reducing the radiation heat production.

4. Discussion

In the study, the characteristics of high-temperature heat waves and the evaluation of outdoor crowd thermal comfort of typical urban spaces in Chongqing, a mountainous city, were analyzed more comprehensively. It was shown that different urban spaces have different morphological elements that determine the characteristics of being affected by high-temperature heat waves through influencing their thermal parameter indicators. It was found that sparse greenery, dense pedestrian flow, single street orientation, a large number of external air conditioning units, overly open streets, and more hard pavement on the lower mat are common problems that exacerbate high-temperature heat waves in the study area, which is consistent with the findings of previous studies [27,32,33]. While this study focused on the scale of urban functional areas (10 m–1 Km), the data revealed that urban high-temperature heat waves characteristics have functional spatial variability. The data from this study show that old settlements have the most severe heat waves among the four study areas, and the functional spatial variability should be considered while developing retrofitting plans. Different from other cities, Chongqing’s unique topographic conditions often require consideration of height differences when considering spatial morphological factors, which directly determine the magnitude of heat radiation received by the area and local ventilation problems. Outdoor crowd thermal comfort studies show that people’s heat perception is closely related to the space they are in, and the correlation between PET and crowd voting is also influenced by spatial morphological elements, such as the outdoor sunlight and indoor air conditioning at the Jiefangbei measurement site. The contrasting relationship between cold air affects the accuracy of PET. The calculation of the maximum value of PET thermal neutral temperature (36.55 °C) as about 14 °C higher than the standard value, the higher standard threshold of outdoor thermal comfort temperature in summer in the main city of Chongqing, indicates that the thermal neutral temperature in Chongqing, a humid and hot region, is also affected by regional differences in climate, where the crowd appears to be adaptive to climatic conditions and the thermal adaptation ability has improved. Examining the Pearson correlation between the values of PET and the elements of the thermal environment reveals that there are also small differences between the measurement points, and the correlation coefficients are larger for the measurement points where the spatial elements have a stronger effect on the mitigation of high-temperature heat waves. At the same time, we believe that the relationship between vegetation characteristics and thermal environment needs to be studied separately. In this paper, we mainly analyze the shading effect of vegetation at each measurement point, and analyzing factors such as Leaf Area Index (LAI) and orthogonal experimental design using ENVI-met software can provide effective data support. In summary, it can be concluded that improving outdoor crowd thermal comfort needs to be considered in a local context, and the degree of local high-temperature heat waves and crowd outdoor thermal comfort in summer are ultimately related to regional spatial elements, and differentiated measures need to be considered in design strategies and improving human feelings. This study found that the proportion of thermal environment factors affecting human thermal comfort was different by establishing a thermal comfort model, and the influence of surface temperature was not imagined to be strong, which is different from the findings of previous studies, where the influence of surface temperature was not focused on in the objective data, mainly verified in the studies of Zhou [53] and Lai [54]. However, the areas studied in this paper are the different urban spaces in the mountainous city of Chongqing, which forms the characteristics and focus of our study. The results of this study have found some very worthy points for discussion, which we will further explore on the basis of this study subsequently.
  • The results of this study may only apply to mountainous humid-heat regions similar to Chongqing.
  • In the measured study, only the outdoor crowd thermal comfort in summer was studied, lacking the winter measured control.
  • In the follow-up study, multiple measurements should be conducted in the selected measurement areas to ensure the continuity and accuracy of the data, and further simulation modeling should be used to make the study’s conclusions more accurate.

5. Conclusions

This manuscript addresses the problem of high-temperature heat waves in mountainous urban spaces. Taking Chongqing, a typical mountainous city, as an example, we analyze the characteristics of high-temperature heat waves and human thermal comfort in three types of four urban functional spaces, namely, commercial area, residential area, mountain park, and riverfront park, in the Yuzhong District, Chongqing, based on the measured data of the thermal environment in one high-temperature heat wave cycle. Initially, we reveal the influence of different types of urban space composition forms on high temperature heat waves and outdoor thermal comfort, with the following conclusions.
  • Urban high-temperature heat waves are related to the distribution of urban spatial environmental elements, high temperature heat waves in mountainous high-density urban spaces show obvious zoning differences and complex influencing factors. Spatial environmental elements such as SVF, vegetation planning, site elevation, street alignment, and height to width ratio have an impact on thermal parameters such as thermal radiation, air temperature, surface temperature, and relative humidity. A vegetation and greenery setting with a rich canopy layer, combined with low reflectivity underlayment material, can effectively reduce thermal radiation and lower temperature. Suitable SVF, street height to width ratio, and orientation, combined with water arrangement, can mitigate high-temperature heat waves by blocking solar radiation, promoting urban ventilation and improving wet heat environment.
  • Urban high-temperature heat wave characteristics have functional-spatial variability, and different spaces have different mitigating capacities for it. Research shows that old residential areas have the most severe heat waves, followed by commercial areas, and better parks and green areas, indicating that old residential areas are more thermally vulnerable than commercial areas and are the key targets for urban energy-saving renovation. At the same time, the spatial elements that induce high-temperature heat waves differ in different functional spaces, and the differences in functional spaces should be considered when formulating mitigation strategies for high-temperature heat waves. Commercial areas mainly consider such elements as underlayment materials, SVF, greening arrangement, and ventilation channels, while residential areas focus on such elements as vegetation arrangement and green space planning, street height to width ratio, and orientation, site elevation and shading, etc. Green space, water bodies, and landscape shading in parks are important elements.
  • Human thermal comfort is correlated with urban spatial elements and thermal environment. High-density commercial areas have small SVF, few green trees, and many hard impermeable substrates, which lead to a generally poor thermal environment effect of high temperature, high humidity, and strong thermal radiation for human thermal sensory voting. Residential areas have a large number of vegetation of a single type, as well as uneven distribution of greenery, plus cramped roads, and concrete and other substrates, which exacerbate the degree of heat and humidity affecting thermal comfort. Parks which are rich in vegetation, green water bodies, good shading, and heat dissipation conditions create a more comfortable thermal environment, in which waterfront parks have the best thermal environment and thermal comfort performance, and the lowest thermal neutral temperature, closer to the standard value of PET as a moderate state. It indicates that the thermal environment composed of different urban spatial elements may be a key factor in determining the thermal comfort of people with different outdoor activities.
  • Modeling outdoor thermal comfort during high-temperature heat waves based on research data, which showed that air temperature, relative humidity, thermal radiation, and surface temperature were negatively correlated with thermal comfort, and the proportion of the influence of each parameter was: air temperature > thermal radiation > relative humidity > surface temperature. To cope with urban heat wave disasters lowering air temperature, reducing solar radiation, and then lowering humidity and surface temperature through reasonable planning and arrangement of urban spatial form and greening elements is an important direction to improve human thermal comfort.
Based on the findings of this research, the study of more diverse urban space types, longer measurement years and more diverse outdoor population thermal comfort indexes can provide a basis for the next step of exploring the mitigation mechanisms of urban heat waves, and the optimal design of urban spaces suitable for human thermal comfort.

Author Contributions

Conceptualization, H.H. and P.J.; methodology, H.H. and P.J.; software, P.J.; validation, P.J.; formal analysis, P.J.; investigation, H.H. and P.J.; resources, H.H.; data curation, P.J.; writing—original draft preparation, P.J.; writing—review and editing, H.H.; visualization, P.J.; supervision, H.H.; project administration, H.H.; funding acquisition, H.H. All authors have read and agreed to the published version of the manuscript.

Funding

This research was funded by the National Social Science Foundation of China: “Research on the Prevention, Control and Management Mechanism of Heat Wave Disasters in High-density Cities in Mountainous Areas, grant number 19BGL004; The National Natural Science Foundation of China: A typological approach and energy-saving potential of energy-saving renovation of existing residential buildings: A case study of Chongqing, grant number 52078071”.

Institutional Review Board Statement

Not applicable.

Informed Consent Statement

Not applicable.

Data Availability Statement

The data presented in this study are available on request from the corresponding author. The data are not publicly available due to privacy restrictions.

Acknowledgments

Thanks to fellow graduate students for providing technical support for the practical part of this experiment.

Conflicts of Interest

The authors declare no conflict of interest. The funders had no role in the design of the study; in the collection, analyses, or interpretation of data; in the writing of the manuscript; or in the decision to publish the results.

Nomenclature

UHIUrban heat island
UTCIUniversal Thermal Climate Index
PETPhysiological equivalent temperature
SETStandard equivalent temperature
UCmapUrban climate map
H/WStreet aspect ratio
SVFSky view factor
CFDComputational fluid dynamics
OUT_SET*Outdoor SET
TCVThermal comfort voting
TSVThermal sensory voting
TPVThermal preference voting
PMVPredicted Mean Vote
TRThermal radiation
TaAir temperature
TsSurface temperature
WSWind speed
RHRelative humidity

References

  1. IPCC. Climate Change 2007. Impacts, Adaptation, and Vulnerability; Contribution of Working Group II to the Fourth Assessment Report of the IPCC; IPCC: Geneva, Switzerland, 2007. [Google Scholar]
  2. IPCC. Summary for policymakers. In Climate Change 2013: The Physical Science Basis; Stocker, T.F., Qin, D., Plattner, G.-K., Tignor, M., Allen, S.K., Boschung, J., Nauels, A., Xia, Y., Bex, V., Midgley, P.M., Eds.; Cambridge University Press: Cambridge, UK, 2013. [Google Scholar]
  3. World Meteorological Organization. The Global Climate 2001–2010: A Decade of Climate Extremes Summary Report [EB/OL]. Available online: https://library.wmo.int/pmb_ged/wmo_1119_en.Pdf (accessed on 22 March 2022).
  4. World Meteorological Organization. WMO Statement on the State of the Global Climate in 2017 [EB/OL]. Available online: https://library.wmo.int/doc_num.php?explnum_id=4453 (accessed on 22 March 2022).
  5. Huynen, M.M.; Martens, P.; Schram, D.; Weijenberg, M.P.; Kunst, A.E. The impact of heat waves and cold spells on mortality rates in the Dutch population. Environ. Health Perspect. 2001, 109, 463–470. [Google Scholar] [CrossRef]
  6. China Meteorological Administration. [Heat Science] What is a Heat Wave [EB/OL]. Available online: http://www.cma.gov.cn/2011qxfw/2011qqxkp/2011qkpdt/201110/t20111026_124192.html (accessed on 22 March 2022).
  7. Meng, Q.-l.; Wang, P.; Li, Q. Evaluation Methods of Urban Thermal Environment. Chin. Landsc. Archit. 2014, 30, 13–16. [Google Scholar]
  8. Stewart, I.D. A systematic review and scientific critique of methodology in modern urban heat island literature. Int. J. Climatol. 2011, 31, 200–217. [Google Scholar] [CrossRef]
  9. Srivanit, M.; Hokao, K. Evaluating the cooling effects of greening for improving the outdoor thermal environment at an institutional campus in the summer. Build. Environ. 2013, 66, 158–172. [Google Scholar] [CrossRef]
  10. Karimipour, N. Implications of Urban Design Strategies for Urban Heat Islands: An Investigation of the UHI Effect in Downtown Austin, Texas; The University of Texas: Austin, TX, USA, 2017; Available online: http://hdl.handle.net/2152/61758 (accessed on 22 March 2022).
  11. Zhang, Y.; Huang, S.; Yin, S.; Xiao, Y. A Study of Urban Design Assessment in Hot and Humid Area Based on Optimization of Wind and Thermal Environment: The Case Study of Baiyun New Town, Guangzhou. Urban Plan. Forum 2019, 251, 109–118. [Google Scholar] [CrossRef]
  12. He, B.J.; Wang, J.; Liu, H.; Ulpiani, G. Localized synergies between heat waves and urban heat islands: Implications on human thermal comfort and urban heat management. Environ. Res. 2021, 193, 110584. [Google Scholar] [CrossRef]
  13. Yang, J.; Wang, Z.H.; Kaloush, K.E.; Dylla, H. Effect of pavement thermal properties on mitigating urban heat islands: A multi-scale modeling case study in Phoenix. Build. Environ. 2016, 108, 110–121. [Google Scholar] [CrossRef] [Green Version]
  14. Hsieh, C.M.; Huang, H.C. Mitigating urban heat islands: A method to identify potential wind corridor for cooling and ventilation. Comp. Environ. Urban Syst. 2016, 57, 130–143. [Google Scholar] [CrossRef]
  15. Hsieh, C.M.; Chen, H.; Ooka, R.; Yoon, J.; Kato, S.; Miisho, K. Simulation analysis of site design and layout planning to mitigate thermal environment of riverside residential development. In Building Simulation; Tsinghua Press: Beijing, China, 2010; Volume 3, pp. 51–61. [Google Scholar] [CrossRef]
  16. Inostroza, L.; Palme, M.; de la Barrera, F. A heat vulnerability index: Spatial patterns of exposure, sensitivity and adaptive capacity for Santiago de Chile. PLoS ONE 2016, 11, e0162464. [Google Scholar] [CrossRef] [Green Version]
  17. Gago, E.J.; Roldan, J.; Pacheco-Torres, R.; Ordóñez, J. The city and urban heat islands: A review of strategies to mitigate adverse effects. Renew. Sustain. Energy Rev. 2013, 25, 749–758. [Google Scholar] [CrossRef]
  18. Gunawardena, K.R.; Wells, M.J.; Kershaw, T. Utilising green and bluespace tomitigate urban heat island intensity. Sci. Total Environ. 2017, 584, 1040–1055. [Google Scholar] [CrossRef] [PubMed]
  19. Johnson, D.P.; Stanforth, A.; Lulla, V.; Luber, G. Developing an applied extreme heat vulnerability index utilizing socioeconomic and environmental data. Appl. Geogr. 2012, 35, 23–31. [Google Scholar] [CrossRef]
  20. Norton, B.A.; Coutts, A.M.; Livesley, S.J.; Harris, R.J.; Hunter, A.M.; Williams, N.S.G. Planning for cooler cities: A framework to prioritise green infrastructure to mitigate high temperatures in urban landscapes. Landsc. Urban Plan. 2015, 134, 127–138. [Google Scholar] [CrossRef]
  21. Vailshery, L.S.; Jaganmohan, M.; Nagendra, H. Effect of street trees on microclimate and air pollution in a tropical city. Urban For. Urban Green. 2013, 12, 408–415. [Google Scholar] [CrossRef]
  22. Abreu-Harbich LV, D.; Labaki, L.C.; Matzarakis, A. Effect of tree planting design and tree species on human thermal comfort in the tropics. Landsc. Urban Plan. 2015, 138, 99–109. [Google Scholar] [CrossRef]
  23. Sanusi, R.; Johnstone, D.; May, P.; Livesley, S.J. Street orientation and side of the street greatly influence the microclimatic benefits street trees can provide in summer. J. Environ. Qual. 2016, 45, 167–174. [Google Scholar] [CrossRef] [Green Version]
  24. Shahrestani, M.; Yao, R.; Luo, Z.; Turkbeyler, E.; Davies, H. A field study of urban microclimates in London. Renew. Energy 2015, 73, 3–9. [Google Scholar] [CrossRef] [Green Version]
  25. Mahmoud, A.H.A. Analysis of the microclimaticand human comfort conditions in an urban park in hot and arid regions. Build. Environ. 2011, 46, 2641–2656. [Google Scholar] [CrossRef]
  26. Ali, J.M.; Marsh, S.H.; Smith, M.J. Modelling the spatiotemporal change of canopy urban heat islands. Build. Environ. 2016, 107, 64–78. [Google Scholar] [CrossRef] [Green Version]
  27. Peng, S.; Piao, S.; Ciais, P.; Friedlingstein, P.; Ottle, C.; Bréon, F.-M.; Nan, H.; Zhou, L.; Myneni, R.B. Surface urban heat island across 419 global big cities. Environ.Sci. Technol. 2012, 46, 696–703. [Google Scholar] [CrossRef]
  28. Gartland, L. Heat Islands: Understanding and Mitigating Heat in Urban Areas; Version 1; Routledge: London, UK, 2008. [Google Scholar] [CrossRef]
  29. Gartland, L. Heat Islands: Understanding and Mitigating Heat in Urban Areas; Version 2; Routledge: London, UK, 2010. [Google Scholar] [CrossRef]
  30. Liu, H.; Weng, Q. Seasonal variations in the relationship between landscape pattern and land surface temperature in Indianapolis, USA. Environ. Monit. Assess. 2008, 144, 199–219. [Google Scholar] [CrossRef] [PubMed]
  31. Emmanuel, R. An Urban Approach to Climate Sensitive Design: Strategies for the Tropics; Taylor & Francis: Milton Park, UK, 2012. [Google Scholar] [CrossRef]
  32. Luber, G.; McGeehin, M. Climate change and extreme heat events. Am. J. Prev. Med. 2008, 35, 429–435. [Google Scholar] [CrossRef] [PubMed]
  33. Tomlinson, C.J.; Chapman, L.; Thornes, J.E.; Baker, C.J. Including the urban heat island in spatial heat health risk assessment strategies: A case study for Birmingham, UK. Int. J. Health Geogr. 2011, 10, 1–14. [Google Scholar] [CrossRef] [PubMed] [Green Version]
  34. Loughnan, M.; Nicholls, N.; Tapper, N.J. Mapping heat health risks in urban areas. Int. J. Popul. Res. 2012, 2012, 518687. [Google Scholar] [CrossRef]
  35. United Nations Environment Programme. Beating the Heat: A Sustainable Cooling Handbook for Cities; United Nations Environment Programme: Nairobi, Kenya, 2021. [Google Scholar]
  36. Kalkstein, L.S.; Jamason, P.F.; Greene, J.S.; Libby, J.; Robinson, L. The Philadelphia hot weather-health watch-warning system: Development and application, summer 1995. Bull. Am. Meteorol. Soc. 1996, 77, 1519–1528. [Google Scholar] [CrossRef] [Green Version]
  37. Acero, J.A.; Herranz-Pascual, K. A comparison of thermal comfort conditions in four urban spaces by means of measurements and modelling techniques. Build. Environ. 2015, 93, 245–257. [Google Scholar] [CrossRef]
  38. Cheng, Y.; Niu, J.; Gao, N. Thermal comfort models: A review and numerical investigation. Build. Environ. 2012, 47, 13–22. [Google Scholar] [CrossRef]
  39. Liu, B.; Wei, D. Review and Prospect of Thermal Comfort in Green Space. Planners 2017, 33, 102–107. [Google Scholar]
  40. Liu, B.; Peng, X. The Progress and Enlightenment of Research on Microclimate Comfort in Urban Streets. Chin. Landsc. Archit. 2019, 35, 57–62. [Google Scholar]
  41. Zhang, J.; Li, K.; Zhao, L. Characteristics of Evaluation on Subjective Thermal Comfort in Different Outdoor Spaces in Summer in Hot and Humid Areas. Build. Sci. 2019, 35, 18–24. [Google Scholar]
  42. Olesen, B.W.; Brager, G.S. A Better Way to Predict Comfort: The New ASHRAE Standard 55-2004. 2004. Available online: https://escholarship.org/uc/item/2m34683k (accessed on 22 March 2022).
  43. Höppe, P. The physiological equivalent temperature—A universal index for the biometeorological assessment of the thermal environment. Int. J. Biometeorol. 1999, 43, 71–75. [Google Scholar] [CrossRef] [PubMed]
  44. Pickup, J.; de Dear, R. An Outdoor Thermal Comfort Index (OUT_SET*)—Part I: The Model and Its Assumptions. Biometeorology and Urban Climatology at the Turn of the Millennium. In Proceedings of the Conference ICB-ICUC’99, Sydney, Australia, 8–12 November 1999; World Meteorological Organization: Geneva, Switzerland, 2000; pp. 279–283. [Google Scholar]
  45. Jendritzky, G.; Bucher, K.; Laschewski, G.; Walther, H. Atmospheric heat exchange of the human being, bioclimate assessments, mortality and thermal stress. Int. J. Circumpolar Health 2000, 59, 222–227. [Google Scholar] [PubMed]
  46. Nip, I.S.B.; Green, J.R.; Marx, D.B. Early speech motor development: Cognitive and linguistic considerations. J. Commun. Disord. 2009, 42, 286–298. [Google Scholar] [CrossRef] [PubMed] [Green Version]
  47. Bedford, T. The Warmth Factor in Comfort at Work. A Physiological Study of Heating and Ventilation. In Industrial Health Research Board Report. Medical Research Council; The Stationery Office: London, UK, 1936; Volume 76. [Google Scholar]
  48. Panraluk, C.; Sreshthaputra, A. Developing guidelines for thermal comfort and energy saving during hot season of multipurpose senior centers in Thailand. Sustainability 2019, 12, 170. [Google Scholar] [CrossRef] [Green Version]
  49. Hwang, R.L.; Lin, T.P. Thermal comfort requirements for occupants of semi-outdoor and outdoor environments in hot-humid regions. Archit. Sci. Rev. 2007, 50, 357–364. [Google Scholar] [CrossRef]
  50. Spagnolo, J.; De Dear, R. A field study of thermal comfort in outdoor and semi-outdoor environments in subtropical Sydney Australia. Build. Environ. 2003, 38, 721–738. [Google Scholar] [CrossRef] [Green Version]
  51. Kántor, N.; Égerházi, L.; Unger, J. Subjective estimation of thermal environment in recreational urban spaces—part 1: Investigations in Szeged, Hungary. Int. J. Biometeorol. 2012, 56, 1075–1088. [Google Scholar] [CrossRef]
  52. Cheng, V.; Ng, E.; Chan, C.; Givoni, B. Outdoor thermal comfort study in a sub-tropical climate: A longitudinal study based in Hong Kong. Int. J. Biometeorol. 2012, 56, 43–56. [Google Scholar] [CrossRef]
  53. Zhou, Z.; Chen, H.; Deng, Q.; Mochida, A. A field study of thermal comfort in outdoor and semi-outdoor environments in a humid subtropical climate city. J. Asian Archit. Build. Eng. 2013, 12, 73–79. [Google Scholar] [CrossRef]
  54. Lai, D.; Zhou, C.; Huang, J.; Jiang, Y.; Long, Z.; Chen, Q. Outdoor space quality: A field study in an urban residential community in central China. Energy Build. 2014, 68, 713–720. [Google Scholar] [CrossRef]
  55. Yang, W.; Wong, N.H.; Jusuf, S.K. Thermal comfort in outdoor urban spaces in Singapore. Build. Environ. 2013, 59, 426–435. [Google Scholar] [CrossRef]
  56. Lai, D.; Guo, D.; Hou, Y.; Lin, C.; Chen, Q. Studies of outdoor thermal comfort in northern China. Build. Environ. 2014, 77, 110–118. [Google Scholar] [CrossRef]
  57. Wei, D.; Liu, B. The Analysis and Evaluation of Thermal Comfort at Shanghai Knowledge & Innovation Community Square. Chin. Landsc. Archit. 2018, 34, 5–12. [Google Scholar]
  58. Yingsheng, Z.; Yuan, S.; Chao, R.; Edward, N.G. Urban Ventilation Strategies for Micro Climate Improvement in Subtropical High-density Cities:A Case Study of Tai Po Market in Hong Kong. Urban Plan. Int. 2016, 31, 68–75. [Google Scholar]
  59. Yang, Z.; Chen, Y.; Wu, Z.; Zheng, Z.; Li, J. Spatial pattern of urban heat island and multivariate modeling of impact factors in the Guangdong-Hong Kong-Macao Greater Bay area. Resour. Sci. 2019, 41, 1154–1166. [Google Scholar] [CrossRef] [Green Version]
  60. Guoliang, L. The Key Technologies and Systems of Urban Heat Island Mitigation on Urban-Scales Based GIS Platform; Zhejiang University: Hangzhou, China, 2010. [Google Scholar]
  61. Tapia, C.; Abajo, B.; Feliu, E.; Mendizabal, M.; Martinez, J.A.; Fernández, J.G.; Laburu, T.; Lejarazu, A. Profiling urban vulnerabilities to climate change: An indicator-based vulnerability assessment for European cities. Ecol. Indic. 2017, 78, 142–155. [Google Scholar] [CrossRef]
  62. Uejio, C.K.; Wilhelmi, O.V.; Golden, J.S.; Mills, D.M.; Gulino, S.P.; Samenow, J.P. Intra-urban societal vulnerability to extreme heat: The role of heat exposure and the built environment, socioeconomics, and neighborhood stability. Health Place 2011, 17, 498–507. [Google Scholar] [CrossRef]
  63. Li, J.; Zhao, T.; Zhu, W.; Luo, Y. Urban Heat Island Effect Based on Landsat8 Image in Urban Districts of Chongqing, China. Mt. Res. 2018, 36, 452–461. [Google Scholar] [CrossRef]
  64. Luo, X.; Yang, J.; Sun, W.; He, B. Suitability of human settlements in mountainous areas from the perspective of ventilation: A case study of the main urban area of Chongqing. J. Clean. Prod. 2021, 310, 127467. [Google Scholar] [CrossRef]
  65. Oke, T.R. Street design and urban canopy layer climate. Energy Build. 1988, 11, 103–113. [Google Scholar] [CrossRef]
  66. Stewart, I.D.; Oke, T.R. Local climate zones for urban temperature studies. Bull. Am. Meteorol. Soc. 2012, 93, 1879–1900. [Google Scholar] [CrossRef]
  67. Gulyás, Á.; Unger, J.; Matzarakis, A. Assessment of the microclimatic and human comfort conditions in a complex urban environment: Modelling and measurements. Build. Environ. 2006, 41, 1713–1722. [Google Scholar] [CrossRef]
  68. Imran, H.M.; Hossain, A.; Islam, A.K.M.; Rahman, A.; Bhuiyan MA, E.; Paul, S.; Alam, A. Impact of land cover changes on land surface temperature and human thermal comfort in Dhaka City of Bangladesh. Earth Syst. Environ. 2021, 5, 667–693. [Google Scholar] [CrossRef]
  69. Huang, H.; An, Z. Study on Heatwave Disaster Prevention and Control Planning System—Enlightenment of Major Countries in the World. IOP Conf. Ser. Earth Environ. Sci. 2021, 696, 012025. [Google Scholar] [CrossRef]
Figure 1. The methodological framework of the study.
Buildings 12 00625 g001
Figure 2. Distribution of measurement points.
Buildings 12 00625 g002
Figure 3. Representative sky fisheye photos of the four measurement areas: (a) is the Jiefangbei measurement point; (b) is the Dajing Lane measurement point; (c) is the People’s Park measurement point; (d) is the Riverside Park measurement point.
Buildings 12 00625 g003
Figure 4. Subjective heat sensation voting scale; (a) is the Thermal comfort voting scale; (b) is the Thermal sensory voting scale.
Buildings 12 00625 g004
Figure 5. Folding line diagram of thermal environment factors for each measurement point: (a) Thermal Radiation; (b) Air Temperature; (c) Surface Temperature; (d) Relative Humidity.
Buildings 12 00625 g005
Figure 6. Crowd Heat Comfort Voting: (a) Thermal Sensory Voting (TSV); (b) Thermal Comfort Voting (TCV).
Buildings 12 00625 g006
Figure 7. Analysis of the mean thermal sensory vote (TSV) and mean thermal comfort vote (TCV) and PET fit for each measurement area: (a) Jiefangbei (TCV); (b) Dajing Lane (TCV); (c) People’s Park (TCV); (d) Riverside Park (TCV); (e) Jiefangbei (TSV); (f) Dajing Lane (TSV) (g) People’s Park (TSV); (h) Riverside Park (TSV).
Buildings 12 00625 g007
Figure 8. Nonlinear fitting of crowd heat voting to PET: (a) Relationship between TCV and PET for thermal comfort voting in each measurement area; (b) Relationship between TSV and PET for thermal sensory voting in each measurement area.
Buildings 12 00625 g008
Figure 9. The change of PET at each measurement point during the actual measurement period.
Buildings 12 00625 g009
Table 1. Basic information of each measurement area.
1 Road Alignment (Long Direction)Height to Width Ratio/(H/D)High Difference/m
(Measurement Points)
Sky View Factor (0–1)
Business District (Jiefangbei)
B1, B2, B3, B4
135°3.491.60.566
Residence (Dajing Lane)
R1, R2, R3, R4
160°0.4564.70.301
Mountain Park (People’s Park)
P1, P2, P3
45°0.5040.80.381
Riverside Park (Riverside Park)
P4
15°1.650.00.258
1 The E-W strike is 0° strike.
Table 2. Summary of the data used to calculate PET values.
Dajing LaneJiefangbeiRiverside ParkPeople’s Park
Air Temperature/°CMax44.8(36.7)40.3(35.6)37.4(34.5)38.2(36.0)
Min31.2(33.2)31.5(32.9)26.6(29.1)32.1(33.2)
AVG35.735.834.835.1
Relative Humidity/%Max68.8(54.3)60.0(47.2)70.0(53.4)62.0(48.6)
Min42.8(45.6)37.7(40.1)43.0(47.5)40.1(42.6)
AVG52.347.653.448.4
Wind Speed/(m\S)Max0.4(0.1)3.4(1.7)3.1(1.5)1.5(0.3)
Min0.0(0.0)0.2(0.4)0.0(0.6)0.0(0.1)
AVG0.30.91.50.4
Thermal radiation/W/m2Max850.0(487.3)581.0(329.2)0.0(0.0)690.0(440.0)
Min0.0(0.0)0.0(0.0)0.0(0.0)0.0(0.0)
AVG180.9111.10.098.2
PET/°CMax37.5(30.8)48.6(36.5)36.1(31.5)49.7(37.6)
Min26.7(28.2)28.2(30.1)22.6(26.5)26.6(29.9)
AVG34.236.432.137.6
Table 3. Correlation analysis of PET and thermal environment factors at each measurement point.
Measurement Points PETTRTaRhLST
B1PETPearson correlation10.634 *0.972 **−0.915 **0.639 *
Sig. (2-tailed) 0.0270.0000.0000.025
B2PETPearson correlation10.4690.948 **−0.842 **0.604 *
Sig. (2-tailed) 0.1240.0000.0010.037
B3PETPearson correlation10.928 **0.926 **−0.717 **0.916 **
Sig. (2-tailed) 0.0000.0000.0000.000
B4PETPearson correlation10.963 **0.952 **−0.724 **0.701 *
Sig. (2-tailed) 0.0000.0000.0080.011
R1PETPearson correlation10.938 **0.788 **−0.689 *0.694 *
Sig. (2-tailed) 0.0000.0020.0130.012
R2PETPearson correlation10.906 **0.921 **−0.6660.819 **
Sig. (2-tailed) 0.0000.0000.0180.001
R3PETPearson correlation10.3560.845 **−0.838 **0.874 **
Sig. (2-tailed) 0.2560.0010.0010.000
R4PETPearson correlation10.959 **0.779 **−0.673 *0.875 **
Sig. (2-tailed) 0.0000.0030.0160.000
P1PETPearson correlation10.815 **−0.0420.0410.708 **
Sig. (2-tailed) 0.0010.8970.8980.010
P2PETPearson correlation10.884 **0.315−0.2230.698 *
Sig. (2-tailed) 0.0000.3190.4870.012
P3PETPearson correlation1−0.0890.467−0.5520.280
Sig. (2-tailed) 0.7840.1260.0630.378
P4PETPearson correlation1/0.952 **−0.864 **0.910 **
Sig. (2-tailed) /0.0000.0000.000
**: Significantly correlated at the 0.01 level (2-tailed); *: Significantly correlated at the 0.05 level (2-tailed).
Publisher’s Note: MDPI stays neutral with regard to jurisdictional claims in published maps and institutional affiliations.

