
Factors Affecting Residential End-Use Energy: Multiple Regression Analysis Based on Buildings, Households, Lifestyles, and Equipment

Abstract
:1. Introduction
2. Materials and Methods
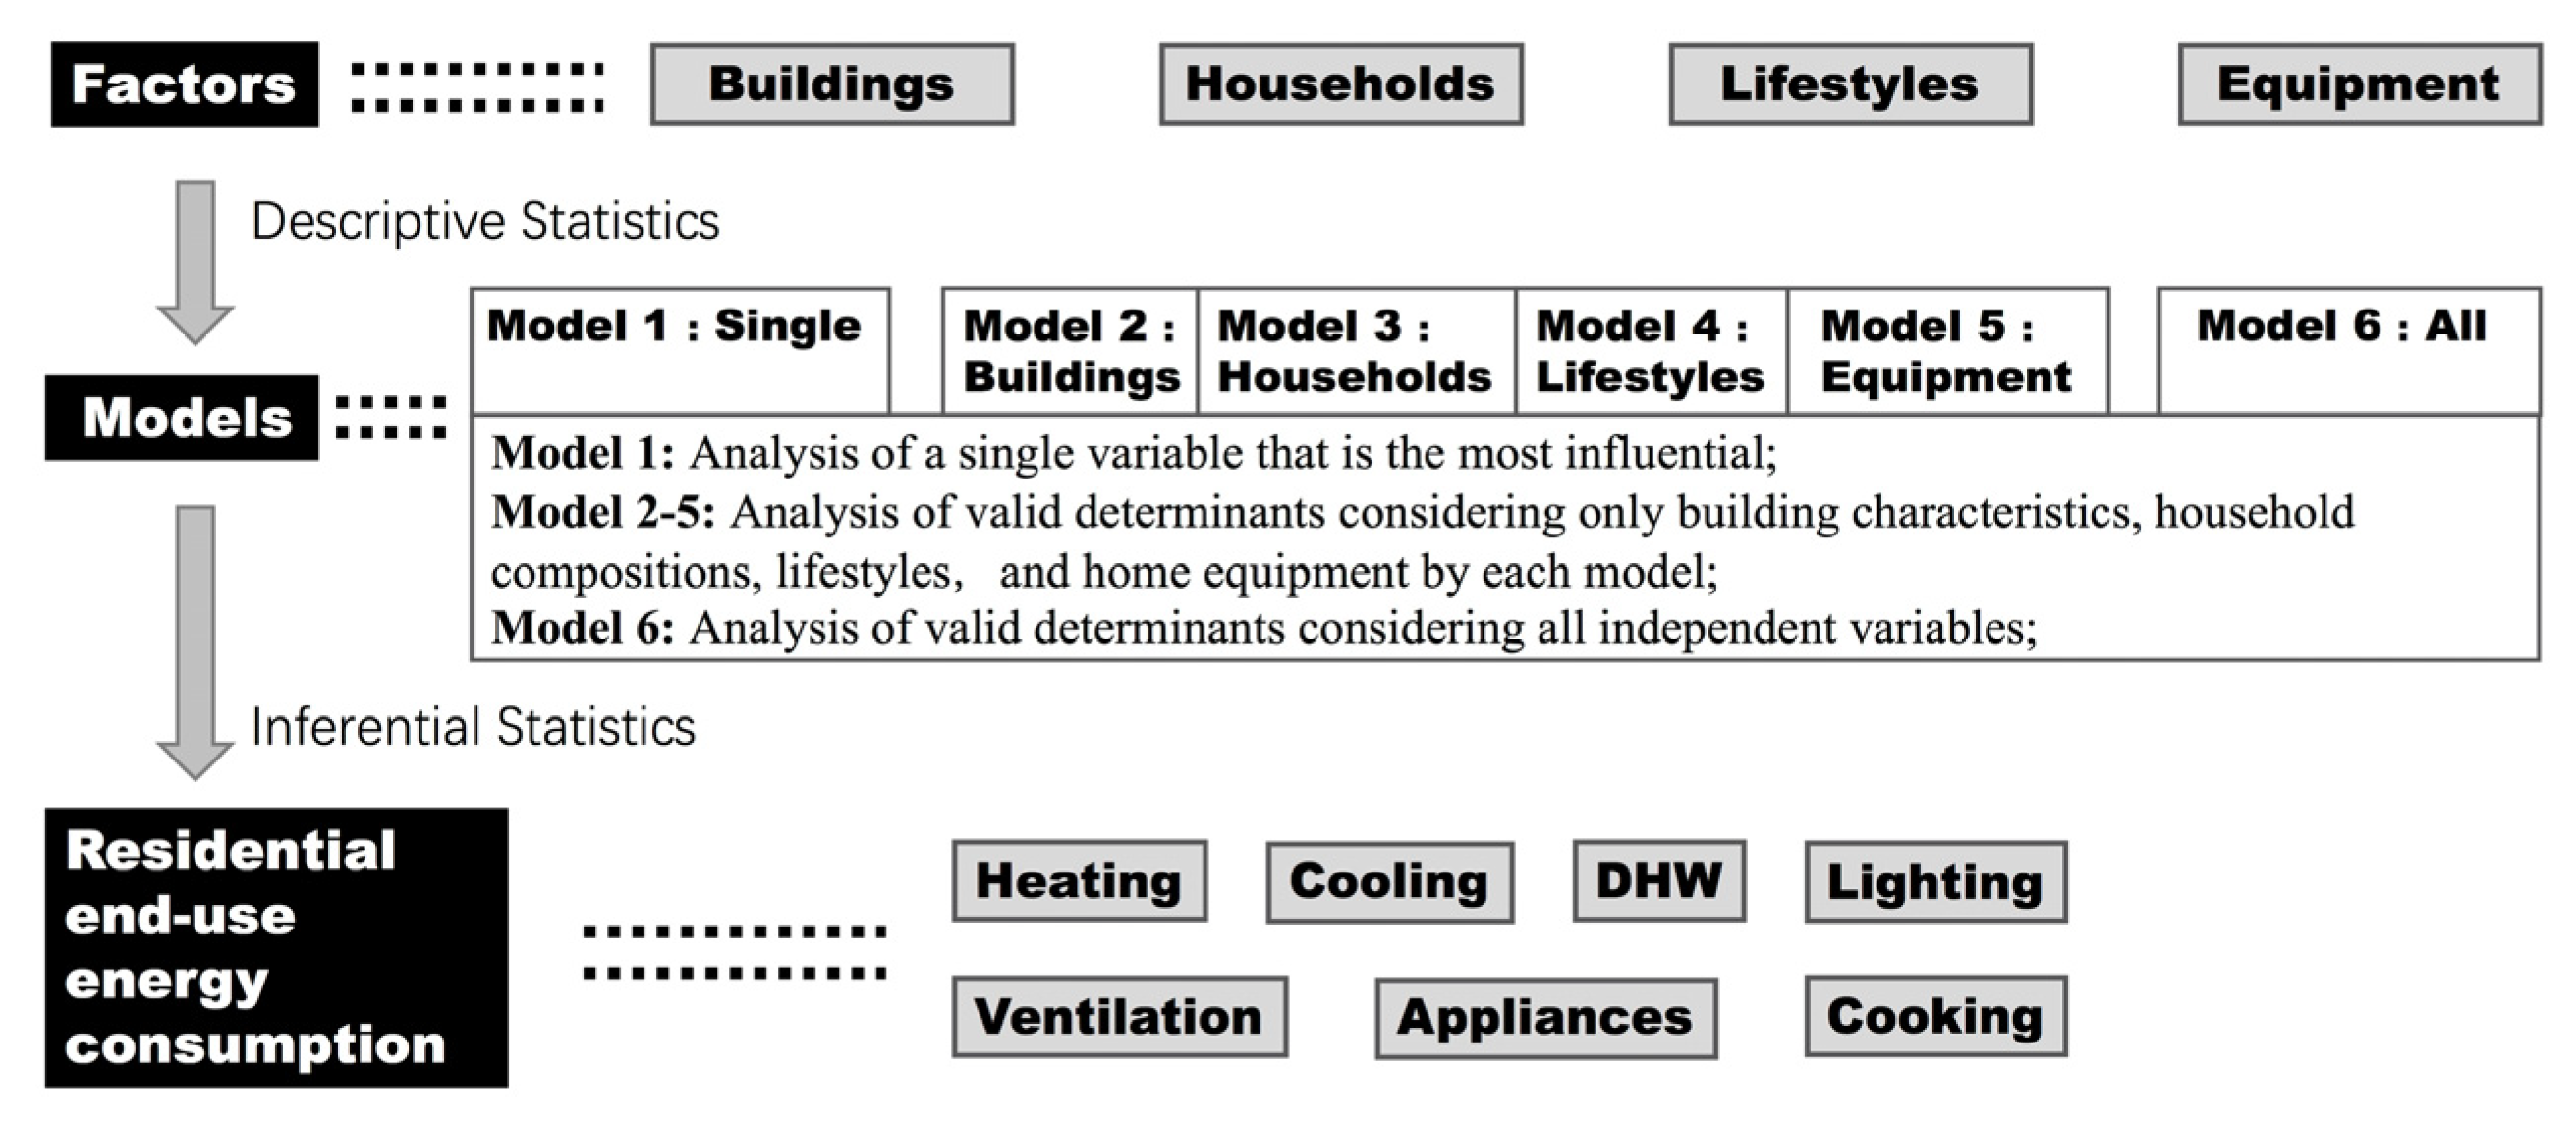
2.1. Study Method Overview
2.2. Overall Sample Design
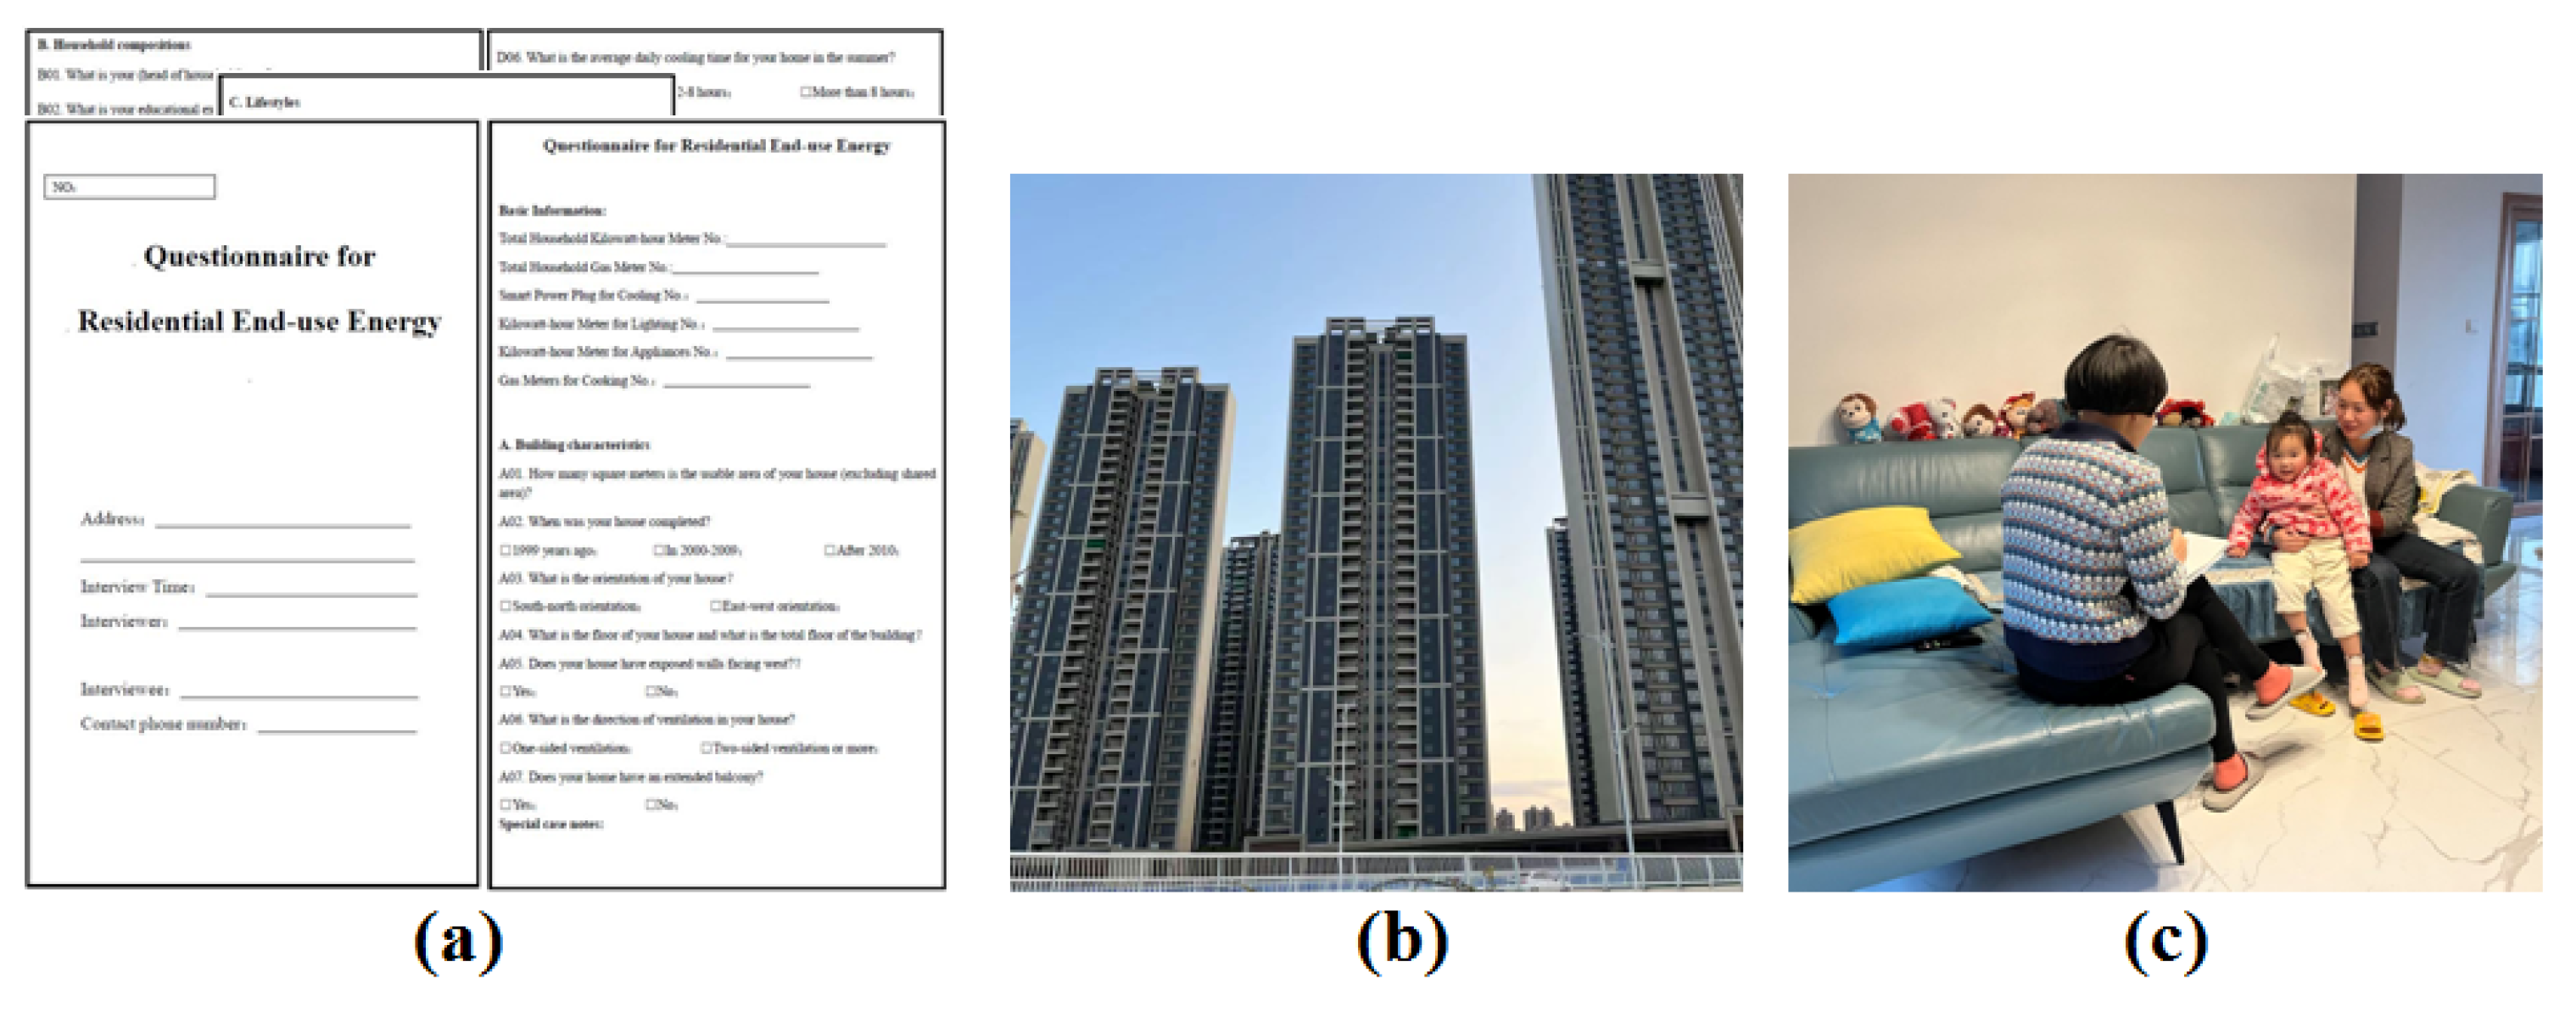
2.3. Field Survey Description
2.4. Classification and Measurement
2.5. Data Analysis
3. Results
3.1. Basic Information
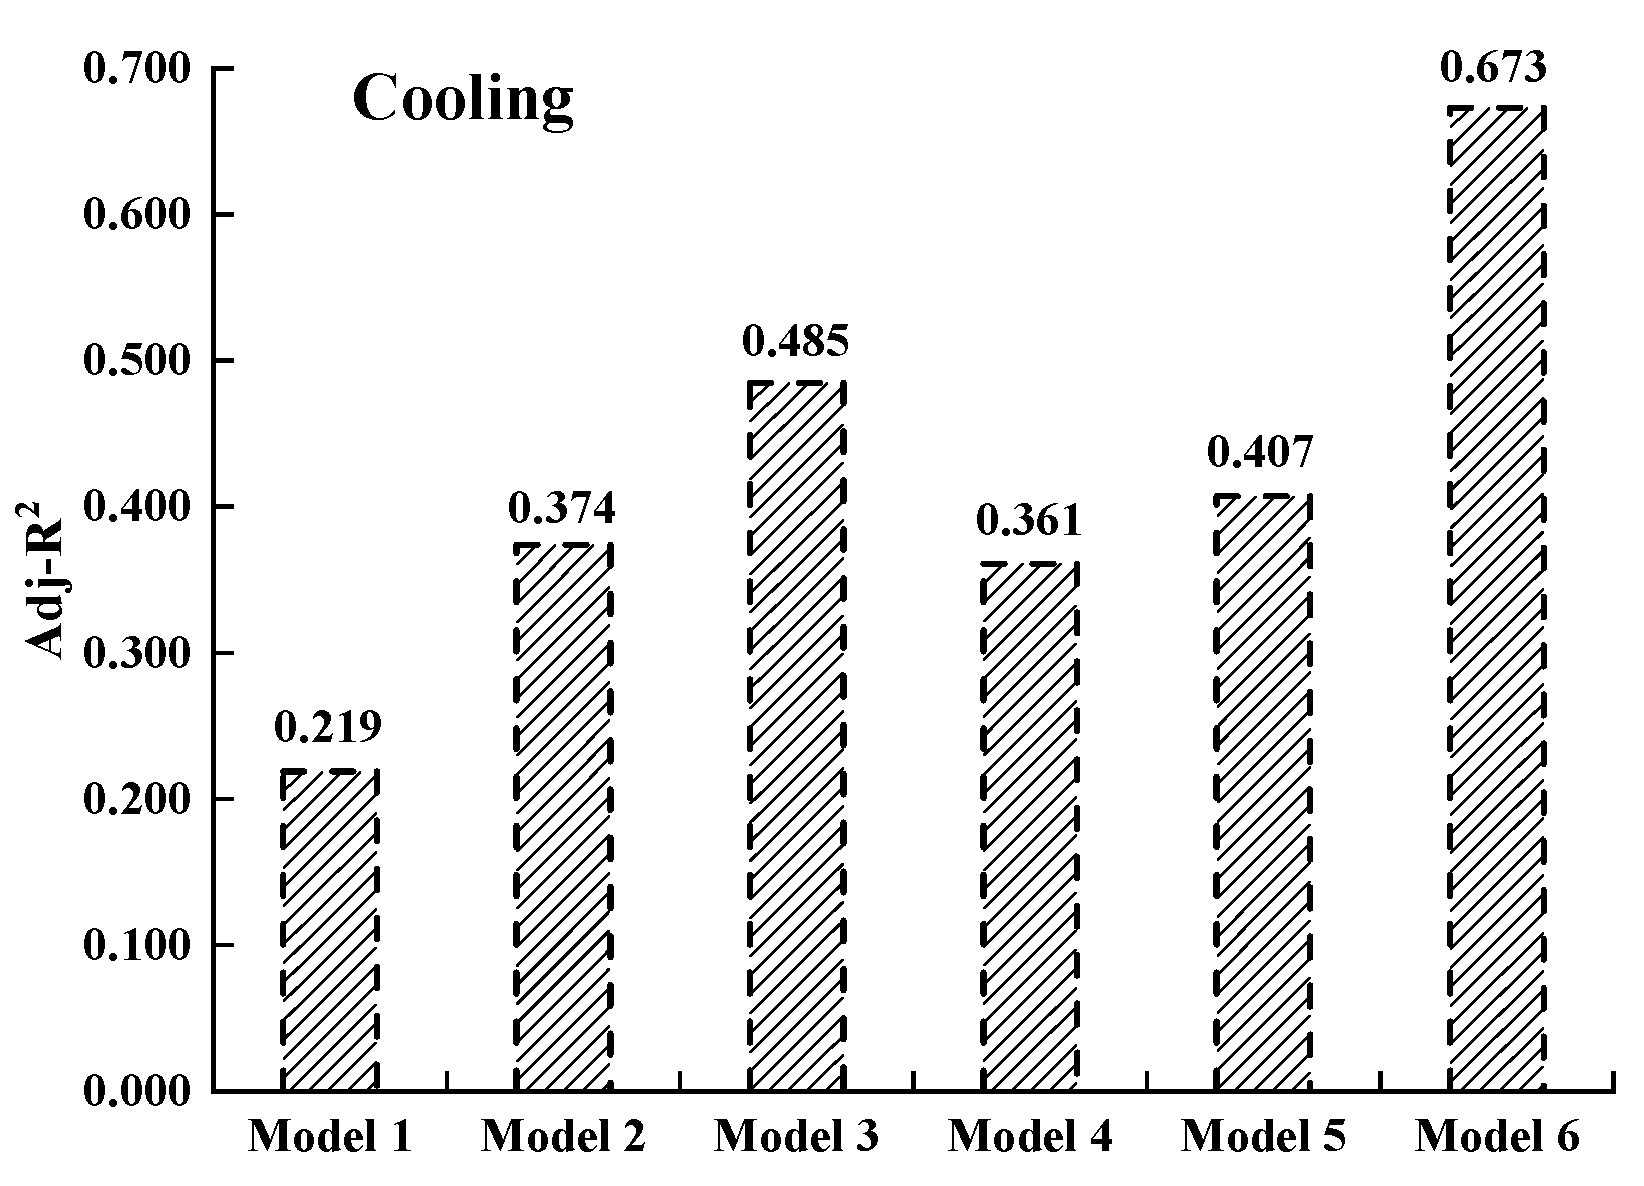
3.2. Cooling
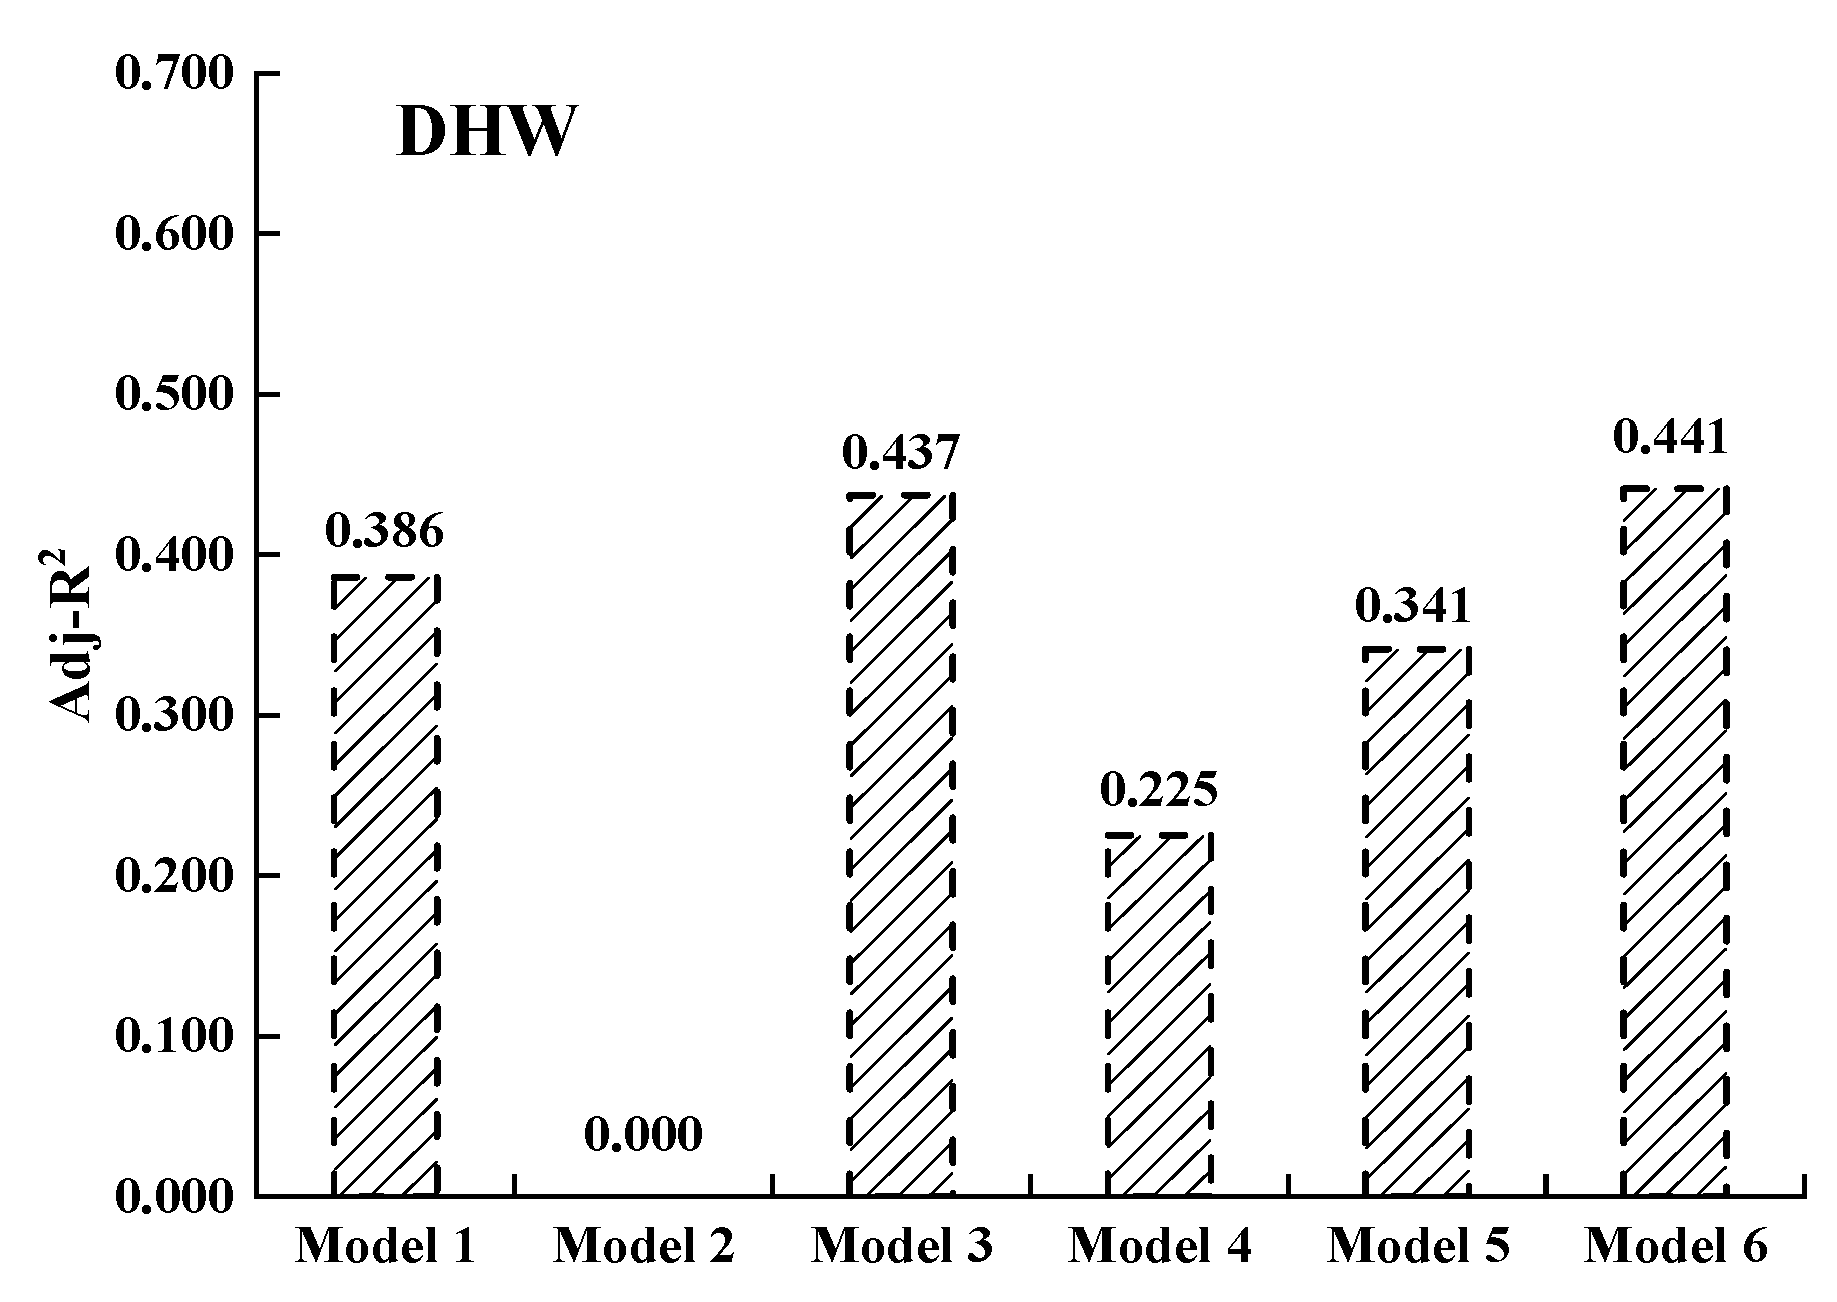
3.3. DHW
3.4. Lighting
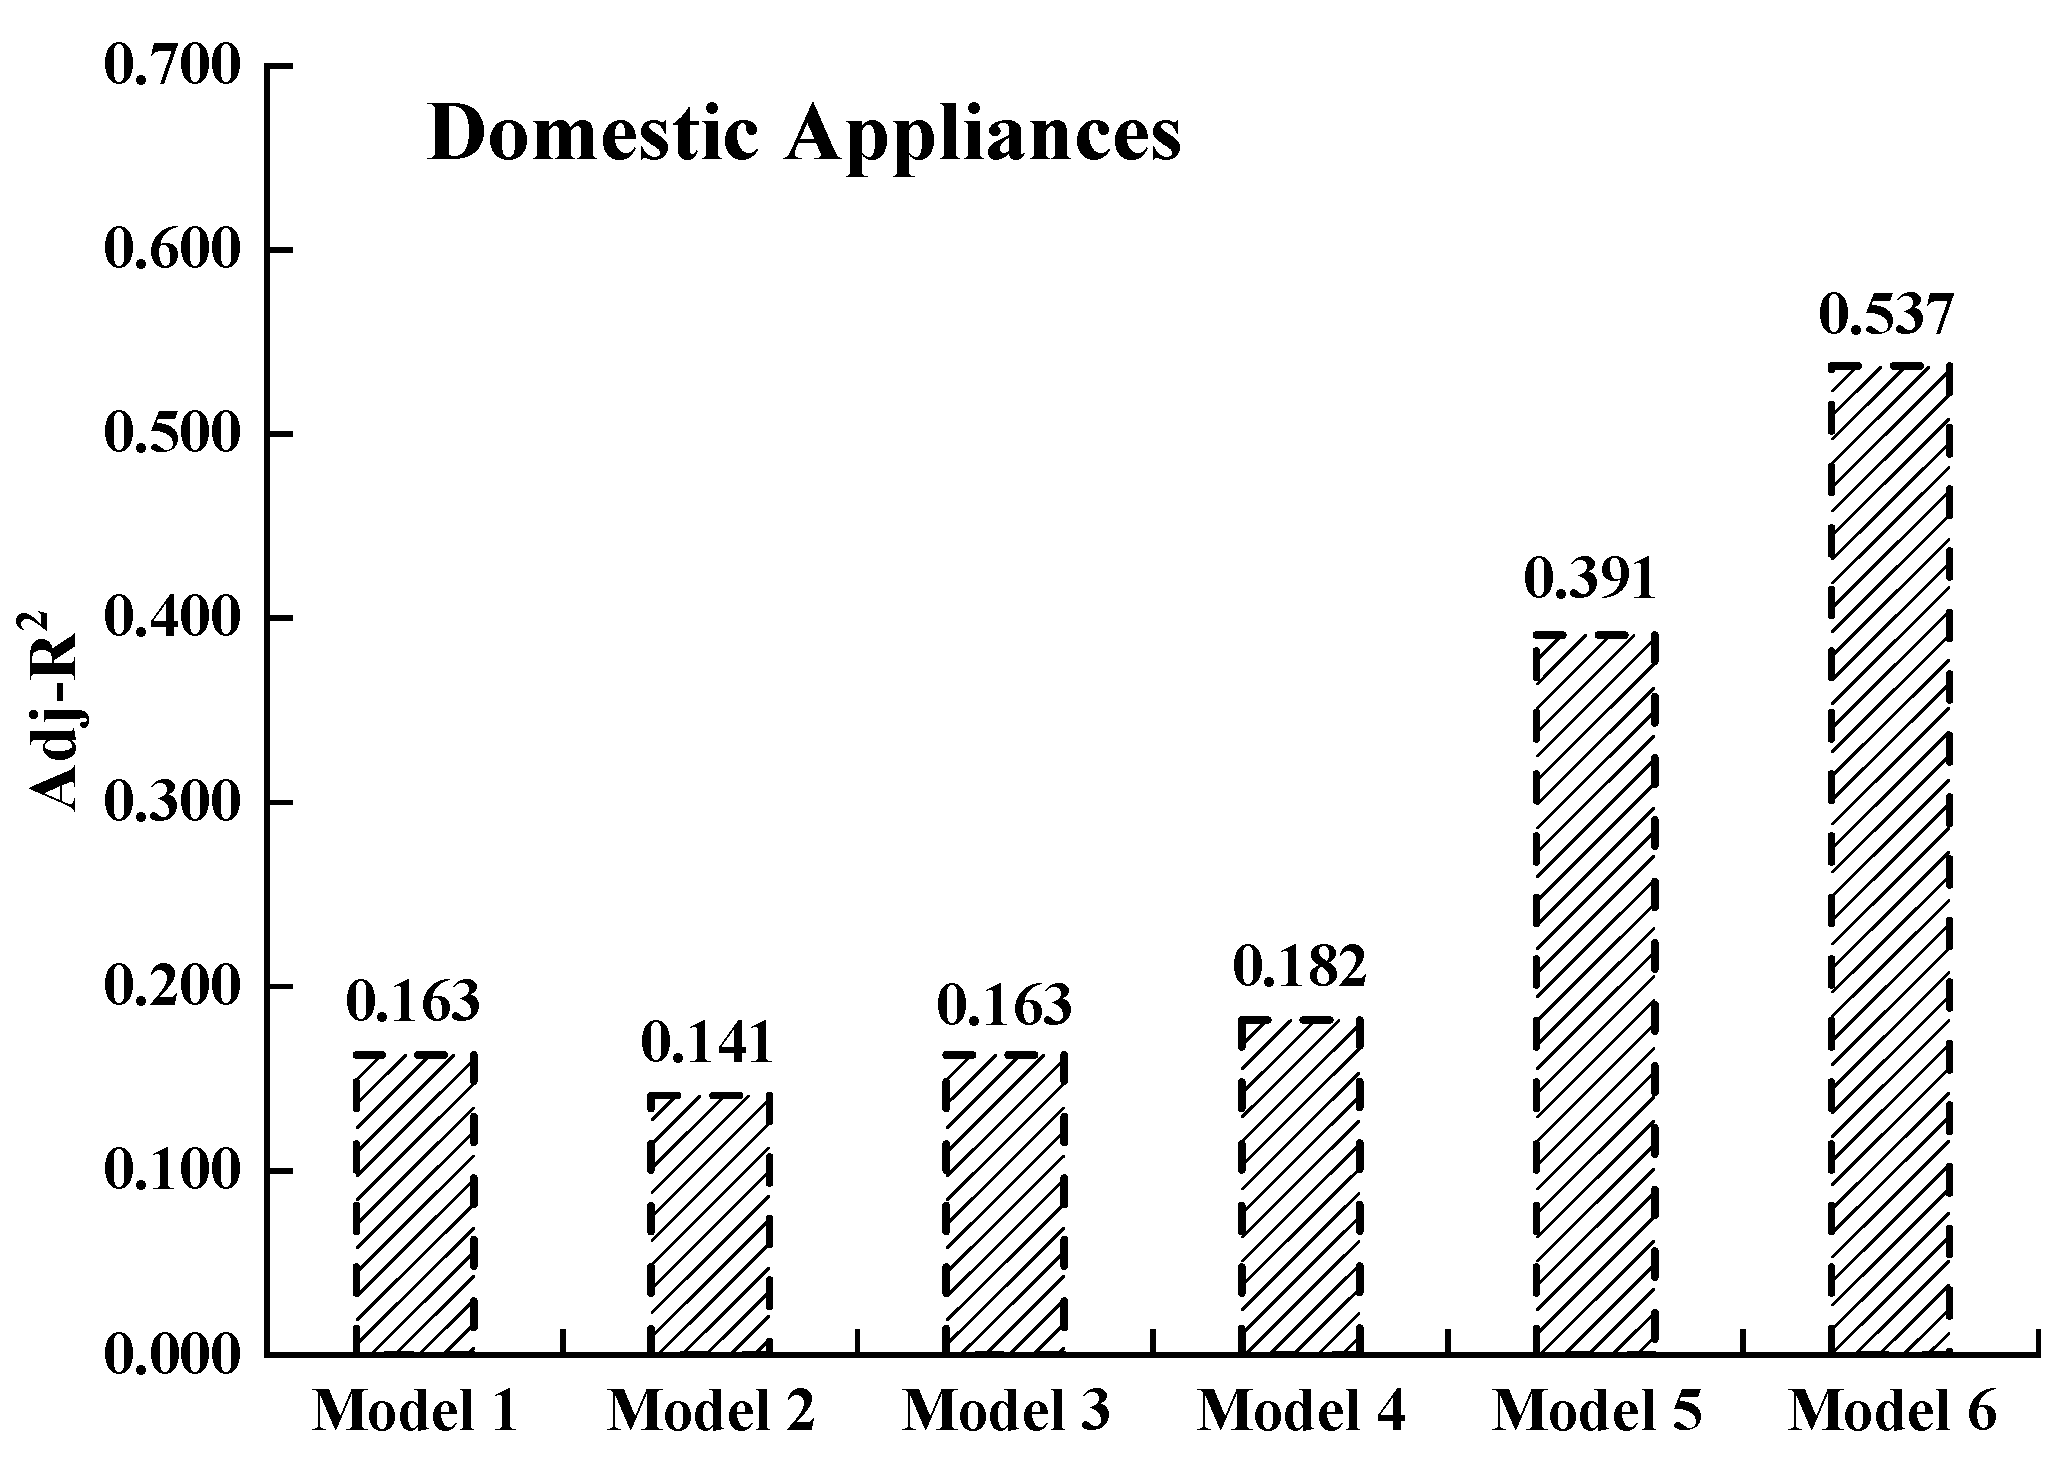
3.5. Appliances
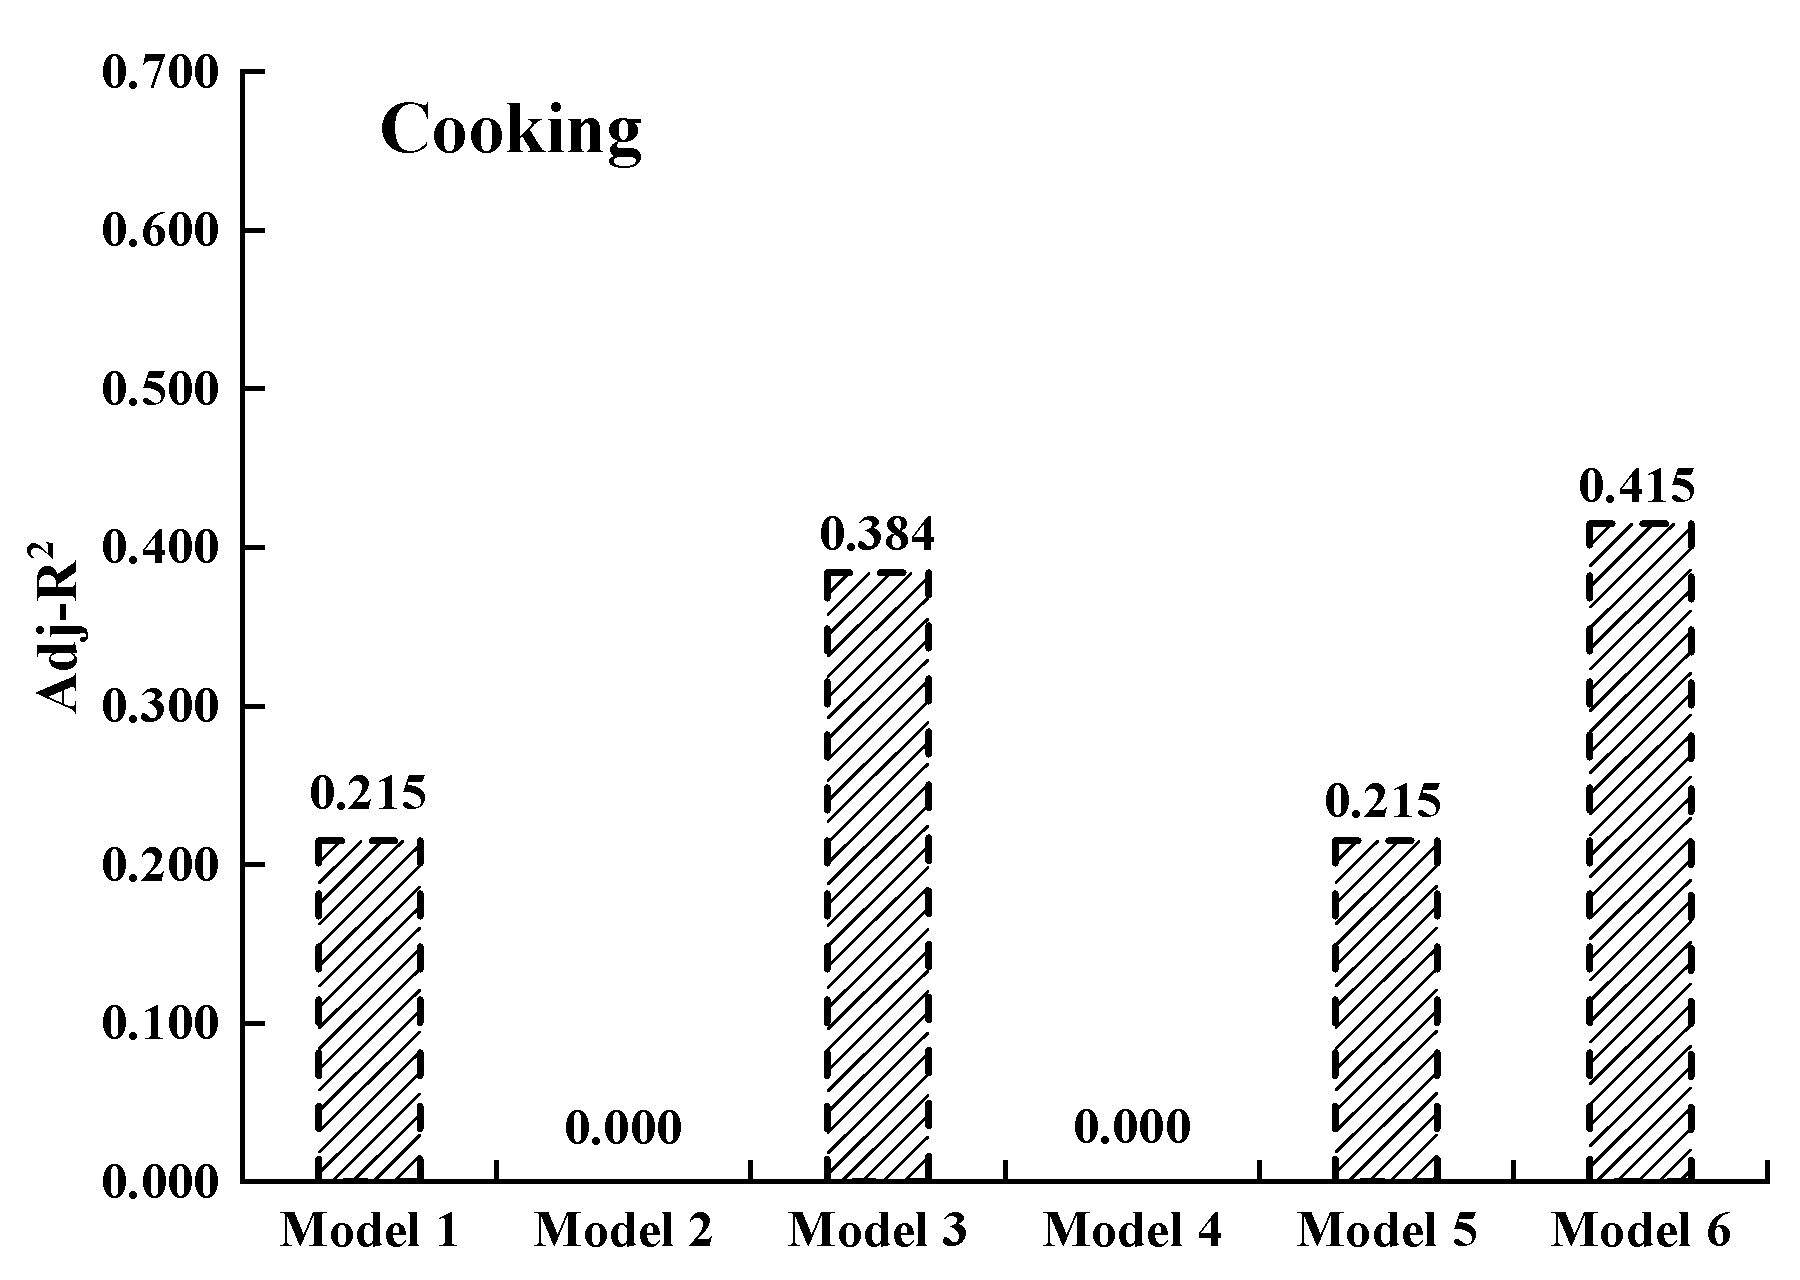
3.6. Cooking
4. Conclusions
Author Contributions
Funding
Institutional Review Board Statement
Informed Consent Statement
Data Availability Statement
Conflicts of Interest
References
- Clark, M.; Domingo, N.; Colgan, K.; Thakrar, S.; Tilman, D.; Lynch, J.; Azevedo, I.; Hill, J. System approach in complex integra Global food system emissions could preclude achieving the 1.5 and 2 °C climate change targets. Science 2020, 370, 705–708. [Google Scholar] [CrossRef]
- Fang, K.; Tang, Y.; Zhang, Q.; Song, J.; Wen, Q.; Sun, H.; Ji, C.; Xu, A. Will China peak its energy-related carbon emissions by 2030? Lessons from 30 Chinese provinces. Appl. Energy 2019, 255, 113852. [Google Scholar] [CrossRef]
- Jia, Z.; Lin, B. How to achieve the first step of the carbon-neutrality 2060 target in China: The coal substitution perspective. Energy 2021, 233, 121179. [Google Scholar] [CrossRef]
- Yang, L.; Yan, H.; Lam, J.C. Thermal comfort and building energy consumption implications–A review. Appl. Energy 2014, 115, 164–173. [Google Scholar] [CrossRef]
- Li, G.; Kou, C.; Wang, H. Estimating city-level energy consumption of residential buildings: A life-cycle dynamic simulation model. J. Environ. Manag. 2019, 240, 451–462. [Google Scholar] [CrossRef]
- Butler, D. Architecture: Architects of a low-energy future. Nature 2008, 452, 520–523. [Google Scholar] [CrossRef] [Green Version]
- Li, M.; Cao, J.; Guo, J.; Niu, J.; Xiong, M. Response of energy consumption for building heating to climatic change and variability in Tianjin City, China. Meteorol. Appl. 2015, 23, 123–131. [Google Scholar] [CrossRef] [Green Version]
- Huebner, G.M.; Hamilton, I.; Chalabi, Z.; Shipworth, D.; Oreszczyn, T. Explaining domestic energy consumption-The comparative contribution of building factors, socio-demographics, behaviours and attitudes. Appl. Energy 2015, 159, 589–600. [Google Scholar] [CrossRef] [Green Version]
- He, C.; Tian, W.; Shao, Z. Impacts of Courtyard Envelope Design on Energy Performance in the Hot Summer–Cold Winter Region of China. Buildings 2022, 12, 173. [Google Scholar] [CrossRef]
- Brom, P.V.D.; Hansen, A.R.; Gram-Hanssen, K.; Meijer, A.; Visscher, H. Variances in residential heating consumption-Importance of building characteristics and occupants analysed by movers and stayers. Appl. Energy 2019, 250, 713–728. [Google Scholar] [CrossRef]
- Uddin, M.N.; Wei, H.-H.; Chi, H.L.; Ni, M. Influence of Occupant Behavior for Building Energy Conservation: A Systematic Review Study of Diverse Modeling and Simulation Approach. Buildings 2021, 11, 41. [Google Scholar] [CrossRef]
- Kavousian, A.; Rajagopal, R.; Fischer, M. Determinants of residential electricity consumption: Using smart meter data to examine the effect of climate, building characteristics, appliance stock, and occupants’ behavior. Energy 2013, 55, 184–194. [Google Scholar] [CrossRef]
- Palme, M.; Isalgué, A.; Coch, H. Avoiding the Possible Impact of Climate Change on the Built Environment: The Importance of the Building’s Energy Robustness. Buildings 2013, 3, 191–204. [Google Scholar] [CrossRef] [Green Version]
- Chen, Y.; Li, M.; Cao, J.; Cheng, S.; Zhang, R. Effect of climate zone change on energy consumption of office and residential buildings in China. Arch. Meteorol. Geophys. Bioclimatol. Ser. B 2021, 144, 353–361. [Google Scholar] [CrossRef]
- Kotharkar, R.; Ghosh, A.; Kapoor, S.; Reddy, D.G.K. Approach to local climate zone based energy consumption assessment in an Indian city. Energy Build. 2022, 259, 111835. [Google Scholar] [CrossRef]
- Lee, S.-J.; Song, S.-Y. Determinants of residential end-use energy: Effects of buildings, sociodemographics, and household appliances. Energy Build. 2021, 257, 111782. [Google Scholar] [CrossRef]
- Choi, M.; Oh, S.; Ji, C.; Lee, D. An analysis of residential building energy consumption using building energy integrated database-focused on building uses, regions, scale and the year of construction completion. J. Real Estate Anal. 2017, 3, 101–118. [Google Scholar] [CrossRef]
- Williams, K.T.; Gomez, J.D. Predicting future monthly residential energy consumption using building characteristics and climate data: A statistical learning approach. Energy Build. 2016, 128, 1–11. [Google Scholar] [CrossRef]
- Hasegawa, Y.; Inoue, T. Energy consumption in housing on the basis of national scale questionnaire: Study on influence of residential characteristic and dispersion of energy consumption Part 1. J. Environ. Eng. 2004, 69, 23–28. [Google Scholar] [CrossRef]
- Jones, R.V.; Lomas, K.J. Determinants of high electrical energy demand in UK homes: Socio-economic and dwelling characteristics. Energy Build. 2015, 101, 24–34. [Google Scholar] [CrossRef] [Green Version]
- Hara, K.; Uwasu, M.; Kishita, Y.; Takeda, H. Determinant factors of residential consumption and perception of energy conservation: Time-series analysis by large-scale questionnaire in Suita, Japa. Energy Pilicy. 2015, 87, 240–249. [Google Scholar] [CrossRef]
- Choi, Y.; Song, D.; Ozaki, A.; Lee, H.; Park, S. Do energy subsidies affect the indoor temperature and heating energy consumption in low-income households? Energy Build. 2022, 256, 111678. [Google Scholar] [CrossRef]
- Otsuka, A.; Masuda, T.; Narumi, D. A study on lifestyles promoting energy-saving: Focusing on people’s values, energy-cognition and energy consumption among two-generation families in Tokyo Metropolitan Region. J. Environ. Eng. 2020, 85, 776–777. [Google Scholar] [CrossRef]
- Jalas, M.; Juntunen, J.K. Energy intensive lifestyles: Time use, the activity patterns of consumers, and related energy demands in Finland. Ecol. Econ. 2015, 113, 51–59. [Google Scholar] [CrossRef]
- Du, P.; Wood, A.; Stephens, B. Empirical Operational Energy Analysis of Downtown High-Rise vs. Suburban Low-Rise Lifestyles: A Chicago Case Study. Energies 2016, 9, 445. [Google Scholar] [CrossRef] [Green Version]
- Jones, R.V.; Lomas, K.J. Determinants of high electrical energy demand in UK homes: Appliance ownership and use. Energy Build. 2016, 117, 71–82. [Google Scholar] [CrossRef] [Green Version]
- Lee, S.-J.; Kim, Y.-J.; Jin, H.-S.; Kim, S.-I.; Ha, S.-Y.; Song, S.-Y. Residential End-Use Energy Estimation Models in Korean Apartment Units through Multiple Regression Analysis. Energies 2019, 12, 2327. [Google Scholar] [CrossRef] [Green Version]
- Yasugi, K.; Nishina, D.; Murakawa, S.; Kindaichi, S.; Ando, M. Electric power consumption and operating characteristics of kitchen instruments–Study on the energy consumption of electrified housing in Hiroshima area. J. Environ. Eng. 2015, 80, 381–388. [Google Scholar] [CrossRef] [Green Version]
- Debs, L.; Metzinger, J. A Comparison of Energy Consumption in American Homes by Climate Region. Buildings 2022, 12, 82. [Google Scholar] [CrossRef]
- Jang, H.; Kang, J. A stochastic model of integrating occupant behaviour into energy simulation with respect to actual energy consumption in high-rise apartment buildings. Energy Build. 2016, 121, 205–216. [Google Scholar] [CrossRef] [Green Version]
- Swan, L.G.; Ugursal, V.I. Modeling of end-use energy consumption in the residential sector: A review of modeling techniques. Renew. Sust. Energy Rev. 2009, 13, 1819–1835. [Google Scholar] [CrossRef]
- Wang, L.; Lee, E.W.; Hussian, S.A.; Yuen, A.C.Y.; Feng, W. Quantitative impact analysis of driving factors on annual residential building energy end-use combining machine learning and stochastic methods. Appl. Energy 2021, 299, 117303. [Google Scholar] [CrossRef]
- Grygierek, J.; Sarna, I.; Grygierek, K. Effects of climate change on thermal comfort and energy demand in a single-family house in Poland. Buildings 2021, 11, 595. [Google Scholar] [CrossRef]
- Batih, H.; Sorapipatana, C. Characteristics of urban households’ electrical energy consumption in Indonesia and its saving potentials. Renew. Sustain. Energy Rev. 2016, 57, 1160–1173. [Google Scholar] [CrossRef]
- Choi, B.; Jin, H.; Kang, J.; Kim, S.; Lim, J.; Song, S. Measurement and normalization methods of energy consumption by end-use in apartment buildings for providing detailed energy information. J. Korean Inst. Archit. Sustain. Environ. Build. Syst. 2015, 9, 437–447. [Google Scholar]
- ISO 16346:2013; Energy Performance of Buildings: Assessment of all Overall Energy Performance. International Organization for Standardization: Geneva, Switzerland, 2013.


| Construction Year | Floor Area | Number of Sample Buildings |
|---|---|---|
| 1999 or earlier | Smaller than 60 m2 | 7 |
| Smaller than 110 m2 | 8 | |
| 110 m2 or larger | 7 | |
| 2009 or earlier | Smaller than 60 m2 | 7 |
| Smaller than 110 m2 | 8 | |
| 110 m2 or larger | 7 | |
| 2010 or later | Smaller than 60 m2 | 7 |
| Smaller than 110 m2 | 8 | |
| 110 m2 or larger | 7 | |
| Sum | - | 66 |
| Factors | Variable | Units | Scale | Description and Range |
|---|---|---|---|---|
| Building characteristics | AREA | m2 | Ratio | Floor area; 42–148 |
| YR * | - | Nominal | Residential completion year (Dummy variable, D1, D2); (0,0): 1999 or earlier (Base), (1,0): 2009 or earlier, (0,1): 2010 or later | |
| ORNT | - | Nominal | Residential unit orientation (Dummy variable, D1); 0: south or north (Base), 1: east or west | |
| FLR | EA | Nominal | Living floor (Dummy variable, D1); 0: bottom floor and middle floor (Base), 1: top floor | |
| EW_west | - | Nominal | Exposed wall on the west side (Dummy variable, D1); 0: have no (Base), 1: have | |
| VEN_dir | - | Nominal | Direction of ventilation (Dummy variable, D1); 0: single direction ventilation (Base), 1: two or more directions ventilation | |
| BAL-ext | - | Nominal | Balcony extension status (Dummy variable, D1); 0: not extended (Base), 1: extended | |
| Household compositions | FM_no | Person | Ratio | Number of family members; 1–7 |
| HF_age | Year | Ratio | Head of family age; 21–85 | |
| FM_no (≥60) | Person | Ratio | Number of family members aged 60 or older; 0–4 | |
| FM_no (22–59) | Person | Ratio | Number of family members aged 22 to 59; 0–3 | |
| FM_no (8–21) | Person | Ratio | Number of family members aged 8 to 21; 0–3 | |
| FM_no (≤7) | Person | Ratio | Number of family members aged 7 or younger; 0–3 | |
| FW_no | Person | Ratio | Number of family workers; 0–4 | |
| Lifestyles | COOL_sel | - | Nominal | Selection of cooling equipment (Dummy variable, D1); 0: fan (Base), 1: fan and air conditioner |
| COOL_temp | °C | Ratio | Cooling set temperature; 16–29 | |
| AIR_grade | - | Nominal | Air conditioner energy efficiency grade 1 (Dummy variable, D1, D2); (0,0): Level 1 (Base), (1,0): Level 2, (0,1): Level 3 | |
| ESM_use | - | Nominal | Energy-saving mode use for electrical appliances (Dummy variable, D1); 0: not use (Base); 1: use | |
| Home equipment | HEAT_type | - | Nominal | Heating-appliances source type (Dummy variable, D1); 0: air conditioner (Base); 1: electric heater |
| HEAT_op | - | Nominal | Heating-appliances operating hour (based on average daily operating hours) (Dummy variable, D1, D2); (0,0): 2 h or less (Base), (1,0): 8 h or less, (0,1): more than 8 h | |
| AIR_no | EA | Ratio | Number of air conditioners mainly used; 0–4 | |
| AIR_op | - | Nominal | Air conditioners operating hours (based on average daily operating hours) (Dummy variable, D1, D2); (0,0): 2 h or less (Base), (1,0): 8 h or less, (0,1): more than 8 h | |
| FAN_no | EA | Ratio | Number of air conditioners mainly used; 0–6 | |
| FAN_op | - | Nominal | Fan operating hours (based on average daily operating hours) (Dummy variable, D1, D2); (0,0): 2 h or less (Base), (1,0): 8 h or less, (0,1): more than 8 h | |
| DHW_type | - | Nominal | DHW-appliances source type (Dummy variable, D1) 0: gas water heater (Base), 1: electric water heater | |
| DHW_h | Hour | Ratio | Average daily DHW usage hours; 0–4 | |
| Lighting_h | Hour | Ratio | Average daily lighting hours; 0.5–12 | |
| EF_no | EA | Ratio | Number of exhaust fans; 1–4 | |
| AP_no | EA | Ratio | Number of air purifiers; 0–6 | |
| Frige_no | EA | Ratio | Number of refrigerators; 0–2 | |
| TV_no | EA | Ratio | Number of TVs (including video projectors); 0–4 | |
| TV_hr | Hour | Ratio | Average daily TV usage hours; 0–14 | |
| PC_no | EA | Ratio | Number of personal computers; 0–3 | |
| PC_h | Hour | Ratio | Average daily PC usage hours; 0–16 | |
| WF_no | EA | Ratio | Number of water fountains; 1–3 | |
| WM_no | EA | Ratio | Number of washing machines; 0–3 | |
| Cooking_type | - | Nominal | Cooking-appliances source type (Dummy variable, D1); 0: gas stove, 1: electric stove | |
| Cooking_h | Hour | Ratio | Average daily cooking hours; 0.5–4.5 |
| Classification | Description | Energy Sources |
|---|---|---|
| Heating | Energy consumption of air conditioners and electric heaters | Electricity |
| Cooling | Energy consumption of air conditioners and fans | Electricity |
| DHW | Energy consumption for providing hot water equipment, such electric water heater, gas water heater | Electricity or gas |
| Lighting | Energy consumption of the whole indoor lighting devices | Electricity |
| Ventilation | Energy consumption from exhaust fans for kitchens and air purification devices for bedrooms | Electricity |
| Appliances | Energy consumption of appliances, such as refrigerators, washing machine, TV, computers, etc. | Electricity |
| Cooking | Energy consumption from electric cooking or gas cooking | Electricity or gas |
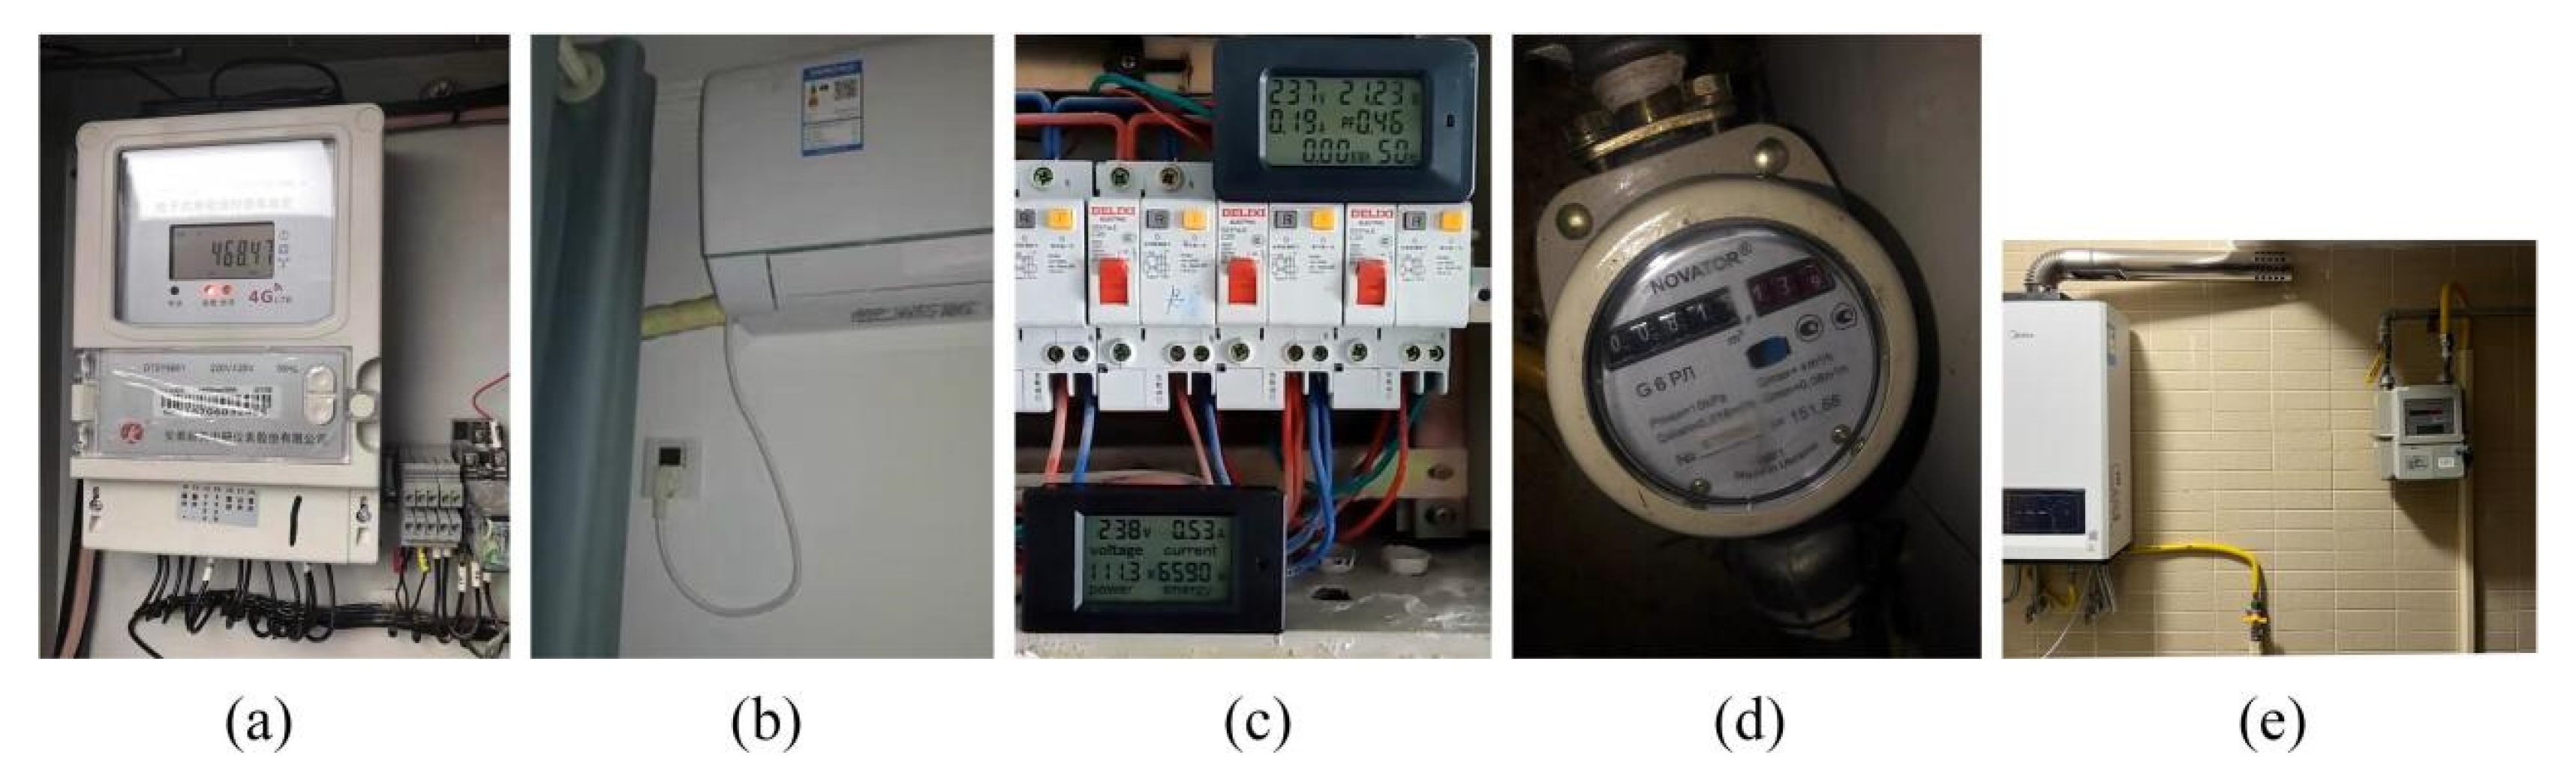
| Instruments | Model Name | Specifications |
|---|---|---|
| (a)-Kilowatt-hour meter for total household power | RS485 | Measurement voltage: 220 V ± 10% |
| Measurement current: 60 A | ||
| Error: ±0.6% | ||
| Size: 217 × 145 × 53 mm | ||
| (b)-Smart power plug for cooling | CY711-16A | Measurement voltage: 220 V ± 10% |
| Measurement current: 16 A | ||
| Measurement power: 3500 W | ||
| Error: ±0.5% | ||
| Size: 86 × 86 × 36 mm | ||
| (c)-Kilowatt-hour meter for lighting and appliances | P06S-20 | Measurement voltage: 110–250 V |
| Measurement current: 20 A | ||
| Measurement power: 4400 W | ||
| Error: ±0.5% | ||
| Size: 90 × 54.5 × 28 mm | ||
| (d)-Gas meters for cooking | LLQ-15 | Maximum operating pressure: 10 kPa |
| Maximum flowrate: 4.0 m3/h | ||
| Minimum flowrate: 0.016 m3/h | ||
| Error: ±1.5% | ||
| Size: 125 × 100 × 60 mm | ||
| (e)-Gas meters for domestic hot water (DHW) | J4.0 | Maximum operating pressure: 30 kPa |
| Maximum flowrate: 6.0 m3/h | ||
| Minimum flowrate: 0.04 m3/h | ||
| Error: ±1.5% | ||
| Size: 224 × 217 × 170 mm |
| Classification | Heating | Cooling | DHW | Lighting | Ventilation | Appliances | Cooking |
|---|---|---|---|---|---|---|---|
| Number of valid samples | 37 | 53 | 44 | 47 | 39 | 45 | 51 |
| Average | 48 | 3384 | 904 | 368 | 40 | 1944 | 1312 |
| Maximum | 112 | 6899 | 2131 | 976 | 107 | 3412 | 1951 |
| Minimum | 0 | 673 | 217 | 149 | 0 | 1125 | 283 |
| Standard deviation | 41 | 1765 | 782 | 171 | 34 | 527 | 346 |
| Average-based ratio | 0.6% | 42.3% | 11.3% | 4.6% | 0.5% | 24.3% | 16.4% |
| Cooling | Buildings | Households | Lifestyles | Equipment | Adj-R2/ F-Sig. | ||||||
|---|---|---|---|---|---|---|---|---|---|---|---|
| FLR (D1) | EW_ west (D1) | FM_no (22–59) | FM_no | COOL_ sel (D1) | COOL_ temp | AIR_ no | AIR_op (D1) | AIR_op (D2) | |||
| Model 1 (Single) | β | 715 | 0.219/0.003 | ||||||||
| Std. error | 118 | ||||||||||
| t-Sig. | 0.003 | ||||||||||
| Model 2 (Buildings) | β | 457 | 582 | 0.374/0.001 | |||||||
| Std. error | 71 | 92 | |||||||||
| t-Sig. | 0.006 | 0.014 | |||||||||
| Model 3 (Households) | β | 549 | 233 | 0.485/0.000 | |||||||
| Std. error | 67 | 48 | |||||||||
| t-Sig. | 0.004 | 0.002 | |||||||||
| Model 4 (Lifestyles) | β | 1071 | 356 | 0.361/0.006 | |||||||
| Std. error | 185 | 41 | |||||||||
| t-Sig. | 0.007 | 0.013 | |||||||||
| Model 5 (Equipment) | β | 337 | 584 | 1155 | 0.407/0.002 | ||||||
| Std. error | 52 | 95 | 176 | ||||||||
| t-Sig. | 0.011 | 0.024 | 0.015 | ||||||||
| Model 6 (All) | β | 217 | 353 | 772 | 384 | 562 | 0.673/0.000 | ||||
| Std. error | 46 | 51 | 134 | 55 | 77 | ||||||
| t-Sig. | 0.009 | 0.003 | 0.005 | 0.012 | 0.008 | ||||||
| DHW | Households | Lifestyles | Equipment | Adj-R2/ F-Sig. | |||
|---|---|---|---|---|---|---|---|
| FM_no | FM_no (≥60) | FM_no (≤7) | ESM_use (D1) | DHW_h | |||
| Model 1 (Single) | β | 211 | 0.386/0.000 | ||||
| Std. error | 43 | ||||||
| t-Sig. | 0.000 | ||||||
| Model 2 (Buildings) | β | - | |||||
| Std. error | |||||||
| t-Sig. | |||||||
| Model 3 (Households) | β | 177 | 221 | 257 | 0.437/0.000 | ||
| Std. error | 54 | 72 | 85 | ||||
| t-Sig. | 0.003 | 0.005 | 0.008 | ||||
| Model 4 (Lifestyles) | β | −282 | 0.225/0.000 | ||||
| Std. error | 93 | ||||||
| t-Sig. | 0.011 | ||||||
| Model 5 (Equipment) | β | 269 | 0.341/0.000 | ||||
| Std. error | 85 | ||||||
| t-Sig. | 0.003 | ||||||
| Model 6 (All) | β | 164 | 203 | 0.441/0.000 | |||
| Std. error | 83 | 64 | |||||
| t-Sig. | 0.002 | 0.001 | |||||
| Lighting | Buildings | Households | Lifestyles | Equipment | Adj-R2/ F-Sig. | ||
|---|---|---|---|---|---|---|---|
| AREA | FM_no | FM_no (8–21) | ESM_use (D1) | Lighting_h | |||
| Model 1 (Single) | β | 5 | 0.291/0.001 | ||||
| Std. error | 1 | ||||||
| t-Sig. | 0.001 | ||||||
| Model 2 (Buildings) | β | 5 | 0.291/0.001 | ||||
| Std. error | 1 | ||||||
| t-Sig. | 0.001 | ||||||
| Model 3 (Households) | β | 63 | 71 | 0.342/0.000 | |||
| Std. error | 23 | 19 | |||||
| t-Sig. | 0.000 | 0.023 | |||||
| Model 4 (Lifestyles) | β | −137 | 0.183/0.008 | ||||
| Std. error | 42 | ||||||
| t-Sig. | 0.008 | ||||||
| Model 5 (Equipment) | β | 65 | 0.279/0.002 | ||||
| Std. error | 21 | ||||||
| t-Sig. | 0.002 | ||||||
| Model 6 (All) | β | 4 | 63 | 42 | 0.516/0.000 | ||
| Std. error | 1 | 15 | 19 | ||||
| t-Sig. | 0.003 | 0.001 | 0.004 | ||||
| Appliances | Buildings | Households | Lifestyles | Equipment | Adj-R2/ F-Sig. | |||||
|---|---|---|---|---|---|---|---|---|---|---|
| AREA | FM_no | ESM_use (D1) | AIR_ op(D1) | AIR_ op(D2) | DHW_h | PC_h | Cooking_h | |||
| Model 1 (Single) | β | 321 | 0.163/0.008 | |||||||
| Std. error | 94 | |||||||||
| t-Sig. | 0.008 | |||||||||
| Model 2 (Buildings) | β | 18 | 0.141/0.007 | |||||||
| Std. error | 3 | |||||||||
| t-Sig. | 0.007 | |||||||||
| Model 3 (Households) | β | 321 | 0.163/0.008 | |||||||
| Std. error | 94 | |||||||||
| t-Sig. | 0.008 | |||||||||
| Model 4 (Lifestyles) | β | −652 | 0.182/0.006 | |||||||
| Std. error | 101 | |||||||||
| t-Sig. | 0.005 | |||||||||
| Model 5 (Equipment) | β | 317 | 243 | 189 | 67 | 135 | 0.391/0.002 | |||
| Std. error | 127 | 95 | 88 | 21 | 56 | |||||
| t-Sig. | 0.005 | 0.003 | 0.014 | 0.012 | 0.009 | |||||
| Model 6 (All) | β | 19 | 296 | 217 | 141 | 75 | 118 | 0.537/0.000 | ||
| Std. error | 3 | 105 | 91 | 75 | 23 | 42 | ||||
| t-Sig. | 0.006 | 0.002 | 0.005 | 0.011 | 0.008 | 0.006 | ||||
| Cooking | Households | Equipment | Adj-R2/ F-Sig. | ||||
|---|---|---|---|---|---|---|---|
| FM_no | FW_no | FM_no (≤7) | FM_no (≥60) | Cooking_h | |||
| Model 1 (Single) | β | 437 | 0.215/0.002 | ||||
| Std. error | 162 | ||||||
| t-Sig. | 0.002 | ||||||
| Model 2 (Buildings) | β | - | |||||
| Std. error | |||||||
| t-Sig. | |||||||
| Model 3 (Households) | β | 213 | −13 | 78 | 63 | 0.384/0.000 | |
| Std. error | 41 | 5 | 36 | 23 | |||
| t-Sig. | 0.000 | 0.007 | 0.005 | 0.010 | |||
| Model 4 (Lifestyles) | β | - | |||||
| Std. error | |||||||
| t-Sig. | |||||||
| Model 5 (Equipment) | β | 437 | 0.215/0.002 | ||||
| Std. error | 162 | ||||||
| t-Sig. | 0.002 | ||||||
| Model 6 (All) | β | 176 | 37 | 379 | 0.415/0.000 | ||
| Std. error | 38 | 9 | 146 | ||||
| t-Sig. | 0.001 | 0.005 | 0.003 | ||||
Publisher’s Note: MDPI stays neutral with regard to jurisdictional claims in published maps and institutional affiliations. |
© 2022 by the authors. Licensee MDPI, Basel, Switzerland. This article is an open access article distributed under the terms and conditions of the Creative Commons Attribution (CC BY) license (https://creativecommons.org/licenses/by/4.0/).
Share and Cite
Xie, Y.; Noor, A.I.M. Factors Affecting Residential End-Use Energy: Multiple Regression Analysis Based on Buildings, Households, Lifestyles, and Equipment. Buildings 2022, 12, 538. https://doi.org/10.3390/buildings12050538
Xie Y, Noor AIM. Factors Affecting Residential End-Use Energy: Multiple Regression Analysis Based on Buildings, Households, Lifestyles, and Equipment. Buildings. 2022; 12(5):538. https://doi.org/10.3390/buildings12050538
Chicago/Turabian StyleXie, Yixuan, and Azlin Iryani Mohd Noor. 2022. "Factors Affecting Residential End-Use Energy: Multiple Regression Analysis Based on Buildings, Households, Lifestyles, and Equipment" Buildings 12, no. 5: 538. https://doi.org/10.3390/buildings12050538
APA StyleXie, Y., & Noor, A. I. M. (2022). Factors Affecting Residential End-Use Energy: Multiple Regression Analysis Based on Buildings, Households, Lifestyles, and Equipment. Buildings, 12(5), 538. https://doi.org/10.3390/buildings12050538