Article

Mechanical Properties of Seawater Sea-Sand Concrete Exposed to Daily Temperature Variations

1
School of Civil and Transportation Engineering, Guangdong University of Technology, Guangzhou 510006, China
2
School of Civil and Environmental Engineering, UNSW, Sydney, NSW 2052, Australia
*
Author to whom correspondence should be addressed.
Buildings 2022, 12(5), 517; https://doi.org/10.3390/buildings12050517
Submission received: 7 March 2022 / Revised: 16 April 2022 / Accepted: 18 April 2022 / Published: 21 April 2022
(This article belongs to the Section Building Structures)

Abstract

:
The durability of a concrete structure is affected by temperature cycles that occur during the structure’s service life. This paper presents an experimental and theoretical study of the mechanical properties of seawater sea-sand concrete when exposed to temperature variations. By using compressive tests on cylindrical concrete specimens, the effects of thermal cycling (e.g., the amplitude of temperature variations and cycling times) on the mechanical properties of seawater sea-sand concrete, such as failure modes, compressive strength, stress–strain relationship, Young’s modulus, ultimate strain, Poisson’s ratio and toughness are investigated. Microstructures of both unconditioned and conditioned concrete samples are examined by using scanning electron microscopy (SEM) to understand the mechanisms behind the strength changes. Finally, the stress–strain model is proposed for seawater sea-sand concrete subjected to daily temperature variations, and the proposed model is verified by the experimental data.

1. Introduction

In recent decades, a shortage of raw materials for concrete has led to the use of recycled materials [1,2,3,4] and seawater sea-sand concrete (SSC) in construction [5,6,7]. As they are abundant marine resources, the usage of seawater and sea-sand also provides social, economic and environmental benefits. Past studies [8] indicated that sea-sand has a desirable particle size, high hardness and low mud content. These features make it a suitable constructional sand, given the fact that sand with higher mud content can reduce the strength and durability of concrete. Although river sand generally has desirable particle shape and particle size distribution and low mud content, the extensive exploitation of river sand can negatively impact ecosystems and the environment. However, a major concern regarding the application of SSC into structures is that the chloride ions in seawater and sea-sand can rapidly erode the conventional steel reinforcements in concrete [9,10,11]. Commonly, sea-sand requires desalination treatment to remove the corrosive ions, but this process certainly increases the construction cost. Recently, scholars proposed using fiber-reinforced polymer (FRP) materials to reinforce SSC [12,13,14]. As FRP is immune to chloride corrosion, no special treatment is needed for FRP-SSC structures [15]. Therefore, with the utilization of corrosion-resistant reinforcing materials, SSC structures can potentially be applied to marine structures [16], coastal infrastructures, bridges [17] and pavements [18]. Seawater and/or sea-sand concrete has been used in some engineering projects, especially plain concrete in Japan [16]. A demonstration project in an EU–US project named SEACON has successfully used FRP bars to reinforce concrete bridge decks that came into contact with de-icing salt [8] (Figure 1).
Concrete structures are likely to be subjected to various factors that affect their durability [19], such as corrosive agents [20], freezes and thaws, alkali–aggregate reactions, cyclic loads [21], elevated temperatures [22], temperature cycles [23] or a combination of these factors [24]. Among them, the daily temperature is one of the most common types of environmental loads. In some coastal areas, the surface temperature of concrete could reach 60–70 °C upon being directly exposed to sunlight, and the temperature could quickly decrease during the night or due to rainfall, resulting in a periodic change in temperature. Although the natural temperature may not obviously affect concrete durability, large numbers of temperature cycles could deteriorate its mechanical properties. Temperature variations cause curling and the expansion/contraction of concrete slabs, which is a critical factor affecting the behavior of pavements [25]. Nam et al. [26] investigated the effects of daily temperature variations on the continuous deflection profiles of airfield-jointed concrete pavements. The internal stress of concrete caused by daily temperature variations can lead to cracks, reducing the durability of concrete structures. Liu et al. [27] found that the changes in modal frequencies induced by temperature variations can be more obvious than those caused by structural damage and proposed a new method to quantify the effects of temperature on modal frequencies. An et al. [28] analyzed the influence of temperature cycling on the mechanical behavior of high-performance concrete and indicated that the compressive strength, splitting strength and elastic modulus decreased when the number of temperature cycling times increased. Liu et al. [29] found that the static and dynamic behavior of recycled aggregate concrete decreased obviously due to the daily temperature variations. Thus far, only a few studies have been conducted to understand the behavior of concrete subjected to temperature variations, and no study, to the best of the authors’ knowledge, has been conducted on seawater sea-sand concrete subjected to daily temperature variations. As daily temperature variations are an important factor affecting the durability of concrete, it is necessary to fill the aforementioned knowledge gap to promote the further application of SSC structures.
In this paper, axial compressive tests were conducted on SSC cylindrical specimens to measure mechanical properties such as compressive strength, Young’s modulus, ultimate strain, Poisson’s ratio, toughness and the stress–strain relationship. The effects of daily temperature variations (e.g., thermal cycling times and temperature amplitude) on the mechanical properties of SSC were discussed. With the help of scanning electron microscopy (SEM), the microstructures of SSC exposed to temperature variations were examined. Finally, theoretical models were proposed to predict the stress–strain relationship after thermal cycles.

2. Experimental Program

2.1. Materials

In this study, three grades of seawater sea-sand concrete (SSC) were investigated, and the mixtures are listed in Table 1. SSC was made up of ordinary Portland cement, sea-sand, coarse aggregate, seawater and superplasticizer (SP). Class of the cement was 42.5 MPa, and its specific density was 3112 kg/m3 (data from supplier). Fineness modulus of sea-sand was 2.6 and its apparent density was 2893 kg/m3. The coarse aggregate was made from the crushed granite, which was in continuous gradation with a minimum size of 5 mm and maximum size of 20 mm, and its apparent density was 2827.5 kg/m3. Artificial seawater was used for SSC, and it was prepared in accordance with ASTM D1141-98 [30] by mixing NaCl (24.53 g/L), MgCl2 (5.2 g/L), Na2SO4 (4.09 g/L), CaCl2 (1.16 g/L), KCl (0.695 g/L), NaHCO3 (0.201 g/L), KBr (0.101 g/L), H3BO3 (0.027 g/L), SrCl2 (0.025 g/L) and NaF (0.003 g/L) with distilled water. Density of the simulated seawater was 1016 kg/m3. The solid mass content and density of superplasticizer were 20% and 1030 kg/m3, respectively. Mixing and casting of SSC were conducted in accordance with [31].

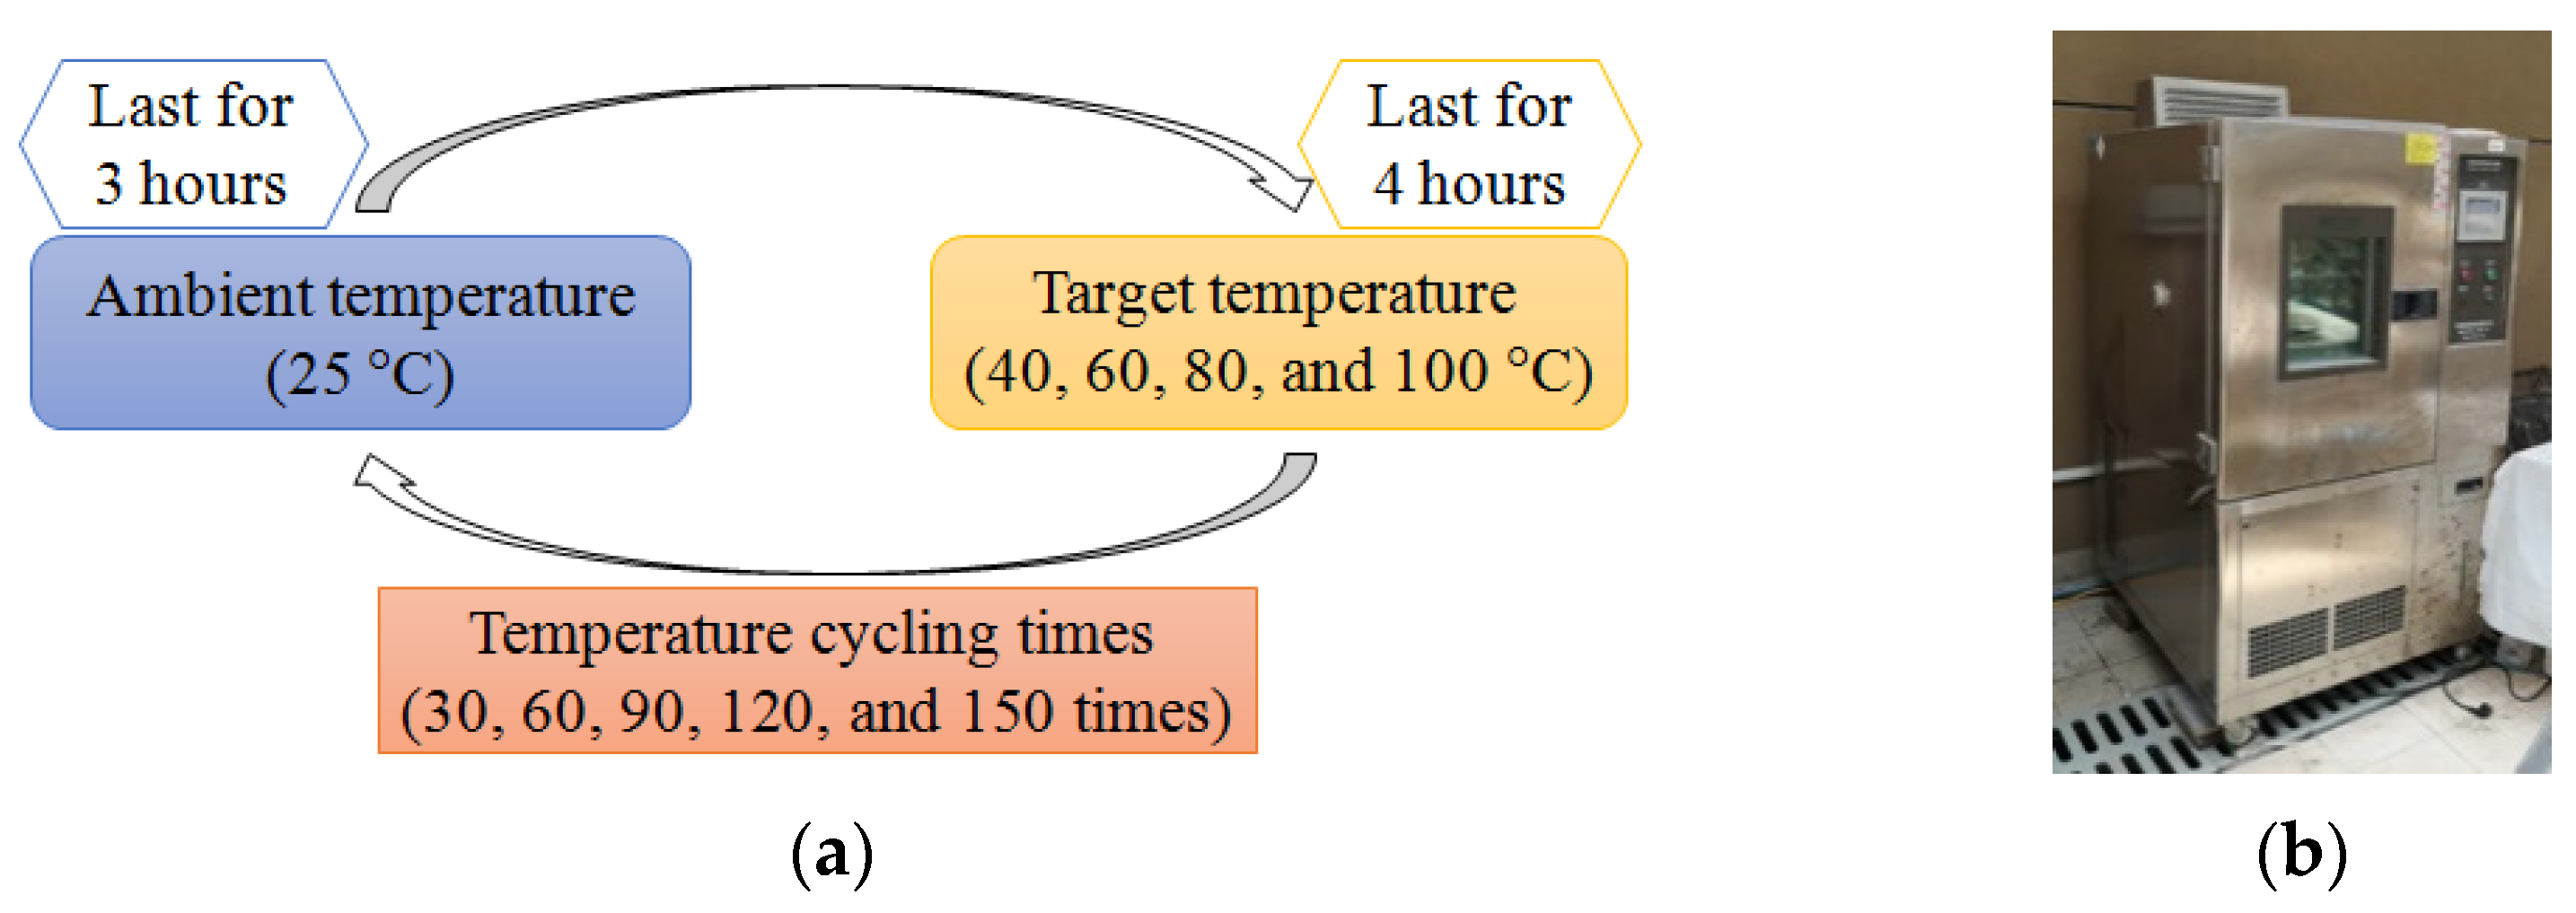
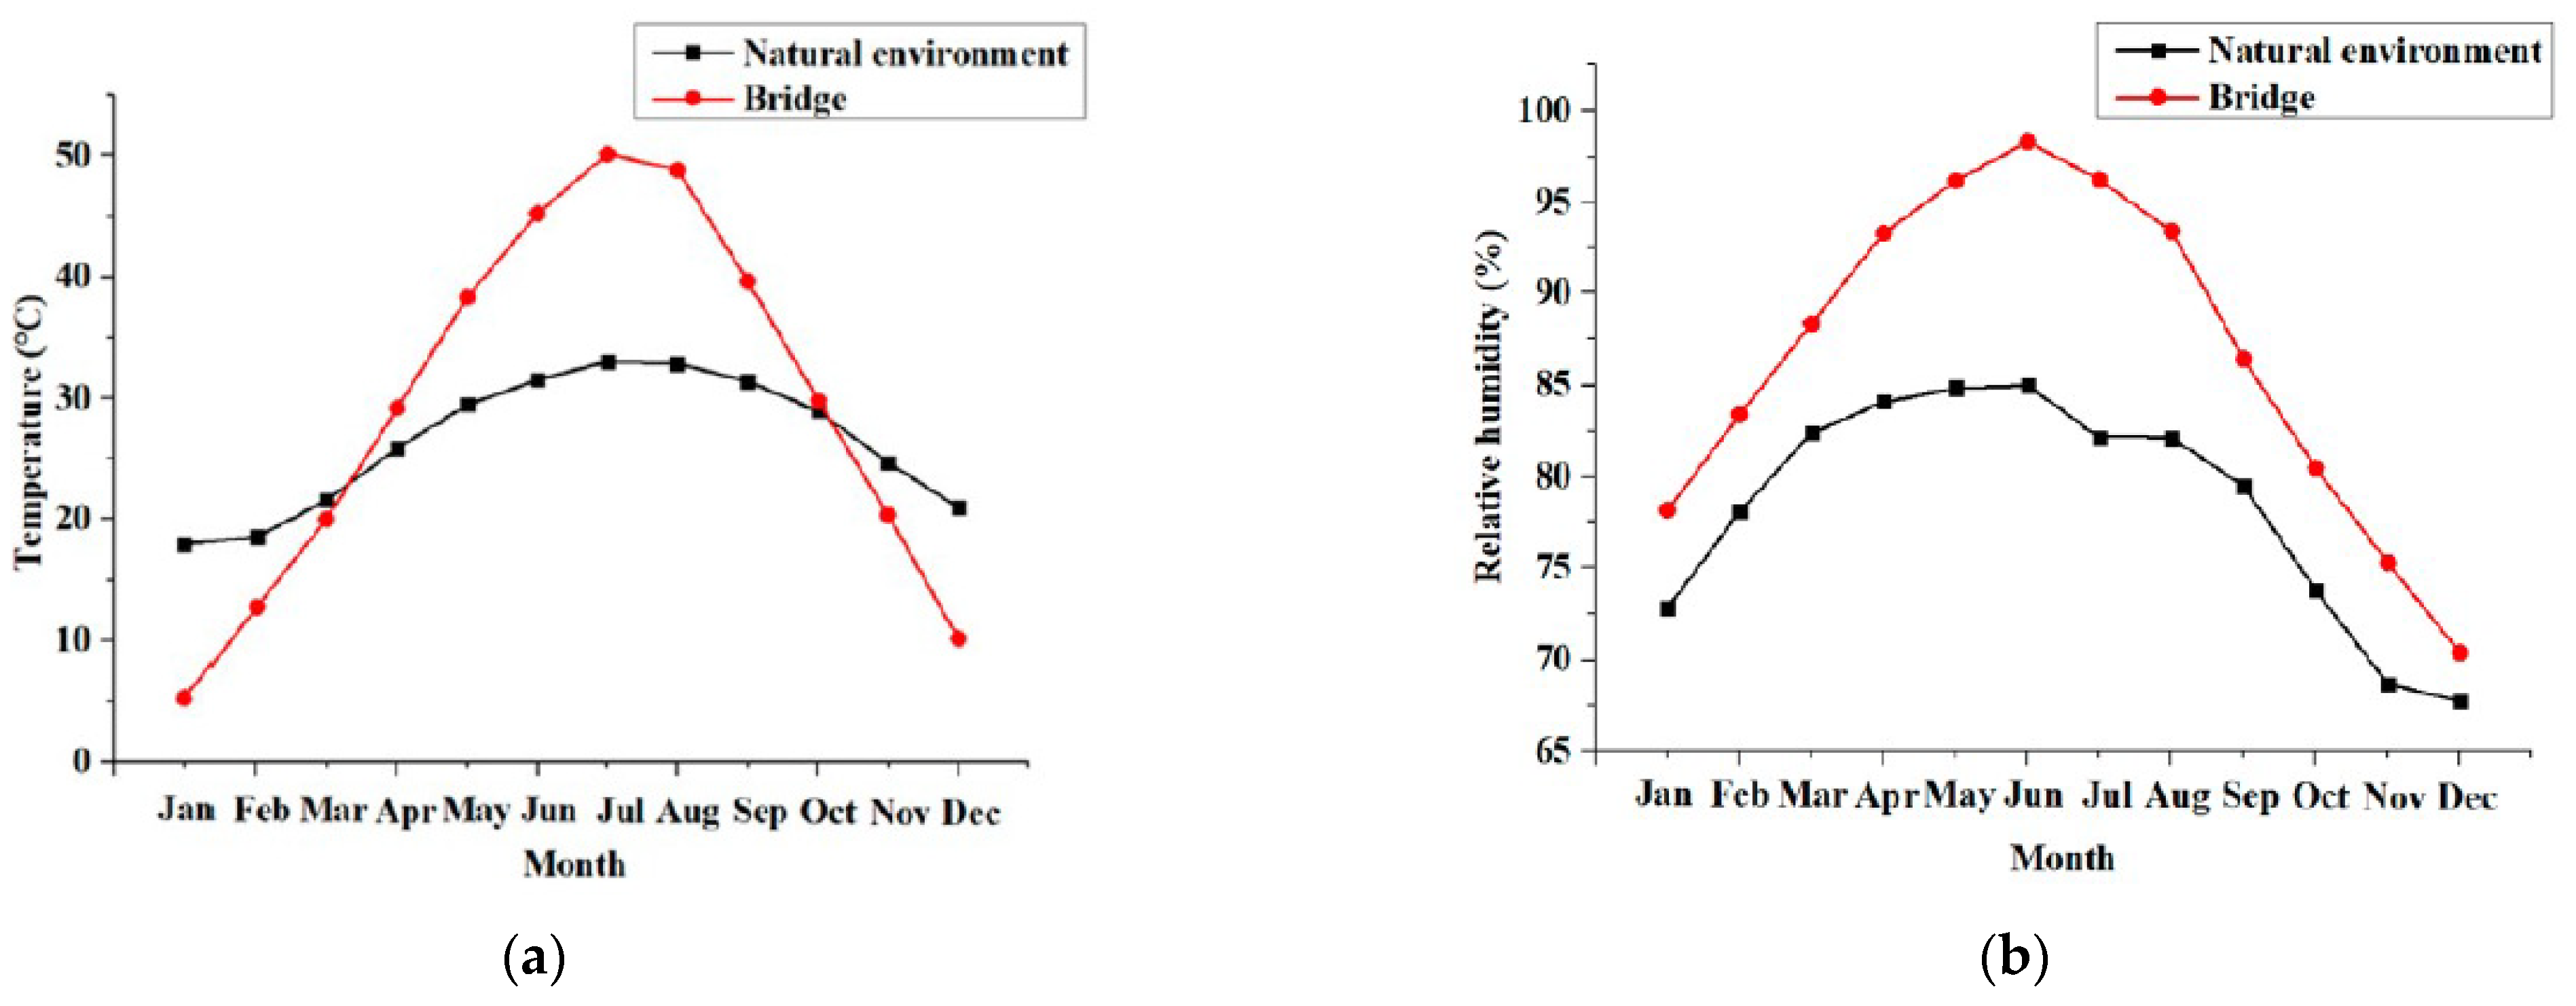
2.2. Simulation of Daily Temperature
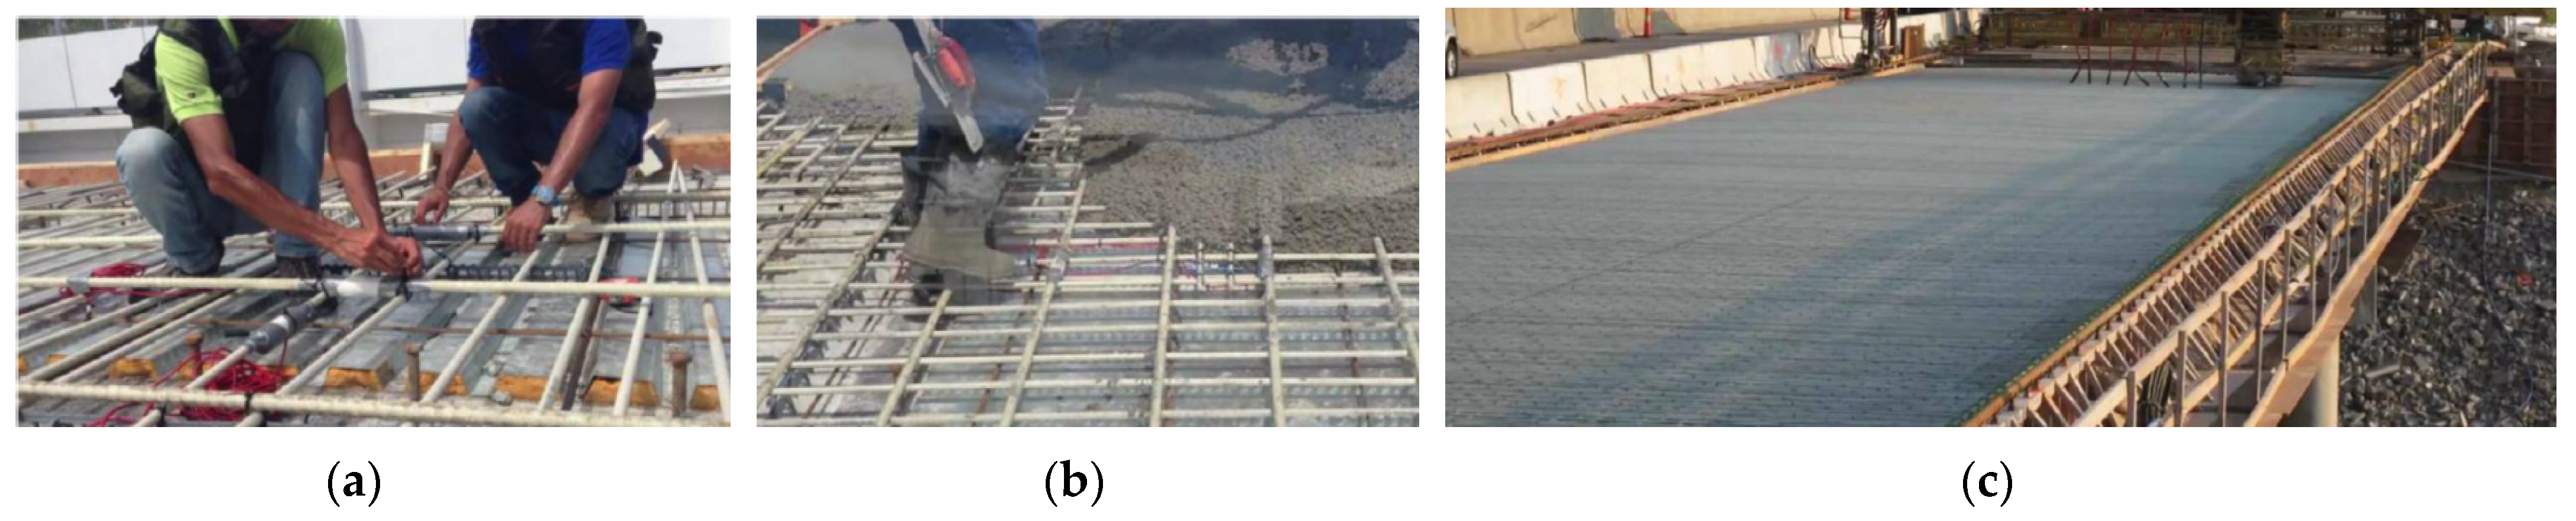
Daily temperature variations were simulated by temperature cycles created by an environmental chamber (Figure 2). Parameters of temperature variations were same as the authors’ previous study [32], which included four kinds of temperature variations (e.g., 25~40, 25~60, 25~80 and 25~100 °C) and five cycling times (e.g., 30, 60, 90, 120 and 150 times). Based on past studies [33], the average annual temperature and humidity of the coastal city Guangzhou are 24 °C and 70%, respectively (Figure 3). The maximum temperature of bridge surface is about 50 °C. Therefore, this study selected 25 °C as the baseline temperature and temperature variations of 25~40 °C and 25~60 °C. The selection of 25~80 and 25~100 °C in this study is to accelerate the degradation rate of concrete. The relative humidity is selected as 70%. Heating regime for a temperature cycle included heating to the target temperature at 1.25 °C/min, a maintained temperature stage for 4 h, a natural cooling stage to the ambient temperature and another maintained temperature stage for 3 h. Relative humidity for specimens was set as 70% to simulate the humidity of a specimen encountered in a real environment.

2.3. Specimens

To investigate the influence of daily temperature variations on SSC, concrete cylinders with a diameter of 150 mm and a height of 300 mm were prepared. There were thirteen groups of compressive specimens, as listed in Table 2. For each group, three identical specimens were prepared. In total, thirty-nine compressive specimens were tested. The labels of SSC specimens consist of a strength grade (C40, C70 or C90), “T” followed by target temperature, and “t” followed by cycling times. Letter “N” after strength grade means unconditioned specimens. For example, “C70T60t120” refers to a group of SSC cylinders with a concrete grade of C70 being exposed to cyclic temperatures of 25~60 °C 120 times. Based on the method in [34] that converts concrete cubic strength to cylindrical strength ( f c ), the minimum cylindrical compressive strengths for concrete grades C40, C70 and C90 are 31.6 MPa, 55.3 MPa and 71.1 MPa, respectively.

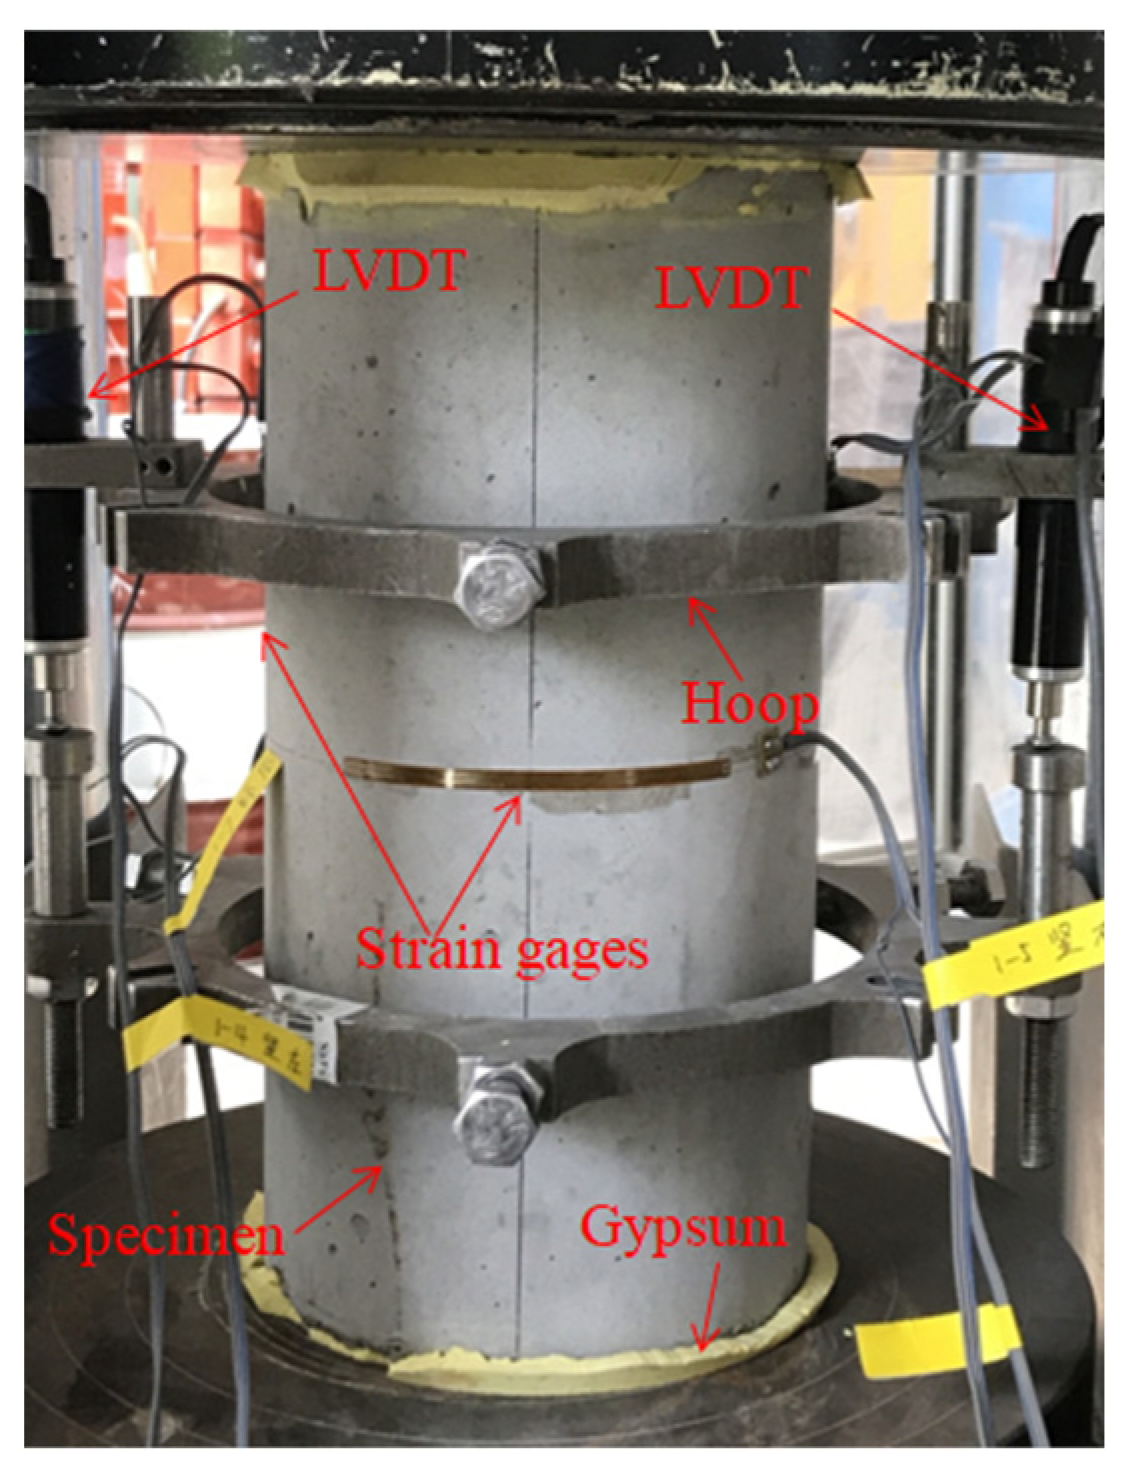
2.4. Experimental Setup and Instrumentation

Compressive tests were conducted on SSC cylinders by using a 4000 kN testing machine in accordance with ASTM C39/C39M [35], and the loading rate was 0.18 mm/min (Figure 4). Two pairs of 50 mm-long strain gauges (one vertical and one horizontal strain gauge for each pair) were oppositely fixed in the middle of cylinders. Due to the appearance of cracks underneath strain gauges, the readings were not accurate during the late loading stage. As shown in Figure 5, if cracks formed underneath the strain gauge, the reading from strain gauge included the influence of the crack openings and no longer represented the real strain in concrete [36]. The strain gauge readings were only adopted for the measurement of Young’s modulus and Poisson’s ratio before the cracks started to propagate. Nevertheless, the full-range stress–strain curves were obtained by using linear variable differential transducers (LVDTs), where the strain is equal to the axial shortening (measured by LVDTs) divided by the specimen height. Two LVDTs were installed at the middle height to measure the axial deformation of the middle portion of cylinders (Figure 4). The axial strain is taken as the average value of LVDTs’ reading divided by their gauge length, which is 100 mm. Prior to testing, all cylinders were capped with high-strength gypsum, which is a commonly used capping material for concrete compressive tests, to ensure the two ends were smooth and parallel.

3. Experimental Results and Discussions
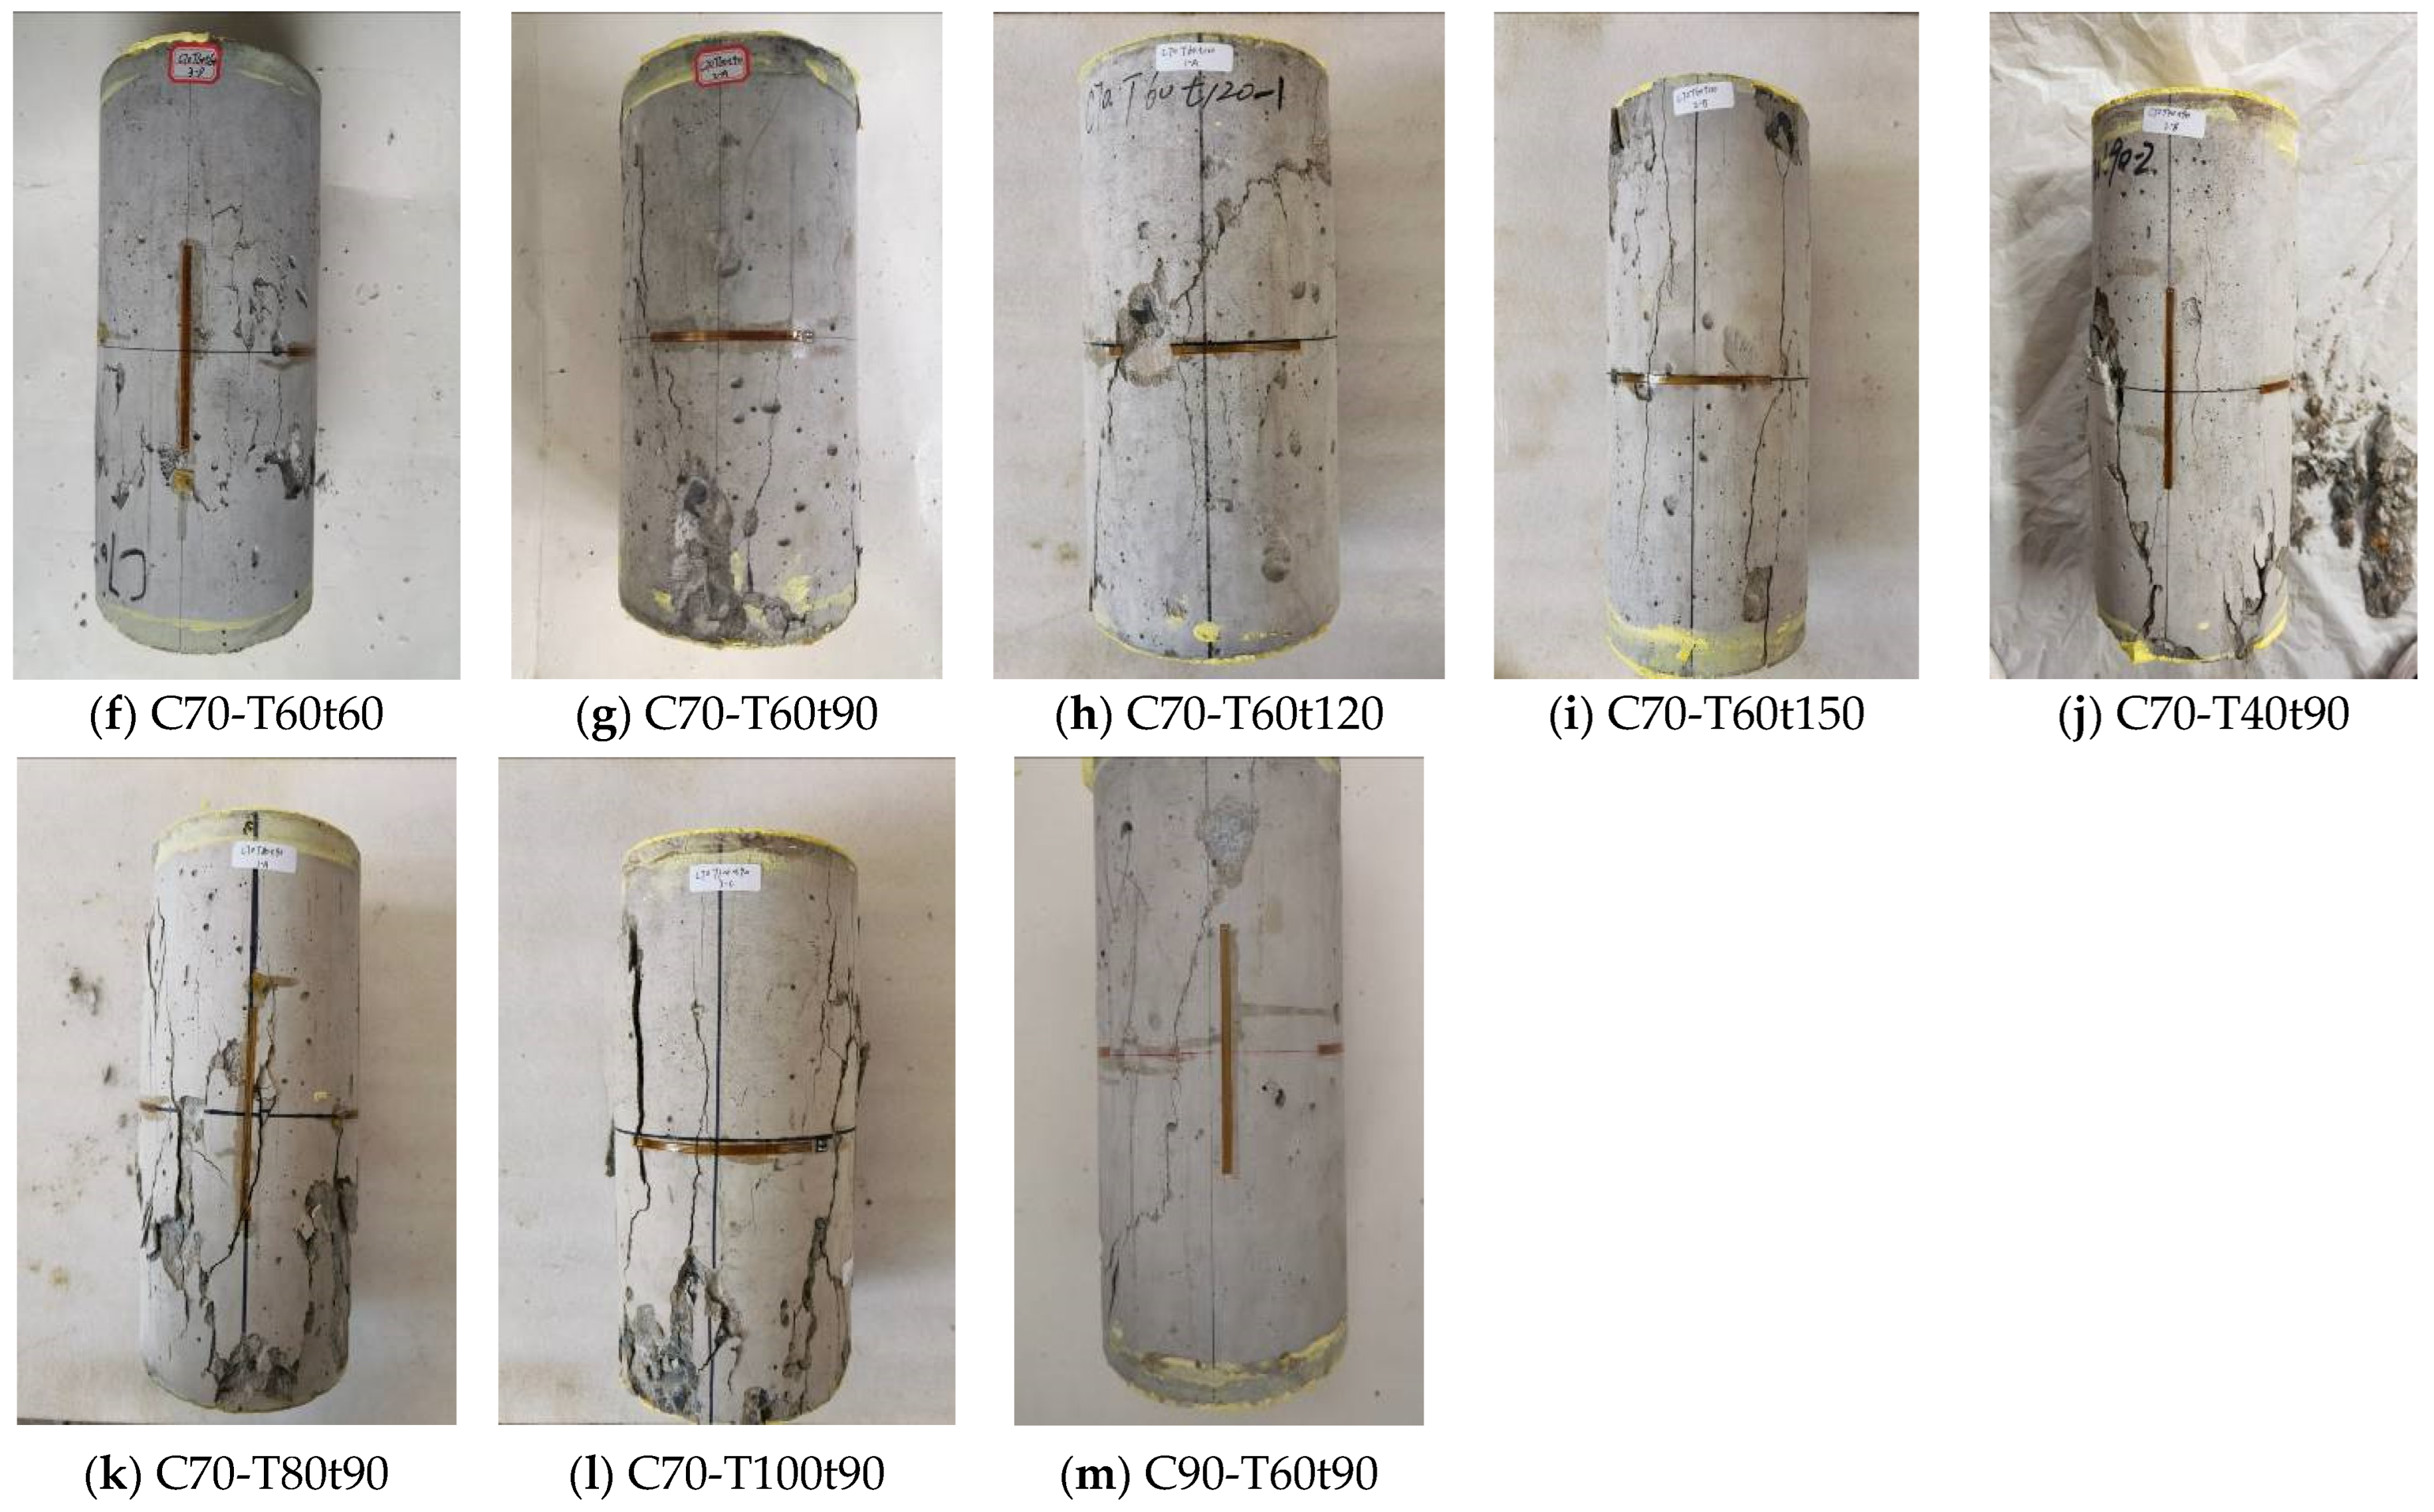
3.1. Failure Modes

The failure modes of SSC cylinders under axial compression are shown in Figure 5. Before reaching the peak load, the cracks on the cylinders’ surfaces were not obvious, which is in agreement with previous studies [37]. Thereafter, vertical cracks appeared at the middle height. When a further increase in deformation occurred, diagonal cracks appeared and widened, and concrete peeled off. In general, the failure modes of SSC are similar to those of ordinary concrete.
As shown in Figure 5a–c for unconditioned cylinders, when concrete strength increases, the number of cracks is reduced, and the failures become more brittle. Specimens subjected to temperature variations exhibited slightly more severe damage compared to unconditioned specimens. This damage was caused by the deterioration of the internal structure of SSC after temperature variations. Nevertheless, the influences of temperature and cycling times on the failure modes are not obvious based on the current study.

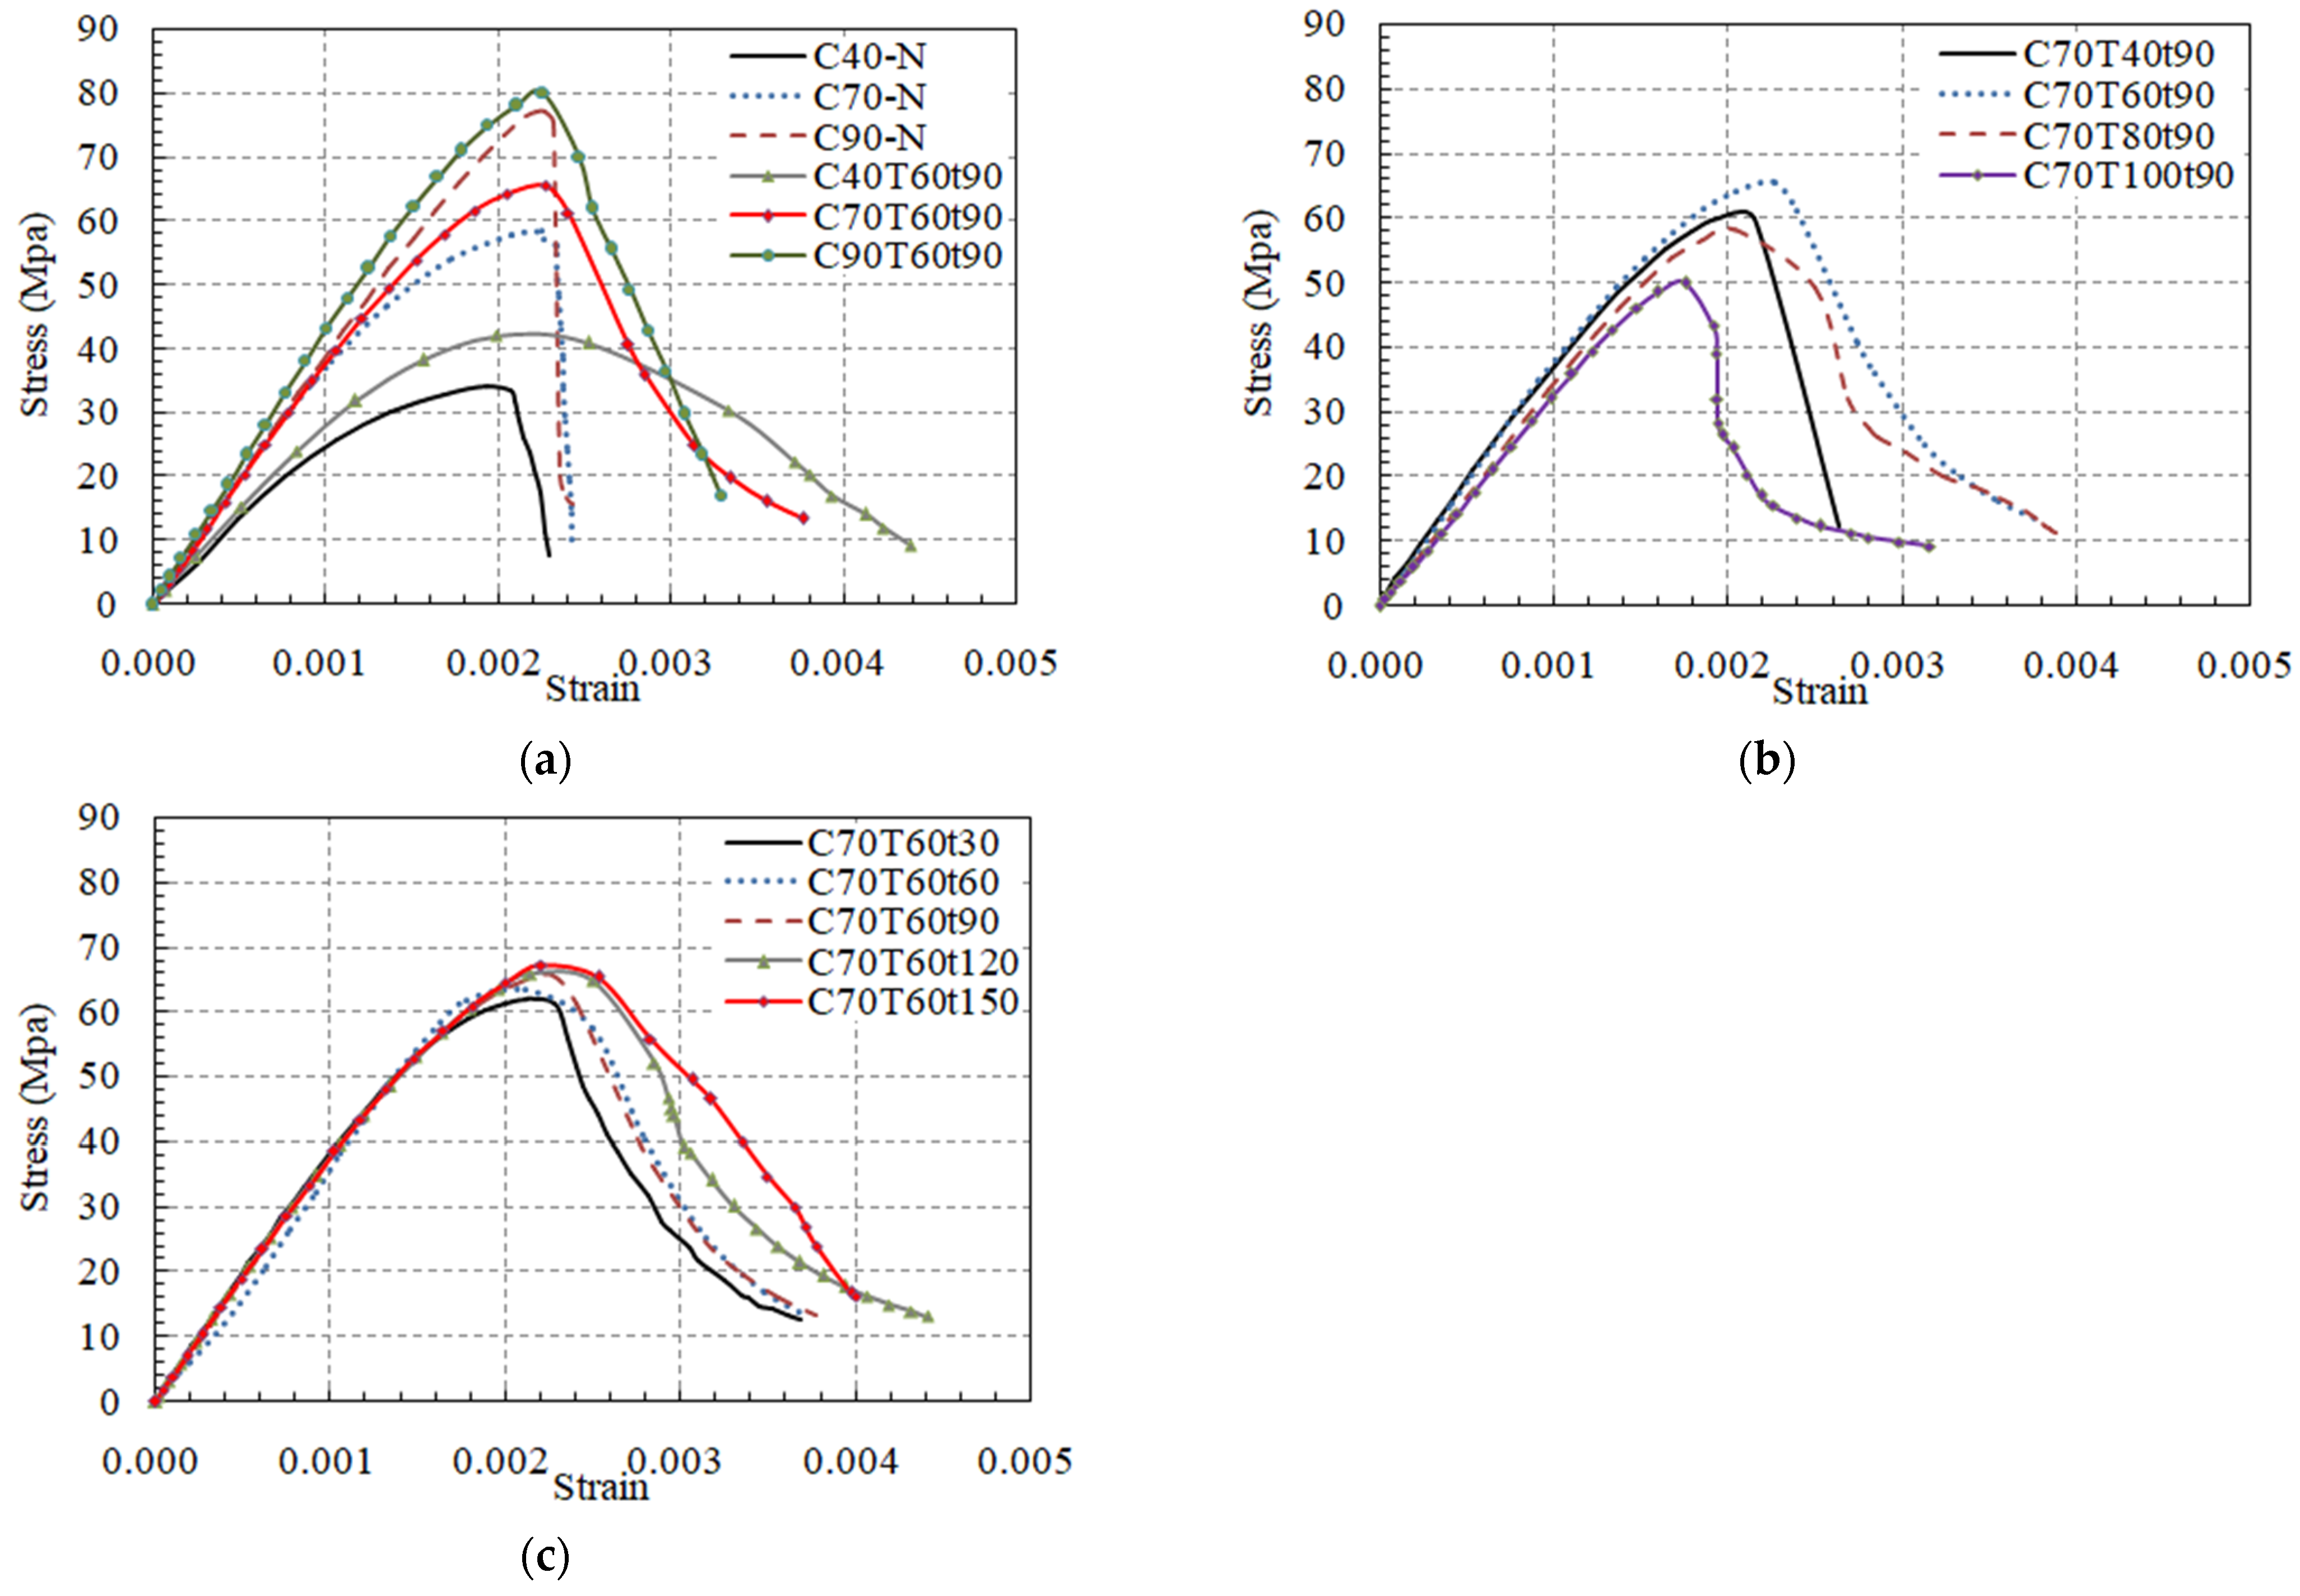
3.2. Stress–Strain Relationship

The stress–strain curves of the SSC cylinders are plotted in Figure 6, where the stress is equal to the applied load divided by the cross-sectional area, and the strain is derived from the LVDT readings. The stress increases linearly, up to about two-thirds of the ultimate stress. At higher stresses, SSC exhibits obvious plasticity. After the peak stress, the applied load drops dramatically until the concrete is crushed.
As shown in Figure 6a, the post-peak curve of unconditioned concrete with a lower strength is less steep, indicating less brittleness, which agrees with the observations of the failure modes. After 60 thermal cycles with a target temperature of 60 °C, SSC strength is enhanced, probably due to further hydration of cement. Nevertheless, the drop in the stress of the conditioned SSC is less rapid than that of the unconditioned specimens. Figure 6b shows the effects of the target temperature, and Figure 6c shows the effects of thermal cycling times on the stress–strain relationship of SSC. In general, thermal cycles substantially affect the post-peak behavior of SSC and lead to less brittle failures. With the increase in target temperature and cycling times, the post-peak portion of the stress–strain curve becomes flatter. However, as shown in Figure 6, the effects of thermal cycling on the ascending part of the stress–strain response are negligible.

3.3. Compressive Strength

The cylindrical compressive strength (fc) of unconditioned SSC and SSC subjected to thermal cycles is listed in Table 2, and the comparison of compressive strength is plotted in Figure 7. After thermal cycles (target temperature = 60 °C and cycling times = 90), the compressive strength increases by 23%, 12% and 4% for SSC with grades of C40, C70 and C90, respectively (Figure 7a). This is mainly caused by the further hydration of cement at 60 °C. SSC with a grade of C90 has the lowest strength increase due to its low free water content during the hydration process. Figure 7b shows the effects of the target temperature on the compressive strength of SSC (cycling times = 90). A strength increase is observed at 40 °C and 60 °C for SSC. However, when the temperature further increases to 100 °C, compressive strength decreases due to the thermal effect, and this observation agrees with past studies on concrete at elevated temperatures [38]. As shown in Figure 7c, when cycling times increase at 60 °C, the compressive strength increases gradually. This is caused by the further hydration of cement at 60 °C, and an increase in cycling times means longer exposure time for SSC. It is expected that this beneficial effect will be mitigated when the hydration process is completed. It is noted that the temperature of SSC subjected to real environments is generally less than 60 °C, and the detrimental effects of these daily temperature variations on SSC strength are not found in the current study.

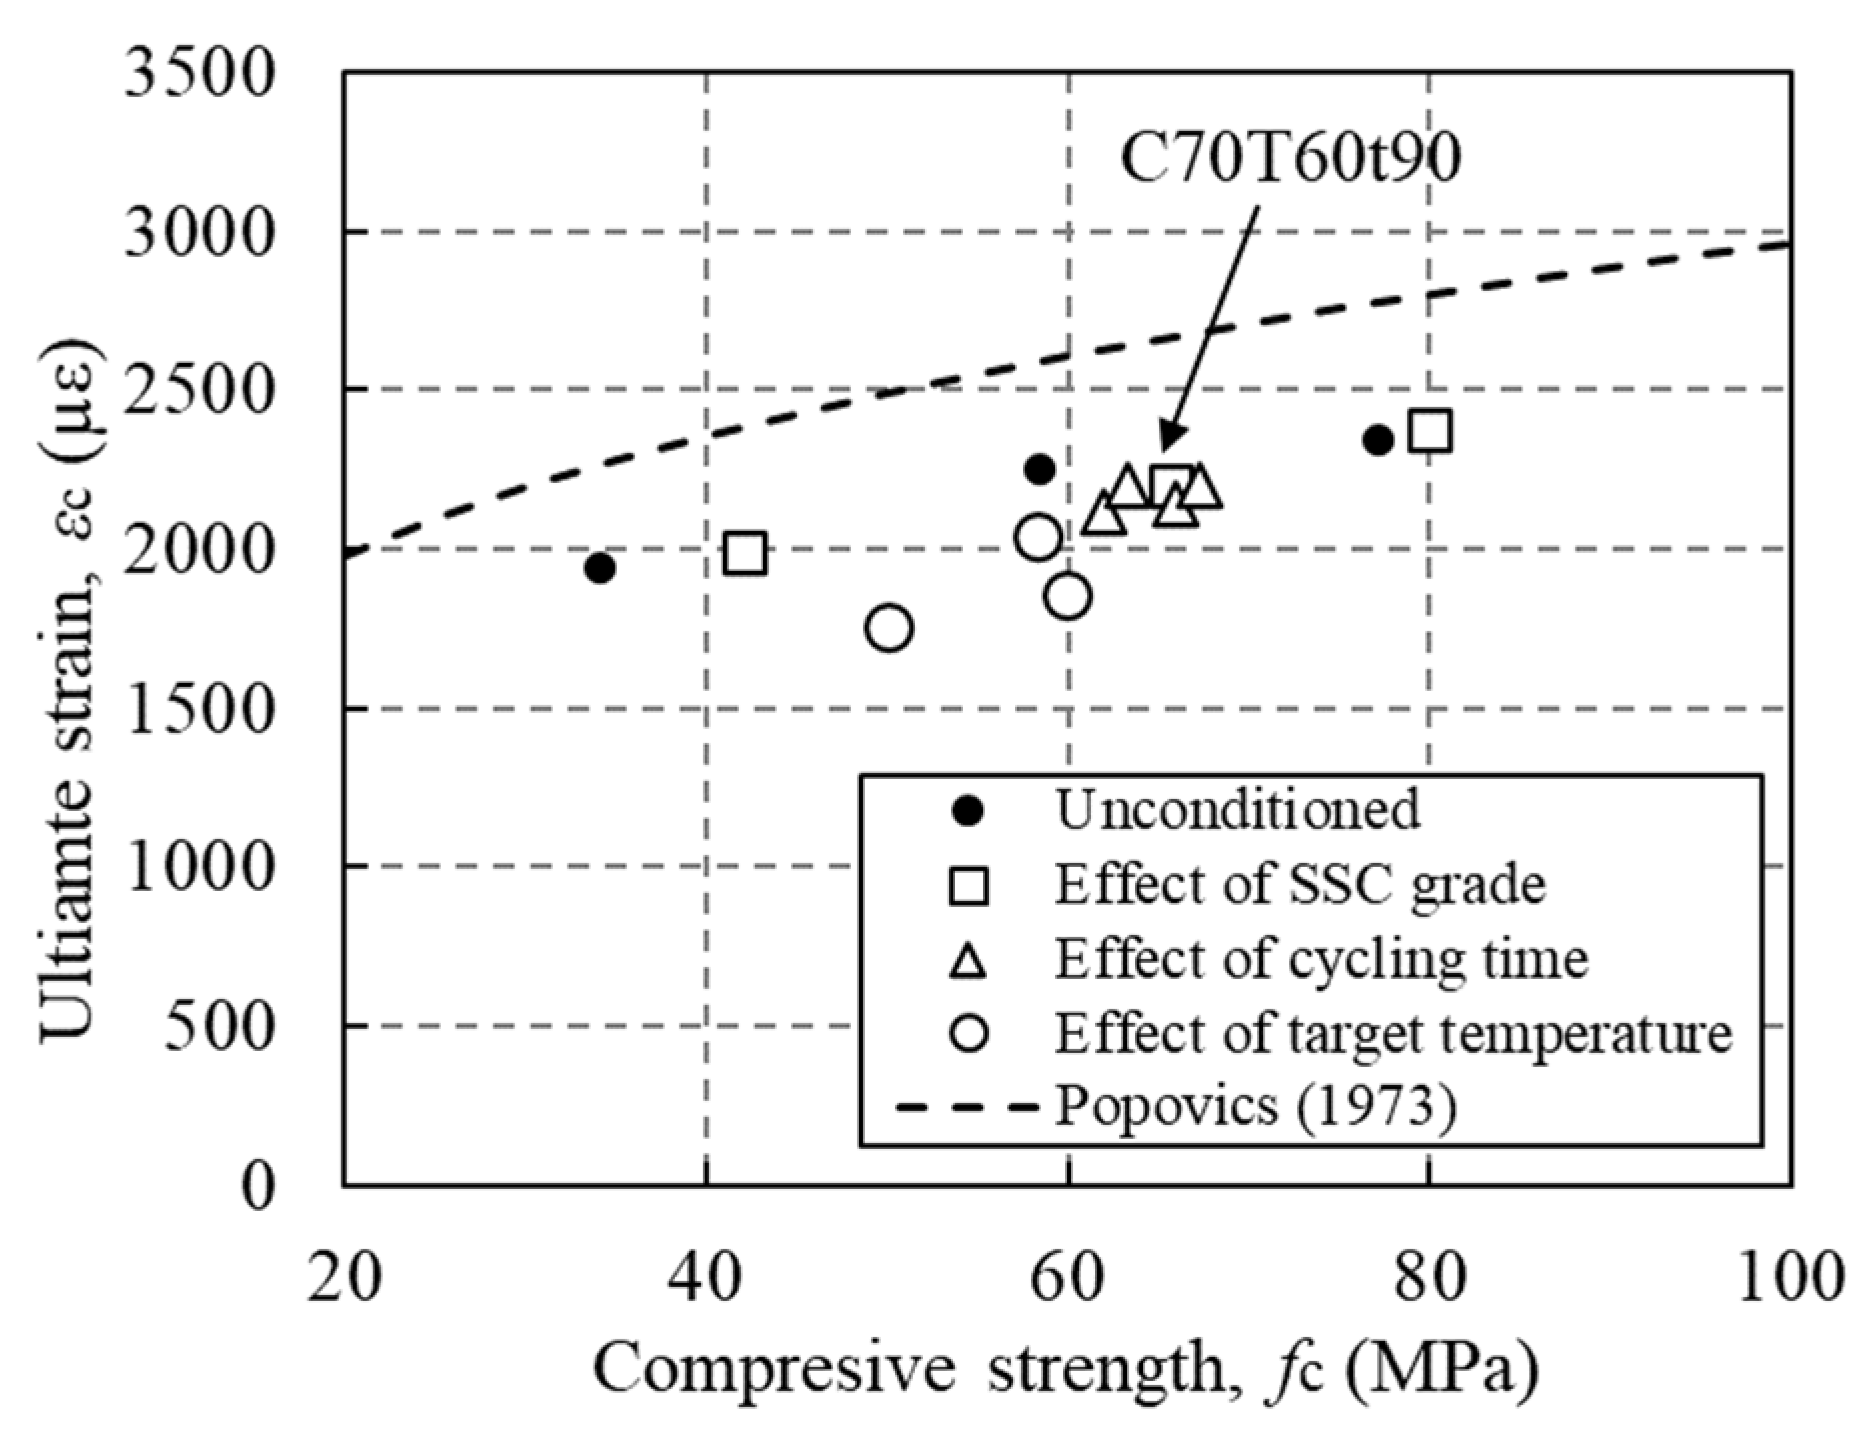
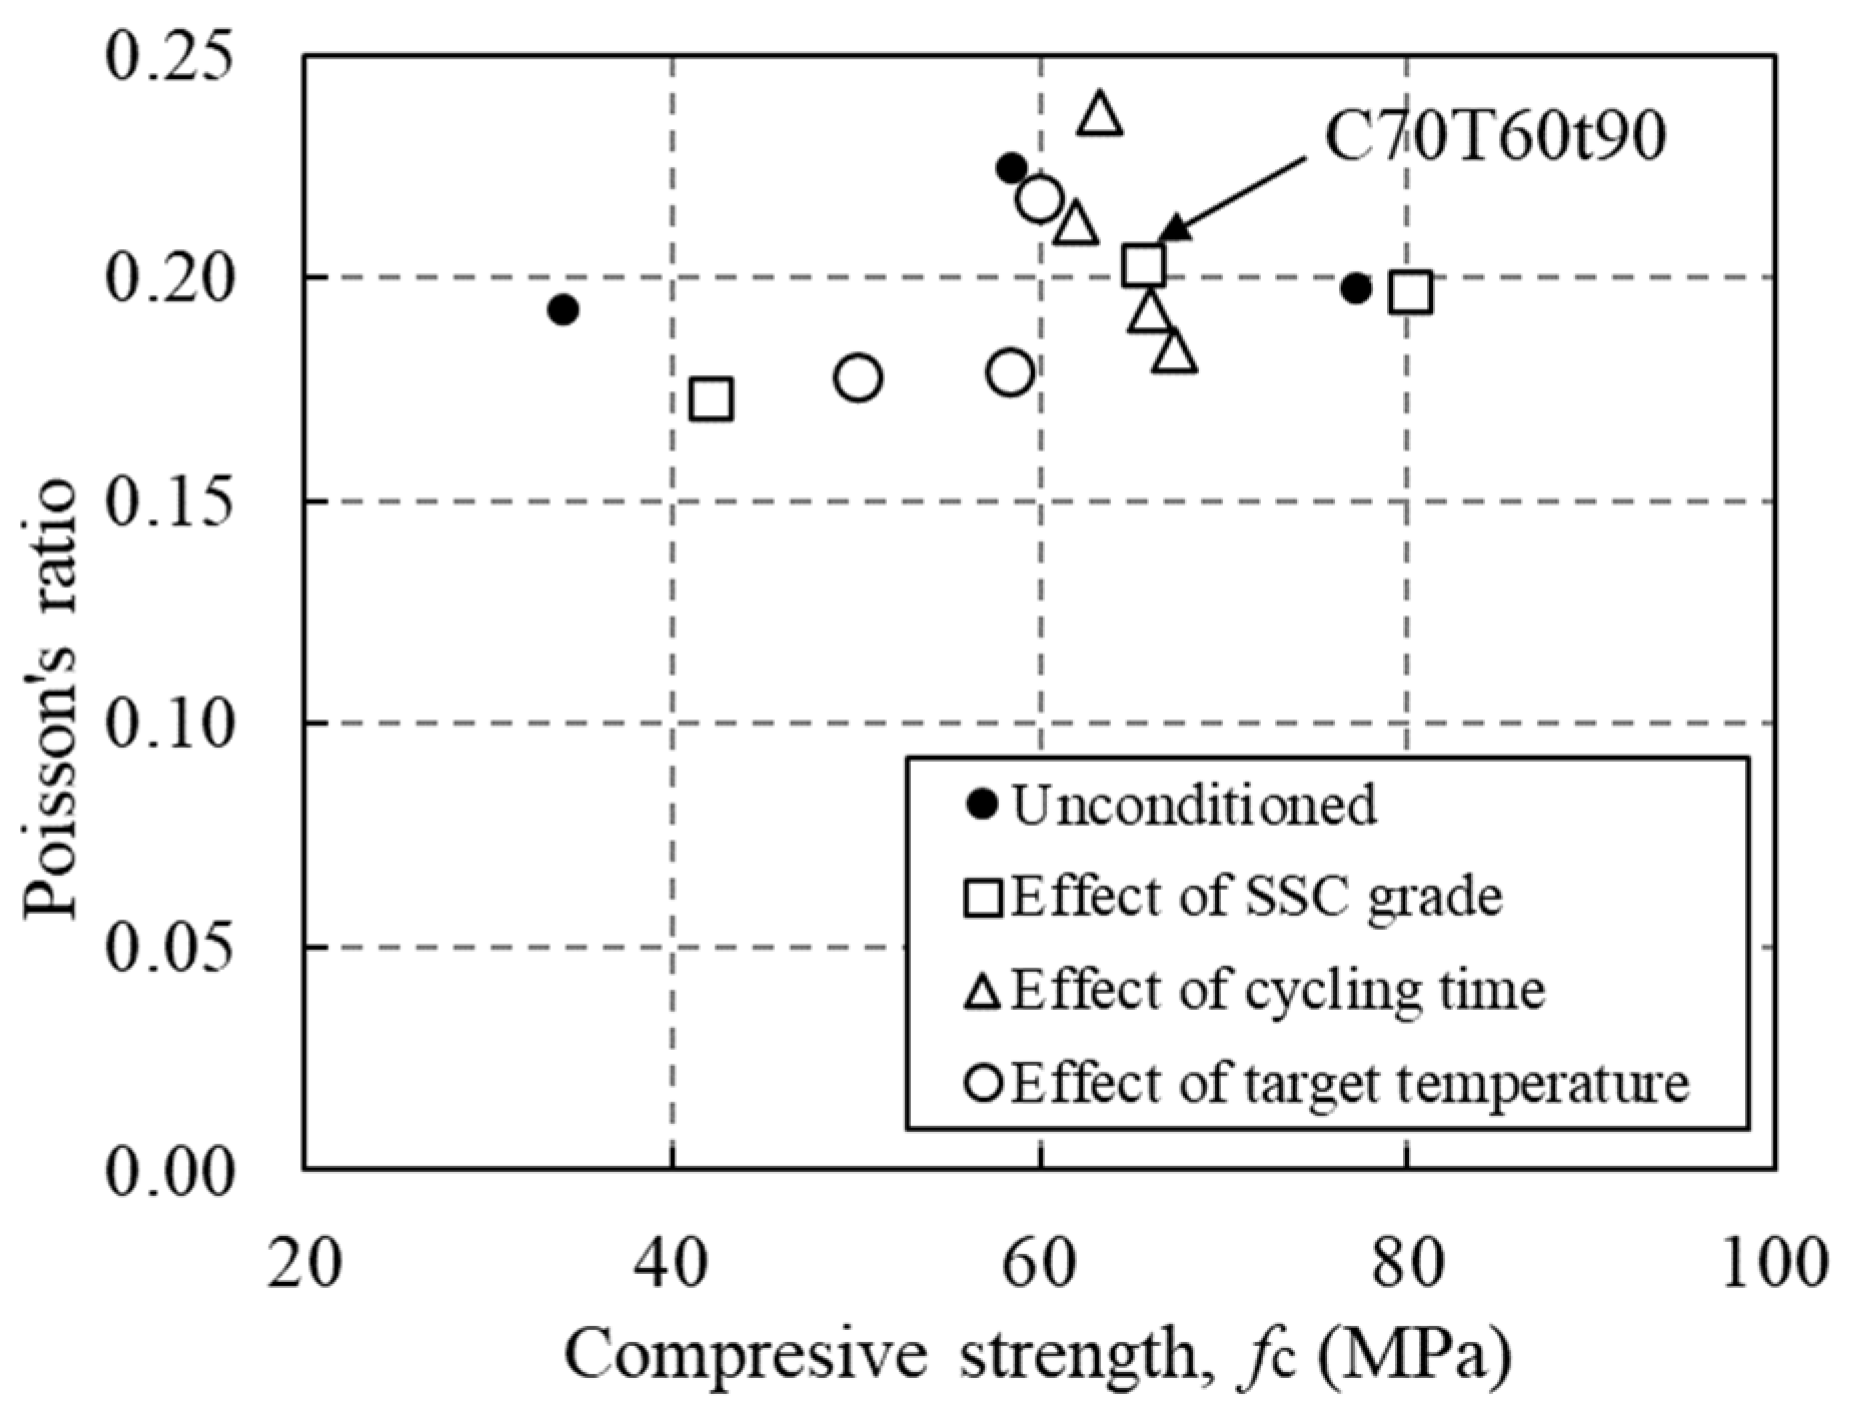
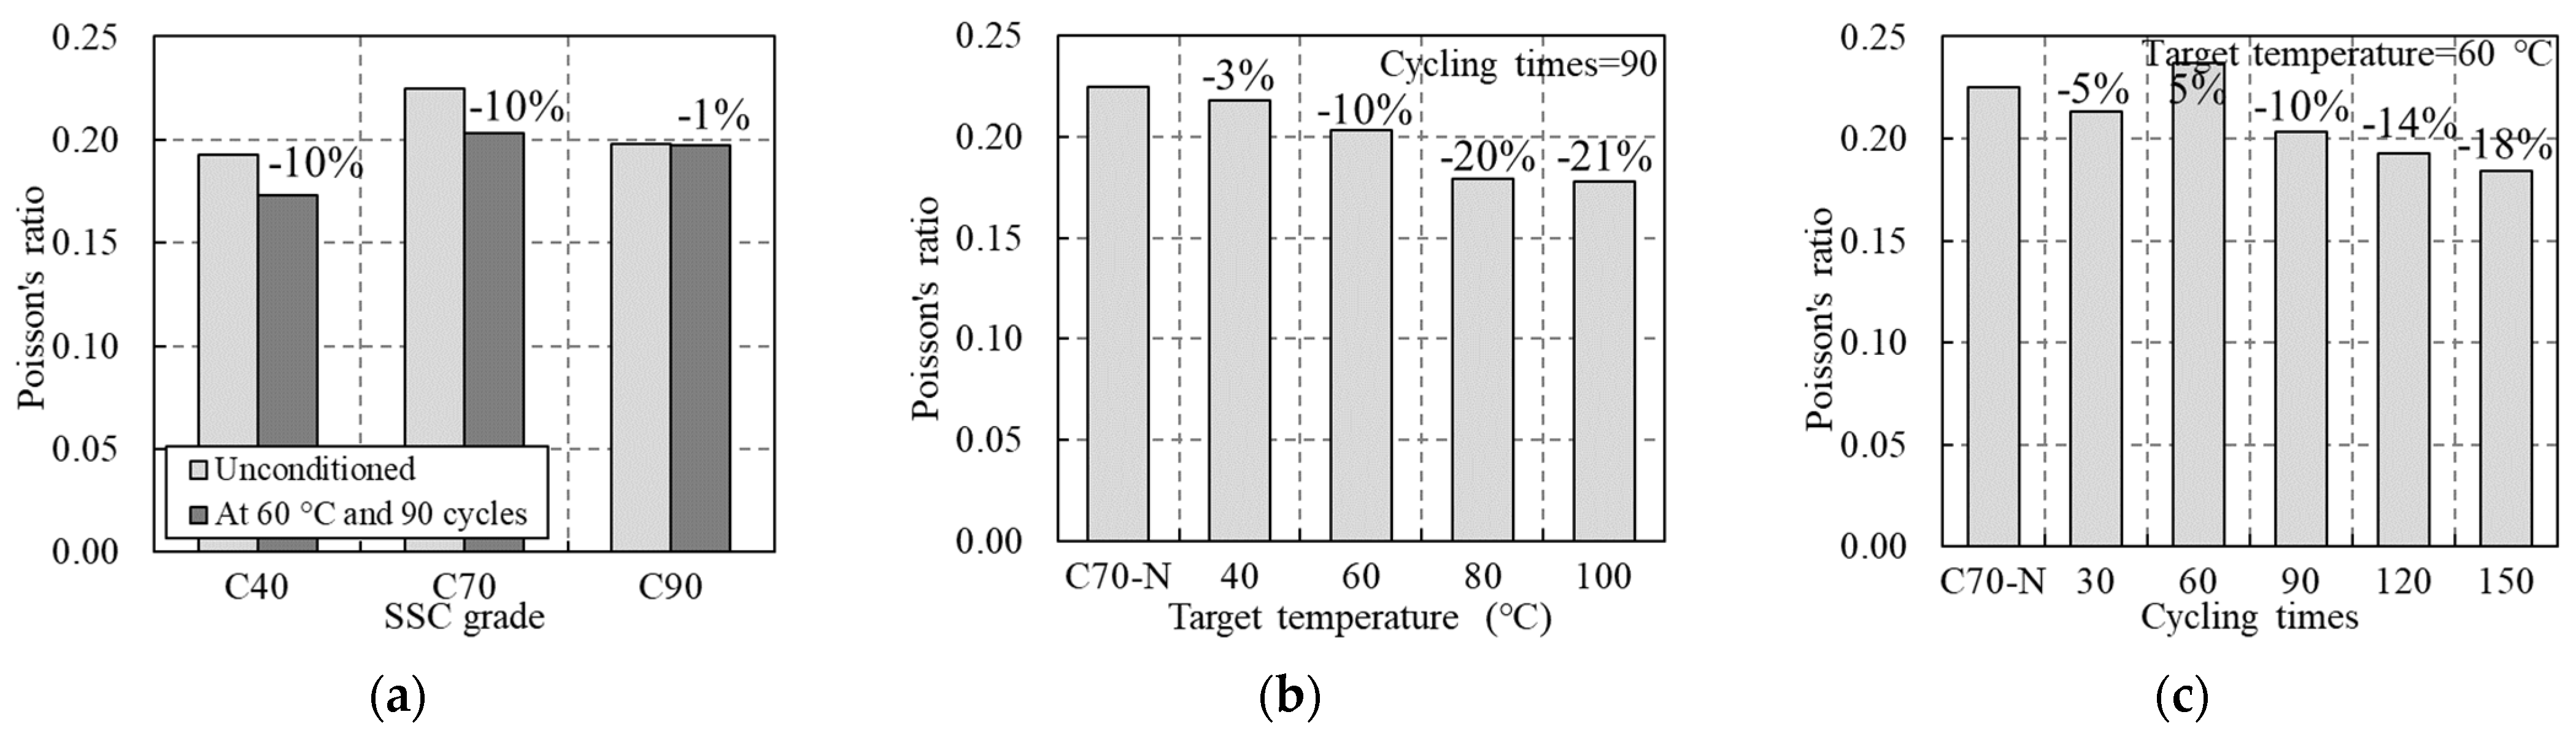
3.4. Young’s Modulus, Ultimate Strain and Poisson’s Ratio
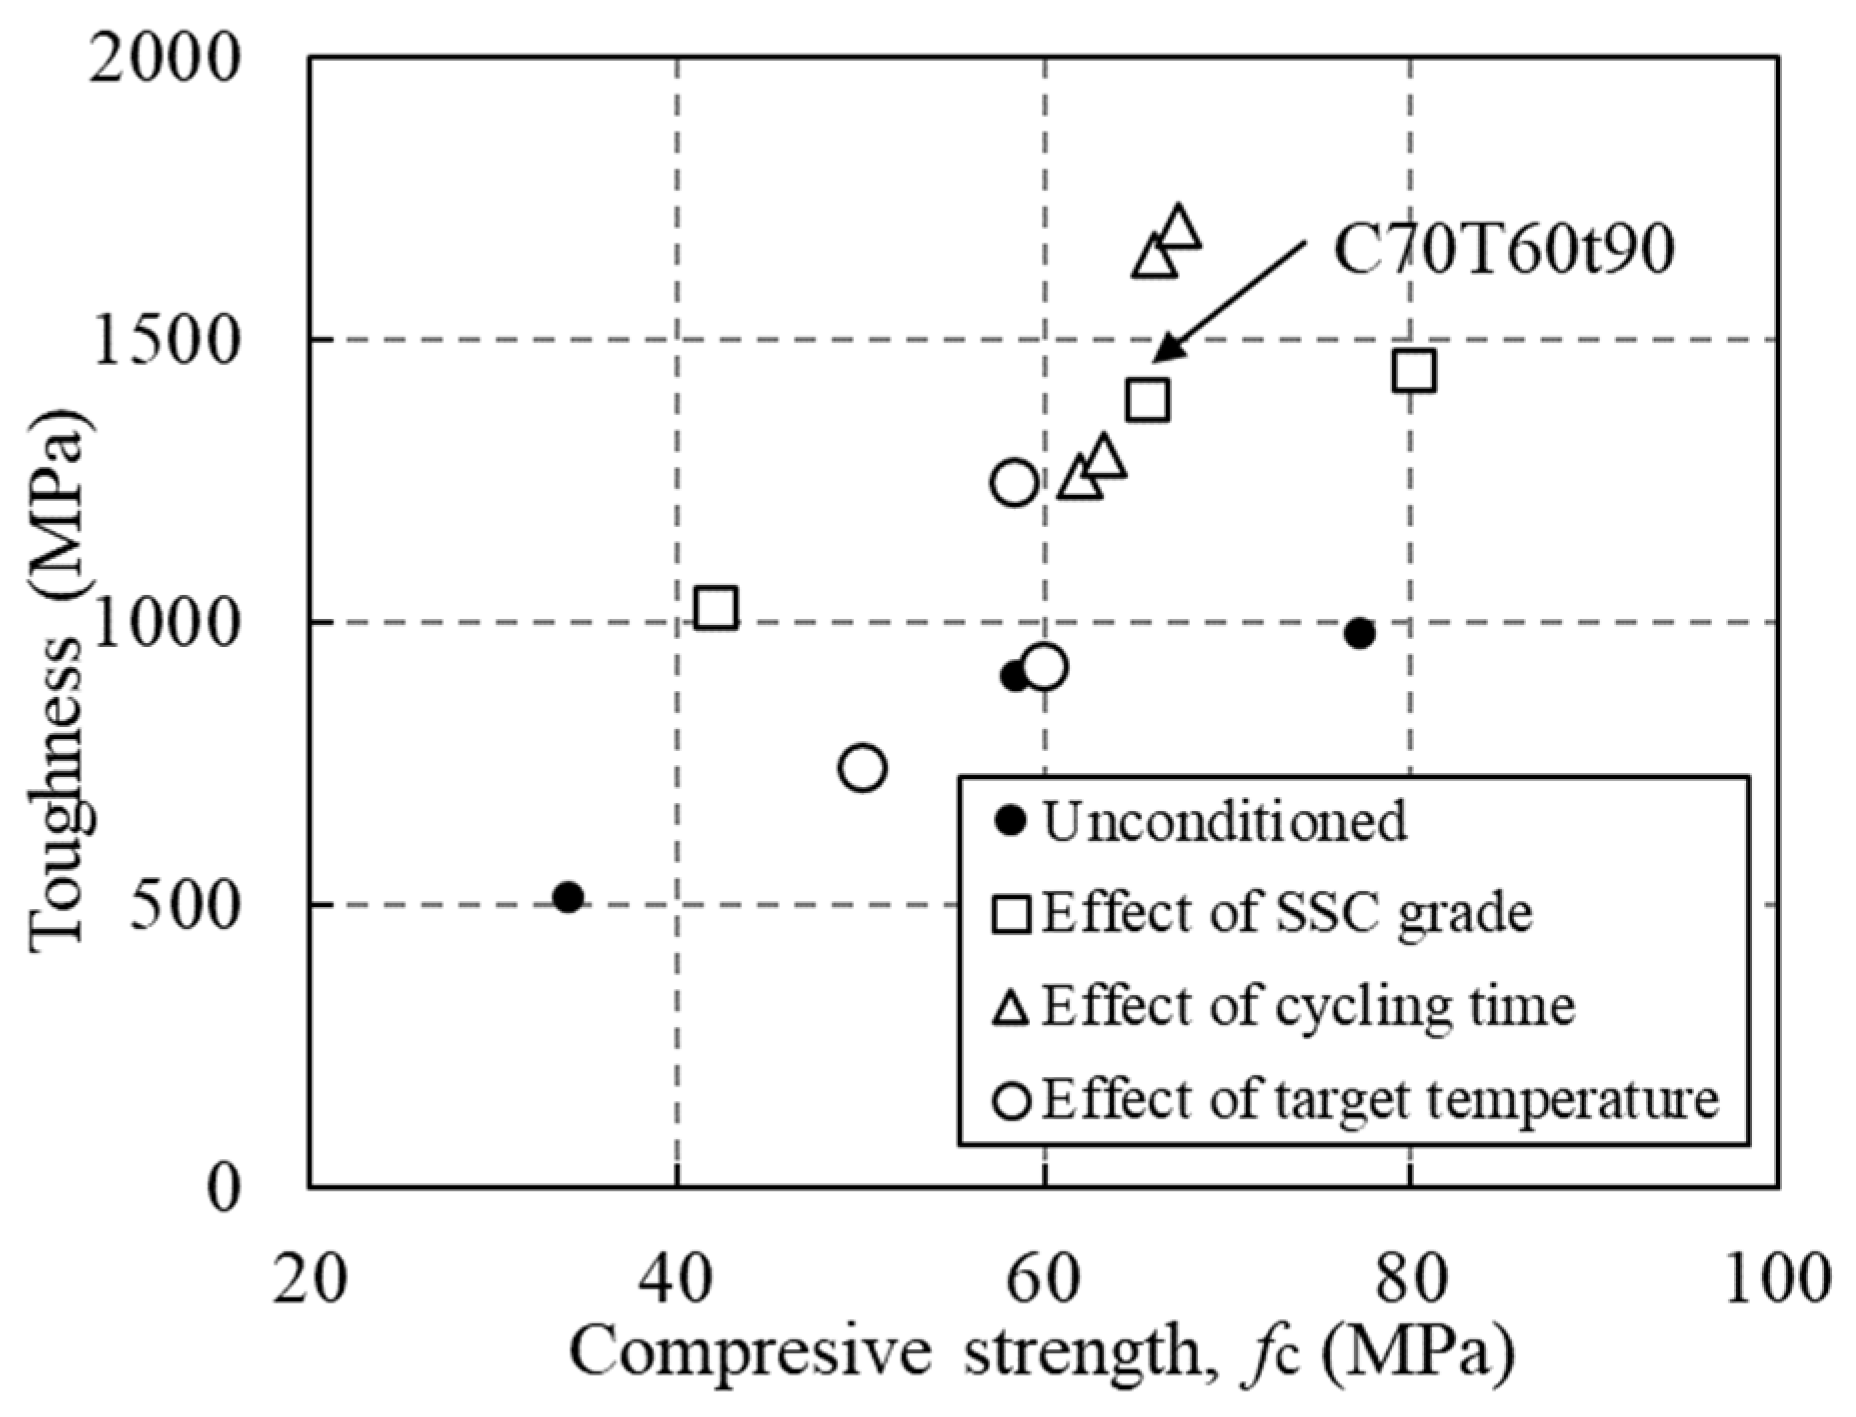
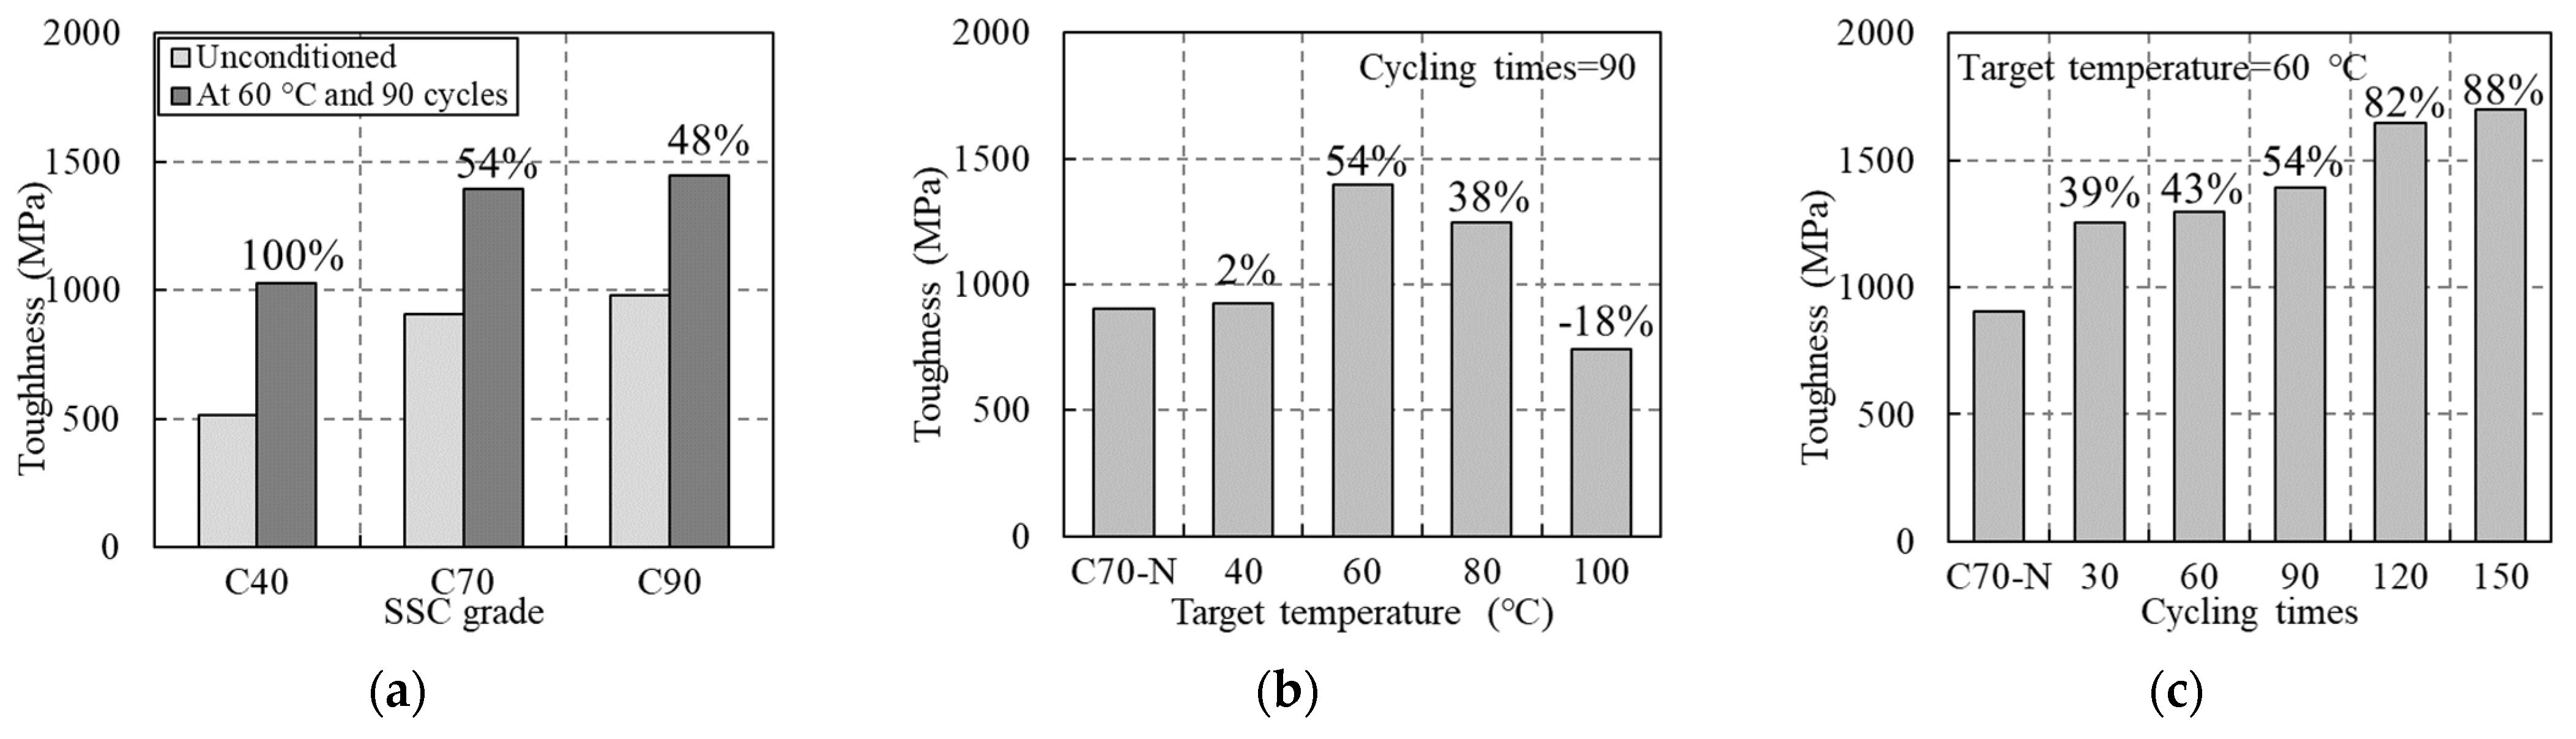
It is known that Young’s modulus (Ec) of concrete is related to compressive strength (fc), and a simplified formula is given in ACI318-11 [39].
E c = 4730 f c
where Ec and fc are in MPa. Figure 8 shows the experimental data of unconditioned SSC and SSC subjected to thermal cycles, as well as the curve of Equation (1). In Figure 8, specimen C70T60t90 is the benchmark specimen, and the legends “SSC grade”, “Cycling time” and “Target temperature” mean conditioned specimens with various grades (C40, C70 and C90), cycling times (30, 60, 90, 120 and 150) and target temperatures (40, 60, 80 and 100 °C), respectively. As shown in Figure 8, the effects of thermal cycles on Young’s modulus of concrete are negligible and solely depend on the compressive strength. The relationship proposed in ACI318-11 can be used to estimate Young’s modulus of SSC subjected to daily temperature variations.
Ultimate strain (εc) is the strain of concrete at compressive strength (fc). Past research found that ultimate strain is related to fc, and Popovics [40] proposed Equation (4) to estimate the ultimate strain of concrete:
ε c = 0.000937 f c 4
where fc is in MPa. The relationships between the εc and fc of tested specimens are presented in Figure 9, along with Equation (2). In general, the ultimate strain of SSC is mainly controlled by its compressive strength, and the effects of thermal cycling (e.g., target temperature and cycling times) are insignificant. The form of Equation (2) is still suitable for SSC, but the coefficient needs to be refined.
Poisson’s ratio is the ratio of the transverse strain to that of the axial strain of SSC under axial compression. It is a parameter representing the dilation property of concrete. As shown in Figure 10, Poisson’s ratio of SSC ranges from 0.17 to 0.24 regardless of compressive strength. The relationship between Poisson’s ratio and compressive strength is not clear. Figure 11 indicates that thermal cycling could affect Poisson’s ratio of SSC to some extent. With the increase in target temperature and cycling times, Poisson’s ratio is generally in a decreasing trend. This is probably due to the changes in the microstructure of SSC after thermal treatment. Nevertheless, if accounting for the discrepancies between Poisson’s ratio and the measurements, the effects of thermal cycling on Poisson’s ratio of SSC is not significant.

3.5. Toughness

Toughness is an index that represents the capability of concrete to absorb energy, which is generally defined as the area covered by the stress–strain curve of SSC. Due to the difficulty of obtaining a full-range curve of concrete, a “cut-off” method is adopted in which the stress–strain curve is terminated when the stress drops to 20% of the compressive strength [41]. The toughness of the specimens is listed in Table 2. Figure 12 shows the relationship between the toughness and the compressive strength of SSC, and Figure 13 shows the effects of concrete grade, target temperature and cycling times on the toughness. In general, concrete with high compressive strength and a flat post-peak branch of the stress–strain curve has a higher toughness. As shown in Figure 12, toughness increases when concrete strength increases. The toughness of SSC subjected to thermal cycling is higher than that of unconditioned SSC (Figure 13a). When the target temperature increases, toughness first increases and then decreases (Figure 13b). Furthermore, toughness increases when the number of cycling times increases (Figure 13c). These changing trends are similar to those of the compressive strength shown in Figure 7.

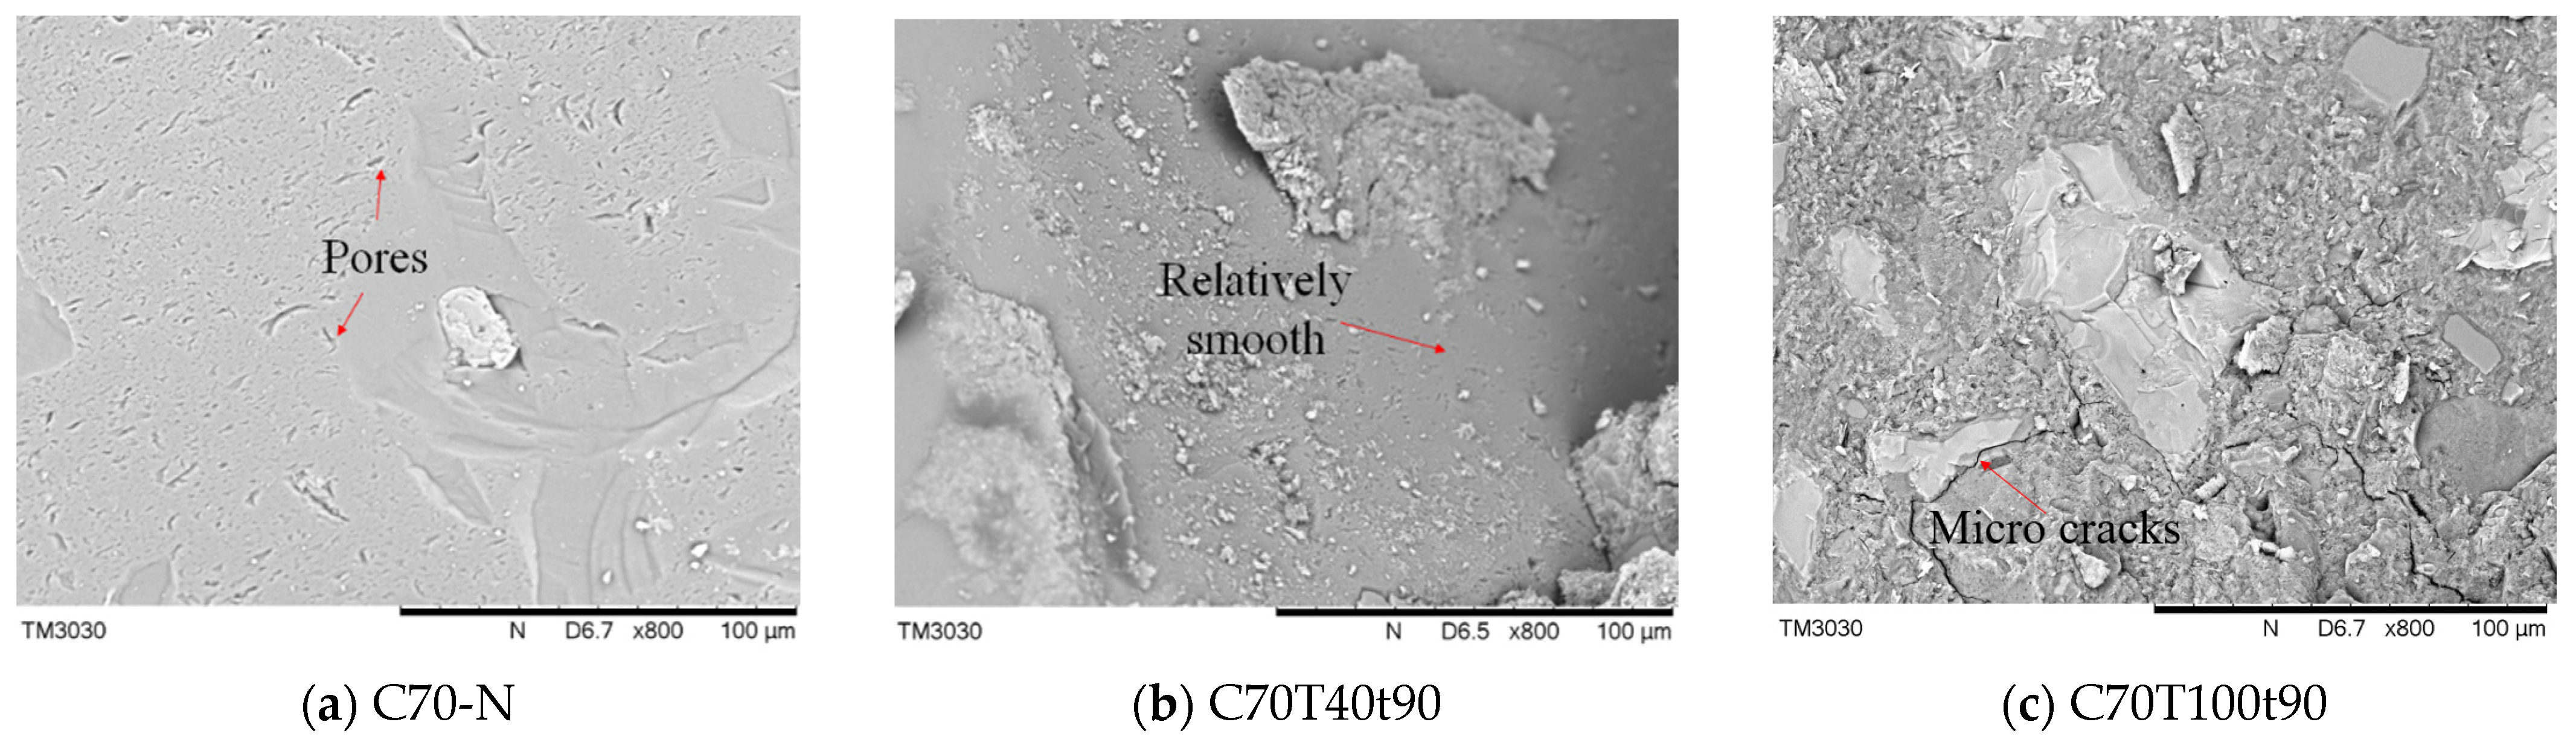
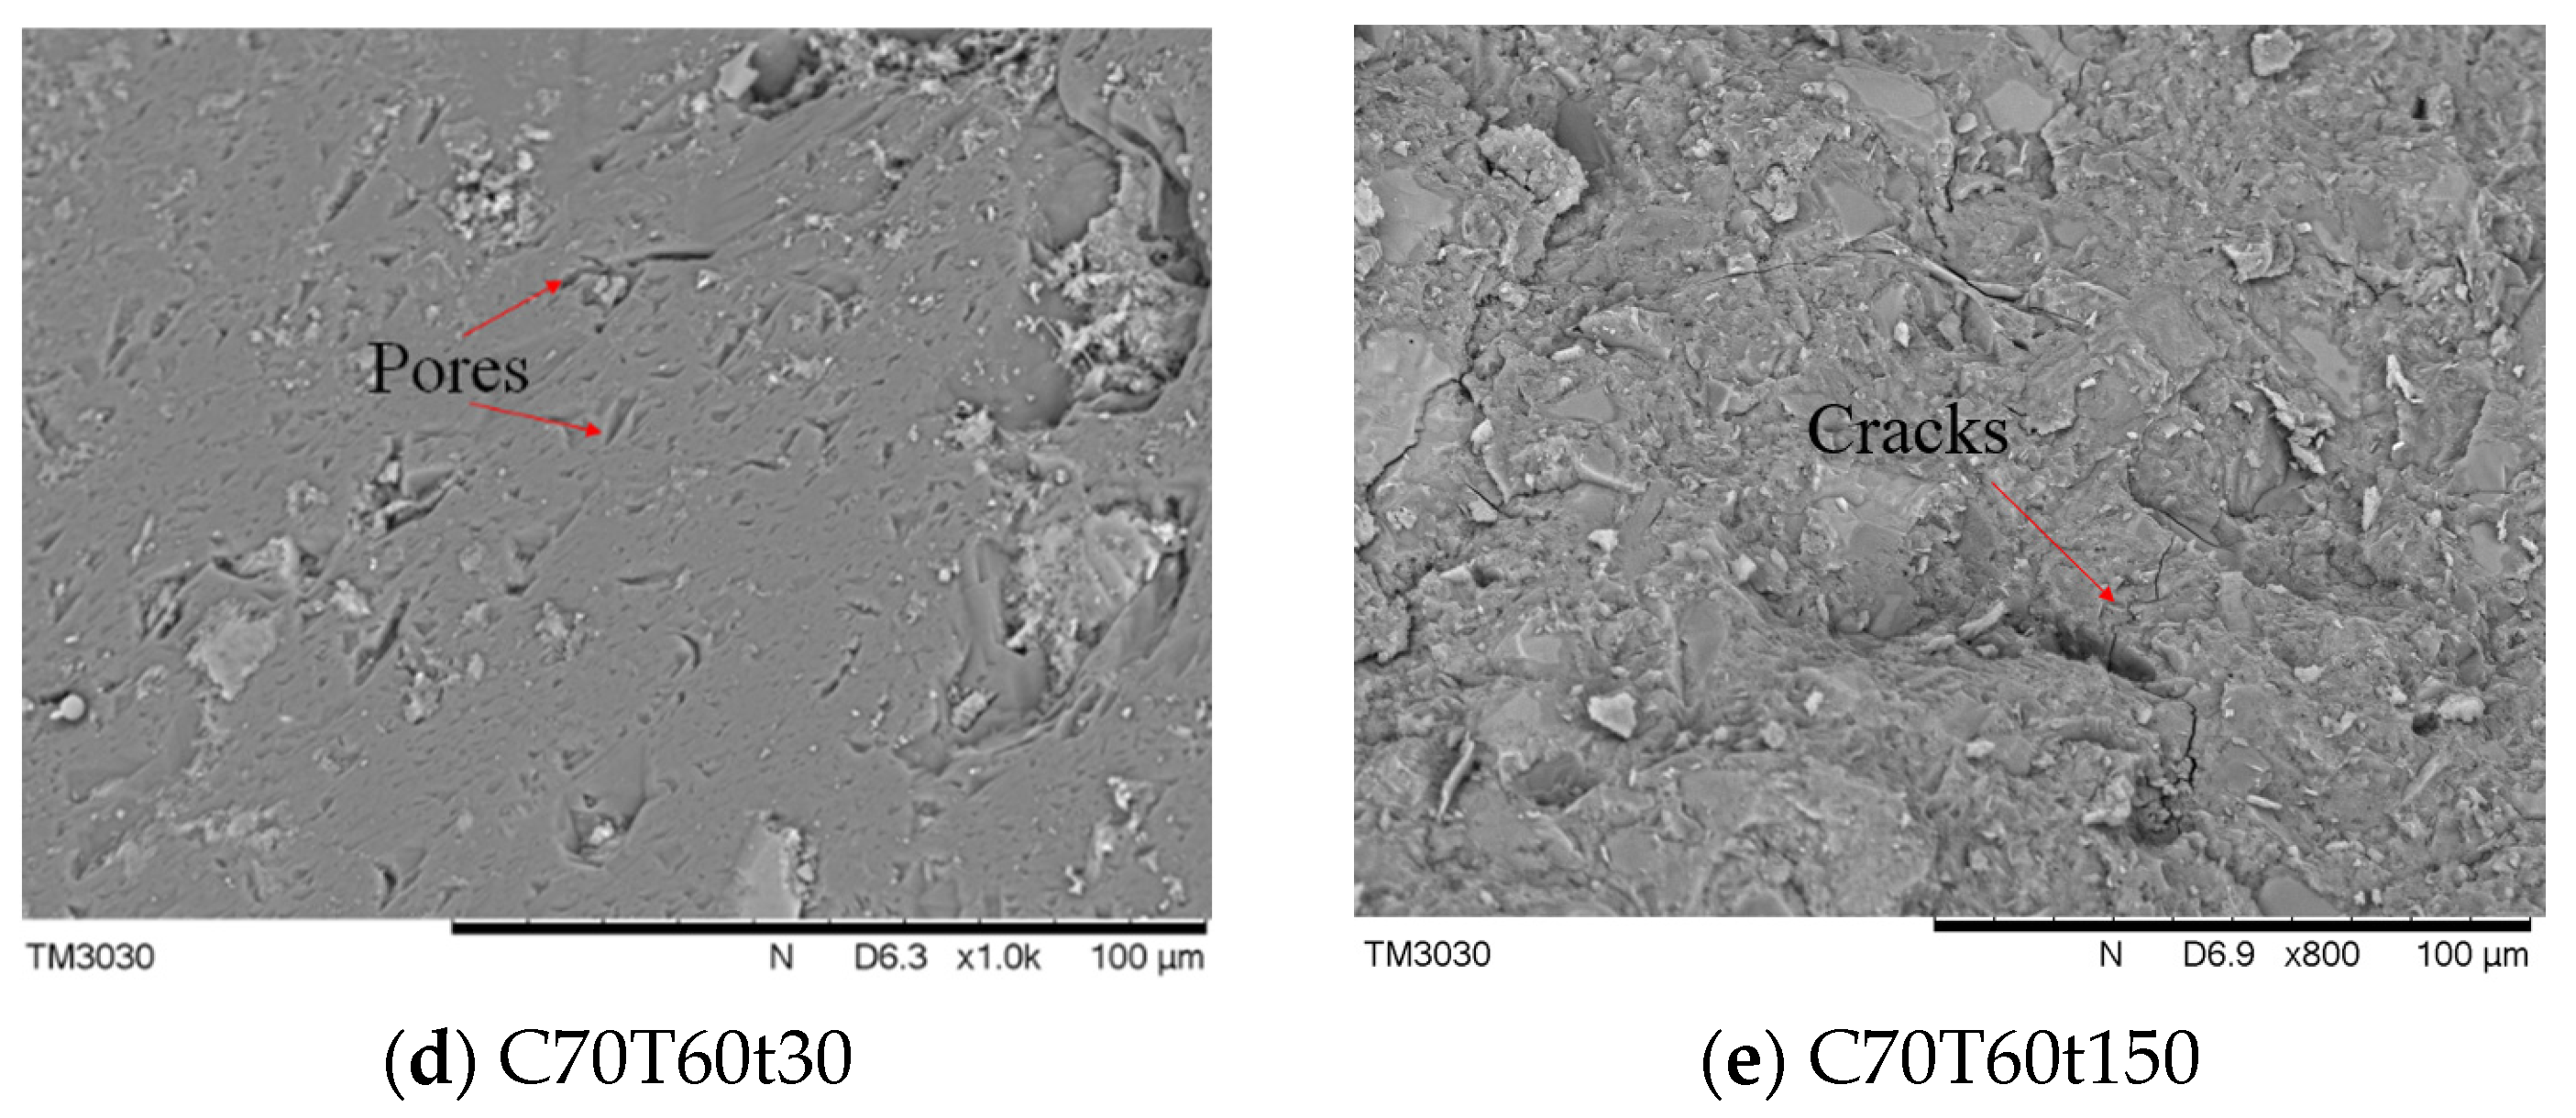
3.6. Microstructures of SSC

In order to understand the strength change mechanism of SSC, scanning electron microscopy (SEM) was conducted on SSC before and after thermal cycling using a scanning electron microscope TM3030. The samples were preheated at 40 °C for 2 days to remove any moisture. SEM images of SSC are presented in Figure 14. In unconditioned specimen C70-N, small pores, which are the capillary voids not filled by hydration products, can be found (Figure 14a). After thermal cycling (at 40 °C and 90 times of thermal cycling, Figure 14b), the surface becomes relatively smooth, as some voids are filled during further hydration. Nevertheless, if the temperature is high (e.g., 100 °C), microcracks are observed in the aggregate-to-paste interface. These microcracks are caused by the unmatchable expansion of paste and aggregates. Due to the repeated expansion and contraction that occurred during thermal cycles, the microcracks are noticeable, and they deteriorate the strength of SSC. Furthermore, some minor cracks are found in the paste, probably due to drying shrinkage (i.e., water loss at high temperature). For specimens with a target temperature of 60 °C and various cycling times (Figure 14d,e), microcracks in the interfacial transition zone are not obvious. Based on the SEM images, thermal cycling of 60 °C does not deteriorate the microstructure of SSC. These observations agree with the experimental results of SSC strength, as discussed in Section 3.3.

4. Stress–Strain Model for Seawater Sea-Sand Concrete

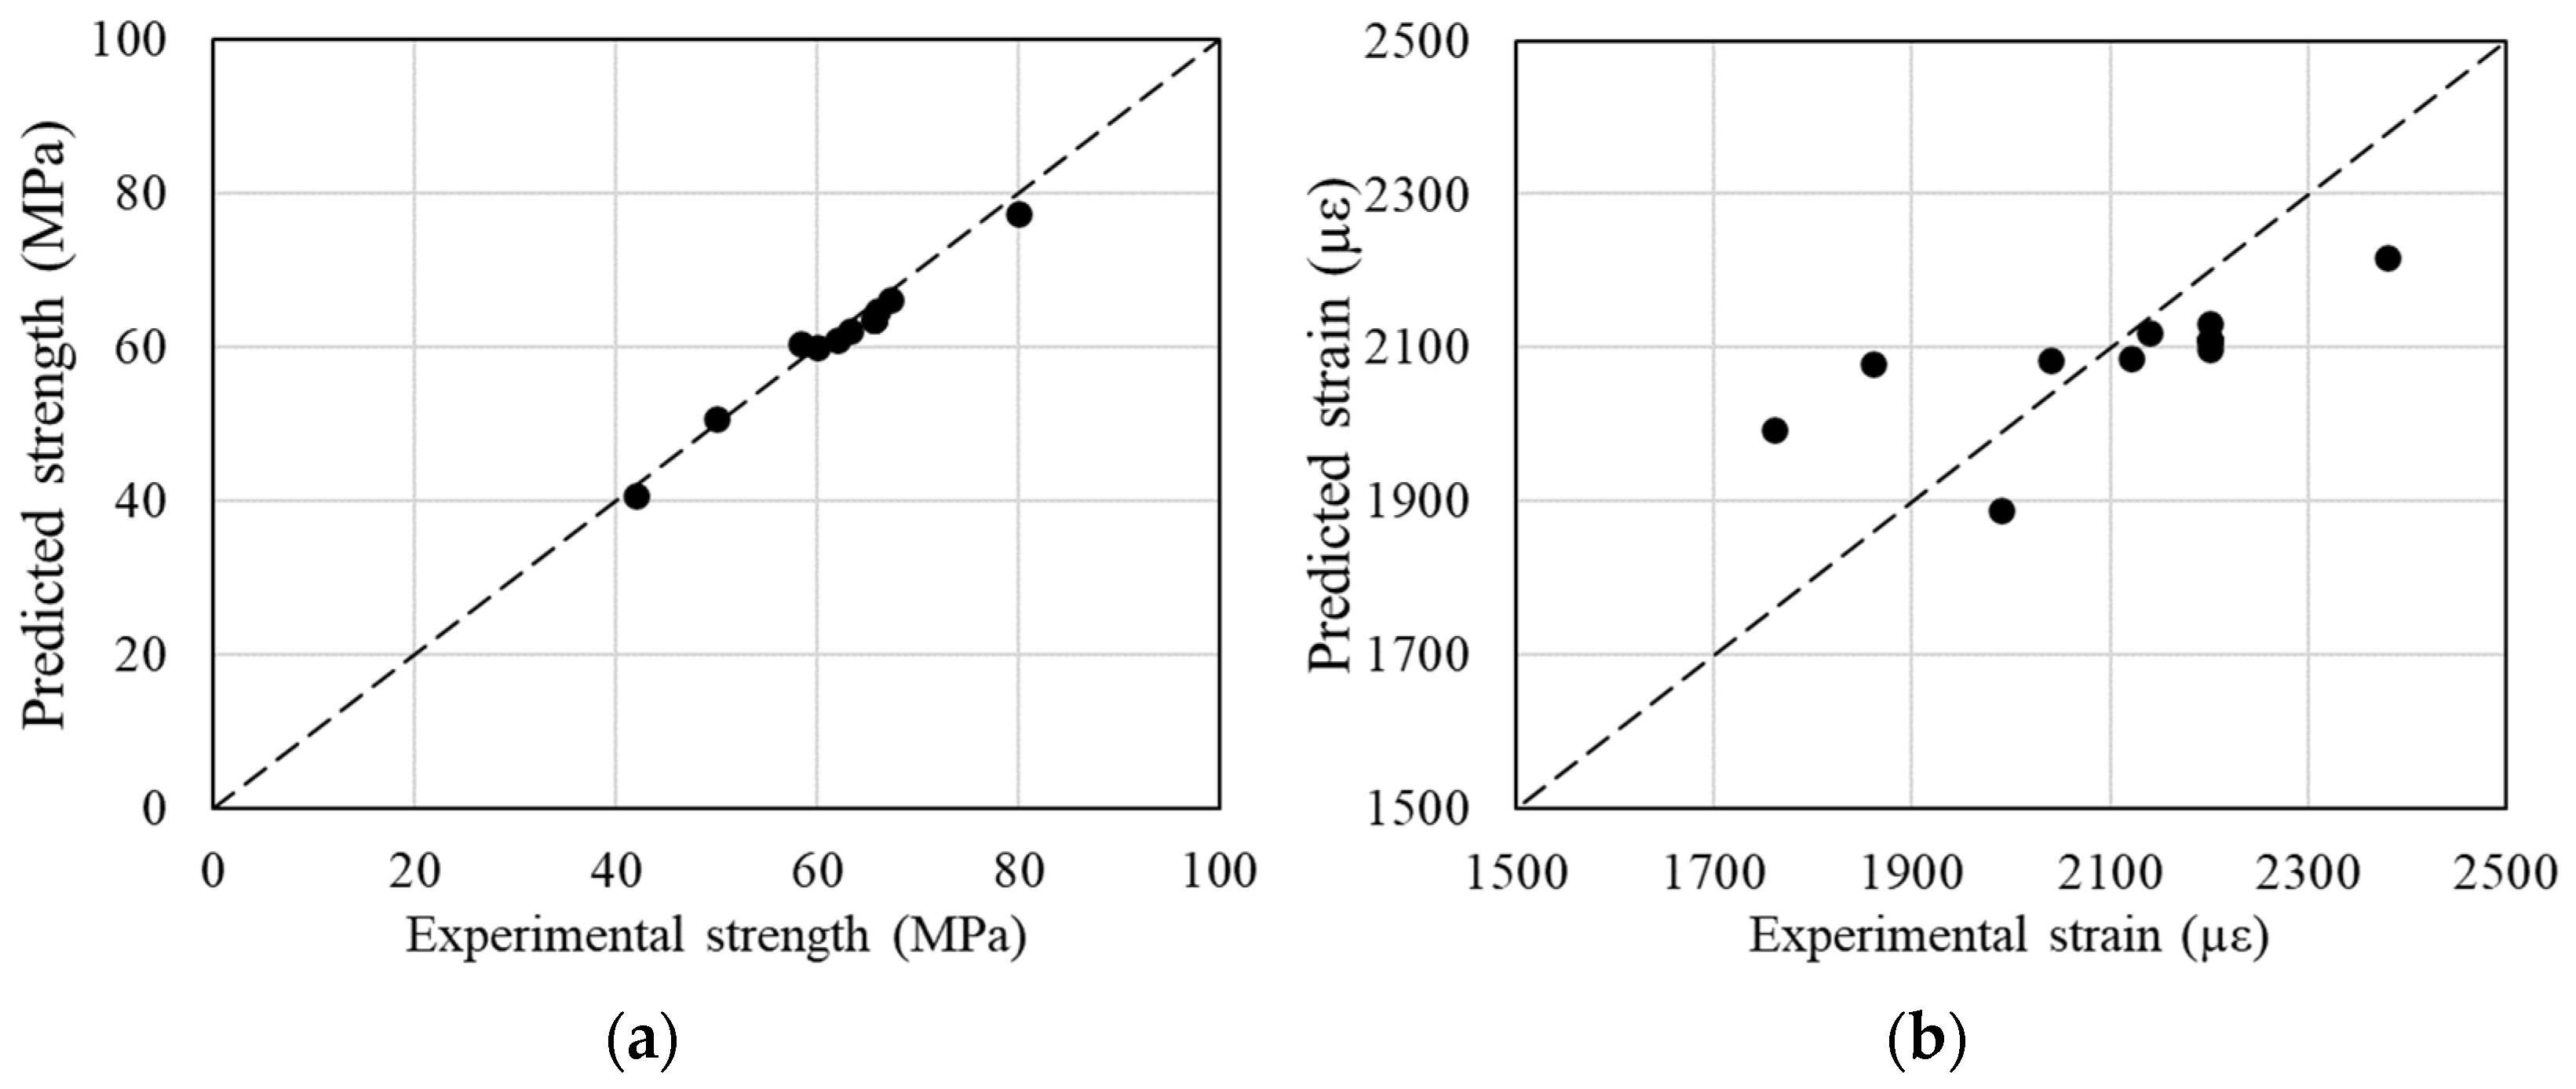
4.1. Concrete Strength and Corresponding Strain

Based on the experimental observations, the compressive strength of SSC after thermal cycling is mainly governed by its original strength (i.e., the strength of unconditioned SSC), the target temperature and the thermal cycling times. By using regression analysis, Equation (3) is proposed to estimate the strength of SSC:
f c T = f c ( 139 0.46 f c ) ( 0.13 T 2 + 15.8 T + 503 ) ( 0.68 P + 926 ) × 10 8
where f c T is the compressive strength of SSC after thermal cycling, fc is the compressive strength of unconditioned SSC, T is the target temperature and P is the number of cycling times. As discussed in Section 3.4, Equation (2) for predicting the ultimate strain of SSC is still applicable, but the coefficient needs to be refined. Therefore, Equation (4) is proposed to estimate the ultimate strain of SSC after thermal cycling ( ε c T ).
ε c T = 0.000747 f c T 4
where f c T is in MPa and can be determined by Equation (3). It is necessary to mention that Equation (4) is also applicable to unconditioned SSC. A comparison between the experimental and predicted results of the compressive strength and ultimate strain is shown in Figure 15. The average predicted-to-experimental ratio of f c T for specimens tested in this study is 0.99 with a coefficient of variation (COV) of 0.02, whereas the average ratio of ε c T is 1.00 with COV = 0.07. The prediction shows good accuracy. It is necessary to mention that Equation (3) is valid for T = 40–100 °C and P = 30–150, and further experimental verification is needed if the parameters are out of the range.

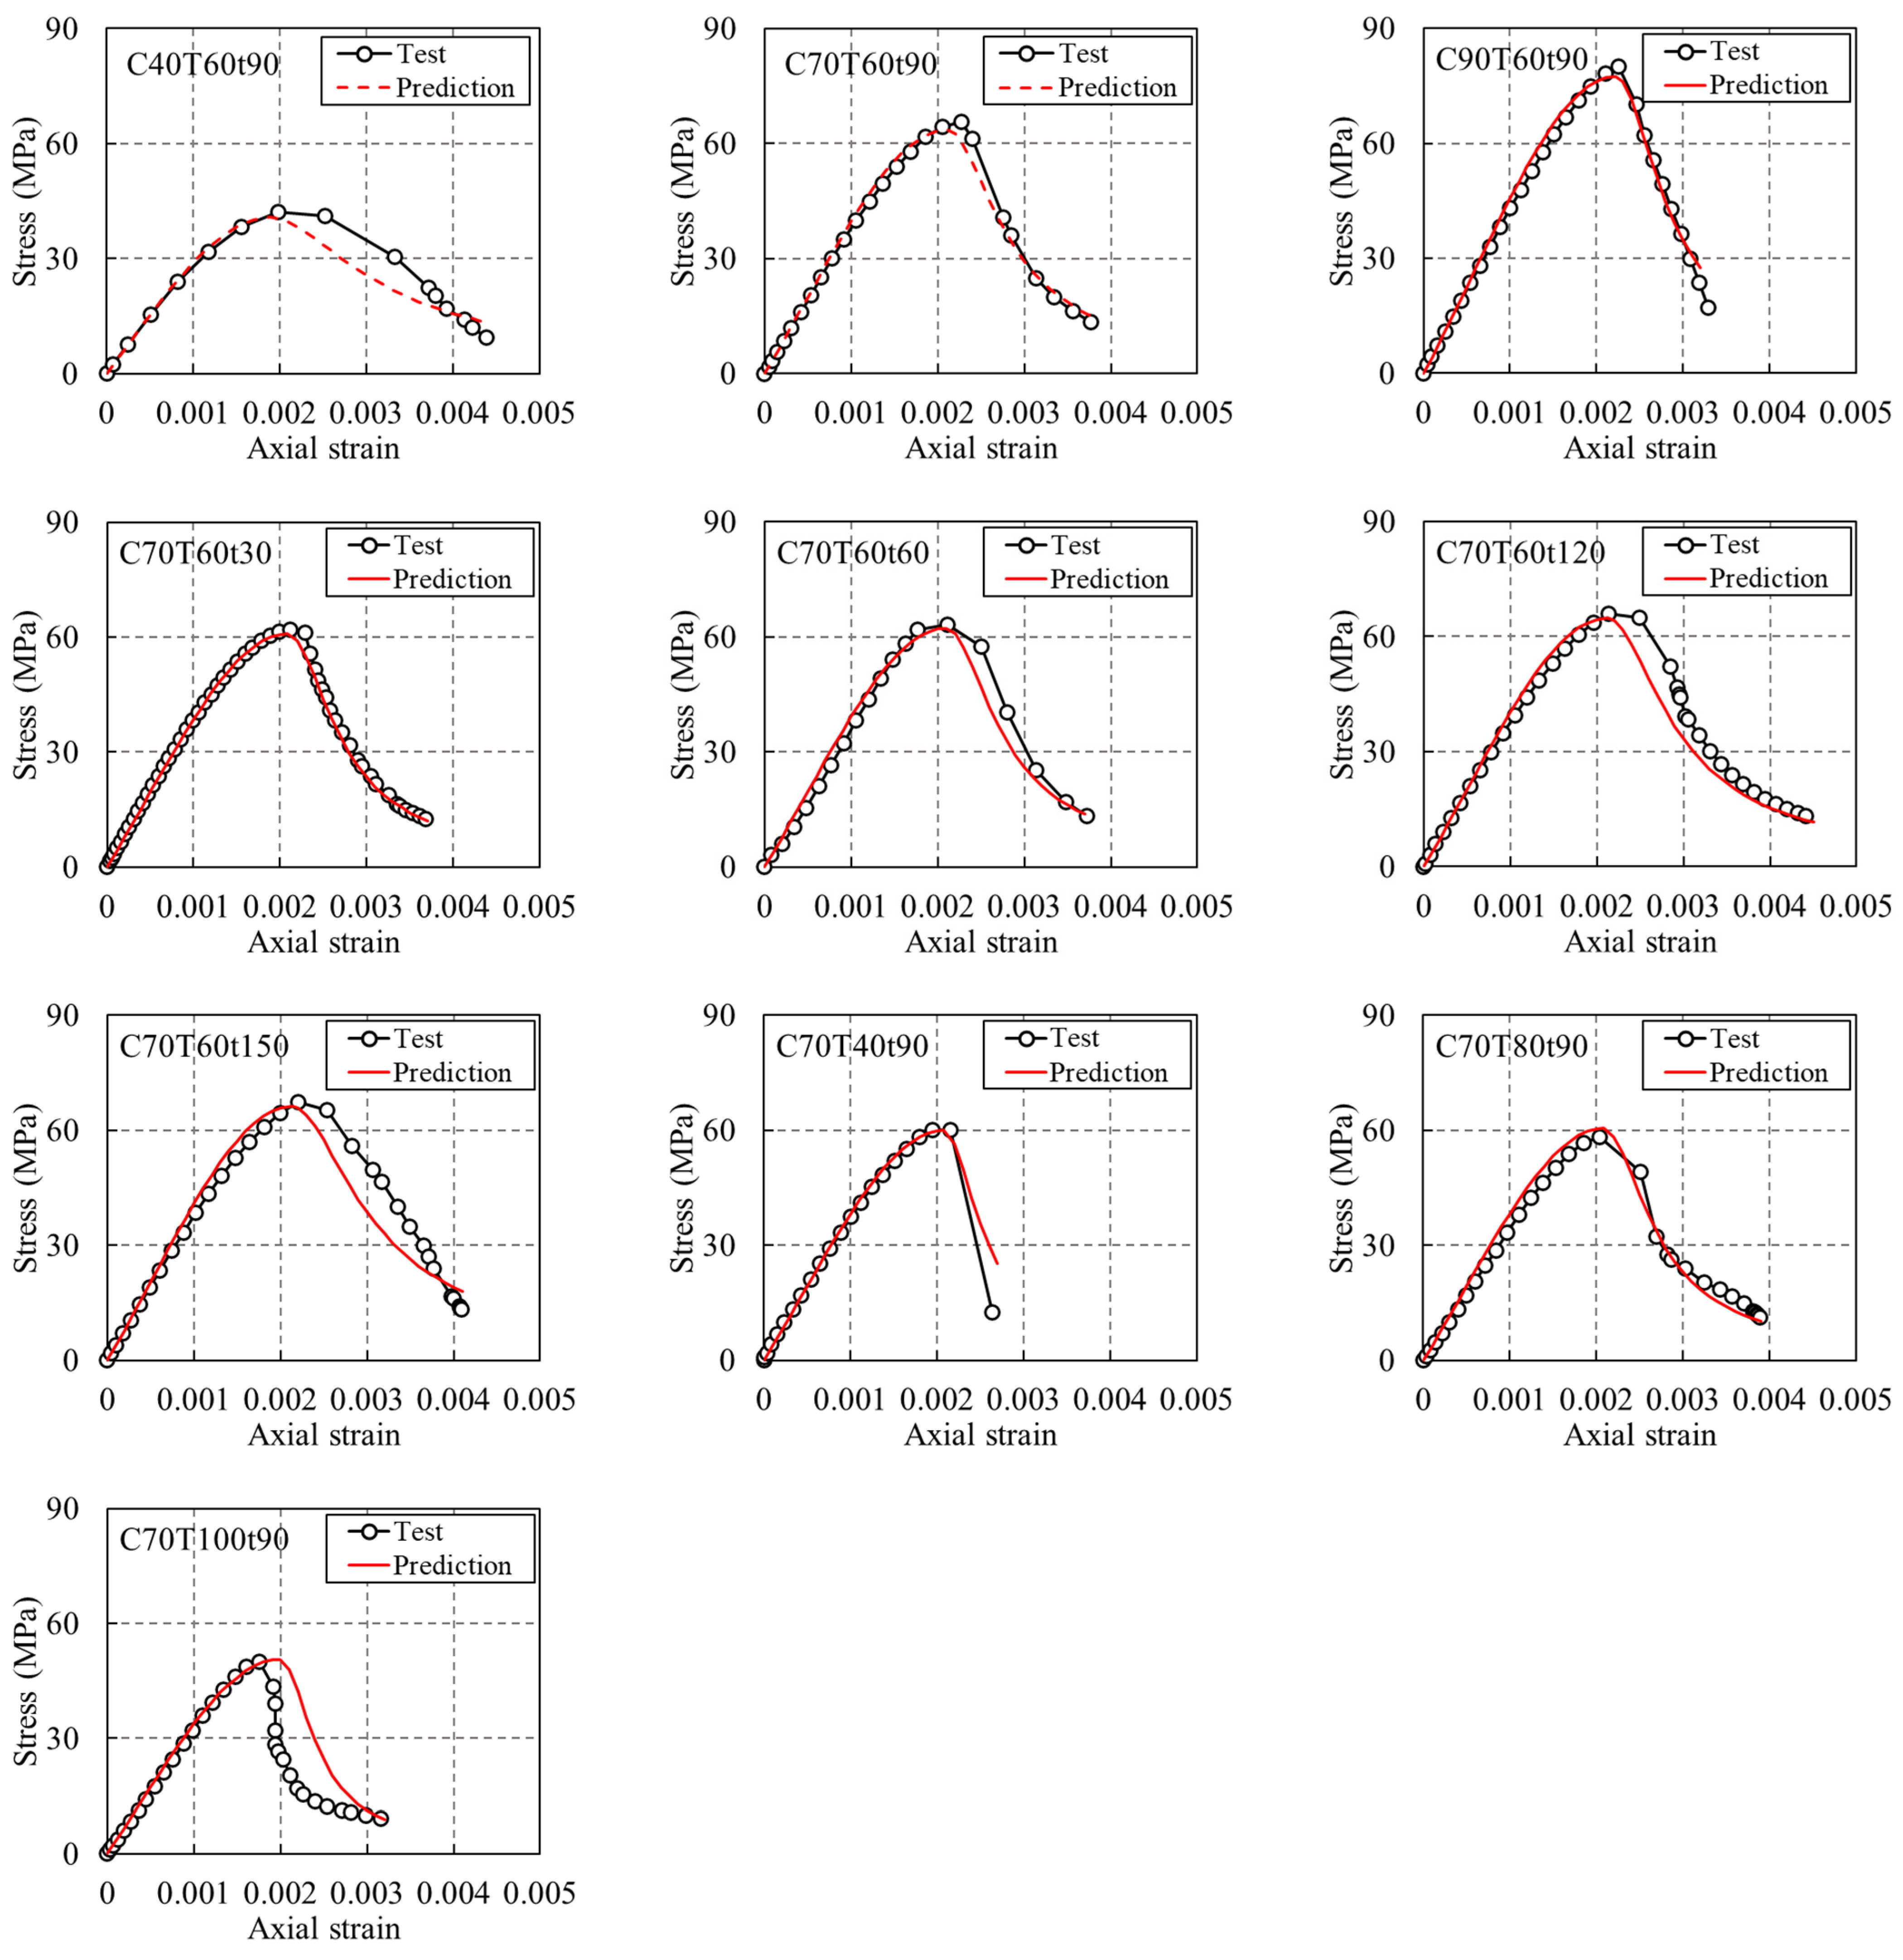
4.2. Stress–Strain Relationship

The stress–strain relationship is a graphical representation of concrete behavior that relates applied stress to concrete deformation. Knowledge of the deformability of concrete is necessary to compute the deflections of structures. Furthermore, the stress–strain relationship is a compulsory input for finite element analysis when accounting for material nonlinearity. Due to the degradation of concrete properties, the stress–strain relationship of SSC exposed to temperature variations may differ from that of conventional concrete. Based on an existing stress–strain model, new formulas were proposed to estimate the stress–strain curve of SSC.
In Li et al.’s study [42], a two-range stress–strain (σ-ε) model was proposed:
σ = { f c [ a ε ε c + ( 3 2 a ) ( ε ε c ) 2 + ( a 2 ) ( ε ε c ) 3 ] ( ε < ε c ) f c ε / ε c b ( ε / ε c 1 ) 2 + ε / ε c ( ε ε c )
where εc is the ultimate strain, fc is the compressive strength and a and b are factors controlling the shape of the stress–strain curve. As shown in Figure 6, thermal cycling does not affect the ascending branch of the σ-ε curve of SSC. In Li et al.’s study [42], factor a represents the ratio of Young’s modulus to the secant slope at the peak stress of the SSC σ-ε curve (i.e., Ec-to-fc/εc ratio). As Young’s modulus is a function of concrete strength (Equation (1)), factor a could be determined by:
a = 3.53 f c T 4 1
A high value of factor a for SSC means the nonlinearity of the ascending branch of the σ-ε curve is insignificant. Factor b mainly controls the steepness of the descending branch of the σ-ε curve, which can represent the ductility and toughness of concrete. Based on the experimental results of this study, an empirical formula is proposed to estimate factor b:
b = ( 0.29 f c T 9.16 ) ( 0.067 P + 16 ) ( 0.234 T 2 30.56 T + 1092 ) × 10 3
where f c T is the compressive strength of SSC after thermal cycling, T is the target temperature and P is the number of thermal cycling times. After determining factors a and b, the stress–strain relationship of SSC subjected to thermal cycling could be obtained by utilizing Equation (5). A comparison between the predicted and experimental stress–strain curves of SSC specimens is shown in Figure 16. The prediction closely matches the experimental results, which verifies the reasonability of the proposed model.

5. Conclusions

This paper mainly investigates the effects of temperature variations (e.g., target temperature and thermal cycling times) on the mechanical properties of seawater sea-sand concrete (SSC). The conclusions drawn are as follows:
(1)
At 60 °C, the compressive strength of SSC increases when the number of thermal cycling times increases due to the further hydration of cement. However, if the target temperature is 100 °C, the compressive strength of SSC is reduced, as microcracks are formed in the SSC interfacial transition zone by the unmatchable expansion and contraction of aggregates and paste.
(2)
Young’s modulus and the ultimate strain of SSC are functions of compressive strength, and the influence of thermal cycling is indirect. Poisson’s ratio of SSC decreases slightly with the increase in cycling times.
(3)
Compared to that of unconditioned SSC, the toughness of SSC subjected to thermal cycling is higher, as the strength is increased, and the post-peak branch of the stress–strain curve is flat.
(4)
A theoretical model is proposed to predict the stress–strain relationship of SSC under temperature variations, and the prediction closely matches the experimental results. It is necessary to mention that the proposed formulas are based on the specimens with temperatures ranging from 25 to 100 °C and cycling times ranging from 30 to 150 times.

Author Contributions

Conceptualization, S.Q., Z.X. and Y.L.; Data curation, S.Q. and Z.Y.; Formal analysis, S.Q., Z.Y. and S.H.; Funding acquisition, Z.X. and L.L.; Investigation, Z.X., Y.L. and S.H.; Methodology, S.Q., Z.X. and Y.L.; Project administration, L.L.; Resources, Z.X. and L.L.; Software, Z.Y. and Y.Z.; Supervision, Y.L. and L.L.; Writing—original draft, S.Q. and Y.L.; Writing—review and editing, Z.X. and Y.L. All authors have read and agreed to the published version of the manuscript.

Funding

This research was funded by the National Natural Science Foundation of China, grant numbers 12002091 and 12032009.

Institutional Review Board Statement

Not applicable.

Informed Consent Statement

Not applicable.

Data Availability Statement

The original data will be available upon requirement.

Acknowledgments

The authors gratefully acknowledge the financial support provided by the National Natural Science Foundation of China under grant no. 12002091 and no. 12032009.

Conflicts of Interest

The authors declare no conflict of interest.

References

  1. Fang, Z.; Fang, H.; Huang, J.; Jiang, H.; Chen, G. Static behavior of grouped stud shear connectors in steel-precast UHPC composite structures containing thin full-depth slabs. Eng. Struct. 2022, 252, 113484. [Google Scholar] [CrossRef]
  2. Sun, C.; Chen, L.; Xiao, J.; Singh, A.; Zeng, J. Compound utilization of construction and industrial waste as cementitious recycled powder in mortar. Resour. Conserv. Recycl. 2021, 170, 105561. [Google Scholar] [CrossRef]
  3. Sun, C.; Chen, Q.; Xiao, J.; Ge, W. Study on Aggregate Interlock Behavior of Pre-Cracked Recycled Aggregate Concrete without Stirrups. J. Build. Eng. 2021, 39, 102257. [Google Scholar] [CrossRef]
  4. Liu, X.; Liu, L.; Lyu, K.; Li, T.; Zhao, P.; Liu, R.; Zuo, J.; Fu, F.; Shah, S.P. Enhanced early hydration and mechanical properties of cement-based materials with recycled concrete powder modified by nano-silica. J. Build. Eng. 2022, 50, 104175. [Google Scholar] [CrossRef]
  5. Li, T.; Liu, X.; Zhang, Y.; Yang, H.; Zhi, Z.; Liu, L.; Ma, W.; Shah, S.P.; Li, W. Preparation of sea water sea sand high performance concrete (SHPC) and serving performance study in marine environment. Constr. Build. Mater. 2020, 254, 119114. [Google Scholar] [CrossRef]
  6. Tjaronge, M.W.; Irmawaty, R.; Adisasmita, S.A.; Amiruddin, A.; Hartini. Compressive strength and hydration process of self compacting concrete (SCC) mixed with sea water, marine sand and portland composite cement. Adv. Mat. Res. 2014, 935, 242–246. [Google Scholar] [CrossRef]
  7. Younis, A.; Ebead, U.; Suraneni, P.; Nanni, A. Fresh and hardened properties of seawater-mixed concrete. Constr. Build. Mater. 2018, 190, 276–286. [Google Scholar] [CrossRef]
  8. Xiao, J.; Qiang, C.; Nanni, A.; Zhang, K. Use of sea-sand and seawater in concrete construction: Current status and future opportunities. Constr. Build. Mater. 2017, 155, 1101–1111. [Google Scholar] [CrossRef]
  9. Liu, W.; Cui, H.; Dong, Z.; Xing, F.; Zhang, H.; Lo, T.Y. Carbonation of concrete made with dredged marine sand and its effect on chloride binding. Constr. Build. Mater. 2016, 120, 1–9. [Google Scholar] [CrossRef]
  10. Xiao, J.; Long, X.; Qu, W.; Li, L.; Jiang, H.; Zhong, Z. Influence of sulfuric acid corrosion on concrete stress-strain relationship under uniaxial compression. Measurement 2022, 187, 110318. [Google Scholar] [CrossRef]
  11. Mohammed, T.U.T.; Hamada, H.; Yamaji, T. Performance of seawater-mixed concrete in the tidal environment. Cem. Concr. Res. 2004, 34, 593–601. [Google Scholar] [CrossRef]
  12. Xie, J.; Li, Y.; Lu, Z.; Fan, Z.; Li, J.; Li, S. Effects of immersion in water, alkaline solution and seawater on the shear performance of BFRP bars embedded in seawater sea-sand concrete. J. Compos. Constr. 2022, 26, 04021071. [Google Scholar] [CrossRef]
  13. Xiong, Z.; Lin, L.; Qiao, S.; Li, L.; Li, Y.; He, S.; Li, Z.; Liu, F.; Chen, Y. Axial performance of seawater sea-sand concrete columns reinforced with basalt fibre-reinforced polymer bars under concentric compressive load. J. Build. Eng. 2022, 47, 103828. [Google Scholar] [CrossRef]
  14. Li, Y.L.; Zhao, X.L.; Raman Singh, R.K.; Al-Saadi, S. Experimental study on seawater and sea sand concrete filled GFRP and stainless steel tubular stub columns. Thin-Walled Struct. 2016, 106, 390–406. [Google Scholar] [CrossRef]
  15. Dong, Z.; Wu, G.; Zhao, X.-L.; Zhu, H.; Lian, J.-L. Durability test on the flexural performance of seawater sea-sand concrete beams completely reinforced with FRP bars. Constr. Build. Mater. 2018, 192, 671–682. [Google Scholar] [CrossRef]
  16. Nishida, T.; Otsuki, N.; Ohara, H.; Garba-Say, Z.M.; Nagata, T. Some considerations for applicability of seawater as mixing water in concrete. J. Mater. Civ. Eng. 2015, 7, B4014004. [Google Scholar] [CrossRef] [Green Version]
  17. El-Salakawy, E.; Benmokrane, B.; El-Ragaby, A.; Nadeau, D. Field investigation on the first bridge deck slab reinforced with glass FRP bars constructed in Canada. J. Compos. Constr. 2005, 9, 470–479. [Google Scholar] [CrossRef]
  18. Limeira, J.; Agullo, L.; Etxeberria, M. Dredged marine sand in concrete: An experimental section of a harbor pavement. Constr. Build. Mater. 2010, 24, 863–870. [Google Scholar] [CrossRef]
  19. Mehta, P.K.; Monteiro, P.J.M. Concrete: Microstructure, Properties, and Materials, 3rd ed.; McGraw-Hill, New York, NY, USA, 2006.
  20. Wegian, F.M. Effect of seawater for mixing and curing on structural concrete. IES J. Part A Civ. Struct. Eng. 2010, 3, 235–243. [Google Scholar] [CrossRef]
  21. Xiong, Z.; Mai, G.; Qiao, S.; He, S.; Zhang, B.; Wang, H.; Zhou, K.; Li, L. Fatigue bond behaviour between basalt fibre-reinforced polymer bars and seawater sea-sand concrete. Ocean. Coast. Manag 2022, 218, 106038. [Google Scholar] [CrossRef]
  22. Tang, Y.; Feng, W.; Chen, Z.; Nong, Y.; Guan, S.; Sun, J. Fracture behavior of a sustainable material: Recycled concrete with waste crumb rubber subjected to elevated temperatures. J. Clean Prod. 2021, 318, 128553. [Google Scholar] [CrossRef]
  23. Silva, M.A.G.; Biscaia, H.; Chastre, C. Influence of temperature cycles on bond between glass fiber-reinforced polymer and concrete. ACI Struct. J. 2013, 110, 977–987. [Google Scholar]
  24. Wang, Z.; Zhao, X.-L.; Xian, G.; Wu, G.; Raman, R.S.; Al-Saadi, S. Effect of sustained load and seawater and sea sand concrete environment on durability of basalt-and glass-fibre reinforced polymer (B/GFRP) bars. Corros. Sci. 2018, 138, 200–218. [Google Scholar] [CrossRef]
  25. Liang, R.Y.; Niu, Y.-Z. Temperature and curling stress in concrete pavements: Analytical solutions. J. Transp. Eng. 1998, 124, 91–100. [Google Scholar] [CrossRef]
  26. Nama, B.H.; Yeon, J.H.; Behring, Z. Effect of daily temperature variations on the continuous deflection profiles of airfield jointed concrete pavements. Constr. Build. Mater. 2014, 73, 261–270. [Google Scholar] [CrossRef]
  27. Liu, H.; Wang, X.; Jiao, Y. Effect of temperature variation on modal frequency of reinforced concrete slab and beam in cold regions. Shock Vib. 2016, 2016, 4792786. [Google Scholar] [CrossRef] [Green Version]
  28. An, M.; Huang, H.; Wang, Y.; Zhao, G. Effect of thermal cycling on the properties of high-performance concrete: Microstructure and mechanism. Constr. Build. Mater. 2020, 243, 118310. [Google Scholar] [CrossRef]
  29. Liu, F.; Feng, W.; Xiong, Z.; Tu, G.; Li, L. Static and impact behaviour of recycled aggregate concrete under daily temperature variations. J. Clean. Prod. 2018, 191, 283–296. [Google Scholar] [CrossRef]
  30. ASTM D1141-98; Standard Practice for the Preparation of Substitute Ocean Water. American Society for Testing and Materials: West Conshohocken, PA, USA, 2013.
  31. JGJ 55-2011; Specification for Mix Proportion Design of Ordinary Concrete. Ministry of Housing and Urban-Rural Development: Beijing, China, 2011.
  32. Xiong, Z.; Zhou, K.; Ye, Z.; He, S.; Li, L.; Li, Y.; Zeng, Y.; Liu, F. Bond behavior of basalt fiber reinforced polymer bars in seawater sea-sand concrete exposed to daily temperature variations. Adv. Struct. Eng. 2021, submitted.
  33. Guo, X.; Shu, S.; Wang, Y.; Huang, P.; Lin, J.; Guo, Y. Effect of subtropical natural exposure on the bond behavior of FRP-concrete interface. Polymers 2020, 12, 967. [Google Scholar] [CrossRef] [Green Version]
  34. Ding, F.-X.; Yu, Z.-W.; Bai, Y.; Gong, Y.-Z. Elasto-plastic analysis of circular concrete-filled steel tube stub columns. J. Constr. Steel Res. 2011, 67, 1567–1577. [Google Scholar] [CrossRef]
  35. ASTM C39/C39M; Standard Test Method for Compressive Strength of Cylindrical Concrete Specimens. American Society for Testing and Materials: West Conshohocken, PA, USA, 2017.
  36. Ferretti, E. On Poisson’s ratio and volumetric strain in concrete. Int. J. Fract. 2004, 126, 49–55. [Google Scholar] [CrossRef]
  37. Huang, Y.J.; He, X.J.; Wang, Q.; Sun, Y.D. Mechanical properties of sea sand recycled aggregate concrete under axial compression. Constr. Build. Mater. 2018, 175, 55–63. [Google Scholar] [CrossRef]
  38. Li, Y.L.; Zhao, X.L.; Singh Raman, R.K.; Al-Saadi, S. Thermal and mechanical properties of alkali-activated slag paste, mortar and concrete utilising seawater and sea sand. Constr. Build. Mater. 2018, 159, 704–724. [Google Scholar] [CrossRef]
  39. ACI 318-11; Building Code Requirements for Structural Concrete and Commentary. American Concrete Institute: Farmington Hills, MI, USA, 2011.
  40. Popovics, S. A numerical approach to the complete stress-strain curve of concrete. Cem Concr Res. 1973, 3, 583–599. [Google Scholar] [CrossRef]
  41. Li, L.G.; Lin, C.J.; Chen, G.M.; Kwan, A.K.H.; Jiang, T. Effects of packing on compressive behaviour of recycled aggregate concrete. Constr Build. Mater. 2017, 157, 757–777. [Google Scholar] [CrossRef]
  42. Li, L.J.; Ruan, S.H.; Zeng, L. Mechanical properties and constitutive equations of concrete containing low volume of tire rubber particles. Constr Build. Mater. 2014, 70, 291–308. [Google Scholar] [CrossRef]
Figure 1. Demonstration project for FRP-SSC bridge decks: (a) FRP mesh; (b) concrete casting; (c) bridge deck (Adapted from Ref. [8]).
Buildings 12 00517 g001
Figure 2. Simulation of daily temperature variations: (a) cyclic temperature regime; (b) programmable environmental chamber (Adapted from Ref. [32]).
Buildings 12 00517 g002
Figure 3. Recorded data for Guangzhou, China: (a) temperature; (b) relative humidity (Adapted from Ref. [33]).
Buildings 12 00517 g003
Figure 4. Experimental setup for SSC compressive test.
Buildings 12 00517 g004
Figure 5. Failure modes of SSC cylinders.
Buildings 12 00517 g005aBuildings 12 00517 g005b
Figure 6. Stress–strain curves of SSC: (a) unconditioned and conditioned specimens; (b) specimens with various target temperatures; (c) specimens with various cycling times.
Buildings 12 00517 g006
Figure 7. Compressive strength of SSC: (a) effects of SSC grade; (b) effects of target temperature; (c) effects of cycling times.
Buildings 12 00517 g007
Figure 8. Young’s modulus of SSC.
Buildings 12 00517 g008
Figure 9. Ultimate strain of SSC.
Buildings 12 00517 g009
Figure 10. Relationship between Poisson’s ratio and compressive strength.
Buildings 12 00517 g010
Figure 11. Poisson’s ratio of SSC: (a) effects of SSC grade; (b) effects of target temperature; (c) effects of cycling times.
Buildings 12 00517 g011
Figure 12. Relationship between toughness and compressive strength.
Buildings 12 00517 g012
Figure 13. Toughness of SSC: (a) effects of SSC grade; (b) effects of target temperature; (c) effects of cycling times.
Buildings 12 00517 g013
Figure 14. SEM images of SSC.
Buildings 12 00517 g014aBuildings 12 00517 g014b
Figure 15. Comparison between the experimental and predicted results: (a) compressive strength; (b) ultimate strain.
Buildings 12 00517 g015
Figure 16. Prediction of stress–strain relationship of SSC subjected to thermal cycles.
Buildings 12 00517 g016
Table 1. Mix proportions of SSC.
ConcreteCement: Seawater: Sea Sand: Gravels: SP (by Weight)
C401:0.55:2.101:3.151:0.008
C701:0.38:1.613:3.276:0.01
C901:0.295:1.054:2.24:0.01
Table 2. SSC specimens and key experimental results.
Specimen f c   ( MPa ) Ec (GPa)υεc (µε)Toughness (MPa)
C40-N34.126.90.191940513
C70-N58.437.00.232250905
C90-N77.241.50.202340977
C40T60t9042.129.80.1719901025
C70T60t9065.739.50.2022001394
C90T60t9080.142.40.2023801447
C70T60t3061.939.70.2121201256
C70T60t6063.340.00.2422001297
C70T60t12066.038.40.1921401647
C70T60t15067.337.90.1822001700
C70T40t9059.937.30.221860923
C70T80t9058.334.30.1820401248
C70T100t9050.032.30.181760744
Publisher’s Note: MDPI stays neutral with regard to jurisdictional claims in published maps and institutional affiliations.

