1. Introduction
It is well known that energy consumed by buildings accounts for more than 40% all global energy consumption, and 60% of that goes to ensuring indoor thermal comfort for occupants [
1,
2]. Air conditioning systems, which play a crucial role in creating a thermally comfortable living environment, are used extensively since most people spend 80–90% of their time inside buildings. Because air conditioning systems make up such a large portion of total energy consumption, researchers are paying more attention to their optimization [
3,
4,
5,
6]. The goal is to reduce building energy consumption by optimizing air conditioning systems without reducing indoor thermal comfort. To achieve this, efficient operation strategies based on building envelope characteristics and loads and meteorological conditions are required. Over the years, many studies have investigated energy consumption by radiant cooling systems and found that, compared to conventional convection air conditioning systems, radiant cooling systems can reduce energy consumption by about 40% [
7,
8,
9,
10,
11].
Radiant floor cooling (RFC) has attracted widespread attention because of its good thermal comfort, low energy consumption, building space saving, and low operating noise. Researchers have conducted many practical application studies and field measurement studies on radiant floor air conditioning systems [
12,
13,
14,
15]. Sourbron et al. compared the response times of RFC and convection air conditioning systems based on the thermal inertia of the envelope and proposed an operational strategy utilizing intermittent operation [
14,
16,
17,
18]. Romaní et al. proposed a water supply temperature operation strategy where the water supply temperature is continuously adjusted according to the outdoor temperature, but this strategy was more complicated than others. A water supply temperature operating strategy is well adapted to maintaining stable operation while accounting for uncertainties resulting from increased indoor heat loads or solar radiant heat gain throughout the day. However, RFCs are not able to immediately deal with changes in hot and cold loads due to the high thermal inertia of buildings, so other energy handling systems must be set up to buffer rapid change [
19,
20,
21,
22,
23]. In light of this, Mikeska et al. demonstrated the advantages of using the RFC system at night or during off-peak hours, thus effectively utilizing low temperature air from natural ventilation and off-peak electricity prices. In this intermittent operation, when the system is stopped, heat accumulates in the air near the radiant floor surface, and when the system is started again, a strong temperature gradient is created near the radiant floor surface. This strategy increases the heat capacity of the radiant floor system and enables it to absorb heat for a short period of time while reducing energy consumption [
19,
24,
25,
26].
A summary of previous applications and studies on radiant cooling are listed in
Table 1. Zarrella et al. studied radiant floor cooling with different ventilation systems using simulations, their results showed that RFC systems need to be combined with ventilation systems to achieve efficient and energy-saving operation [
27,
28]. Zhao et al. proposed a simple method for predicting the performance of RFC systems with solar radiation in steady states or large open spaces using a combination of experiments and simulations, which considered the role of solar radiation in RFC systems [
29]. Jin et al. showed that the risk of condensation on a radiant surface is high during the start-up phase and that an air convector can effectively reduce the risk of condensation on the radiant surface [
30,
31]. Srivastava et al. studied a roof radiation system combined with different ventilation systems using both simulations and experiments, and their results showed that the radiant cooling system was able to maintain efficient operation in different climate zones [
32,
33]. Feng et al. showed that the cold transient rates of a radiant system are faster than those of an air system during heat gain by an experimental building [
34]. Fernandez-H et al. studied a radiant floor with fan coil/displacement ventilation systems using experimental methods, and their results showed that radiant cooling systems not only improve energy efficiency, but also the system response time [
35,
36]. Joe et al. showed that different operating strategies can achieve different levels of energy savings while ensuring indoor thermal comfort [
37,
38].
Convection air conditioning systems have short response times and are capable of rapid temperature adjustment compared to RFC systems. Here, to utilize the advantages of both RFC and traditional convection air conditioning systems, a combined radiant floor and fan coil cooling (RFCAFC) system was developed. As with conventional air conditioning systems, the adoption of suitable operation strategies is central to the energy consumption reduction strategy of the RFCAFC system [
39]. Indeed, by studying operation strategies using combinations of radiant floors with different ventilation systems, Atienza et al. found that integrating an air conditioning system not only ensured indoor thermal comfort, but also resulted in a greater potential for energy savings. In addition, since weather conditions and indoor heat gain are dynamic and have a large impact on the performance of radiant cooling systems, an effective operation strategy is especially important [
40,
41].
Currently, RFC systems are not widely used in residential buildings and small offices without central air conditioning because of the high risk of condensation, slow response time, difficulty in controlling multiple zones, and insufficient floor cooling capacity due to intermittent use within high humidity environments [
41,
42,
43,
44,
45,
46,
47]. Moreover, the existing field experiments on the operation strategies of combined radiant floor and fan coil cooling systems have been based on manual adjustments and have not implemented automated operation strategies. This means that RFC systems have been difficult to integrate into the automated systems of buildings to achieve efficient smart building functions. Based on the above problems, we built a RFCAFC automatic operation system and analyzed the impacts of different operating strategies on building energy consumption and thermal comfort in a high humidity environment. The RFCAFC automatic operation system was installed in Jinan, China. During the experiment, relevant parameters of the combined system were monitored and the operating characteristics and cooling capacity of the combined system under different outdoor meteorological conditions were analyzed. This study provides a strong reference and basis for further study of the operating characteristics of combined systems under high humidity environments and for further promotion of the combined system in small scale residential applications.
2. Experimental Description
2.1. Introduction of the Laboratory
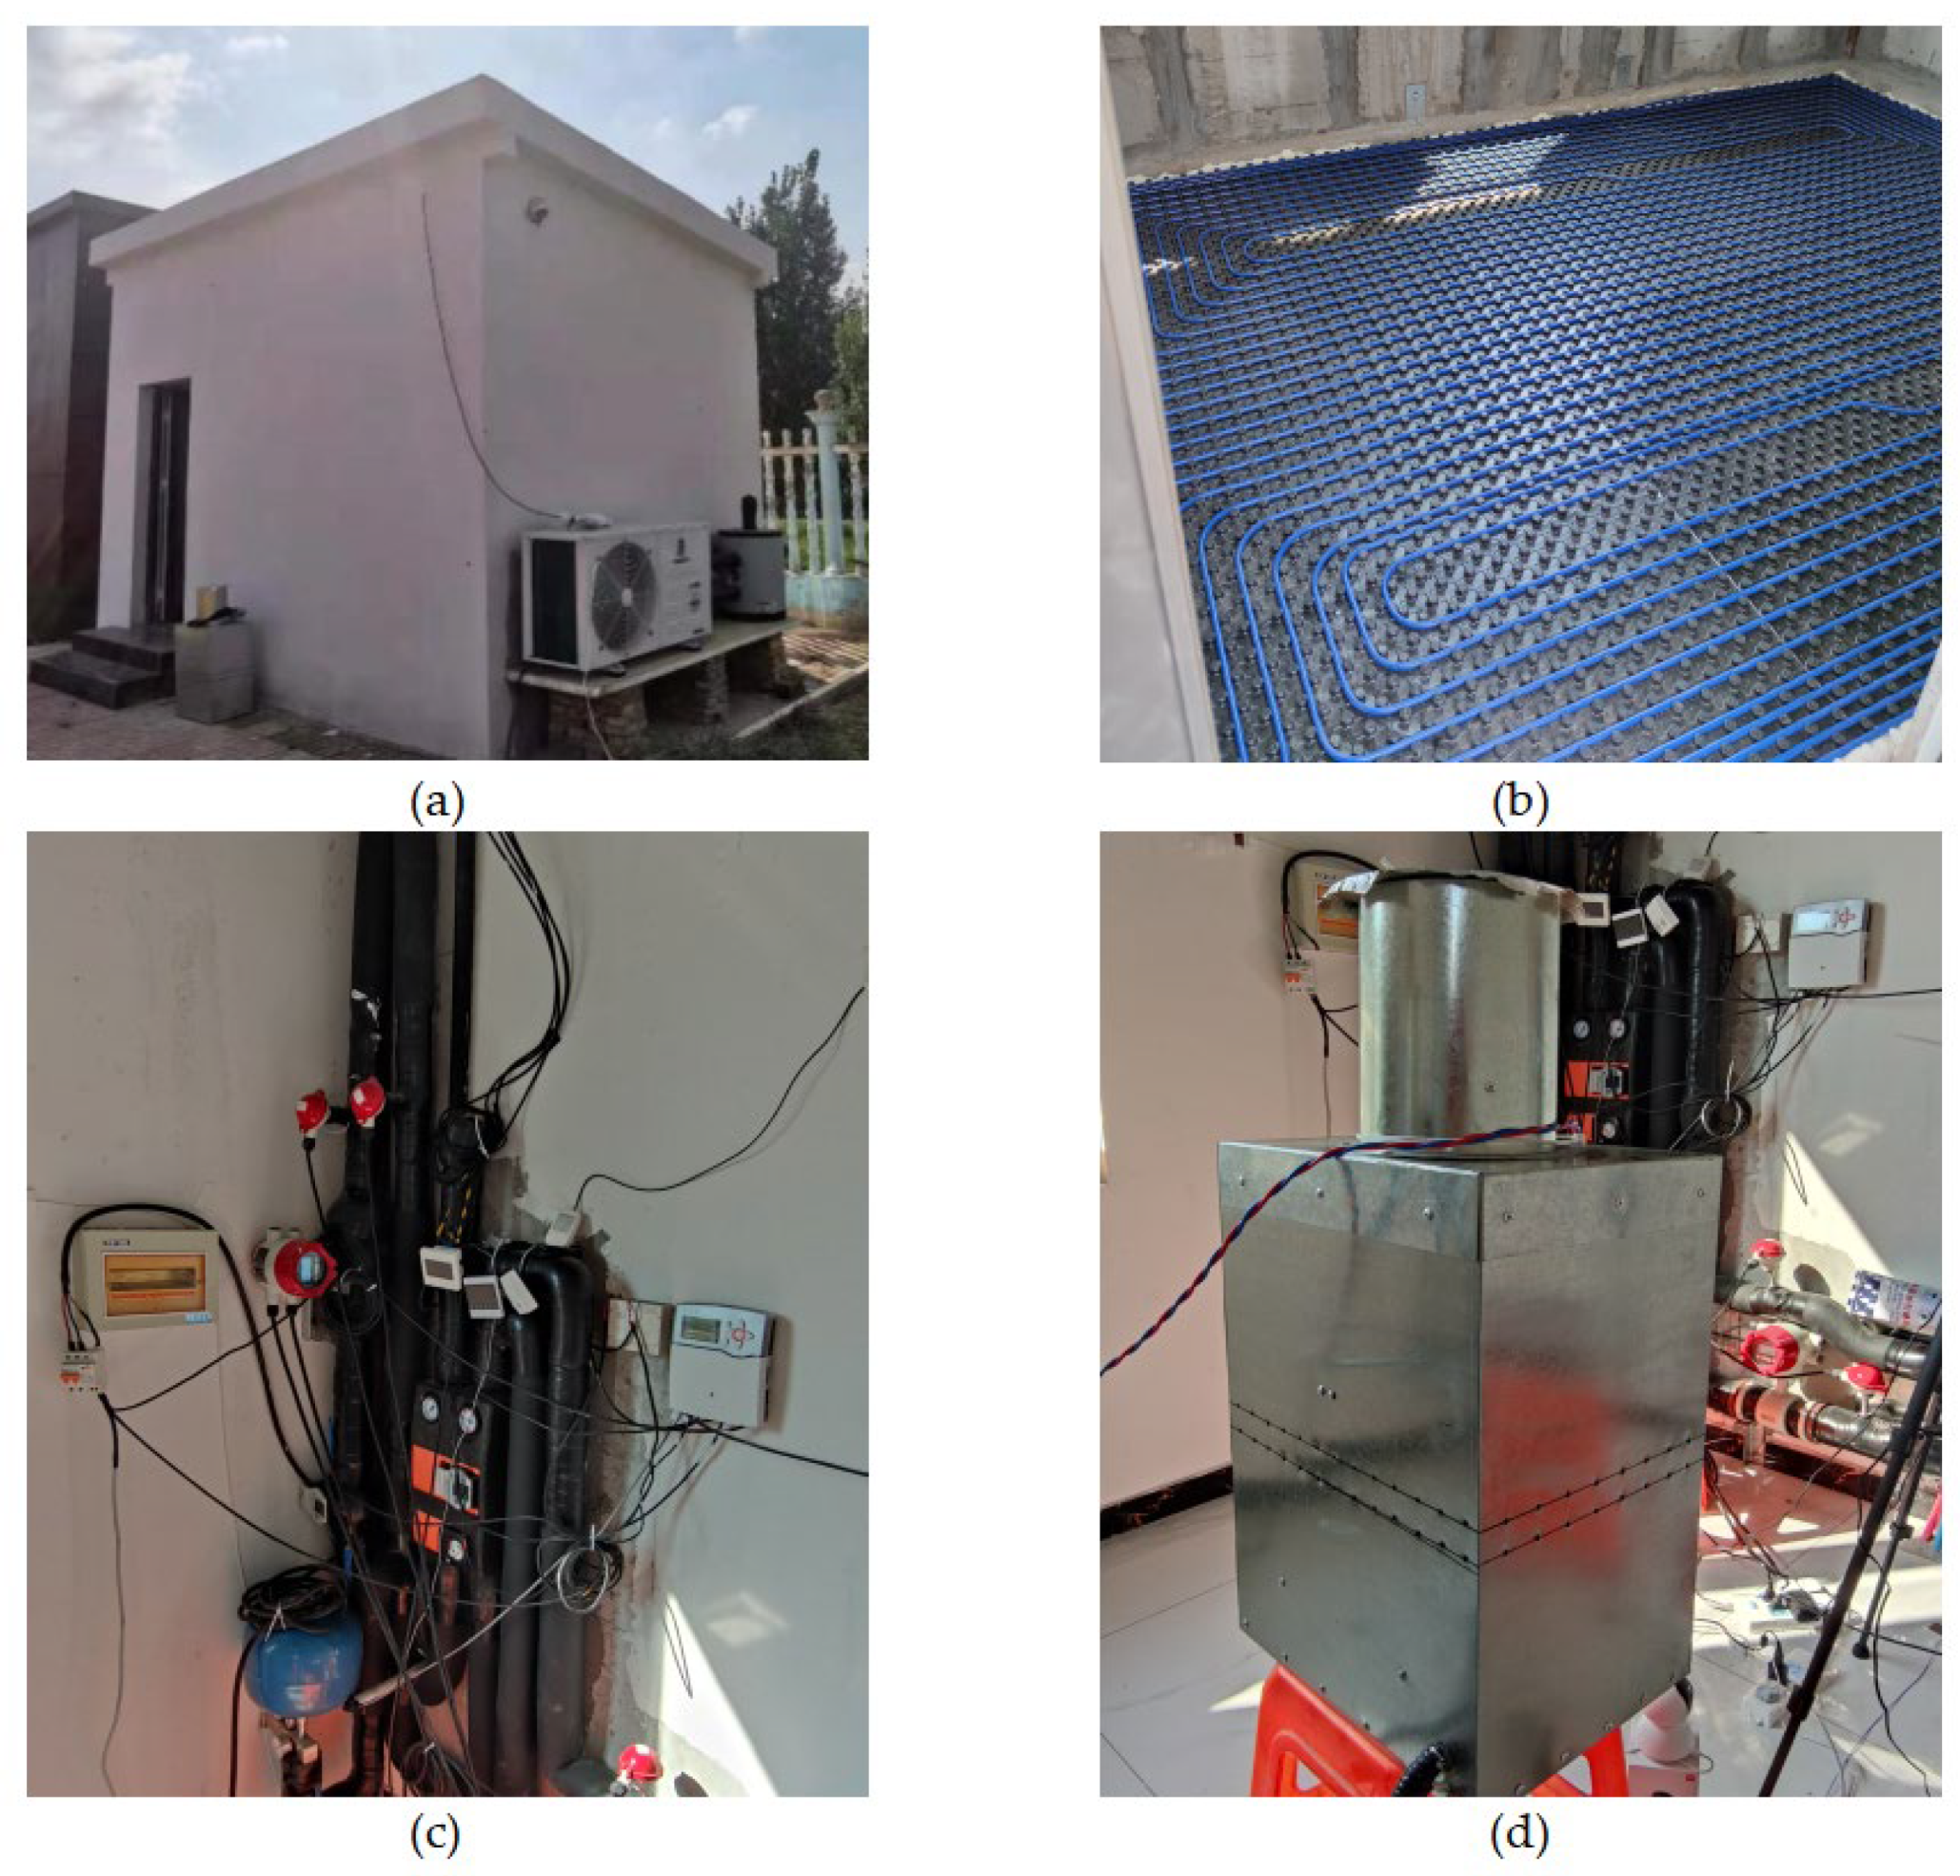
The experimental laboratory was located in Jinan, China, which is in a hot summer and cold winter climate zone. The enclosed structure adopted aerated concrete integrated composite wall panels, which have low thermal conductivity and good thermal stability. The laboratory was a single building with length, width, and height of 4.00 m, 2.80 m, and 3.00 m, respectively, and a total construction area of 11.2 m
2. The exterior walls were all 250 mm aerated concrete integrated composite wall panels, and the heat transfer coefficient of the exterior walls was 0.536 W/(m
2·K). The south facing exterior wall had an aluminum framed double-glazed exterior window with an area of 2.4 m
2 and a heat transfer coefficient of 2.40 W/(m
2·K). The floor plan of the laboratory and building is shown in
Figure 1.
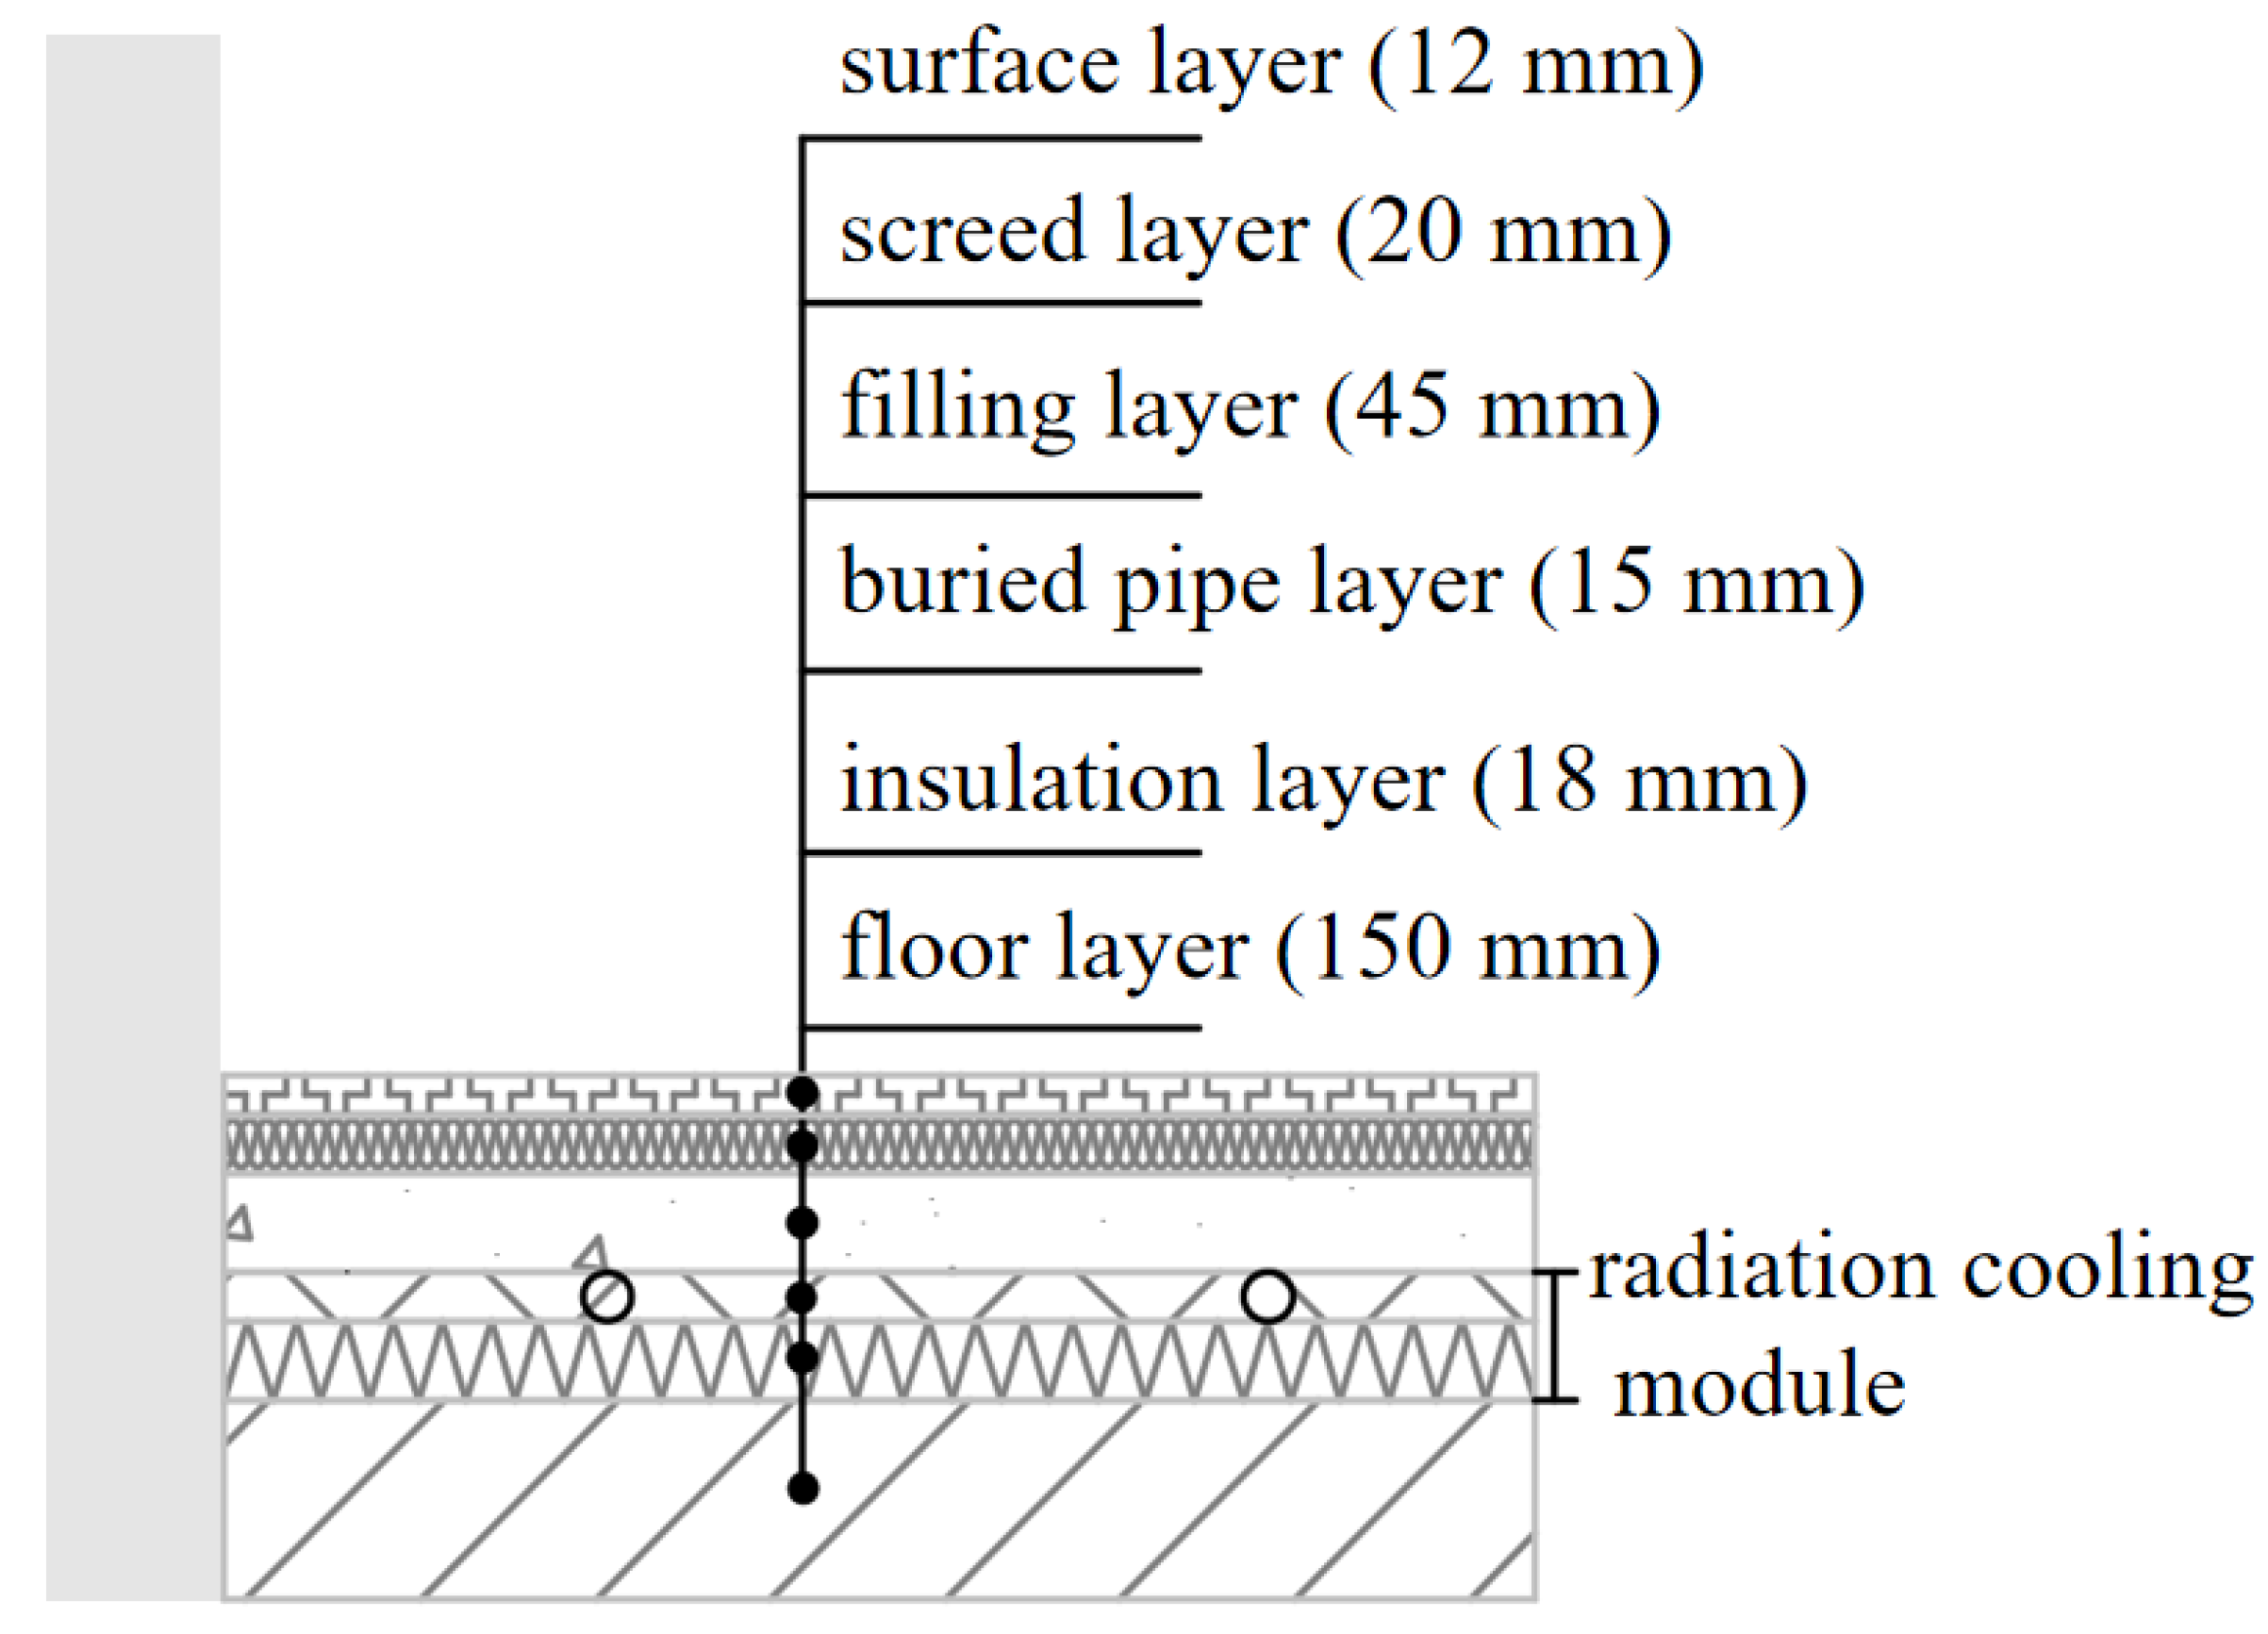
The radiant floor coil adopted the double circuit dry buried pipe arrangement. The floor radiant coil pipe diameter was 12 mm, the pipe wall thickness was 2 mm, the coil spacing was 60 mm, and the pipe was PE-RT pipe. The radiant floor surface decoration material for the tile surface and radiant floor structure is shown in
Figure 2. Its basic structure from the bottom to top was made of the following parts: floor layer, insulation layer, buried pipe layer, soil layer, screed layer and surface layer, where the insulation layer and buried pipe layer for integrated processing were combined into a radiation cooling module. The radiant floor thermal parameters are listed in
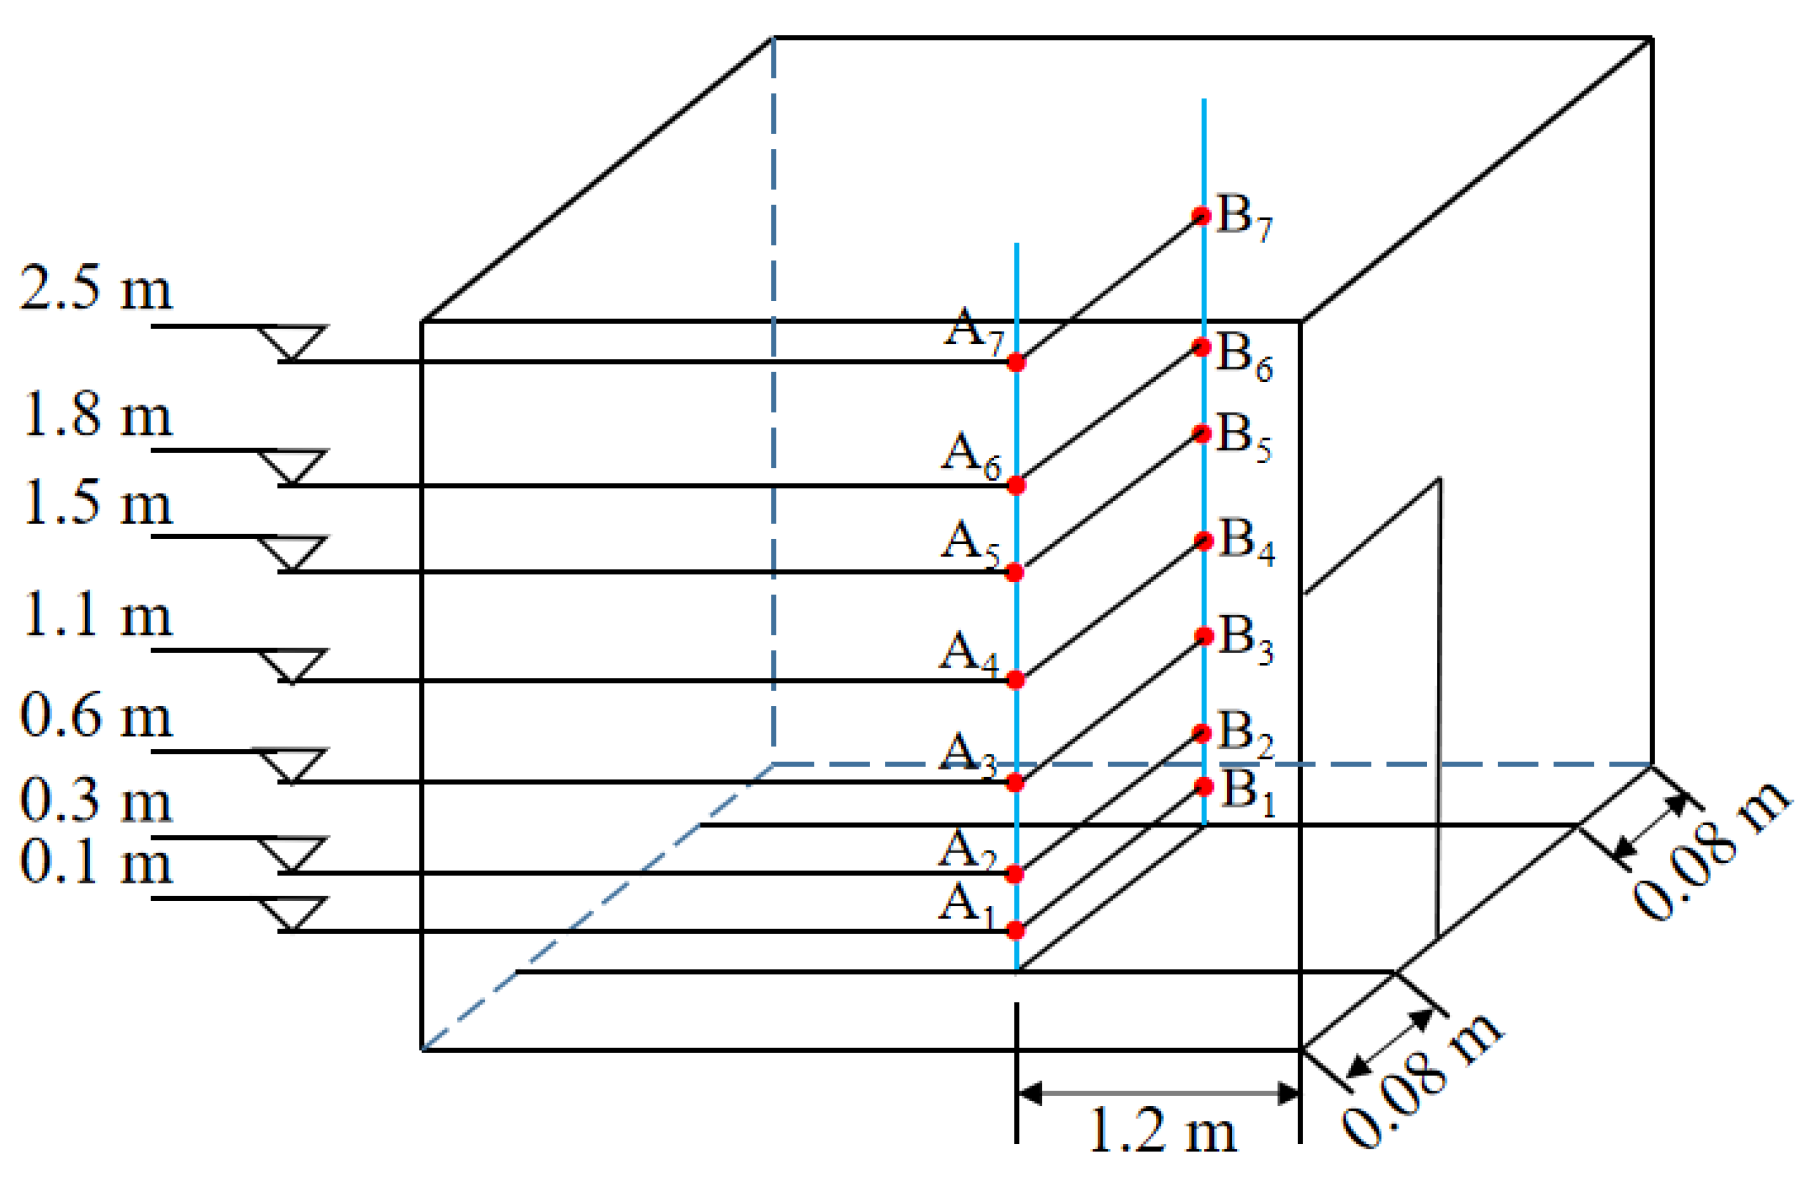
Table 2. Indoor temperature sensors, humidity sensors, and anemometers were installed to measure indoor temperature, humidity, and vertical air temperature difference. The measurement points were arranged as shown in
Figure 3. PT-100 thermal couplings were installed on the interior walls to measure the temperature of each wall’s surface.
2.2. Introduction of the Combined Cooling System
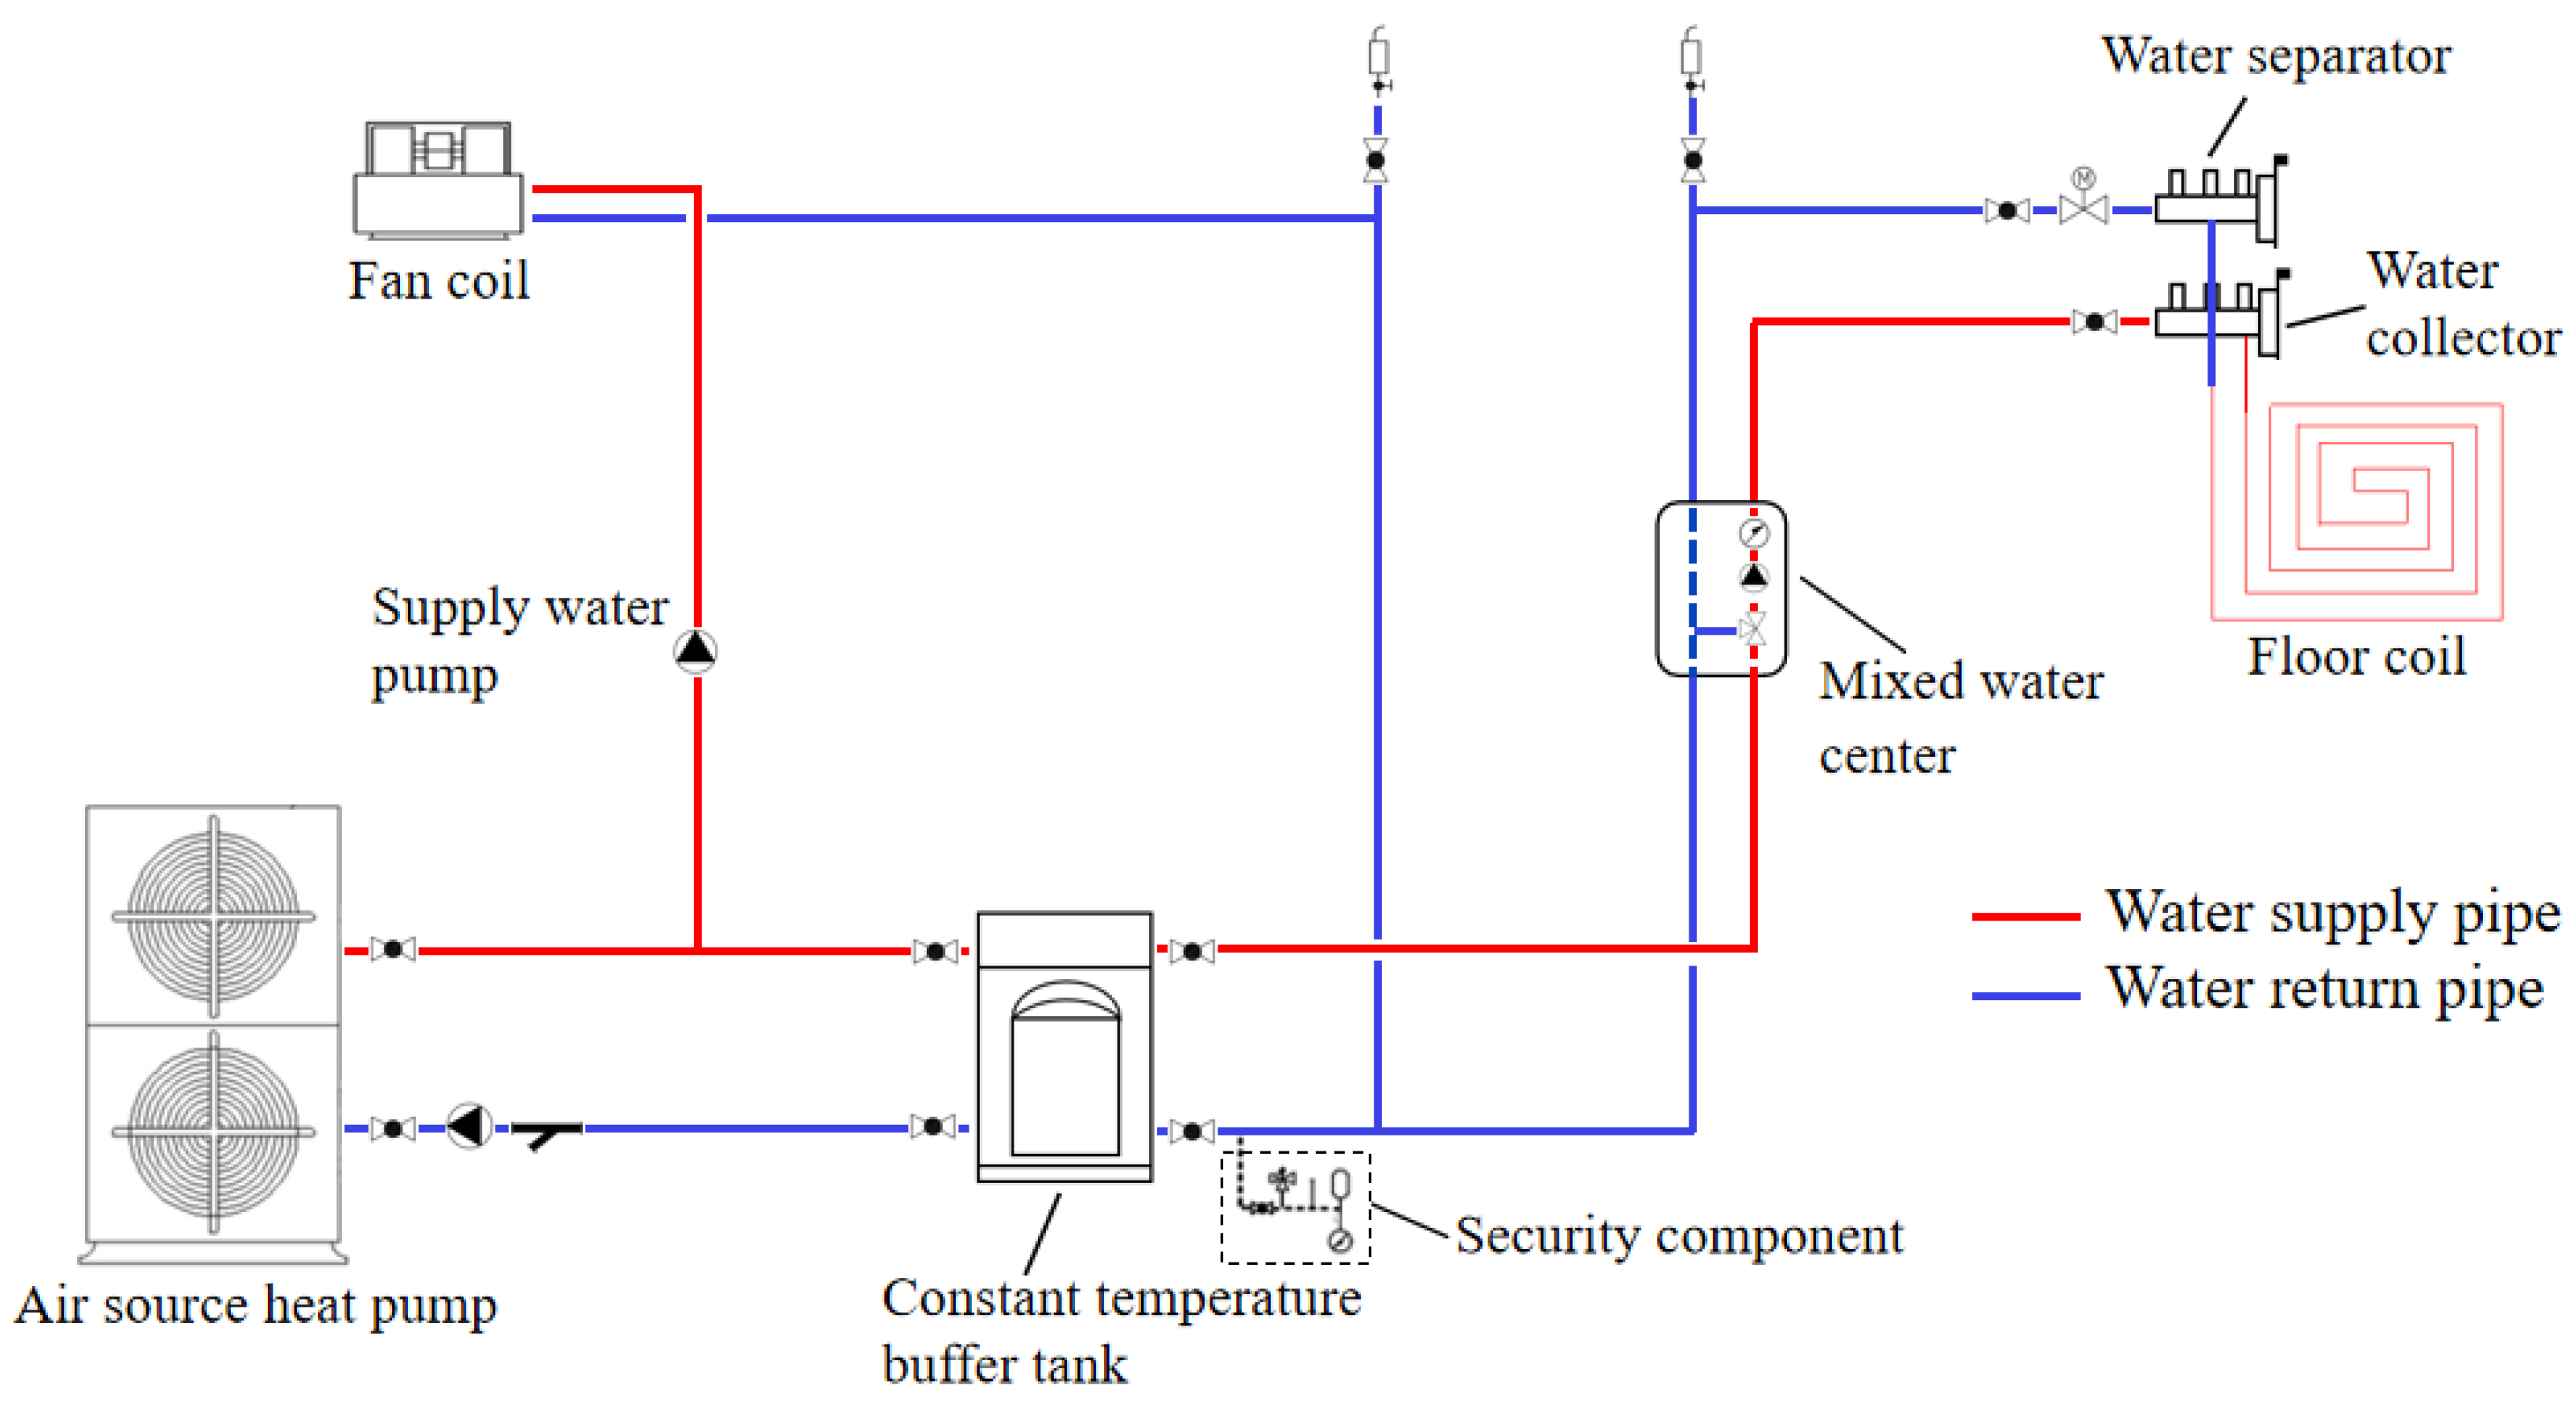
The operating principle of the RFCAFC system is shown in
Figure 4. The RFCAFC system consisted of a cold source, a constant temperature water tank, a primary distribution system, a secondary distribution system (mixer pump), a safety component, and an air conditioning terminal.
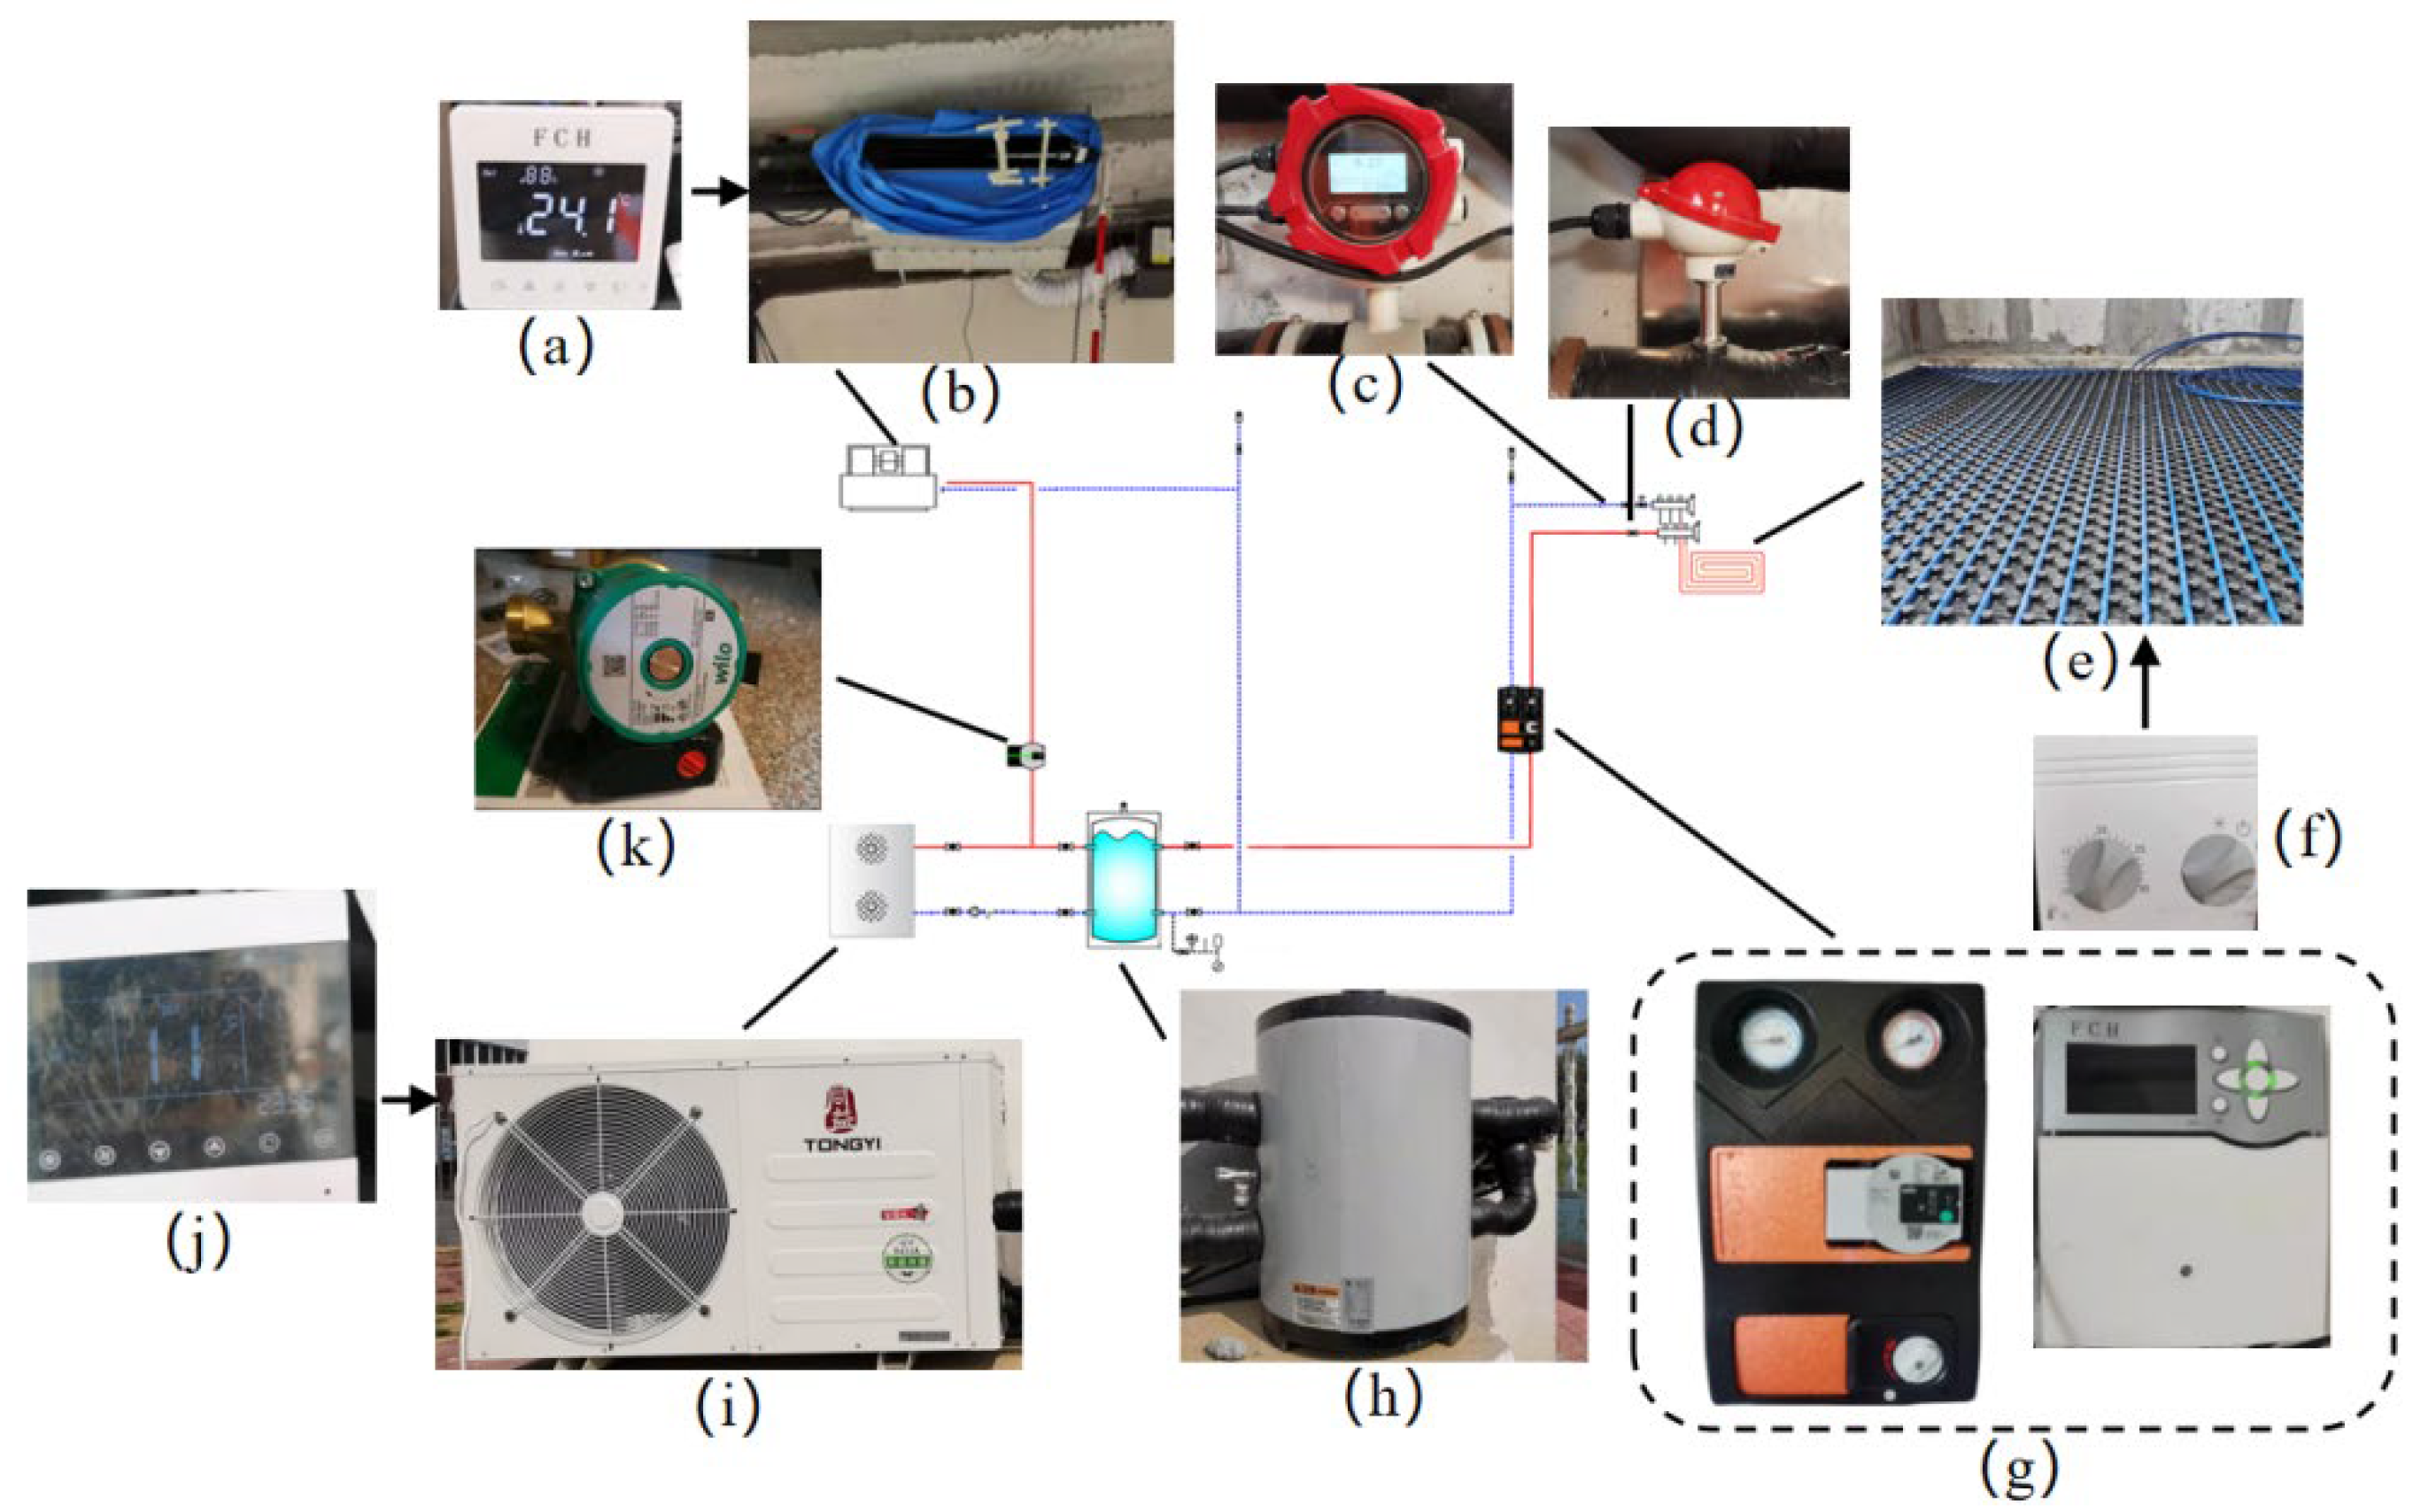
The combined cooling system used a single-phase inverter air source heat pump (KXD80/60EA-V) with a rated cooling capacity of 7.2 KW, an IPLV of 2.81, and a fan coil (FP-51) with a rated cooling capacity of 2.7 kW. To measure the cooling capacity of the combined cooling system, an electromagnetic flow meter (LDG-MIK DN25) and a water temperature sensor (MIKwrn-130) were installed on the supply and return pipes of the fan coil. To measure the energy consumption of the combined cooling system, an intelligent socket (KTBL03LM) was installed on the system power transmission and distribution system to record power consumption. The experimental equipment of the combined cooling system is shown in
Figure 5 and the detailed parameters of the experimental equipment are shown in
Table 3.
In summer, chilled water produced by the air source heat pump first flows through the constant temperature buffer tank where it is brought to the required pressure by the circulating pump to overcome the resistance of the pipeline. The chilled water is sent to the air conditioner, passing through the temperature measuring instrument on the way, through the circulating pipeline made of polyvinyl chloride (PVC) plastic pipes.
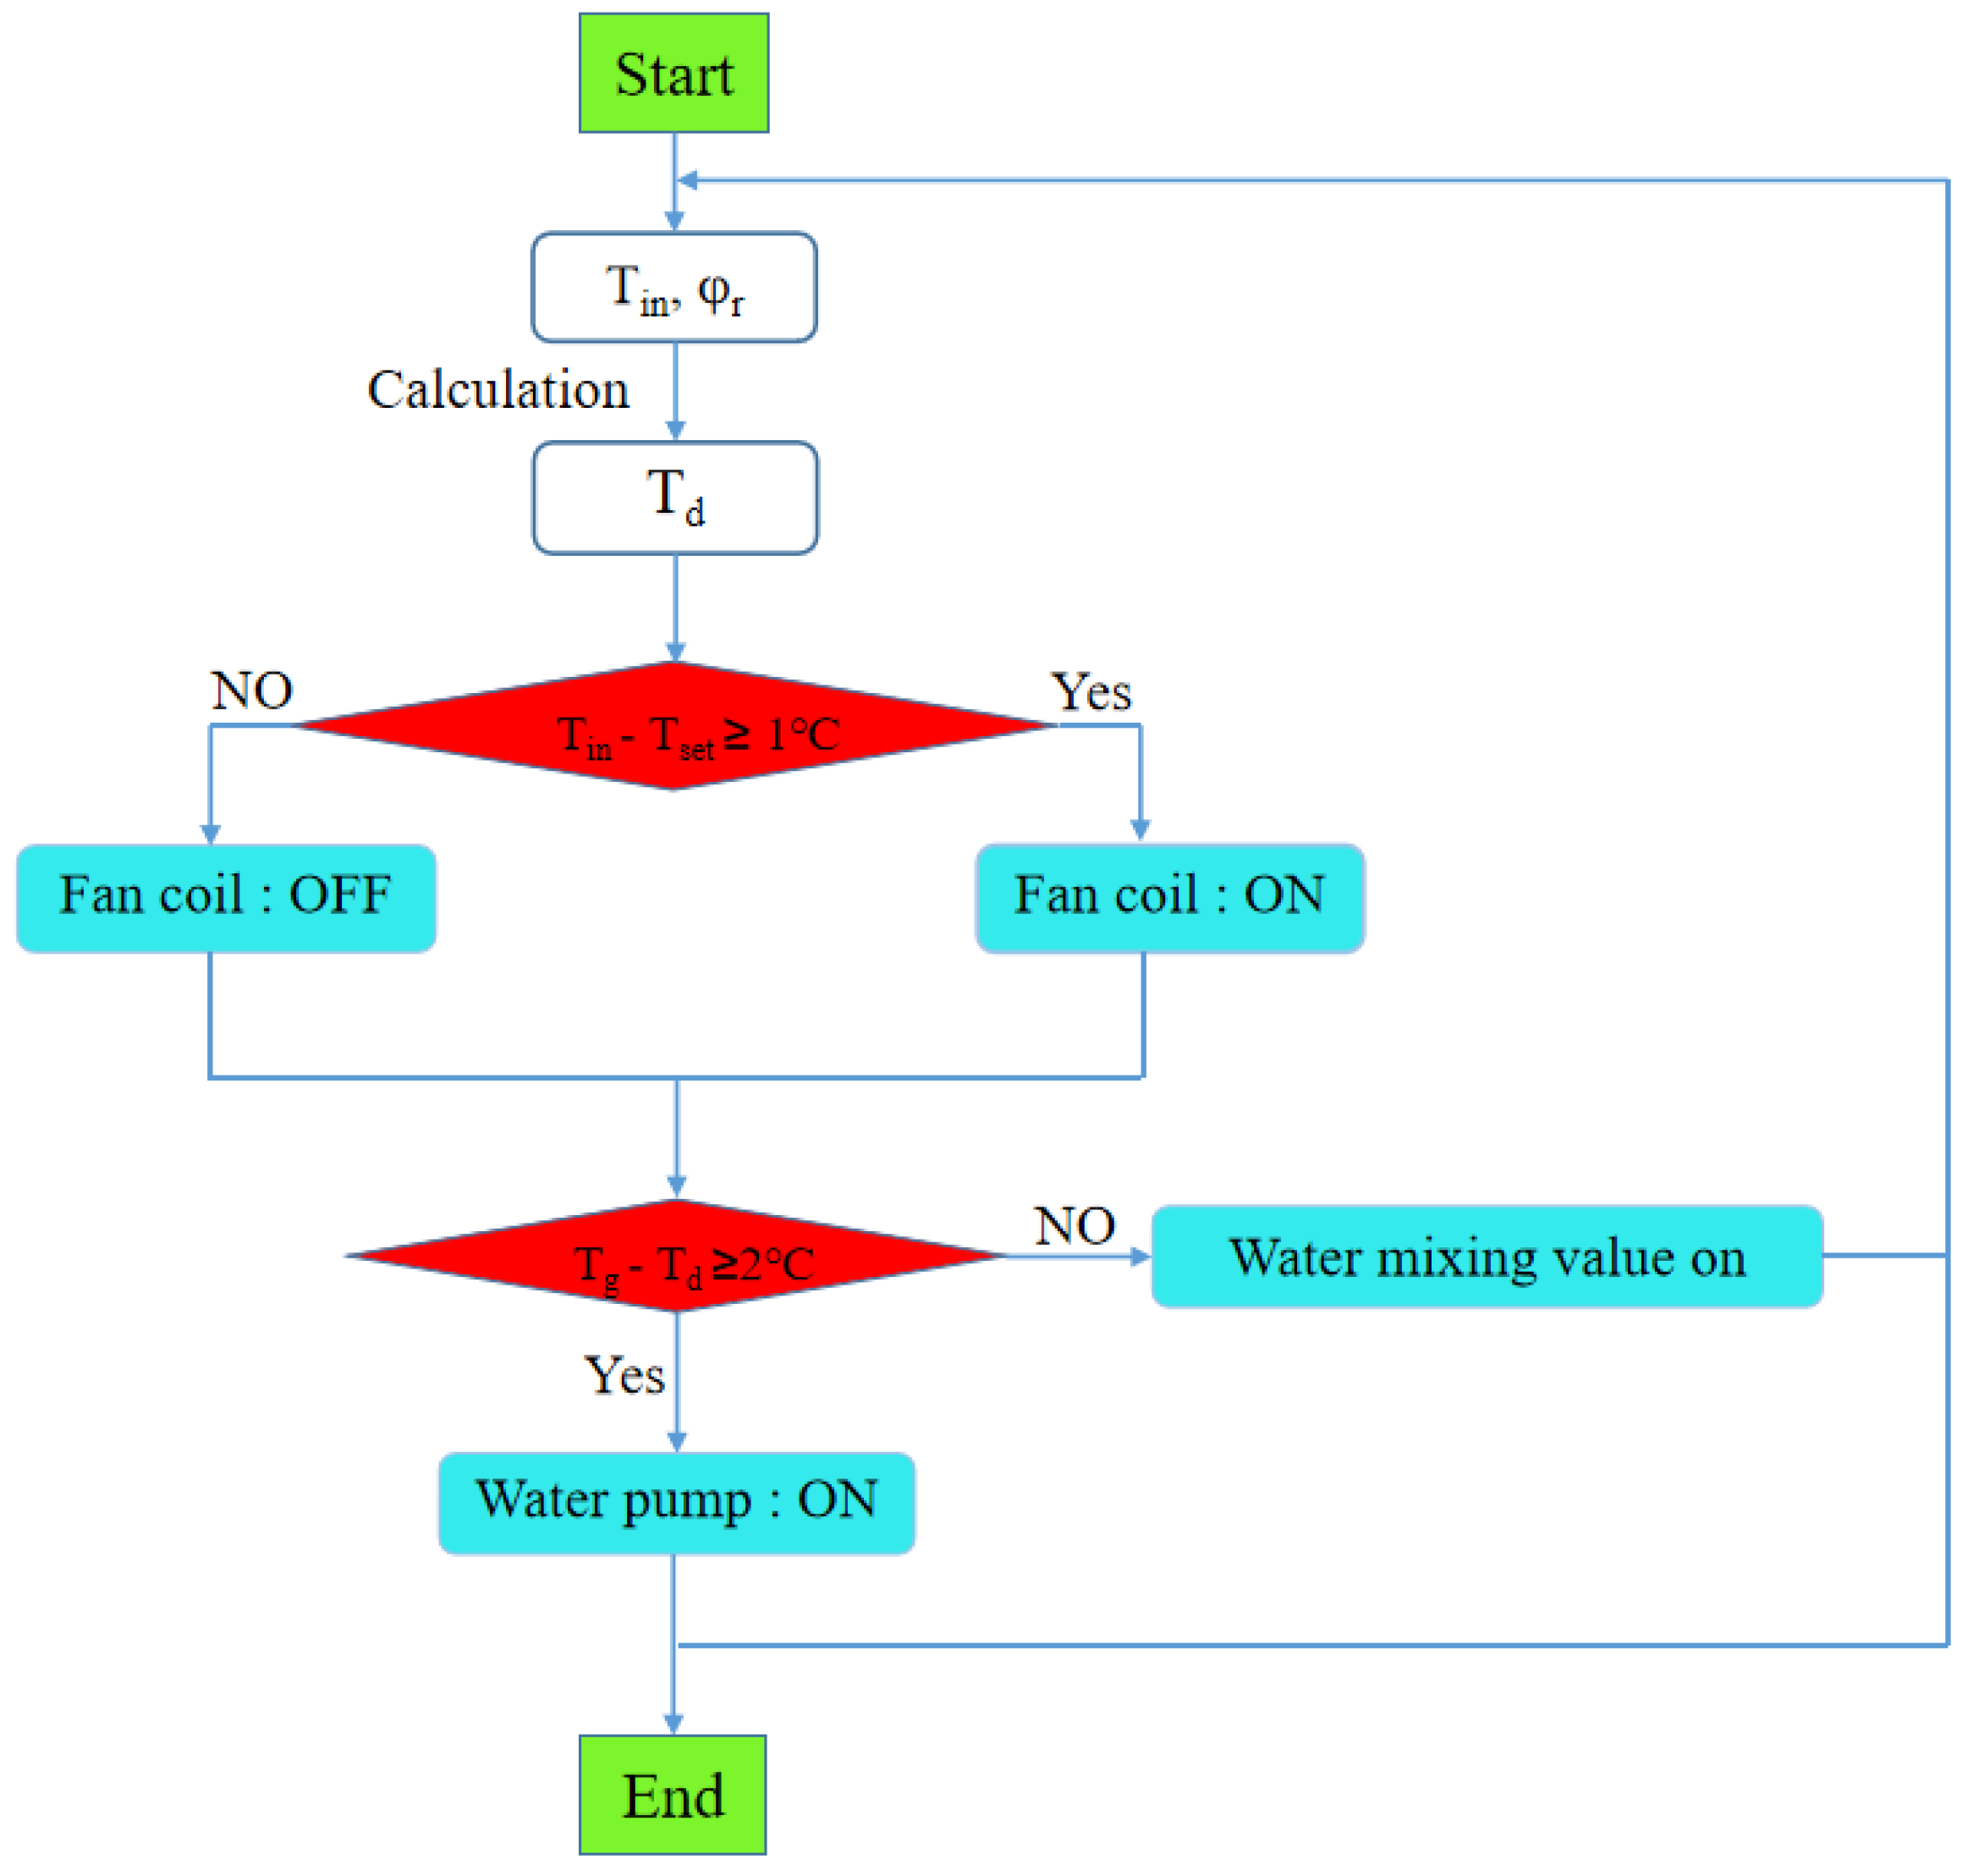
As a radiant floor is more prone to condensation in high a humidity environment, the combined cooling system adopted the operation logic that the floor radiation water supply temperature should be higher than the indoor air dew temperature to prevent condensation. The specific implementation was as follows: The radiant floor water supply temperature always followed the indoor air dew temperature. An indoor dew thermostat collects the indoor air temperature and humidity and transmits the data to the central controller, which calculates the dew temperature based on the indoor temperature and humidity and the built-in enthalpy and humidity graph algorithm, and then adjusts the mixing valve at the mixing pump station to adjust the water temperature so it is higher than the dew point temperature by 2 °C, thus realizing the control logic flow, as shown in
Figure 6.
The operation of the combined cooling system was realized primarily by setting the desired indoor temperature. In this system, when the indoor temperature is lower than the set value, the air source heat pump will run at a low frequency or be stopped, and when the indoor temperature is higher than the set value, the air source heat pump starts to run again. The low temperature chilled water produced during this operation was not only supplied to the radiant floor and fan coil air conditioning, but also stored in a thermostatic buffer tank. When the system needs low temperature chilled water again, it can be taken directly from the constant temperature buffer tank. This avoids frequently starting and stopping the air source heat pump, which prolongs the heat pump’s service life and saves energy.
During the initial operating stage of the combined cooling system, due to the high humidity of the indoor environment, the radiant floor and fan coil are used together to provide cooling. When the fan coil stops running, the radiant floor provides all the cooling for the room.
2.3. Uncertainty Analysis
In order to quantify the accuracy of measurements, an uncertainty analysis of the measured data was carried out based on the general law of uncertainty propagation [
48]. The uncertainty was obtained using the following equations [
49] and the results are listed in
Table 4.
where
ui is the standard uncertainty of the measured parameter;
wi is the accuracy of the device; and
UR is the standard uncertainty of the parameter determined by other measured parameters.
3. Experimental Cases and Evaluation Indices
3.1. Experimental Cases
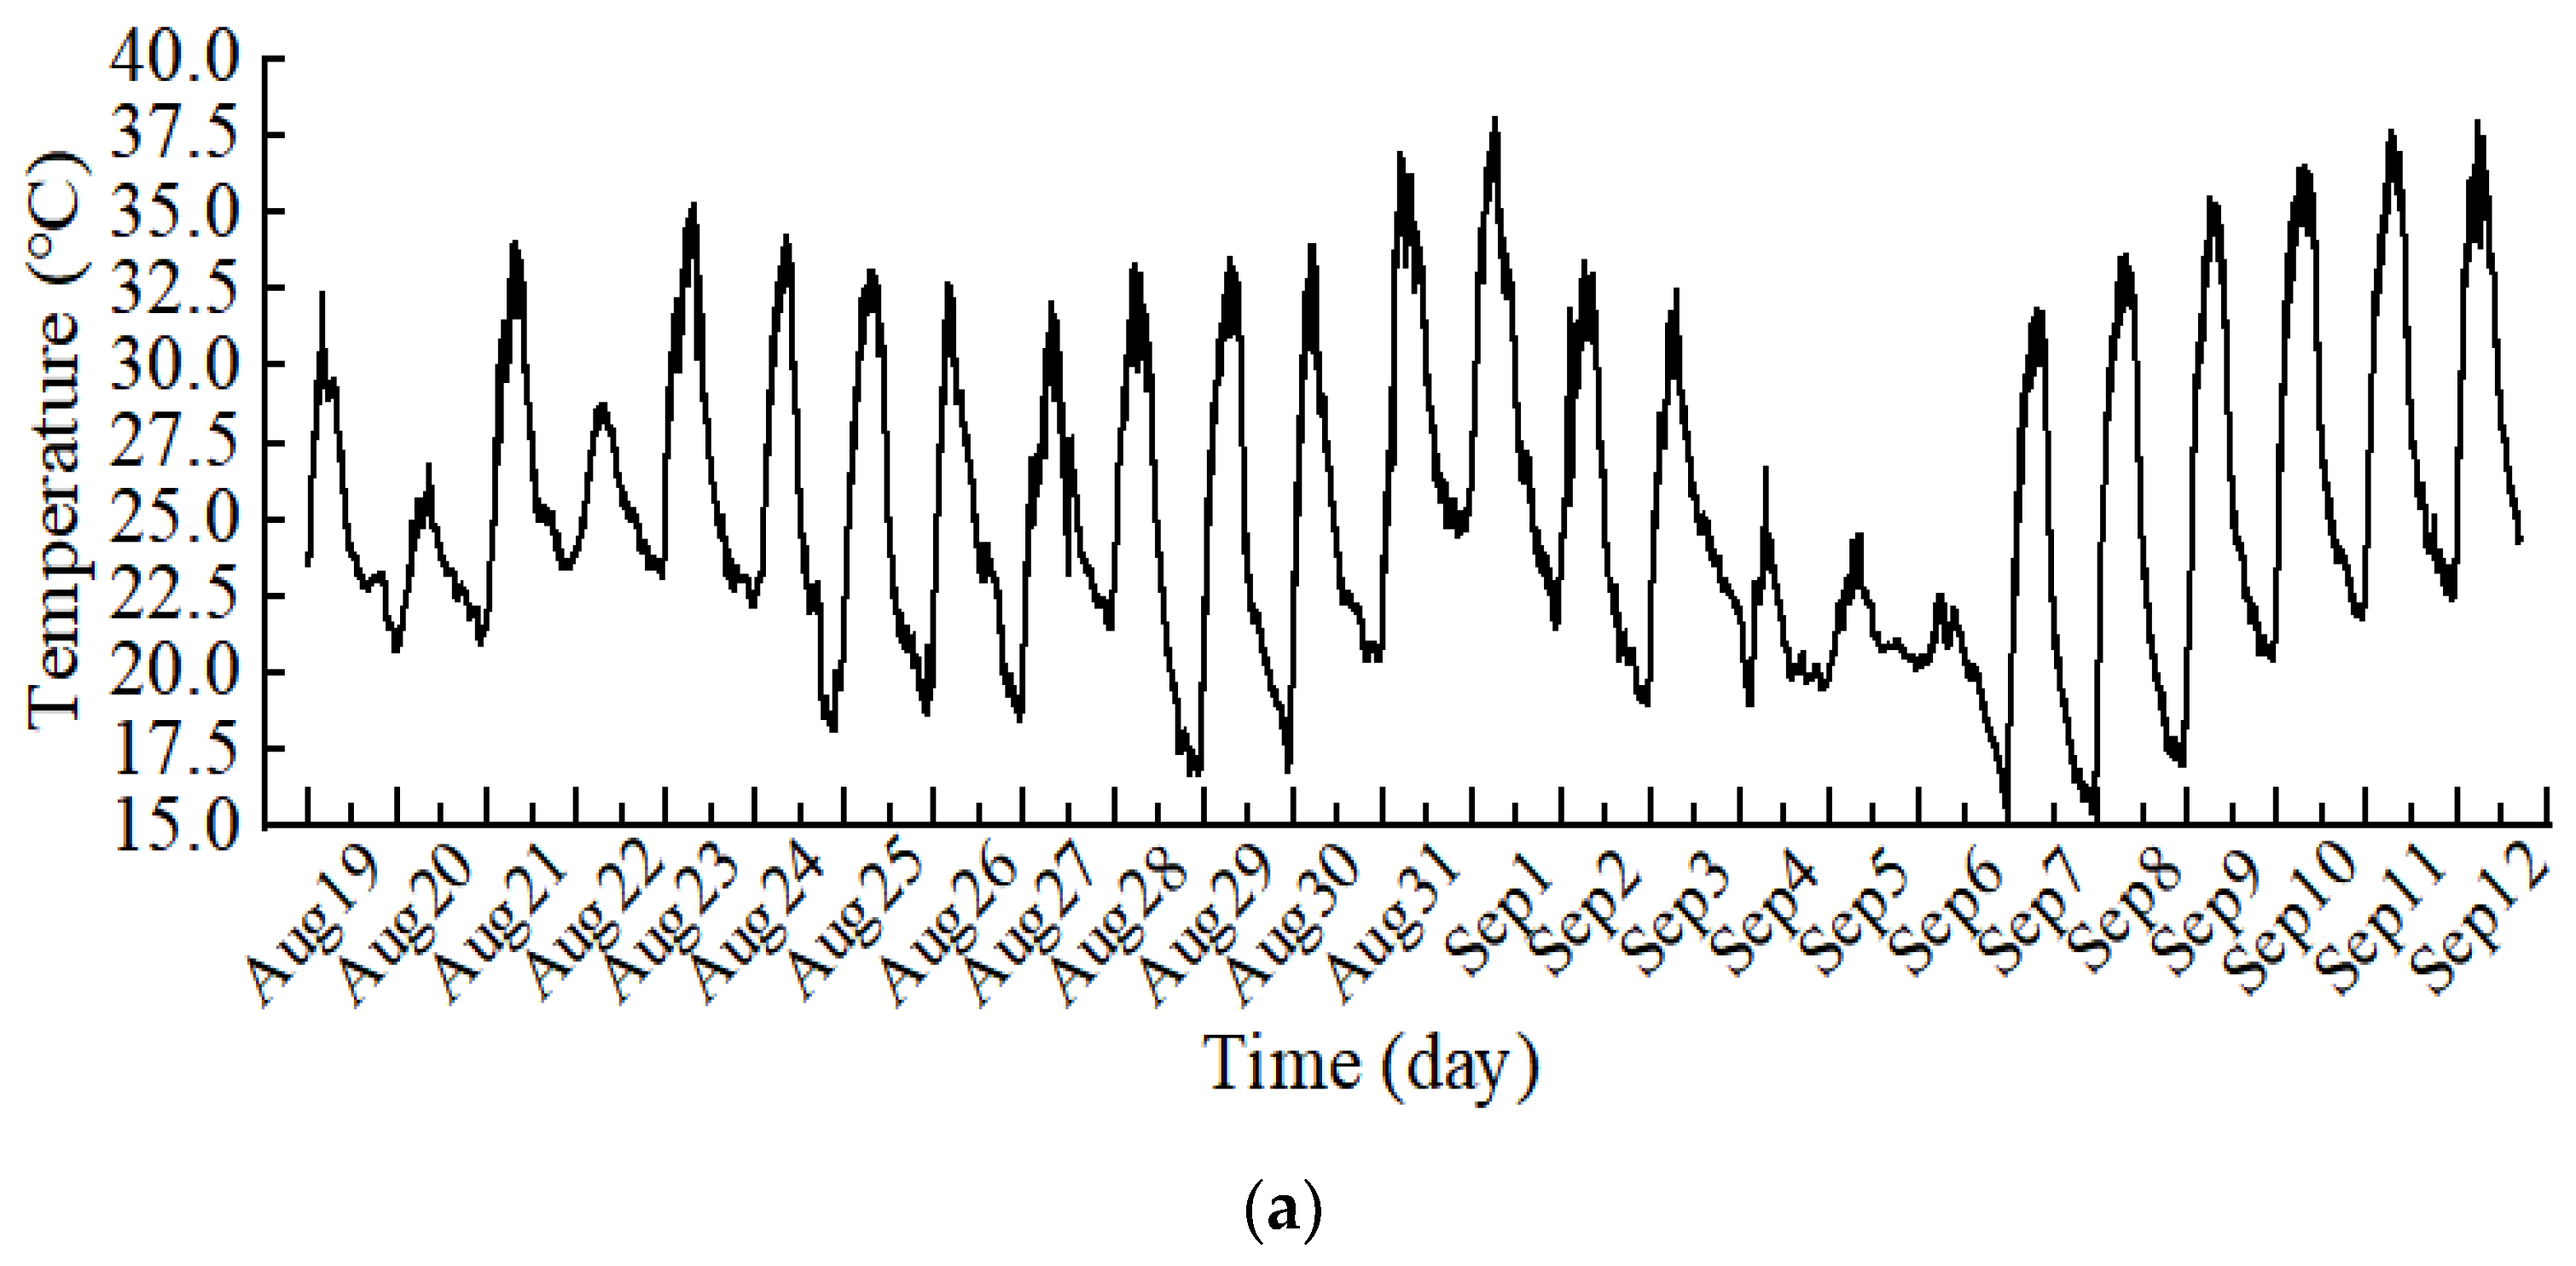
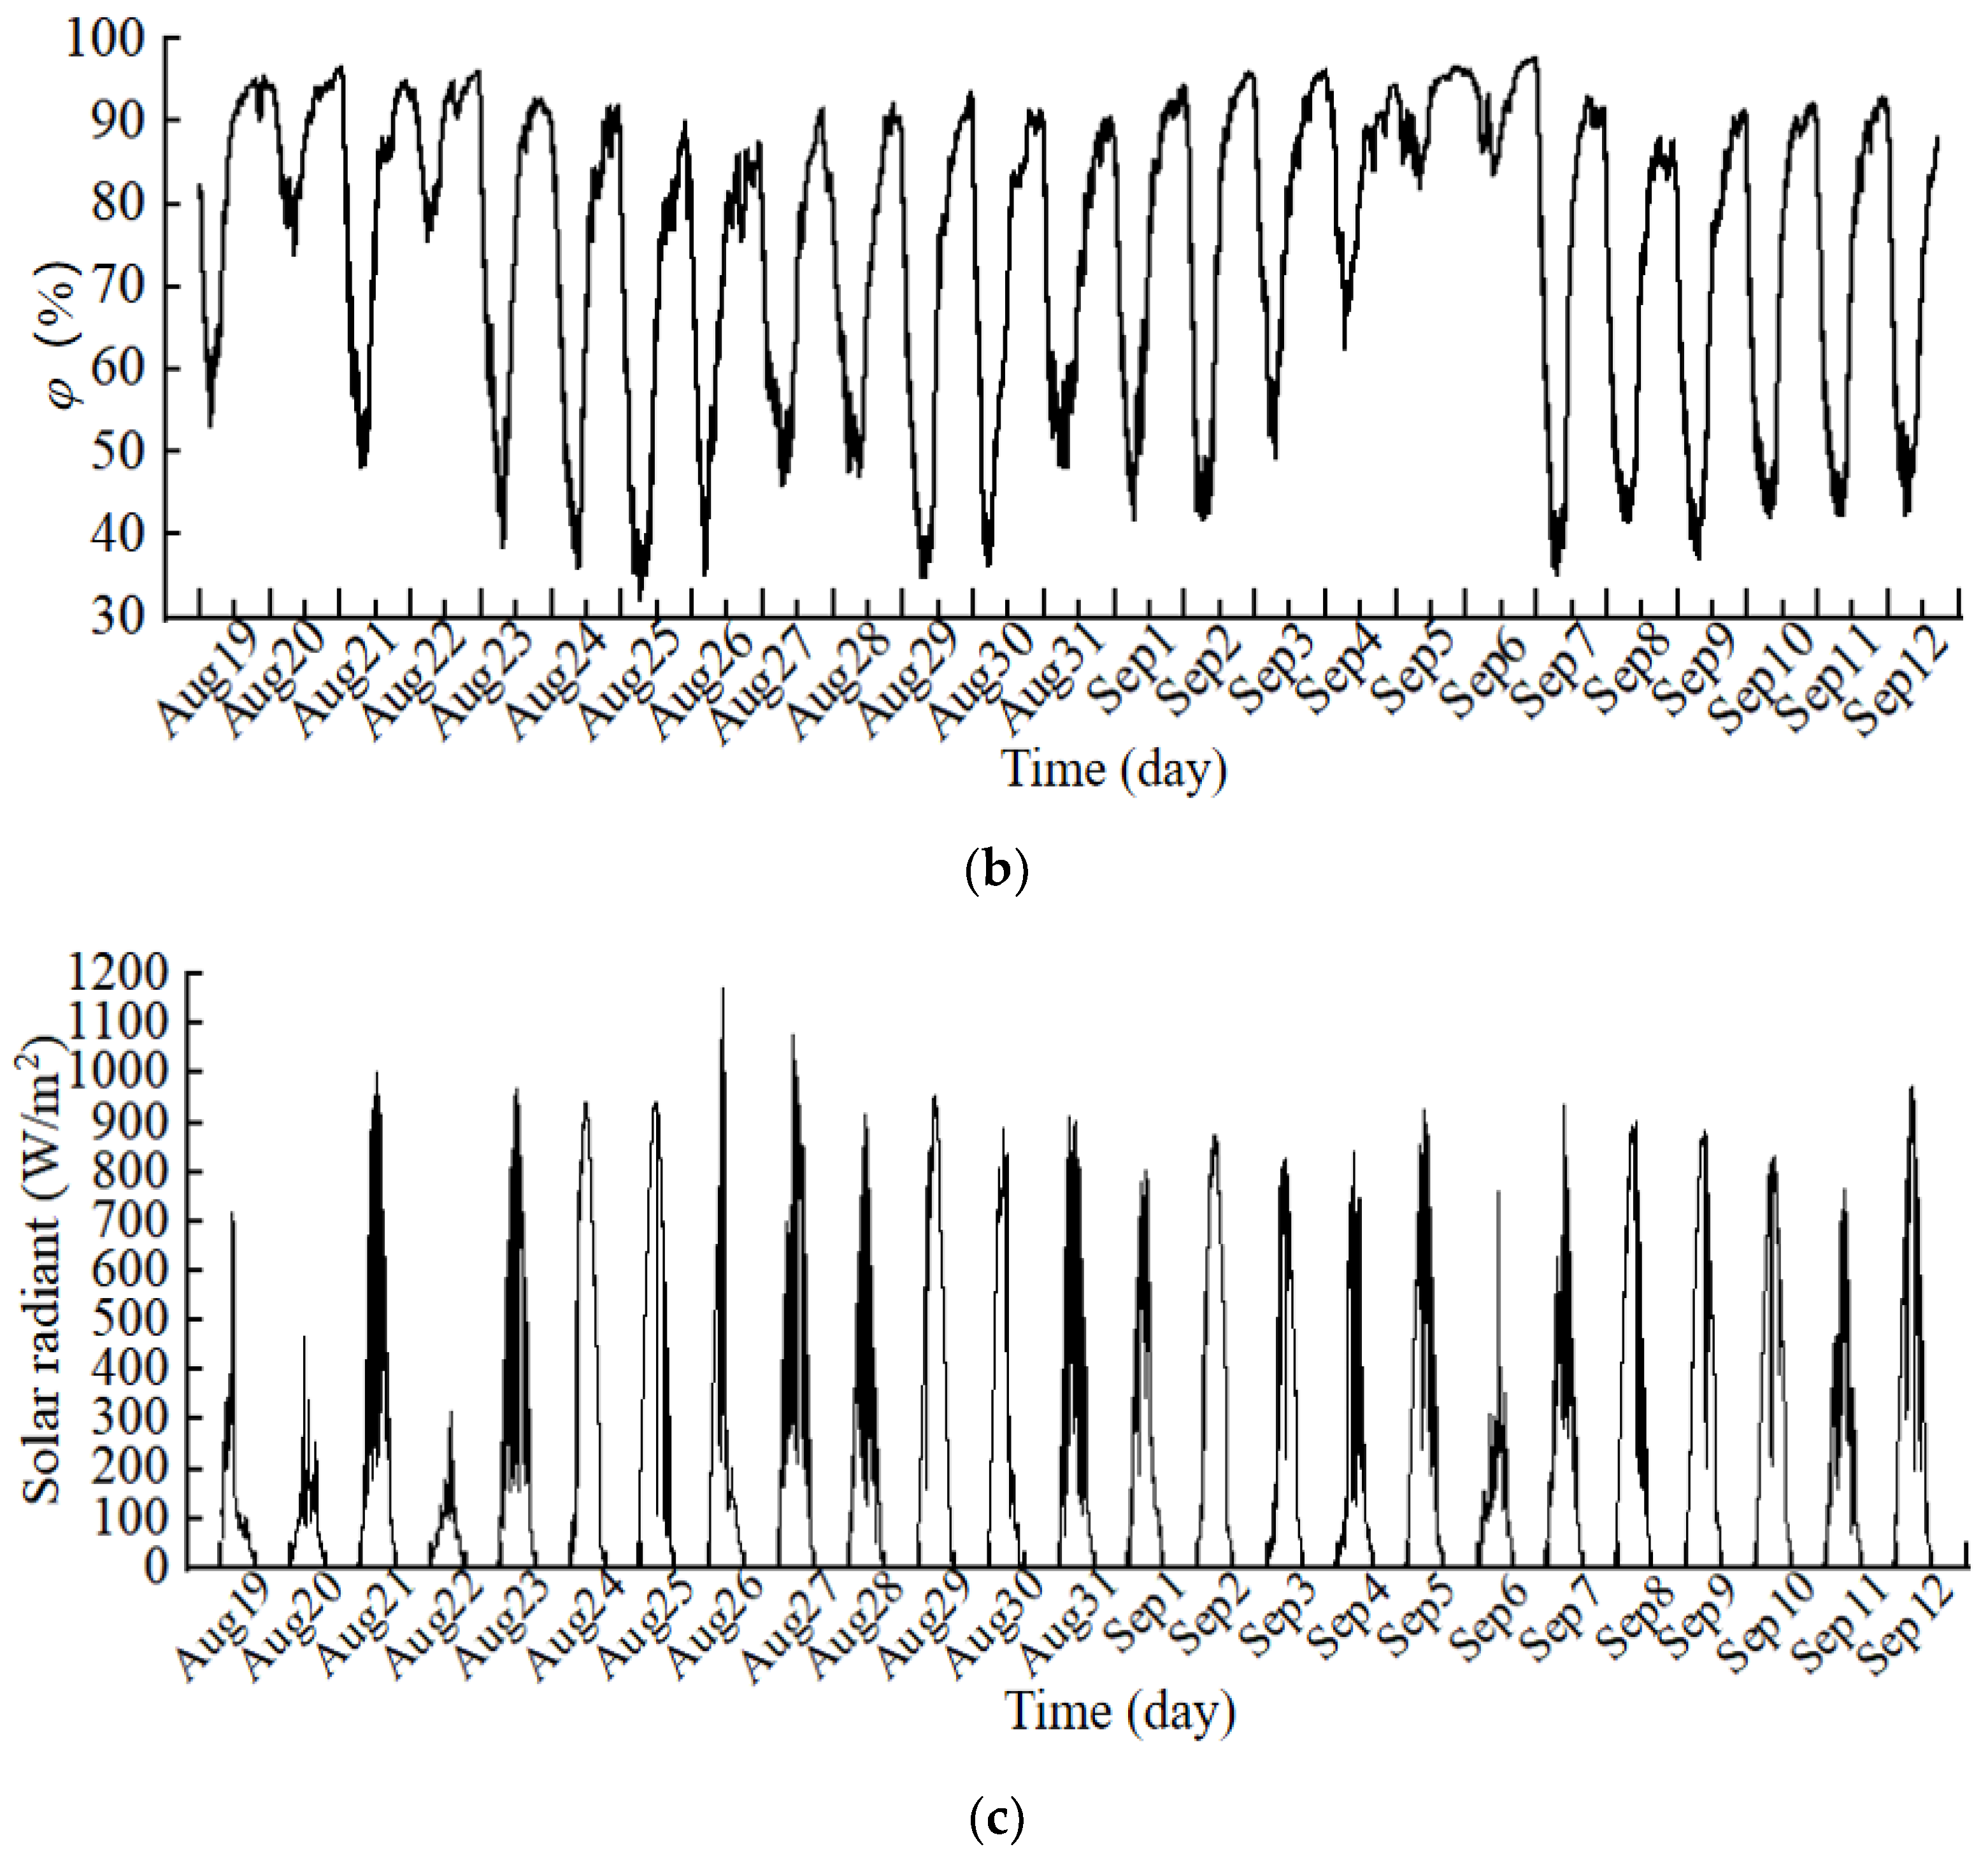
These experiments were conducted in August and September, which are representative of the summer cooling season in Jinan, China. The outdoor temperature varied from 26 °C to 40 °C and the outdoor humidity varied from 35% to 94% during the test period, as shown in
Figure 7. The outdoor weather was classified as overcast, sunny, or cloudy, which could be directly related to changes in outdoor total horizontal solar radiation. These climate characteristics provide conditions in which intermittent operation of the combined cooling system was required. During the experiment, the room temperature was set at 25 °C and the fan coil was set at the lowest operating air speed. During the operating time, two heated dummies (123.6 W and 137.5 W) were used to simulate indoor heat sources that approximated human bodies.
According to the temperature, humidity, and outdoor meteorological conditions, the environmental conditions were classified into three groups, as shown in
Table 5. When the outdoor temperature and humidity ranges were 21–29 °C and 74–94%, respectively, the conditions were referred to as low temperature and high humidity (LH). When the outdoor temperature and humidity ranges were 24–38 °C and 42–90%, respectively, the weather conditions were referred to as high temperature and low humidity (HL). When the outdoor temperature and humidity ranges were 22–33 °C and 50–88%, respectively, the weather conditions were referred to as medium temperature and medium humidity (MM).
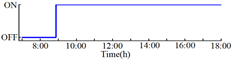
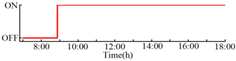
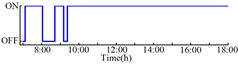
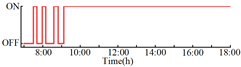
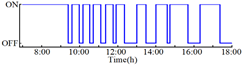
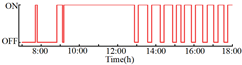
Different outdoor weather conditions required different start-stop strategies in the RFCAFC system. The start-stop conditions of the combined cooling system during the experiment are shown in
Table 6.
3.2. Evaluation Indices
3.2.1. Radiant Floor Surface Uniformity Temperature Coefficient
The average temperature of the surface of the radiant floor directly affects the heat exchange at the surface of radiant floor. This study used the
S value to express the cooling capacity of the radiant floor. The closer the average temperature of the radiant floor surface to the lowest temperature of the radiant floor surface, the closer
S is to 1. The better the
S, the greater the cooling capacity of the radiant floor surface supply. The
S calculation method is shown in Equation (3).
where
Ts,max is the maximum radiant floor surface temperature, °C;
Ts,min is the minimum radiant floor surface temperature, °C;
Tg is the radiant floor water supply temperature, °C; and
Th is the radiant floor return water temperature, °C.
3.2.2. Time Constant
The time constant (
τ) is used as a time scale to measure the time required from the start of the combined cooling system for the radiant floor to reach a relatively stable state.
τ63 is defined as the time required for the temperature to change from the initial value
Ts to
Te (approximately 63.2% of the total desired change).
τ63 reflects the rapidity of the radiant floor surface temperature change.
τ95 is defined as the time required for the radiant floor surface temperature to reach approximately 95% of the desired change.
τ95 is a measure of the time required for the surface temperature of the radiant floor to reach a relatively stable state from the initial state. According to the physical meaning of
τ, the
τ calculation method is shown in Equations (4) and (5).
where
τ63 is the time required for the radiant floor surface temperature to reach 63.2% of the total change, h;
τ95 is the time required for the radiant floor surface temperature to reach approximately 95% of the total desired change, h;
Tim is the initial radiant floor surface temperature, °C; and
Trs is the desired radiant floor surface temperature, °C.
3.2.3. Room Temperature Fluctuation
The sample standard deviation (
S) was introduced in this experiment to evaluate the stability of the indoor thermal environment and characterize the degree of dispersion of the indoor temperature. Larger sample standard deviations indicate a greater degree of fluctuation in indoor temperature during the test period, which would indicate poor stability in the indoor thermal environment. The
s calculation method is shown in Equation (6).
where
S is the standard deviation of indoor temperature;
Ti is the indoor temperature at the
ith hour after the start of the combined system, °C; and
Tage is the average indoor temperature during the test period, °C.
3.2.4. Thermal Comfort
The international standard ISO7730 uses the predicted mean vote (PMV) and predicted percentage dissatisfaction (PPD) to describe and assess the comfort of an indoor thermal environment. PMV represents the sensations experience by the majority of people in the same environment and can be used to evaluate the comfort or discomfort of a thermal environment. However, as a mean value, the PMV metric ignores individual variability, which means that it does not represent the thermal sensations of all people within a thermal environment. Therefore, researchers have proposed the PPD index which uses probability analysis to indicate the percentage of the population dissatisfied with a thermal environment. The recommended PMV value range in the international standard ISO7730 is −0.5 to +0.5, and the recommended value of PPD is ≤10%. The PMV calculation method is shown in Equation (7) and the PMV quantitative index is shown in
Table 7.
where
M is the human energy metabolic rate, W/m
2;
W is the mechanical work done by the human body, W/m
2;
Pa is the partial pressure of water vapor around the human body, kPa;
fcl is the garment area coefficient;
tcl is the temperature of the outer surface of the garment, °C;
tage is the average radiation temperature, °C;
hr is the convective heat transfer coefficient, W/(m
2·K); and
ta is the air temperature around the human body, °C.
3.2.5. System Cooling Capacity
In principle, when a radiant floor is used for summer cooling, it needs to be combined with an air supply system. However, most existing studies on the cooling capacity of RFC systems were based on experimental benches without air supply systems, which does not consider the influence of different air supply forms on the cooling capacity of a radiant floor, and also ignores the influence of air supply on the convective heat exchange of the radiant floor. The introduction of the air supply system not only affects the convective heat exchange between the surface of the radiant floor and the room air, but also changes the thermal environment condition of the room, which directly influences the RFC capacity.
The cooling capacity and operation status of the combined cooling system was evaluated by calculating the heat load carried at different air conditioning terminals. The operation of the combined cooling system at each stage of the day was analyzed based on the heat load capacities of different system components. The cooling capacity of the RFCAFC system can be calculated according to Equations (8) and (9).
where
QR is the RFC capacity, W;
QF is the fan coil cooling capacity, W; c
pis the specific heat at constant pressure, J/(kg·°C);
m is the mass flow rate per unit area of circulating duct, kg/s;
Gn is the fan coil air supply volume, kg/s;
h2 is the return air outlet enthalpy, kJ/(kg·K); and
h1 is the enthalpy at the supply air outlet, kJ/(kg·K).
3.2.6. System Operation Status and Energy Consumption
The
EERh, a measure of cooling capacity per unit power, was used to evaluate the energy efficiency of the combined cooling system during operation. The greater the
EERh, the better the energy conversion efficiency of the RFCAFC system. The
EERh of the combined system is calculated according to Equation (10).
where
EERh is the hourly cooling performance coefficient;
Q is the cooling capacity, W; and
Eh is the system energy consumption, kWh.
4. Results
Experimental data under similar outdoor meteorological conditions were grouped to assess the different operating strategies for the combined radiant floor and fan coil cooling system in high humidity environments. The variations in indoor temperature (Tin), radiant floor surface temperature (Tf), and PMV-PPD values over time differed among different operation strategies and different outdoor meteorological conditions. The operational status and energy consumption of the combined cooling system under different operation strategies were analyzed using the EERh and power consumption of the system. The analysis verified that the RFCAFC system was effective and energy efficient for different outdoor meteorological conditions in a high humidity environment. These results provide a strong theoretical basis for the promotion and application of the combined RFCAFC system in high humidity environments in Jinan, China.
4.1. Indoor Temperature and Humidity
Figure 8 and
Figure 9 show the variation of indoor humidity (
φ), outdoor temperature (
TO), indoor temperature (
Tin), and dew point temperature (
Td) over time using different operating strategies. It can be seen from
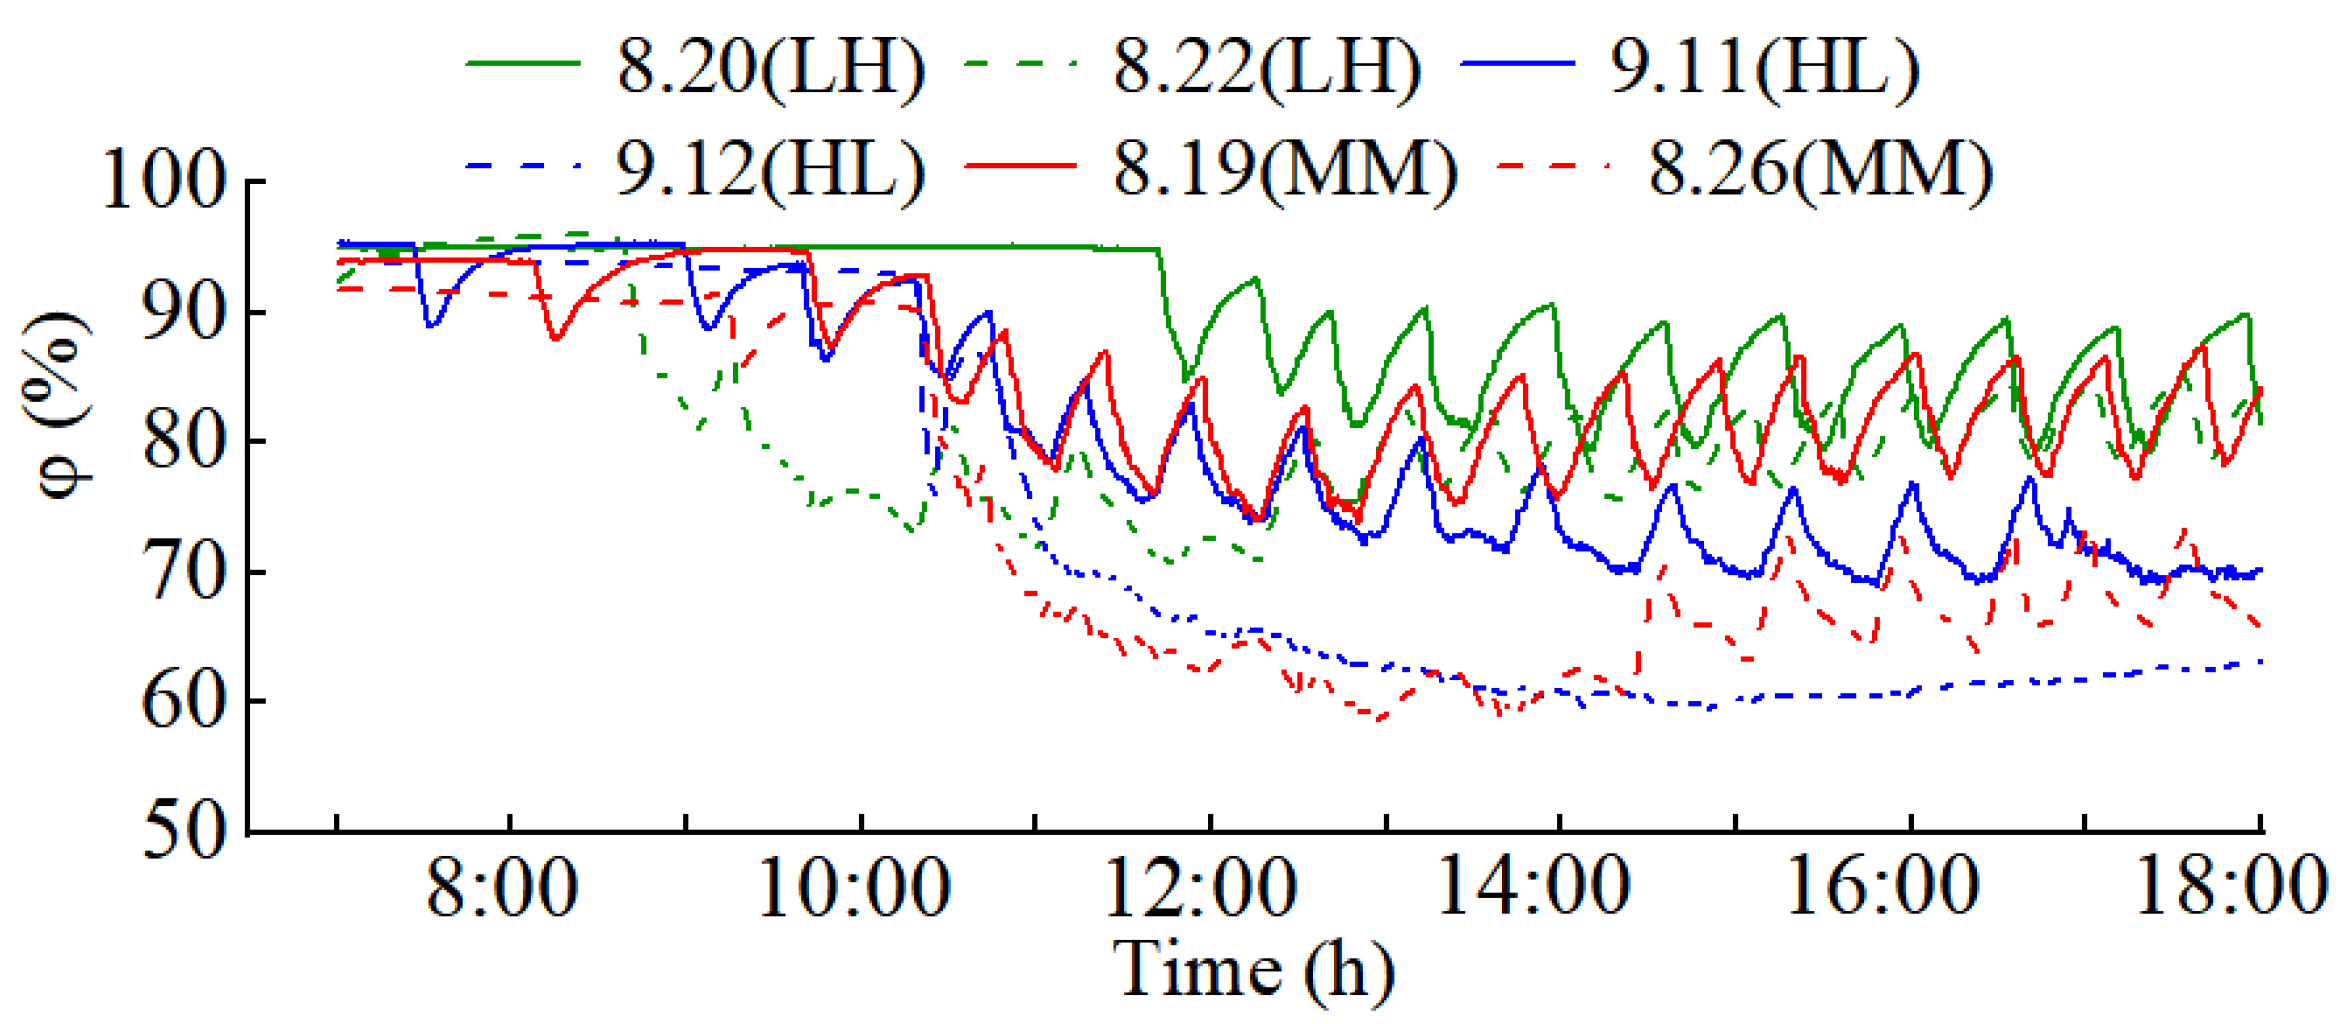
Figure 8 that
φ varied greatly during the test period. The
φ tended to decrease significantly 0–3 h after turning on the combined cooling system, but after that the
φ gradually reached a relatively stable state. This was because higher outdoor humidity resulted in higher indoor humidity as well, which affected the operation of the system. In general, the combined cooling system had a significant dehumidification effect in the high humidity indoor environment.
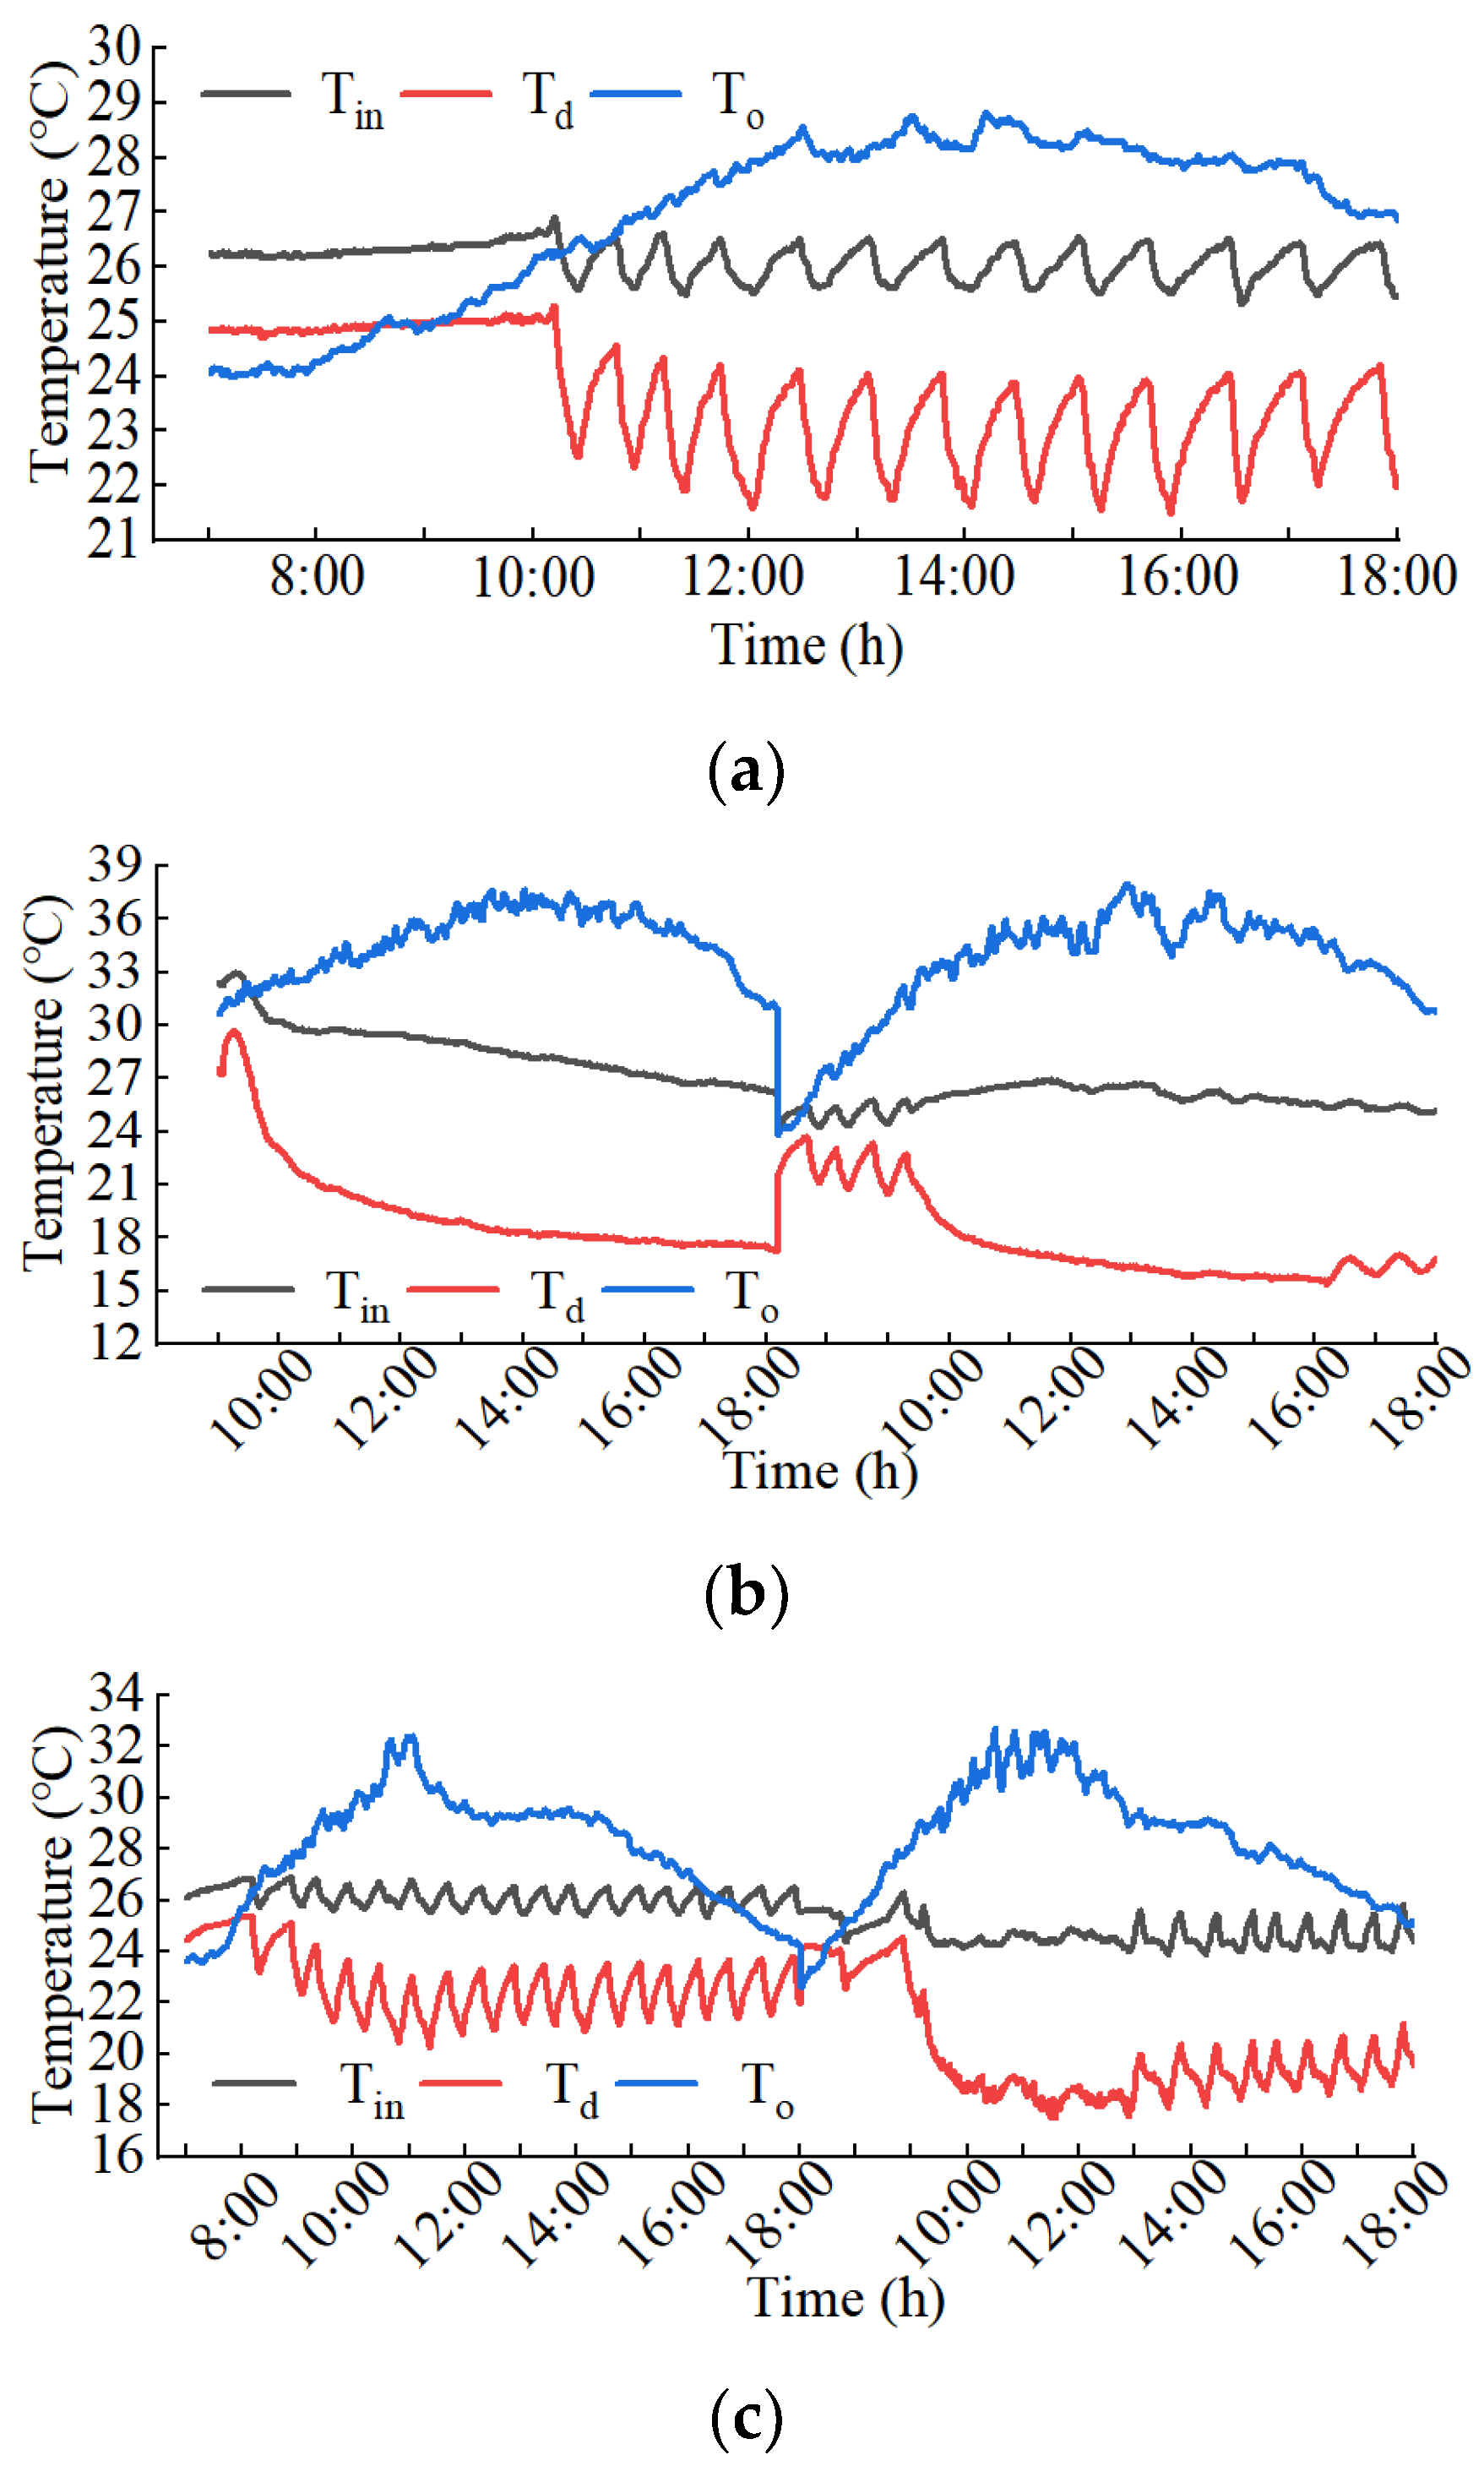
As can be seen in
Figure 9, the outdoor temperature fluctuated between 23 °C and 40 °C during the test period in Jinan, China. The average outdoor temperatures were 27.4 °C, 33.9 °C, and 28.7 °C during operating hours (8:00–18:00). The room temperature fluctuated between 25.5 °C and 27.5 °C during operation after the combined system reached a relative steady state. The average indoor temperatures were 26.1 °C, 26.6 °C, and 25.4 °C, respectively, during working hours. These values met the indoor temperature requirements for occupants. The standard deviations of
Tr were low, i.e., 0.45 °C, 1.04 °C, and 0.58 °C, and the maximum standard deviation of
Tin was only 1.04 °C. These values indicated that
Tin was relatively stable and the operation strategy was effective in regulating
Tin under different outdoor meteorological conditions.
Figure 9 shows that
TO was significantly lower than the indoor temperature during the test period 7:00–9:00. Therefore, the room temperature appeared to be reduced by natural cooling during that time period. By comparing the operating strategies for different outdoor meteorological conditions, it was found that the indoor temperature (
Tin) under the operation strategy for HL showed a decreasing trend during the test period, while the
Tin under the LH and MM operating strategies exhibited oscillating changes during the test period. The reason for this phenomenon was that there was a larger heat load entering the room through the envelope structure with continuously high outdoor temperatures. At the same time, the combined cooling system operated intermittently and the low outdoor temperature environment at night further improved the stability of the indoor thermal environment by reducing the internal surface temperature of the building envelope and offsetting part of the heat load accumulated by the building during the day. Therefore, to further improve the stability of the indoor thermal environment, intermittent operation of the combined cooling system at night can be considered. From the perspective of energy saving, natural cooling can effectively be used from 7:00 to 9:00.
4.2. Vertical Air Temperature Difference
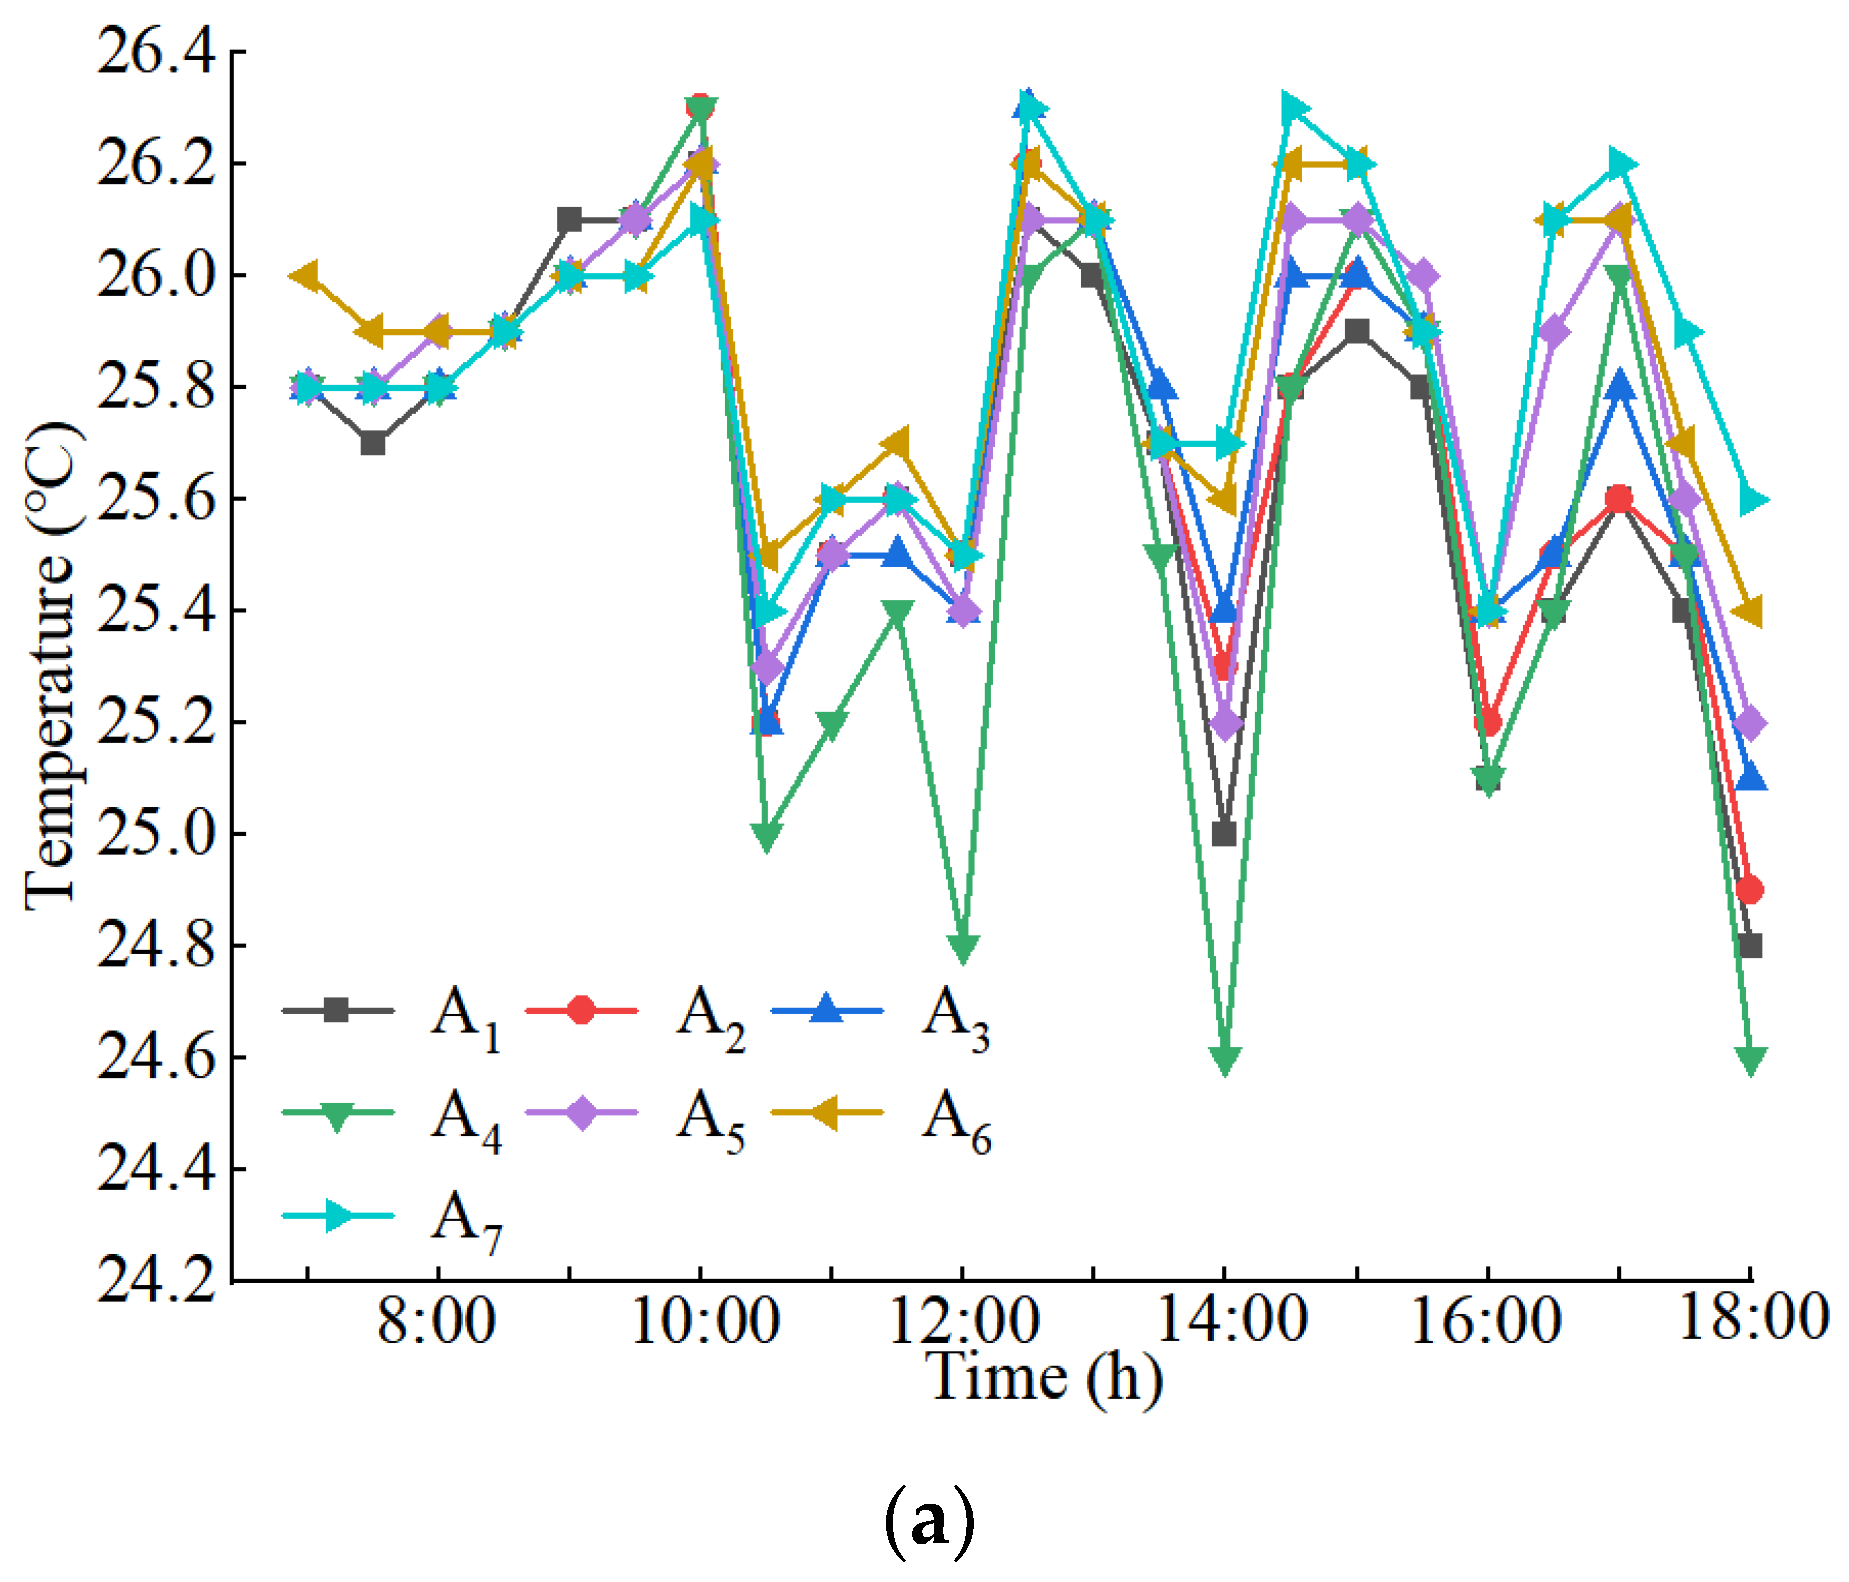
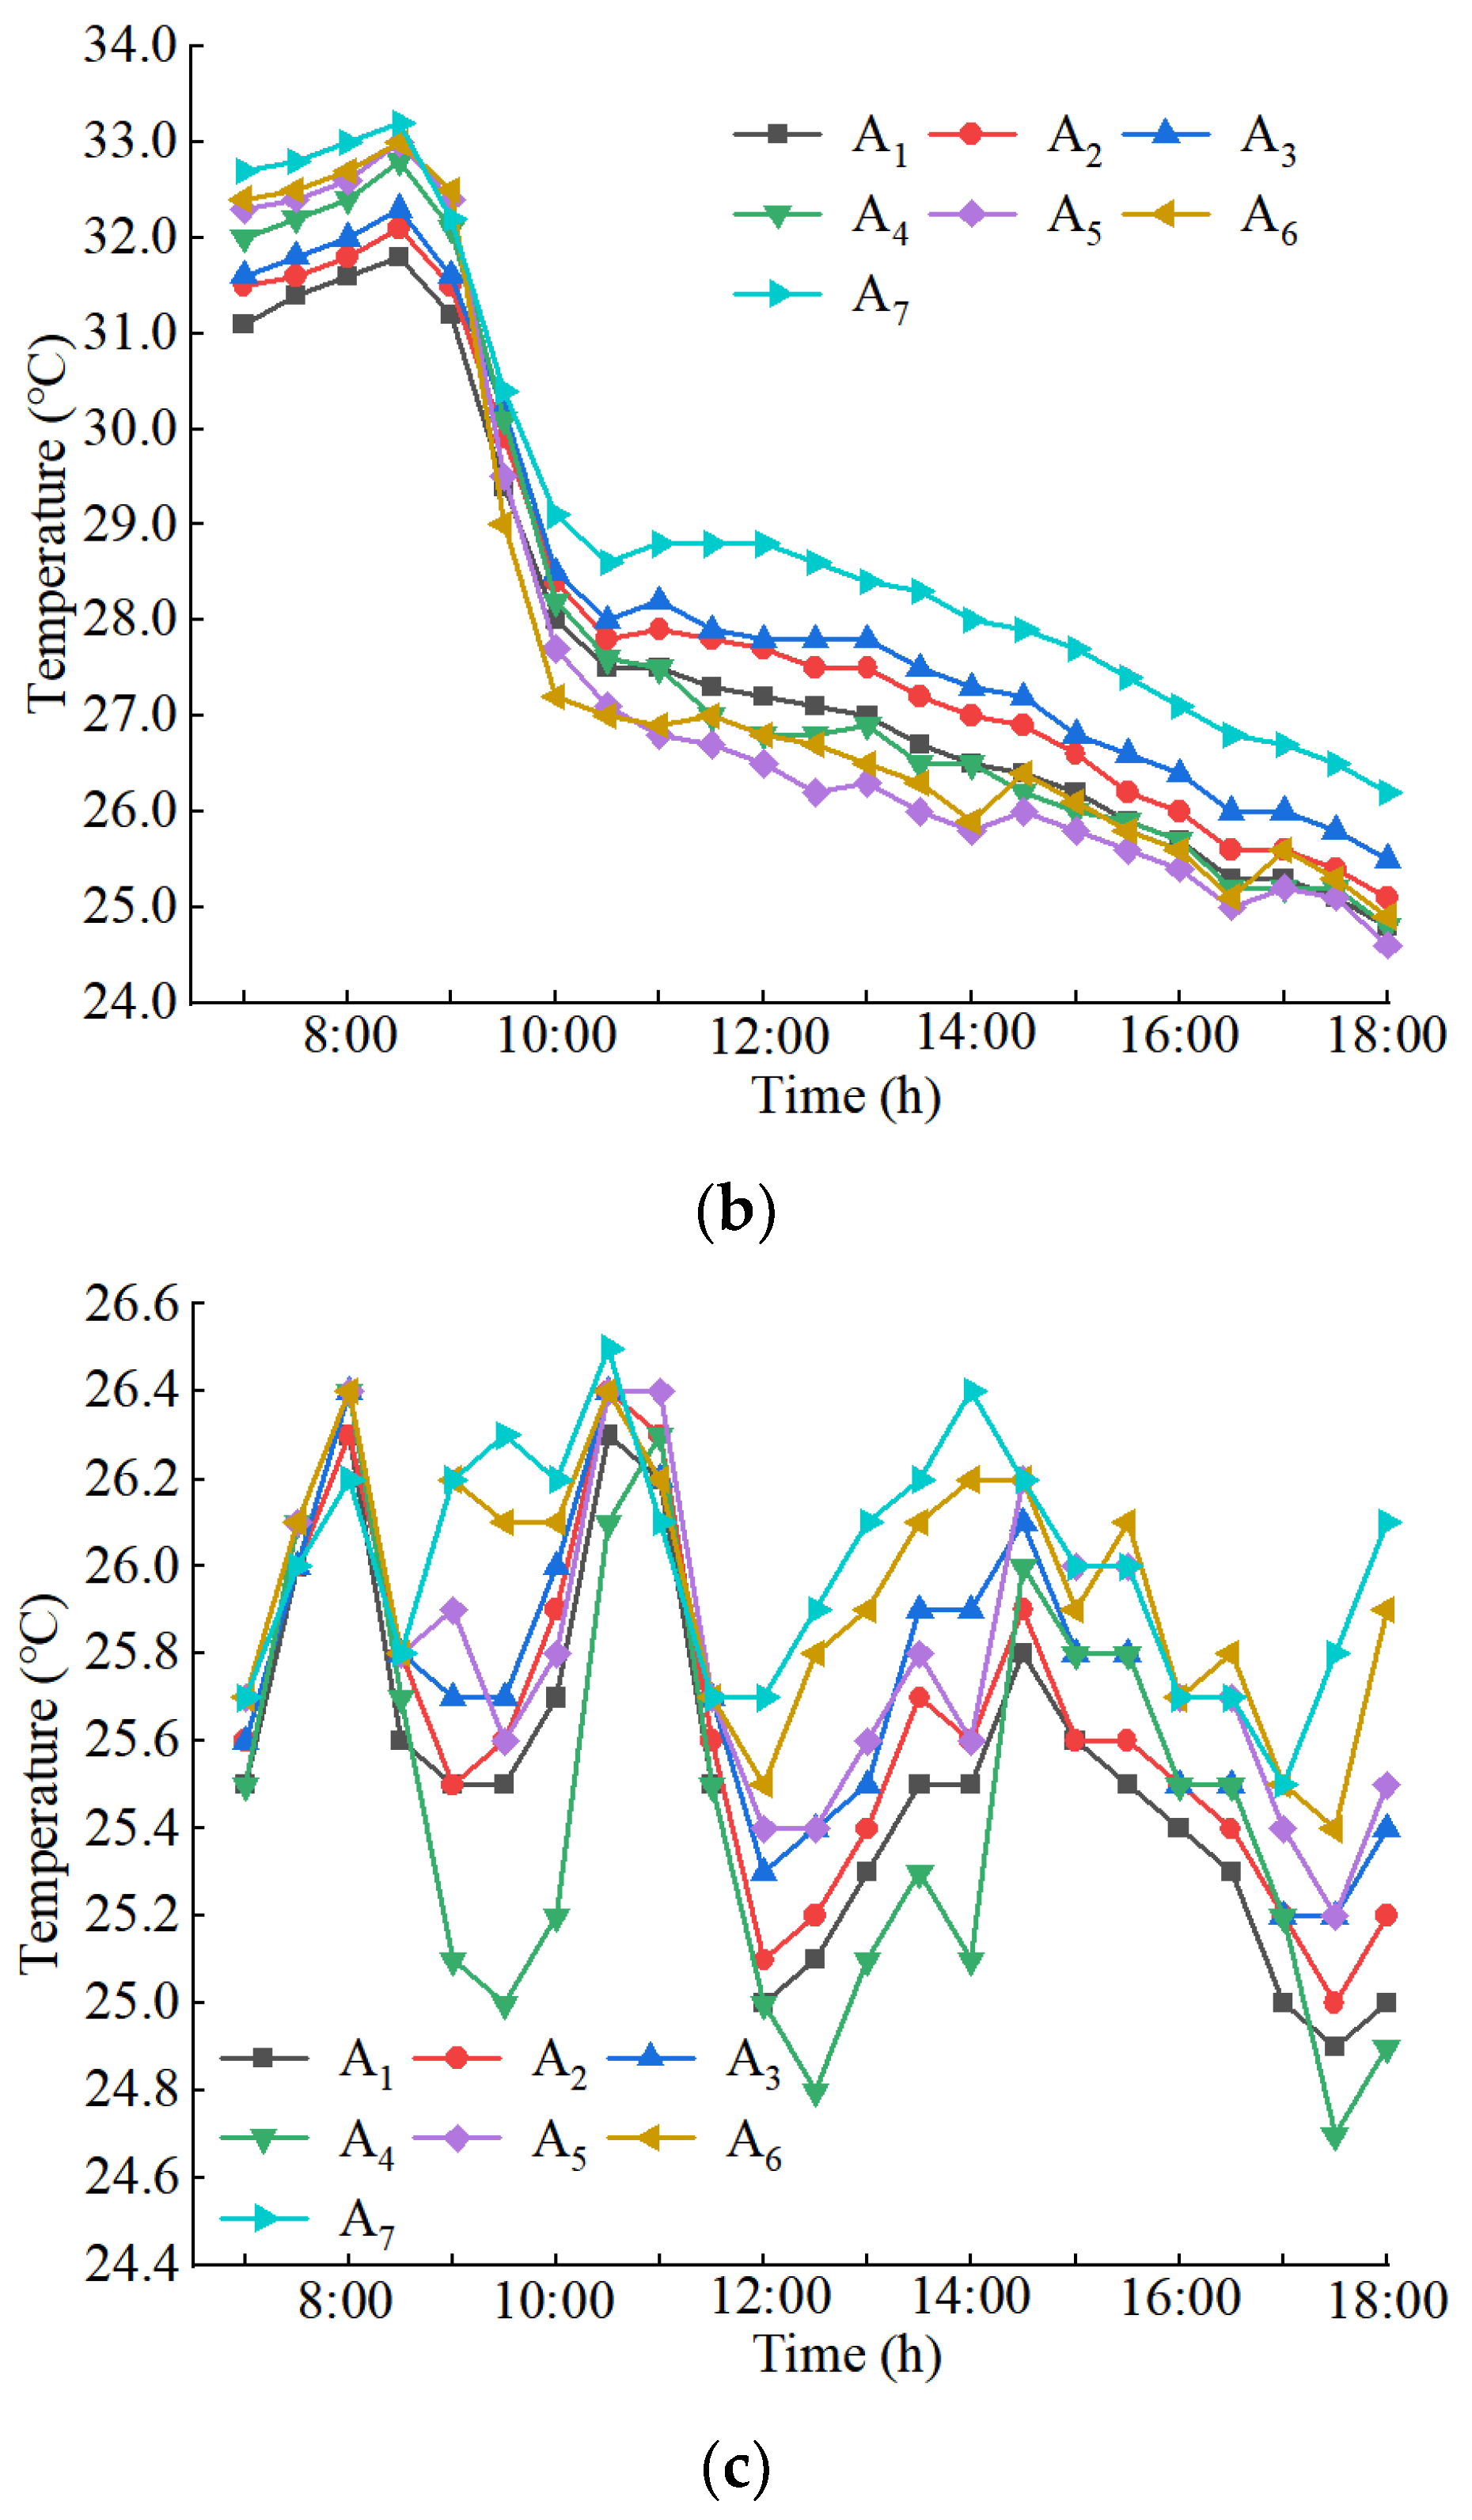
Figure 10 shows the
Tin change curves at different heights from the ground over time. It can be seen that the indoor vertical temperature fluctuated between 24.5 °C and 33.1 °C and at 1100 mm above the ground the temperature fluctuated between 23.4 °C and 26.3 °C under different operating strategies. Under the same operational strategy, the trends of
Tin change were similar and relatively uniform among different heights. Under the LH operating strategy, the maximum temperature difference between different locations in the room was 0.3 °C at the same height, while under the LH and MM operating strategies the maximum temperature differences between locations in the room at the same height were 0.7 °C and 0.5 °C, respectively. The figure also shows that the room was colder at the lower points and hotter at higher points, and the temperature gradient was slightly more pronounced above 1.5 m. Under the LH, HL, and MM operating strategies, the maximum temperature differences at different heights in the room were about 1.7 °C, 1.6 °C, and 1.8 °C, respectively.
According to the ASHRAE552017 standard, the maximum temperature gradient should not exceed 3 °C in an area with major human activities. Therefore, the operating strategies used under all different outdoor meteorological conditions met the indoor temperature gradient requirements. Due to the influence of solar radiation, the indoor local maximum temperature occurred at the height of 1.1–1.5 m from 13:00 to 15:00, which could cause thermal discomfort at specific locations. Therefore, shading measures should be considered in the building construction process to reduce thermal discomfort caused by the local high temperature phenomenon.
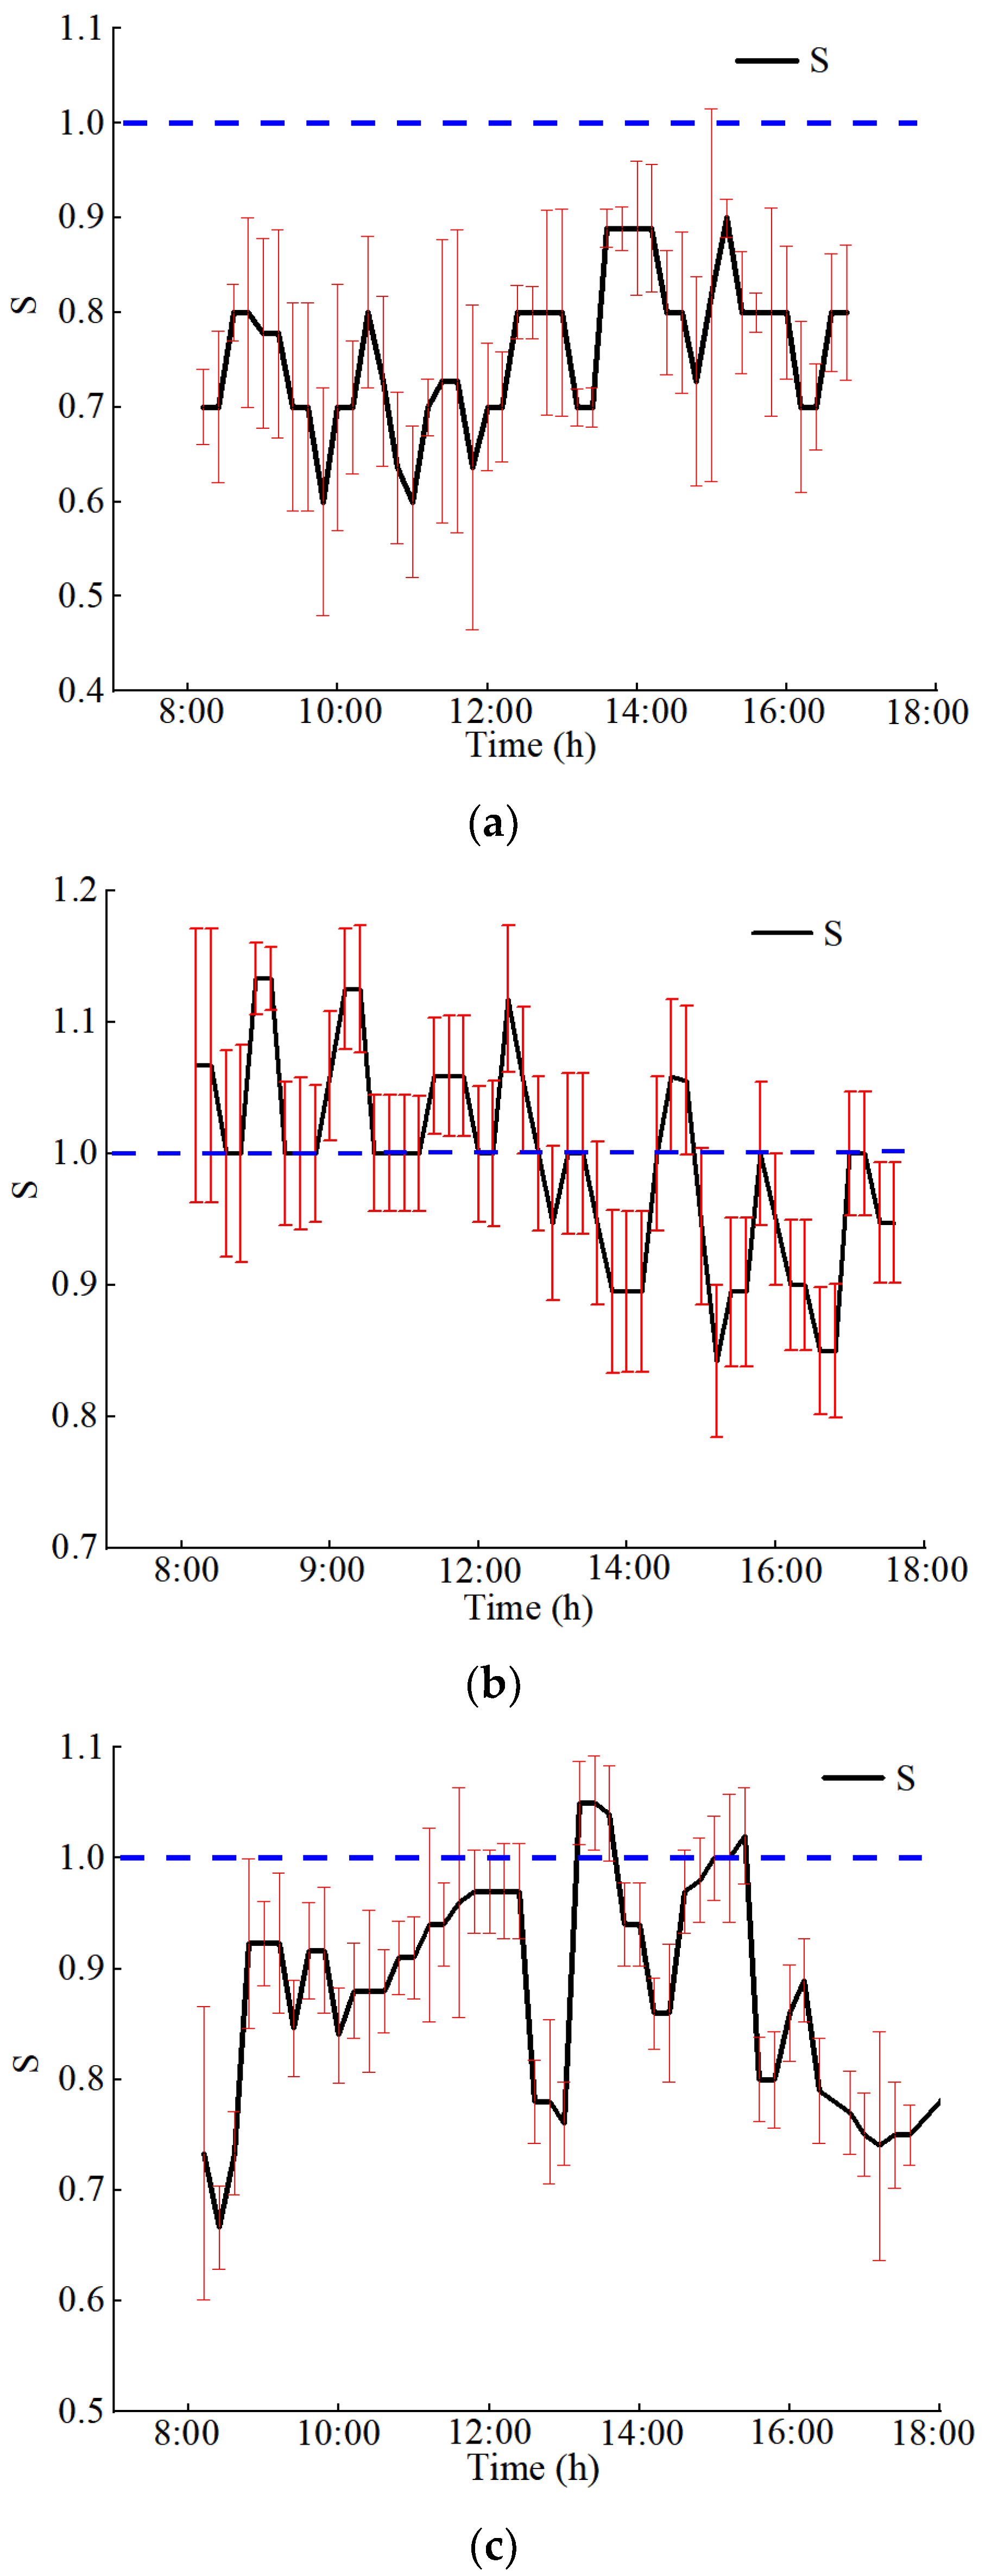
4.3. Radiant Floor Surface Temperature
The changes in radiation floor surface temperature under different operating strategies are shown in
Figure 11. The black curve indicates the change trend of
S and the red line indicates the fluctuation range of
S. Under the HL operating strategy,
S remained basically stable at about 1.0, which was a desirable level. Under the LH and MM operating strategies, the
S was low, mostly within the 0.7–1.0 range, which can be considered the normal range. However, under the MM operating strategy, the
s appeared to fluctuate more. So, under the MM operating strategy, the radiation floor had worse stability, but still remained within the normal range. This may have been because the indoor humidity was too high under this environmental condition. From the following
Figure 11, it can be found that
S was more stable when the radiant floor operated continuously than when it operated intermittently. Therefore, when the combined cooling system is artificially regulated, the radiant floor should be set to a constant open state to reduce fluctuation and improve comfort.
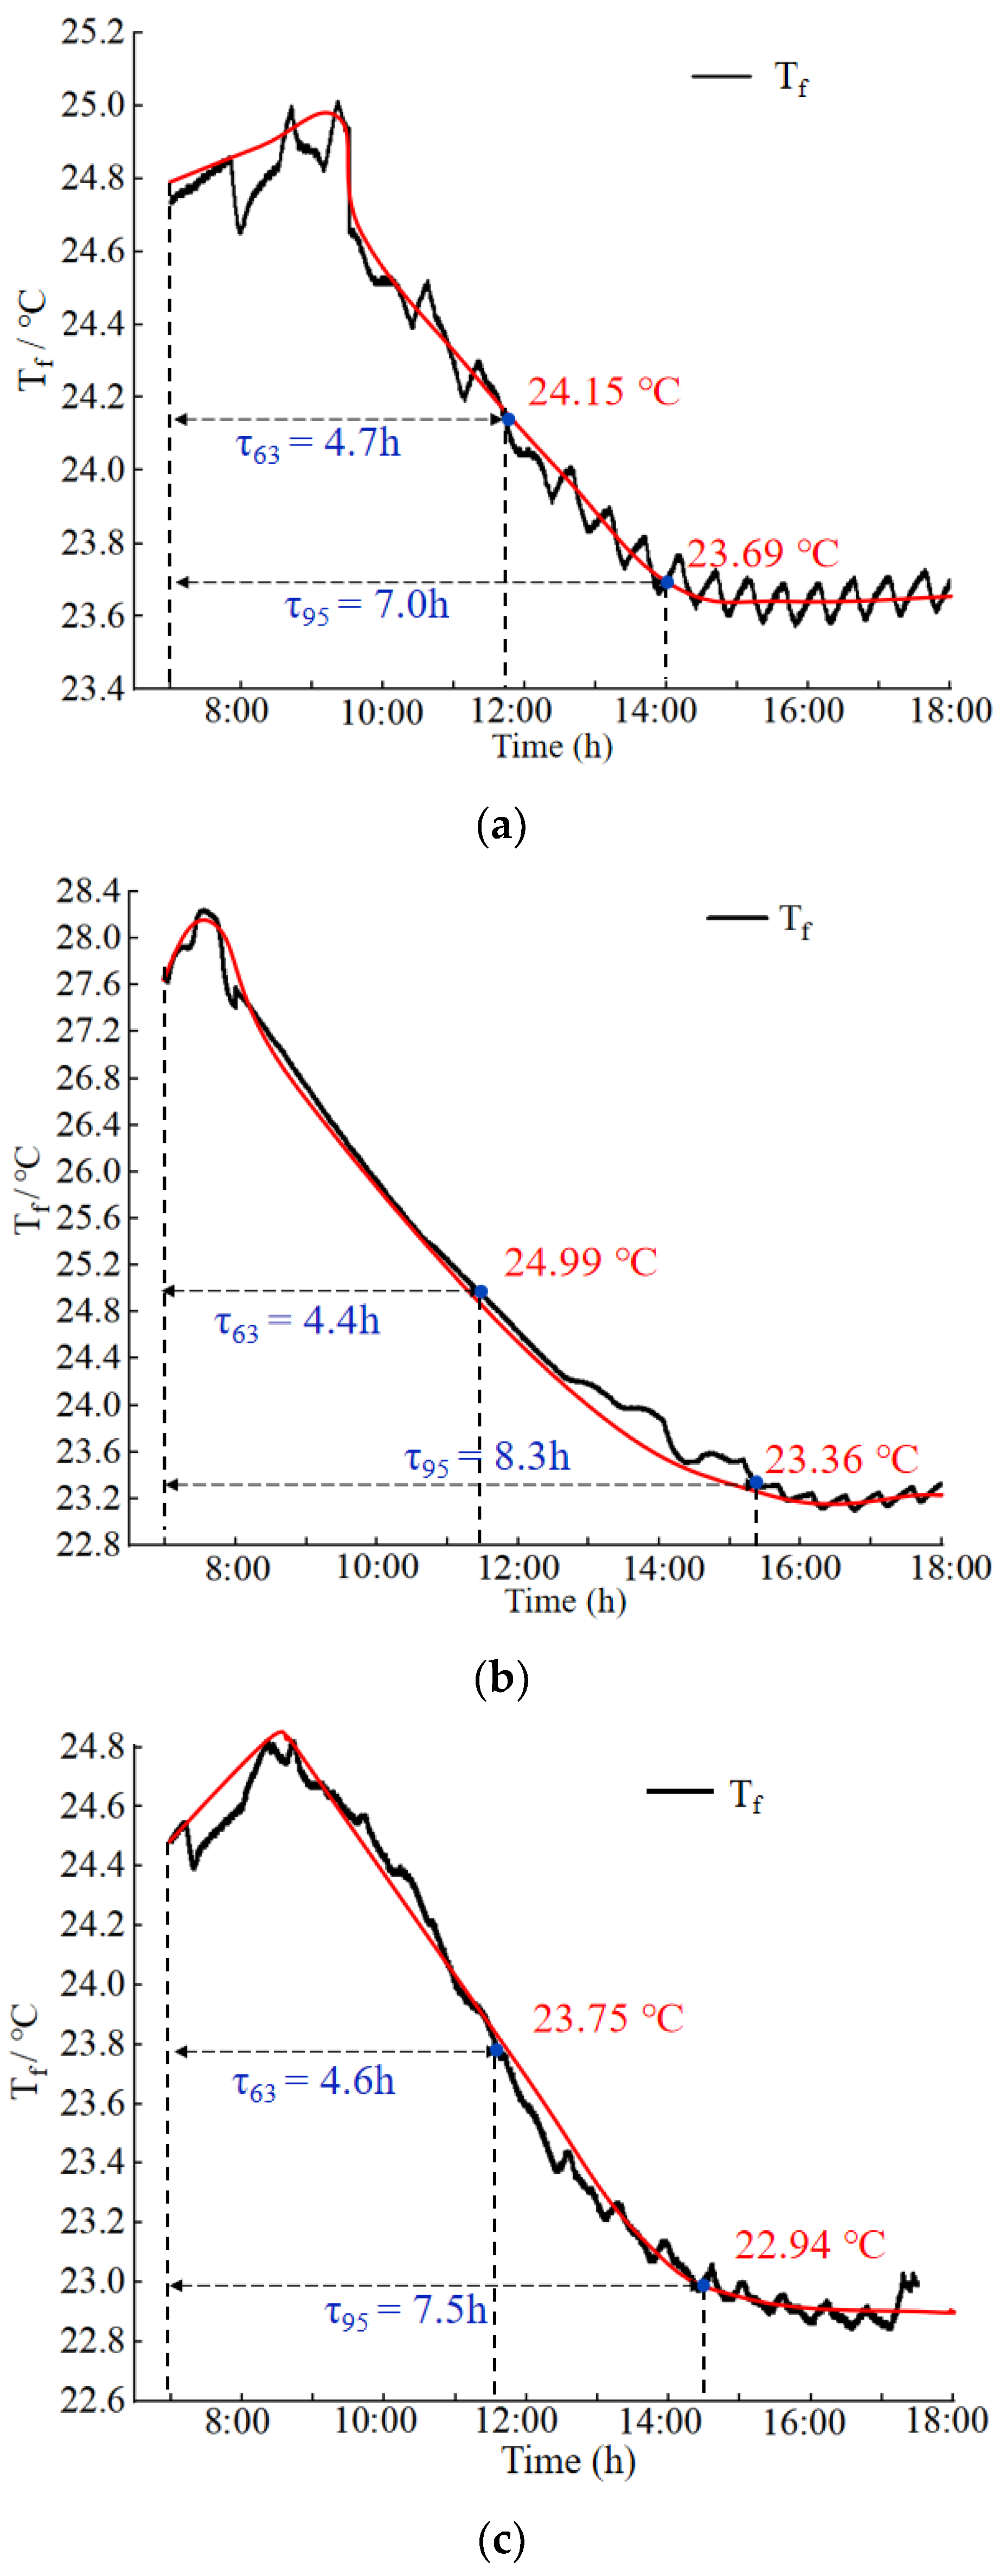
4.4. Radiant Floor Time Constant
Figure 12 shows the radiant floor surface temperature change over time for different operating strategies for different outdoor meteorological conditions. It can be seen that the
τ63 of different operating strategies ranged between 4.4 and 4.7 h.
The differences in τ63 between operating strategies were small, and the final floor surface temperatures all stabilized at about 23 °C. This indicated that all the different RFCAFC operating strategies for different outdoor meteorological conditions were effective in the high humidity environment. In particular, when high outdoor temperatures led to high initial indoor temperatures, the τ63 value was only 4.4 h, which corresponds to a radiant floor temperature drop rate of 0.73 °C/h. The LH and MM operating strategies corresponded to radiant floor surface temperature drop rates of 0.19 °C/h and 0.21 °C/h. This may have been due to the high outdoor humidity levels, which required that the fan coil system be in continuous operation at all times and had a large effect on the drop in floor surface temperature. The τ95 values among operating strategies had large differences. Comparisons showed that the higher the outdoor humidity, the greater the τ95 value of the radiant floor, or the longer it takes the radiant floor surface to stabilize. Therefore, in cases of high outdoor humidity, we can consider activating the radiant floor system in advance to ensure the system reaches relative stability before being occupied.
4.5. Thermal Comfort
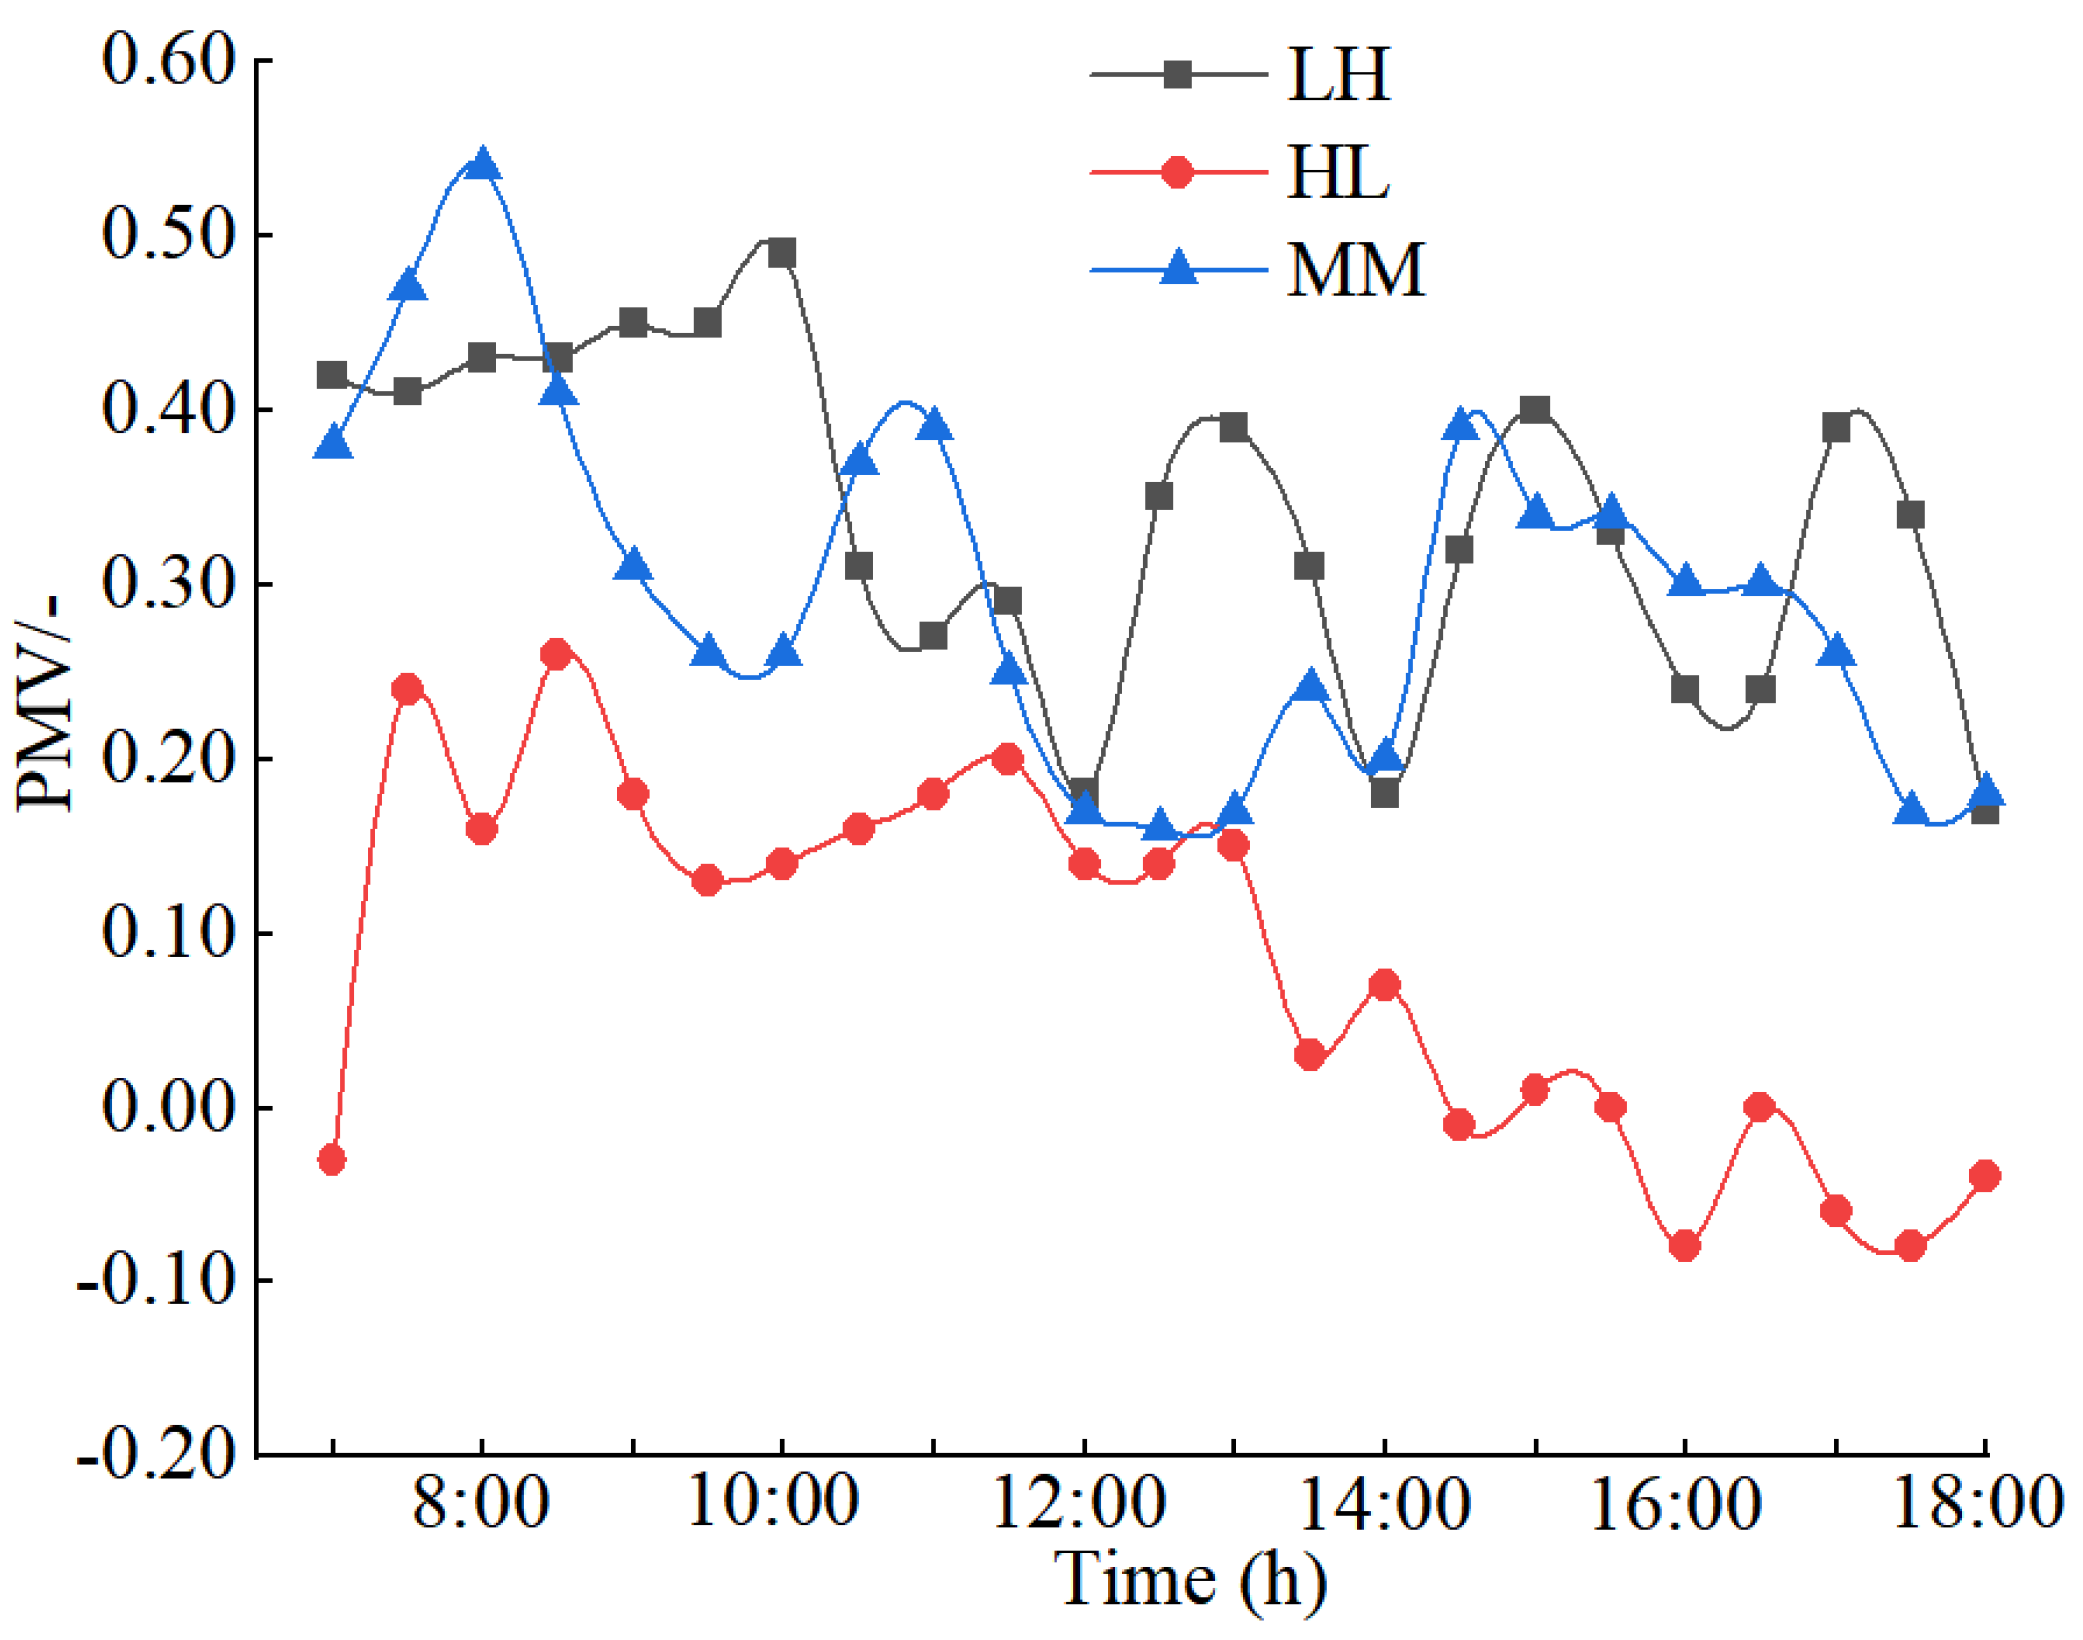
Figure 13 plots the PMV values over time for the different operation strategies. It can be seen that when the combined cooling system used the LH operating strategy, the PMV value fluctuated from −0.03 to 0.49, with the average value of 0.24. The PMV value fluctuated between −0.82 and 0.51 under the HL operating strategy, with an average of −0.08. The PMV value under the MM operating strategy fluctuated from −0.17 to 0.54, with an average of 0.14. The values of PMV under the LH and HL operating strategies were in accordance with ISO7730. However, the PMV was slightly higher than the recommended value during certain periods while using the MM operation strategy, but the comfort level was still acceptable. From the comfort point of view, the combined cooling system was able to effectively manage indoor thermal comfort.
Figure 14 shows that indoor thermal comfort was better under different meteorological conditions. Therefore, in order to optimize indoor thermal comfort and energy saving, some interior design strategies can be considered. Due to the higher amount of solar radiation reaching the room through the south window, the combined cooling system was unable to completely eliminate the indoor heat load, which finally led to a certain reduction in indoor comfort from 13:00 to 15:00. Therefore, to improve thermal comfort, it is necessary to adjust the operation strategy of the combined cooling system in real time according to the changes in outdoor meteorological conditions.
4.6. System Cooling Capacity
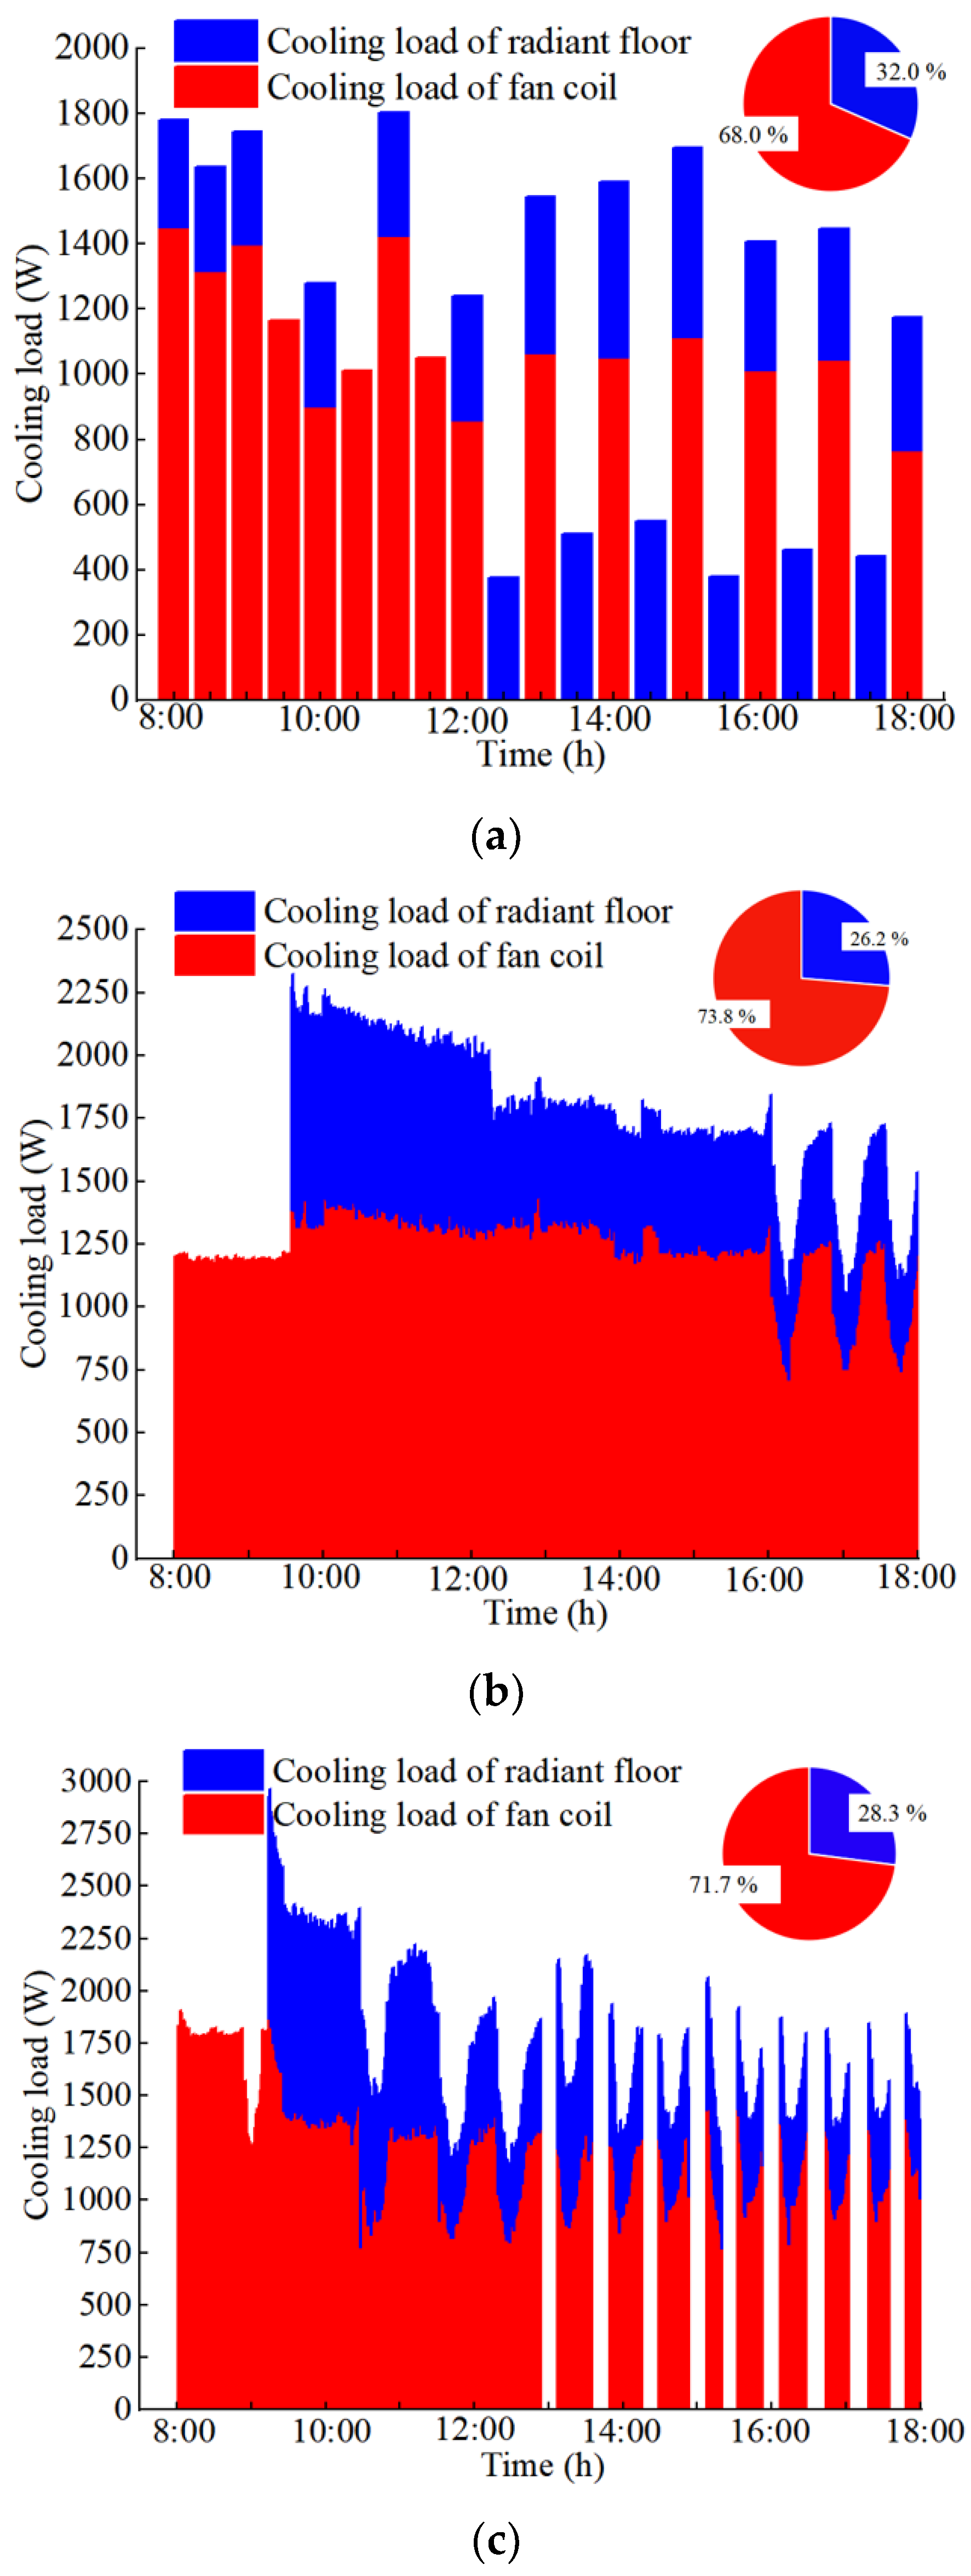
Figure 14 shows the change in cooling capacity of the combined cooling system over time under different outdoor meteorological conditions. According to the figure, in the initially high humidity environment, the fan coil accounted for about 68.0% of the total cooling load under the LH operating strategy. Under the HL and MM operation strategies the fan coil made up about 73.8% and 71.7% of the total cooling capacity, respectively. In short, the fan coil of the combined system contributed more to the total cooling capacity than the radiant floor.
Comparing the proportion of fan coil cooling capacity to the total cooling capacity, we see that only during the LH operating strategy were fan coil system and floor radiation system turned on simultaneously to dehumidify and cool due to the high outdoor humidity. Under the HL and MM operating strategy, the fan coil system was turned on about 1 h before the radiant floor to compensate for the slow start and long thermal response time of the radiant floor system as well as to the eliminate indoor heat load. The cooling load taken on by the fan coil system was much higher than that of the radiant floor system because the outdoor temperature was higher under the HL and MM operating conditions.
In order to avoid thermal discomfort in the room, the fan coil was necessary for cooling when the outdoor temperature was high. Therefore, when the indoor and outdoor temperatures are high, in order to reduce indoor temperature and the risk of thermal discomfort, the fan coil system should be turned on in advance.
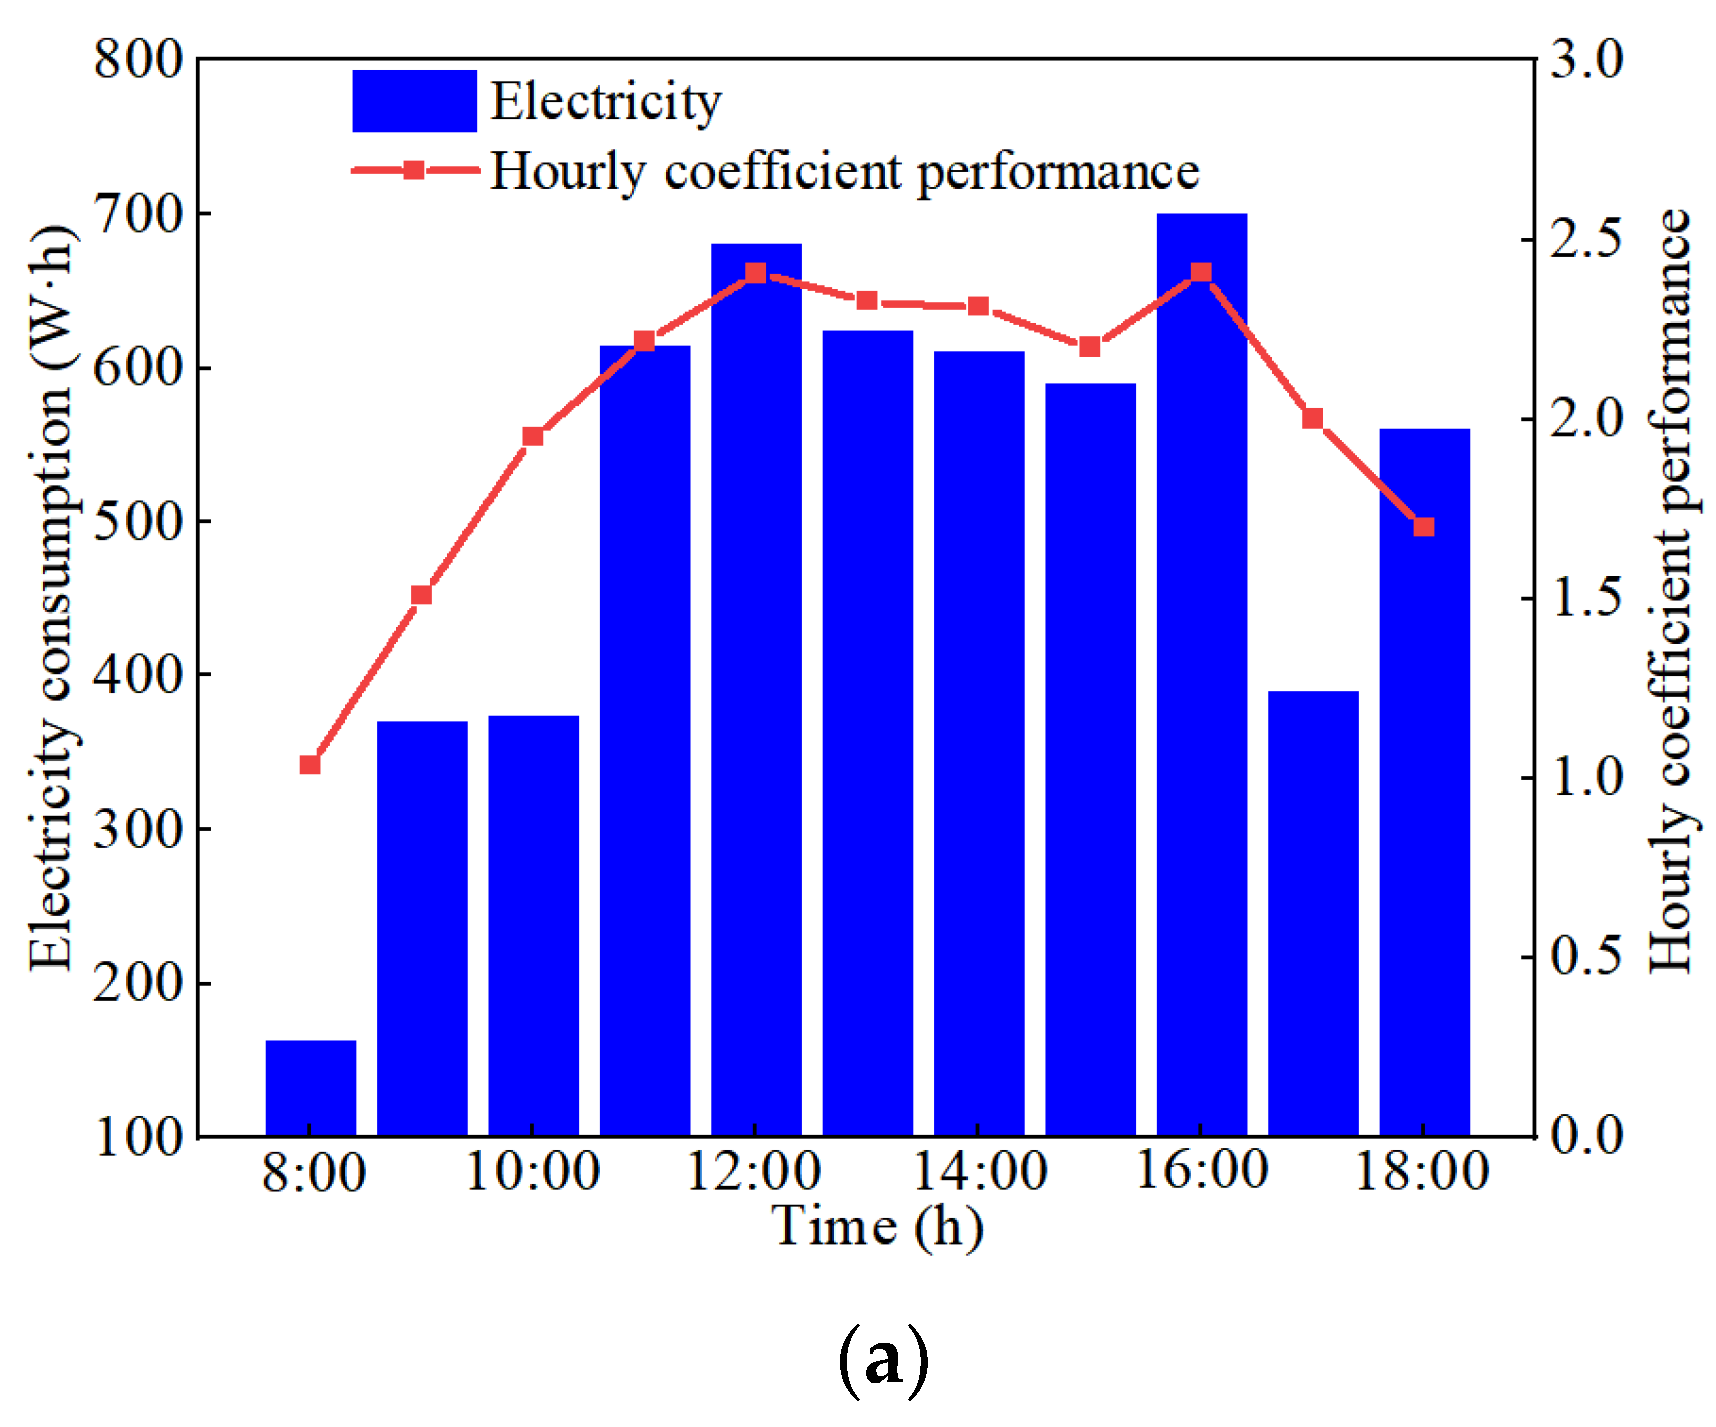
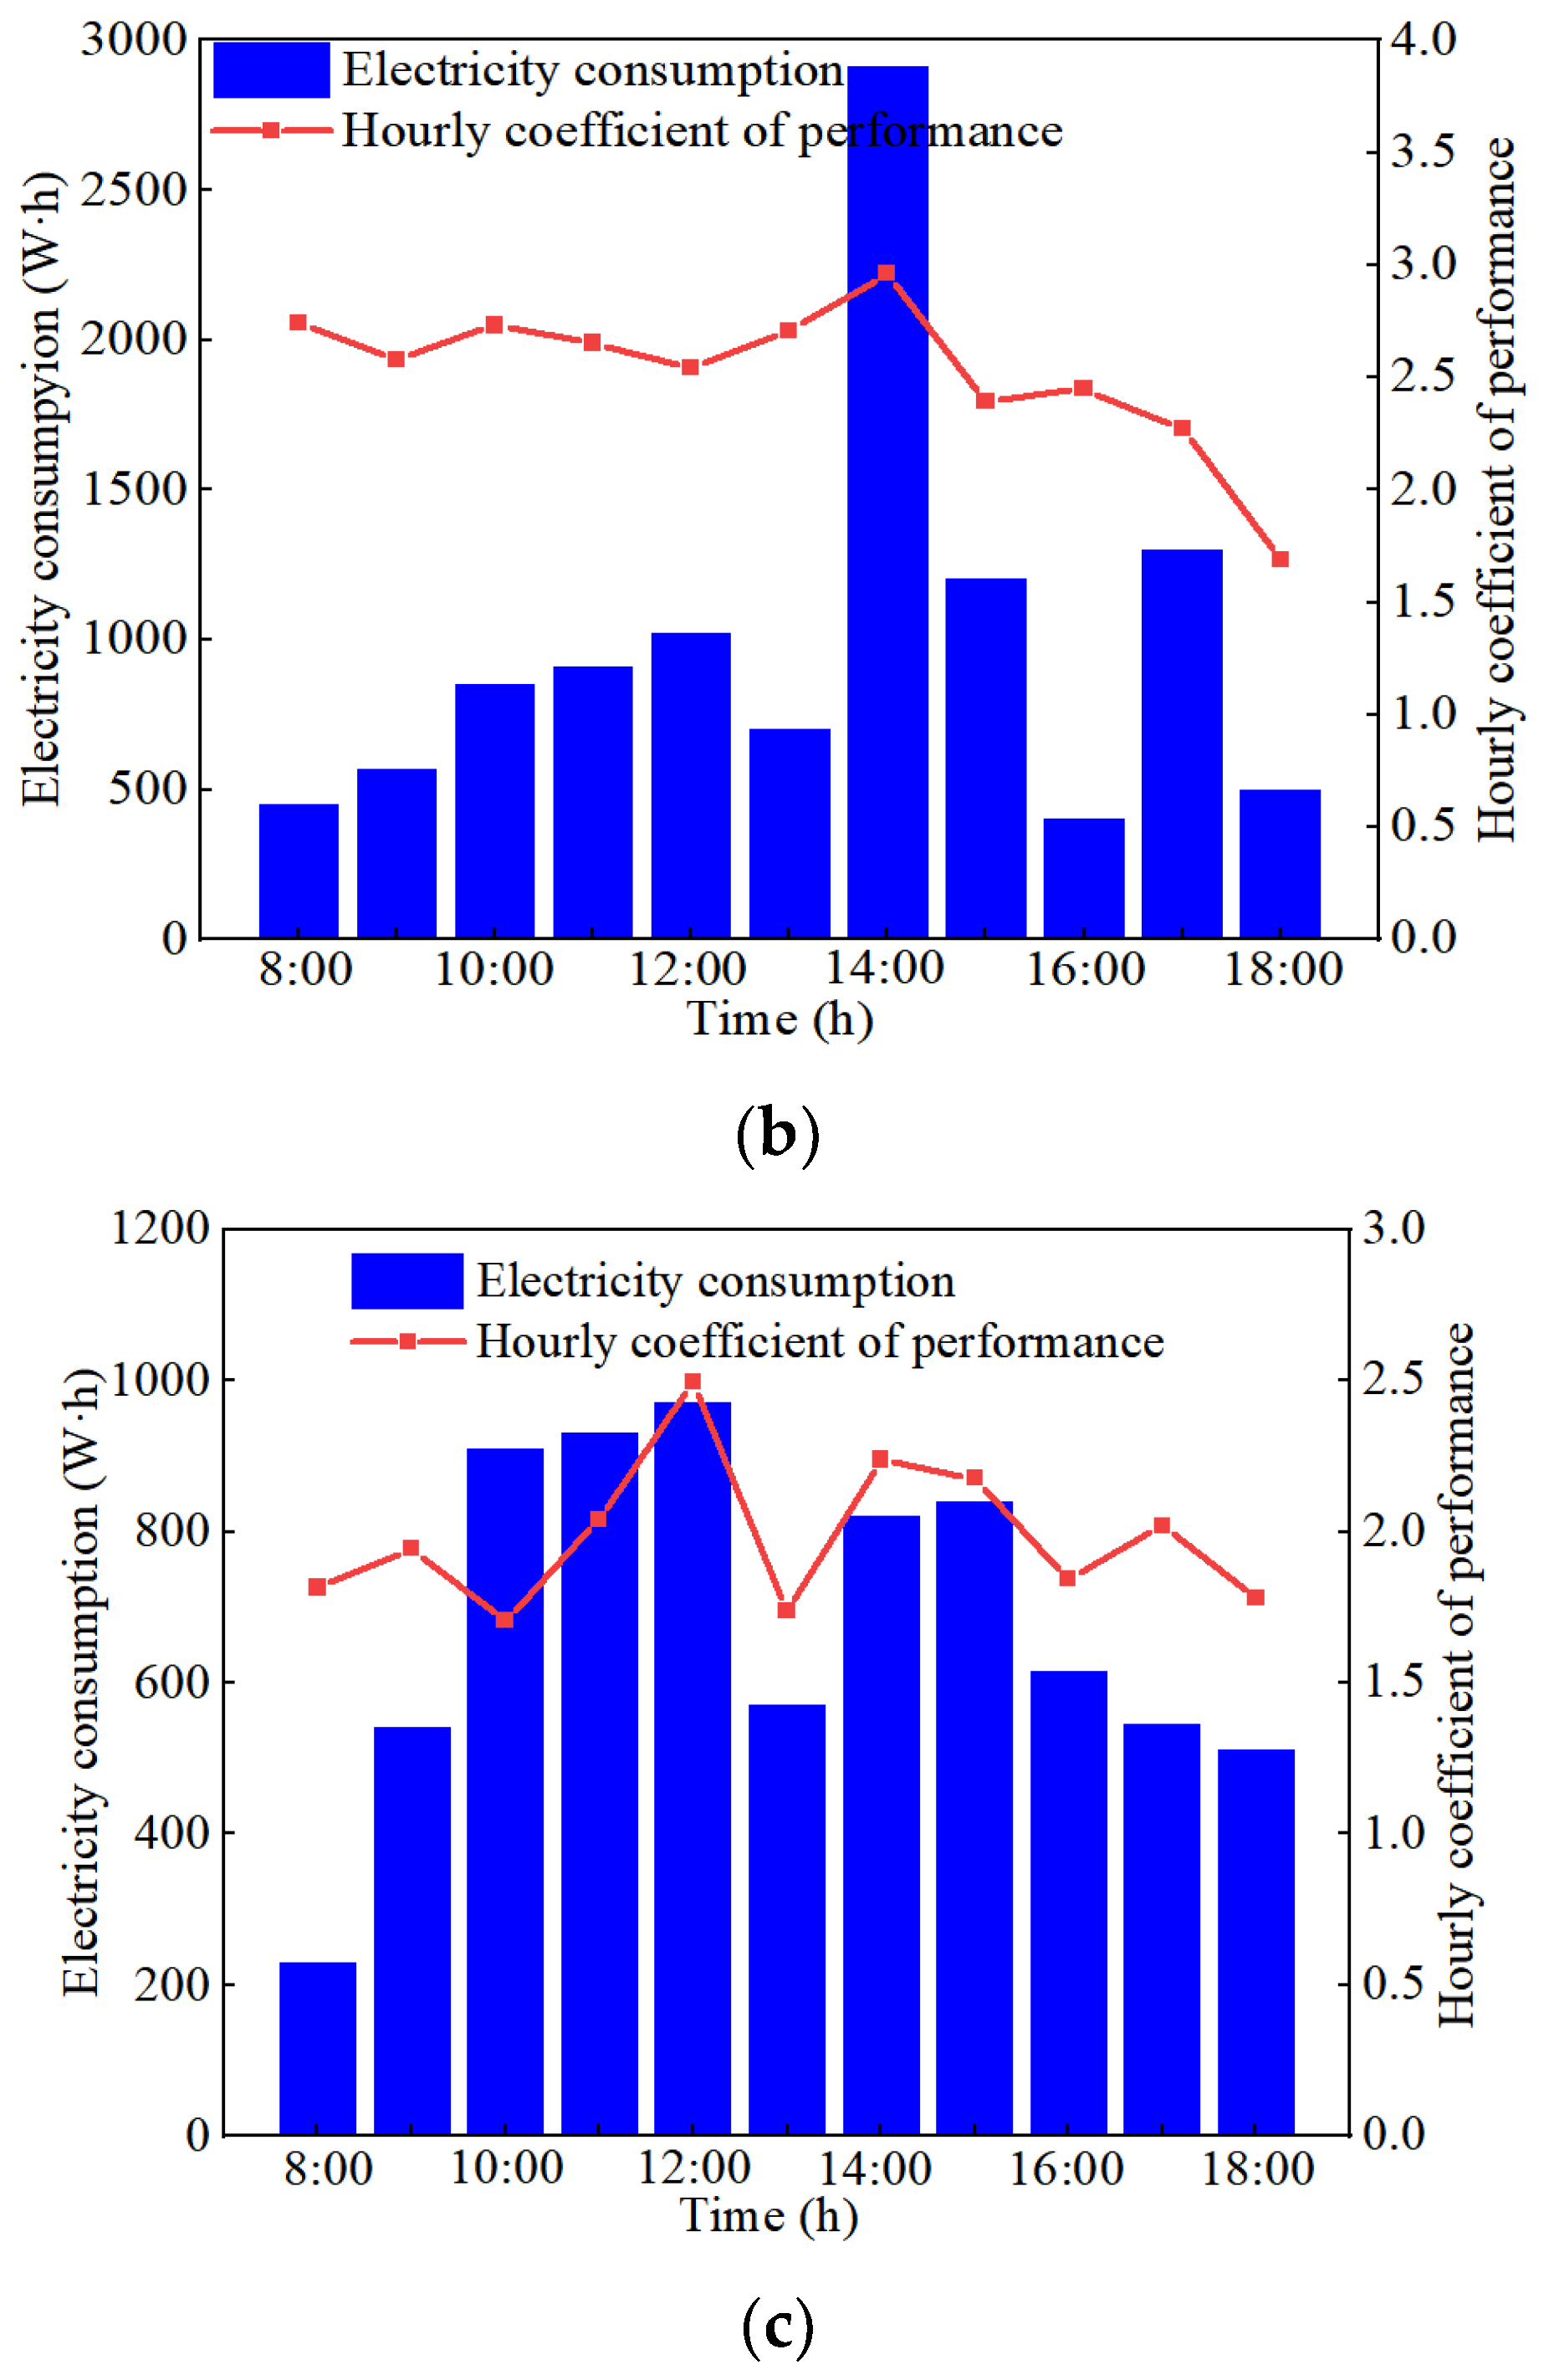
4.7. System Operation and Energy Consumption
Figure 15 shows the
EERh and system energy consumption over time for the combined cooling system the operation strategies for different outdoor meteorological conditions. It can be seen that when the combined cooling system was under the LH operating strategy, the
EERh fluctuated between 1.04 and 2.41, with an average of 1.98. During the HL and MM operating strategies, the
EERh of the combined cooling system fluctuated between 1.69–2.96 and 1.73–2.41, with averages of 2.52 and 2.14, respectively. The
EERh values of the combined system were slightly higher under HL outdoor meteorological conditions. This was because while using the HL operation strategy, the air source heat pump was operating at a high load when the room temperature reached a relatively stable state. In the MM operating strategy, the air source heat pump was maintained at a low load operation state. The combined cooling system consumed 13.43 kWh and 17.18 kWh when utilizing the LH and HL operating strategies, respectively, under the three different outdoor meteorological conditions. During the MM operating strategy, the daily energy consumption of the combined system was 11.36 kWh.
Calculations showed that the energy consumption of the LH operating strategy was about 21.8% lower than that of the HL operating strategy. The energy consumption of the MM operating strategy was about 15.4% lower than that of the LH operating strategy. The energy consumption of the HL was much larger than those of the other two operating strategies. This showed that energy consumption was mainly influenced by the outdoor temperature. Thus, the higher the outdoor temperature, the more energy is consumed by the combined system. Furthermore, the EERh was smaller during the initial operating period each day compared to other time periods. This was because the air source heat pump was operated at low load during the initial time period each day. In addition, the EERh tended to increase as the cooling load taken by the radiant floor system increased. Therefore, from the perspective of reducing energy consumption and achieving efficient operation of the system, the radiant floor system should take on as much cooling capacity as possible and be continuously operated, while the fan coil can be operated intermittently.
5. Discussion
This experiment is one of the few that integrate an RFCAFC system into a standalone outdoor building in China. Previous experimental studies on the RFCAFC system have been based in office or residential buildings wherein not all walls are exterior walls. This experiment assessed the automatic operation of the RFCAFC system based on outdoor meteorological conditions, which freed the system from defects due to manual control present in previous studies. The subsequent results have created a strong theoretical basis for the promotion and application of combined cooling systems in the construction of intelligent buildings. They also provide new ideas for the operation of RFCAFC systems in actual building projects. The effectiveness of the operation strategies for different outdoor meteorological conditions can be used to guide future system operations and help to improve the reliability of the combined cooling system, especially in spaces that are frequently characterized by high humidity.
However, there were five limitations in this study that need to be further explored. First, this experimental study used only three different outdoor meteorological conditions (HL, LH, and MM) and did not consider others, such as high temperature and high humidity/low temperature and low humidity. Therefore, the operation strategies that were effective here may be different from those required for a combined cooling system in an actual project. In-depth studies will need to be conducted to consider more types of outdoor meteorological conditions in the future.
Second, the effect of indoor moisture dissipation on the combined cooling system was not considered in the study. Moreover, the study only assessed control strategies and did not study the control principles and the implementation process of the controls, which introduces certain limitations. A more in-depth study is needed to ensure the combined cooling system is widely applicable to different outdoor meteorological conditions.
Third, the experimental test was only conducted for six days, which is relatively short considering the length of the cooling season. The outdoor meteorological conditions were limited and cannot be considered representative of all outdoor meteorological conditions in Jinan, China during the cooling season. Therefore, when promoting the application of the combined cooling system, the influence of different outdoor meteorological conditions on the combined cooling system should be fully considered.
Fourth, this experiment was conducted in Jinan, China, which is in a hot summer and cold winter climate zone. Therefore, appropriate validation studies should be carried out before promoting the application of this combined cooling system in other climate zones to ensure that the RFCAFC system is the most effective and energy-saving option. The next steps will gradually address each of the above deficiencies to provide a stronger theoretical basis for the application of this type of the RFCAFC system in high humidity environments.
Fifth, this study will need to be augmented by developing numerical models and conducting simulation tests for validation. These methods will allow us to obtain results from different, more general case studies and under a wider variety of conditions.
6. Conclusions
In this study, a RFCAFC system for a single building was established and tested. The effects of different operation strategies on indoor temperature, vertical temperature difference, thermal comfort, cooling capacity, EERh, and system energy consumption under different outdoor meteorological conditions were analyzed. The conclusions of the study are as follows.
(1) The level of radiation floor surface uniformity coefficient was low, mostly within 0.7–1.0. The range of τ63 of different operation strategies for different outdoor meteorological conditions was 4.4–4.7 h. The differences among operation strategies were small. The final floor surface temperature was stable at about 23 °C. In order for the radiant floor to reach its relatively stable state earlier, the radiant floor system could be turned on in advance.
(2) For all different operating strategies, the indoor thermal comfort was good and the temperature distribution was uniform in the indoor high humidity environment. Therefore, interior design approaches can be considered to further reduce the temperature and ensure indoor thermal comfort.
(3) The fan coil of the combined system took up a large proportion of the cooling load, accounting for about 68.0–73.8% of the total cooling capacity. The fan coil system plays a significant role in compensating for the long thermal response time of the radiant floor system.
(4) The energy consumption during the HL operating conditions was much larger than those of the other two outdoor meteorological conditions. The energy consumed by the LH operating strategy was about 21.8% lower than that of the HL operation strategy. The energy consumption of the MM operating strategy was about 15.4% lower than that of the LH operation strategy. From the energy saving point of view, use of the radiant floor system for cooling should be prioritized and it should be operated continuously, while the fan coil can be operated intermittently.
Author Contributions
Conceptualization, X.Z. (Xuwei Zhu) and J.L.; methodology, J.L.; formal analysis, X.Z. (Xuwei Zhu), X.W. and J.L.; investigation, X.Z. (Xuwei Zhu), J.L., Y.D. and X.Z. (Xiangyuan Zhu); writing—original draft preparation, X.Z. (Xuwei Zhu); writing—review and editing, J.L., X.Z. (Xiangyuan Zhu), J.M., X.W. and X.Z. (Xuwei Zhu); supervision, J.L.; project administration, J.L.; funding acquisition, J.L. and J.M. All authors have read and agreed to the published version of the manuscript.
Funding
This work was funded by Natural Science Foundation of Shandong Province (ZR2021ME199) and Key Research and Development Project in Shandong Province (2018GSF121003).
Institutional Review Board Statement
Not applicable.
Informed Consent Statement
Not applicable.
Data Availability Statement
Not applicable.
Acknowledgments
This work acknowledges the support of the Plan of Introduction and Cultivation for Young Innovative Talents in Colleges and Universities of Shandong Province.
Conflicts of Interest
The authors declare no conflict of interest.
Nomenclature
| cp | specific heat of air, J/(kg·°C) |
| h | enthalpy, kJ/kg |
| T | Temperature, °C |
| Q | cooling capacity, W |
| S | radiant floor surface temperature uniformity coefficient |
| M | human energy metabolic rate, W/m2 |
| W′ | mechanical work done by the human body, W/m2 |
| Pa | partial pressure of water vapor around the human body, kPa |
| m | mass flow rate per unit area of circulating duct, kg/s |
| | |
| Abbreviation | |
| RFCAFC | combined radiant floor and fan coil cooling |
| RFC | radiant floor cooling |
| LH | low temperature and high humidity |
| HL | high temperature and low humidity |
| MM | medium temperature and medium humidity |
| PMV | predicted mean vote |
| PPD | predicted percentage dissatisfaction |
| PVC | polyvinyl chloride |
| S | sample standard deviation |
| | |
| Greek letters | |
| τ | time constant, h |
| φ | relative humidity, % |
| | |
| Subscripts | |
| s,max | radiant floor surface maximum temperature, °C |
| s,min | radiant floor surface minimum temperature, °C |
| g | radiant floor water supply temperature, °C |
| h | radiant floor water return temperature, °C |
| s | initial temperature, °C |
| e | temperature at reaching 63% of total temperature change, °C |
| 63 | the time required for the radiant floor surface temperature change of the radiant floor to reach a total change of approximately 63.2%, h |
| 95 | the time required for the radiant floor surface temperature change of the radiant floor to reach a total change of approximately 95%, h |
| im | the initial moment radiant floor surface temperature, °C |
| rs | radiant floor surface temperature to reach a relatively stable state, °C |
| i | temperature after the i hour after the start of the combined system, °C |
| age | average indoor temperature during the test period, °C |
| fcl | garment area coefficient |
| tcl | temperature of the outer surface of the garment, °C |
| age | average radiant temperature, °C |
| r | convective heat transfer coefficient, W/(m2·K) |
| a | air temperature around the human body, °C |
| R | RFC capacity, W |
| F | fan coil cooling capacity, W |
| n | fan coil air supply volume, kg/s |
| 2 | return air outlet enthalpy, kJ/(kg·K) |
| 1 | enthalpy at the supply air outlet, kJ/(kg·K) |
| Eh | system energy consumption, kWh |
| EERh | hourly cooling performance coefficient |
| O | outdoor temperature, °C |
| in | indoor temperature, °C |
| d | dew point temperature, °C |
References
- Harish, V.S.K.V.; Kumar, A. A review on modeling and simulation of building energy systems. Renew. Sust. Energy Rev. 2016, 56, 1272–1292. [Google Scholar] [CrossRef]
- Yang, L.; Yan, H.; Lam, J.C. Thermal comfort and building energy consumption implications—A review. Appl. Energy 2014, 115, 164–173. [Google Scholar] [CrossRef]
- Hu, Y.; Xia, X.; Wang, J. Research on operation strategy of radiant cooling system based on intermittent operation characteristics. J. Build. Eng. 2022, 45, 103483. [Google Scholar] [CrossRef]
- Qi, R.; Lu, L.; Yang, H. Investigation on air-conditioning load profile and energy consumption of desiccant cooling system for commercial buildings in Hong Kong. Energy Build. 2012, 49, 509–518. [Google Scholar] [CrossRef]
- Chua, K.J.; Chou, S.K.; Yang, W.M.; Yan, J. Achieving better energy-efficient air conditioning—A review of technologies and strategies. Appl. Energy 2013, 104, 87–104. [Google Scholar] [CrossRef]
- Rupp, R.F.; Vásquez, N.G.; Lamberts, R. A review of human thermal comfort in the built environment. Energy Build. 2015, 105, 178–205. [Google Scholar] [CrossRef]
- Song, D.; Kim, T.; Song, S.; Hwang, S.; Leigh, S.-B. Performance evaluation of a radiant floor cooling system integrated with dehumidified ventilation. Appl. Therm. Eng. 2008, 28, 1299–1311. [Google Scholar] [CrossRef]
- Feustel, H.E.; Stetiu, C. Hydronic radiant cooling—Preliminary assessment. Energy Build. 1995, 22, 193–205. [Google Scholar] [CrossRef]
- Zhang, L.Z. Energy performance of independent air dehumidification systems with energy recovery measures. Energy 2006, 31, 1228–1242. [Google Scholar] [CrossRef]
- Kim, M.K.; Liu, J.; Cao, S.-J. Energy analysis of a hybrid radiant cooling system under hot and humid climates: A case study at Shanghai in China. Build. Environ. 2018, 137, 208–214. [Google Scholar] [CrossRef]
- Liu, J.; Li, Z.; Kim, M.K.; Zhu, S.; Zhang, L.; Srebric, J. A comparison of the thermal comfort performances of a radiation floor cooling system when combined with a range of ventilation systems. Indoor Built Environ. 2020, 29, 527–542. [Google Scholar] [CrossRef]
- Liu, J.; Zhu, S.; Kim, M.K.; Srebricv, J. A review of CFD analysis methods for personalized ventilation (PV) in indoor built environments. Sustainability 2019, 11, 4166. [Google Scholar] [CrossRef] [Green Version]
- Liu, J.; Kim, M.K.; Srebric, J. Numerical analysis of cooling potential and indoor thermal comfort with a novel hybrid radiant cooling system in hot and humid climates. Indoor Built Environ. 2022, 31, 929–943. [Google Scholar] [CrossRef]
- Liu, J.; Ren, J.; Zhang, L.; Xie, X.; Kim, M.M.; Zhang, L. Optimization of Control Strategies for the Radiant Floor Cooling System Combined with Displacement Ventilation: A Case study of an Office Building in Jinan, China. Int. J. Archit. Eng. Technol. 2019, 6, 33–48. [Google Scholar] [CrossRef]
- Ren, J.; Liu, J.; Zhou, S.; Kim, M.K.; Song, S. Experimental study on control strategies of radiant floor cooling system with direct-ground cooling source and displacement ventilation system: A case study in an office building. Energy 2022, 239, 122410. [Google Scholar] [CrossRef]
- Li, N.; Chen, Q. Study on dynamic thermal performance and optimization of hybrid systems with capillary mat cooling and displacement ventilation. Int. J. Refrig. 2020, 110, 196–207. [Google Scholar] [CrossRef]
- Hu, R.; Niu, J.L. A review of the application of radiant cooling & heating systems in Mainland China. Energy Build. 2012, 52, 11–19. [Google Scholar] [CrossRef]
- Sourbron, M.; De Herdt, R.; Van Reet, T.; Van Passel, W.; Baelmans, M.; Helsen, L. Efficiently produced heat and cold is squandered by inappropriate control strategies: A case study. Energy Build. 2009, 41, 1091–1098. [Google Scholar] [CrossRef]
- Romaní, J.; de Gracia, A.; Cabeza, L.F. Simulation and control of thermally activated building systems (TABS). Energy Build. 2016, 127, 22–42. [Google Scholar] [CrossRef] [Green Version]
- Li, Y.; Zhuang, Z.; Zhu, Q.; Song, J.; An, H. Research on control methods of roof radiant cooling system. Procedia Eng. 2017, 205, 2149–2155. [Google Scholar] [CrossRef]
- Schmelas, M.; Feldmann, T.; Bollin, E. Savings through the use of adaptive predictive control of thermo-active building systems (TABS): A case study. Appl. Energy 2017, 199, 294–309. [Google Scholar] [CrossRef]
- Jia, H.; Pang, X.; Haves, P. Experimentally-determined characteristics of radiant systems for office buildings. Appl. Energy 2018, 221, 41–54. [Google Scholar] [CrossRef] [Green Version]
- Bourdakis, E.; Kazanci, O.B.; Olesen, B.W. Load Calculations of Radiant Cooling Systems for Sizing the Plant. Energy Procedia 2015, 78, 2639–2644. [Google Scholar] [CrossRef] [Green Version]
- Mikeska, T.; Svendsen, S. Dynamic behavior of radiant cooling system based on capillary tubes in walls made of high performance concrete. Energy Build. 2015, 108, 92–100. [Google Scholar] [CrossRef] [Green Version]
- Mikeska, T.; Fan, J.; Svendsen, S. Full scale measurements and CFD investigations of a wall radiant cooling system integrated in thin concrete walls. Energy Build. 2017, 139, 242–253. [Google Scholar] [CrossRef] [Green Version]
- Liu, J.; Zhu, X.; Kim, M.K.; Cui, P.; Kosonen, R. A Transient Two-dimensional CFD Evaluation of Indoor Thermal Comfort with an Intermittently-operated Radiant Floor Heating System in an Office Building. Int. J. Archit. Eng. Technol. 2020, 7, 62–87. [Google Scholar] [CrossRef]
- Zarrella, A.; De Carli, M.; Peretti, C. Radiant floor cooling coupled with dehumidification systems in residential buildings: A simulation-based analysis. Energy Convers. Manag. 2014, 85, 254–263. [Google Scholar] [CrossRef]
- Seo, J.-M.; Song, D.; Lee, K.H. Possibility of coupling outdoor air cooling and radiant floor cooling under hot and humid climate conditions. Energy Build. 2014, 81, 219–226. [Google Scholar] [CrossRef]
- Zhao, K.; Liu, X.-H.; Jiang, Y. Application of radiant floor cooling in a large open space building with high-intensity solar radiation. Energy Build. 2013, 66, 246–257. [Google Scholar] [CrossRef]
- Jin, W.; Jia, L.; Wang, Q.; Yu, Z. Study on Condensation Features of Radiant Cooling Ceiling. Procedia Eng. 2015, 121, 1682–1688. [Google Scholar] [CrossRef]
- Kim, M.K.; Leibundgut, H. A case study on feasible performance of a system combining an airbox convector with a radiant panel for tropical climates. Build. Environ. 2014, 82, 687–692. [Google Scholar] [CrossRef]
- Schmelas, M.; Feldmann, T.; Wellnitz, P.; Bollin, E. Adaptive predictive control of thermo-active building systems (TABS) based on a multiple regression algorithm: First practical test. Energy Build. 2016, 129, 367–377. [Google Scholar] [CrossRef]
- Srivastava, P.; Khan, Y.; Bhandari, M.; Mathur, J.; Pratap, R. Calibrated simulation analysis for integration of evaporative cooling and radiant cooling system for different Indian climatic zones. J. Build. Eng. 2018, 19, 561–572. [Google Scholar] [CrossRef]
- Feng, J.; Bauman, F.; Schiavon, S. Experimental comparison of zone cooling load between radiant and air systems. Energy Build. 2014, 84, 152–159. [Google Scholar] [CrossRef] [Green Version]
- Fernández Hernández, F.; Cejudo López, J.M.; Fernández Gutiérrez, A.; Domínguez Muñoz, F. A new terminal unit combining a radiant floor with an underfloor air system: Experimentation and numerical model. Energy Build. 2016, 133, 70–78. [Google Scholar] [CrossRef]
- Gu, X.; Cheng, M.; Zhang, X.; Qi, Z.; Liu, J.; Li, Z. Performance analysis of a hybrid non-centralized radiant floor cooling system in hot and humid regions. Case Stud. Therm. Eng. 2021, 28, 101645. [Google Scholar] [CrossRef]
- Joe, J.; Karava, P. A model predictive control strategy to optimize the performance of radiant floor heating and cooling systems in office buildings. Appl. Energy 2019, 245, 65–77. [Google Scholar] [CrossRef]
- Zhang, D.; Cai, N.; Cui, X.; Xia, X.; Shi, J.; Huang, X. Experimental investigation on model predictive control of radiant floor cooling combined with underfloor ventilation system. Energy 2019, 176, 23–33. [Google Scholar] [CrossRef]
- Liu, D.; Zhou, H.; Hu, A.; Zhang, Q.; Liu, N.; Wen, J. Study on the intermittent operation mode characteristic of a convection-radiation combined cooling system in office buildings. Energy Build. 2022, 255, 111669. [Google Scholar] [CrossRef]
- Atienza Márquez, A.; Cejudo López, J.M.; Fernández Hernández, F.; Domínguez Muñoz, F.; Carrillo Andrés, A. A comparison of heating terminal units: Fan-coil versus radiant floor, and the combination of both. Energy Build. 2017, 138, 621–629. [Google Scholar] [CrossRef]
- Khan, Y.; Khare, V.R.; Mathur, J.; Bhandari, M. Performance evaluation of radiant cooling system integrated with air system under different operational strategies. Energy Build. 2015, 97, 118–128. [Google Scholar] [CrossRef] [Green Version]
- Lin, B.; Wang, Z.; Sun, H.; Zhu, Y.; Ouyang, Q. Evaluation and comparison of thermal comfort of convective and radiant heating terminals in office buildings. Build. Environ. 2016, 106, 91–102. [Google Scholar] [CrossRef]
- Sun, H.; Yang, Z.; Lin, B.; Shi, W.; Zhu, Y.; Zhao, H. Comparison of thermal comfort between convective heating and radiant heating terminals in a winter thermal environment: A field and experimental study. Energy Build. 2020, 224, 110239. [Google Scholar] [CrossRef]
- Cen, C.; Jia, Y.; Liu, K.; Geng, R. Experimental comparison of thermal comfort during cooling with a fan coil system and radiant floor system at varying space heights. Build. Environ. 2018, 141, 71–79. [Google Scholar] [CrossRef]
- Dong, J.; Zhang, L.; Deng, S.; Yang, B.; Huang, S. An experimental study on a novel radiant-convective heating system based on air source heat pump. Energy Build. 2018, 158, 812–821. [Google Scholar] [CrossRef]
- Tian, Z.; Love, J.A. A field study of occupant thermal comfort and thermal environments with radiant slab cooling. Build. Environ. 2008, 43, 1658–1670. [Google Scholar] [CrossRef]
- Liu, J.; Dalgo, A.D.; Zhu, S.; Zhang, L.; Srebric, J. Performance analysis of a ductless personalized ventilation combined with radiant floor cooling system and displacement ventilation. Build. Simul. 2019, 12, 905–919. [Google Scholar] [CrossRef]
- ISO. Guide to the Expression of Uncertainty in Measurements; IO Standardization: Geneva, Switzerland, 1995. [Google Scholar]
- Mathioulakis, E.; Voropoulos, K.; Belessiotis, V. Assessment of uncertainty in solar collector modeling and testing. Sol. Energy 1999, 66, 337–347. [Google Scholar] [CrossRef]
Figure 1.
Photographs of the floor plan and experimental building. (a) Experimental site, (b) pipe with counter flow type laying, (c) control system components, and (d) indoor heat source.
Figure 1.
Photographs of the floor plan and experimental building. (a) Experimental site, (b) pipe with counter flow type laying, (c) control system components, and (d) indoor heat source.
Figure 2.
Radiant floor structure.
Figure 2.
Radiant floor structure.
Figure 3.
Location of the indoor measuring points.
Figure 3.
Location of the indoor measuring points.
Figure 4.
Schematic of the cooling system.
Figure 4.
Schematic of the cooling system.
Figure 5.
Illustrated schematic of the cooling system, (a) temperature controller of fan coil, (b) fan coil, (c) flow meter, (d) thermometer, (e) radiant floor coil, (f) temperature controller of radiant floor, (g) mixed water center, (h) constant temperature buffer tank, (i) air source heat pump, (j) controller of air source heat pump, (k) supply water pump.
Figure 6.
Control logic of the cooling system.
Figure 6.
Control logic of the cooling system.
Figure 7.
Meteorological conditions during the experiment, (a) outdoor air temperature, (b) outdoor air relative humidity, and (c) solar radiation.
Figure 7.
Meteorological conditions during the experiment, (a) outdoor air temperature, (b) outdoor air relative humidity, and (c) solar radiation.
Figure 8.
φ during the experimental period.
Figure 8.
φ during the experimental period.
Figure 9.
Temperature field showing (a) Tin change on the LH, (b) Tin change on the HL, and (c) Tin change on the MM.
Figure 9.
Temperature field showing (a) Tin change on the LH, (b) Tin change on the HL, and (c) Tin change on the MM.
Figure 10.
Vertical temperature differences under the (a) LH, (b) HL, and (c) MM operating strategies.
Figure 10.
Vertical temperature differences under the (a) LH, (b) HL, and (c) MM operating strategies.
Figure 11.
S range for the (a) LH, (b) HL, and (c) MM operating strategies.
Figure 11.
S range for the (a) LH, (b) HL, and (c) MM operating strategies.
Figure 12.
Temperature change of the radiant floor surface, Tf change during the (a) LH, (b) HL, and (c) MM operating strategies.
Figure 12.
Temperature change of the radiant floor surface, Tf change during the (a) LH, (b) HL, and (c) MM operating strategies.
Figure 13.
Thermal comfort under different operating strategies.
Figure 13.
Thermal comfort under different operating strategies.
Figure 14.
Cooling loads taken on by radiant floor and fan coil under the (a) LH, (b) HL, and (c) MM operating strategies.
Figure 14.
Cooling loads taken on by radiant floor and fan coil under the (a) LH, (b) HL, and (c) MM operating strategies.
Figure 15.
Energy consumption under the (a) LH, (b) HL, and (c) MM operating strategies.
Figure 15.
Energy consumption under the (a) LH, (b) HL, and (c) MM operating strategies.
Table 1.
Summary of the existing research on radiant cooling.
Table 1.
Summary of the existing research on radiant cooling.
| Author | System | Building | Investigation Type | Anti-Condensation Method | Key Findings |
|---|
| Zarrella et al. [25] | Radiant floor + mechanical ventilation | Residential buildings | Simulation | Mechanical ventilation | RFC system must be integrated with ventilation systems for dehumidification purposes. |
| Seo et al. [28] | Radiant floor + natural ventilation/displacement ventilation | | Simulation | Natural ventilation and displacement | In hot and humid climate, this hybrid system provides energy savings of approximately 19% compared to traditional RFC systems. |
| Zhao et al. [29] | Radiant floor + fan coil | Large open space | Simulation, experiment | Fan coil | A simple method for predicting the performance of radiant floor cooling systems with solar radiation in steady state is proposed. |
| Jin et al. [30] | Radiant roof | | Simulation, experiment | | During the start-up period, the temperature on the radiant surface drops rapidly. As the rate of radiation temperature drop increases, there is a risk of condensation on the radiant surface. |
| Keum-M and Leibundgut [31] | Radiant roof + air convector | Office buildings | Experiment | Air convectors | The use of air convectors helps reduce the risk of condensation on the radiant roof. |
| Schmelas et al. [32] | Radiant roof + mixed ventilation | Commercial buildings | Experiment | Mixed ventilation | The operation strategy of the combined system can maintain efficient operation for buildings with high thermal inertia. |
| Srivastava et al. [33] | Radiant roof and ventilation dehumidification system | Office buildings | Simulation, experiment | Ventilation/dehumidification | The integrated roof radiation and evaporative cooling system not only can be adapted to a variety of different climate zones but also have a large energy-saving potential. |
| Feng et al. [34] | Radiant roof + mixed air system | Experimental room | Experiment | Mixed air system | By studying the dynamic heat transfer in the room under the radiant system, the transient cooling rate of the radiant system is 18–21% higher than that of the air system during the heat gain. |
| Fernández-H et al. [35] | Radiant floor + air system | | Simulation, experiment | Underfloor air supply | The combined system can reduce the response time to changes in the space thermal loads and increase the cooling capacity of the floor. |
| Gu et al. [36] | Radiant floor + fan coil | Office buildings | Experiment | Fan coil/outdoor air dehumidifiers | Outdoor air systems and fan coils improve response time of radiant system in addition to auxiliary dehumidification. |
| Joe and Karava [37] | Radiant floor + supper wall diffuser | Living lab | Experiment | Air handler | The MPC results show 34% cost savings compared to baseline feedback control during the cooling season. |
| Zhang et al. [38] | Radiant floor + displacement ventilation | Experimental room | Experiment | Displacement ventilation | By building a dynamic simplification model, the studied control strategy is approximately 17% more energy efficient than the conventional control strategy. |
Table 2.
Thermal parameters of the radiant floor.
Table 2.
Thermal parameters of the radiant floor.
| Type | Thickness (mm) | Material | Density (kg/m3) | Thermal Conductivity (W/m·k) |
|---|
| Floor layer | 150 | Aerated concrete | 500 | 0.329 |
| Insulation layer | 18 | Polystyrene | 35 | 0.021 |
| Buried pipe layer | 15 | Polythene | 962 | 0.30 |
| Filling layer | 45 | Cement mortar | 1080 | 0.90 |
| Screed layer | 20 | Cement | 1800 | 0.93 |
| Surface layer | 12 | Marble | 2800 | 2.91 |
Table 3.
Summary of the experimental instrument operating parameters.
Table 3.
Summary of the experimental instrument operating parameters.
| Parameters | Instruments | Range | Accuracy | Sampling Frequency |
|---|
| Room air temperature | Temperature and humidity meter | −20~80 °C | ±0.5 °C | 30 s |
| Room air relative humidity | Temperature and humidity meter | 0~100% | ±3% | 30 s |
| Floor surface temperature | PT100-type thermometer | −100~300 °C | ±0.5 °C | 2 s |
| Ventilation air temperature | Air multi-parameter meter | −10~60 °C | ±0.3 °C | 30 s |
| Ventilation air relative humidity | Air multi-parameter meter | 0~100% | ±3% | 30 s |
| Ventilation air velocity | Air multi-parameter meter | 0~10 m/s | ±0.015 m/s | 30 s |
| Wall and ceiling temperature | PT100-type thermometer | −100~300 °C | ±0.5 °C | 2 s |
| Water temperature | PT100-type thermometer | −40~125 °C | ±0.5 °C | 2 s |
| Water flow rate | Flow meter | 0~3.0 m3/h | ±0.5% | 2 s |
Table 4.
Accuracy and uncertainty of measured parameters.
Table 4.
Accuracy and uncertainty of measured parameters.
| Parameters | Instruments | Uncertainty |
|---|
| Room air temperature | Temperature and humidity meter | 0.29 °C |
| Room air relative humidity | Temperature and humidity meter | 1.7% |
| Floor surface temperature | PT100-type thermometer | 0.29 °C |
| Ventilation air temperature | Air multi-parameter meter | 0.17 °C |
| Ventilation air relative humidity | Air multi-parameter meter | 1.7% |
| Ventilation air velocity | Air multi-parameter meter | 0.009 m/s |
| Wall and ceiling temperature | PT100-type thermometer | 0.29 °C |
| Water temperature | PT100-type thermometer | 0.29 °C |
| Water flow rate | Flow meter | 0.29% |
Table 5.
Outdoor weather conditions classification table.
Table 5.
Outdoor weather conditions classification table.
| Condition No. | Experiment Time | Temperature and Humidity Characteristics | Temperature Range (°C) | Humidity Range (%) | Meteorological Conditions |
|---|
| 1 | 20 August 2021
20 August 2021 | LH | 21~29 | 74~94 | Overcast |
| 2 | 11 September 2021
12 September 2021 | HL | 24~38 | 42~90 | Sunny |
| 3 | 19 August 2021
26 August 2021 | MM | 22~33 | 50~88 | Cloudy |
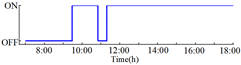
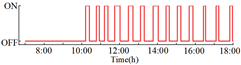
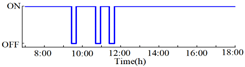
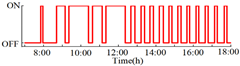
Table 6.
Summary of the combined cooling system start/stop strategy under different outdoor weather conditions.
Table 7.
Predicted mean vote index.
Table 7.
Predicted mean vote index.
| Thermal Sensation | Hot | Warm | Slightly Warm | Neutral | Slightly Cool | Cool | Cold |
|---|
| PMV value | +3 | +2 | +1 | 0 | −1 | −2 | −3 |
| Publisher’s Note: MDPI stays neutral with regard to jurisdictional claims in published maps and institutional affiliations. |
© 2022 by the authors. Licensee MDPI, Basel, Switzerland. This article is an open access article distributed under the terms and conditions of the Creative Commons Attribution (CC BY) license (https://creativecommons.org/licenses/by/4.0/).


