Article

Study on Wind Loads of Different Height Transmission Towers under Downbursts with Different Parameters

1
School of Civil Engineering, Chongqing University, Chongqing 400045, China
2
School of Civil Engineering, Henan University of Science and Technology, Luoyang 471023, China
*
Author to whom correspondence should be addressed.
Buildings 2022, 12(2), 193; https://doi.org/10.3390/buildings12020193
Submission received: 30 December 2021 / Revised: 26 January 2022 / Accepted: 5 February 2022 / Published: 8 February 2022

Abstract

:
Disaster investigation results have shown that most wind-induced damage to transmission towers is related to downbursts. To clarify the effects of downbursts’ parameters on transmission towers with different heights, studies were conducted on five transmission towers with different diameters under static and moving downburst wind conditions. As a comparison, the responses of the towers under normal wind conditions were studied. The results showed that the effect of downbursts on the response of the transmission tower increased with the distance between the downburst center and the tower (r) when r < 1.0 Djet (Djet is the jet diameter of downburst) and then decreased when r > 1.0 Djet. The effects of jet diameter on the response of transmission towers with different tower heights were similar. As the jet diameter increased, the response of the tower continued growing until it reached a peak value and then steadily decreased soon thereafter. When the tower height was below 81.5 m, the wind load of the downburst on the transmission tower was significantly greater than that of the normal wind. As the tower height increased, the ratio of the transmission tower’s response under the two types of wind fields rapidly declined to about 0.91–1.01.

1. Introduction

Modern life is inseparable from electricity. Without all kinds of electrical equipment, society cannot function properly. Transmission lines undertake the important task of transmitting electricity [1]. The economic and social impact of the destruction of transmission lines is enormous [2]. As the demand for power supply continues to grow, however, tower height needs to increase above the terrain and transmission lines need to be able to deploy energy over long distances. This increase in the height of transmission towers makes these structures more sensitive to wind loads [3], and the wind-induced response becomes more pronounced. With increases in transmission distance, the probability of damage to the transmission tower line structures becomes higher under harsh weather and topographic conditions [4]. The normal operation of transmission lines poses serious safety hazards [5,6].
The United States, Canada, and other countries have summarized and analyzed the accidental collapse of transmission towers. One study identified that more than 80% of the transmission tower damage accidents caused by weather factors were directly related to downbursts [7]. Downburst is a disaster involving short-term strong winds near the ground that are formed by high air current hitting the ground and then spreading along the ground in a thunderstorm. Probability of extreme wind events encountering tower is low, but transmission lines cross extremely long distances. The possibility of transmission tower being destroyed by downbursts has increased significantly.
Many studies on the mechanical behavior of the transmission tower line system under downburst conditions have been conducted. Based on two high-intensity wind events, Savory [8] noted that only a more broad-fronted downburst could cause damage to the transmission tower. By using a deterministic–stochastic hybrid model of downbursts, Chen and Letchford [9] analyzed the sensitivity of the response to the coherence function. Shehata [10,11,12] introduced a finite element model for whole-guyed transmission lines under downburst and provided a reference for the wind load design of transmission towers. Subsequently, they studied the structural behavior of a tower in the most unfavorable conditions by changing the wind field of the downburst. Chay [13] studied the wind-induced response of transmission towers under downburst and compared the results with the equivalent static response of various transmission tower design codes. Some scholars have studied the failure of transmission towers under downburst. Yang [14] analyzed downburst wind loads on two typical transmission towers in the inland and coastal areas, and thoroughly explored the factors that should be considered in the design of transmission towers in different regions. Damatty [15] proposed a failure model for the collapse of a transmission tower based on numerical simulation and gave a method that could predict the structural parameters of the downburst storm corresponding to the most unfavorable conditions when a tower falls. They also proposed three typical conditions that need to be considered in the design of the lower pole tower under downburst. Qu [16] studied the weak parts and failure characteristics of a transmission tower under downburst by carrying out elastoplastic dynamic analysis on the transmission tower and simulated the failure process of the transmission tower. Wang [17] used shell elements or solid elements to simulate the potential failure parts of the tower and proposed a multiscale finite element model of the transmission tower for failure analysis under the action of downburst. Compared with traditional beam element modeling, the multiscale finite element model achieved higher accuracy. Damatty and Elawady [18] conducted extensive parametric studies on transmission lines and evaluated their critical response to downburst loads. Although the relevant parameters of critical downburst were given, the relationship between the response of different transmission towers and the wind field parameters has not been described further. Elawady [18,19] conducted aeroelasticity tests on multi-span transmission lines under the downburst in the WindEEE dome, which showed very good agreement between the critical configurations of the downburst obtained from the experiment compared with those predicted previously by different numerical studies. These studies have focused mainly on response analysis, stability research, and collapse and failure process of a specific transmission tower, but rarely have they involved the influence of structural parameters. Actually, different transmission towers have different wind resistance. How to choose the appropriate tower is really important to engineering applications.
To adapt to the terrain, transmission towers are set to different heights. As shown in Figure 1, the average wind speed of normal wind and downburst at different heights varies greatly. The average wind speed of downburst in the near-surface area is greater than that of normal wind, and the average wind speed of normal wind is higher at higher places. The most unfavorable loading conditions corresponding to each height of the transmission tower are different and need to be determined by parameter analysis. In this study, the relationship between the transmission tower’s parameters and the wind field was further explored. Section 2 and Section 3 introduce the numerical models, including the downburst wind field model, the generation method of the unsteady downburst wind, and the self-supported transmission tower model. Next, Section 4.1 studies the relationship between the jet diameter of the downburst and different transmission towers by analyzing the response of the structure. Referring to the boundary layer wind field, Section 4.2 analyzes the response of the transmission tower under the two wind fields. Last, Section 4.3 compares the response of the transmission tower under steady-state and unsteady-state downburst conditions.

2. Wind Load Model and Parameters

2.1. Wind Field Model

2.1.1. Boundary Layer Wind

At present, the two types of wind profile of boundary layer wind are the logarithmic and exponential ones. The logarithm law indicates that the average wind speed of normal wind is more ideally distributed along the height direction. The logarithm law was used in this study. The specific expression can be expressed as follows:
U U 10 = ln z / z 0 ln 10 / z 0
where U represents the mean velocity at height z; U10 denotes the mean velocity at 10 m height; and z0 is the length of the ground roughness.

2.1.2. Downburst

Downburst is nonstationary random process. Considering its movement, the wind speed U z , t at any point in the wind field can be expressed as follows:
U z , t = U ¯ z , t + U ˜ z , t
where U z , t is the average wind speed of downburst; and U ˜ z , t is the pulsating wind speed of downburst.

Mean Wind

Chen [9] assumed that the average wind speed of downbursts at different heights reached its maximum value at a certain moment when the time function f(t) was equal to 1. Then the mean wind velocity of any time at any height could be factorized as the product of a vertical profile and a time function, as follows:
U ¯ z , t = V z × f t
where V(z) is the vertical profile of the maximum mean wind speed; and f(t) is a time function with its maximum value of 1, which describes how the mean evolves with time.
From the perspective of fluid mechanics, some scholars have proposed a series of analytical models of downburst wind profiles following the form of normal wind profile. The Wood [20] model was used to simulate the mind wind speed profile. The model can be expressed as follows:
V z = 1.55 z δ 1 6 × 1 erf 0.7 z δ × V m a x
where δ is the height where the velocity is equal to half its maximum value; δ = 400; erf is the error function; erf x = 2 2 π 0 x e y 2 d y ; and V m a x is taken as 60 m/s, which is a reference wind speed similar to the design wind speed.
Holmes [21] considered that mean wind speed V c t at a certain point in the downburst wind field at any time is the vector of the radial wind speed V r t of the downburst and the storm center moving speed V t , as follows:
V c t = V r t + V t
where V r t can be expressed as follows:
V r t = r r V r r , t
V r r , t = V r , m a x · Π · r r m                                                                                         r < r m a x V r , m a x · Π · exp r r m a x / R r 2               r r m a x
where R r is the characteristic distance of the downburst; r m is the distance from the radial position where the maximum horizontal wind speed appears to the center of the downburst; Π is the intensity factor. The form is as follows:
Π =       t T m a x                                                                 0 t T m a x exp t T m a x T t o t a l                                     t > T m a x
where T m a x is the time from the start of the downburst to the maximum outflow intensity; and T t o t a l is the total duration of the downburst.
The mean wind speed of downbursts is often greater than the moving speed of the storm. If the change in the direction of the average wind speed of the downburst caused by the movement of the storm is neglected, the time function f(t) of the average wind speed can be expressed as follows:
f t = V c t m a x V c t

Turbulent Wind

Affected by turbulence, the fluctuating wind speed of the moving downburst is a nonstationary random process that changes with time. Chen [9] utilized the evolutionary power spectral density function (EPSD) to model this fluctuation. They assumed that the frequency structure of the fluctuation did not change with time. Therefore, the fluctuation can be obtained by amplitude-modulating some stationary process with some PSD:
U ˜ z , t = k z , t σ z , t
In this formula, k z , t is a stationary Gaussian process with a mean value of 0 and a variance of 1. Its power spectral density function can be expressed as follows:
S 0 z 1 , z 2 , n = S 0 n c o h z 1 , z 2 , n
where n is the frequency (Hz); and S 0 n can use normalized pulsating wind Kaimal spectrum:
S 0 n = u * 2 200 f n 1 + 50 f 5 / 3
where u * is the friction speed; f = n Z / U z i ; and U z i is the time-varying average wind speed at the corresponding height of the downburst. The coherence function c o h n , z 1 , z 2 can adopt the vertical coherence function proposed by Davenport, and its expression follows:
c o h z 1 , z 2 , n = exp C z 1 z 2 n U ¯ 10
In the equation, the attenuation factor can be C = 16. Similar to the benign wind in the boundary layer, the root mean square σ z , t of the fluctuating wind speed of the downburst can be regarded as constant along with the height, expressed as follows:
σ t = U ¯ 10 t I 10
where I 10 is the degree of turbulence at a height of 10 m. Referring to the Chinese standard, I 10 = 0.14 for type B landforms, we define the nonstationary uniform modulation function a t not more than 1 as follows:
a t = U ¯ 10 t / U ¯ 10 max
where U ¯ 10 max is the maximum value of the time-varying average wind speed at a height of 10 m from the downburst. The cross spectrum of nonstationary pulsating wind speed acting on the tower is as follows:
S z 1 , z 2 , n , t = a 2 t I 10 U ¯ 10 max 2 S 0 n c o h z 1 , z 2 , n

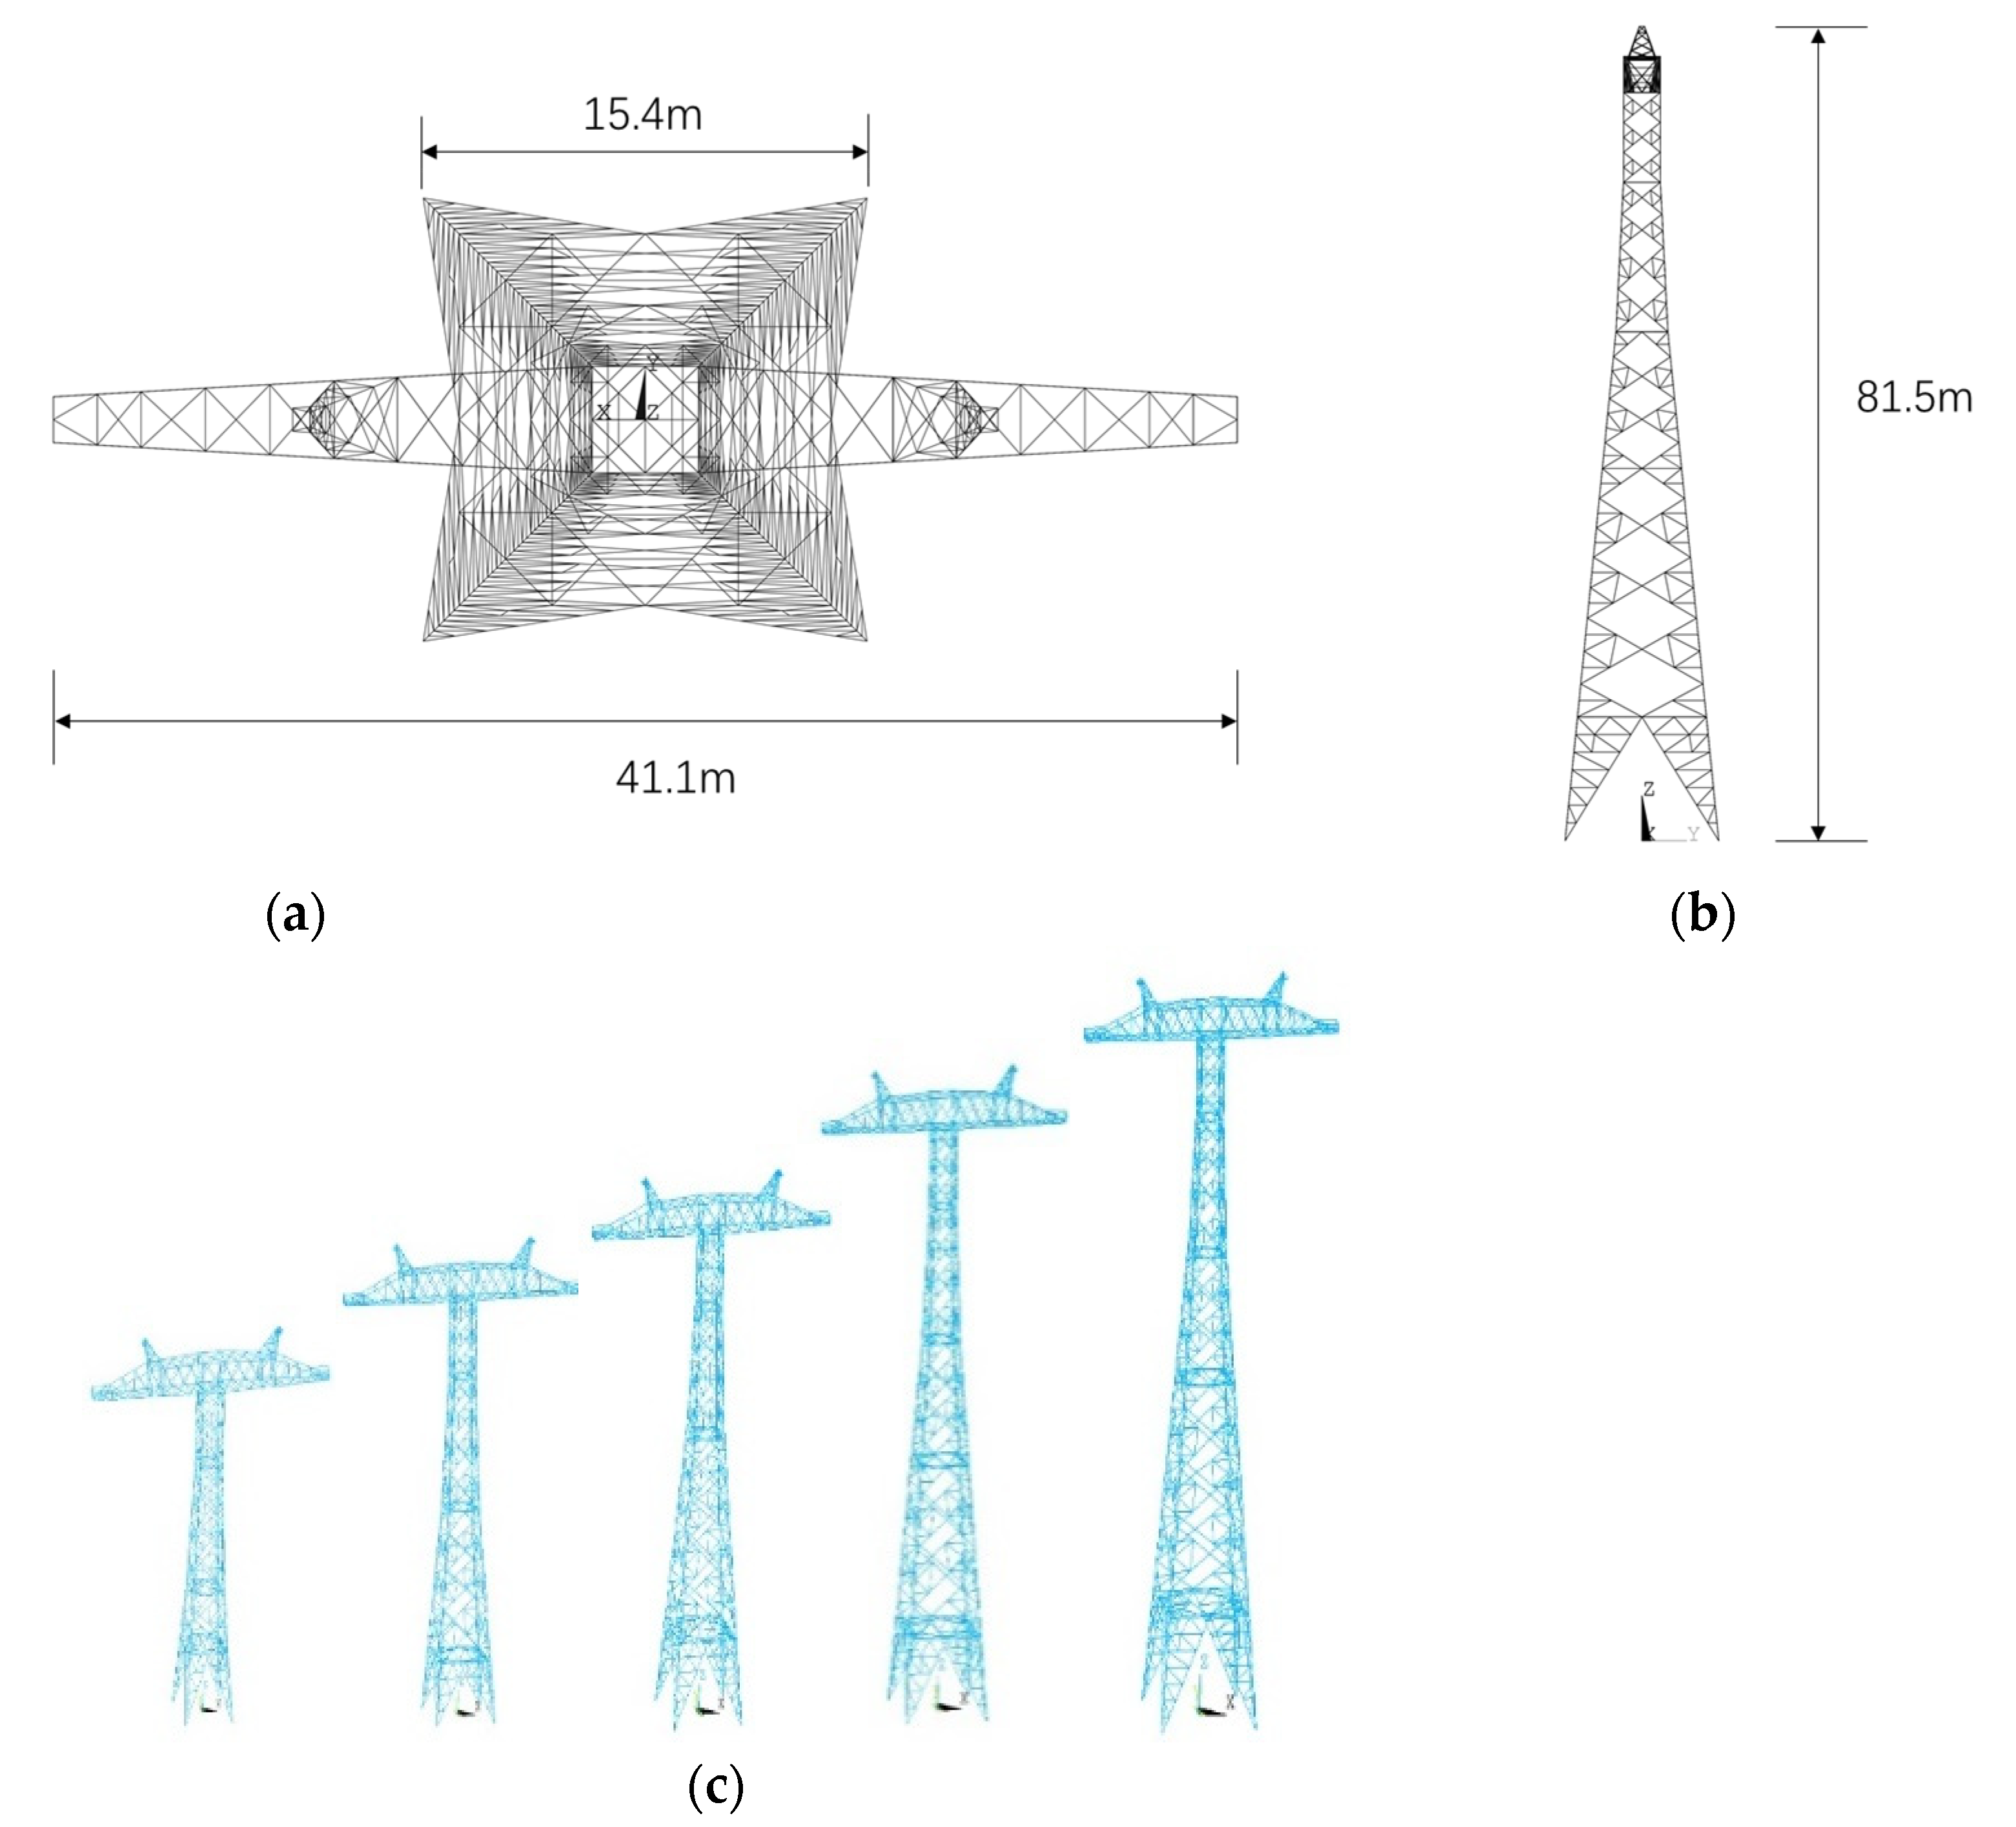
3. Transmission Tower Model Parameters

In this study, five different height transmission towers in a ±800 kV UHV DC transmission line were selected as the research objects. The parameters of the transmission towers are listed in Table 1. The basic characteristics of the transmission tower were as follows: the main material of the tower body was Q420 and Q345 equilateral angle steel, and the other finishing materials were Q235 equilateral angle steel. The main material specifications were L200 × 24, L200 × 16, and L200 × 16. The finishing materials were L75 × 5, L80 × 6, and L56 × 5. Elastic modulus was E = 2.06 MPa, Poisson’s ratio was ν = 0.3, and density was ρ = 7850 kg/m
According to the Chinese code for the design of ± 800 kV DC overhead transmission lines, the shape factor (μs) of the angle-steel tower is 1.3(1+η). η is the reduction factor of the leeward surface of the tower, and the value is taken according to Table 2. As is the projected area of the windward surface component. A is the outline area of the tower. a is the width of the tower’s windward side. b is the distance between the windward and leeward sides of the tower. In this paper, μs of towers 1, 2, 3, 4 and 5 are 2.46, 2.48, 2.47, 2.51 and 2.48, respectively.
In this study, the transmission towers were modeled by ANSYS. The transmission tower rods were simulated by the BEAM188 unit, which is a three-dimensional linear unit and was suitable for analyzing slender to medium-thick beam structures. BEAM188 has six or seven degrees of freedom, and the change in the number (degrees of freedom) is controlled by KEYOPT(1). When KEYOPT(1) = 1, a seventh degree of freedom (warpage) is added. In this paper, the warping in the finite element analyses wasn’t considered.
The finite element model of the transmission tower is shown in Figure 2.

4. Calculation Results and Analysis

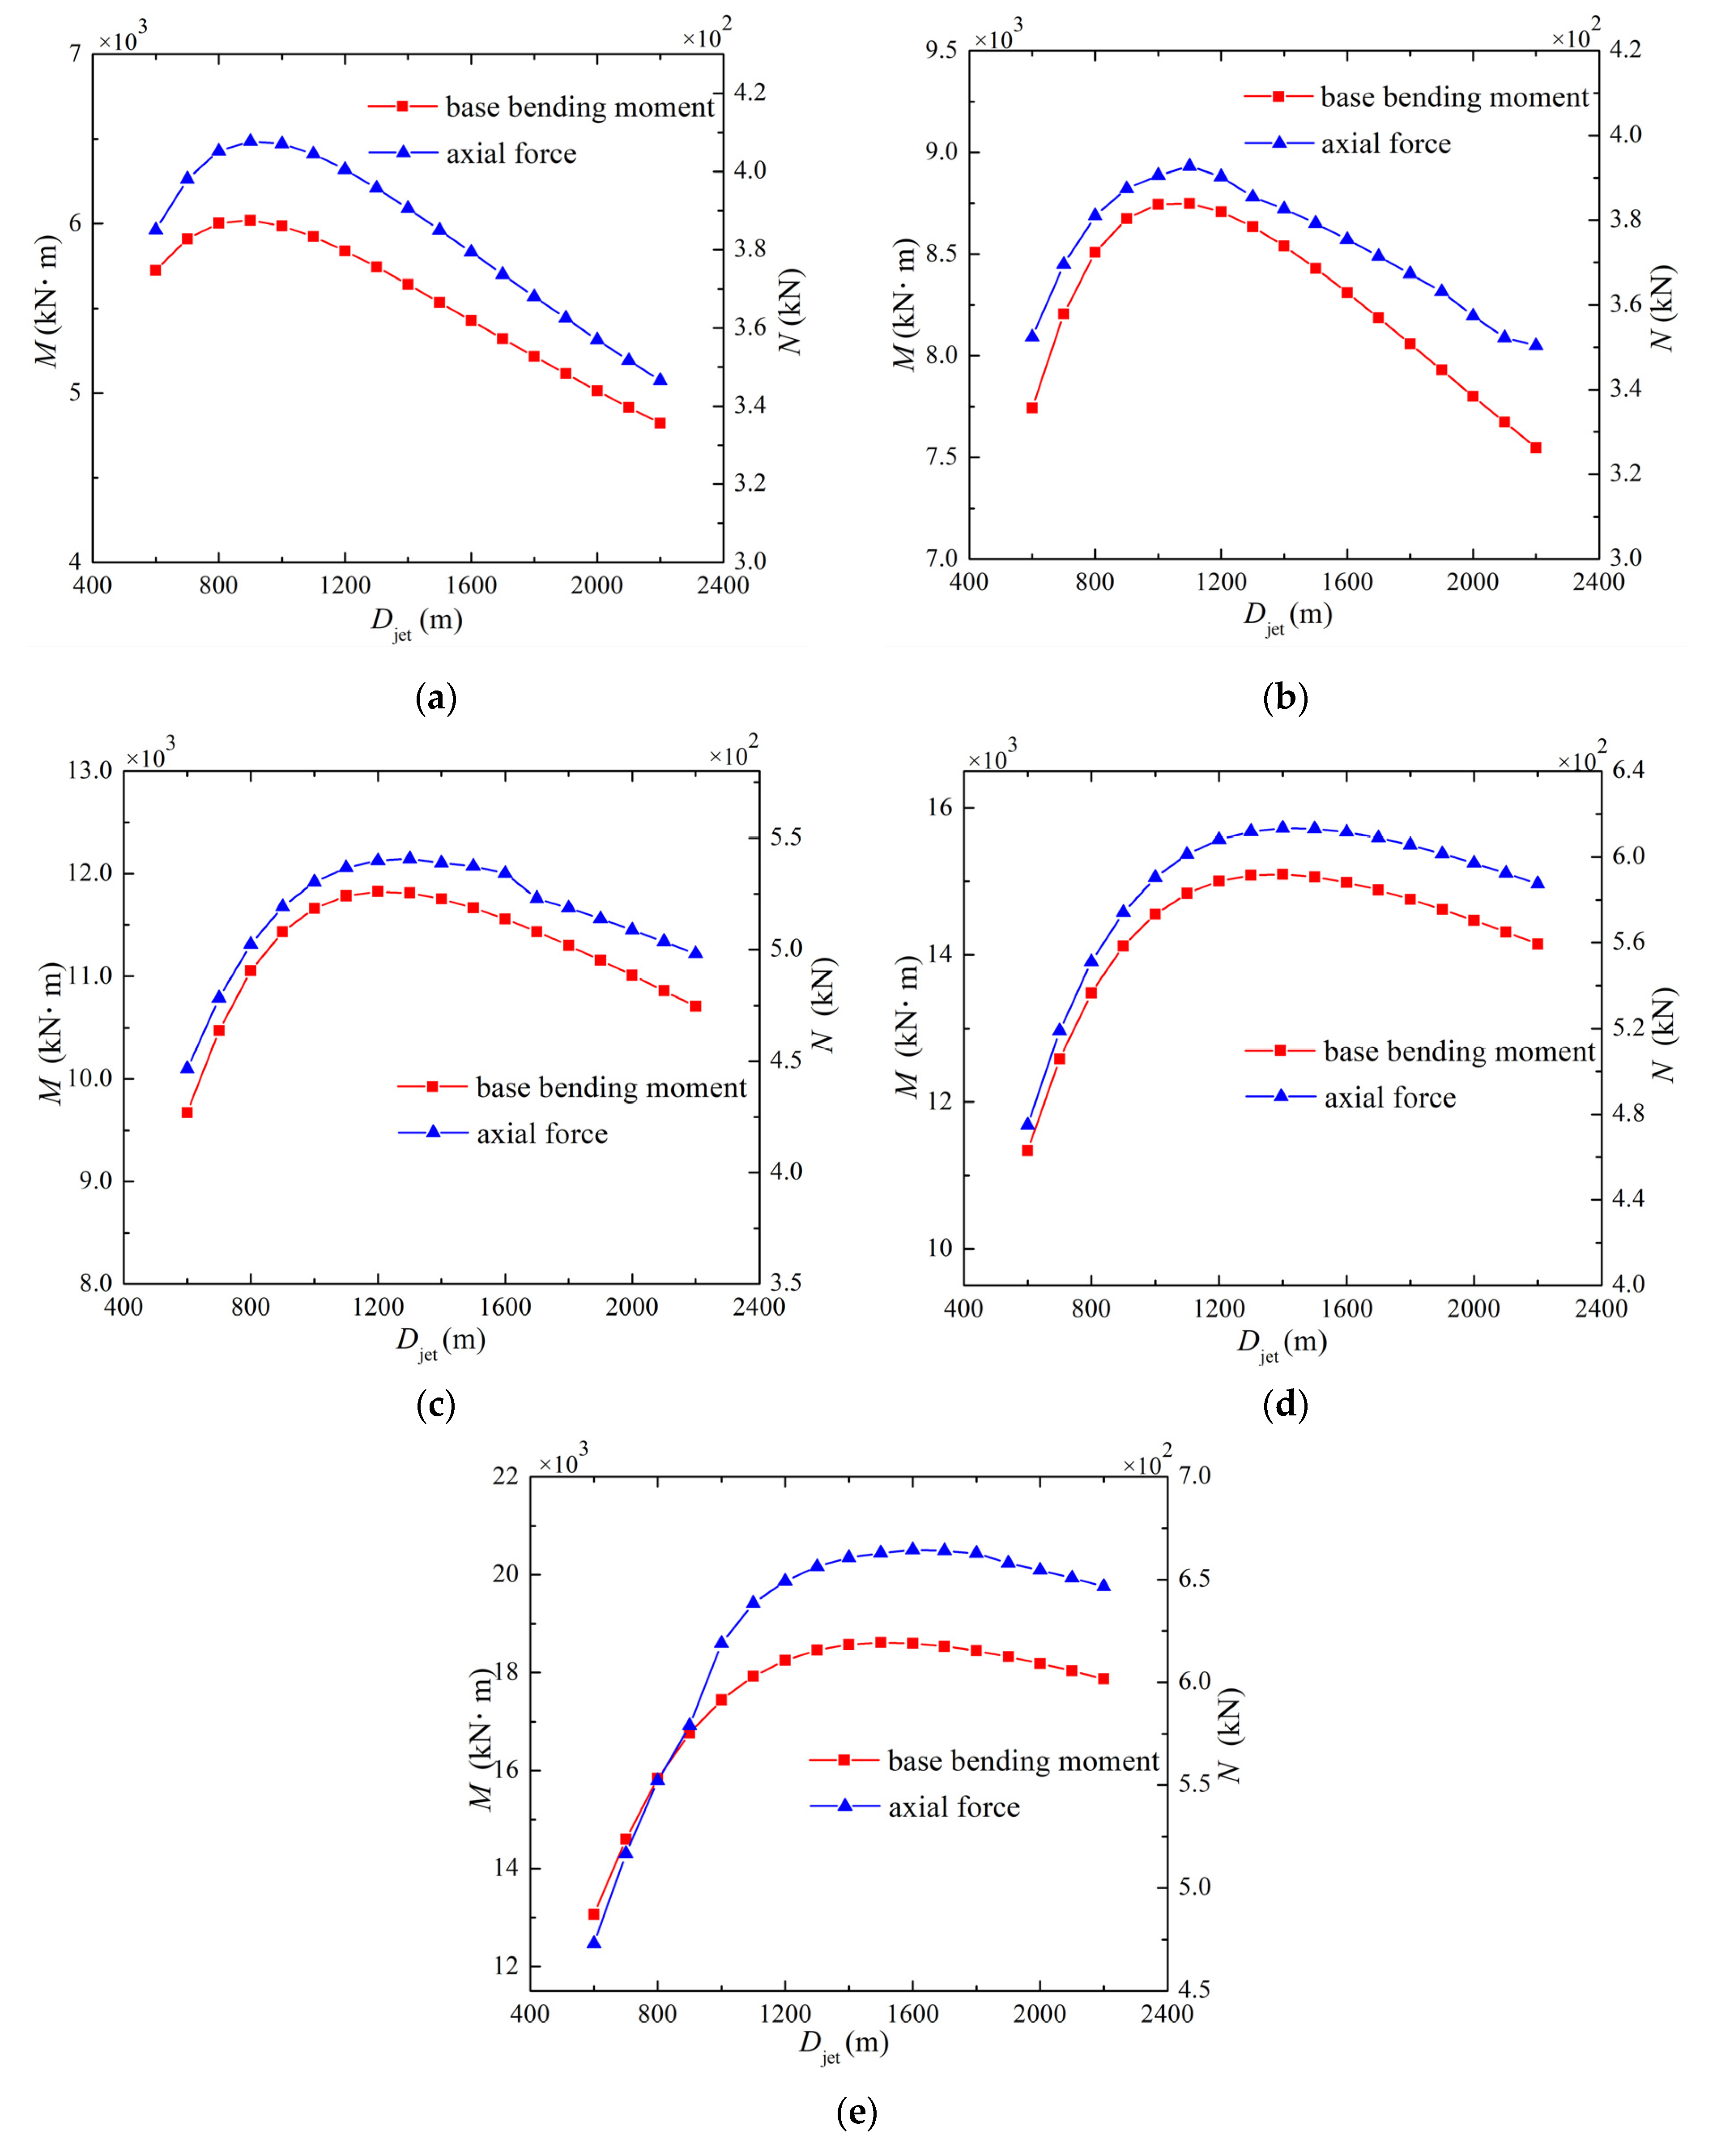
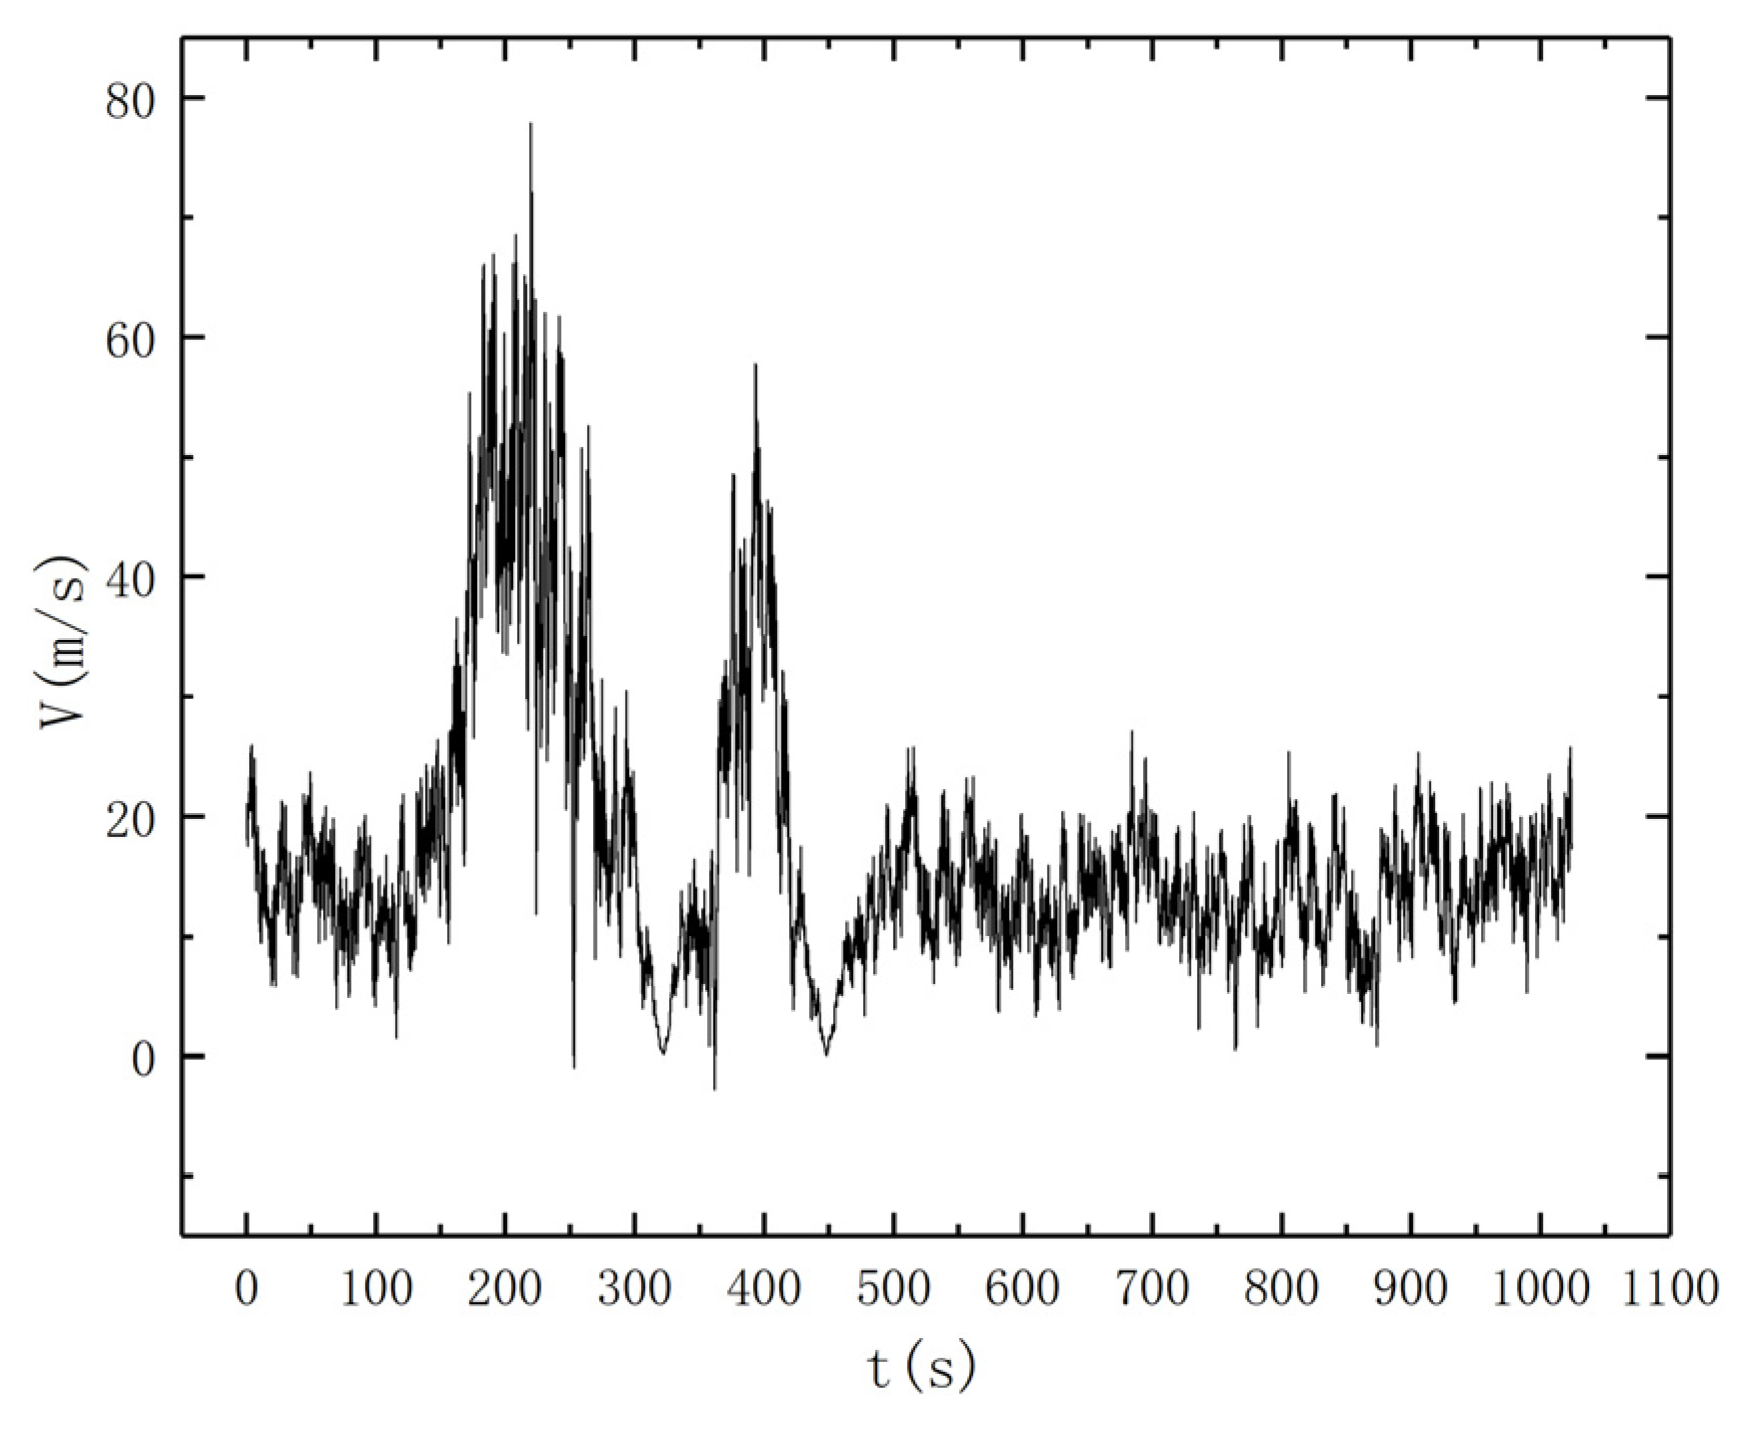
4.1. Wind Field Parameter Analysis

The occurrence of downbursts has a strong random characteristic. The speed parameters and shape parameters of the downbursts that occur each time are different.
Downburst wind loads acting on the transmission tower mainly change with the different downburst’s outflow parameters and the cylindrical coordinate position (r, α) of the downburst center relative to the center of the transmission tower.
Figure 3a shows the transmission tower and the downburst location. The parameters affecting the wind load of the transmission tower mainly included the following: the radial distance (r) of the transmission tower from the storm center and the wind direction angle (α), and the jet diameter of the downburst (Djet).
In this part, the downburst wind field is steady. The radial distance r = 1.0 Djet, the wind direction angle α = 0° and the jet diameter of the downburst Djet = 800 m. The r and Djet were changed independently, while keeping the other factors unchanged.
Figure 4 shows the curve of the transmission tower base’s bending moment and the main material’s axial force with the radial distance. The main material’s force is the maximum axial force of the entire tower which was at bottom of tower. With the increase of the radial distance, the base bending moment and main material axial force increased firstly and then decreased in the range of r is 0.5–2.0 Djet. The maximum value is about two to four times the minimum. With an increase in tower height, the influence of the radial distance on the bending moment and the axial force value became increasingly greater and greater. For towers 1 and 2, the force reaches the peak at r of 1.0 Djet, while the forces of towers 3, 4 and 5 reach an extreme value at r of 0.9 Djet.
Figure 5 compares the change law of base bending moment and main material axial force with jet diameter for different tower heights. When the height of the transmission tower was small, the jet diameter had a small influence on the internal force of the transmission tower caused by wind load. In the range of Djet = 600–2200 m, the maximum base bending moment was about 1.25 times the minimum. As the height of the tower increased, the load on the transmission tower was increasingly affected. The maximum base bending moment of tower 5 was about 1.43 times the minimum. This reflected the fact that within a certain range, the greater the height of the transmission tower, the more sensitive it was to the parameters of the downburst wind field. Within a certain range, with the increase of Djet, the base bending moment of the transmission tower also increased until the peak was reached.
It is found that all towers reach their peaks at jet diameters of 900, 1100, 1300, 1400, and 1600 m, respectively. After that, if the jet diameter continues to increase, the base bending moment and main material axial force of the transmission tower gradually decrease.

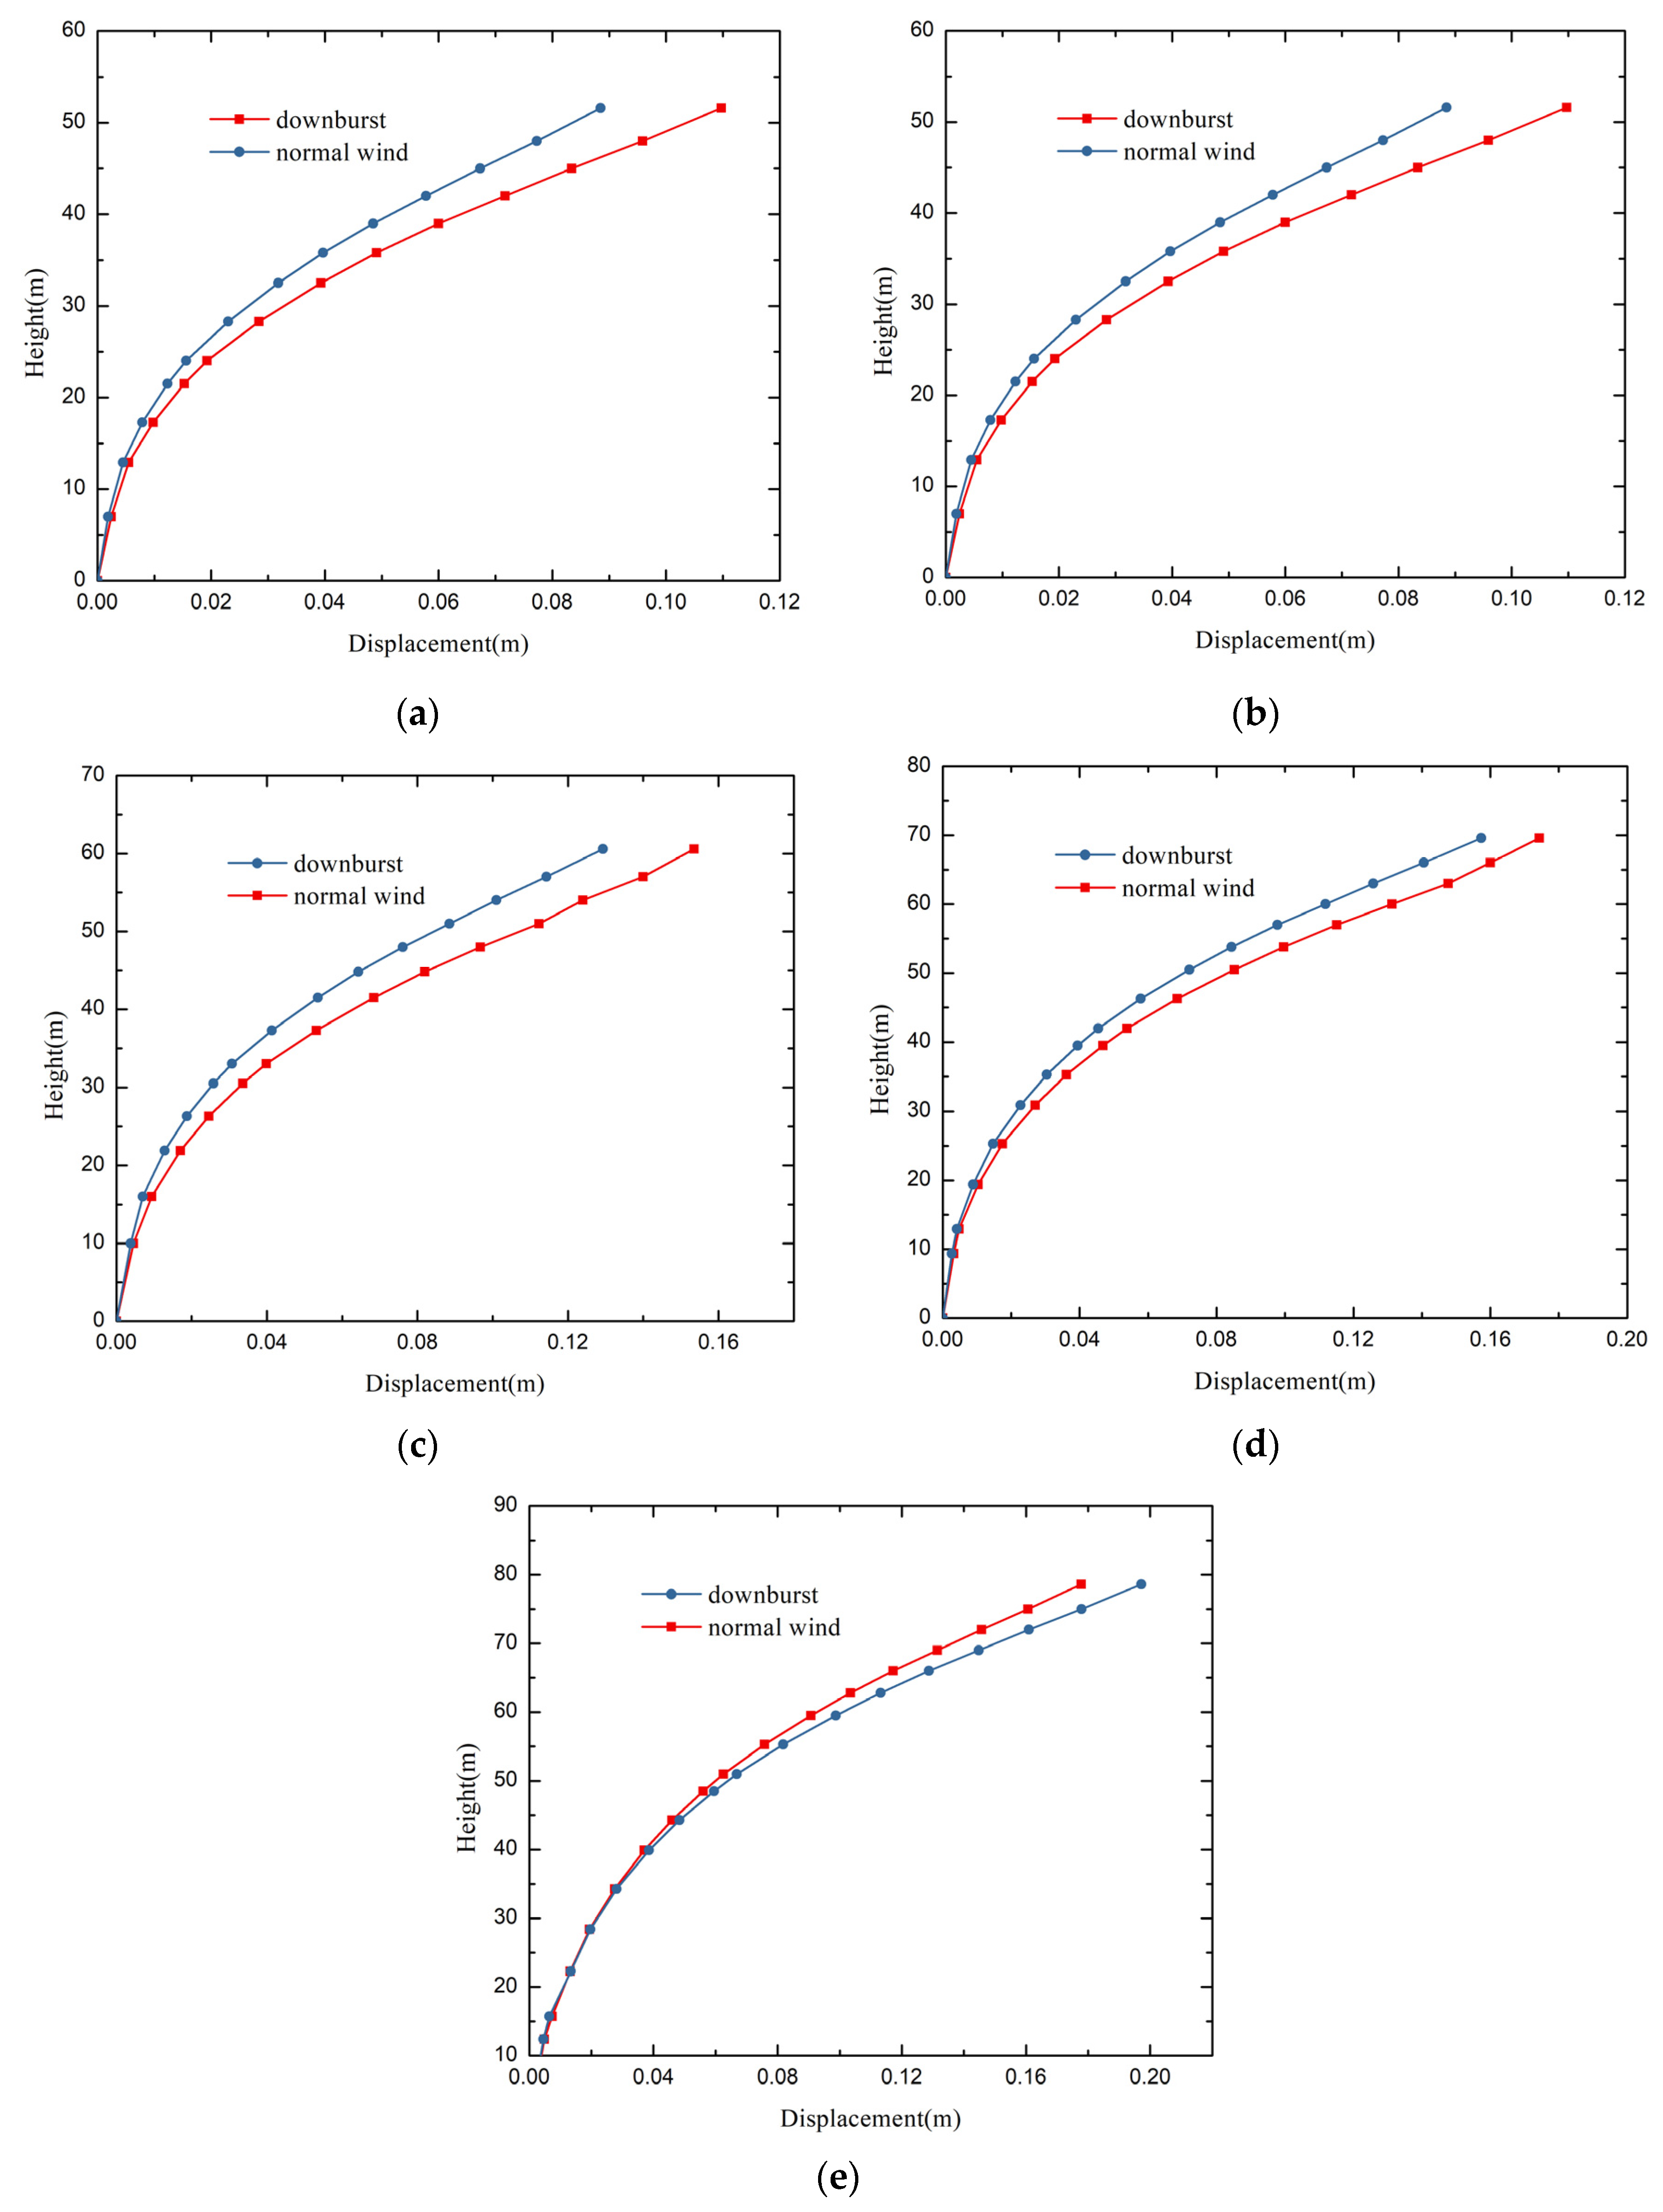
4.2. Comparison of the Effects of Downburst and Ordinary Boundary Wind

Under the action of the downburst, most of the damage occurred above the root of the tower. Therefore, it is necessary to compare the wind load and response of the transmission tower under the action of the two types of wind fields when designing the wind resistance of a transmission tower [22]. The reference wind speed at 10 m height of the atmospheric boundary layer wind was 28.3 m/s, and the wind direction angle was 0°.

4.2.1. Static Response

The base bending moment and main material axial force values of transmission towers at different heights under two types of wind fields are shown in Table 3 and Table 4.
Compared with the response of the tower under the boundary layer wind, the base bending moment of tower 1 under the downburst increased 45%. As the height of the tower increased, the ratio of base bending moment under two types of wind fields decreased. The base bending moment of tower 5 under two types of wind fields was almost the same. The change law of the main material’s axial force was the same as that of the base bending moment, and the main material’s axial force of tower 5 under the boundary layer wind was greater than that under the downburst. This law could be confirmed by Figure 1. At lower part, the velocity of downburst is much faster than the normal wind. Until the velocity of downburst reached its peak, the velocity difference between the two gradually decreased until it converged. Actually, wind speed dominated the response of transmission tower, so that the greater the height of the transmission tower, the closer the wind load of the downburst on tower was to the normal wind.

4.2.2. Dynamic Response

Table 5 shows the peak displacement response of the transmission tower top under the downburst and boundary layer wind. Under the downburst conditions, the top displacement response of the tower ascended as the height of the transmission tower went up, and the increase in displacement was nonlinear with the rise in tower height. As the height of the tower increased, the impact of downburst wind on the wind load of the transmission tower became smaller; under the boundary layer wind, the displacement of tower 2 was 1.3 times that of the tower 1. This ratio changed less as the tower height increased. It’s showed that the increase in tower height and the top displacement of the tower raised almost linearly. In the tower height range of 45.5–72.5 m, the displacement of the transmission tower under the downburst was greater than that of the boundary layer wind, and the peak displacement of the tower 5 under the boundary layer wind was greater than that of the downburst. With an increase in tower height, the ratio of the peak displacement under the two types of wind fields declined, from 1.24 to 0.91.
Figure 6 shows the displacement response peaks distributed along with the tower height. For towers with a height of 45.5–72.5 m, compared with the boundary layer wind, the downburst caused greater deformation and displacement of the transmission tower and caused greater damage to the transmission tower. For the tower 5, the displacement distribution curves under the two types of wind fields almost overlapped in the lower part. In the upper part, the displacement of the transmission tower under the boundary layer wind was greater.
Table 6 shows the time history peak value of the axial force of the transmission tower’s main material under the two types of wind fields.
Comparing the peak axial force changes of different heights under the same wind field, it is found that the axial force value also raised nonlinearly with an increase in tower height. For downburst, as the transmission tower’s height went up, the trend of increasing the main material’s axial force is weakening. The 54.5 m tower had an increase of 16.7% relative to the 45.5 m tower, and the 81.5 m tower had an increase of 1.3% relative to the 72.5 m tower. Comparing the main material’s axial force of the 45.5–72.5 m tower under the two types of wind fields, we found that the axial force generated by the downburst was greater than the boundary layer wind, which had a greater effect on the wind load of the transmission tower. When the height of the tower was 81.5 m, the axial force of the main material produced by the boundary layer wind was greater than the downburst, which caused more damage to the transmission tower.

4.3. Comparison of the Effects of Unsteady and Steady Downburst

Affected by the boundary layer wind, the actual downburst is mobile. The movement of the storm will change the wind field and eventually affect the wind load on structures [23,24]. Therefore, to study the impact of the movement effect of the downburst, the static downburst wind field were replaced with moving downburst wind field for numerical calculations.
About the unsteady downburst, the touch down location d0 = 3600 m, the wind direction angle α = 0°, and the moving velocity of the unsteady downburst v = 12 m/s. Figure 7 shows the wind speed time series of unsteady downburst with Djet = 1000 m.
As moving downburst currents affected the transmission tower, the downburst center from the initial position continuously approached the transmission tower and then moved away. Figure 8a shows the time history of the wind field and the normalized time history of the internal force of the transmission tower. The data was processed by the moving average method, using 100 and 200 points averages in Figure 8a. FN is the main material’s axial force of transmission towers. FN gradually increased as the storm center approached. When r/Djet approached 1, FN reached its maximum value and then gradually decreased. When r/Djet approached 4.5, there was a second small peak, but it was not as large as the former peak. Figure 8b shows that the pulsating wind had a very large effect on the response. The pulsating wind also had two crests, and the position of the crests was similar to that shown in Figure 8a.
Figure 9 shows the change curves of the main material axial force, base shear force, and tower top displacement of the transmission tower under moving downbursts with different jet diameters.
Figure 9 shows that the responses of towers 1, 3, and 4 gradually decreased when the Djet was from 600 m to 1400 m. The response of tower 3 changed significantly and was reduced by about 25%. As the Djet continued to rise, the responses of towers 1, 3, and 4 continued to increase and reached extreme values when the Djet were 1800 m, 1900 m, and 1900 m, respectively. Among them, the extreme value of tower 3 was similar to its value when Djet was 700 m, and the extreme values of tower 1 and tower 4 were both the maximum values in this process. Figure 9a shows that the maximum top displacement of tower 1 and tower 3 was increased by 50% compared with the minimum. In Figure 9b, the maximum value of the main material axial force of tower 1 was nearly doubled compared with the minimum value. The response of the above three towers gradually decreased with an increase in the jet diameter after reaching the extreme value. Tower 5 and tower 2 gradually increased with an increase in Djet at the beginning. Tower 5 had a smaller extreme point when Djet was 1100 m, and then it reached the maximum value at Djet = 1700. Tower 2 had an extreme point when Djet was about 1200, and then decreased. Unlike other power transmission towers, the response of tower 2 continued to go up with an increase in Djet after the jet diameter reached 2200 m.
Compared with the response of the transmission tower under the static downburst wind field, the displacement and axial force value under the moving downburst were significantly increased. This conformed to the law of moving wind field, and the moving speed of downburst had a significant amplifying effect on the peak value. Though tower 2 had different response comparing with the others, the overall trend was still consistent with the laws that the higher the tower, the greater the response.
In general, this response was different from the regularity of static downburst. Under the moving downburst, the response of the transmission tower did not change significantly with Djet and it had two extreme points. Under static wind field, there was only one extreme point in response to the change of the jet diameter. Additionally, the moving effect of the wind field increased the Djet, which corresponded to the extreme value of the transmission tower.

5. Conclusions

Based on the above analysis results, the following conclusions can be drawn:
(1)
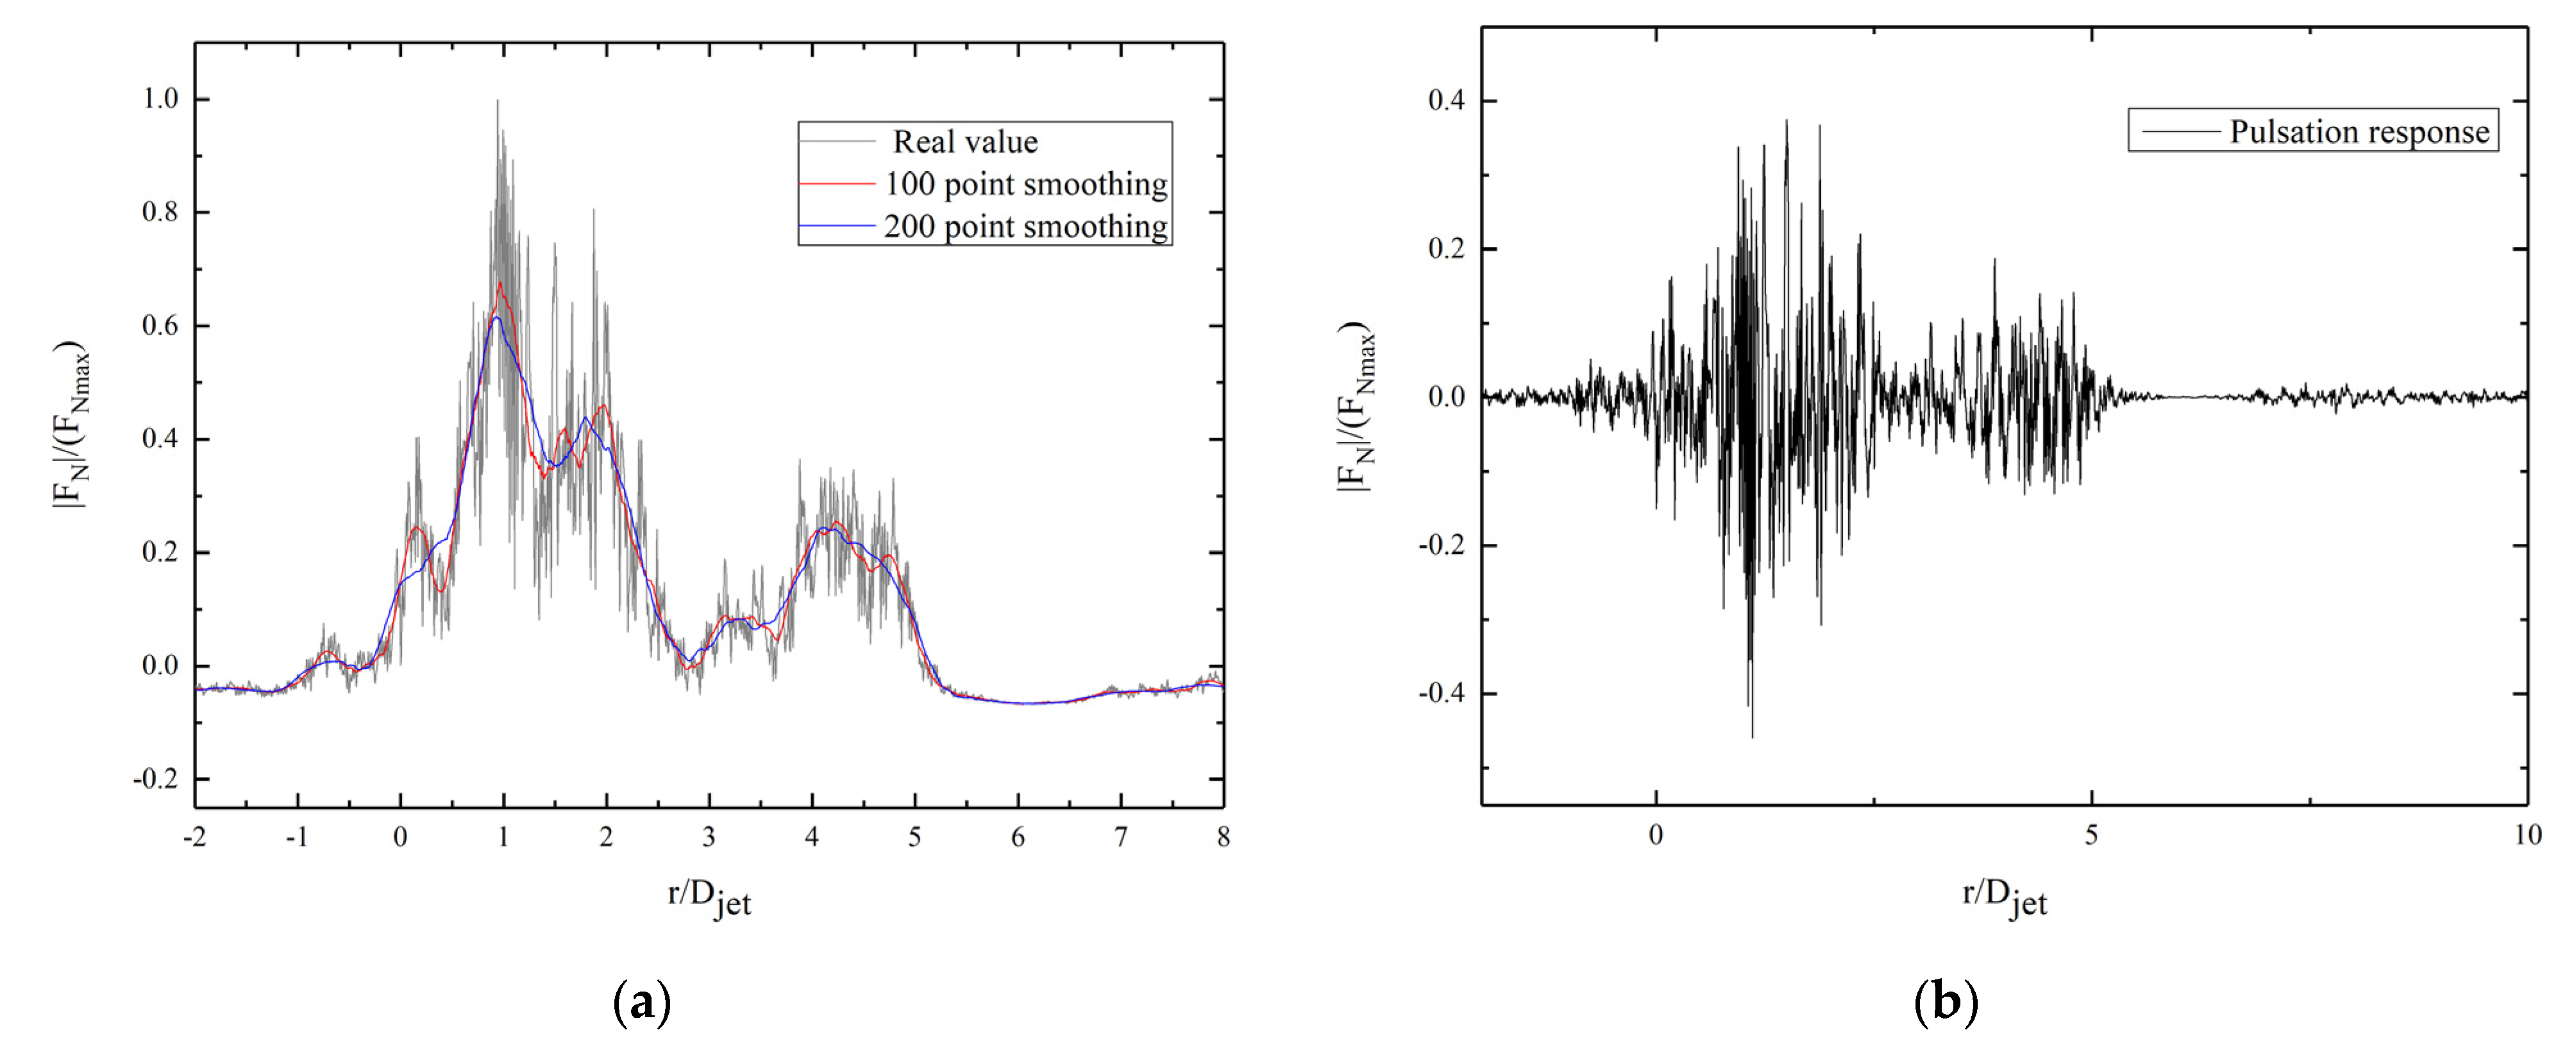
When the transmission tower was located near r = 0.9–1.0 Djet, the impact of the downburst wind load was the greatest.
(2)
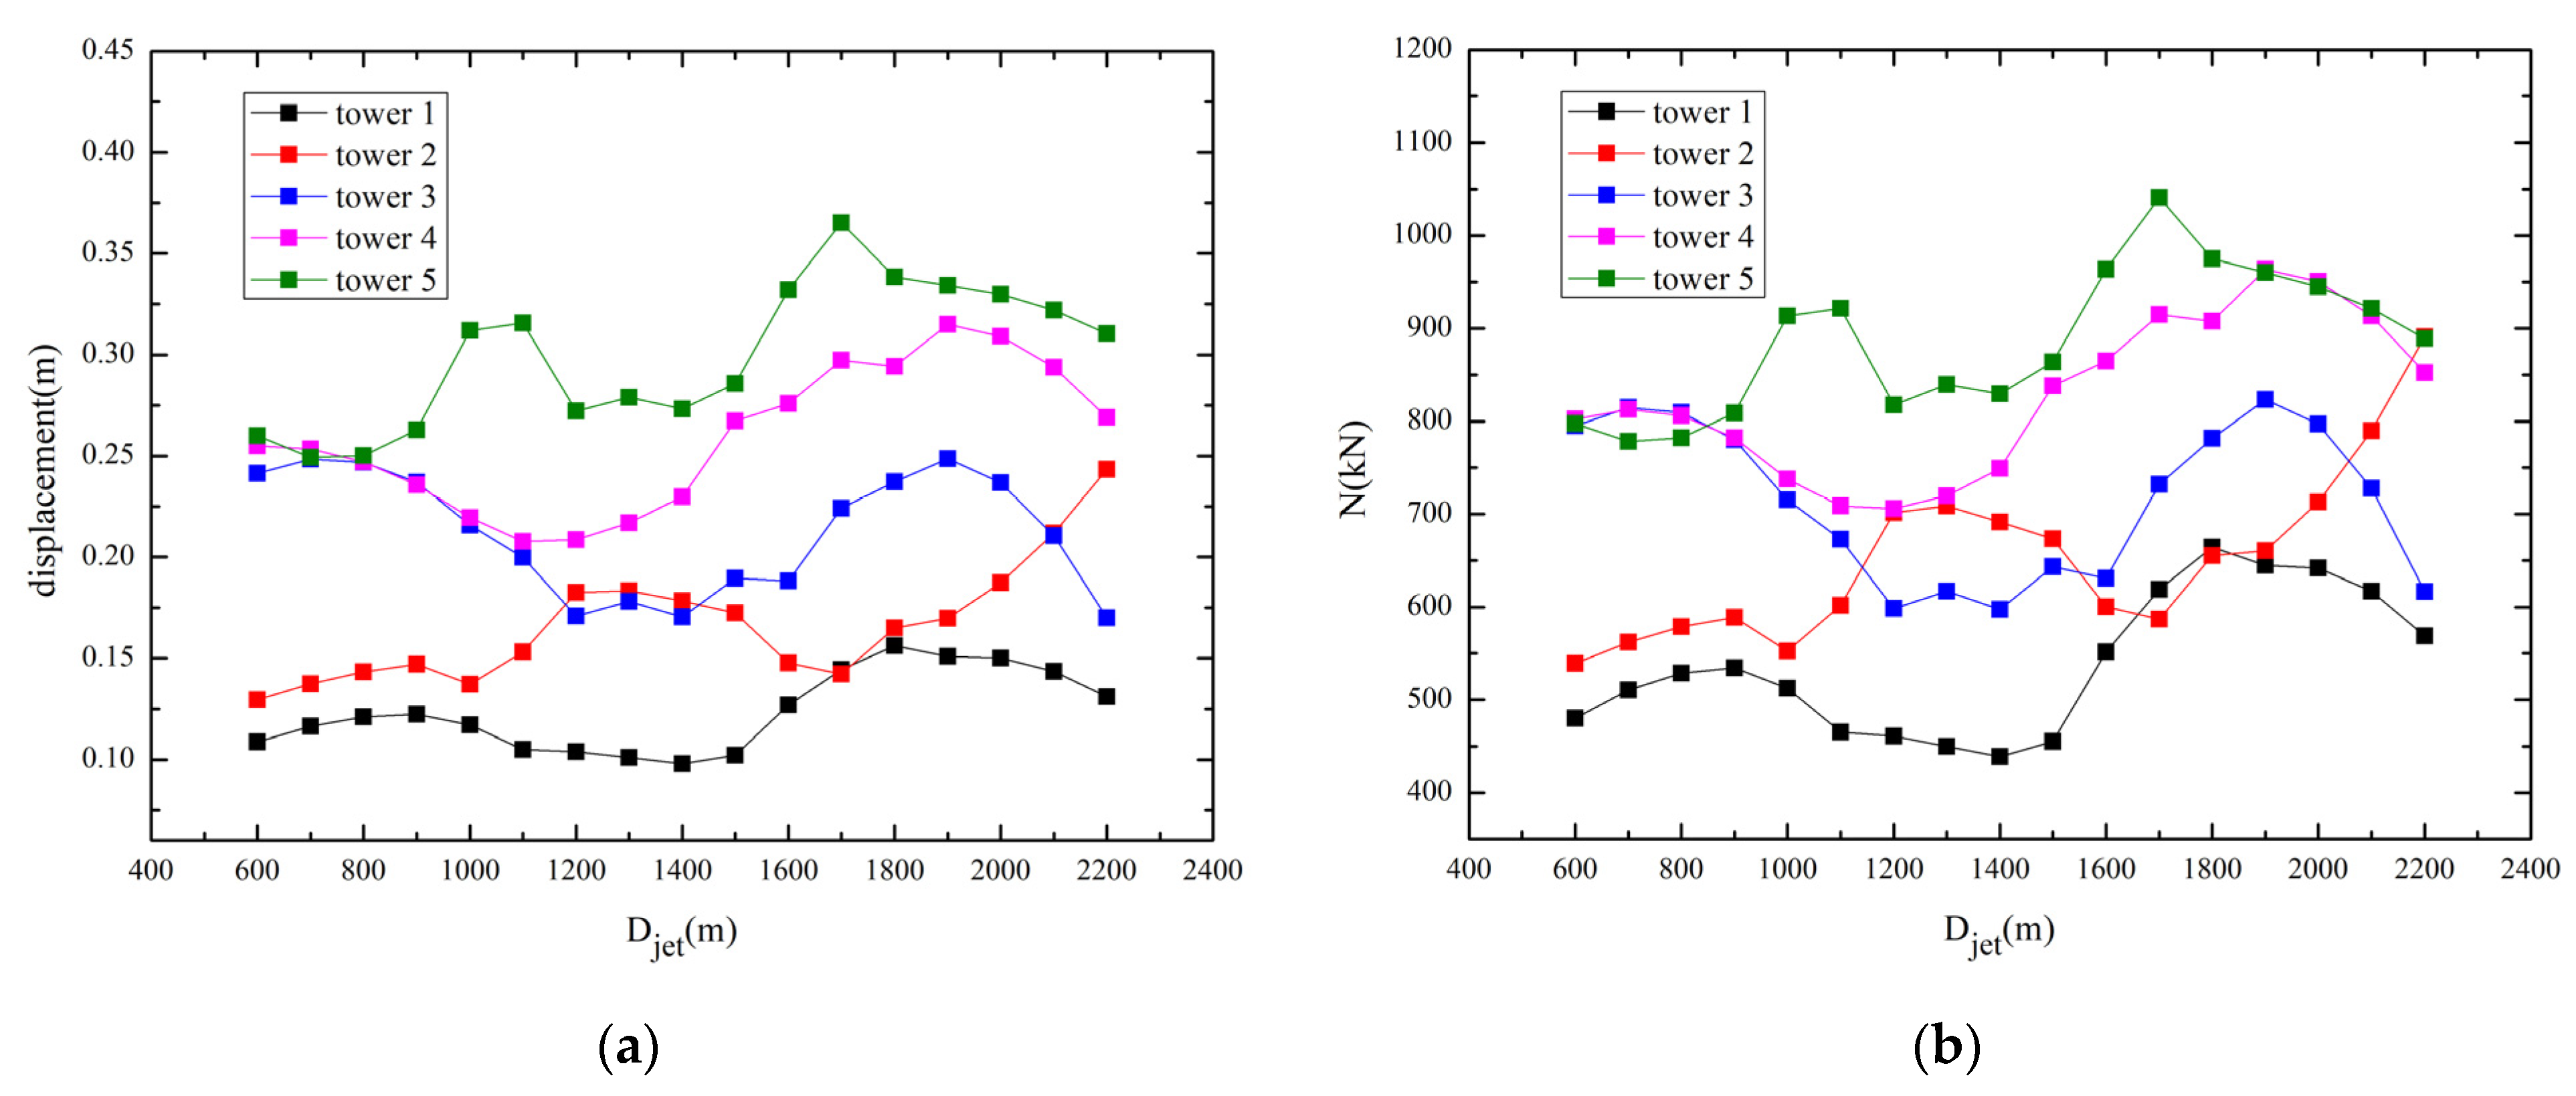
The wind load on the transmission tower first increased and then decreased with an increase in the downburst jet diameter. The jet diameter had similar effects on transmission towers of different tower heights, but the most unfavorable jet diameters of transmission towers with different tower heights were different. When r/Djet = 1.0, the most unfavorable jet diameters corresponding to towers with H = 45.5, 54.5, 63.5, 72.5 and 81.5 m were 900, 1100, 1300, 1400 and 1600 m, respectively.
(3)
When the height of the transmission tower was small, the downburst wind was more damaging to the transmission tower than the normal wind. The response ratio of the transmission tower under two types of wind fields was about 1.1 to 1.4. In the design, it is necessary to consider the effect of the downburst wind. When the transmission tower was taller, the normal wind was slightly more damaging to the transmission tower than the downburst. The response ratio of the transmission tower under two types of wind fields was about 0.91–1.01, and the effect of violent downburst wind was not considered.
(4)
Under the action of the moving downburst wind field, the response of the transmission tower did not change significantly with the change of storm parameters. Compared with the static wind field, the Djet corresponding to the most unfavorable load increased.

Author Contributions

Conceptualization, Z.W. and F.Y.; methodology, Z.F.; software, F.Y.; validation, F.Y. and Y.W.; formal analysis, Y.W.; investigation, F.Y.; resources, F.Y.; data curation, F.Y.; writing—original draft preparation, F.Y. and Z.W.; writing—review and editing, F.Y.; visualization, F.Y.; supervision, Z.F.; project administration, Z.W.; funding acquisition, Z.W. All authors have read and agreed to the published version of the manuscript.

Funding

This research was funded by National Natural Science Foundation of China (NSFC), grant number 52178455. The APC was funded by NSFC.

Data Availability Statement

Not applicable.

Conflicts of Interest

The authors declare no conflict of interest.

References

  1. Haitham, A.; Amal, E.; Ayman, E.A.; Ashraf, E.D. Review on dynamic and quasi-static buffeting response of transmission lines under synoptic and non-synoptic winds. Eng. Struct. 2016, 112, 23–46. [Google Scholar]
  2. Wang, Z.; Wu, Y.; Fang, Z. Downburst wind field characteristics under moving effect. J. Vib. Shock 2019, 38, 32–38. [Google Scholar]
  3. Sun, Q.; Wu, J.; Wang, D.; Sun, X. Analysis of the Quasi-Static Buffeting Responses of Transmission Lines to Moving Downburst. Comput. Modeling Eng. Sci. 2020, 124, 287–302. [Google Scholar] [CrossRef]
  4. Holmes, J.D.; Hangan, H.M.; Schroeder, J.L.; Letchford, C.W.; Orwig, K.D. A forensic study of the Lubbock-Reese downdraft of 2002. Wind Struct. 2008, 11, 137–152. [Google Scholar] [CrossRef]
  5. Mohamed, D.; Ashraf, E.D. Critical Parameters and Configurations Affecting the Analysis and Design of Guyed Transmission Towers under Downburst Loading. Pract. Period. Struct. Des. Constr. 2017, 22, 04016017. [Google Scholar]
  6. Yang, F.; Zhang, H.; Yang, J.; Dang, H.; Liu, J. Bearing Capacity Analysis and Load Values of Transmission Towers Under Thunderstorm Downburst. Proc. CSEE 2014, 34, 4179–4186. [Google Scholar]
  7. Dempsey, D.; White, H.B. Wind wreak havoc on lines. TD World Mag. 1996, 48, 32–42. [Google Scholar]
  8. Savory, E.; Parke, G.A.R.; Zeinoddini, M.; Toy, N.; Disney, P. Modelling of tornado and microburst-induced wind loading and failure of a lattice transmission tower. Eng. Struct. 2001, 23, 365–375. [Google Scholar] [CrossRef]
  9. Chen, L.; Letchford, C.W. A deterministic-stochastic hybrid model of downbursts and its impact on a cantilevered structure. Eng. Struct. 2004, 26, 619–629. [Google Scholar] [CrossRef]
  10. Shehata, A.Y.; El Damatty, A.A.; Savory, E. Finite element modeling of transmission line under downburst wind loading. Finite Elem. Anal. Des. 2005, 42, 71–89. [Google Scholar] [CrossRef]
  11. Shehata, A.Y.; El Damatty, A.A. Behavior of guyed transmission line structures under downburst wind loading. Wind Struct. 2007, 10, 249–268. [Google Scholar] [CrossRef]
  12. Shehata, A.Y.; Nassef, O.; El Damatty, A.A. A coupled finite element-optimization technique to determine critical microburst parameters for transmission towers. Finite Elem. Anal. Des. 2008, 45, 1–12. [Google Scholar] [CrossRef]
  13. Chay, M.T.; Albermani, F.; Wilson, R. Wind loads on transmission line structures in simulated downbursts. Eng. Struct. 2006, 28, 240–254. [Google Scholar] [CrossRef] [Green Version]
  14. Yang, F.L. Zhang, H.J. Two case studies on structural analysis of transmission towers under downburst. Wind Struct. 2016, 22, 685–701. [Google Scholar] [CrossRef]
  15. Damatty, A.E.; Hamada, A.; Elawady, A. Development of Critical Load Cases Simulating the Effect of Downbursts and Tornados on Transmission Line Structures. In Proceedings of the Eighth Asia-Pacific Conference on Wind Engineering, Chennai, India, 10–14 December 2013. [Google Scholar]
  16. Ji, B.; Qu, W.; Wang, L.; Zhao, E. Elastic-plastic buckling collapse analysis of transmission tower under downburst. China Saf. Sci. J. 2014, 24, 90–95. [Google Scholar]
  17. Wang, F.Y.; Xu, Y.L.; Qu, W.L. Multi-Scale Failure Analysis of Transmission Towers Under Downburst Loading. Int. J. Struct. Stab. Dyn. 2018, 18, 1850029. [Google Scholar] [CrossRef]
  18. Damatty, E.; Elawady, A. Critical load cases for lattice transmission line structures subjected to downbursts: Economic implications for design of transmission lines. Eng. Struct. 2018, 159, 213–226. [Google Scholar] [CrossRef]
  19. Elawady, A.; Aboshosha, H.; Damatty, E. Amal Aero-elastic response of transmission line system subjected to downburst wind: Validation of numerical model using experimental data. Wind Struct. 2018, 27, 71–88. [Google Scholar]
  20. Wood, G.S.; Kwok, K.C.S.; Motteram, N.A.; Fletcher, D.F. Physical and numerical modelling of thunderstorm downbursts. J. Wind Eng. Ind. Aerodyn. 2001, 89, 535–552. [Google Scholar] [CrossRef]
  21. Holmes, J.D.; Oliver, S.E. An empirical model of a downburst. Eng. Struct. 2000, 22, 1167–1172. [Google Scholar] [CrossRef]
  22. Hamada, A.; Damatty, A.A.E. Behaviour of guyed transmission line structures under tornado wind loading. Comput. Struct. 2011, 89, 986–1003. [Google Scholar] [CrossRef]
  23. Fang, Z.; Li, Z.; Wang, Z. Study on effect of storm movement on wind field characteristics of downburst. J. Build. Struct. 2019, 40, 166–174. [Google Scholar]
  24. Andi, X.; Massimiliano, B.; Giovanni, S. A general-purpose analytical model for reconstructing the thunderstorm outflows of travelling downbursts immersed in ABL flows. J. Wind Eng. Ind. Aerodyn. 2020, 207, 104373. [Google Scholar]
Figure 1. Profiles of normal wind and downburst with different jet diameters.
Buildings 12 00193 g001
Figure 2. Finite element model of transmission tower (a) top view of tower 5; (b) side view of tower 5; (c) five transmission towers of different heights.
Buildings 12 00193 g002
Figure 3. (a) Location of transmission tower lines and downbursts; (b) Speed time series of steady downburst (α = 0°, Djet = 800 m).
Buildings 12 00193 g003
Figure 4. Base bending moment and main material axial force under different distances (a) Base bending moment; (b) Axial force.
Buildings 12 00193 g004
Figure 5. Base bending moment and main material axial force with different Djet (a) tower 1; (b) tower 2; (c) tower 3; (d) tower 4; (e) tower 5.
Buildings 12 00193 g005
Figure 6. Contrast curve of displacement response peak values distributed along tower heights under two kinds of wind fields (a) tower 1 (45.5 m); (b) tower 2 (54.5 m); (c) tower 3 (63.5 m); (d) tower 4 (72.5 m); (e) tower 5 (81.5 m).
Buildings 12 00193 g006
Figure 7. Wind speed time series of unsteady downburst.
Buildings 12 00193 g007
Figure 8. Change of axial force with radial distance (Djet = 600 m) (a) |FN|/(FNmax); (b) Pulsation response.
Buildings 12 00193 g008
Figure 9. Tower response under different Djet (a) Top displacement; (b) Main material axial force; (c) Base shear.
Buildings 12 00193 g009aBuildings 12 00193 g009b
Table 1. Transmission tower parameters.
Tower Number12345
Nominal Height (m)3948576675
Tower Height (m)45.554.563.572.581.5
Table 2. Reduction factor of leeward surface of tower.
As/A≤0.10.20.30.40.5>0.6
b/a ≤ 11.00.850.660.500.330.15
b/a = 21.00.900.750.600.450.30
Table 3. Comparison of transmission towers’ base bending moments under two types of wind fields.
Tower NumberDownburst (m)Boundary Layer Wind (m)Ratio
16019.84150.21.45
28749.36403.11.37
313,229.210,162.31.3
415,735.113,404.51.17
518,597.618,234.91.01
Table 4. Comparison of main material’s axial force under two types of wind fields.
Tower NumberDownburst (m)Boundary Layer Wind (m)Ratio
1385.1281.81.36
2441.7354.01.25
3522.9460.11.14
4572.9529.91.08
5570.5621.10.92
Table 5. Peak displacement response peak of tower top under two wind fields.
Tower Height (m)Downburst (m)Boundary Layer Wind (m)Ratio
45.50.07520.06361.18
54.50.10970.08851.24
63.50.15350.12931.18
72.50.16430.15731.11
81.50.17780.19720.91
Table 6. Peak axial force of main materials under two wind fields.
Tower Height (m)Downburst (kN)Boundary Layer Wind (kN)Ratio
45.5378.5298.91.26
54.5441.7369.61.19
63.5522.9448.81.16
72.5562.9503.81.11
81.5570.5581.80.98
Publisher’s Note: MDPI stays neutral with regard to jurisdictional claims in published maps and institutional affiliations.

