Article

Compressive Strength Estimation and CO2 Reduction Design of Fly Ash Composite Concrete

1
Department of Integrated Energy and Infra System, Kangwon National University, Chuncheonsi 24341, Korea
2
Department of Architectural Engineering, Kangwon National University, Chuncheonsi 24341, Korea
*
Authors to whom correspondence should be addressed.
Buildings 2022, 12(2), 139; https://doi.org/10.3390/buildings12020139
Submission received: 22 December 2021 / Revised: 21 January 2022 / Accepted: 25 January 2022 / Published: 27 January 2022
(This article belongs to the Special Issue CO2 Neutrality of Sustainable Concrete Materials)

Abstract

:
Fly ash is broadly utilized to produce concrete materials. This study presents a strength estimation model and a CO2 reduction design method for concrete with fly ash. First, a hydration-based strength (HBS) model is proposed for the evaluation of strength development at different ages of fly ash composite concrete with different mix proportions. Second, CO2 emissions for 1 MPa strength were evaluated. The analysis results show that, as the fly ash-to-binder ratio (FA/B) increased, the CO2 emissions for 1 MPa strength decreased. For concrete with a low water-to-binder ratio (W/B), the addition of high content of fly ash had an obvious dilution effect, which increased the reaction degree of cement and reduced CO2 emissions for 1 MPa strength. Moreover, the extension of the design age could reduce CO2 emissions for 1 MPa strength. Third, a genetic-algorithm-based optimal design model is proposed to find the individual mass of cement and fly ash of low-CO2 concrete. The analysis results show that, as the water contents increased from 160 to 170 kg/m3, to obtain the same strength, cement mass and fly ash mass increased, while the water/binder ratio and fly ash/binder ratio did not change. This means that the reduction in mixed water is one feasible way to lower CO2 emissions. In summary, the proposed strength–emission integrated analysis method is useful for designing sustainable fly ash composite concrete with the desired strength and low levels of CO2 emissions.

1. Introduction

Fly ash is an industrial byproduct of coal burning in power plants, and it is broadly utilized to produce concrete materials. Fly ash composite concrete has many benefits, such as good workability, a high late-age strength, good resistance to chloride and acid penetration and low levels of CO2 emissions [1,2]. Moreover, strength is a fundamental index of structural concrete and CO2 emissions are a vital index of the environmental impact of concrete. Property evaluation models, such as the strength development and CO2 emission evaluation models, are helpful for the rational utilization of fly ash in the concrete industry [3].
Because fly ash-blended concrete can achieve mechanical and environmental benefits [4], many studies have been performed on evaluating the development of strength and CO2 emissions of concrete with fly ash.
First, many models have been proposed to estimate the strength of fly ash composite concrete. Using concrete porosity, Atis [5] evaluated the strength of concrete with various content levels of fly ash and W/B. Babu and Rao [6] determined the strength efficiency factor of fly ash on the basis of FA/B, age and W/B. Hwangth et al. [7] predicted the strength of fly ash composite concrete using a fly ash activity coefficient based on age, fly ash fineness, W/B ratio and fly ash contents. Papadakis [8,9] analyzed the strength of composite concrete using the content of calcium silicate hydrate, which was determined from compound compositions of cement and mineral admixtures. Using a particle model, Kang et al. [10] predicted the strength of fly ash composite concrete between 3 and 180 days. Wu et al. [11] proposed a composite hydration model and evaluated the gel–space ratio and strength development of cement–fly ash–silica fume ternary composites.
Second, some studies have been conducted on the CO2 emissions of fly ash composite concrete. Vargas and Halog [12] found that concrete CO2 emissions can be reduced by using upgraded fly ash. Zhang et al. [13] proposed that durability is an important factor for the sustainability of fly ash composite concrete. Yang et al. [14] determined that CO2 emissions and CO2 sink due to the carbonation of fly ash composite concrete. Kim et al. [15] found that fly ash could reduce CO2 emissions and the cost of concrete and proposed an optimal design technique for low-CO2 concrete. Yu et al. [16] showed that concrete with very high fly ash content was green concrete, with less embodied energy, CO2 emissions and costs than those of control concrete. Yang et al. [17] proposed an integrated procedure for the design of low-CO2 concrete. This procedure can evaluate the CO2 emission of concrete, binder contents for aimed strength, and types and replacement percentages of supplementary cementitious materials for aimed strength and CO2 reduction levels.
Although many studies have been performed on the evaluation of strength and CO2 emissions, they had some weak points. First, regarding the development of strength, previous models have not considered the different reaction rates of cement and fly ash. Second, regarding CO2 emissions, previous studies have focused on the effect of FA/B on CO2 emission reduction. The effect of the W/B ratio of composite concrete on CO2 reduction has seldom been considered. Third, previous studies on CO2 emissions have mainly focused on phenomenon-based analyses. The mechanism of strength and CO2 emissions have been rarely analyzed. In other words, the integrated analysis of hydration–strength–CO2 emissions of fly ash composite concrete is necessary and would be helpful in finding feasible ways for producing low-CO2 concrete with the aimed strength and CO2 reduction levels.
To overcome the weaknesses of previous studies, this study presents the integrated analysis of the procedure of hydration–strength–CO2 emissions of fly ash composite concrete. A hydration-based strength (HBS) model is proposed. Moreover, the effects of FA/B and W/B ratios on CO2 emissions for 1 MPa strength are clarified. The mechanism of CO2 emission reduction is based on the aspect of hydration. In addition, a genetic algorithm-based optimal design method is proposed to find low-CO2 fly ash composite concrete.
The rest of this work is structured as follows: Section 2 and Section 3 present the strength evaluation model and the CO2 emission model, respectively; Section 4 shows the genetic algorithm-based optimal design of low-CO2 fly ash composite concrete; Section 5 discusses the strength evaluation and CO2 reduction strategy; and Section 6 presents the conclusions.

2. Strength Evaluation Models

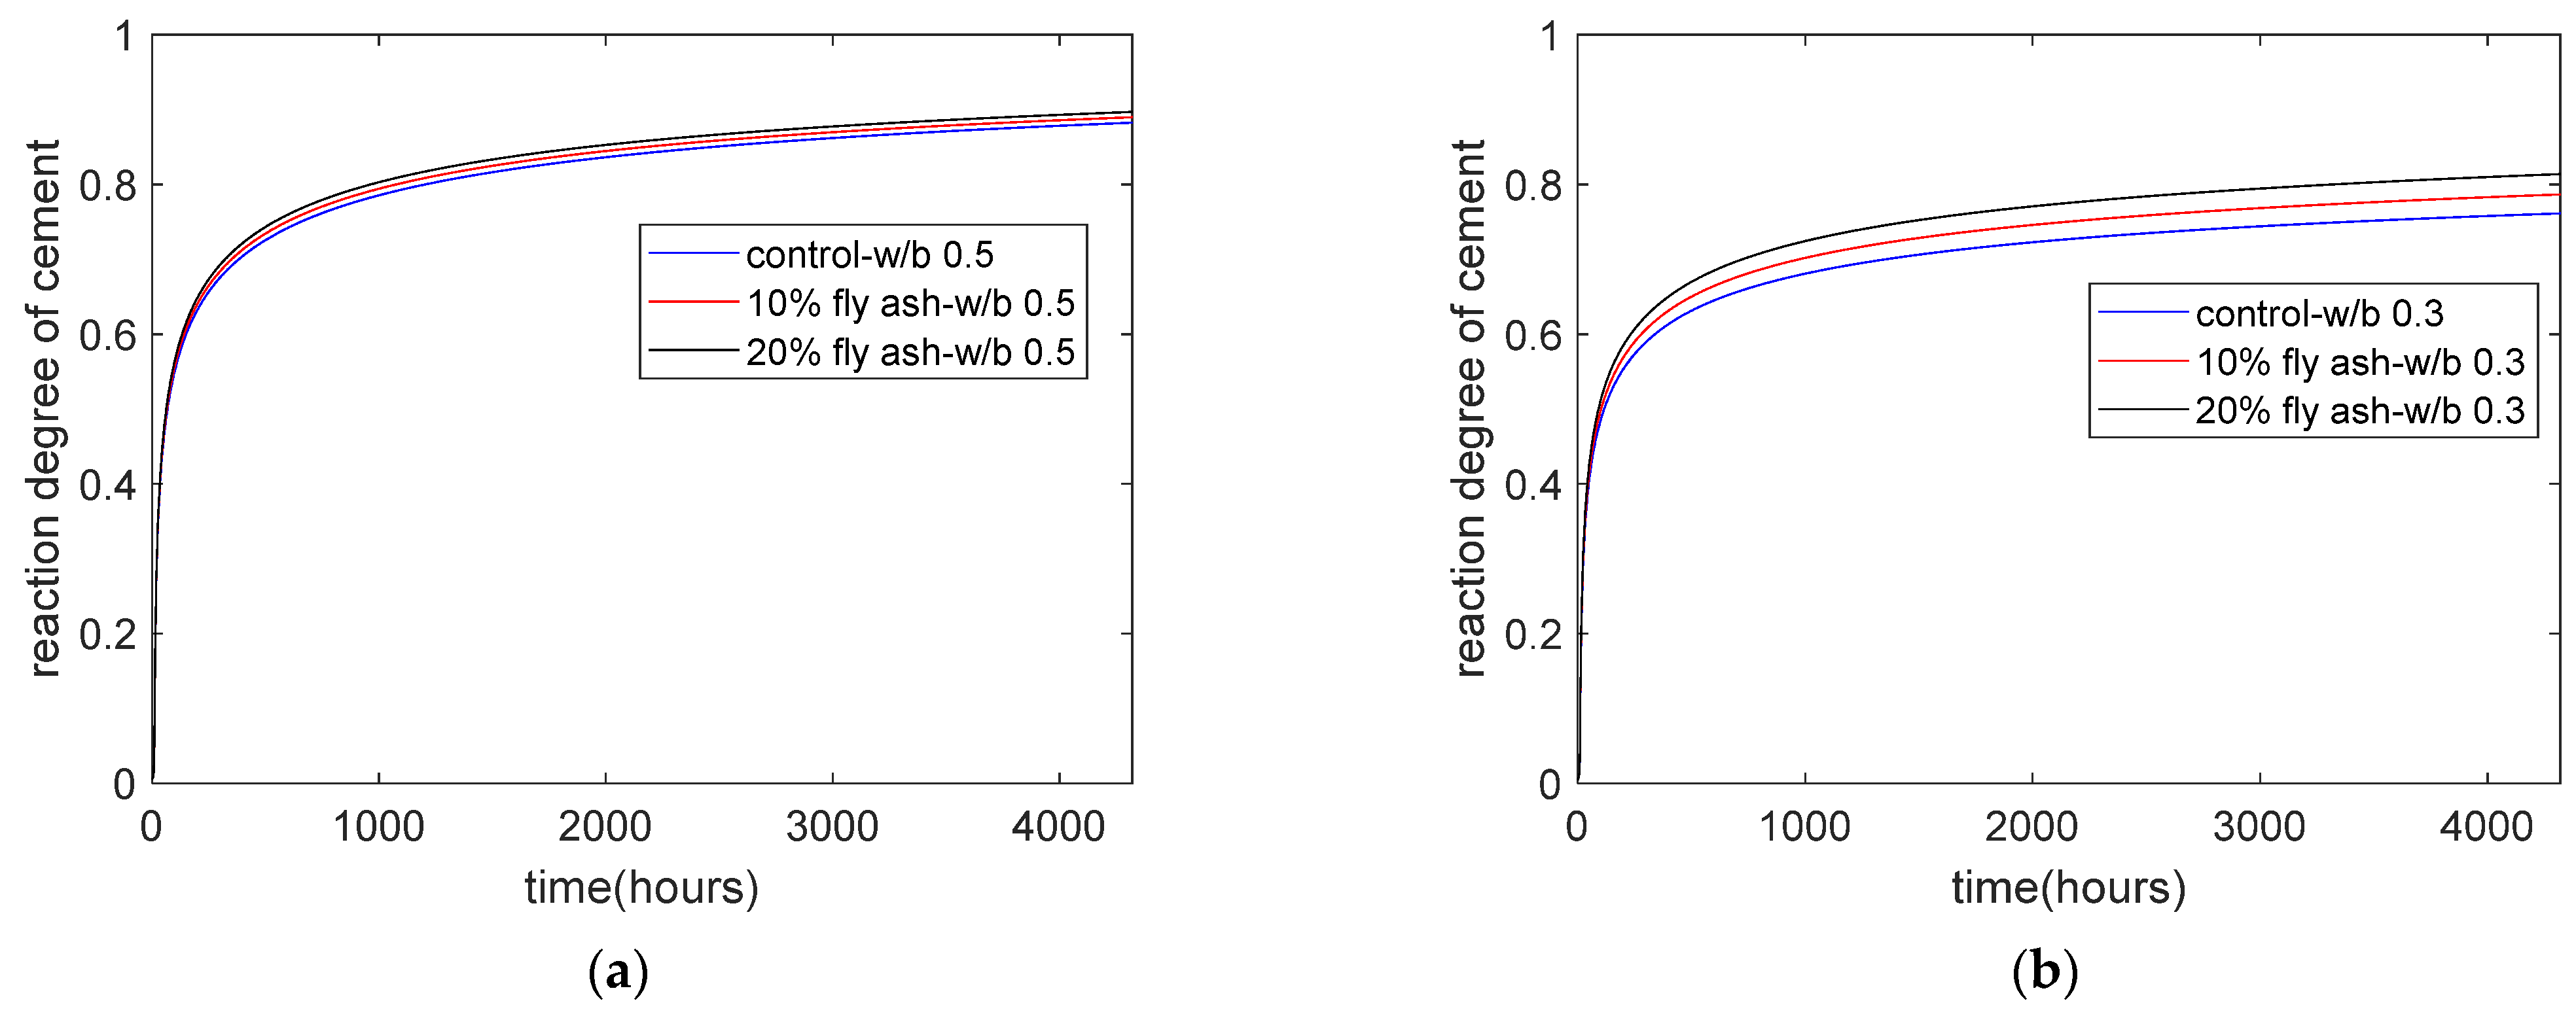
2.1. Hydration-Based Strength (HBS) Model

The strength of hardening concrete is closely related to its hydration reaction. The formation of cement hydration products can fill the capillary pore and contribute to the development of strength. In our previous studies [18,19], we proposed a model for the hydration of a binary composite binder of cement and fly ash. Kinetic equations for cement hydration with water and geopolymerization with calcium hydroxide were proposed and the interactions between geopolymerization and cement hydration were clarified through the contents of calcium hydroxide and capillary water in the hydrating system. The hydration degree of cement is determined as α = 0 t ( d α d t ) d t , where d α d t is the hydration rate. Similarly, the pozzolanic reaction extent of fly ash is determined as α F A = 0 t ( d α F A d t ) d t , where d α F A d t is the pozzolanic reaction rate of fly ash. Detailed calculation equations on d α d t and d α F A d t are shown in our previous studies [18,19,20,21].
The strength of concrete is mainly dependent on the mass of calcium silicate hydrate (CSH). Based on the hydration model, the mass of CSH can be determined as follows [9,18,19,20]:
CSH ( t ) = 2.85 ( f S , C × C 0 × α + f S , P × P × α F A )
where f S , C and f S , P are the contents of SiO2 in cement and fly ash, respectively, and C 0 and P denote the mass of cement and fly ash in the concrete mixtures, respectively. CSH ( t ) is the mass of CSH. The 2.85 coefficient denotes the ratio of calcium silicate hydrate (CSH) molar weight to SiO2 molar weight. Moreover, fly ash has greater SiO2 content than cement, while cement reacts quicker than fly ash. Therefore, CSH content may present a crossover between plain concrete and fly ash composite concrete.
The strength of concrete can be evaluated using a linear equation of CSH ( t ) as follows [9,18,19,20]:
f c ( t ) = A 1 × CSH ( t ) W 0 A 2
where f c is the concrete strength, W 0 is the water mass and A 1 and A 2 are strength coefficients. For mixtures with a different W/B, fly ash contents and curing ages, the strength coefficients A 1 and A 2 are constants [18,19,20,21]. In Equation (2), water mass denotes the initial porosity of concrete and CSH mass relates to the filling of concrete porosity.
The basic principle of the hydration model is to separate the fly ash reaction and cement hydration and consider the mutual interactions between the fly ash reaction and cement hydration through the contents of calcium hydroxide and capillary water. The hydration model covers the effect of binder compositions, concrete mixtures and curing conditions on the hydration of cement–fly ash hybrid concrete. In addition, the main limitations of the hydration strength model are that the current model does not consider the effect of aggregate on the development of strength nor does it cover the difference in the reaction rate of the silicate and aluminate phase of fly ash.

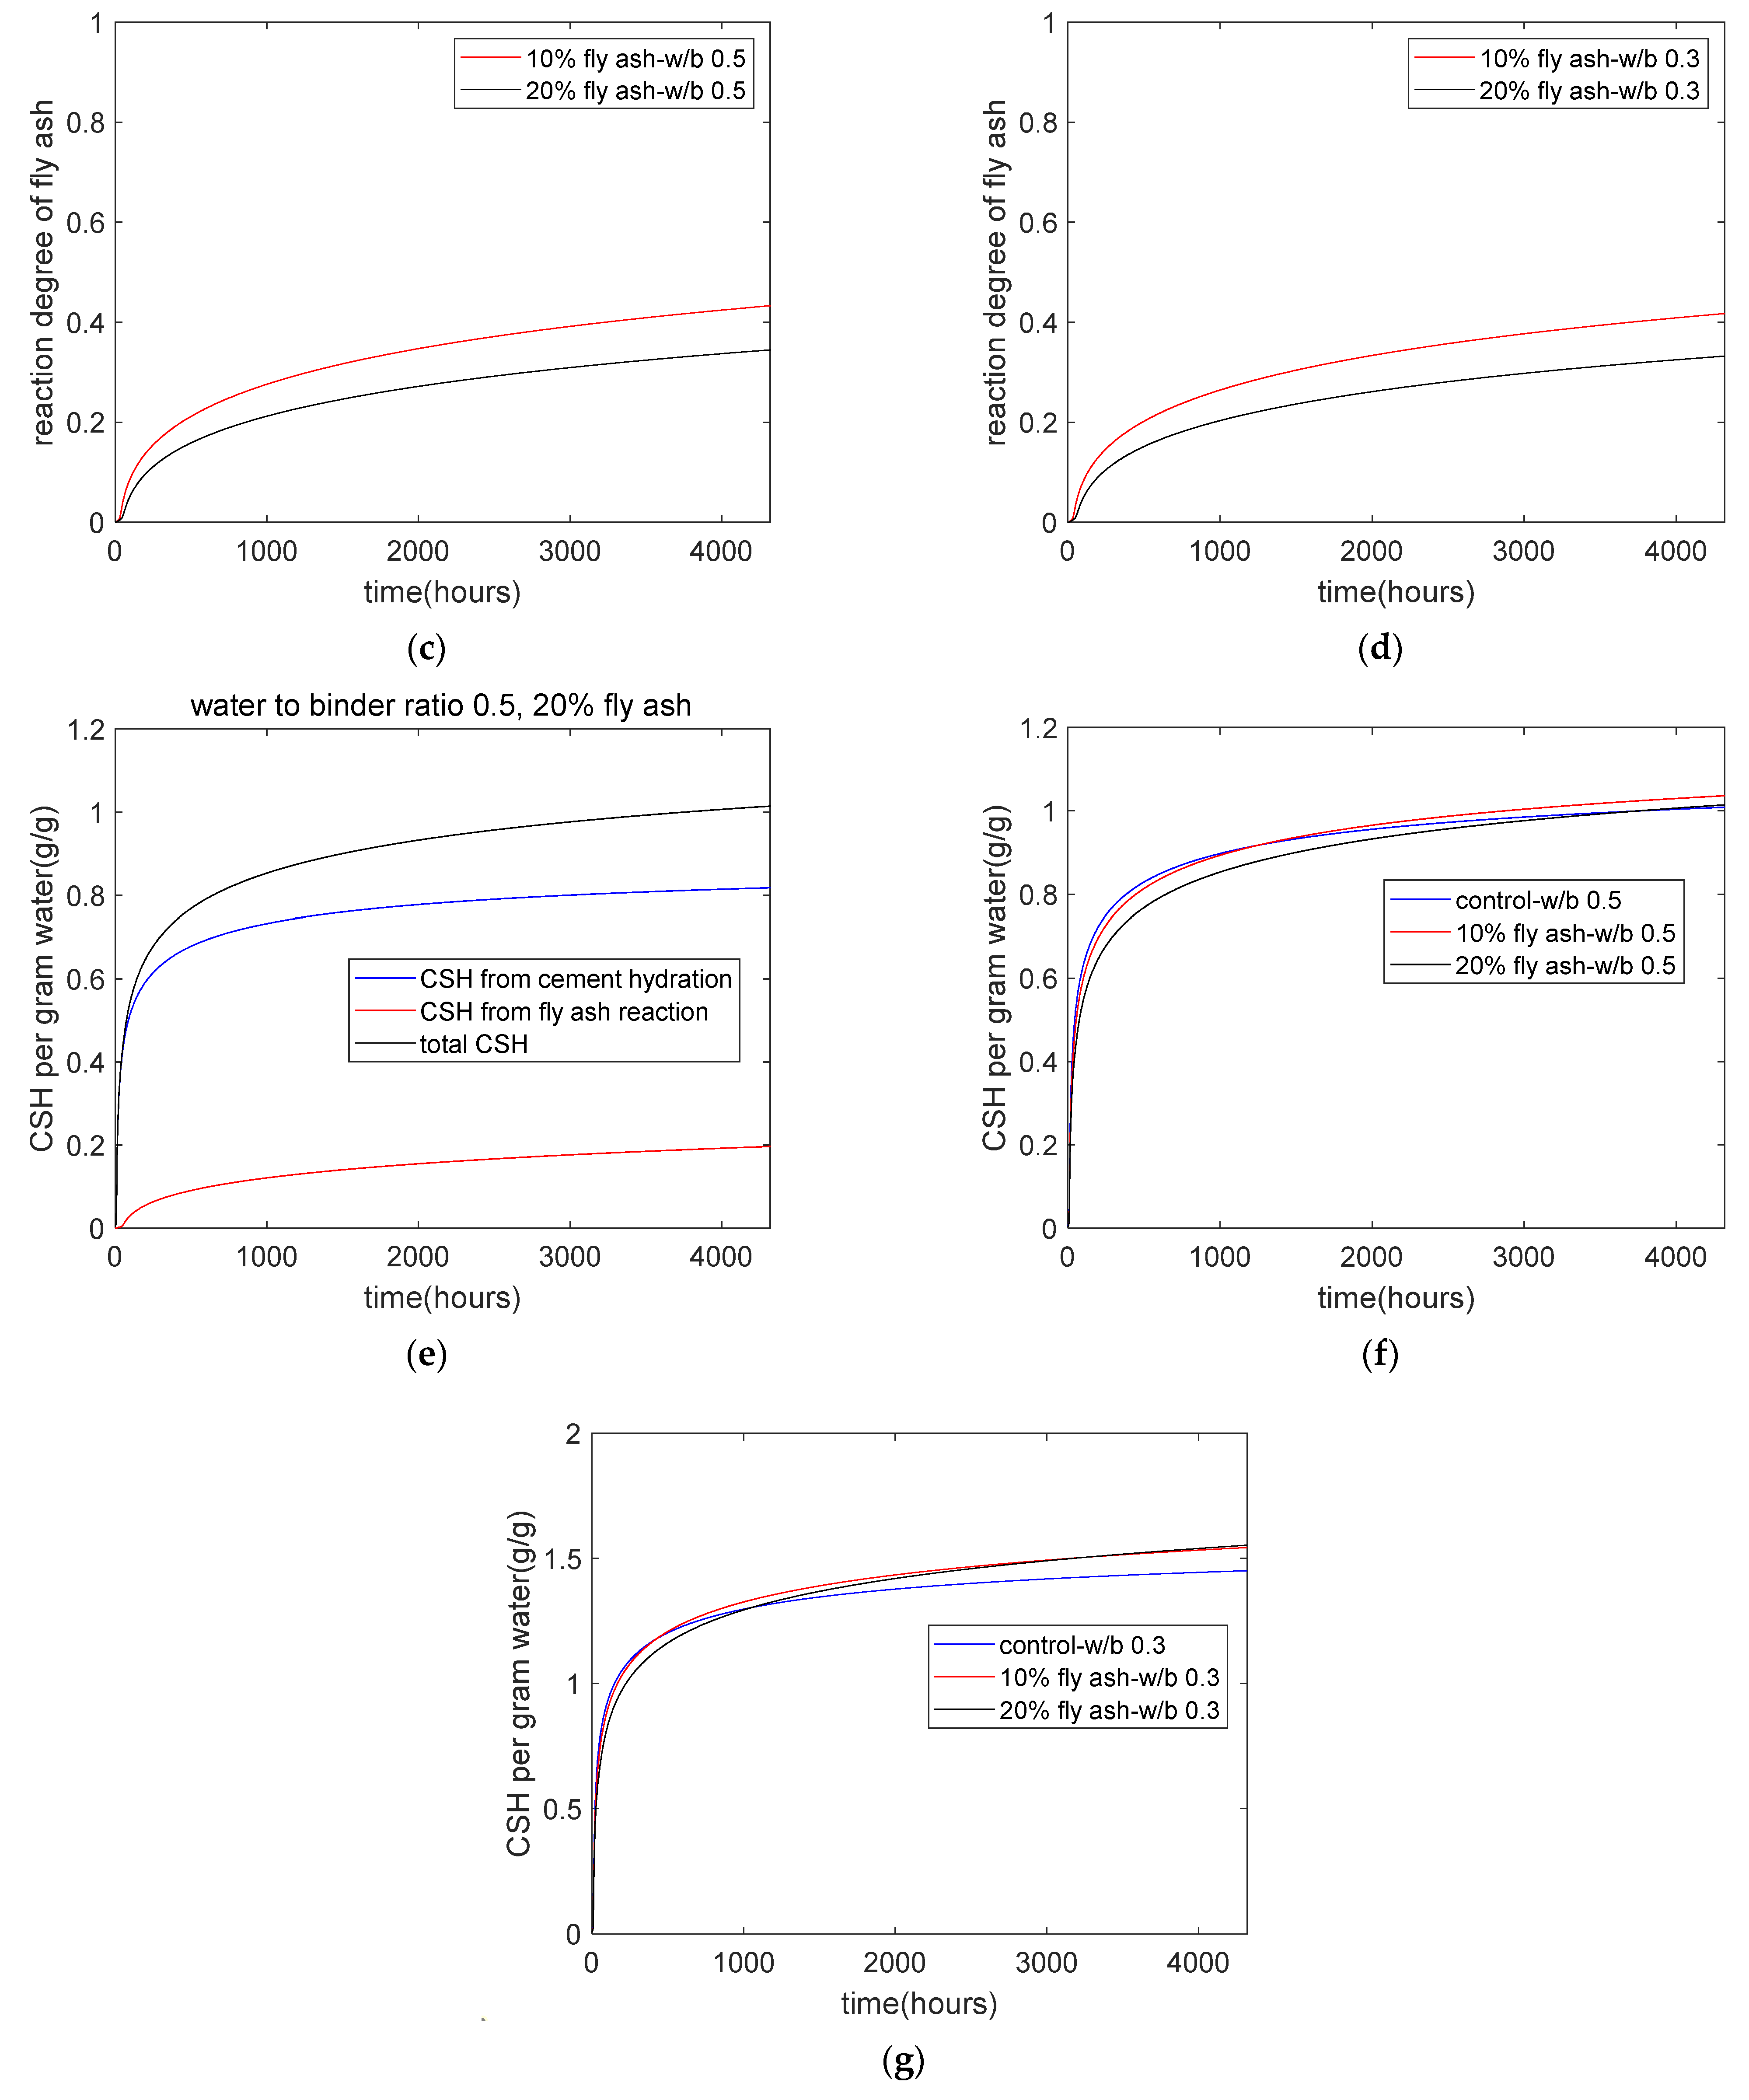
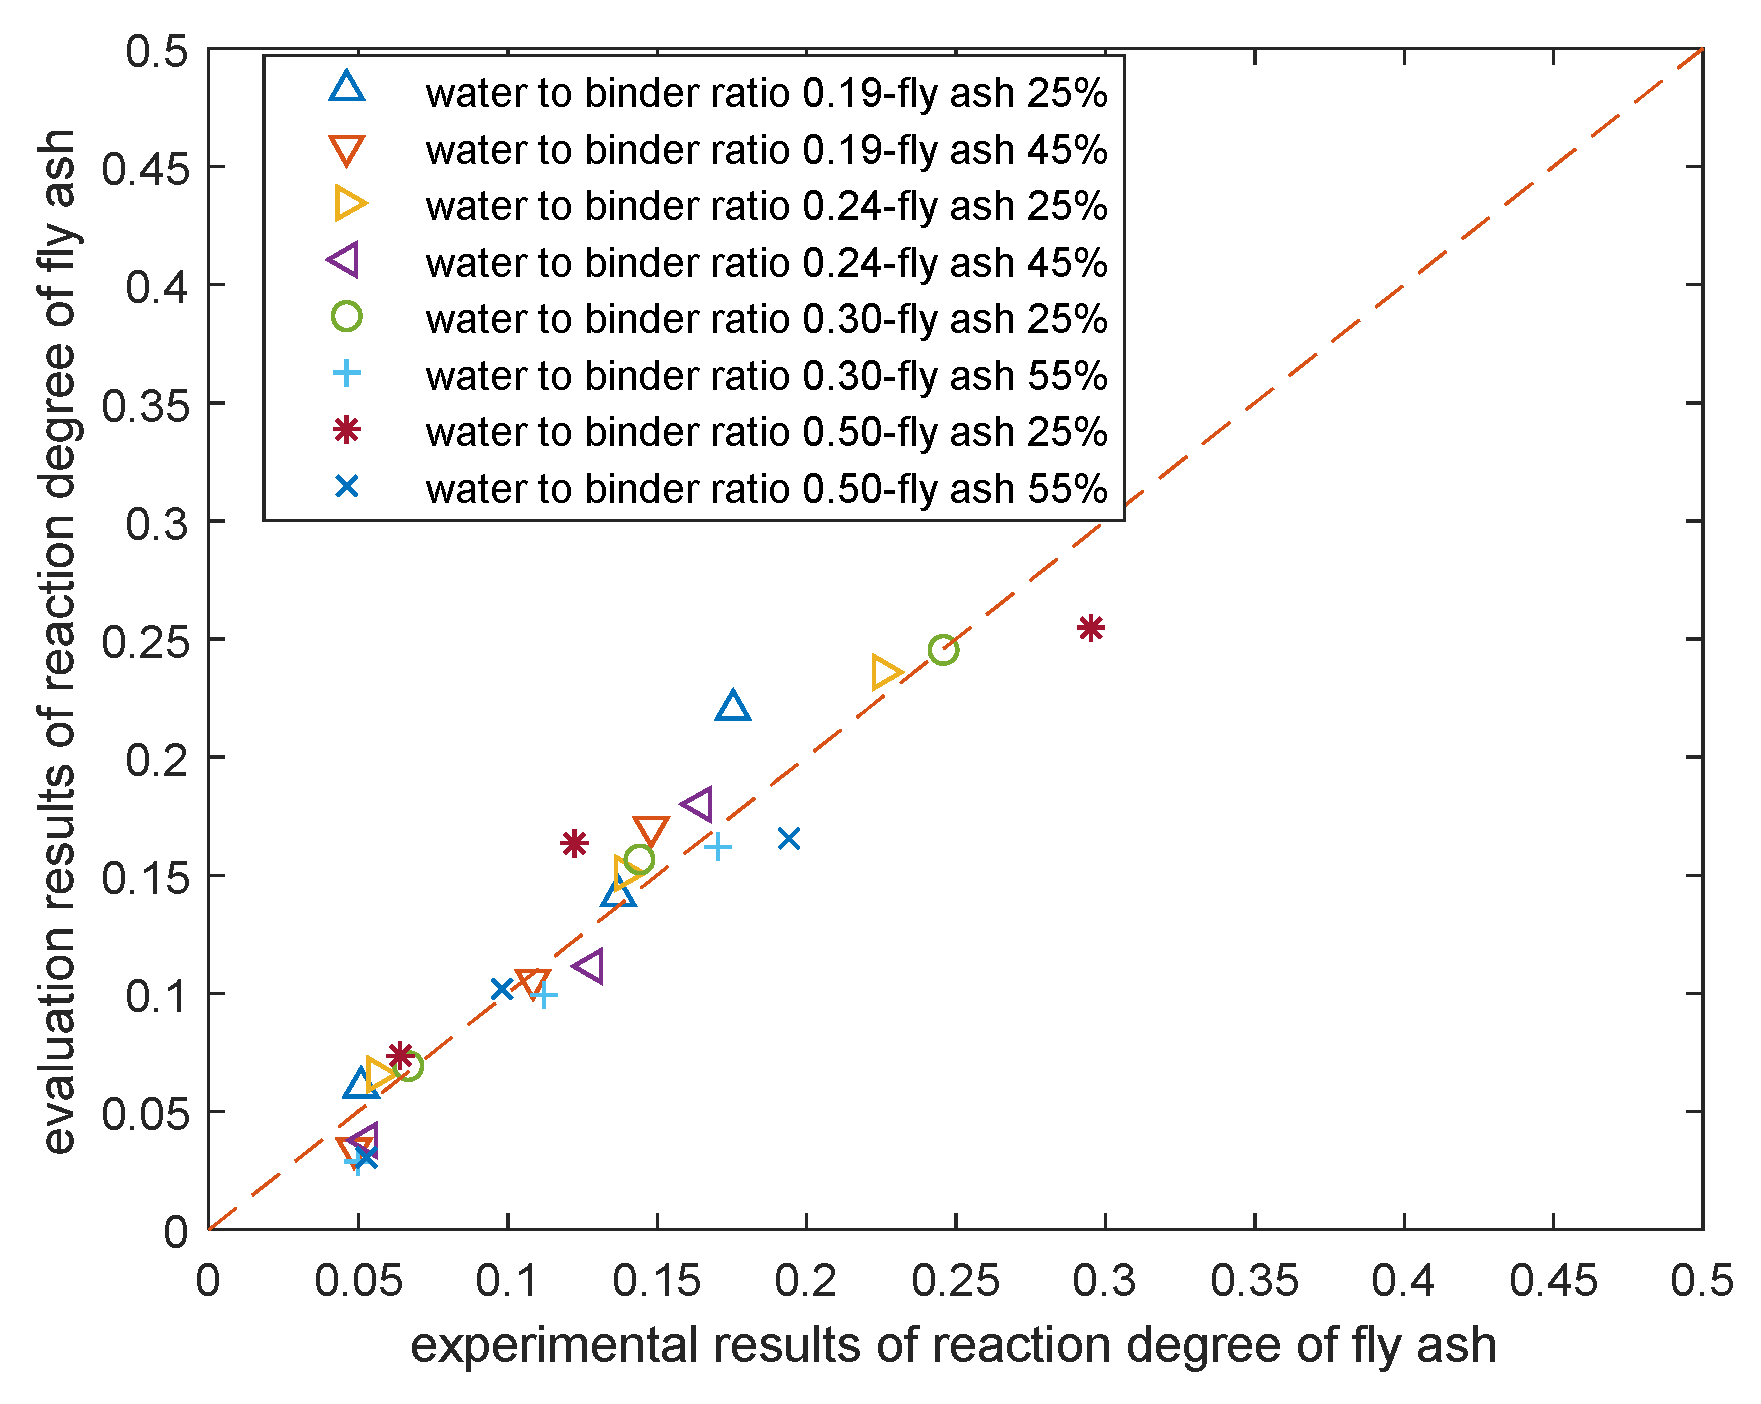
2.2. Verifications and Parameter Study of Hydration Model

Figure 1 displays the verifications of the hydration model of cement–fly ash composites. The experimental data of the pozzolanic reaction extent of fly ash were taken from [22]. On the basis of the selective dissolution method, Lam et al. [22] measured the reaction extent of fly ash in the composite paste with different mix proportions (FA/B ranged from 0.25 to 0.55, W/B ranged from 0.19 to 0.50 and the tested ages ranged from 7 to 90 days). The cement used was ordinary Portland cement and the fly ash used was ASTM Type F fly ash (low-calcium fly ash). Figure 1 shows that the analytical results agree with the experimental data.
Figure 2 shows the parameter study of the cement–fly ash composite hydration model. Figure 2a shows that, when the W/B ratio was 0.5, the addition of fly ash could slightly increase the reaction degree of cement. This was due to the dilution effect, i.e., the addition of fly ash increased the water-to-cement ratio and accelerated the hydration of cement [23,24]. Figure 2b shows that, when the W/B was 0.3, compared with W/B 0.5, the increase in the hydration extent of cement was more obvious. In other words, as the W/B ratio was reduced, the dilution effect due to fly ash addition became more significant [16]. Figure 2c,d show that, as the replacement content of fly ash increased, the reaction degree of fly ash was reduced. This is because the activation effect from cement hydration was weakened due to the increasing percentage of fly ash [21,22]. Moreover, as the W/B ratio decreased from 0.5 to 0.3, the reaction extent of fly ash slightly decreased due to the shortage of available space for reaction products [21,22]. Figure 2e shows the CSH content per gram of water for hydrating the cement–fly ash composite. Total CSH is from the reactions of fly ash and cement. At early curing ages, CSH from cement hydration rapidly increased and then reached a plateau value. At later ages, CSH from fly ash increased more apparently than that from cement hydration. Figure 2f shows the CSH content for a W/B ratio of 0.5 at the early ages of curing; fly ash additions reduced CSH content and, at later ages, increased it, because fly ash has higher SiO2 content than cement and the reaction of the unit mass of fly ash could produce more CSH than cement. Moreover, as the FA/B increased, the surpass time of CSH became longer because the reaction extent of fly ash decreased as the fly ash contents increased (shown in Figure 2f) [21,22]. Figure 2g shows the CSH content for a W/B of 0.3. When the W/B decreased from 0.5 to 0.3, the surpass time of CSH happened much earlier because of the enhancement of the dilution effect [11,25].

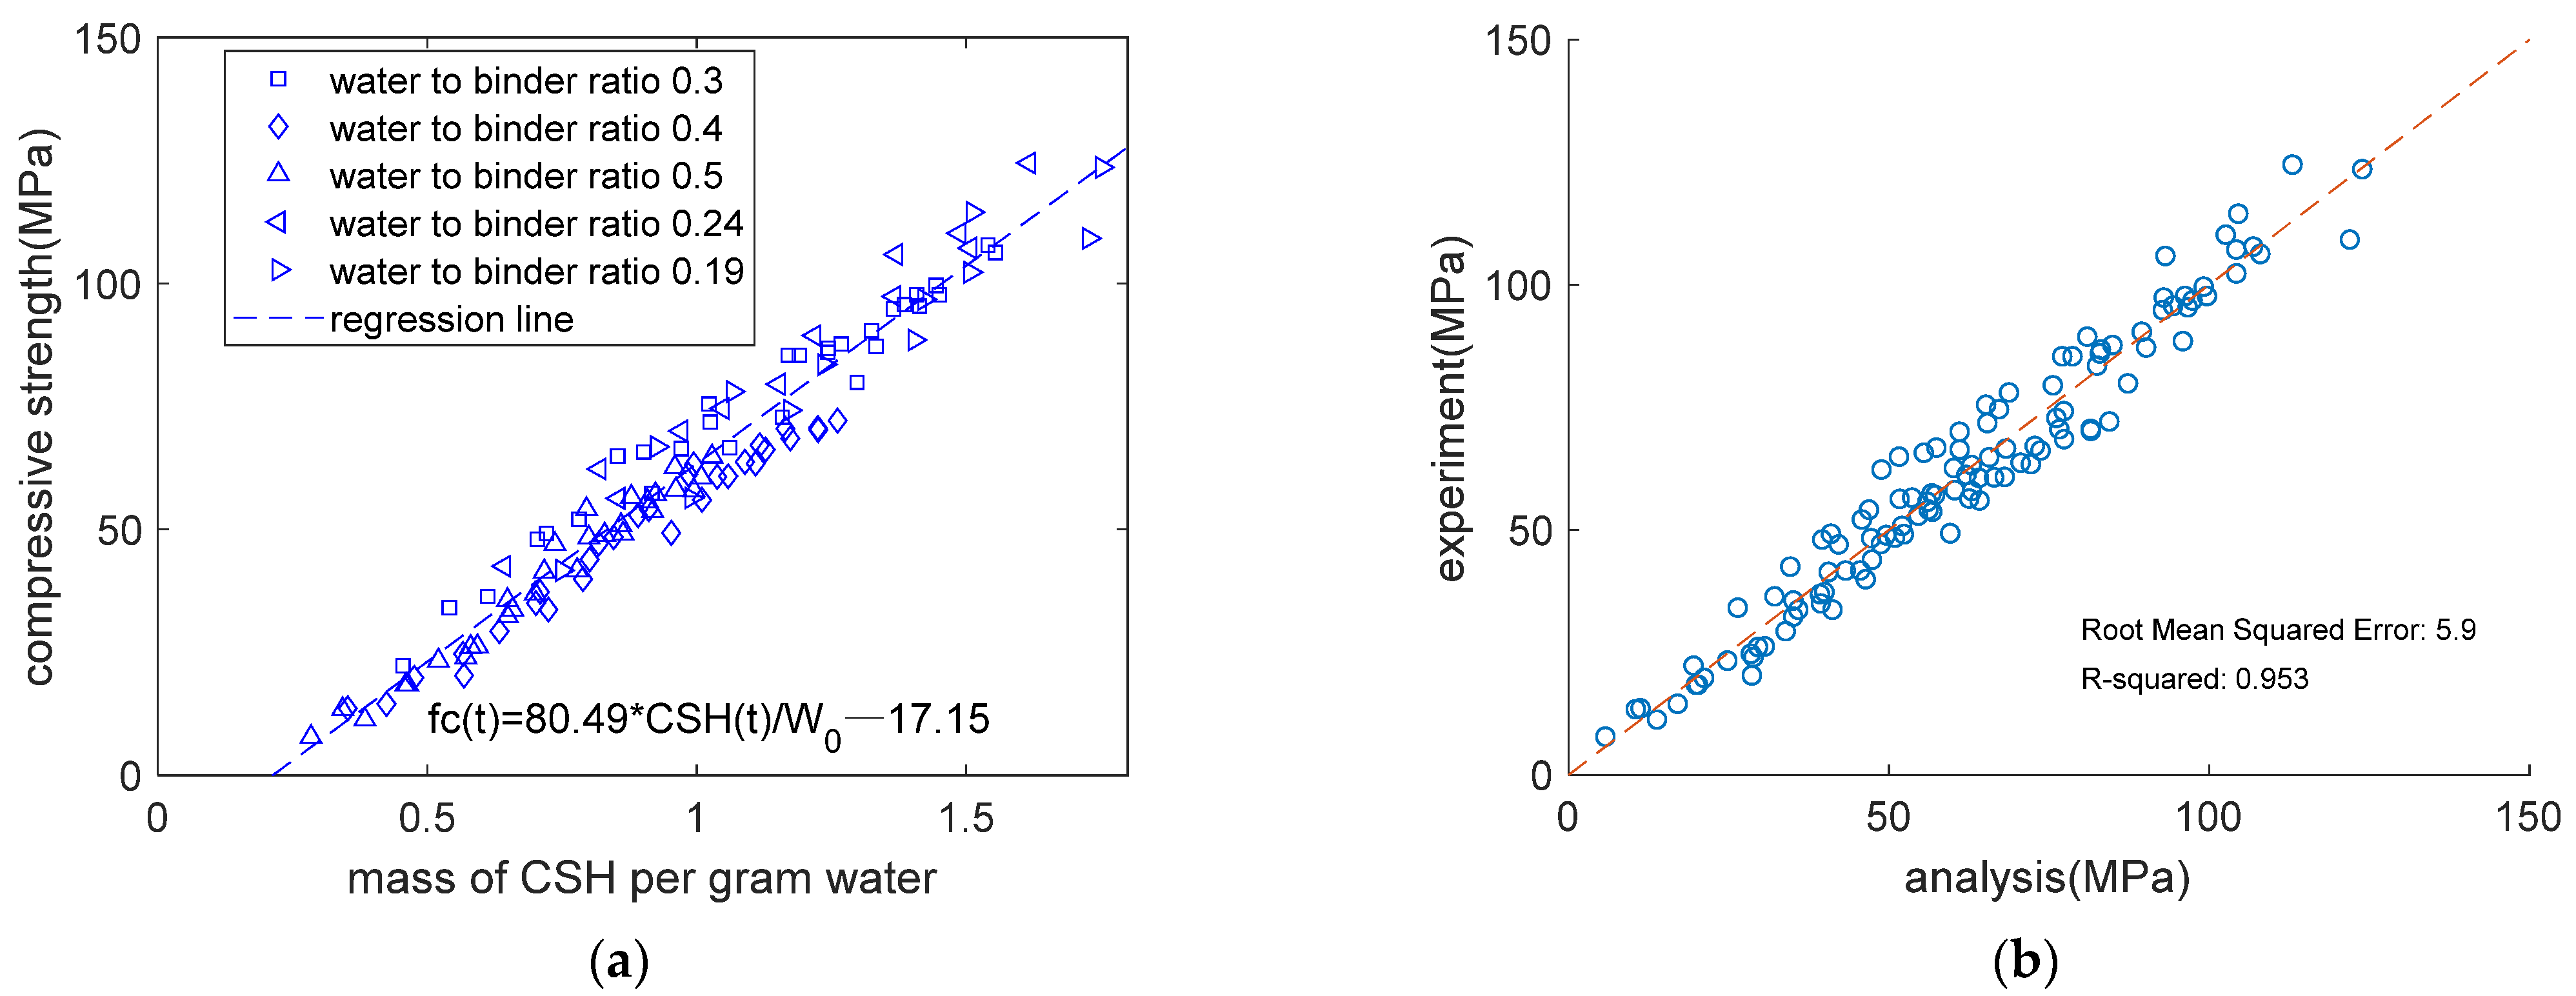
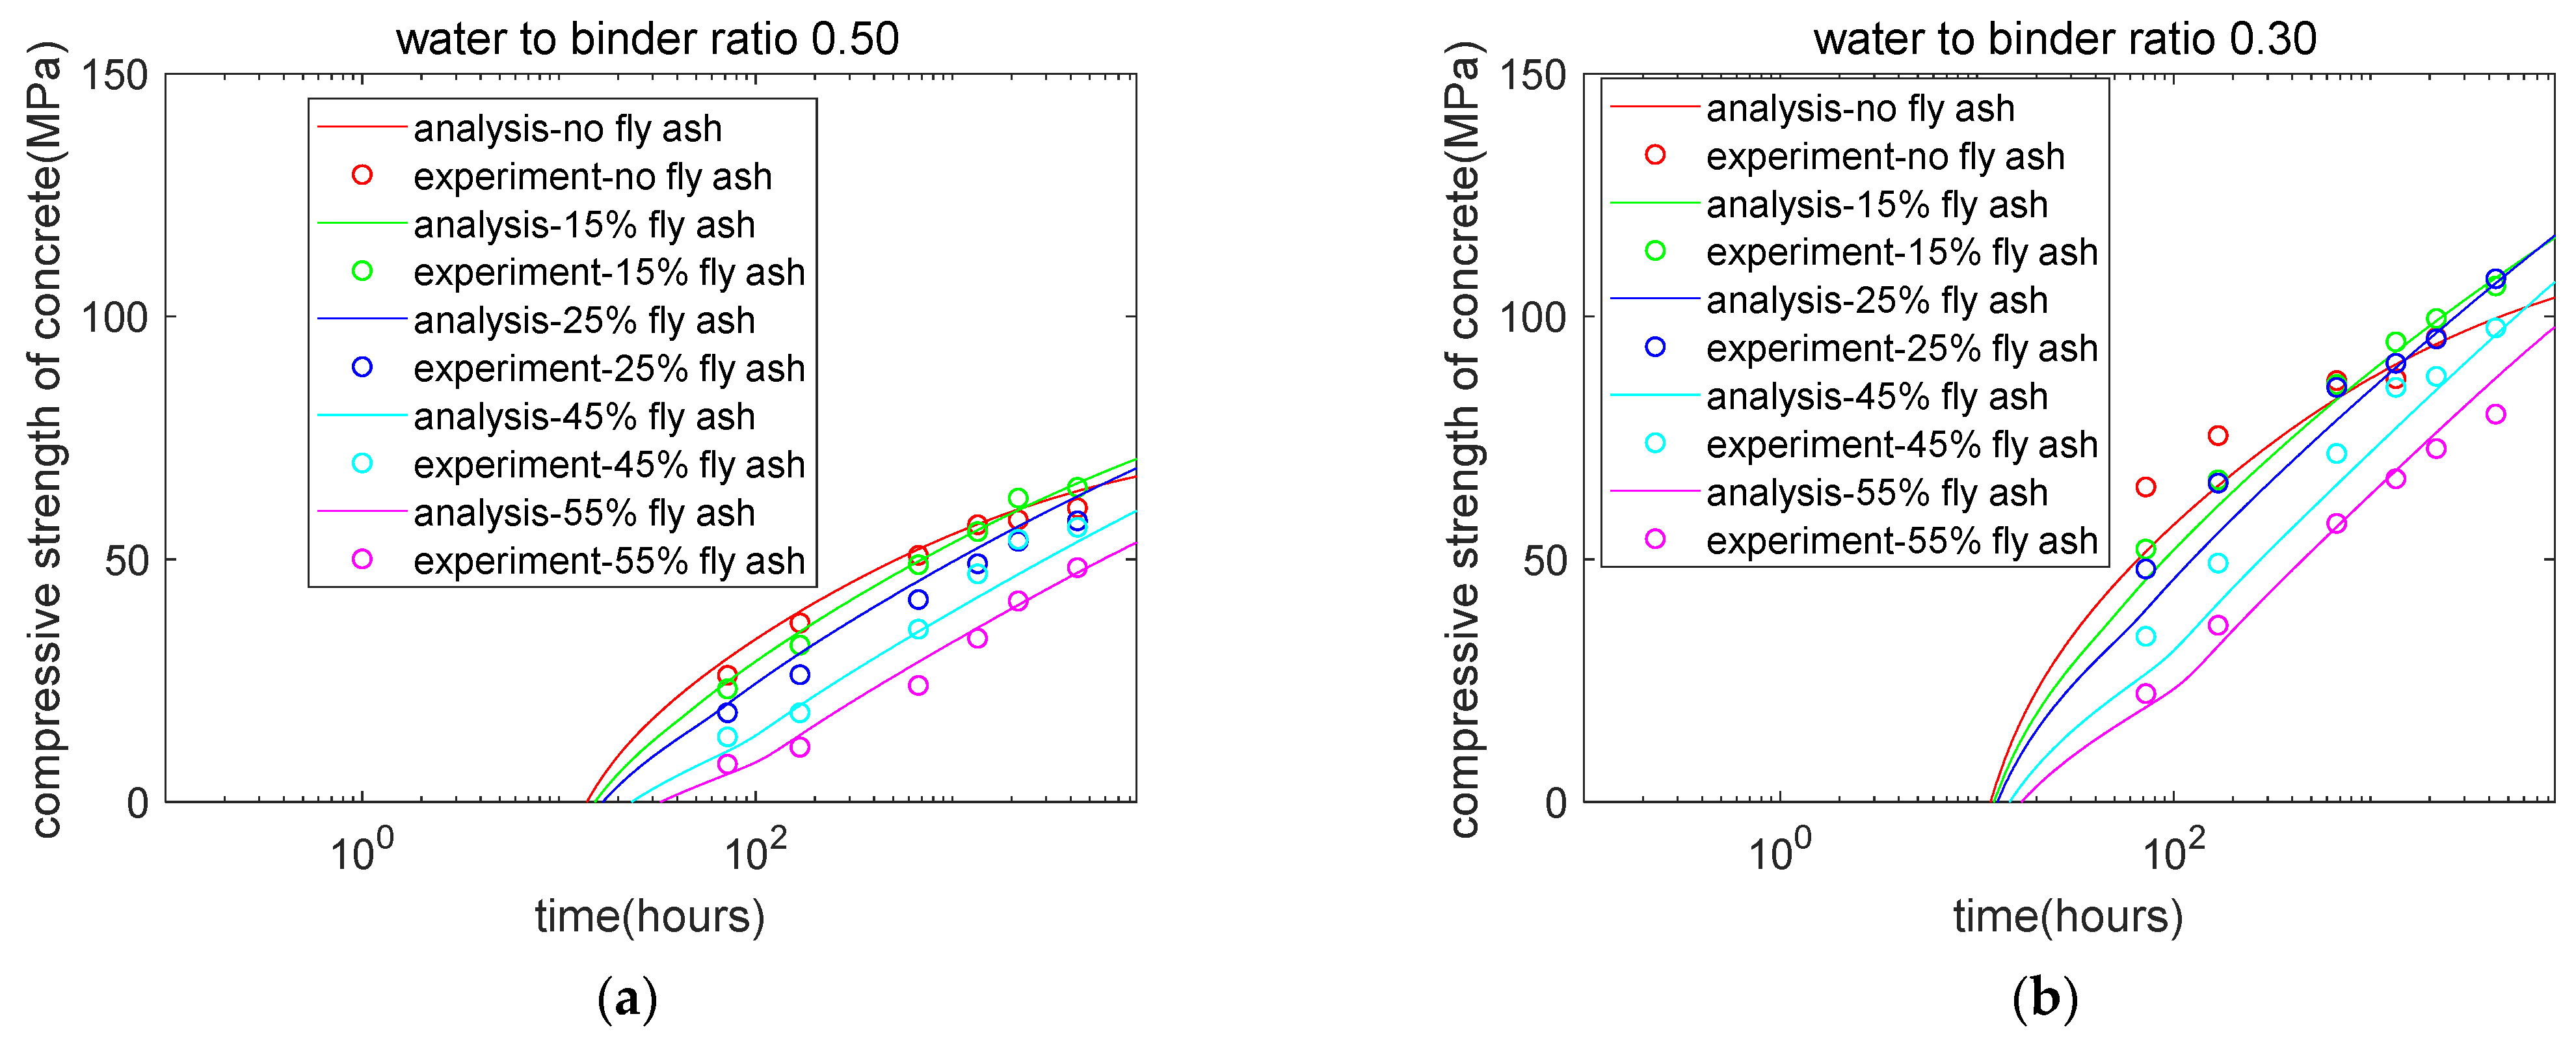
2.3. Verifications and Parameter Study of Strength Model

Figure 3a shows the verifications of the strength model. The experimental results were taken from [26,27]. The W/B of the experimental data ranged from 0.19 to 0.50, FA/B ranged from 0 to 55% and the tested ages ranged from 3 to 180 days. The experimental data covered a wide material and curing process, such as high- and normal-strength concrete, moderate and high contents of fly ash and early and late ages.
Based on the hydration models, CSH concrete contents of different mix proportions and ages were determined. Moreover, as shown in Figure 3a, for concrete of different mix proportions and tested ages, compressive strength showed a linear relationship with normalized CSH contents. In other words, the proposed strength equation is valid for different mixtures and ages. The values of the strength coefficients A1 and A2 were 80.49 and 17.15, respectively. Figure 3b shows the analytical versus experimental results. The coefficient of determination of regression (R-squared) was 0.953 and the root-mean-squared error of regression (RMSE) was 5.9 MPa. The main limitation of the strength evaluation model is that Equation (2) does not consider the influence of hydration products other than CSH on strength development. For example, the ettringite can contribute to the early-age strength of concrete.
Figure 4a,b show a parameter study of the strength model. Figure 4a shows that, for concrete with a W/B of 0.5, as FA/B increased, the starting time for strength was much longer because fly ash extended the setting time, especially for composite concrete with a high content of fly ash. Figure 4b shows that, for concrete with a W/B of 0.3, when FA/B increased, the extension of strength starting time was less obvious. This is due to the dilution effect, which increased the cement reaction degree and concrete strength [11,25]. Compared to the hydration-based strength (HBS) model shown in previous studies [9,18,19,20], the new contributions of this study are summarized as follows: (1) clarification of the dilution effect of fly ash on the hydration of cement; (2) clarification of the effect of the lower water/binder ratio on the development of binder reaction and CSH content; (3) clarification of the strength crossover effect for concrete with various water/binder ratios and fly ash contents.

3. CO2 Emissions and CO2 Reduction Strategy

3.1. CO2 Emission Models

CO2 emissions are an important index of concrete sustainability. CO2 emissions from the binder are the main source of concrete CO2 emissions, which can be evaluated as follows:
CO 2 = C 0 × 0.93 + P × 0.02
where 0.93 and 0.02 are the mass of CO2 emissions for 1 kg cement and fly ash, respectively [28]. CO 2 is CO2 emissions from the binder. The CO2 emissions of concrete consist of various components, such as CO2 emission from the material, CO2 emission from transportation and CO2 emission from the production of fresh concrete [17]. Compared with transportation and production, materials play a much more significant role in the CO2 emissions of concrete [17]. Hence, in this study, we only considered the CO2 emission from concrete materials. In future studies, CO2 emissions from transportation and production of fresh concrete should be considered. In addition, reference [28] does not present a CO2 emission model and only shows the values of CO2 emissions of 1 kg cement and 1 kg fly ash. In other words, the CO2 emission model is original in this study.
CO2 emissions for 1 MPa of concrete strength are determined as follows:
C U ( t ) = CO 2 f c ( t ) = C 0 × 0.93 + P × 0.02 80.49 × 2.85 × ( C 0 × f S , C × α + P × f S , P × α F A ) W 0 17.15
where C U is the CO2 emissions for 1 MPa strength.
Based on the concrete mixtures, CO2 emissions can be determined. By using the hydration-based strength model, the strength of concrete can be calculated. Moreover, CO2 emissions for 1 MPa strength can be determined.
The main limitation of the CO2 emission model is that Equation (3) does not consider the CO2 emissions from other materials (such as aggregates and water-reducing agents) and other processes (such as transportation processes and production processes). In further studies, a more concise analysis of CO2 emissions should be performed.

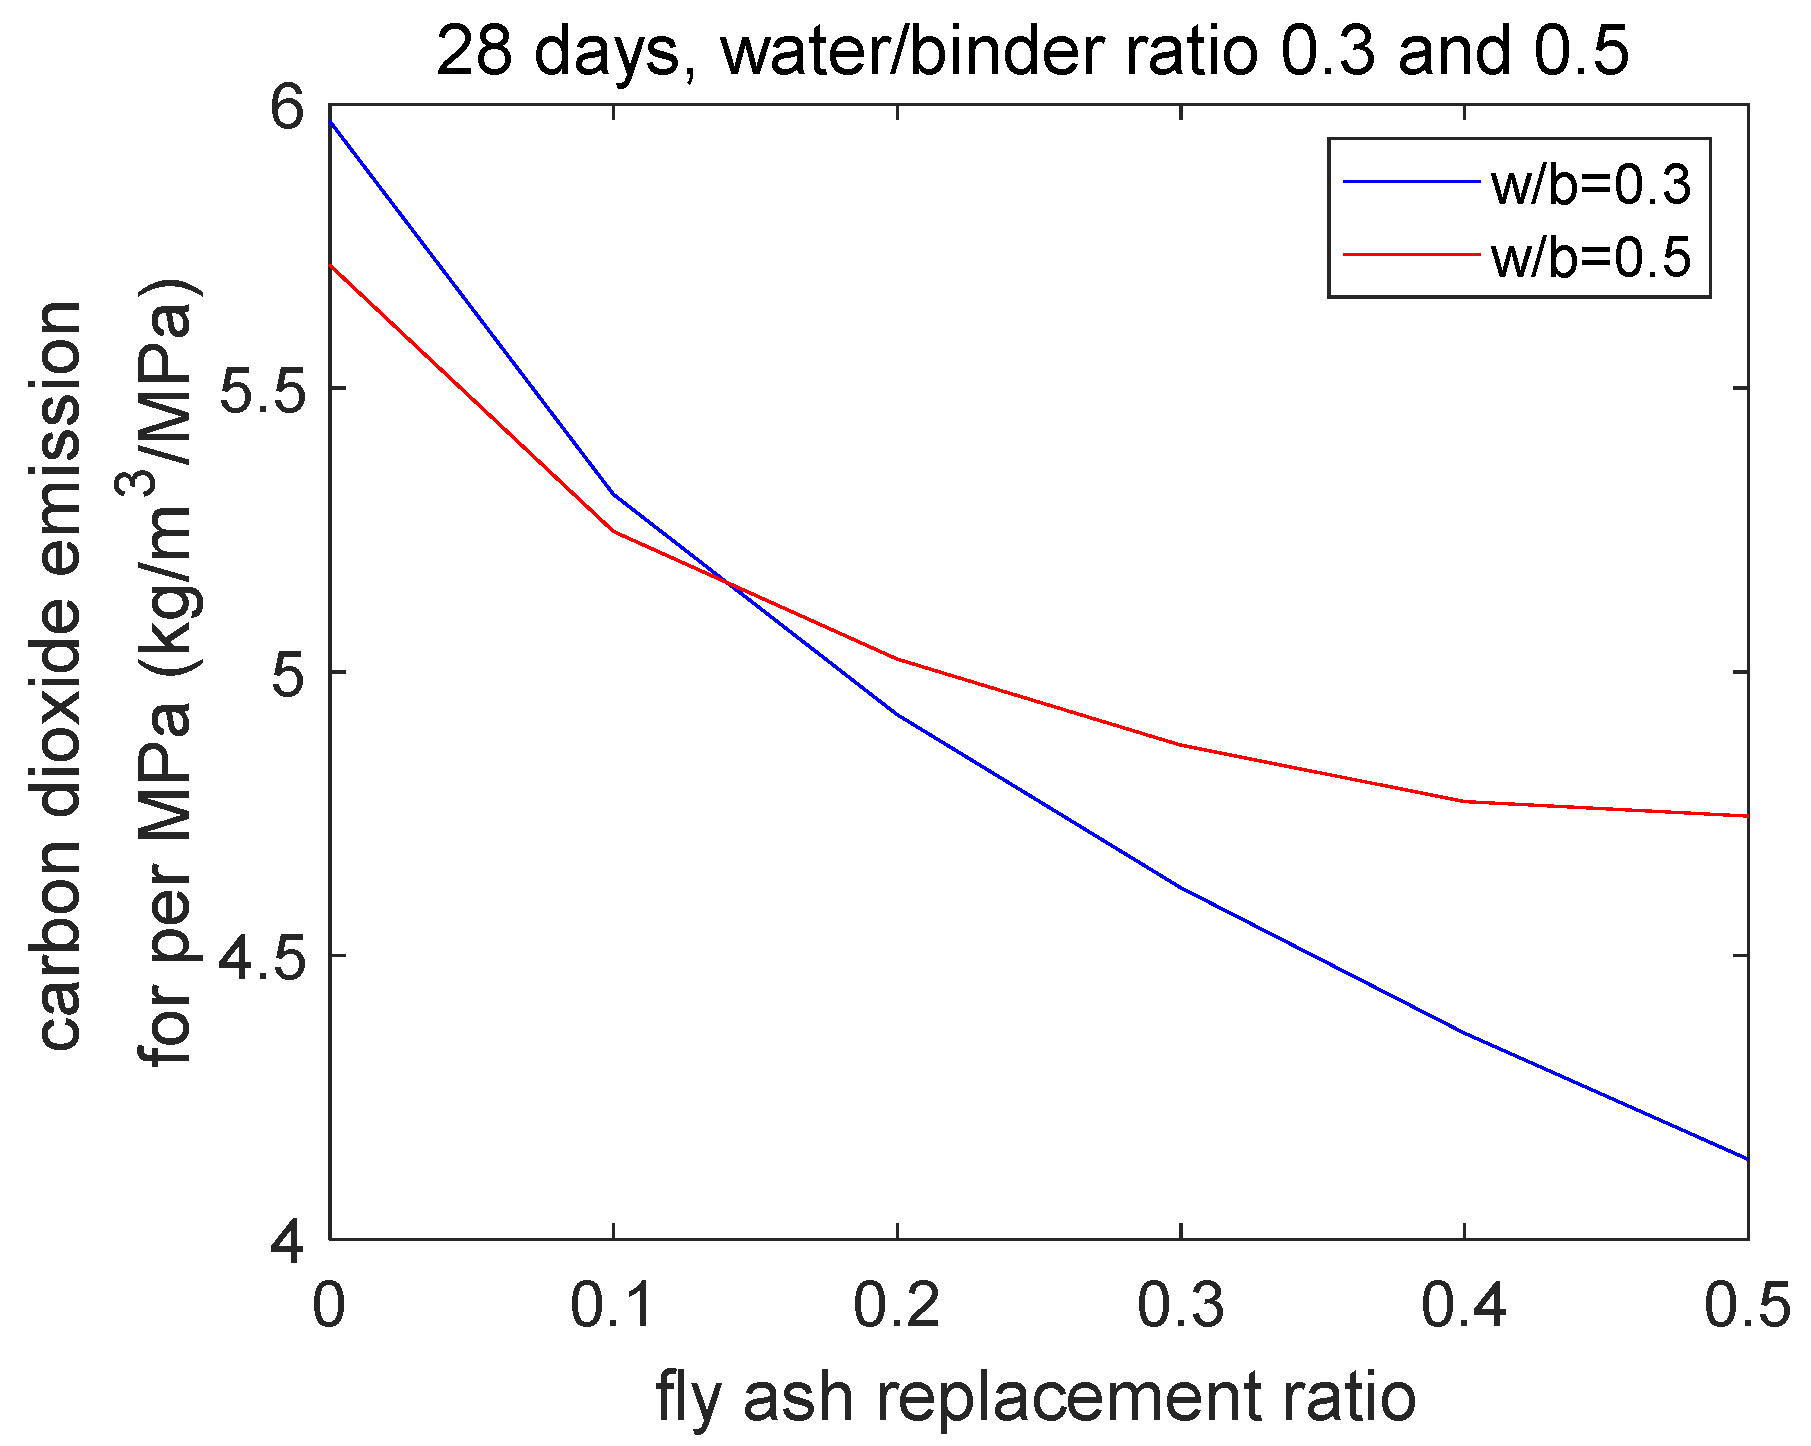
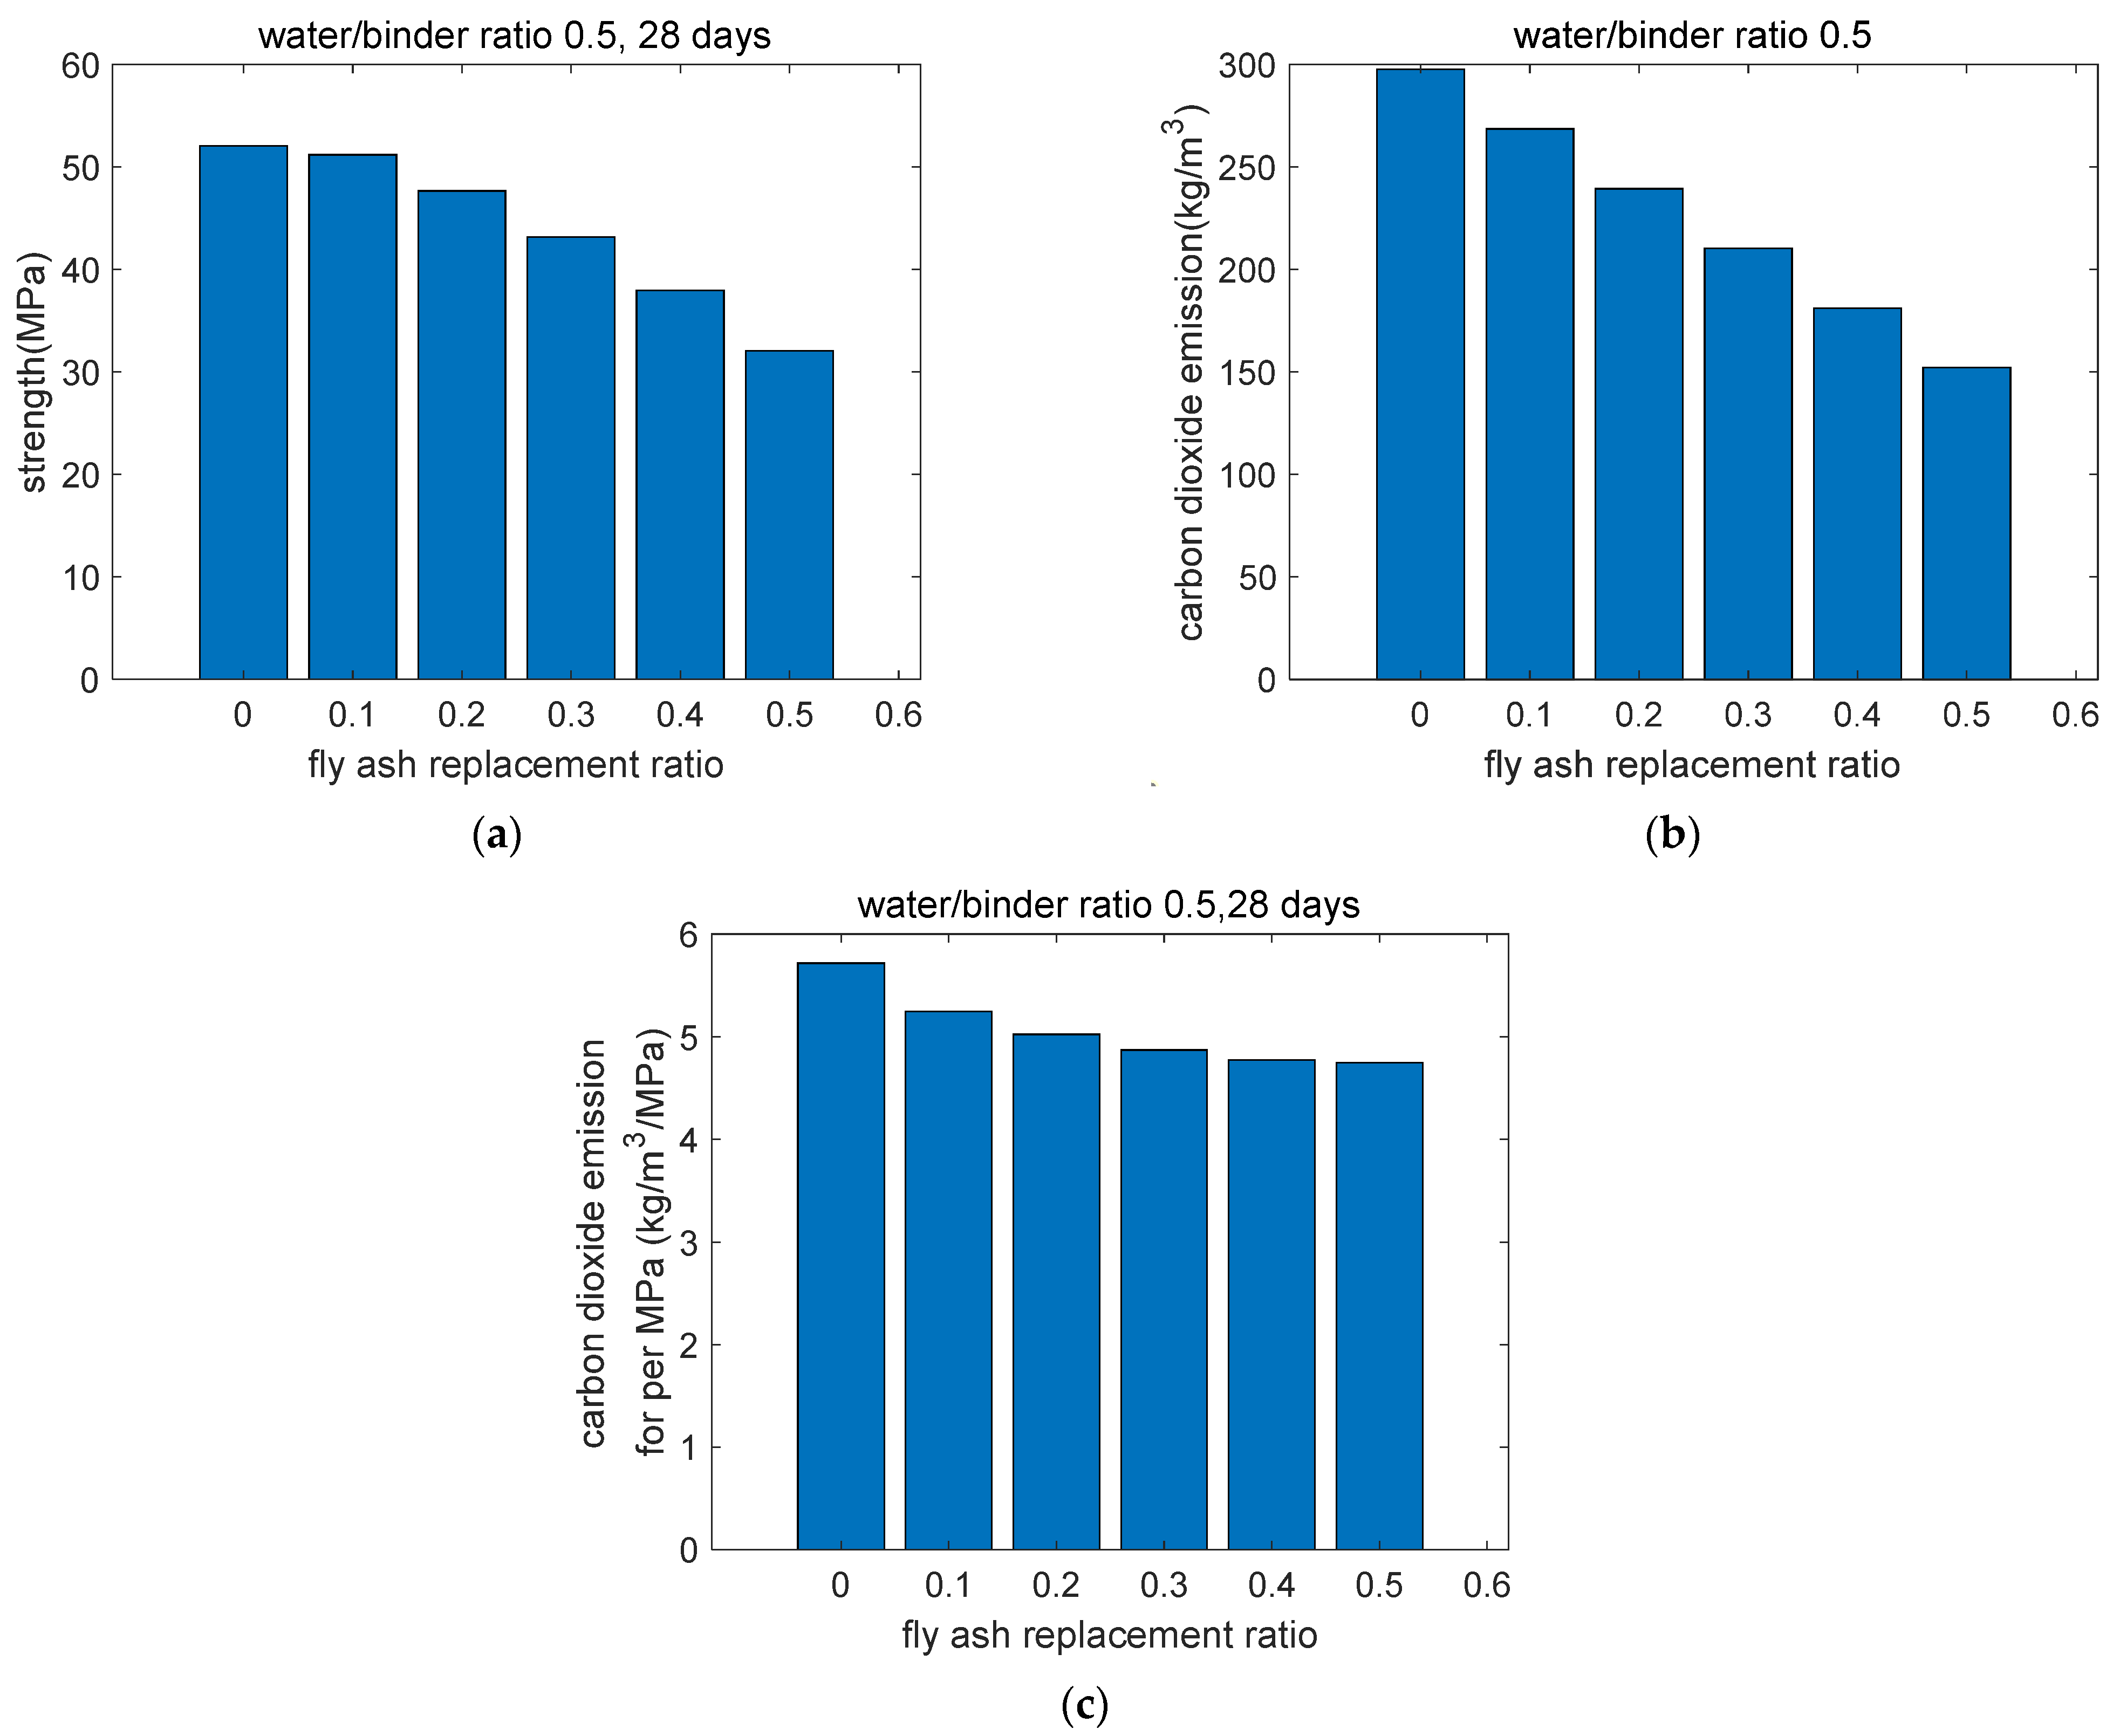
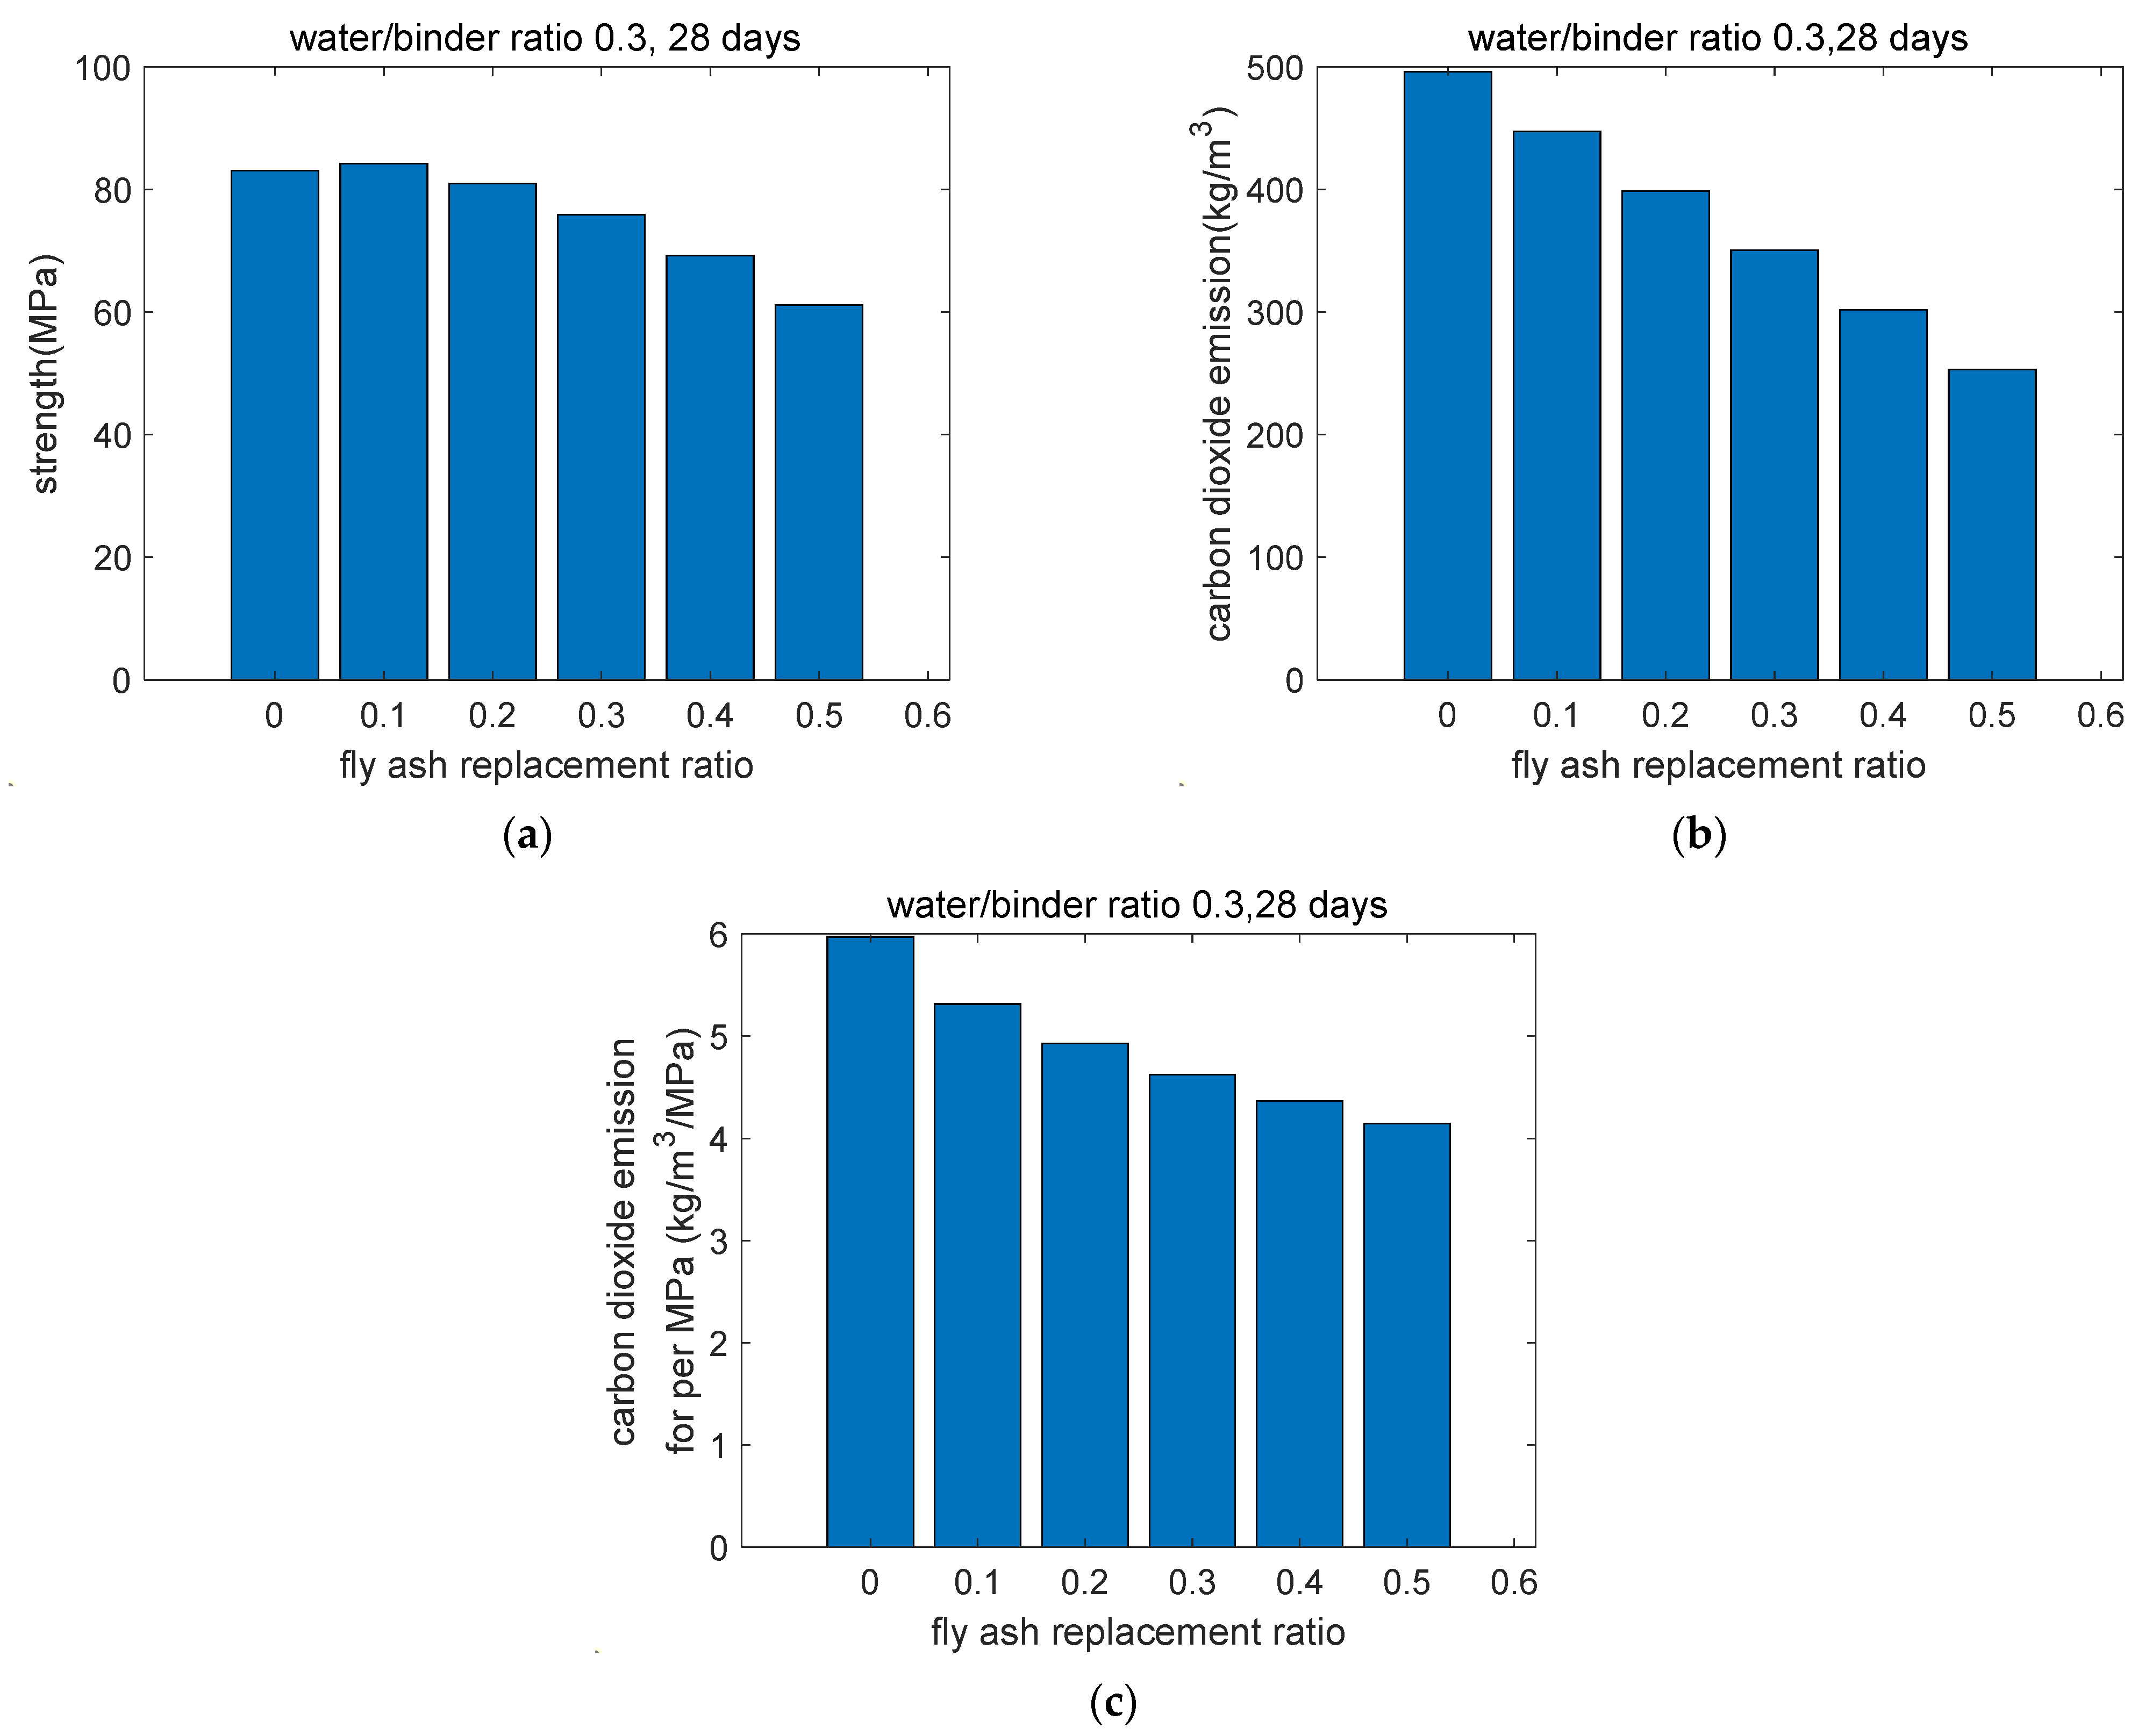
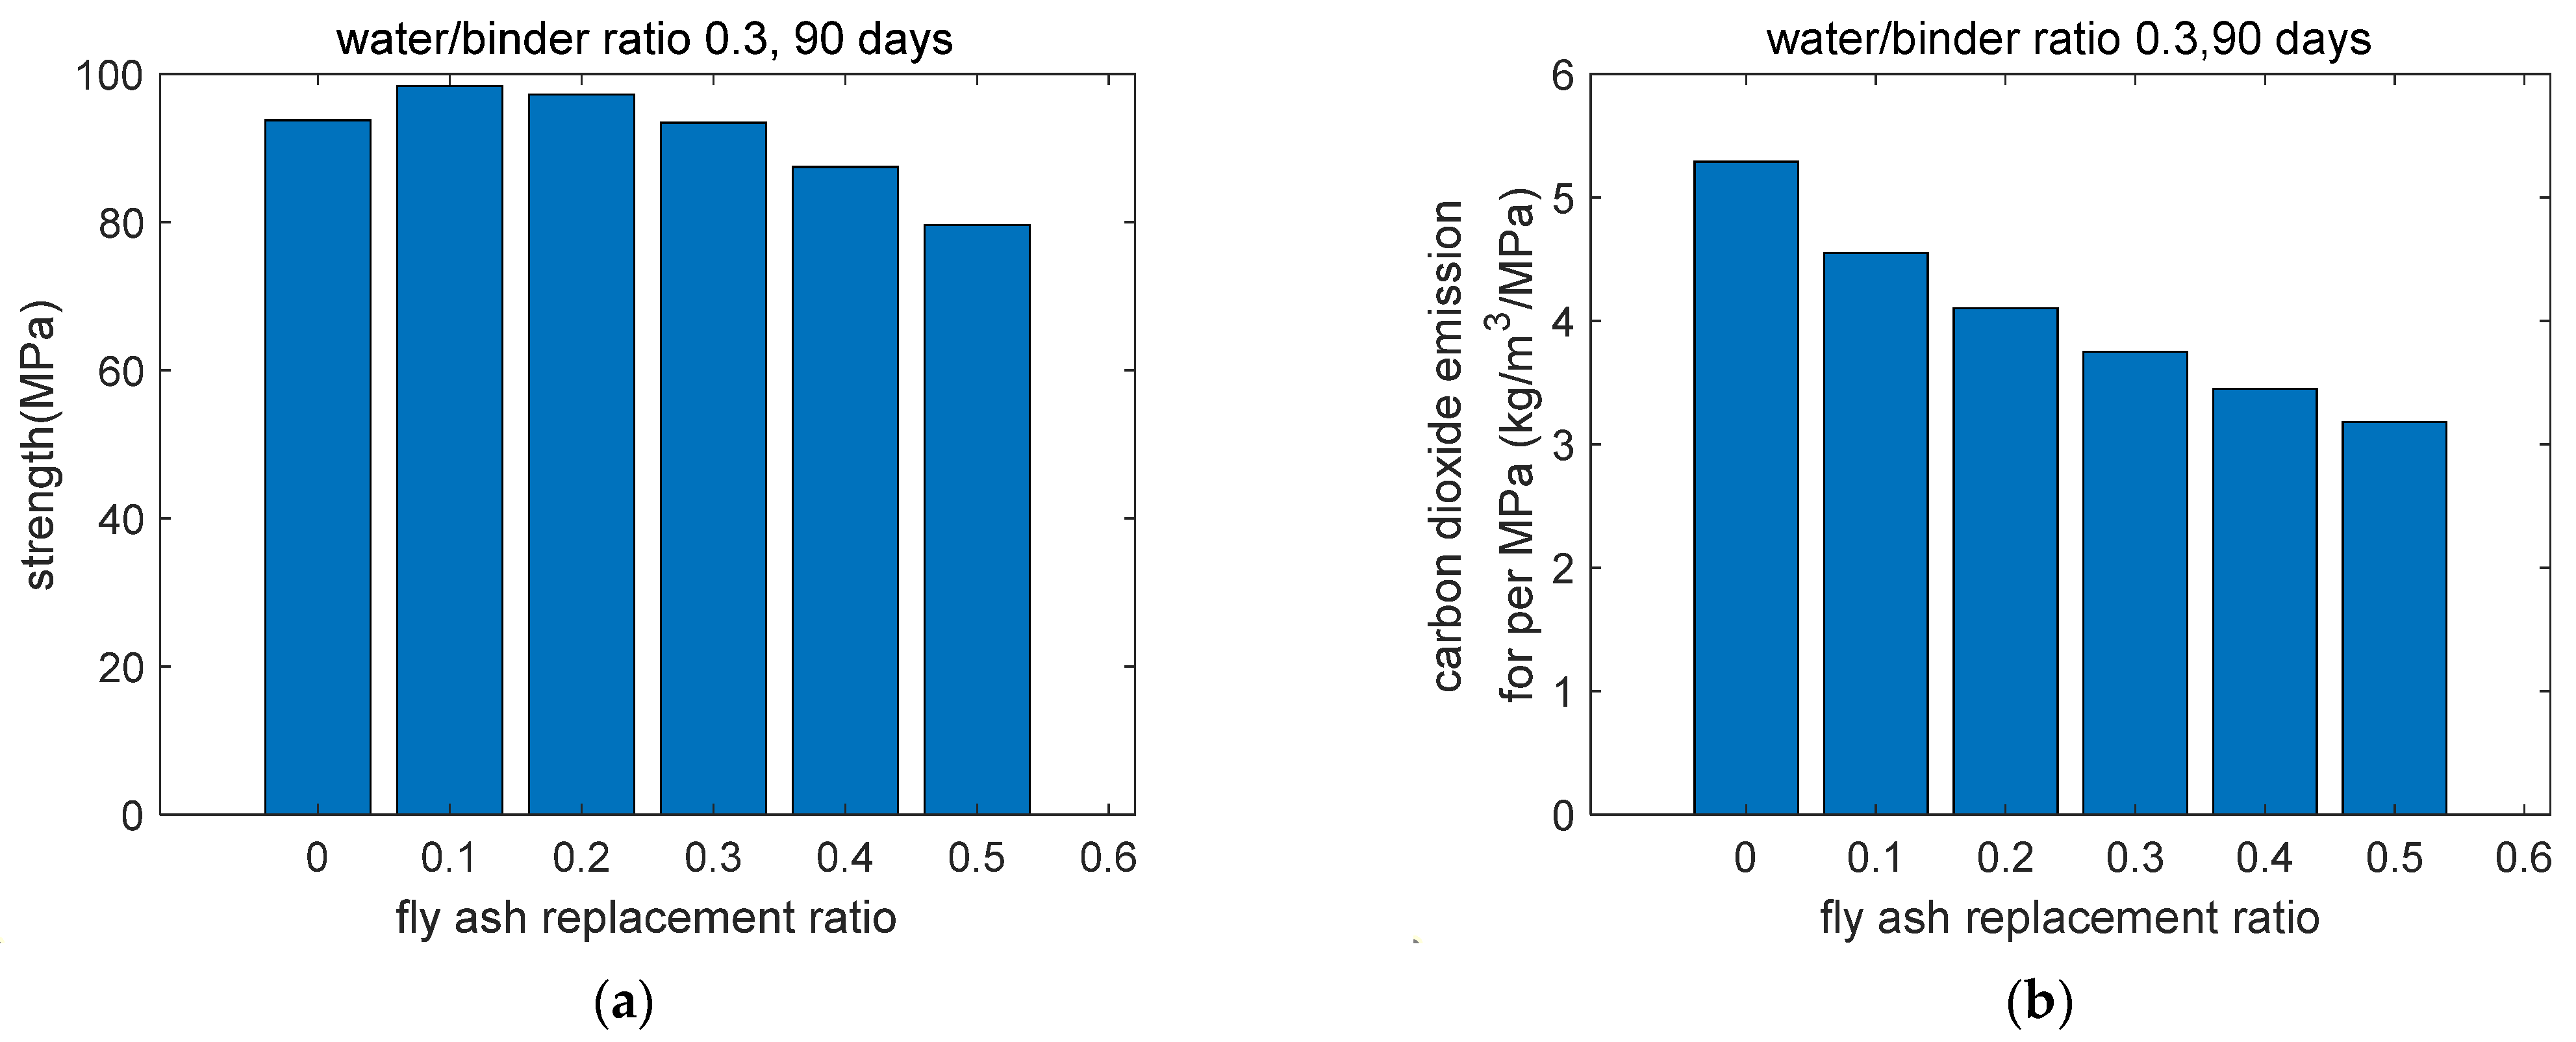
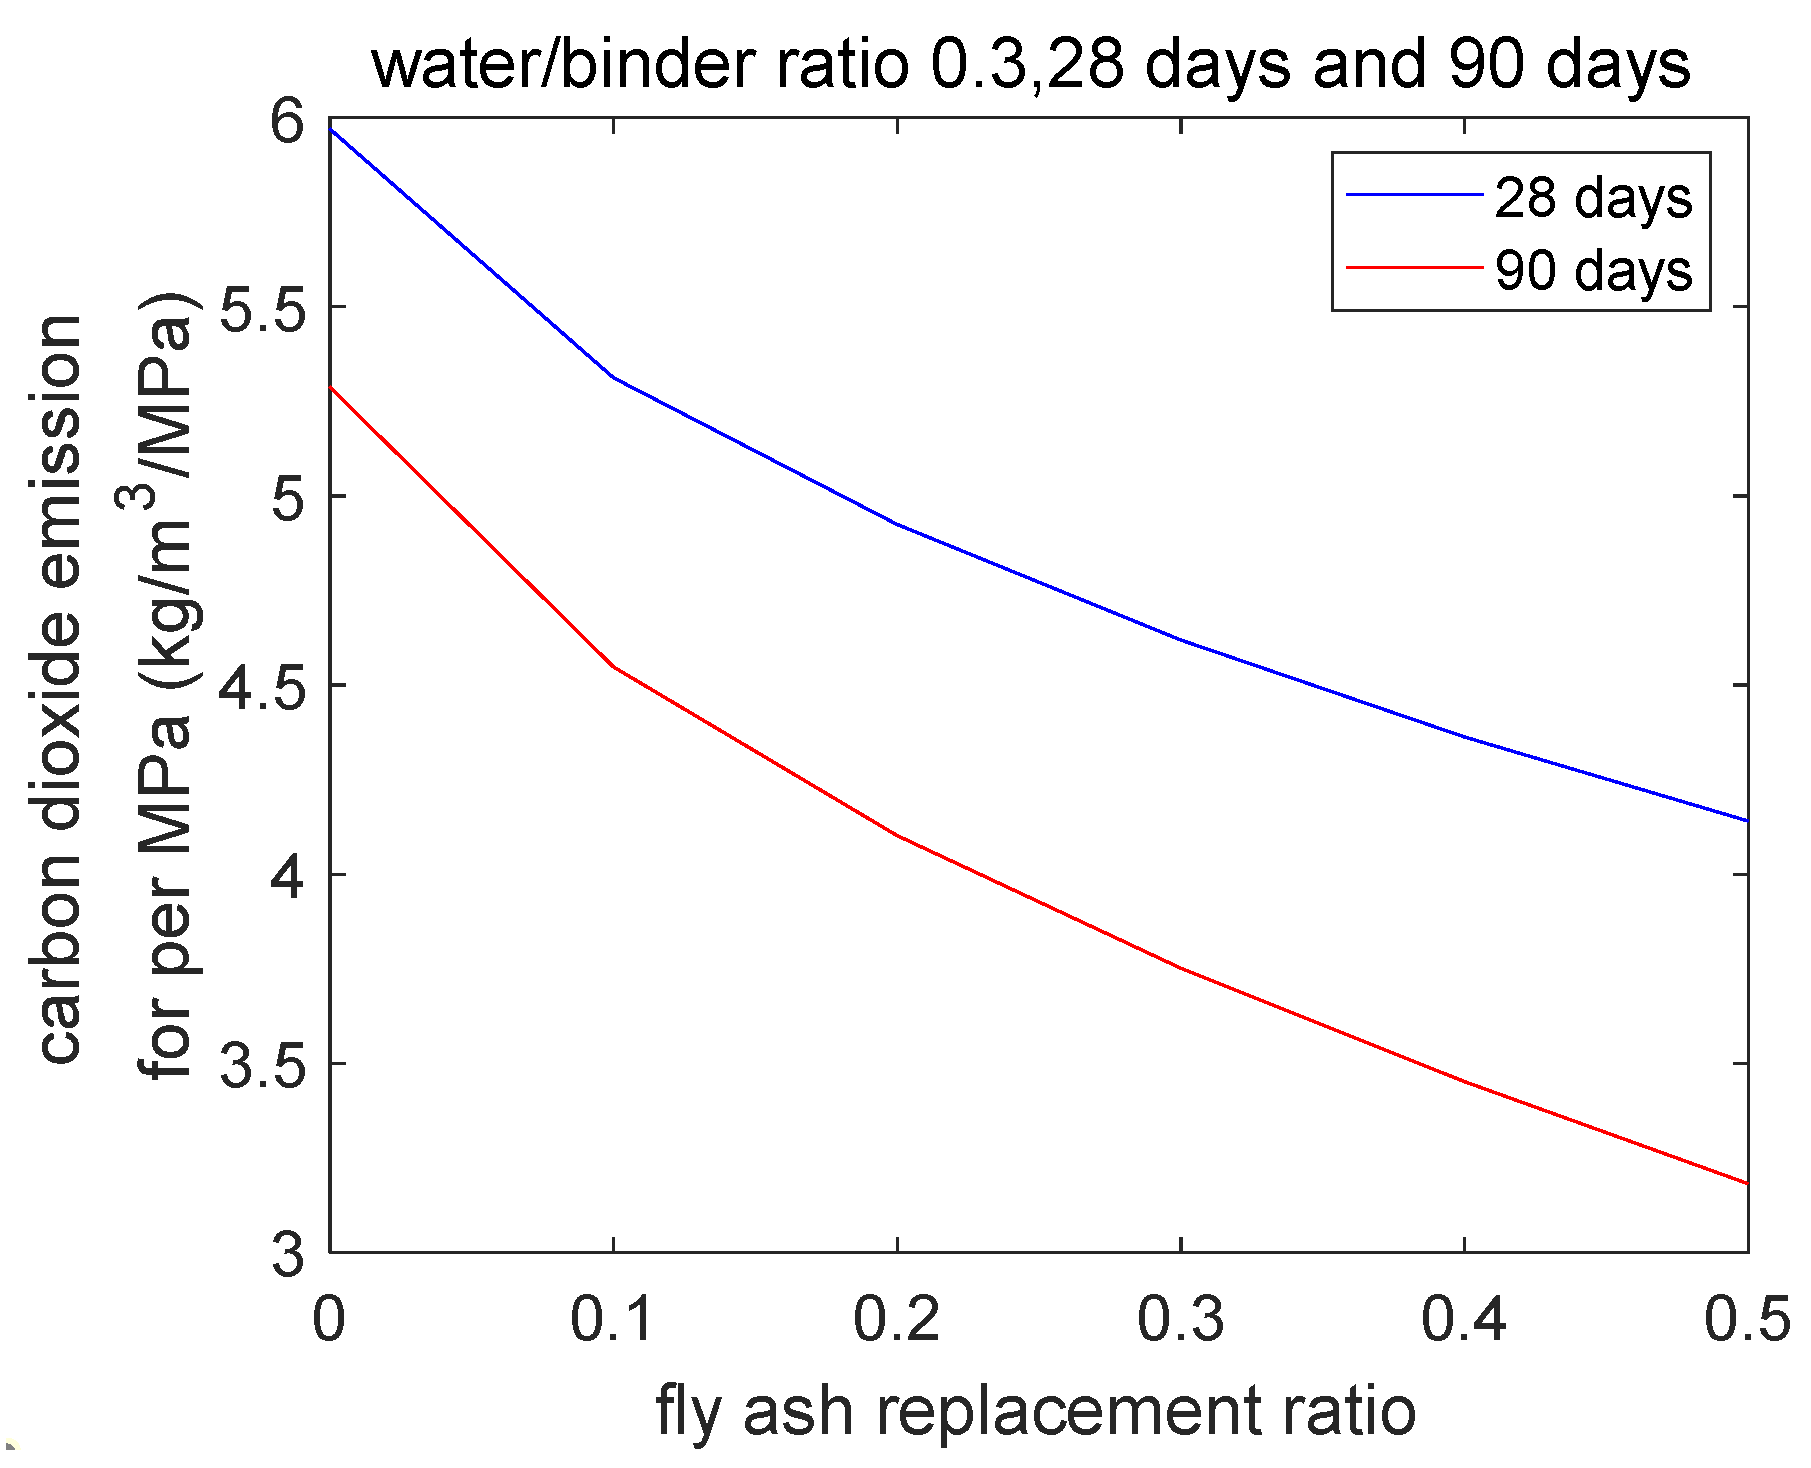
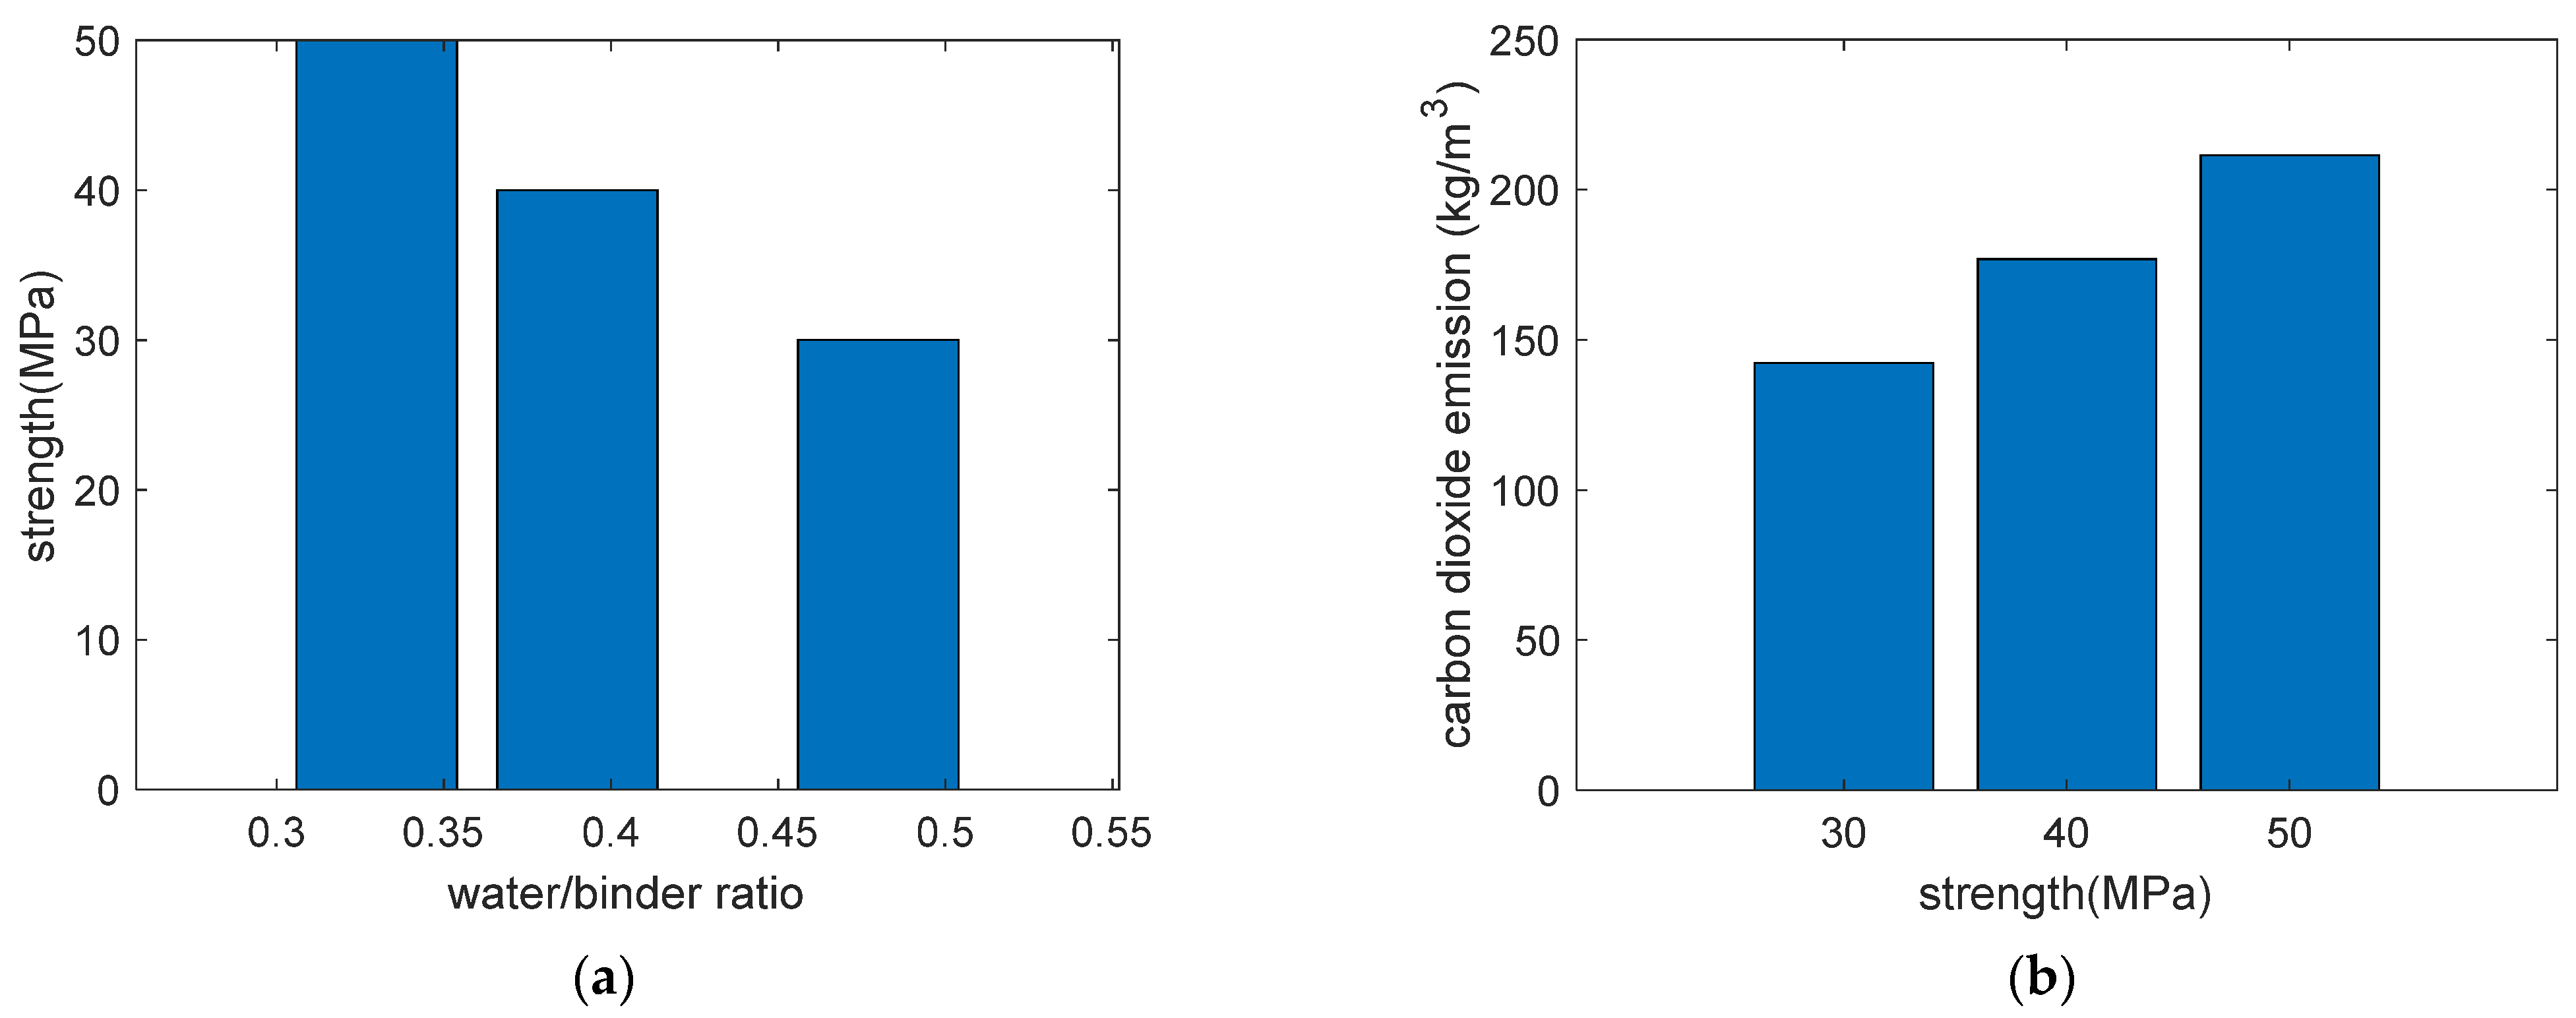
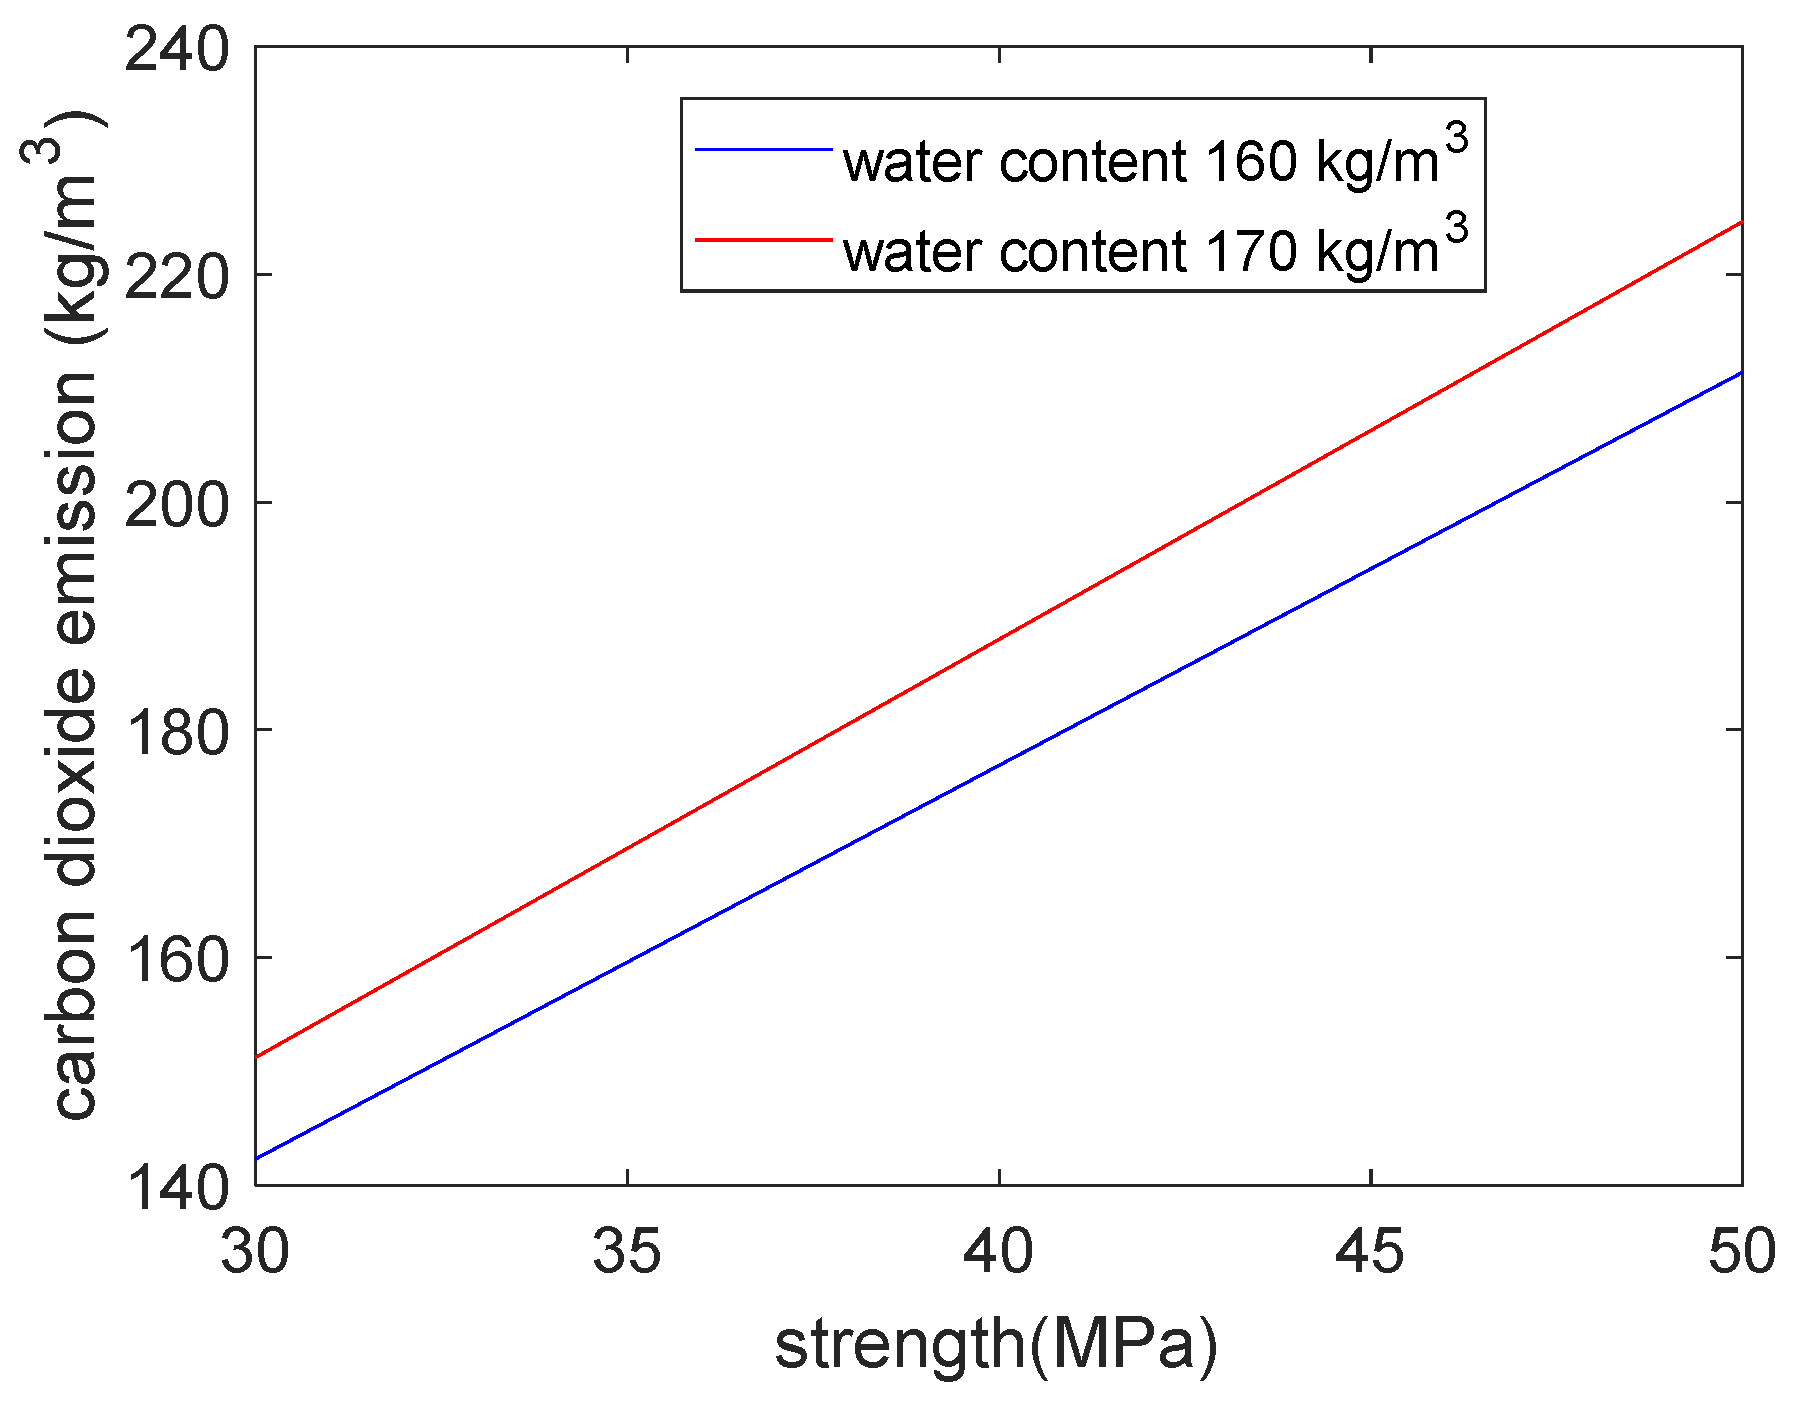
3.2. Parameter Analysis of CO2 Emissions and CO2 Reduction Strategy

Based on the hydration and the CO2 emission model, we analyzed integrated strength–CO2. Moreover, feasible strategies for low-CO2 concrete could be found based on the analytical results.
Figure 5 shows the CO2 emissions for concrete with a W/B ratio of 0.5. The water content was assumed to be 160 kg/m3 [15]. Figure 5a shows strength at the curing age of 28 days. As the fly ash replacement content increased, concrete strength decreased, especially for the case of 50% fly ash. Figure 5b shows that, as the fly ash replacement content increased, CO2 emission contents were also decreased because fly ash emitted less CO2 than cement. Figure 5c shows that, as fly ash content increased, the CO2 emissions for 1 MPa strength were decreased. In other words, to reach the same strength at 28 days, fly ash composite concrete showed fewer CO2 emissions than plain cement did.
Figure 6 shows the CO2 emissions for concrete with a W/B ratio of 0.3. The water content was assumed to be the same as that for a W/B of 0.5 [15]. Figure 6a shows the strength at the curing age of 28 days. When the fly ash replacement content was 10%, fly ash composite concrete had better strength than plain concrete. This is due to the dilution effect, which was obvious for concrete with lower W/B [11,25]. Figure 6b shows the CO2 emissions of concrete. As the W/B ratio decreased from 0.5 to 0.3, CO2 emissions increased due to the increase in binder contents. Figure 6c shows the CO2 emissions for 1 MPa strength. The trend of Figure 6c is similar to that of Figure 5c, showing that fly ash composite concrete is an option for producing sustainable concrete.
Figure 7 displays the effect of the W/B ratio of concrete on unit CO2 emission. For plain concrete and 10% fly ash composite concrete, the CO2 emission unit strength for W/B = 0.3 was higher; for concrete with 20–50% fly ash, the CO2 emission unit strength for W/B = 0.3 was lower. This is because of the dilution effect of fly ash, which can increase the reaction degree and strength of cement [11,25] and reduce the CO2 emissions of unit strength. Hence, the low W/B ratio of concrete with a high content of fly ash is helpful for the improvement of concrete sustainability. For concrete with a low W/B ratio, on the other hand, no fly ash or a small proportion of fly ash is not a good choice to reduce CO2 emissions.
Figure 8 shows CO2 emissions for composite concrete with a W/B ratio = 0.3 at the curing age of 90 days. Figure 8a shows that, at the curing age of 90 days, 10% and 20% fly ash concrete showed better strength than plain concrete, 30% fly ash concrete had comparable strength to plain concrete and 40% and 50% fly ash concrete had worse strength than plain concrete. From 28 days to 90 days, the strength crossover of composite concrete was obvious. Figure 8b shows CO2 emissions for 1 MPa strength. As FA/B increased, the CO2 emission unit strength was reduced. Moreover, as shown in Figure 9, from 28 to 90 days, CO2 emissions for 1 MPa strength were reduced. In other words, the extension of design age is helpful in reducing the CO2 emissions of the concrete industry.

4. Genetic Algorithm-Based-Optimal Design of Low-CO2 Fly Ash Composite Concrete

To use the integrated hydration–strength–CO2 emission models in Section 2 and Section 3, the individual mass of cement, fly ash and water must be first known. In engineering practices, concrete producers are interested in other issues, i.e., given a certain strength, how to find the binder combinations of concrete that has the minimum CO2 emissions.
This section shows a numerical method to determine the optimal cement mass and fly ash mass for low-CO2 fly ash composite concrete. Two design examples with different water contents (160 kg/m3 and 170 kg/m3) and different 28 days design strengths (30, 40 and 50 MPa) are shown. The optimal cement mass and fly ash mass were determined using a genetic algorithm [18,19]. Moreover, the water/binder ratio and fly ash/binder ratio were calculated using the masses of water, cement and fly ash. The details of the numerical method and design examples are shown in the following Section 4.1 and Section 4.2

4.1. Aim Function and Constraint Function of Optimal Design

4.1.1. Aim of Optimal Design of Low-CO2 Concrete

CO2 emission is an essential index of sustainability. This section shows an optimization procedure to achieve the aim of low-CO2 emissions while meeting the requirement of strength. Low-CO2 emission is the aim function of the optimal design and the requirement of strength belongs to a constraint of the optimal design.
The aim of low-CO2 emission concrete is shown as follows:
min ( CO 2 ) = min ( C 0 × 0.93 + P × 0.02 )

4.1.2. Constraint of Strength

The constraint of strength means that the real strength should be higher than the design strength. The constrain of strength is shown as follows:
f c ( t ) f cr
where f c ( t ) is the real strength at the age t and f cr is the design strength. This section assumes the 28 days design strength as three levels, i.e., 30, 40 and 50 MPa. Hence, Equation (6) can be written as follows:
f c ( 28 days ) 30 , 40 ,   or   50 MPa
Furthermore, based on the cement–fly ash composite hydration model, Equation (7) can be re-written as follows:
80.49 × 2.85 × ( C 0 × f S , C × α 28 + P × f S , P × α F A 28 ) W 0 17.15 30 , 40 ,   or   50 MPa
where α 28 and α F A 28 are the reaction degrees of cement and fly ash at the age of 28 days, respectively. α 28 and α F A 28 are not constants. α 28 and α F A 28 can be calculated using the hydration models shown in Section 2.1. f S , C and f S , P are 0.20 and 0.50, respectively.

4.1.3. Constraint of Fly Ash/Binder Ratio

For high-volume fly ash concrete used in engineering practices, the fly ash/binder ratio is generally less than 55% [18,19]. Hence, the constraint of fly ash/binder ratio can be written as follows:
fly ash binder 0.55

4.2. Genetic Algorithm to Determine Optimal Combinations

4.2.1. Optimal Combinations of Example 1 (Water Content = 160 kg/m3)

As shown in Equation (5), CO2 emissions mainly depend on the content of the mass of cement and the mass of fly ash. As shown in Equation (8), 28 days’ strength mainly depends on the water/binder ratio and fly ash/binder ratio. Hence, given a certain water content, we can find optimal cement mass and fly ash mass, which can minimize CO2 emissions while meeting the requirement of strength.
A genetic algorithm is a general method to find the optimal global solutions with various constraints [18,19]. Borrowing from the theory of biological evolution, a genetic algorithm simulates the problem to be solved as a biological evolution process through selection, crossover, mutation and other operations to produce next-generation solutions and gradually eliminate solutions with low fitness values and increase solutions with high fitness values. In this way, after N generations of evolution, individuals with high fitness values are evolved [18,19].
In this study, the genetic algorithm optimization toolbox in MATLAB (MathWorks, Natick, MA, USA) was used to find the optimal cement mass and fly ash mass. The aim of optimization is CO2 emissions. The constraints of optimization consist of strength and fly ash/binder ratio. In this section, the water content was assumed to be 160 kg/m3.
The optimal results of cement mass and fly ash mass are shown in Table 1. Moreover, the water/binder ratio and fly ash/binder ratio could be calculated. The water/binder ratios for the strength values of 30, 40 and 50 MPa concrete were 0.48, 0.39 and 0.33, respectively. The CO2 emissions for the strength values of 30, 40 and 50 MPa concrete were 151.22, 187.94 and 224.65 kg/m3, respectively. In other words, as the strength of concrete increased, the water/binder ratio decreased and the CO2 emissions increased (shown in Figure 10). The trends of water/binder ratio and CO2 emission of optimal solutions show agreement with the references [18,19]. In addition, for the different strength cases of 30, 40 and 50 MPa, the fly ash/binder equaled 55%, which is the upper limit of the fly ash replacement ratio. This is because the CO2 emission of fly ash is much lower than that of cement. When the aim of the optimal design is CO2 emissions, the fly ash content is to be as high as possible.

4.2.2. Optimal Combinations of Example 2 (Water Content = 170 kg/m3)

In Section 4.2.1, the water content considered is 160 kg/m3. In engineering practices, to reach different slumps, the water content may be different. In this section, we assumed the water content to be 170 kg/m3. In other words, the only difference between Section 4.2.1 and Section 4.2.2 is the water content and the other conditions are the same.
Based on the genetic algorithm, the optimal results of cement mass, fly ash mass, water/binder ratio and fly ash/binder ratio were determined, as shown in Table 2. Based on the comparisons between Table 1 and Table 2, we can see that, to obtain the same strength, the water/binder ratio and fly ash/binder ratio were the same. Moreover, as the water content increased from 160 to 170 kg/m3, the masses of cement and fly ash increased and CO2 emissions also increased (shown in Figure 11).

4.2.3. Optimal Combinations of Example 3 (Fly Ash CO2 Emission of 0.2 kg/kg)

In the results of the former examples 1 and 2 (shown in Section 4.2.1 and Section 4.2.2, respectively), the CO2 emission of fly ash is 0.02 kg/kg. In example 3, we changed the CO2 emission of fly ash from 0.02 to a much higher value, i.e., 0.2 kg/kg. The increment in CO2 may be because of longer transportation distance [17]. The other items are the same as examples 1 and 2. The 28-day strength was set as 55 MPa. Based on the genetic algorithm, the mass of cement and fly ash were determined, as shown in Table 3. The fly ash/binder ratio for the optimal combinations equaled 0.044, which is much lower than the upper limit of 0.55. This is because, from example 2 to example 3, the CO2 emission of fly ash increased ten times. Consequently, example 3 shows much less fly ash content than example 2.
Summarily, based on the results of examples 1–3, we can see that the constraint of the fly ash/binder ratio cannot be directly used for the optimal design. The fly ash/binder ratio in the optimal mixtures depends on the CO2 emission of fly ash. When fly ash shows a much lower CO2 emission, the fly ash/binder ratio of optimal mixtures is equal to the constraint value (examples 1 and 2). However, when the fly ash shows a relatively higher CO2 emission, the fly ash/binder ratio of optimal mixtures is much lower than the constraint value (example 3).

4.3. Summary of Design Examples

Based on the analysis of design examples, we can infer the following: (1) the genetic algorithm was effective in finding the optimal cement mass and fly ash mass of low-CO2 composite concrete; (2) the analysis results show that, for different 28-day strengths (30, 40 and 50 MPa), the fly ash/binder ratio equaled the upper limit (this is because fly ash presents a much lower CO2 emission than cement); (3) the analysis results show that, as the strength of concrete increased, the water/binder ratio decreased and the CO2 emissions increased (the trends of the analysis results show agreement with the references [18,19]); (4) the analysis results show that, as the water content increased from 160 to 170 kg/m3, to obtain the same strength, cement mass and fly ash mass increased while the water/binder ratio and fly ash/binder ratio did not change; and (5) the analysis results show that the reduction in mixed water is one feasible way to lower CO2 emissions.
In addition, for different design codes, the strength calculation equations may be different. Because the solution process of genetic algorithms does not depend on the format of specific equations [18,19], the proposed genetic-algorithm-based optimal design method can be used as a general way for different codes to design low-CO2 fly ash composite concrete.

5. Discussions

This study presents an integrated strength–CO2 emission model for fly ash composite concrete.
First, the proposed integrated HBS–CO2 emission model shows some benefits. Above all, the proposed model has a clear theoretical background because the HBS model is based on the blended hydration model, which considers the chemical and physical properties of binders, mixtures of concrete and curing conditions of concrete. Next, the proposed HBS model has a wide application range because it is valid for various mixtures (such as high strength and ordinary strength, as well as high fly ash contents and moderate fly ash contents) and various ages (such as early age and late age).
Second, the best benefit of the HBS model is its simple format, i.e., strength has a linear relationship with the CSH content per gram of water. Moreover, the HBS model could reflect the fundamental mechanisms of strength development, such as fly ash reaction and cement hydration. The HBS model also considers the dilution effect due to fly ash additions [11,25]. The strength coefficients of the HBS model are not dependent on concrete mixtures and ages.
Third, previous studies on low-CO2 concrete mainly focused on the replacement percentages of fly ash [15,29]. However, previous studies did not pay enough attention to the W/B ratio [30,31,32]. This study shows that, for plain concrete with a low W/B ratio, the degree of hydration of Portland cement is low. The large amount of anhydrous cement is a waste of resources. When fly ash replaces partial Portland cement because of the dilution effect, the degree of hydration of cement increases [11,25]. The amount of anhydrous cement is reduced and the waste of resources can be eliminated [33,34].
Fourth, concrete producers want to know, given a certain strength, how to find the binder combinations of concrete that has the minimum CO2 emissions. The genetic algorithm proposed in this study is effective in answering this question because the genetic algorithm could find the optimal cement mass and fly ash mass of low-CO2 composite concrete. The trends of optimal design results of the genetic algorithm show agreement with engineering practices.
Fifth, some limitations of this study need to be improved, such as the strength model considering hydration products other than CSH and the CO2 emissions model considering the aggregate, transportation process and production process [33,34]. Moreover, this study focuses on the material design. An integrated design considering materials and structures should be created in further work.

6. Conclusions

This study presents an integrated analysis of the strength development and CO2 emissions of fly ash composite concrete.
First, a hydration-based strength (HBS) model is proposed for the evaluation of the strength of fly ash composite concrete. The analysis covered a wide range of material and curing processes, such as high- and normal-strength concrete, moderate and high fly ash content and early and late curing ages. The results of the HBS model showed good agreement with the experimental results.
Second, the HBS model is based on a blended model of hydration that considers the reaction of fly ash, cement hydration and the dilution effect. CSH content is determined by using the hydration model. Moreover, the strength of concrete is determined as a linear equation of CSH contents. The R-squared (coefficient of determination) of the HBS model was 0.953 and the RMSE of the HBS model was 5.9 MPa. The HBS model showed that, as the W/B ratio decreased, the delay of strength starting time of fly ash composite concrete was less obvious and the strength crossover between plain concrete and fly ash composite concrete became obvious.
Third, based on the hydration and CO2 emission models, an integrated strength–CO2 analysis was conducted. The analytical data showed that, as FA/B increased, the CO2 emissions for 1 MPa strength decreased. For low W/B ratio concrete, the addition of high content of fly ash had an obvious dilution effect, which could increase the reaction degree of cement and strength and reduce CO2 emissions for 1 MPa strength. In addition, the extension of design age reduced the CO2 emissions for 1 MPa strength.
Fourth, a genetic-algorithm-based model was proposed to carry out the optimal design of low-CO2 fly ash composite concrete. The analysis results show that, for different 28 days strengths (30, 40 and 50 MPa), the fly ash/binder ratio of optimal mixtures equaled the upper limit. As the water contents increased from 160 to 170 kg/m3, to obtain the same strength, cement mass and fly ash mass of optimal mixtures increased while the water/binder ratio and fly ash/binder ratio of optimal mixtures did not change. Hence, the reduction in mixed water is one feasible way to lower CO2 emissions.
The proposed method is useful for designing sustainable fly ash composite concrete with the aimed strength and low levels of CO2 emissions. This study presents four methods for producing low-CO2 concrete, namely, replacing partial cement with fly ash, selecting concrete with a low W/B and high content of fly ash, extending the design age and lowering the mixed water content.

Author Contributions

Conceptualization, R.-S.L.; methodology, Y.H. and X.-Y.W.; validation, R.-S.L., Y.H. and X.-Y.W.; writing—original-draft preparation, R.-S.L. and X.-Y.W.; writing—review and editing, R.-S.L., Y.H. and X.-Y.W.; visualization, Y.H. and X.-Y.W.; supervision, R.-S.L. and X.-Y.W. All authors have read and agreed to the published version of the manuscript.

Funding

This study was supported by the National Research Foundation of Korea (NRF-2020R1A2C4002093).

Institutional Review Board Statement

Not applicable.

Informed Consent Statement

Not applicable.

Data Availability Statement

The data presented in this study are available from the corresponding author upon reasonable request.

Conflicts of Interest

The authors declare no conflict of interest.

References

  1. Hemalatha, T.; Ramaswamy, A. A review on fly ash characteristics—Towards promoting high volume utilization in developing sustainable concrete. J. Clean. Prod. 2017, 147, 546–559. [Google Scholar] [CrossRef]
  2. Moffatt, E.G.; Thomas, M.D.; Fahim, A. Performance of high-volume fly ash concrete in marine environment. Cem. Concr. Res. 2017, 102, 127–135. [Google Scholar] [CrossRef]
  3. Ahmadi-Nedushan, B. Prediction of elastic modulus of normal and high strength concrete using ANFIS and optimal nonlinear regression models. Constr. Build. Mater. 2012, 36, 665–673. [Google Scholar] [CrossRef]
  4. Li, J.; Zhang, W.; Li, C.; Monteiro, P.J. Eco-friendly mortar with high-volume diatomite and fly ash: Performance and life-cycle assessment with regional variability. J. Clean. Prod. 2020, 261, 121224. [Google Scholar] [CrossRef]
  5. Atiş, C.D. Carbonation-porosity-strength model for fly ash concrete. J. Mater. Civ. Eng. 2004, 16, 91–94. [Google Scholar] [CrossRef]
  6. Babu, K.G.; Rao, G.S.N. Efficiency of fly ash in concrete with age. Cem. Concr. Res. 1996, 26, 465–474. [Google Scholar] [CrossRef]
  7. Hwang, K.; Noguchi, T.; Tomosawa, F. Prediction model of compressive strength development of fly-ash concrete. Cem. Concr. Res. 2004, 34, 2269–2276. [Google Scholar] [CrossRef]
  8. Papadakis, V.G. Effect of supplementary cementing materials on concrete resistance against carbonation and chloride ingress. Cem. Concr. Res. 2000, 30, 291–299. [Google Scholar] [CrossRef]
  9. Papadakis, V.G.; Antiohos, S.; Tsimas, S. Supplementary cementing materials in concrete. Part II: A fundamental estimation of the efficiency factor. Cem. Concr. Res. 2002, 32, 1533–1538. [Google Scholar] [CrossRef]
  10. Kang, S.; Lloyd, Z.; Kim, T.; Ley, M.T. Predicting the compressive strength of fly ash concrete with the Particle Model. Cem. Concr. Res. 2020, 137, 106218. [Google Scholar] [CrossRef]
  11. Wu, M.; Li, C.; Yao, W. Gel/space ratio evolution in ternary composite system consisting of Portland cement, silica fume, and fly ash. Materials 2017, 10, 59. [Google Scholar] [CrossRef] [PubMed] [Green Version]
  12. Vargas, J.; Halog, A. Effective carbon emission reductions from using upgraded fly ash in the cement industry. J. Clean. Prod. 2015, 103, 948–959. [Google Scholar] [CrossRef] [Green Version]
  13. Zhang, Y.; Zhang, J.; Luo, W.; Wang, J.; Shi, J.; Zhuang, H.; Wang, Y. Effect of compressive strength and chloride diffusion on life cycle CO2 assessment of concrete containing supplementary cementitious materials. J. Clean. Prod. 2019, 218, 450–458. [Google Scholar] [CrossRef]
  14. Yang, K.-H.; Seo, E.-A.; Tae, S.-H. Carbonation and CO2 uptake of concrete. Environ. Impact Assess. Rev. 2014, 46, 43–52. [Google Scholar] [CrossRef]
  15. Kim, T.; Tae, S.; Roh, S. Assessment of the CO2 emission and cost reduction performance of a low-carbon-emission concrete mix design using an optimal mix design system. Renew. Sustain. Energy Rev. 2013, 25, 729–741. [Google Scholar] [CrossRef] [Green Version]
  16. Yu, J.; Lu, C.; Leung, C.K.Y.; Li, G. Mechanical properties of green structural concrete with ultrahigh-volume fly ash. Constr. Build. Mater. 2017, 147, 510–518. [Google Scholar] [CrossRef]
  17. Yang, K.-H.; Jung, Y.-B.; Cho, M.-S.; Tae, S.-H. Effect of supplementary cementitious materials on reduction of CO2 emissions from concrete. J. Clean. Prod. 2015, 103, 774–783. [Google Scholar] [CrossRef]
  18. Lee, H.-S.; Lim, S.-M.; Wang, X.-Y. Optimal mixture design of low-CO2 high-volume slag concrete considering climate change and CO2 uptake. Int. J. Concr. Struct. Mater. 2019, 13, 56. [Google Scholar] [CrossRef]
  19. Lee, H.-S.; Wang, X.-Y. Hydration model and evaluation of the properties of calcined hwangtoh binary blends. Int. J. Concr. Struct. Mater. 2021, 15, 11. [Google Scholar] [CrossRef]
  20. Wang, X.-Y. Evaluation of the phase assemblage and strength progress of hybrid blends of cement and fly ash using kinetic and thermodynamic hydration model. Ceram.-Silik. 2021, 65, 56–68. [Google Scholar] [CrossRef]
  21. Wang, X.-Y.; Lee, H.-S. Modeling the hydration of concrete incorporating fly ash or slag. Cem. Concr. Res. 2010, 40, 984–996. [Google Scholar] [CrossRef]
  22. Lam, L.; Wong, Y.; Poon, C.S. Degree of hydration and gel/space ratio of high-volume fly ash/cement systems. Cem. Concr. Res. 2000, 30, 747–756. [Google Scholar] [CrossRef]
  23. Nadesan, M.S.; Dinakar, P. Influence of type of binder on high-performance sintered fly ash lightweight aggregate concrete. Constr. Build. Mater. 2018, 176, 665–675. [Google Scholar] [CrossRef]
  24. Xu, G.; Tian, Q.; Miao, J.; Liu, J. Early-age hydration and mechanical properties of high volume slag and fly ash concrete at different curing temperatures. Constr. Build. Mater. 2017, 149, 367–377. [Google Scholar] [CrossRef]
  25. Li, C.; Zhu, H.; Wu, M.; Wu, K.; Jiang, Z. Pozzolanic reaction of fly ash modified by fluidized bed reactor-vapor deposition. Cem. Concr. Res. 2017, 92, 98–109. [Google Scholar] [CrossRef]
  26. Lam, L.; Wong, Y.L.; Poon, C.S. Effect of fly ash and silica fume on compressive and fracture behaviors of concrete. Cem. Concr. Res. 1998, 28, 271–283. [Google Scholar] [CrossRef]
  27. Poon, C.S.; Lam, L.; Wong, Y.L. A study on high strength concrete prepared with large volumes of low calcium fly ash. Cem. Concr. Res. 2000, 30, 447–455. [Google Scholar] [CrossRef]
  28. Wang, X.-Y. Impact of climate change on proportional design of fly-ash-blended low-CO2 concrete. ACI Mater. J. 2019, 116, 141–151. [Google Scholar]
  29. Park, J.; Tae, S.; Kim, T. Life cycle CO2 assessment of concrete by compressive strength on construction site in Korea. Renew. Sustain. Energy Rev. 2012, 16, 2940–2946. [Google Scholar] [CrossRef]
  30. Mo, Z.; Gao, X.; Su, A. Mechanical performances and microstructures of metakaolin contained UHPC matrix under steam curing conditions. Constr. Build. Mater. 2021, 268, 121112. [Google Scholar] [CrossRef]
  31. Ren, M.; Wen, X.; Gao, X.; Liu, Y. Thermal and mechanical properties of ultra-high performance concrete incorporated with microencapsulated phase change material. Constr. Build. Mater. 2021, 273, 121714. [Google Scholar] [CrossRef]
  32. Zhang, J.; Chen, T.; Gao, X. Incorporation of self-ignited coal gangue in steam cured precast concrete. J. Clean. Prod. 2021, 292, 126004. [Google Scholar] [CrossRef]
  33. Zhang, H.; Xu, Y.; Gan, Y.; Chang, Z.; Schlangen, E.; Šavija, B. Combined experimental and numerical study of uniaxial compression failure of hardened cement paste at micrometre length scale. Cem. Concr. Res. 2019, 126, 105925. [Google Scholar] [CrossRef]
  34. Ge, Z.; Tawfek, A.M.; Zhang, H.; Yang, Y.; Yuan, H.; Sun, R.; Wang, Z. Influence of an extrusion approach on the fiber orientation and mechanical properties of engineering cementitious composite. Constr. Build. Mater. 2021, 306, 124876. [Google Scholar] [CrossRef]
Figure 1. Experimental versus analytical data of reaction extent of fly ash.
Buildings 12 00139 g001
Figure 2. Parameter study of hydration model. (a) Degree of hydration of cement (W/B, 0.5). (b) Degree of hydration of cement (W/B, 0.3). (c) Degree of reaction of fly ash (W/B, 0.5). (d) Degree of reaction of fly ash (W/B, 0.3). (e) CSH components from reactions of fly ash and cement. (f) CSH per gram of water (W/B, 0.5). (g) CSH per gram of water (W/B, 0.3).
Buildings 12 00139 g002aBuildings 12 00139 g002b
Figure 3. Verification of strength model. (a) Strength versus CSH. (b) Experimental versus analytical strength results.
Buildings 12 00139 g003
Figure 4. Parameter study of hydration-based strength model. (a) Development of compressive strength (W/B, 0.5). (b) Development of compressive strength (W/B, 0.3).
Buildings 12 00139 g004
Figure 5. CO2 emissions for composite concrete with W/B ratio = 0.5 at 28 days. (a) Strength at 28 days. (b) Total CO2 emissions. (c) CO2 emissions for 1 MPa strength.
Buildings 12 00139 g005
Figure 6. CO2 emissions for composite concrete with W/B ratio = 0.3 at 28 days. (a) Strength at 28 days. (b) Total CO2 emissions. (c) CO2 emissions for 1 MPa strength.
Buildings 12 00139 g006
Figure 7. Effect of W/B ratio of concrete on CO2 emissions for 1 MPa strength.
Buildings 12 00139 g007
Figure 8. CO2 emissions for concrete at 90 days and W/B ratio = 0.3.(a) Strength at 90 days. (b) CO2 emissions for 1 MPa strength.
Buildings 12 00139 g008
Figure 9. Effect of design age on CO2 emissions for 1 MPa strength.
Buildings 12 00139 g009
Figure 10. Performance of design example 1 (water content 160 kg/m3). (a) Strength versus water/binder ratio. (b) CO2 emission versus strength.
Buildings 12 00139 g010
Figure 11. Effect of water content on CO2 emissions.
Buildings 12 00139 g011
Table 1. Optimal results for low-CO2 concrete of example 1 (water content = 160 kg/m3).
28-Day
Strength
(MPa)
Water
(kg/m3)
Cement
(kg/m3)
Fly Ash
(kg/m3)
Water/Binder
Ratio
Fly Ash/Binder
Ratio
CO2 Emissions
(kg/m3)
30160149.12182.250.480.55142.32
40185.32226.510.390.55176.88
50221.53270.760.330.55211.44
Table 2. Optimal results for low-CO2 concrete of example 2 (water content = 170 kg/m3).
28-Day
Strength
(MPa)
Water
(kg/m3)
Cement
(kg/m3)
Fly Ash
(kg/m3)
Water/Binder
Ratio
Fly Ash/Binder
Ratio
CO2 Emissions
(kg/m3)
30170158.44193.640.480.55151.22
40196.91240.660.390.55187.94
50235.38287.680.330.55224.65
Table 3. Optimal results for low-CO2 concrete of example 3. (CO2 emission of fly ash of 0.2 kg/kg).
28-Day Strength (MPa)Water
(kg/m3)
Cement
(kg/m3)
Fly Ash (kg/m3)Fly Ash/Binder RatioWater/Binder
Ratio
CO2 Emissions
(kg/m3)
55160269.8112.530.0440.566253.43
170286.6713.310.0440.566269.26
Publisher’s Note: MDPI stays neutral with regard to jurisdictional claims in published maps and institutional affiliations.

