1. Introduction
The carbonization of concrete will reduce the alkalinity of concrete gradually and lead to concrete deterioration and corrosion of steel bar, which is one of the fundamental indicators for the durability evaluation of reinforced concrete structures [
1,
2,
3]. Relevant scholars have established concrete carbonization prediction models based on different factors, which are suitable for different kinds of concrete [
4]. The carbonization models are mainly of the following types: (1) diffusion theory model of CO
2, including the Alekseev model [
5] and the Papadakis model [
6]; (2) empirical model of water–cement ratio, including the Koichi Kishitani model [
7], Akihiko Ida model [
8], Zhu An-min model [
9], and Uomoto Kenichi model [
10]; (3) multi-factor empirical model, including Richardson model [
10], Gong Luoshu model [
11], Huang Shi-yuan model [
12], and Zhang Hai-yan model [
13]; (4) empirical model based on compressive strength, including Smolczyk model [
8], Di Xiao-tan model [
11], Soviet model [
14], and Niu Ditao model [
15]; (5) semi-theoretical and semi-empirical model, including Zhang Yu model [
16], Liu Yaqin model [
17], and “1 + 2” carbonization model [
18]. The above models show that the effects of concrete curing are crucial to the carbonization resistance and compressive strength of concrete.
Curing measures of concrete are divided into external and internal, while the common external curing measures including watering, spraying curing agent, and surface covering, which usually lead to insufficient hydration inside the concrete. Considering the curing of the internal concrete, water-absorbent materials such as Super Absorbent Polymer (SAP) can be incorporated into the concrete. During the curing period, the SAP inside the concrete can release water gradually, which will enhance the overall hydration degree and increase the matrix compactness, thus resisting the transmission of CO2.
However, some research [
19,
20] has shown that using internal curing material may weaken the carbonization resistance of concrete. The internal curing effect of SAP will produce more Ca(OH)
2, which can reduce the carbonization resistance activity of concrete. Therefore, specific measures need to be adopted to prevent the degradation of carbonation resistance of the internal curing concrete.
Nano-silica (NS) has extremely high volcanic ash activity [
21] and can be used in conjunction with SAP in concrete. The volcanic ash effect of NS will consume the Ca(OH)
2 generated by the secondary hydration of SAP, which can reduce the negative effect of SAP on the carbonization and improve the carbonization resistance of concrete ultimately. However, the theoretical analysis of NS modification on the carbonization resistance of SAP concrete needs further study. Therefore, it is necessary to analyze the carbonization resistance of NS/SAP concrete and explore its carbonization model.
In this paper, the influencing factors of carbonization of NS/SAP concrete were analyzed. After the theoretical analysis, the carbonization coefficient theoretical model of NS/SAP concrete was established preliminarily. According to the accelerated carbonization test data of NS/SAP concrete, the model parameters were clarified and verified. Compared with the literature, the carbonization coefficient theoretical model of NS/SAP concrete has better applicability.
2. Experimental Framework
2.1. Materials and Apparatus
P.O. 42.5 Portland cement (Chinese standard GB 175-2007/XG3-2018 [
22]) is the main cement-based material. Parameters of SAP(class II, China building materials industry standard, JC/T 2551-2019 [
23]) and hydrophilic NS(type A, Chinese standard GB/T 20020-2013 [
24]) are shown in
Table 1 and
Table 2, respectively. Crushed stone with particle size range of 5 mm to 20 mm (Chinese standard GB/T 14685-2022 [
25]) was used as the coarse aggregate. River sand with fineness modulus of 2.7 (Chinese standard GB/T 14684-2022 [
26]) was used as the fine aggregate. Polycarboxylate water reducer (CQJ-JSS type, Chinese standard GB 50119-2013 [
27]) was used to improve the workability of concrete. Water for cement hydration (Chinese industry standard JGJ 63-2006 [
28]) was potable water. Phenolphthalein indicator solution (10 g/L, Chinese standard GB/T 603-2002 [
29]) and paraffin wax (Chinese standard GB 1886.26-2016 [
30]) were prepared for concrete carbonization test.
The main apparatus involved: (1) HJW-200 Single-horizontal-shaft forced type concrete mixer; (2) HZJ-A concrete vibrating stand; (3) CCB-70 carbonization test chamber; (4) SYE-2000 compression testing machine; (5) KX-1613T ultrasonic vibration meter; (6) SHBY-90B concrete curing box; (7) QZ-9425AE industry drying oven; and (8) HT-1 carbonation depth measuring instrument, etc.
2.2. Specimen Fabrication and Testing
2.2.1. Mix Proportions
In the research by Hu [
31], when the content of SAP is less than 0.5%, the self-shrinkage of concrete can be significantly reduced, and the loss of compressive strength is not significant. In this research, the SAP content included 0, 0.08%, 0.16%, and 0.24%, respectively. The NS content included 0, 0.5%, 1.0%, and 1.5%, respectively. The mixture proportions of concretes list in
Table 3. In
Table 3, “S16N5” represents the content of SAP and NS are 0.16% and 0.5%, respectively. The content of SAP and NS is calculated according to the total mass of the cementitious material, which includes cement, SAP, and NS. The content of polycarboxylate water reducer was 0.20% of the total mass of the cementitious material. The additional water consumption was determined according to the Powers model [
32], as shown in Equation (1).
where
W is the mass of water for cement hydration,
C the mass of cement,
We the mass of extra water for internal curing,
W/
C the mass ratio of water to cement, and
We/
C the mass ratio of extra water to cement. In this research,
W/
C = 0.35. Thus,
We/
C = 0.063 according to Equation (1).
2.2.2. Preparation of Concrete Specimens
All the specimens were prepared according to Chinese Standard GB/T 50082-2019 [
33] (Standard for test methods of concrete physical and mechanical properties) and GB/T 50081-2009 [
34] (Standard for Test Methods of Long-term Performance and Durability of Ordinary Concrete).
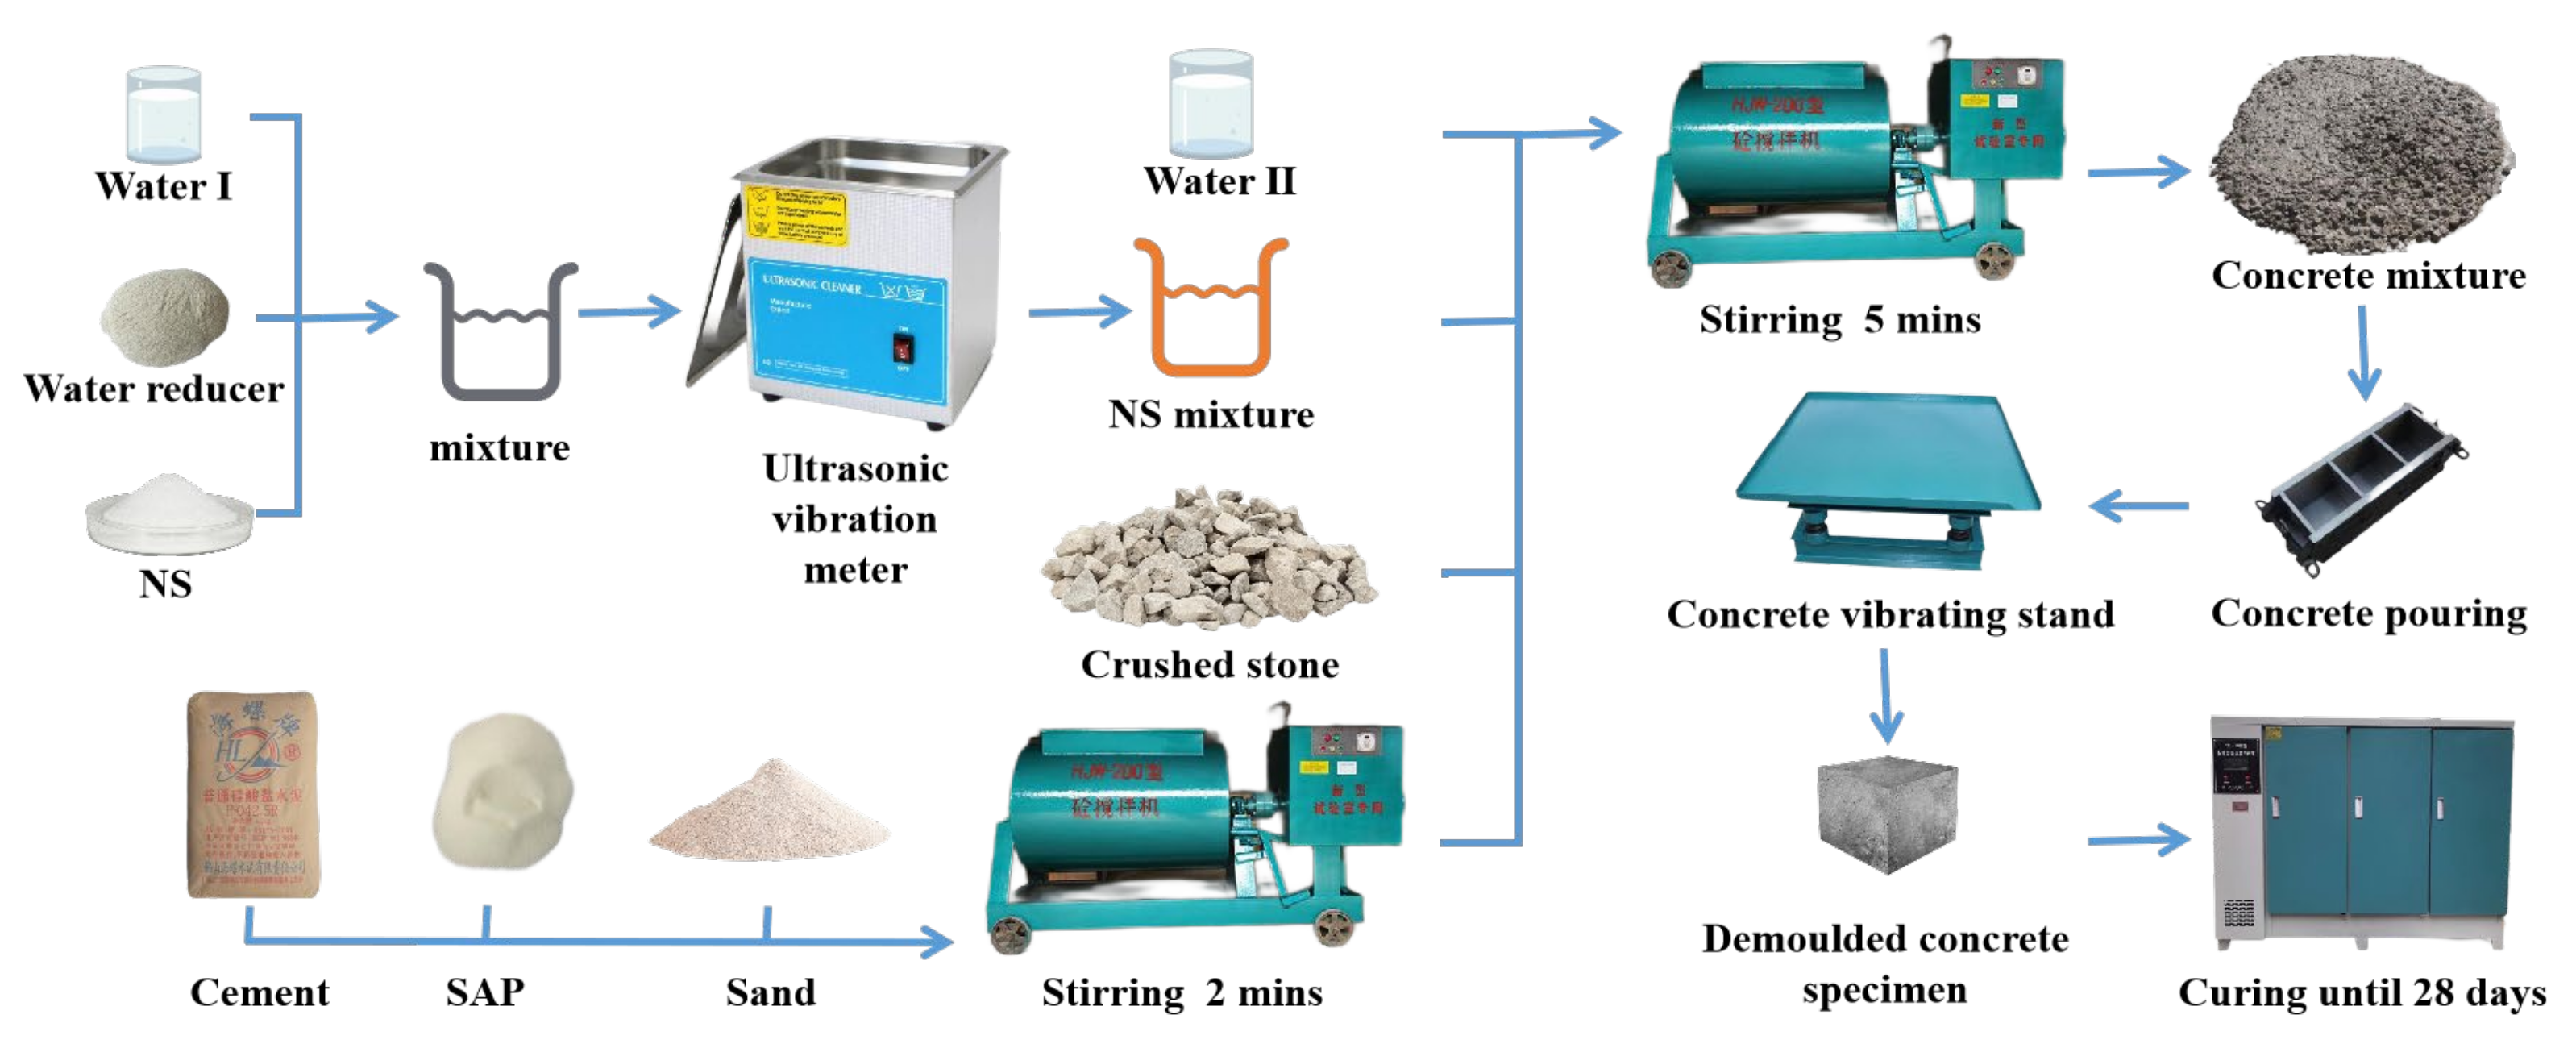
NS/SAP concrete specimens with a size of 100 mm × 100 mm × 100 mm for each mix proportion were casted in the laboratory. The step-by-step process of concrete specimen preparation is depicted in
Figure 1. All specimens were cured with mold at room temperature for 24 h, and then stripped and cured at
T = 20 ± 2 °C and
RH ≥ 95% in the curing box until 28 days [
33].
2.2.3. Accelerated Carbonization Tests
All specimens placed in the oven dry at 60 ℃ for 48 h after curing for 28 days in Concrete Curing Box. Then, specimens were coated with paraffin wax on four successive sides and placed in a carbonization chamber to accelerate carbonization at 20 ± 5 °C, while relative humidity was 70% ± 5% and CO
2 concentration was 20% ± 3%. When the predetermined carbonization time (3 d, 7 d, 14 d, and 28 d) was reached, the compressive strength and carbonization depth of specimens were tested [
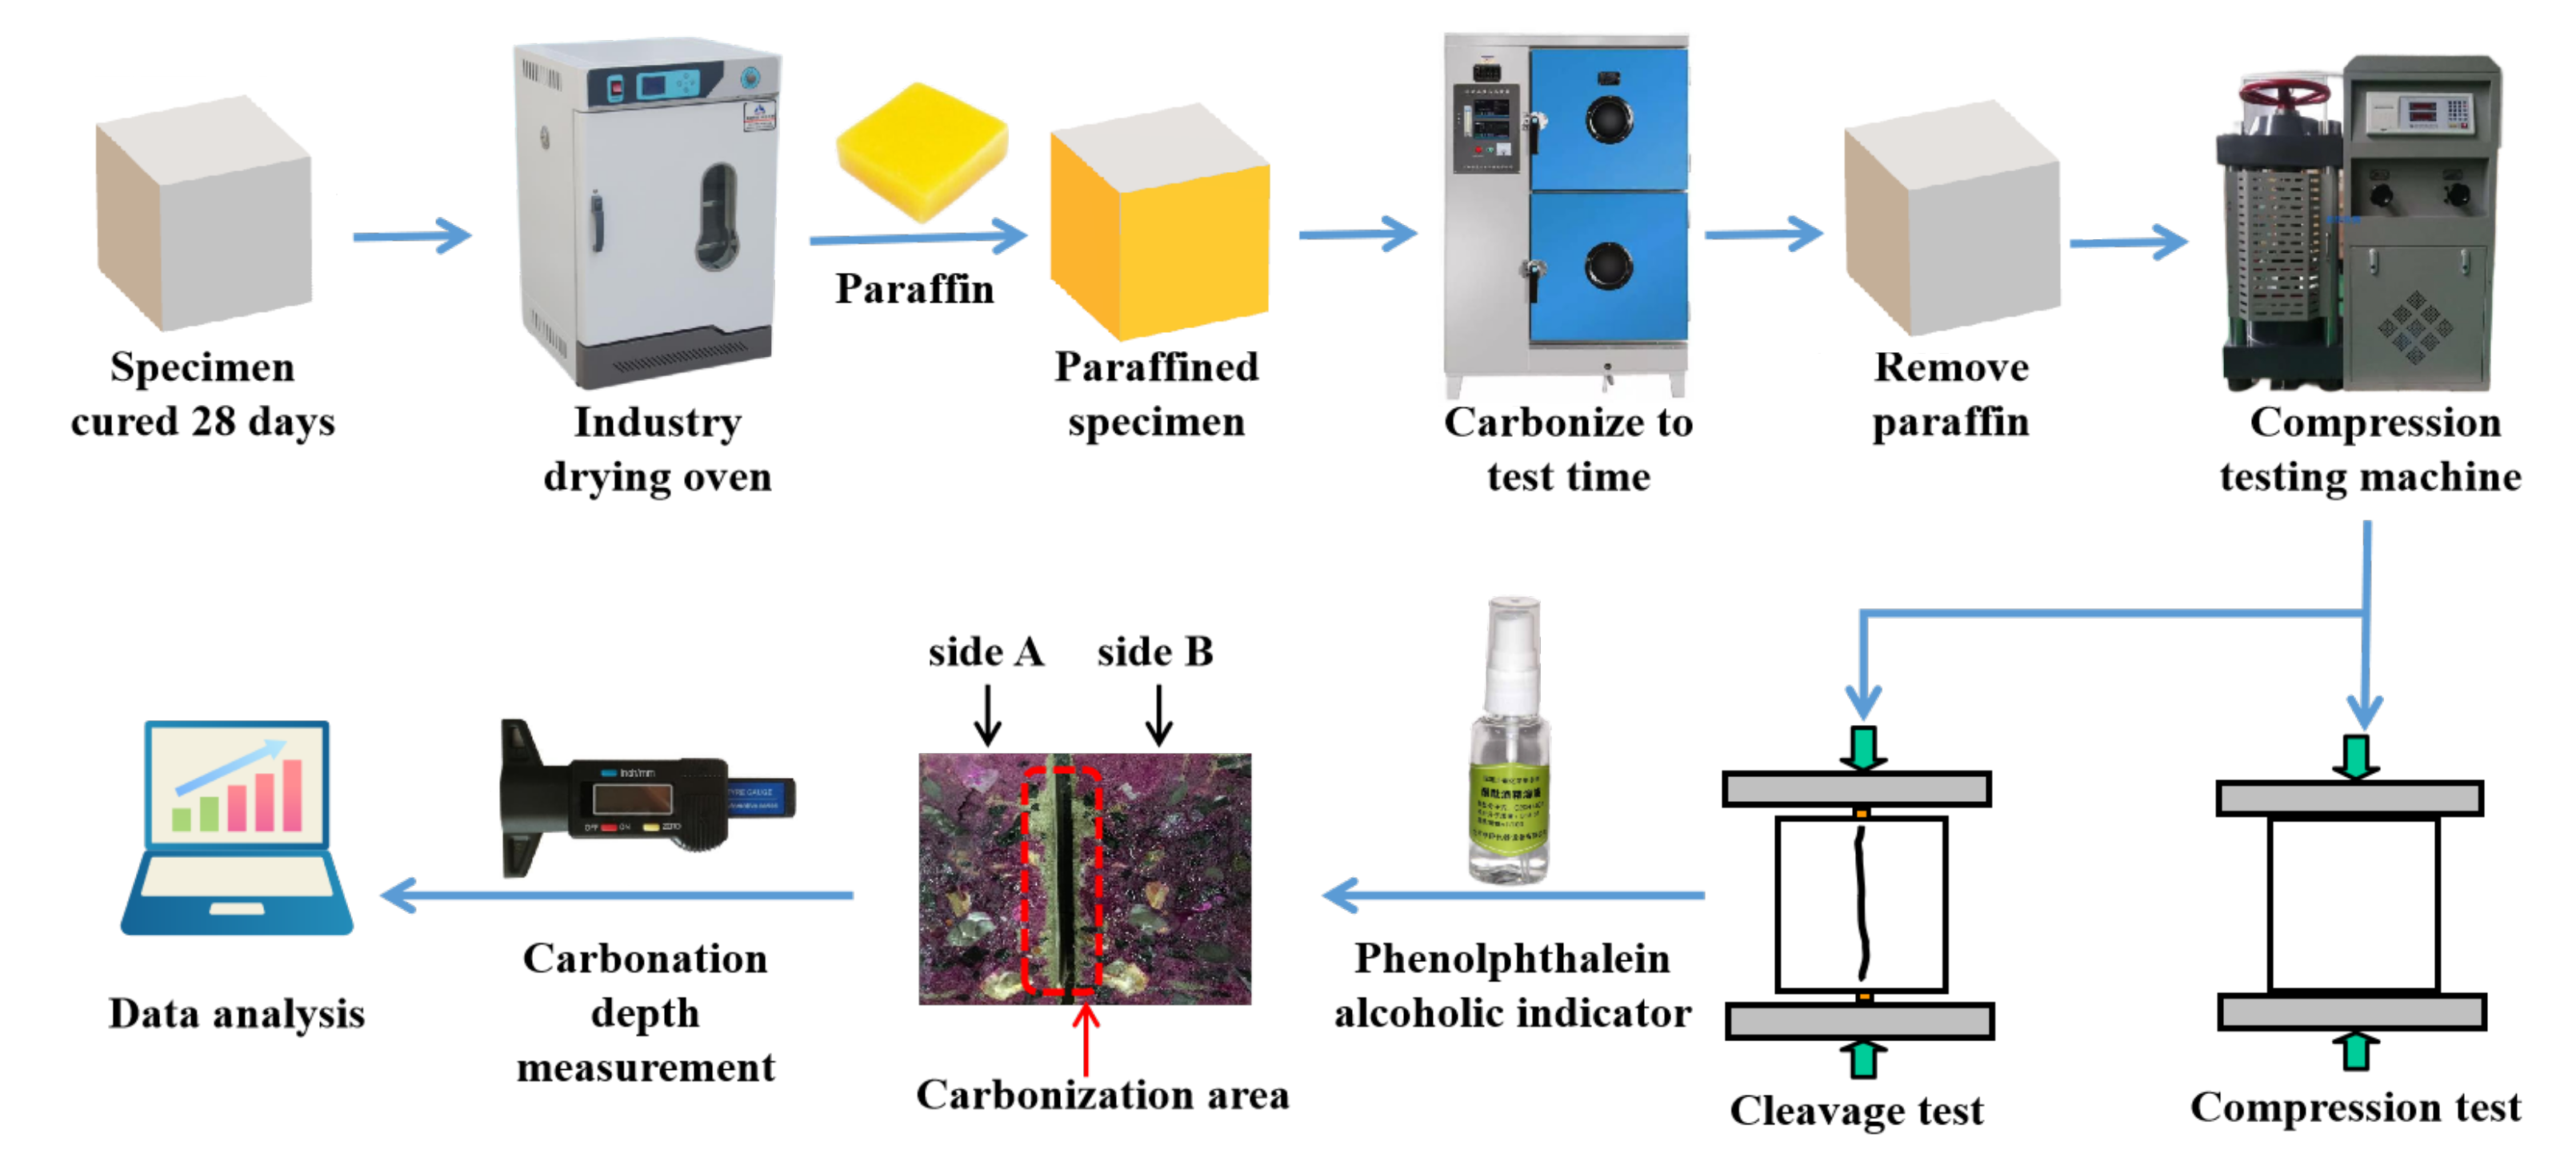
34]. The steps of the carbonization depth test include: (1) split the middle of the carbonized surface of the specimen, (2) spray the phenolphthalein alcoholic indicator on the cross sections, (3) measure the carbonization depth at intervals of 10 mm along the edge of the cross section; giving the result accurate to 0.5 mm. The process of compressive and concrete carbonization test is shown in
Figure 2.
3. Theoretical Model Analysis
Steps for establishing a multivariate model [
35] include: (1) determine the prediction object and target; (2) select the appropriate regression method; (3) establish a sample set from the experimental data; (4) determine parameters and establish a model; (5) analyze prediction of the model; and (6) correct the model.
The corresponding steps in this study include: (1) analyze the relationship between variables and carbonization coefficient, (2) clarify the mathematical relationship of variables and carbonization coefficient, (3) superimpose the mathematical relationship between variables and carbonization and establish the overall model, (4) carry out the coefficient fitting, and (5) verify and analyze the model.
The expression of concrete carbonization depth as given by Equation (2):
where
is carbonization depth, mm;
K carbonization coefficient;
carbonization time, day.
According to Equation (2), it is obvious that the carbonation depth of concrete relates to the carbonation coefficient. This study will be devoted to the theoretical analysis of the concrete carbonization coefficient.
3.1. Analysis of External Influencing Factors
3.1.1. CO2 Concentration
The higher the external CO
2 concentration
, the greater the gradient difference between the internal and external of concrete, which leads to an increase in carbonization coefficient
K. According to the Alekseev model [
5], Zhang Yu model [
16], and Liu Ya-qin model [
17],
K can be taken as proportional function of
.
3.1.2. Relative Humidity
The prerequisite for concrete carbonization is that H2O forms carbonic acid in combination of CO2. The relative humidity (RH) of curing environment will affect the saturation of pore water in concrete. With decrease of RH, the inside of the concrete will be much drier. In this condition, although the diffusion rate of CO2 increases, the carbonation reaction will slow down due to the lack of water. With the increase of RH, the pore water saturation of concrete will increase. The water generated by the carbonation reaction is hard to release, which weakens the diffusion of CO2 and eventually leads to inhibit the carbonation reaction.
Ji [
36] found that the carbonization coefficient conforms to the parabolic relationship with
RH. The carbonation rate of concrete will improve, when
RH is 40–70%. Du [
37] proposed that the carbonization rate was the fastest when
RH was 50–60%. According to GB/T 50082 [
33], the
RH of concrete accelerated carbonization test in this study is 70%.
Jiang [
38] statistically analyzed literature data and presented the influence of
RH on concrete carbonation conformed to Equation (3).
where
RHi is the relative humidity of
i-th environment;
the carbonization rate under the relative humidity
RHi.
According to the carbonization model proposed by Niu [
15], Liu [
17], and Jiang [
38],
K is taken to be the quadratic of
RH.
3.1.3. Ambient Temperature
The ambient temperature
T has a great influence on the concrete carbonization. The increase of
T promotes the diffusion of CO
2 and enhances the carbonization rate. However, the increase of
also decreases the solubility of CO
2, which weakens the carbonization rate [
39]. Loo [
40] concluded that the effect of
T is not significant from 20 °C to 40 °C. However, it has also been suggested that the carbonization reaction intensifies during the increase of
T from 20 °C to 40 °C when
is constant. According to the carbonization database [
38], the effect of
T on the carbonization rate is shown in Equation (4).
where
is the
j-th ambient temperature, °C;
the carbonization rate when the temperature is
.
As is exhibited in Equation (5), the effect of temperature on the carbonization rate is obtained by regression analysis of Uomoto K. [
11].
According to Uomoto Kenichi model [
11] and Niu Di-tao model [
15],
K is taken to be a power of
T.
3.2. Analysis of Internal Influencing Factors
3.2.1. Water–Cement Ratio
With the increase of water–cement ratio W/C, the internal porosity of concrete increases. The pores may be the diffusion channel of CO2, leading to the increase of carbonation rate. With the decrease of water–cement ratio W/C, concrete is denser, and the carbonation rate will reduce.
According to Koichi Kishitani model [
7] and Uomoto Kenichi model [
11], carbonization depth increases with
W/
C. In this paper, the carbonation coefficient
is considered to proportional to
W/
C.
3.2.2. Compressive Strength of Concrete
As is known to all, compressive strength of concrete
is the comprehensive result of the mix ratio, materials, curing conditions and other factors. However, in the Smolczyk model [
8] and Niu Di-tao model [
15],
was proposed as a parameter of carbonization coefficient
K, which was a power of
.
3.2.3. The Content of SAP and NS
In the carbonization test of this section, 35 groups of specimens were tested, each group with 3 samples. According to the carbonization test of specimens with SAP or NS,
Figure 3 and
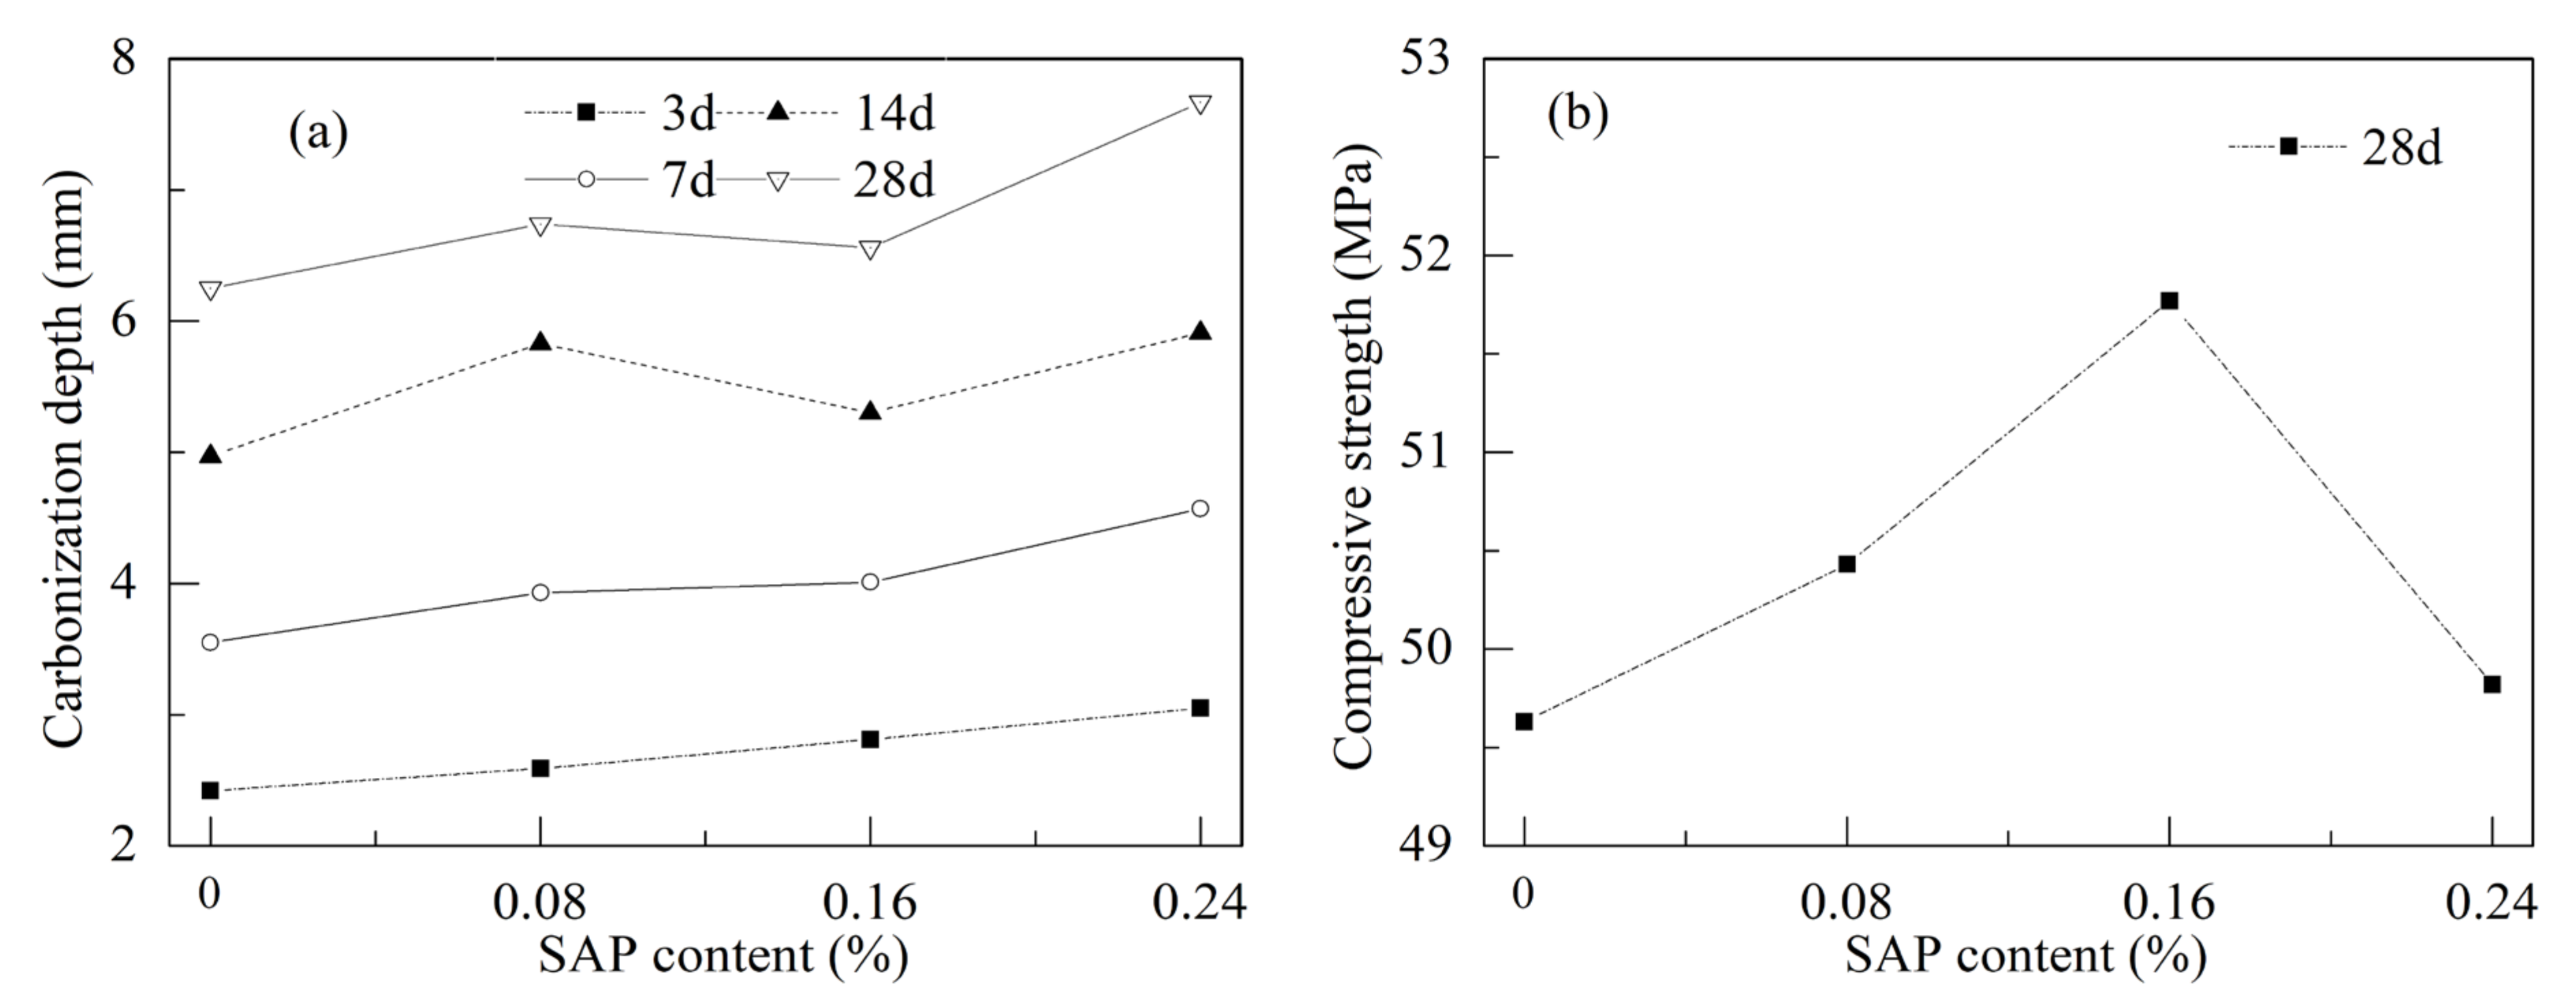
Figure 4 were obtained. It can be observed from
Figure 3 that
X showed an increasing trend with the increase of
, which is consistent with the reference [
19] and
X showed a gradual increase with increasing age of carbonization. During the water release process of SAP, discontinuous micro-pores form inside the concrete, which provides additional possibilities for the diffusion and infiltration of CO
2 in the later stage. Therefore, the depth of concrete carbonization showed an increasing trend with the increase of SAP content
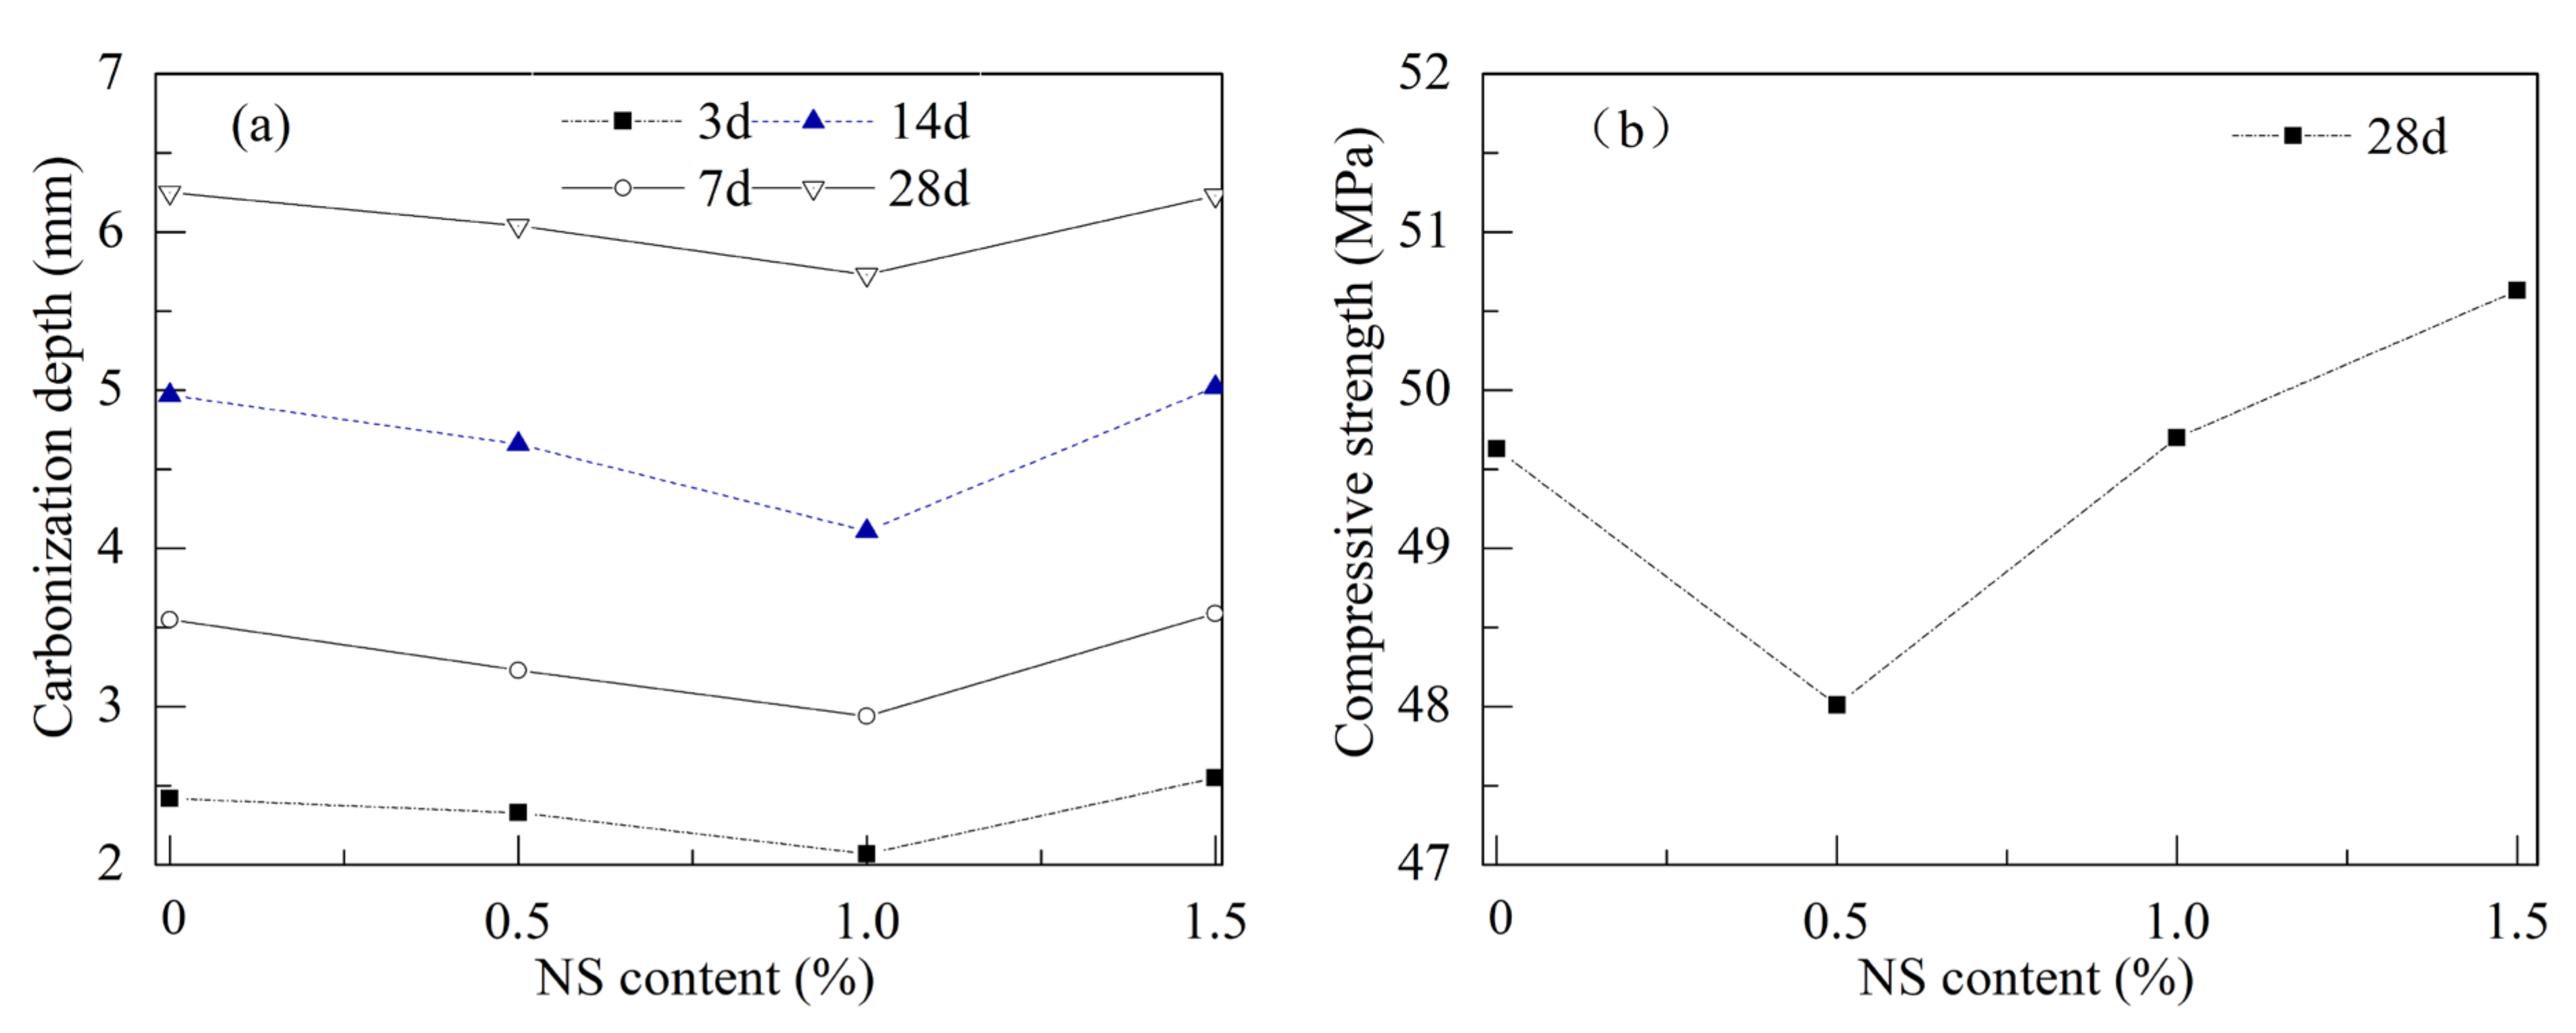
. As shown in
Figure 4, with the increase of
,
decreases first and then increases, and the optimal value of
is 1.0%. Appropriate addition of NS can make the micro-structure of concrete more compacted, improving the carbonization resistance. According to the above analysis, the carbonization coefficient
is taken as proportional to the quadratic of
and proportional to
.
3.3. Theoretical Model
The concrete carbonization coefficient
can be taken as the dependent variable.
can be taken as power-squared with
,
, and
, respectively, with a linear relationship with
W/
C and
, proportional to the quadratic of
and
. The multivariate model of
established as Equation (6).
where
is the regression coefficient,
the power coefficient.
4. Theory Model Building and Validation
In the carbonization test of this section, 36 other groups of specimens were tested, each group with 3 samples. All the carbonization depth tests and compressive strength tests were carried out on the specimens after accelerated carbonization for 28 days. The results of specimens of 25 groups as shown in
Table 4. Randomly, take 30% of 25 groups as the verification group (recorded as No.1 to No.8), and the rest of the groups as the fitting group.
The results of the fitting group were used for coefficient fitting in the theoretical model as in Equation (6). The carbonization depth of the verification group calculated by Equation (6) will compare with the test results of the verification group.
4.1. Specimen Analysis
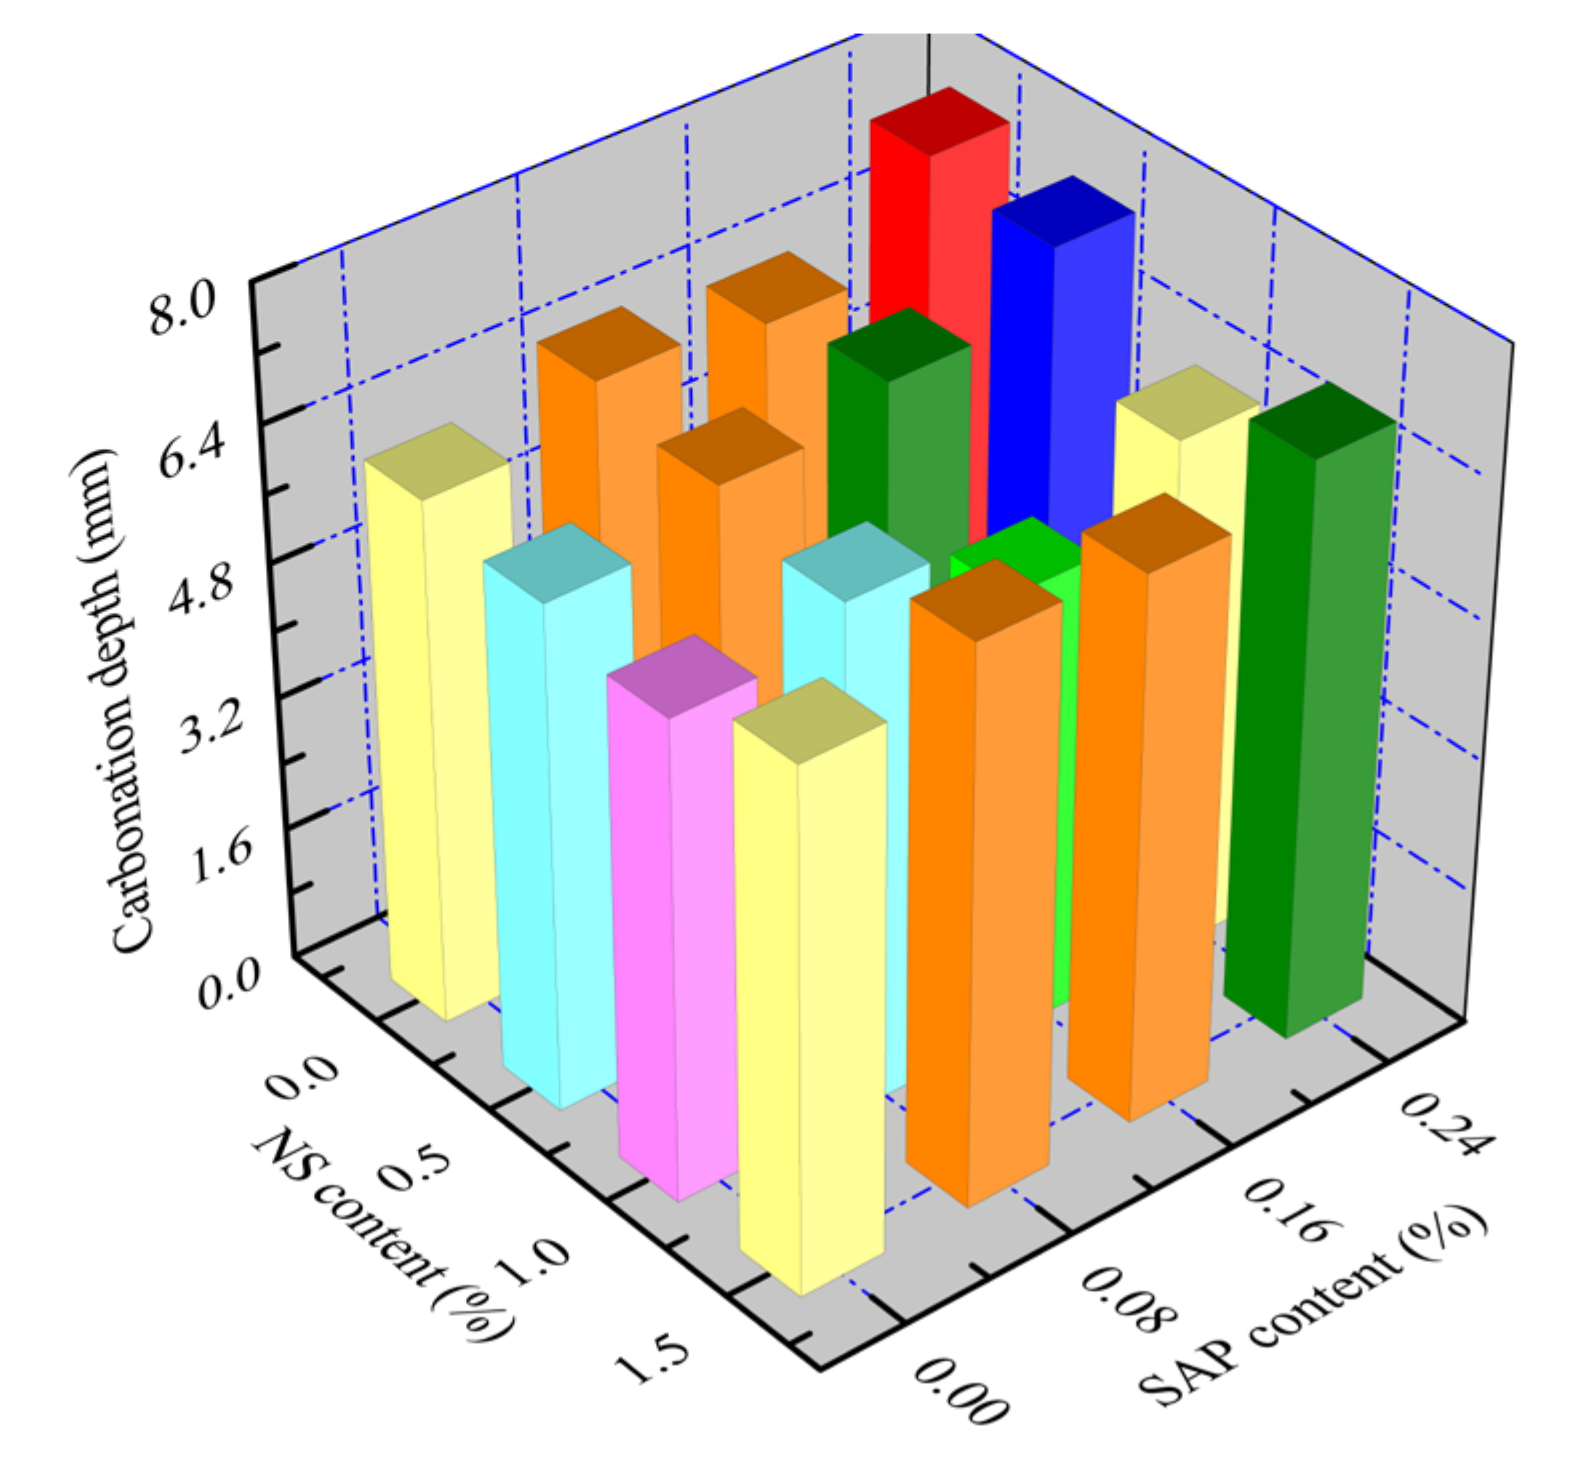
As shown in
Figure 5 and
Figure 6, the two-factor coordinate diagram was established according to
Table 4, which shows the relationship between the carbonization depth of the specimens and the content of NS or SAP. The carbonization depth of the unadulterated concrete (as the reference specimen) was 6.25 mm as shown in
Figure 5. The carbonization depth of the single SAP specimens is higher, while the highest carbonization depth is 7.67 mm when the content of SAP is 0.24%. For different contents of SAP, the addition of NS will reduce the carbonization depth of the specimens. The carbonization depth decreases first and then increases with the increase of NS content, and the effect is best when the NS content is 1.0%. Overall, when the content of NS and SAP is 1.0% and 0.16%, respectively, the carbonization depth of the re-doped specimen is 5.30 mm, which is the smallest. The carbonization depth reduced by 15.2% compared with the reference specimen. The volcanic ash effect of NS is obvious, which can improve the carbonization resistance of SAP concrete.
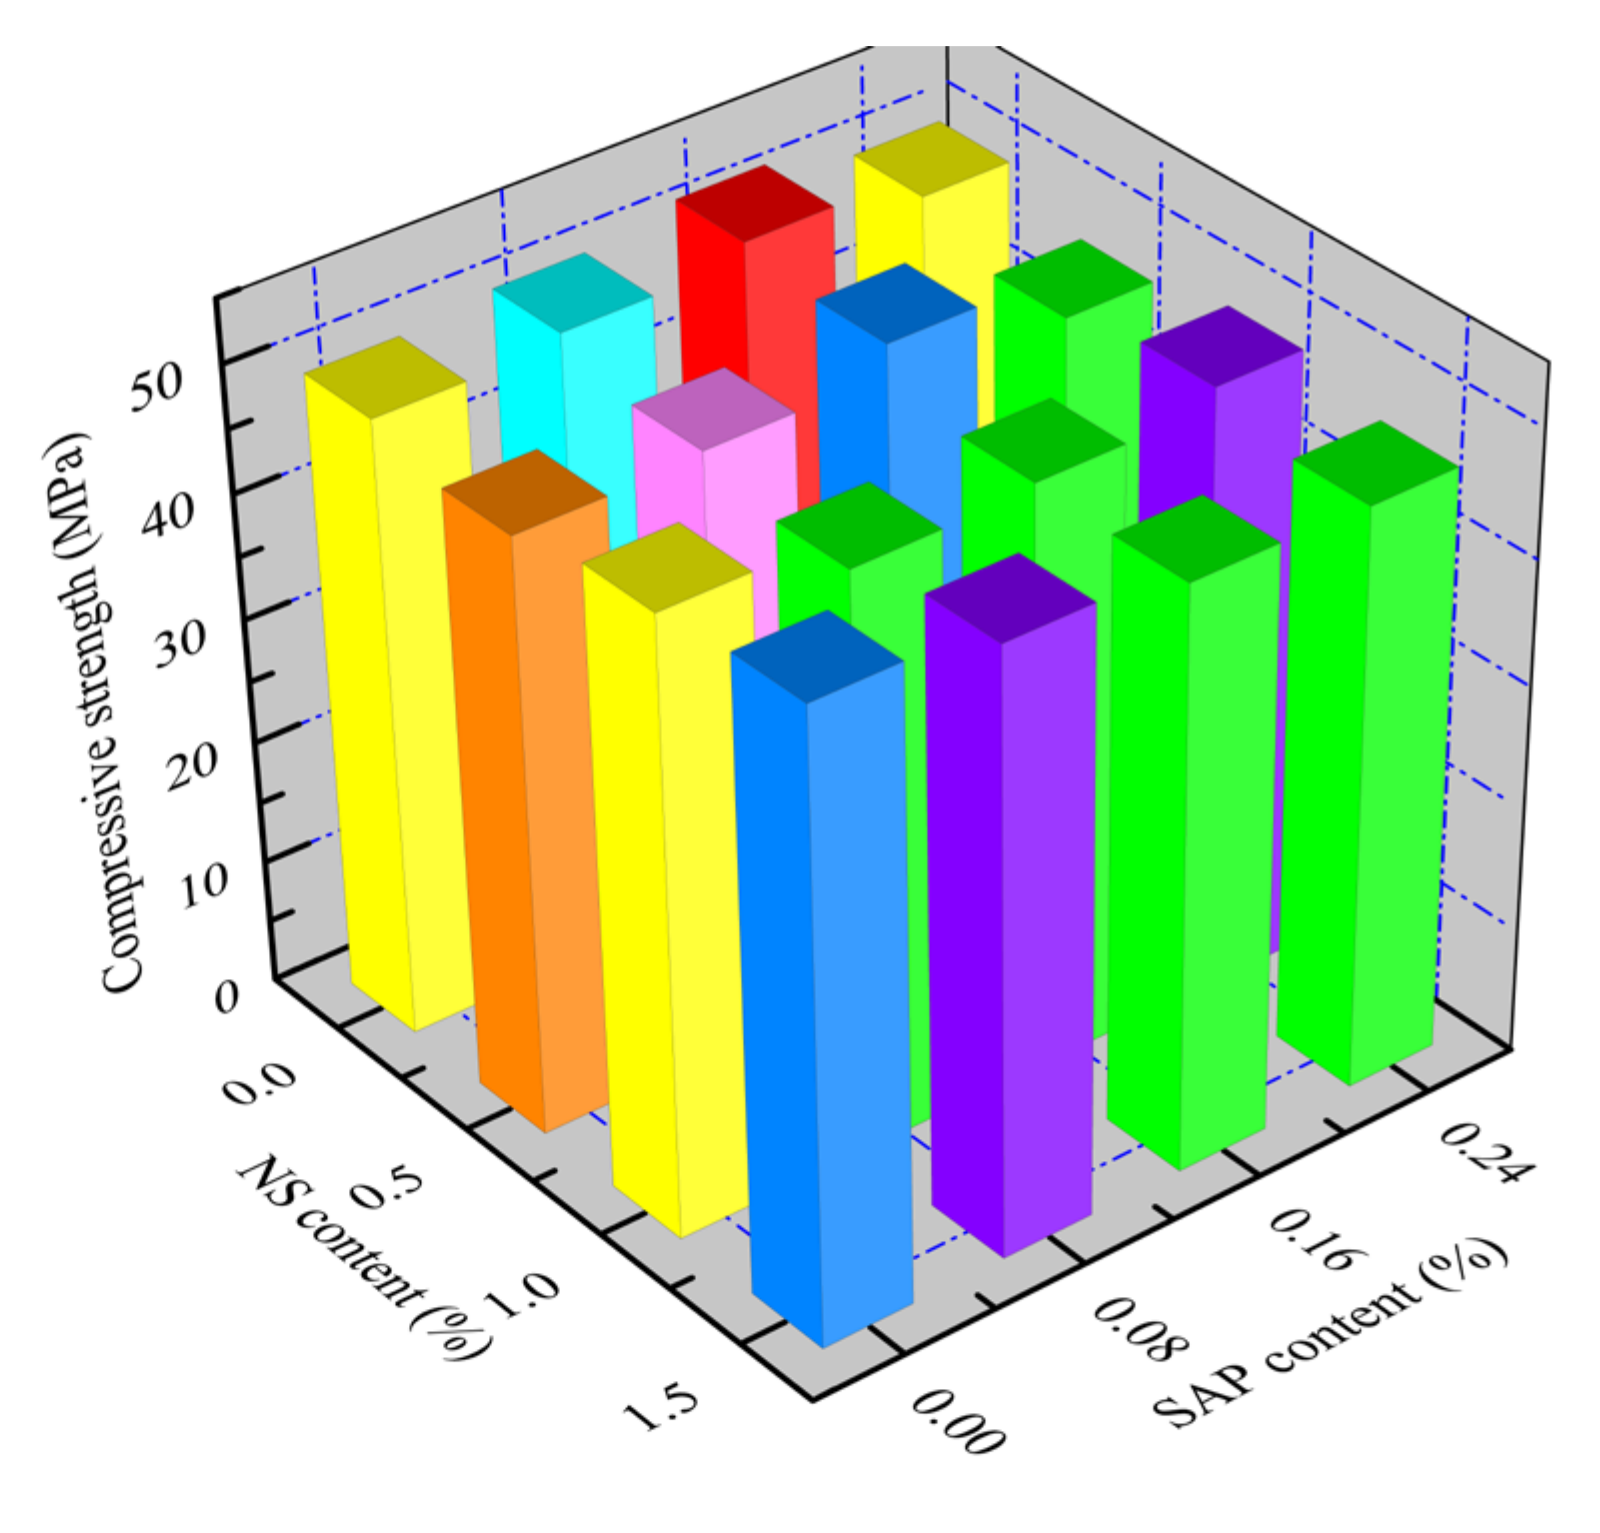
As shown in
Figure 6, the compressive strength of benchmark specimen is 49.63 MPa. The strength of the single-doped SAP specimens is higher than that of the benchmark specimen. The highest compressive strength of concrete is 51.77 MPa when the SAP dose is 0.16%. The strength of the single-doped NS specimens improved with the increase of the NS content. The highest compressive strength of specimens is 50.63 MPa when NS content is 1.5%. This is because NS is a nanoscale material and exerts a micro-aggregate effect in concrete. The average strength of all composite specimens is 47.96 MPa, which is 3.4% less than the reference specimens. This indicates that SAP slightly reduces the strength of the composite specimens after 28 days. However, the internal curing effect of SAP is mainly in the continuous improvement of the concrete strength in the later period.
4.2. Carbonization Model of Compounded Specimens
According to the test data of the fitted groups (No.9 to No.25) in
Table 4, Equation (2) and the parameters of the test conditions (water–cement ratio is 0.35,
is 20 °C,
is 70%, and CO
2 concentration is 20%), the coefficients
and
are determined by fitting a multivariate nonlinear regression through the nonlinear fitting function in
Matlab. Substituting
and
into Equation (6), the multivariate nonlinear model of the carbonization coefficient
of the NS/SAP concrete is obtained, as shown in Equation (7).
4.3. Model Validation and Analysis
The compressive strength, SAP content, and NS content of the verification group in
Table 4 substitute into Equations (7) and (2) to obtain the predicted carbonization depth of the verification specimens, as shown in
Table 5 and
Figure 7. According to
Table 5, (1) the overall mean value of the relative error is 5.04%; (2) the residual mean square deviation of this model is 0.1751.
Table 6 shows the prediction error analysis of carbonization depth of concrete with different admixture according to the models in the existing research [
41,
42,
43] and this paper. Compared with reference [
41,
42,
43], the number of groups in this paper is suitable.
Table 6 exhibits that the relative error between the predicted value and the measured value of the model in this paper is small, and the accuracy of the model is better than that of the related studies.
In general, the prediction model with a smaller residual error mean square deviation is more accurate. Some studies analyzed the relative error and residual mean square error at the same time according to the predicted value and the measured value from their respective studies. The relative error is 16% and the residual mean square error is 0.34 in Reference [
44]; the relative error is 23% and the residual mean square error is 0.43 in Reference [
45]. The residual mean square error of this model is 0.1751, which has better accuracy.
5. Conclusions
In this paper, based on the theoretical models, the influence factors of concrete carbonization were analyzed. According to the experimental data, the NS/SAP concrete carbonization model is established and analyzed. The main conclusions are summarized as follows:
The multivariate nonlinear model can predict the carbonization depth of NS/SAP concrete. The relationship between various factors and the carbonization coefficient were analyzed to establish the corresponding mathematical relationship and the carbonization coefficient model. Combined with the existing theoretical models, the relationship between the carbonization coefficient of NS/SAP concrete can be clarified as: (1) proportional to the power of CO2 concentration, (2) proportional to the quadratic of relative humidity, (3) proportional to the power of ambient temperature, (4) proportional to the water–cement ratio, (5) proportional to the power of concrete compressive strength, (6) proportional to the SAP content, and (7) proportional to the quadratic of NS content.
As internal curing material, the addition of SAP can improve the carbonization resistance of concrete, but slightly weakens its strength in the short term. The micro-aggregate effect and volcanic ash effect of NS are obvious, which can improve the strength of SAP concrete. The results of the orthogonal experiment show that, when the content of NS and SAP are 1.0% and 0.16%, respectively, the carbonization resistance of the compound specimens will enhance in evidence, while the compressive strength of NS/SAP concrete is 47.28 MPa.
The coefficient of the theoretical model was clarified by nonlinear fitting based on the actual measured values of carbonization depth of the specimens. The mean relative error between the predicted values and the experimental values is 5.04%, and the residual mean square error is 0.1751. Compared with similar studies, the resulting carbonization coefficient model of NS/SAP involved more influencing factors and has good applicability and accuracy.
Author Contributions
Conceptualization, S.L. and J.W.; data curation, S.L., J.W. and R.L.; formal analysis, S.L. and Y.C.; funding acquisition, S.L., C.T., Y.C. and R.L.; investigation, S.L., J.W. and H.W.; project administration, R.L.; resources, R.L. and Y.C.; supervision, R.L. and Y.C., validation, S.L. and J.W.; writing—original draft, S.L. and H.W.; writing—review and editing, S.L., C.T. and Y.C. All authors have read and agreed to the published version of the manuscript.
Funding
This research was funded by the National Natural Science Foundation of China (No.51508234, No.51778272), Natural Science Foundation of Science and Technology Department of Jiangsu Province (No.BK20180878), and Jiangsu Provincial Department of Education (“Qinglan Project” of 2022).
Institutional Review Board Statement
Not applicable.
Informed Consent Statement
Not applicable.
Data Availability Statement
Data are contained within the article.
Acknowledgments
The authors gratefully acknowledge the financial support from the National Natural Science Foundation of China (No.51508234, No.51778272), Natural Science Foundation of Science and Technology Department of Jiangsu Province (No.BK20180878), and Jiangsu Provincial Department of Education (“Qinglan Project” of 2022).
Conflicts of Interest
The authors declare that they have no known competing financial interest or personal relationships that could have appeared to influence the work reported in this paper.
Abbreviations
| Symbol | Interpretation |
| W | mass of water for cement hydration |
| We | mass of extra water for internal curing |
| C | mass of cement |
| W/C | mass ratio of water to cement |
| We/C | mass ratio of extra water to cement |
| M | mass of material |
| Χ | carbonization depth |
| K | carbonization coefficient |
| t | carbonization time |
| kc | external CO2 concentration |
| kRH | carbonization rate under RH |
| T | ambient temperature |
| kT | carbonization rate of T |
| fcu,k | compressive strength of concrete |
| RNS | the content of NS |
| RSAP | the content of SAP |
| α | the regression coefficient |
| β | the power coefficient |
References
- Shen, Q. Microstructure Evolution and Prediction Model of Cement-based Materials Under the Coupling Action of Carbonization Area and Load. Ph.D. Thesis, Southeast University, Nanjing, China, 2018. [Google Scholar]
- Yuan, Y. Research on The Influencing Factors and Prediction Model of Coral Concrete Carbonization Area Depth. Master’s Thesis, Guilin University of Technology, Guilin, China, 2020. [Google Scholar]
- Yu, B.; Huang, J.; Li, Q.; Liu, S. Quantitative Durability Design Method for Concrete Structures Under Natural Carbonization Area Conditions. Concrete 2020, 10, 38–42. [Google Scholar] [CrossRef]
- Zhao, Y.; Du, Y.; Liu, F.; Chen, Q. Study on Carbonization Area Model for Fly Ash Concrete Based on Multivariate Nonlinear Analysis. Concrete 2017, 3, 74–77. [Google Scholar] [CrossRef]
- Huang, K. Corrosion and Protection of Steel Bars in Reinforced Concrete Structures; China Building Industry Press: Beijing, China, 1983. [Google Scholar]
- Papadakis, V.G. Effect of Supplementary Cementing Materials on Concrete Resistance Against Carbonization Area and Chloride Ingress. Cem. Concr. Res. 2000, 30, 291–299. [Google Scholar] [CrossRef]
- Koichi, K. Durability of Reinforced Concrete; Kajima Research Institute Publishing Department: Kajima, Japan, 1963. [Google Scholar]
- Chen, S. Mechanism, Influencing Factors and Forecasting Models of Concrete Carbonization Area. J. North China Inst. Water Conserv. Hydroelectr. Power 2010, 31, 35–39. [Google Scholar] [CrossRef]
- Zhu, A. Concrete Carbonization Area and Reinforced Concrete Durability. Concrete 1992, 6, 18–22. [Google Scholar]
- Cao, M.; Ding, Y.; Zheng, J.; Wang, L.; Dou, S. Research Progress of Concrete Carbonization Area Mechanism and Prediction Model. Concrete 2012, 9, 35–38. [Google Scholar] [CrossRef]
- Gong, L. Concrete Multi-factor Carbonization Area Equation and Application. Concrete 1985, 6, 10–16. [Google Scholar]
- Xu, L.; Huang, S. A Mathematical Model for Predicting the Depth of Carbonization Area in Concrete. J. Shanghai Inst. Build. Mater. 1991, 4, 347–357. [Google Scholar]
- Zhang, H.; Ba, D.; Wang, Z. A Model for Forecasting Carbonization Area Depth of Concrete. Eng. J. Wuhan Univ. 2006, 39, 42–45. [Google Scholar] [CrossRef]
- Wu, J.; Zhang, Y.; Sun, W. Reviews on the Models and Test Methods of Concrete Carbonization Area and Some Suggestions. China Concr. Cem. Prod. 2008, 6, 1–7. [Google Scholar] [CrossRef]
- Niu, D. Durability and Life Prediction of Concrete Structures; Science Press: Beijing, China, 2002. [Google Scholar]
- Zhang, Y.; Jiang, L. A Practical Mathematical Model of Concrete Carbonization Area Depth Based on Mechanism. Ind. Constr. 1998, 28, 16–19. [Google Scholar] [CrossRef]
- Liu, Y. Practical Calculation Model for Steel Corrosion Caused by Concrete Carbonization Area. Master’s Thesis, Tongji University, Shanghai, China, 1997. [Google Scholar]
- Gjørv, O.E. Durability of Concrete Structures. Arabian J. Sci. Eng. 2011, 36, 151–172. [Google Scholar] [CrossRef]
- Shen, D.; Jiao, Y.; Liu, C.; Kang, J.; Tang, X. Effect of Water-to-Cement Ratio on Cracking Resistance of Concrete at Early Age in Restrained Ring Specimens. Can. J. Civ. Eng. 2022, 49, 706–715. [Google Scholar] [CrossRef]
- Ma, Y. Experimental Study on the Mechanical Properties of Sap Concrete. Master’s Thesis, Tianjin University, Tianjin, China, 2015. [Google Scholar]
- Shan, H.; Yu, Z. Strength, Chloride Ion Penetration, and Nanoscale Characteristics of Concrete Prepared with Nano-Silica Slurry Pre-Coated Recycled Aggregate. Buildings 2022, 12, 1707. [Google Scholar] [CrossRef]
- GB 175-2007/XG3-2018; Common Portland Cement. China Standard Press: Beijing, China, 2019.
- JC/T 2551-2019; Super Absorbent Polymer for internal curing of Concrete. China Building Materials Industry Press: Beijing, China, 2020.
- GB/T 20020-2013; Fumed Silica. China Standard Press: Beijing, China, 2014.
- GB/T 14685-2022; Pebble and Crushed Stone for Construction. China Standard Press: Beijing, China, 2022.
- GB/T 14684-2022; Sand for Construction. China Standard Press: Beijing, China, 2022.
- GB 50119-2013; Code for Utility Technical of Concrete Admixture. China Construction Industry Press: Beijing, China, 2014.
- JGJ 63-2006; Standard of Water for Concrete. China Construction Industry Press: Beijing, China, 2006.
- GB/T 603-2002; Chemical Reagent--Preparations of Reagent Solutions for Use in Test Methods. China Standard Press: Beijing, China, 2003.
- GB 1886.26-2016; Food Additive Paraffin Wax. China Standard Press: Beijing, China, 2017.
- Hu, S.; Zhou, Y.; Wang, F.; Peng, B. Effect of Super Absorbent Polymer Particles on Autogenous Shrinkage and Compressive Strength of Concrete. J. Huazhong Univ. Sci. Tech. 2008, 25, 1–4. [Google Scholar] [CrossRef]
- Powers, T.C.; Brownyard, T.L. Studies of the Physical Properties of Hardened Portland Cement Paste; Selected Landmark Papers in Concrete Materials Research; American Concrete Institute: Farmington Hills, MI, USA, 2008; pp. 279–627. [Google Scholar]
- GB/T 50081-2019; Standard for Test Methods of Concrete Physical and Mechanical Properties. China Construction Industry Press: Beijing, China, 2019.
- GB/T 50082-2009; Standard for Test Methods of Long-term Performance and Durability of Ordinary Concrete. China Construction Industry Press: Beijing, China, 2010.
- Shang, S. Water Resources System Analysis Method and Application; Tsinghua University Press: Beijing, China, 2006. [Google Scholar]
- Ji, Y.; Zhao, G.; Fan, Z. A Study on Similarity of Concrete Carbonization Area. J. Huaihai Inst. Technol. 2002, 11, 60–63. [Google Scholar] [CrossRef]
- Du, Y.; Huang, C. Study on Prediction Model for Carbonization Area Depth of High Volume Fly Ash Concrete. J. Yangtze River Sci. Res. Inst. 2011, 28, 68–71. [Google Scholar] [CrossRef]
- Jiang, Q. Concrete Carbonization Area Database and Concrete Carbonization Area Analysis. Climbing Project—Prediction Models for Steel Corrosion and Concrete Freeze-thaw Damage; 1997 Annual Research Report; Tsinghua University Press: Beijing, China, 1997. [Google Scholar]
- Zhang, X.; Chen, T.; Yang, J.; Chen, J. Analysis of Influence Factors on Strength and Durability for Different Kinds of Self-compacting Lightweight Concretes. Bull. Chin. Ceram. Soc. 2019, 38, 39–45. [Google Scholar]
- Loo, Y.; Chin, M.; Tam, C. Carbonization Area Prediction Model for Accelerated Carbonization Area Testing of Concrete. Mag. Concr. Res. 1994, 46, 191–200. [Google Scholar] [CrossRef]
- Chen, Z.; Hu, Y.; Zhao, Y.; Yu, B. Multi-factor Computation model of concrete carbonization area depth based on material parameters in standard carbonization area environment. Bull. Chin. Ceram. Soc. 2019, 38, 1681–1687. [Google Scholar]
- Yu, B.; Li, Q.; Liu, S. Quantitative Durability Analysis Models of Concrete Structures Under Carbonization Area Environment. Bull. Chin. Ceram. Soc. 2020, 39, 20–27. [Google Scholar]
- Ding, Y.; Guo, S.; Zhang, X.; Xu, P.; Wu, J.; Zhang, M. Influence of Basalt Fiber on the Anti-carbonization Area Performance of Recycled Aggregate Concrete. Acta Mater. Compos. Sin. 2022, 39, 1228–1238. [Google Scholar] [CrossRef]
- Yang, L.; Cai, R.; Yu, B. Formation Mechanism and Multi-factor Model for Surface Chloride Concentration of Concrete in Marine Atmosphere Zone. China Civ. Eng. J. 2017, 50, 51–60. [Google Scholar]
- Kim, A.T.; Mark, G.S. Structural Reliability of Concrete Bridges Including Improved Chloride-induced Corrosion Models. Struct. Saf. 2000, 22, 313–333. [Google Scholar] [CrossRef]
| Publisher’s Note: MDPI stays neutral with regard to jurisdictional claims in published maps and institutional affiliations. |
© 2022 by the authors. Licensee MDPI, Basel, Switzerland. This article is an open access article distributed under the terms and conditions of the Creative Commons Attribution (CC BY) license (https://creativecommons.org/licenses/by/4.0/).


