Article

Full-Scale Test and Load-Bearing Capacity Evaluation of Synthetic-Polymer-Fiber-Reinforced Concrete Tetrapods under Quasi-Static Loading

Faculty of Civil Engineering, Transportation Engineering and Architecture, University of Maribor, Smetanova Ulica 17, 2000 Maribor, Slovenia
*
Authors to whom correspondence should be addressed.
Buildings 2022, 12(12), 2143; https://doi.org/10.3390/buildings12122143
Submission received: 15 November 2022 / Revised: 24 November 2022 / Accepted: 30 November 2022 / Published: 5 December 2022
(This article belongs to the Collection Advanced Concrete Materials in Construction)

Abstract

:
This paper studies the load-bearing capacity of various concrete tetrapods under quasi-static loading. The tetrapods were made of plain concrete and synthetic-polymer-fiber-reinforced concrete. Load tests of the tetrapods were performed. The maximum load-bearing capacity and the residual-load-bearing capacity of the tetrapods (the load-bearing capacity after the first crack or at different crack widths) were evaluated. The strength and residual-strength values were back-calculated from the load-bearing capacities, and compared with available data from the literature. The specimens with and without fibers achieved similar maximum load-bearing capacities, with cracks occurring at identical locations. However, the differences in residual-load-bearing capacity were more significant. The synthetic-polymer-fiber-reinforced concrete tetrapods exhibited relatively high residual-load-bearing capacities, even at higher displacements and crack widths. Two different calculation-procedures were used for the load-bearing-capacity evaluation. A load-displacement calculation based on the moment-versus-curvature relation and the plastic-hinge approach was performed, and additionally proved the applicability of the employed calculation-procedures for the concrete tetrapod load-bearing-capacity evaluation.

Graphical Abstract

1. Introduction

Problems with the supply of reinforcing steel and fluctuations in the price of construction material motivate the replacement of conventional steel-reinforcement in reinforced-concrete structures by different fibers, either in whole or at least in part. Steel fibers are the most commonly used fibers, but synthetic- or natural-polymer fibers are also increasingly used nowadays. When conventional reinforcement is replaced by fibers, the production time of concrete elements is significantly reduced, as the time-consuming forming of conventional reinforcement is eliminated, and the price is consequently lowered. This is especially true for concrete tetrapods, which are geometric bodies with four arms oriented at equal angles to each other (approximately 109.5°) and are most commonly used to dissipate the energy of sea waves (breakwater armor). There are also known cases where tetrapods were used to protect river banks from erosion [1]. In [2], it is stated that tetrapods were developed in 1950 at the French Laboratoire Dauphinois d’Hydraulique (the predecessor of Sogreah). The review of the scientific literature shows that most research focuses on the effect of tetrapods on the dissipation of wave energy. However, a few studies also focus on the mechanical behavior of individual tetrapods. For example, in study [3], simulations of the behavior of concrete tetrapods under different static loads were carried out. In [4], an analysis (finite element method) of the temperature changes in the tetrapod during concrete hardening and the resulting stresses is presented, as well as the calculation of the moment-curvature relationships for critical cross-sections of tetrapods with different reinforcements (steel bars, fibers, fiber-reinforced polymer bars). It is pointed out that fibers represent a good option for reinforcement of this type of structural element. However, it is also pointed out that there are no specific standards or guidelines for calculating the load-bearing capacity for this structural element. In [2], the problem of tetrapod damage during the construction/transport phase is also presented, and reference is made to drop tests. An example is presented of tetrapods that, when dropped onto a soft surface, were damaged only after being dropped from a height of one meter, while tetrapods that fell onto a concrete surface were damaged already after being dropped from a height of a few decimeters. Simulations of the drop tests are also presented in [5]. The study [6] presents and studies different options for tetrapod placement. This is important for achieving the functioning of tetrapod groups as a cohesive whole. If tetrapods were used to secure river banks and embankments were built on top of them, they would be subjected to a static vertical-load. Tetrapods, intended to protect coasts and river banks, are often unreinforced [7]. The possibility of tetrapod damage during transportation and installation, as well as the usage of unreinforced tetrapods would severely limit the effectiveness or load-bearing capacity of tetrapods for the stated purpose. Therefore, this study focuses on the calculation of the load-bearing capacity and residual-load-bearing capacity (load-bearing capacity after cracking or at larger crack-widths) of concrete tetrapods reinforced with synthetic-polymer fibers, which could be used for cases where the tetrapods are subjected to relatively high vertical-loads.
Various fibers affect the material properties of concrete differently, and many recent studies focus on this topic. In [8], fiber-reinforced concrete samples (with different fiber types: steel, carbon, glass, coir, jute, and sisal) were tested in compression tests, tensile-splitting tests, and flexural tests. The addition of fibers enhanced the mechanical properties. However, the effect was different for different fibers. In [9], coir-fiber-reinforced cement-based concretes were evaluated in terms of workability, compressive strength, flexural strength, splitting-tensile strength, modulus of elasticity, and permeability. It was shown that coir fiber is a viable choice for improving the strength and durability of concrete. The study [10] focused on the effect of temperature exposure on the response of steel-fiber-reinforced concrete, and it was shown that steel fibers significantly improved cracking impact-resistance. In [11], quasi-static tests were performed on pier specimens cast using polyvinyl-alcohol (PVA)-fiber-reinforced concrete. It was observed that the presence of PVA fibers restrained the spalling of the concrete. In [12], the structural performance of flat slabs with and without a square opening, using four fiber-types (hooked-end, straight, corrugated-steel fiber, and polyolefin fiber) was studied. It was observed that adding fibers enhanced the flexural behavior of the concrete slab. The study [13] focused on the effect of the stress–strength ratio and fiber length on the creep property of polypropylene-fiber-reinforced alkali-activated slag concrete, and it was shown that fiber addition reduces the creep of concrete. The investigation [14] focused on V-shaped reinforced-concrete columns’ behavior and the impact of using micro straight-steel fiber. It was observed that the addition of micro straight-steel fiber to the concrete significantly improved the ultimate axial-load and the bending moment, compared to the reference specimens with the plain reinforced-concrete. The study [15] focused on the properties of cement concrete reinforced with nylon and jute fibers. It was observed that concrete with nylon and jute fibers had enhanced compressive-strength, split-tensile strength, and flexural strength compared plain concrete. In the study [16], a review of different polymer and glass fibers used for fiber-reinforced concrete was given. It was stated that polyolefin fibers enable great workability of fresh-fiber-reinforced concrete, are very compatible with the concrete matrix and do not degrade in the concrete environment, provide fair post-peak mechanical properties of fiber-reinforced concrete, have a relatively low price (compared to other fibers) and are widely available on the construction-material market. However, it was also mentioned that polyolefin fibers are not well represented in the literature. Due to the above-mentioned advantages of polyolefin fibers and to reduce the knowledge gap regarding polyolefin-fiber-reinforced concrete elements, it was decided to examine the option of reinforcing concrete tetrapods with this type of synthetic-polymer fibers.
The paper first presents load tests of tetrapods made of plain and synthetic-polymer- fiber-reinforced concrete. The results were evaluated regarding the maximum and residual-load-bearing capacity. Secondly, two calculation procedures for determining the load-bearing capacity were presented and employed to back-calculate the tensile- and residual-tensile strength values of the fiber-reinforced concrete material. The back-calculated strength values were compared with the strength values available in the literature. Finally, the load-displacement relation was calculated (based on the moment-versus-curvature relation and plastic-hinge approach) for one of the fiber-reinforced tetrapods, and compared with the experimentally observed load-displacement behavior.

2. Materials and Methods

Four tetrapods made of concrete were tested 28 days or later after casting. The mass of the tetrapods was approximately 950 kg. Two tetrapods were without any reinforcement (test specimens L22058_2_1 and L22058_2_2), and two were reinforced with STRUX® 75/32 synthetic-polymer fibers (test specimens L22033_2_1 and L22033_2_2). The dimensions of the tetrapods can be seen in Figure 1.
The concrete mechanical-properties were not separately assessed, as the manufacturer provided a declaration of performance for the concrete according to the European standard EN 206-1 [17], which states that the concrete has mechanical properties in line with the strength-class C25/30.
The STRUX® 75/32 polymer fibers are made of a polypropylene and polyethylene blend, and are also called polyolefin fibers. They are characterized as class II macro-fibers, according to the European standard EN14889-2 [18], generally used where an increase in residual-flexural-strength is required. Additional information about the fibers can be found in [19]. A fiber dosage of 4.13 kg/m3 was chosen, due to the criteria of formability of the fresh concrete, without considering the effect of different dosages on the residual strength of concrete.
The load tests were carried out at the Slovenian National Building and Civil Engineering Institute. The tetrapods were placed on a flat surface, and the load was applied to the end of the upper (vertically-oriented) leg, which was thus compressively loaded. The other three legs were loaded with bending moments and shear and axial forces. The schematic representation for the load test is shown in Figure 2, left, and the actual load is shown in Figure 2, right.
Displacement measurements were performed using the ARAMIS SRX optical-measuring device, which monitored the entire specimen-area visible from one direction during the loading period, and the results were directly output for 11 discrete points (Figure 3). The optical-measuring device measured displacements in a Cartesian coordinate system with axes X, Y and Z. The Y-axis was aligned parallel to the gravity direction, while the X and Z axis were aligned to the horizontal plane. The X-axis was approximately aligned with the vector between points T11 and T9 (Figure 3).
The points T1, T2, and T3 were monitored to gain information about the vertical displacements and assess the tetrapod’s possible sway movements. Points T4-T7 were monitored to assess the crack development, and T8-T11 were monitored to assess the support displacements of the tetrapods. The change in the distance between points T6 and T7 was chosen to represent the crack-width measurement. The first load-test (specimen L22033_2_1) gave information about the crack locations, and two additional inductive-displacement-sensors were applied to the remainder of the specimens, to monitor the cracks. The sensors (R1 and R2), which measured the crack widths (similarly to the change of distance between points T6 and T7), were attached to the tetrapod sides that were not monitored by the optical-measuring device (see Figure 4).
The loading of the specimens was carried out with a 63-tonne hydraulic press. The test was controlled by the rate of displacement increment (0.2 mm/min), which allowed the residual-load-bearing capacity of the tetrapods to be determined. The residual-load-bearing capacity is understood as the load-bearing capacity after crack formation. The vertical displacement of point T1 was chosen to represent the vertical displacement of the tetrapod.

3. Results

The results, in the form of load-versus-displacement curves for point T1 in the y-direction (vertical direction), are shown in Figure 5, and the results in the form of load-vs.- crack-width curves are shown in Figure 6 (results are cut off at a crack size of 3.5 mm). The crack widths of specimen L22033_2_2, measured at two additional locations with inductive displacement sensors (R1 and R2), are given in Figure 7. Additionally, the displacements of points T1, T9, and T11 are given in Figure 8.
Results in Figure 5 through Figure 7 consent with the agreement that fibers do not significantly affect the maximum load-bearing capacity of (only) fiber-reinforced structures (at least with similarly small dosages or low volume-percentages). While it is true that the fiber-reinforced specimen L22033_2_2 achieved the highest maximum load-bearing capacity, the other test specimens showed quite similar maximum load-bearing capacities. The unreinforced specimen’s L22058 _2_2 load-bearing capacity even surpassed the load-bearing capacity of the fiber-reinforced specimen L22033_2_1. However, there was a more significant behavior difference in residual-load-bearing capacity, which was virtually nonexistent for the tetrapods without fibers. Moreover, the tetrapods with fibers (L22033_2_1 and L22033_2_2) showed load-bearing capacity (residual-load-bearing capacity) even at higher displacements and crack widths, which is a direct demonstration of the fiber effect (brittle behavior of the unreinforced tetrapods versus the ductile behavior of the fiber-reinforced tetrapods). Figure 8 confirms that the tetrapods are relatively rigid structural-elements (with large cross-section diameters compared to the tetrapod-leg lengths), as the displacement of point T1 in the vertical direction (the Y-direction, at least up to a displacement of 5 mm,) is mainly the result of the support displacements of points T9 and T11 in the vertical direction (due to the crushing of the concrete in supported regions). The results of the maximum load-bearing capacity and the residual-load-bearing capacity are summarized in Table 1.
Residual-load-bearing capacity F Fts was read at a crack width of 0.5 mm, while the residual-load-bearing capacity, F Ftu , was read at a crack width of 2.5 mm. It should be noted that the crack widths were zeroed for the maximum load. This way, a precise determination of the load at which the crack occurs is omitted, and it also gives conservative results regarding the residual-load-bearing capacity, since it results in a lower-than-actual residual-load-bearing capacity, compared with the actual load at the specific crack-width. For specimen L22033_2_2, the crack width was measured on all three sides of the tetrapod as two inductive displacement sensors, R1 and R2, were additionally used. The determined residual-load-bearing capacities F Fts and F Ftu were therefore equal to the average of the loads read from the measurement data in Figure 7. The relatively small difference between the load-versus-crack-width curves in Figure 7 is most likely the result of the misalignment of the inductive displacement sensors, with the direction perpendicular to the crack plane and the imperfectly symmetric behavior of the tetrapod. The residual-load-bearing capacities of the fiber-reinforced tetrapods also showed significant differences, which can be considered as the effect of the higher concrete (tensile)-strength of the specimen L22033-2-2, compared to specimen L22033-2-1, demonstrated by the higher maximum-load-bearing capacity of the specimen L22033-2-2, compared to specimen L22033-2-1. However, these differences are still in accordance with the differences between the 5% and 95% fractile-tensile strength of concrete according to Eurocode 2 [20], which are equal to 70% and 130% of the mean concrete tensile-strength.
All the test specimens, reinforced or unreinforced, failed in the same way regarding the crack locations (see Figure 9 for specimen L22033_2_2 crack-locations). The failure mode of the tetrapods can be described as the flexural failure of the critical tetrapod cross-sections. Figure 10 shows the crack surface of specimen L22033_2_1, where it can be seen that the failure mode of the fibers was, at least mostly, fiber pull-out failure.

4. Calculation

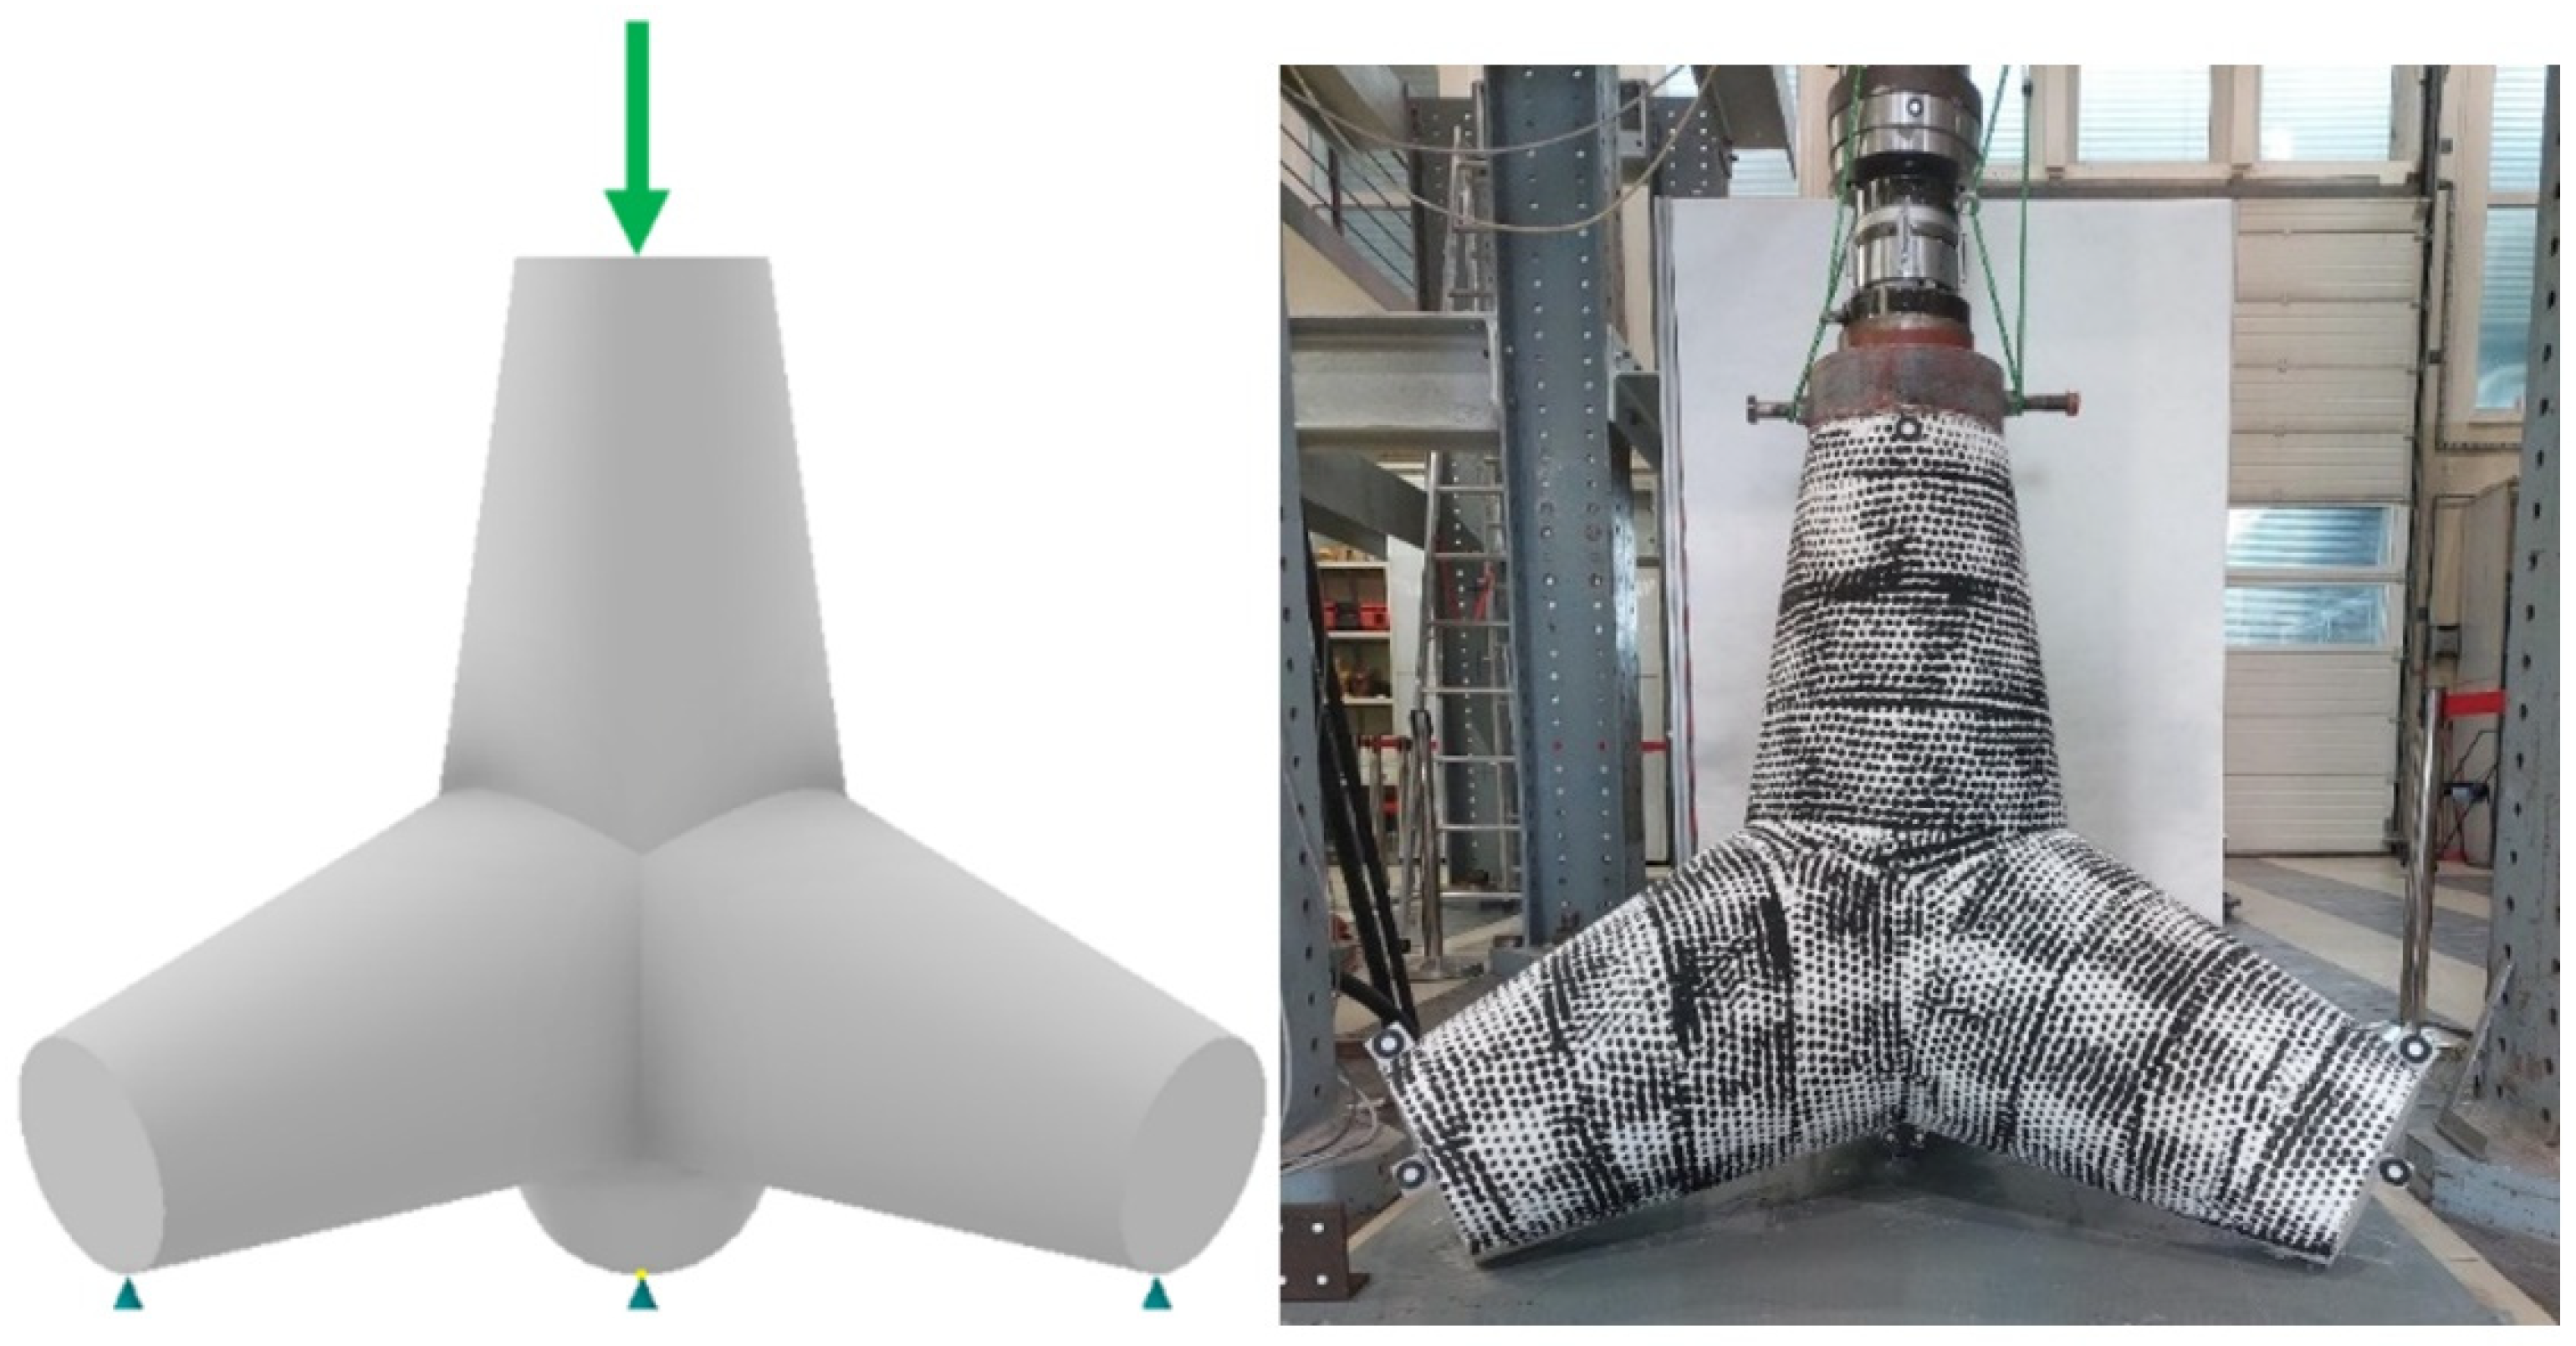
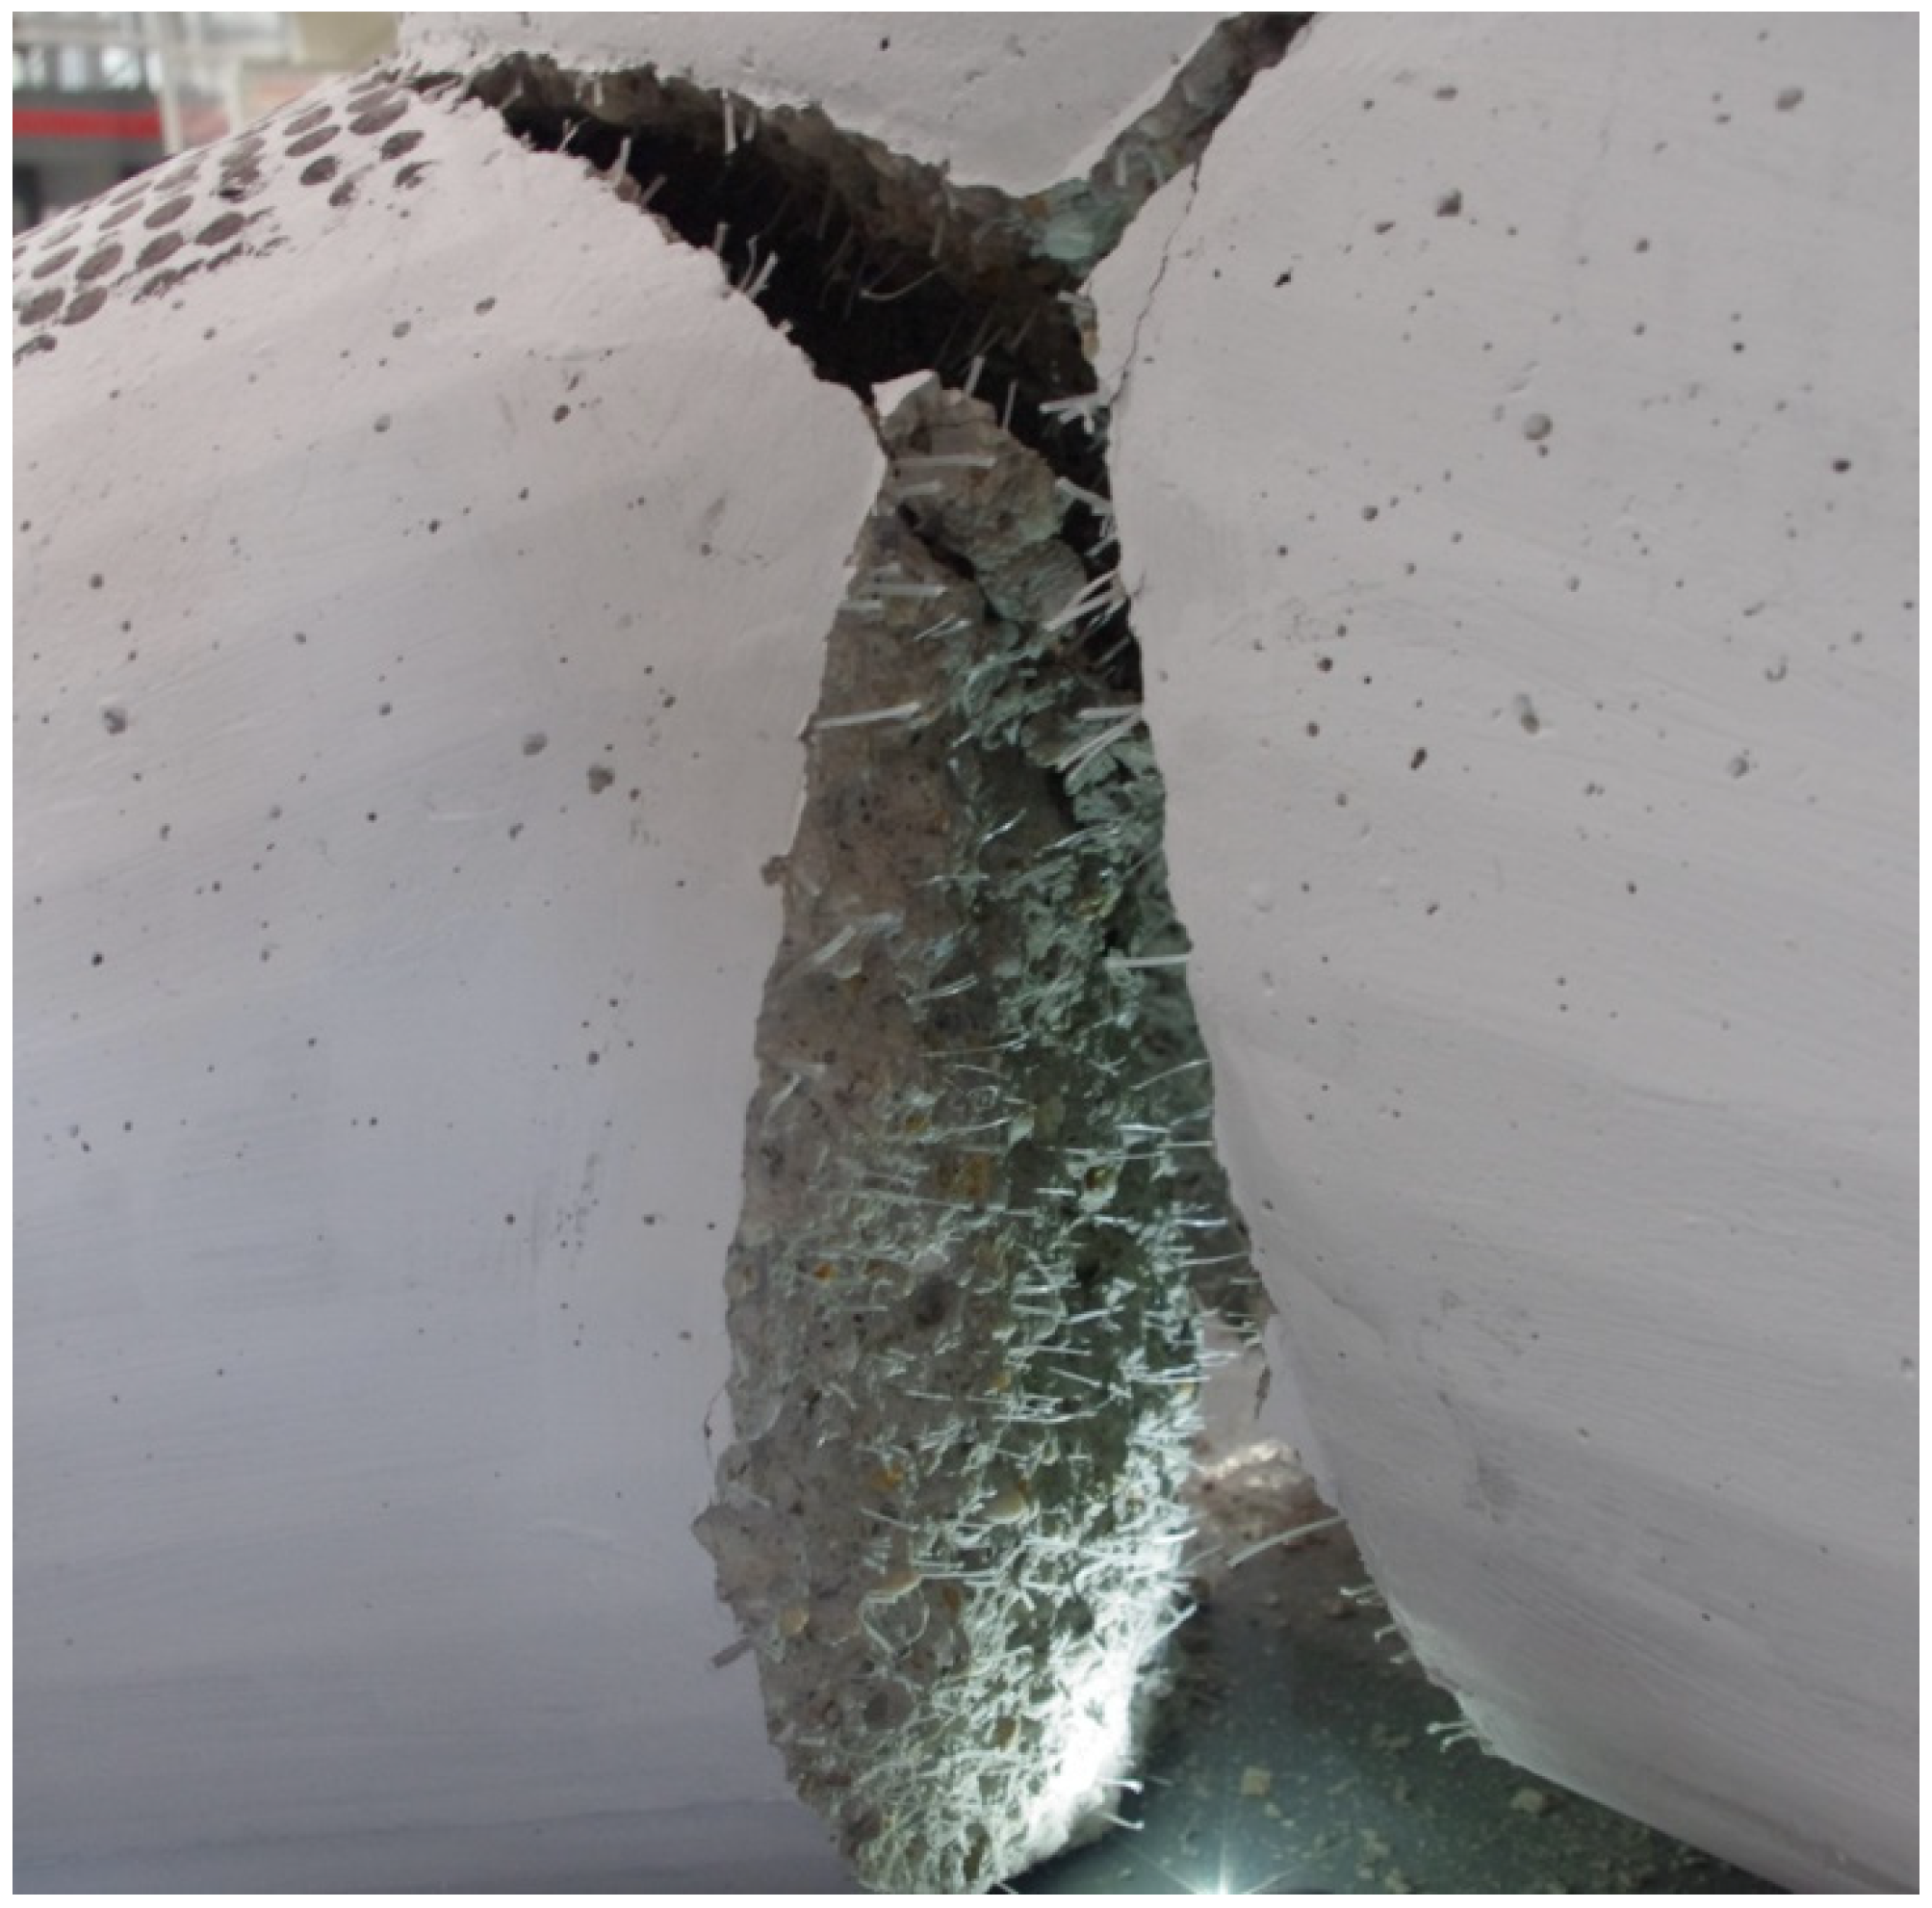
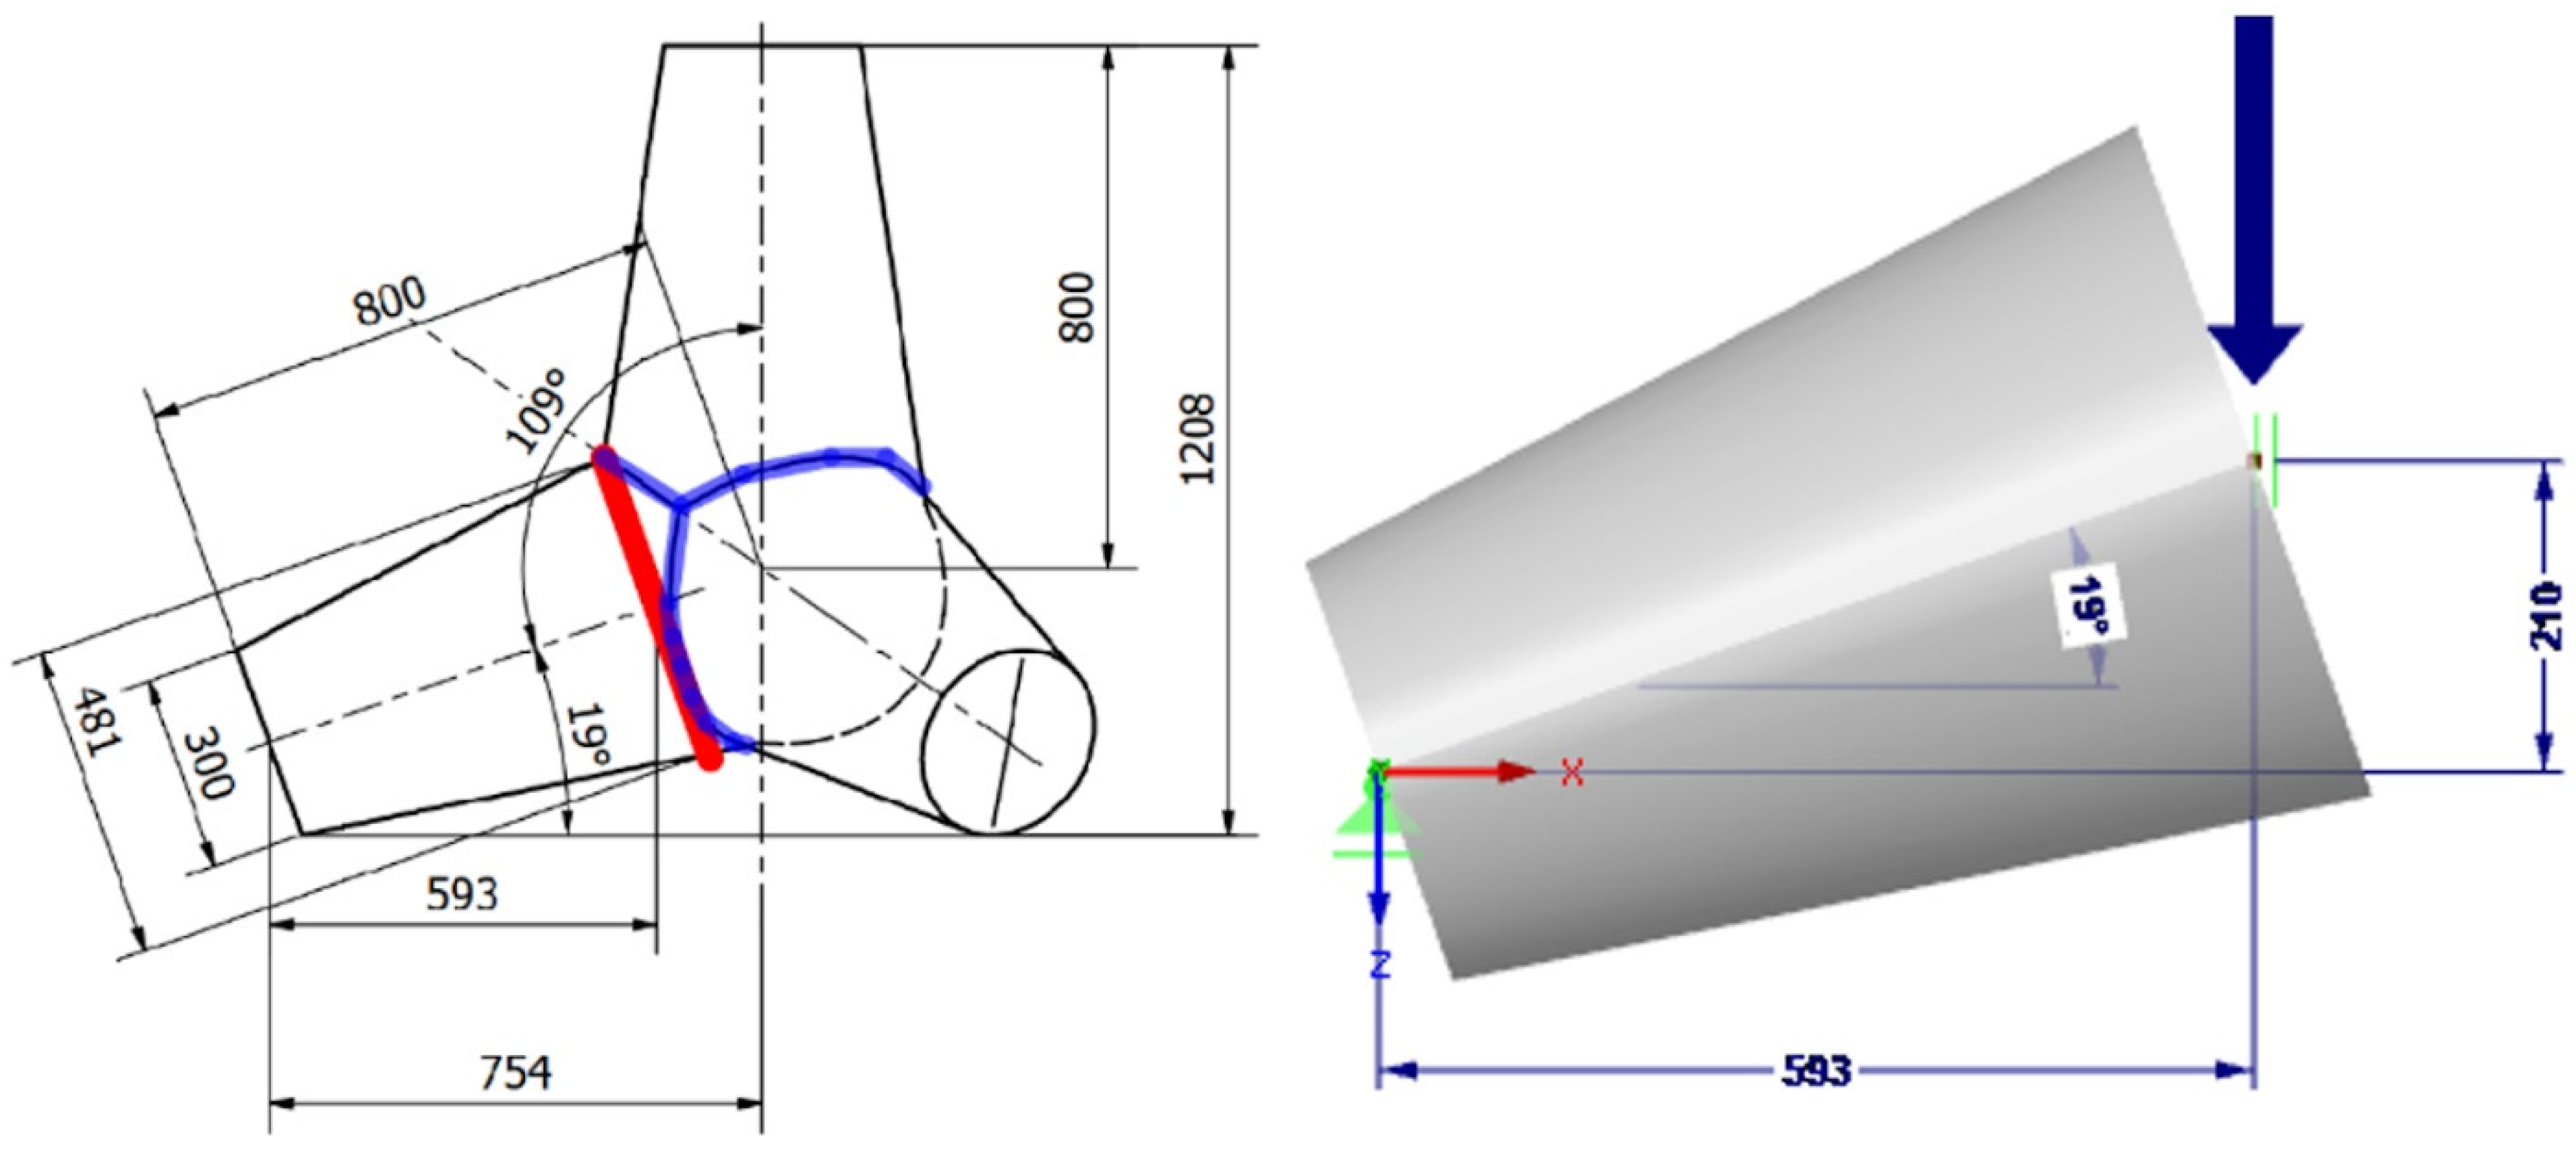
The evaluation of the tetrapod load-bearing capacity is based on the idealization of the tetrapod as a linear structure. The tetrapod legs’ center-lines are considered beams with variable cross-sections. Rotational symmetry is considered, so the static-calculation model is limited to one leg of the tetrapod. It is further assumed that the load (force) is distributed uniformly to the three supported legs. The critical cross-section (the section where the crack occurs) is determined according to the observations from the load tests. As can be seen from Figure 11, left, the critical cross-section considered in the static-calculation model (marked with a red color) agrees with the actual crack (marked with a blue color) and its location observed during the load tests, especially for small crack-widths, which are the center of interest regarding the residual-load-bearing capacity. The static-calculation model (Figure 11, right) includes only the part of the leg up to the critical cross-section, while the remaining part, between the critical cross-section and the geometric center of the tetrapod, is considered a non-deformable core.
The left support in Figure 11, right, is movable in the horizontal direction, while the right support is fixed in the horizontal direction and movable in the vertical direction, and is also prevented from rotating (symmetry conditions). In addition, the frictional force in the left support is considered. The coefficient of friction ( k t ) is taken to be 0.05, which represents an intermediate value for friction between smooth-concrete surfaces and steel surfaces (friction coefficient 0.1) and between smooth-concrete surfaces and painted steel-surfaces (friction coefficient 0.0). The data on friction coefficients are taken from the standard BS 5975 [21]. For the relationship between the load F pre (force) and bending moment M Ed of the critical cross-section, the relationship is thus:
F pre = 3 · M Ed L proj k t · tan α · L proj
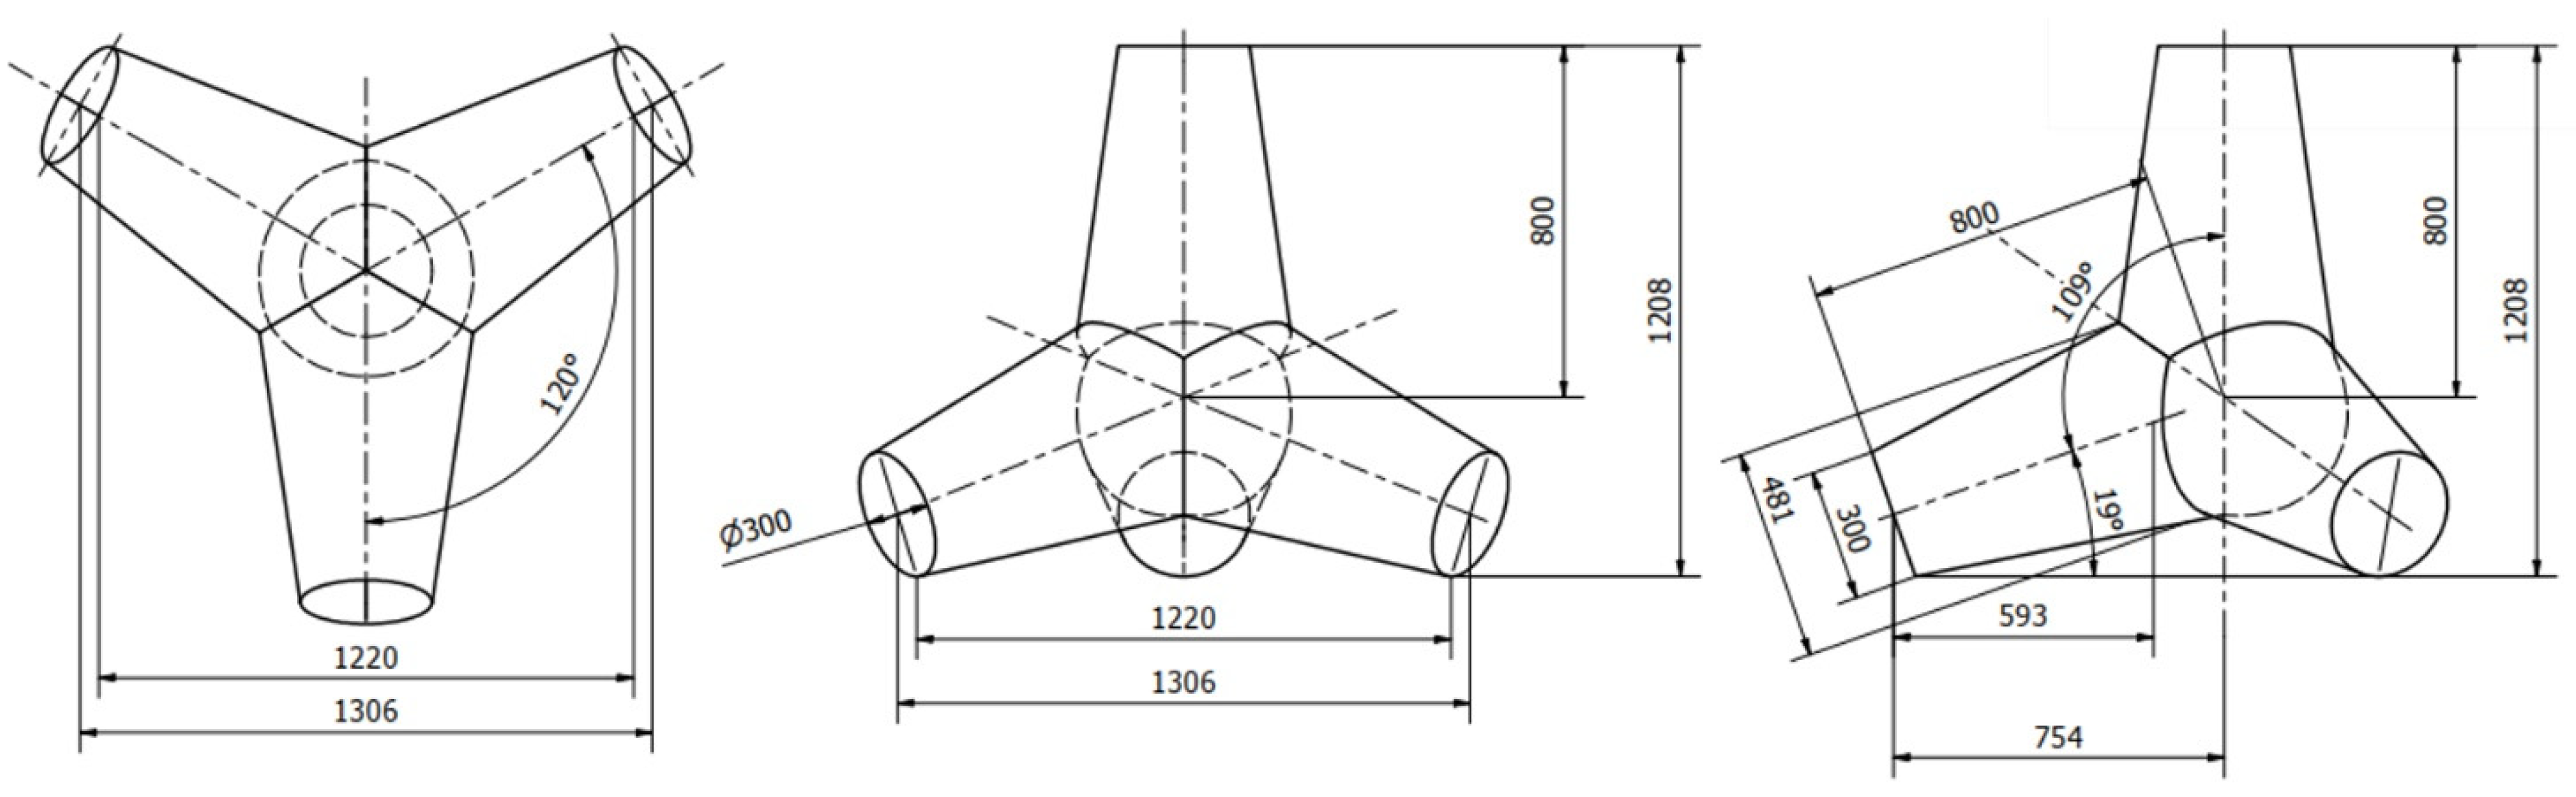
where angle α is equal to 19° and length L proj is equal to 593 mm. The relationship between the shear force, V Ed , and the load is:
F pre = 3 · V Ed cos α k t · sin α
Due to the tetrapod leg’s inclination towards the horizontal, and the frictional force, an axial force is also present in the tetrapod leg. The relationship between the axial force, N Ed , and the load is as follows:
F pre = 3 · N Ed sin α k t · cos α
Two computational models regarding the constitutive law of (fiber-reinforced) concrete were considered, to calculate the load-bearing capacity at the cross-section level of the tetrapods. The presented equations were based on mechanics, as opposed to those based solely on experimental databases, as were presented in the study [22], where the axial capacity of fiber-reinforced polymer-bar-reinforced concrete columns was predicted using data-driven machine learning algorithms. The exact data on the effect of the STRUX® 75/32 fibers on the residual strength of concrete of strength-class C25/30 was unavailable, so both calculations were performed using varying specific parameters for the calculated load-bearing capacities, to match the experimentally determined load-bearing capacities. Thus, the calculation was an inverse analysis (or back-calculation), where the structural resistance is known and material-properties are sought, using a structural model. This definition is given in the fib Model Code for Concrete Structures 2010 [23]. These parameters were the concrete’s tensile strength and the fiber-reinforced concrete’s residual strength. All other material properties of concrete strength-class C25/30 were taken from the fib Model Code for Concrete Structures 2010 [23] and the Eurocode 2 [20]. The back-calculated parameters were then compared with the available data on the material properties, i.e., the tensile strength of concrete of strength-class C25/30 and the estimated residual-strength of concrete of strength-class C25/30 with STRUX® 75/32 synthetic-polymer fibers. Therefore, if the back-calculated strength values exceed the standard tensile-strength of the used concrete C25/30 and the literature data on the residual strength of concrete C25/30, reinforced with the STRUX® 75/32 synthetic-polymer fibers, the calculations are conservative—the calculation with the standard/literature tensile and residual-strength data would underestimate the load-bearing capacities.

4.1. Simplified Calculation

To calculate the tensile strength of concrete, f ct , it was assumed that the stresses vary linearly across the section and that the maximum load-bearing capacity of the tetrapod is reached when, at the lowest point of the cross-section, the tensile stress is equal to the tensile strength of the concrete. In this case, it is necessary to solve the equation:
N Ed π · r tp 2 + M Ed π · 2 · r tp 3 32 · 1 f ct = 1
where r tp is the tetrapod-leg critical cross-section radius. The simplified residual-load-bearing capacity calculation is based on the assumption of constant tensile stresses in the tension zone of the cross-section (in the fib Model Code for Concrete Structures 2010 [23], referred to as the “rigid-plastic model”) and on the assumption of constant compressive stresses in the compressive zone of the cross-section (following fib Model Code for Concrete Structures 2010 [23] and the Eurocode 2 [20]).
To calculate the residual-strength, f Ftu , the conditions for the equilibrium of forces (5) and moments (6) in the cross-section must be satisfied:
F C F frc + N Ed = 0 ,
F C · e F C + F frc · e F frc N Ed · r tp + M Ed = 0
where the moment equilibrium is set at the lower edge of the cross-section, and F C is the resultant of the compressive stresses in the section, F frc is the resultant of the tensile stresses in the section, e F C is the lever arm of the resultant of the compressive stresses to the lower edge of the cross-section, and e F frc the lever arm of the tensile-stress resultant to the cross-section bottom edge.
For the resultant of the compressive stresses, the following expression is considered:
F C = r tp 2 · π 2 · asin r tp λ · x r tp 2 r tp · r tp λ · x · cos asin r tp λ · x r tp · η · f cm
where λ is the effective compression-zone height-factor equal to 0.8, η is the effective strength-factor equal to 0.9 (reduced by 10%, due to the reduction of the compression zone towards the most compressed edge of the cross-section), f cm is the mean compressive-strength of the concrete, and x is the height of the compression zone. For the resultant of the tensile stresses, the following expression applies:
F frc = f Ftu · π · r tp 2 r tp 2 · π 2 · asin r tp 1 · x r tp 2 r tp · r tp 1 · x · cos asin r tp 1 · x r tp
For the lever arm of the resultant of the compressive stresses, the following expression is used:
e F C = r tp + 4 · r tp · sin π 2 · asin r tp λ · x r tp 3 3 · π 2 · asin r tp λ · x r tp sin π 2 · asin r tp λ · x r tp
The following expression has been derived for the tensile-stress resultant lever-arm:
e frc = r tp 2 · 2 · asin r tp 1 · x r tp π 2 + r tp · r tp x · 1 ( r tp 1 · x ) 2 r tp 2 · r tp 4 · r tp · sin π 2 asin r tp 1 · x r tp 3 6 · asin r tp 1 · x r tp 3 · π + 3 · sin 2 · asin r tp 1 · x r tp + π · r tp 3 r tp 2 · 2 · asin r tp 1 · x r tp π 2 + π · r tp 2 + r tp · r tp x · 1 ( r tp 1 · x ) 2 r tp 2 .
Using expressions (1) through (10), we can calculate the unknowns, x and f Ftu . The back-calculated results of the calculation can be found in Table 2. For the “rigid-plastic model” the following equality is considered from the fib Model Code for Concrete Structures 2010 [23]: f r 3 = 3 · f Ftu , where f r 3 is the residual-strength value at 2.5 mm crack width as defined in the European standard EN 14651 [24].

4.2. Detailed Calculation

The detailed calculation is based on the fiber-reinforced concrete constitutive-model, as given in the fib Model Code for Concrete Structures 2010 [23]. It is assumed that fibers do not influence concrete behavior in compression. It is also considered that fibers only start to affect the load-bearing behavior at relatively large tensile-strains. In order to construct a constitutive law for the pre- and post-cracking phase, the residual strengths of concrete with fibers at different crack widths have to be converted into stress–strain relationships. In the fib Model Code for Concrete Structures 2010 [23], a recommendation is made that, for fiber-reinforced concrete elements which show strain-softening behavior (relaxation of the fiber-reinforced concrete, parallel to the increase of the crack width), the characteristic structural length, l cs , can be taken as the height of the cross-section, i.e., in the present case, the diameter of the critical cross-section of the tetrapod leg. For the relation between the strain, ε, and the crack width, w, the expression ε = w l cs is valid. For calculation, the tensile-strain limit, ε C , at which the influence of the fibers begins to be taken into account, at least computationally, is, according to the fib Model Code for Concrete Structures 2010 [23], calculated with the expression:
ε C = f Fts f ct + 0 . 8 · f ct · ε P ε P ε Q ε SLS · f Fts f Ftu ε SLS ε ULS f Fts f Ftu ε SLS ε ULS 0 . 8 · f ct ε P ε Q
where f Fts is the residual strength at a crack width of 0.5 mm, f Ftu , the residual strength at a crack width of 2.5 mm, ε P , the tensile strain of the concrete just before (macro) crack formation equal to 1 . 5 · 10 4 , ε SLS , the strain at crack width 0.5 mm, ε ULS the strain at crack width 2.5 mm, and ε Q 
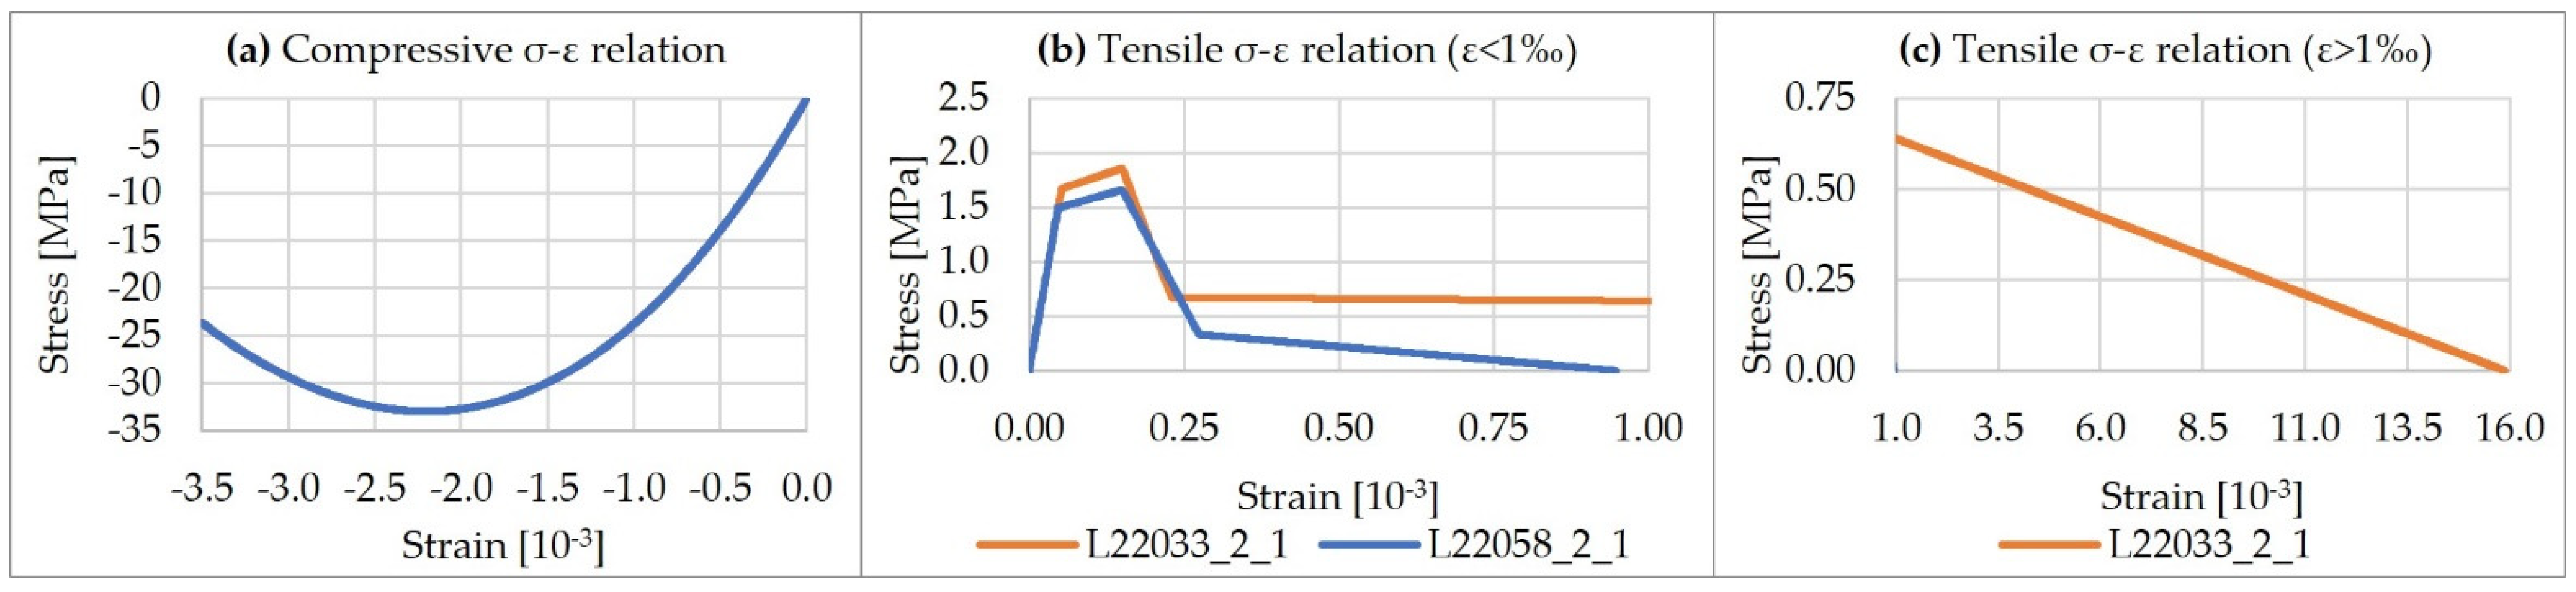
the strain of the concrete without fibers after crack formation at a stress equal to 0.2 times the tensile strength of the concrete. Examples of constitutive laws for the fiber-reinforced (specimen L22033_2_1) and unreinforced (specimen L22058_2_1) concrete, are shown in Figure 12.
The constitutive laws of the fiber-reinforced (specimen L22033_2_1) and unreinforced (specimen L22058_2_1) concrete shown in Figure 12 clearly depict the fact that the fibers do not affect (as regards the calculation) the compressive behavior of concrete (Figure 12a); however, it is evident from Figure 12b that the fibers affect the residual tensile strength of concrete, which is nonexistent for large strains and approximately larger than 1‰ for the given case, as can be seen in Figure 12c.
The method of dividing the cross-section into layers was employed. It was decided to divide the cross-section into 1500 layers. The thickness of each layer (of the critical cross-section) is:
t sl = D tp 1500 = 0 . 321   mm
where D tp is the diameter of the critical cross-section of the tetrapod leg. The width of each layer is:
b sl , i = 2 · r tp · cos asin y sl , i   r tp r tp
where y sl , i is the center of gravity of each layer measured from the bottom edge of the cross-section, and is calculated by:
y sl , i = 2 · r tp t sl · i + t sl 2
where i is the index of each layer, (i are numbers between 1 and 1500).
The relationship between the curvature of the cross-section and the load-bearing capacity of each tetrapod was calculated. The detailed calculation included the bisection method, which was employed to calculate the strain at the bottom edge of the cross-section at different values of cross-section curvature. The corresponding loads (forces) were calculated for the different curvatures. The expressions (1–3) and the equations of equilibrium of forces and moments in the cross-section were used:
N Ed = i = 1 1500 σ i · b sl , i · t sl
M Ed = i = 1 1500 σ i · b sl , i · t sl · y sl , i 1 + N Ed · r tp
where σ i is the stress in the i-th layer of the cross-section (read for the deformation of the i-th layer, ε i , from the stress–strain diagram, Figure 12). The calculation was carried out as explained above, by looking for the tensile strength of the concrete, f ct , the residual strength at a crack width of 0.5 mm, f Fts , and the residual strength at a crack width of 2.5 mm, f Ftu . The calculation of the stress–strain relationship was repeated until the experimental and calculated maximum load-bearing capacities, the residual-load capacities at a crack width of 0.5 mm, and the residual-load-bearing capacities at a crack width of 2.5 mm, were in agreement. The back-calculated strength-value results of the calculation are given in 
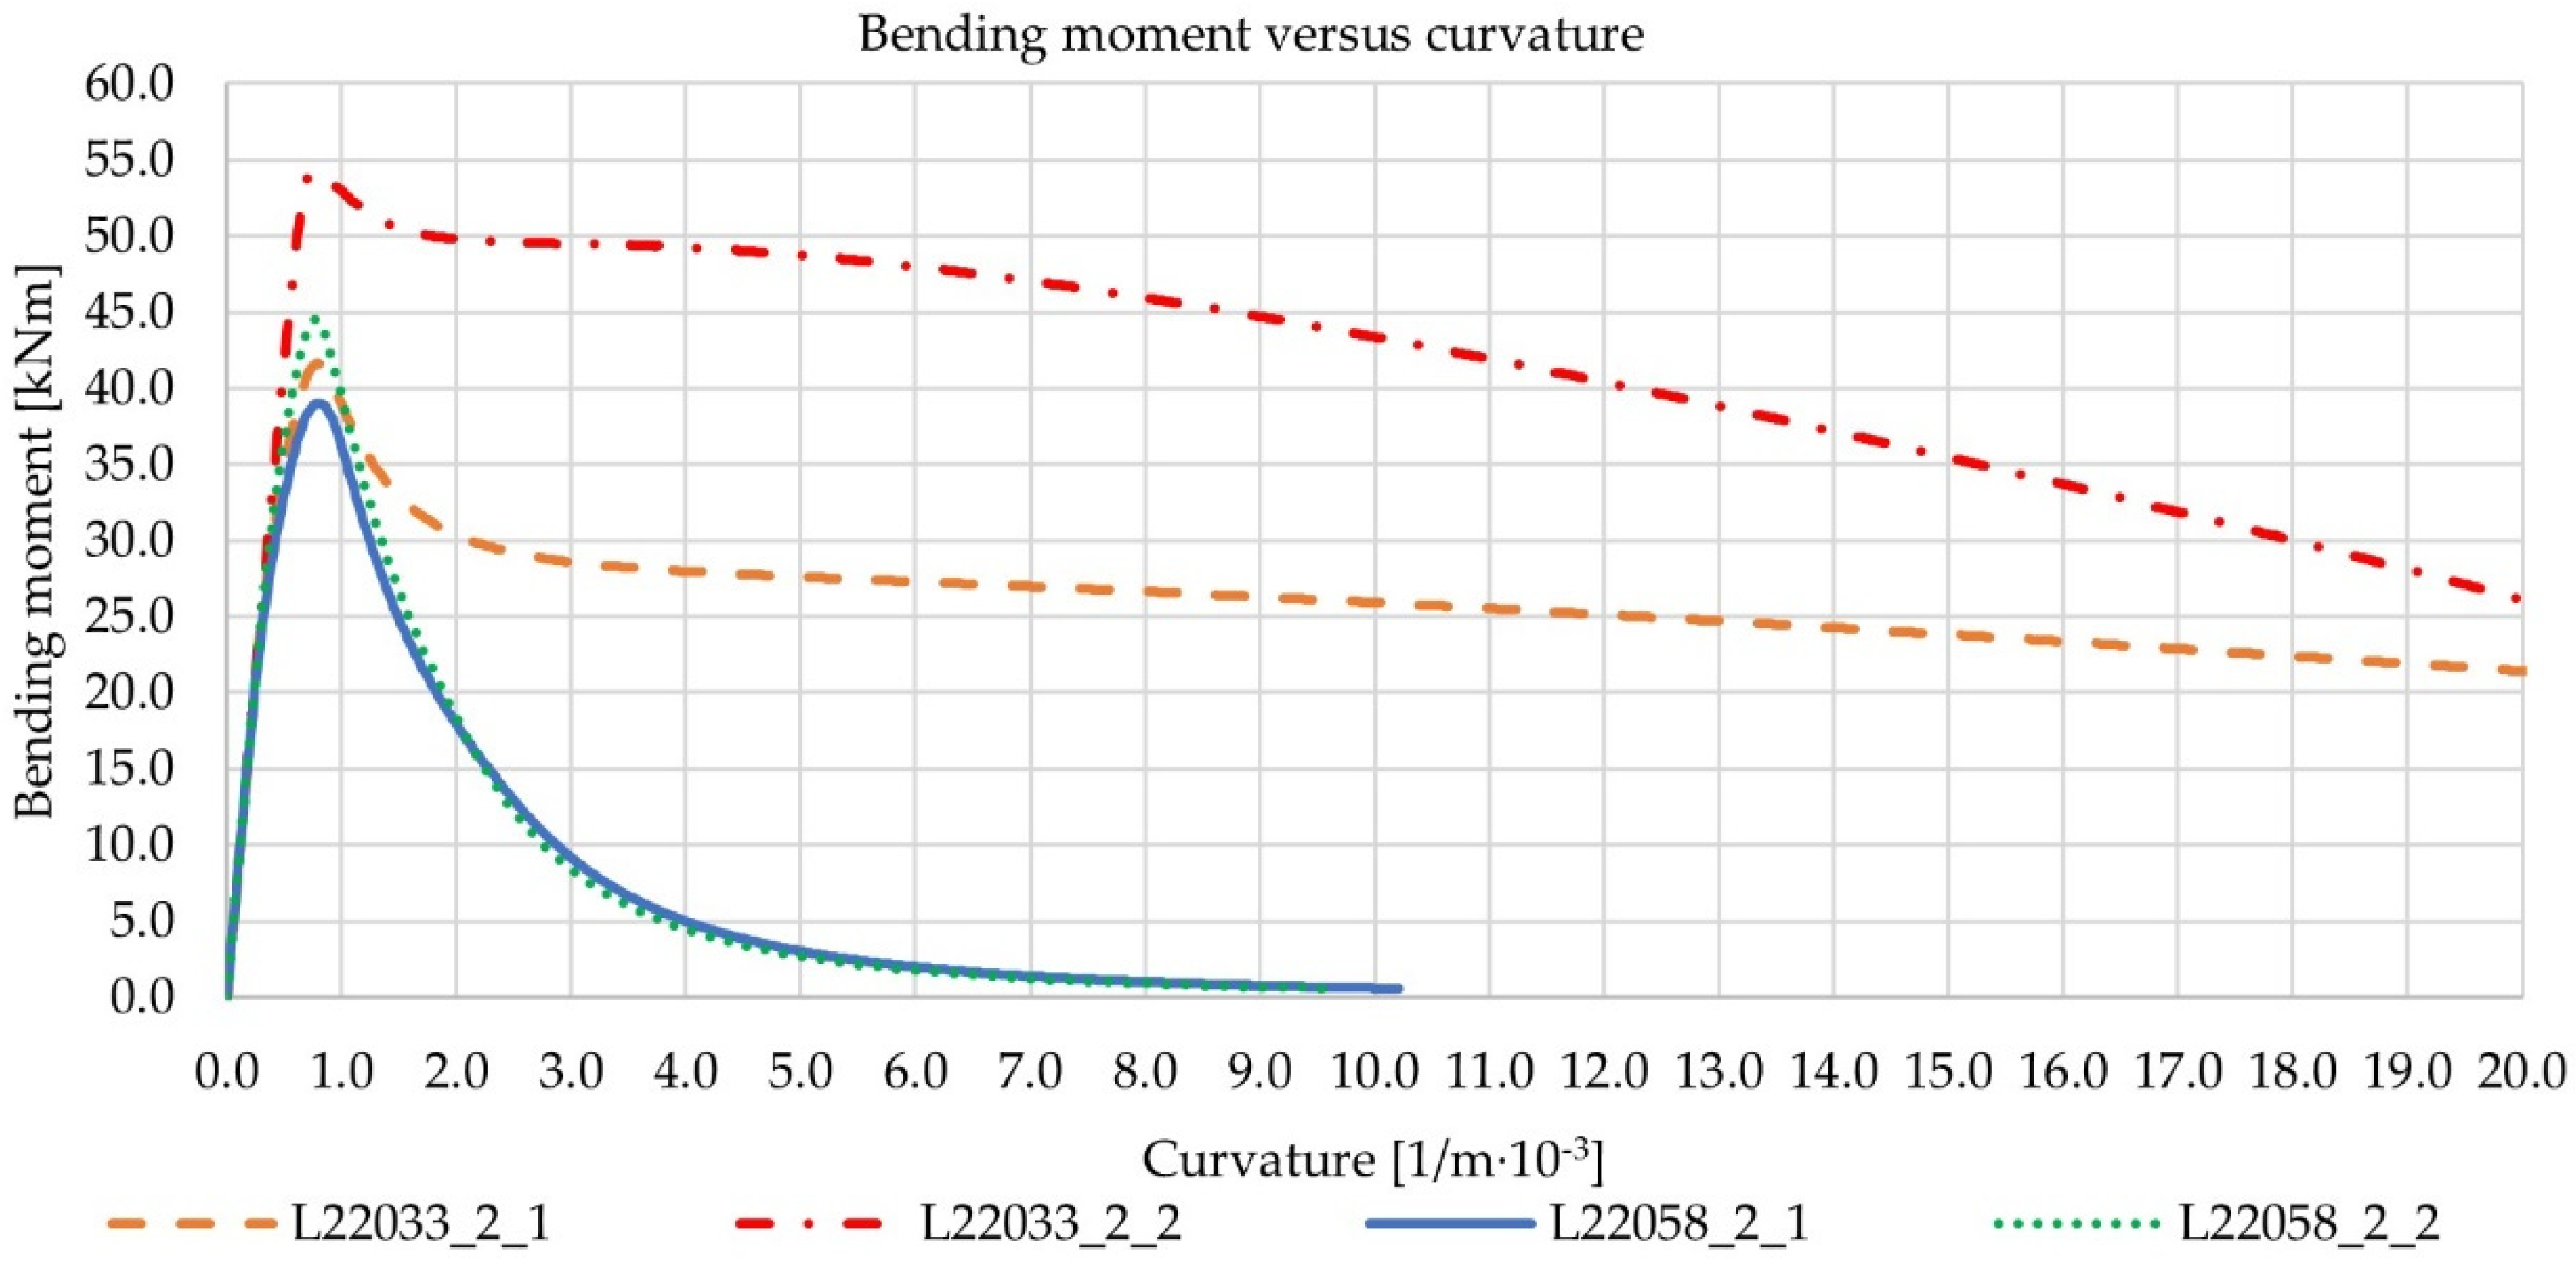
Table 3, while the corresponding bending-moment-versus-curvature relations are given in Figure 13.
To calculate the residual strengths, f r 1 and f r 3 in Table 3, the relationships presented in [25] were applied, as the corresponding relationships in the fib Model Code for Concrete Structures 2010 [23] are very simplified and, in the case at hand, when f r 1 and f r 3 are calculated from f Fts and f Ftu the calculation returns inappropriate results. The expressions used are:
f r 1 = f Fts 0 . 37 ,
f r 3 = f Ftu + 0 . 2645 · f r 1 0 . 5715

4.3. Estimated Residual-Strength Values of Concrete C25/30 Reinforced with STRUX® 75/32 Fibers

No specific values for the residual strengths of concrete of strength-class C25/30 reinforced with STRUX® 75/32 fibers were found. However, the results of bending tests (in line with the European standard EN 14889-2 [18] and EN 14651 [24]) of concrete strength-class C40/50 beams with different fiber dosages (four beams per dosage) of STRUX® 75/32 fibers were available in [26]. Furthermore, indicative values of the equivalent residual-strengths (according to the standard ASTM C 1018-97 [27]) of concretes of different strength-classes and with different dosages of STRUX® 90/40 fibers were also available in [28]. It was assumed that the effect of the concrete strength-class on the differently defined residual-strengths (equivalent or at specific crack-width) is similar. Furthermore, STRUX® 75/32 and STRUX® 90/40 fibers are both made of the same material, but have different lengths (32 mm and 40 mm) and similar effective-diameters, as seen from the document [29]. It was thus also assumed that the relationships of residual strengths to concrete-strength classes of concretes reinforced with STRUX® 90/40 fibers are similar to the relationships of residual strengths to concrete strength-classes of concretes reinforced with STRUX® 75/32 fibers. The estimated residual-strengths of concrete of strength-class C25/30 with STRUX® 75/32 synthetic-polymer fibers were calculated using linear interpolation. The STRUX® 75/32 data (for concrete strength-class C40/50) was used to interpolate the estimated strengths according to the chosen fiber-dosage, and the STRUX® 90/40 equivalent residual-strength data was used to interpolate the estimated values according to the strength-class of the concrete. Interpolated estimated residual-strength values f r 1 (at 0.5 mm crack width) and f r 3 (at 2.5 mm crack width) as defined by the European standard EN 14651 [24], are summarized in Table 4. It should be noted that the residual strengths f ri , according to the European standard EN 14651 [24], are fictitious strengths, since they are calculated on the assumption of a linear stress-distribution in the cross-section of the beams.

4.4. Comparison of the Calculated (Based on the Load Tests) Strength Values with Strength Values Available from the Literature

The tetrapods were made of concrete of strength-class C25/30, for which (according to Eurocode 2 [20]) the 5% fractile-tensile strength is equal to 1.8 MPa, the mean tensile-strength equal to 2.6 MPa, and the 95% fractile-tensile strength equal to 3.3 MPa. The comparison with the back-calculated tensile strengths of the simplified calculation (results in Table 2) shows that the simplified calculation is rather conservative—tensile-strength values close to or even higher than the 95% fractile-tensile strength of concrete C25/30 are needed for the calculated maximum load-bearing capacity to match the experimentally determined maximum load-bearing capacity. Comparing the concrete C25/30 tensile-strength values with the back-calculated tensile-strength values of the detailed calculation (results in Table 3) shows that the detailed calculation gives more accurate results. In order for the calculated maximum load-bearing capacity to match the experimentally determined maximum load-bearing capacity, a tensile strength close to the 5% fractile-tensile strength of the concrete strength-class C25/30 is needed, except for specimen L22033_2_2, for which a value close to the 95% fractile-tensile strength of the concrete strength-class C25/30 is needed. The comparison of the (from the literature) estimated residual-strengths f r 1 and f r 3 (Table 4) with the calculated ones shows that both the simplified and the detailed calculations are conservative, since residual-strength values of fiber-reinforced concrete of strength-class C25/30 close to or higher than the estimated residual-strength values f r 1 and f r 3 from Table 4 are needed for the calculated residual load-bearing capacities F Fts and F Ftu to match the experimentally observed residual load-bearing capacities. Furthermore, the comparison of the calculated residual-strength values f r 3 from Table 2 and Table 3, indicates that the rigid-plastic constitutive model (Section 4.1) and the consideration of the more realistic constitutive model (Section 4.2) of fiber-reinforced concrete, give very similar results (differences of less than 3%). It means that the rigid-plastic model can be applied for calculating the residual-load-bearing capacities of fiber-reinforced concrete circular cross-sections without loss of accuracy, compared to a calculation with more realistic stress-distributions in the cross-section.

4.5. Load-Displacement Calculation and Comparison with Load Test Results

The load-displacement behavior of the tetrapod L22033_2_1 was calculated using the same static model as for the load-bearing-capacity calculation (Figure 11, right). A numeric algorithm was written where, in the first step, the tetrapod leg was divided into 100 segments and where for each segment cross-section, the bending-moment-versus-curvature relation was calculated (as for the critical cross-section in Section 4.2). The total deflection was calculated as the sum of the deflection coming from the flexural, shear, and axial deformation of the tetrapod leg and the axial deformation of the vertical (axially loaded) tetrapod leg.
The flexural deflection was calculated by numerically integrating (the trapezoidal rule) the curvature along the tetrapod leg with virtual bending-moments resulting from a virtual unit-force at the location, and oriented in the direction of the actual tetrapod-loading during the load tests. For each calculated curvature and the corresponding bending moment of the critical cross-section, the corresponding curvatures along the tetrapod leg were calculated, taking into consideration the fact that the bending moments vary linearly along the tetrapod leg and are a function of the segment location along the tetrapod leg. The shear deflections were calculated by integrating the shear forces with virtual shear-forces and considering the shear correction-factor (κS) as equal to 0.9 (as per [30], for example). The deflections resulting from axial forces were calculated by integrating the axial forces with the virtual axial-forces. Variation of the cross-section area along the tetrapod leg was considered. The following equation was used for calculating the deflection Δ (for different loads):
Δ = 3 · i = 0 99 L seg 2 · κ fl i · M i ¯ + κ fl i + 1 · M i + 1 ¯ + 3 · 0 L leg N ·   N ¯ E cm · A x dx + 3 · 0 L leg V ·   V ¯ E cm 2 · 1 + ν · κ S · A x dx + 0 L leg F pre ·   1 ¯ E cm · A x dx ,
where κfl,i are curvatures at different segment cross-sections along the tetrapod leg. Index 0 denotes the cross-section at the beginning of the tetrapod leg, and index 100 (99+1) denotes the critical cross-section of the tetrapod leg. M i ¯ are virtual bending-moments at different segment cross-sections, Lseg is the length of the segments, Lleg is the length of the tetrapod leg, N is the axial force in the tetrapod leg, N ¯ is the virtual axial-force in the tetrapod leg, Ecm is the mean elastic-modulus of the used concrete-strength-class, A(x) is the tetrapod-leg cross-section area at location x, V is the shear force in the tetrapod leg, V ¯ is the virtual shear-force in the tetrapod leg, ν is the Poisson’s ratio for concrete (0.2), and Fpre the different load (force) steps.
This procedure was, however, only appropriate up to curvatures of the critical cross-section corresponding to a bending-moment less than or equal to the maximum bending-moment from the bending-moment-versus-curvature relation from Figure 13. For larger curvatures, the plastic-hinge approach was applied. Many studies state different values for the appropriate plastic-hinge lengths, as shown in [31], where different studies’ plastic-hinge lengths (also called characteristic or structural-characteristic length) range from half of the cross-section height to twice the cross-section height for steel-fiber-reinforced concrete. As steel-fiber-reinforced-concrete design procedures are commonly also applied to polymer-fiber-reinforced concrete, the plastic-hinge length applied for the deflection calculation in this study was chosen as equal to the diameter of the critical cross-section. After all, this value was already used for transforming the stress-versus-crack-width relation into the stress-versus-strain relation in Section 4.2. However, for the present case of three bent tetrapod-legs (the fourth is only axially loaded) joined at one location, the plastic-hinge length for beams translates to half of the chosen plastic-hinge length at the end of each of the three bent tetrapod-legs.
For the tetrapod leg-segments inside the plastic-hinge length, a constant curvature equal to the curvature of the critical cross-section, was considered. According to [32], this is a valid assumption for fiber-reinforced concrete elements with tensile-softening behavior, as was the case in this study. For tetrapod leg-segments outside the plastic hinge, the curvature for a specific bending-moment acting on the segment cross-section was read (from Figure 13) from the quasi-elastic part of the bending-moment-versus-curvature relation curve (part of the curve from zero curvature up to curvature corresponding to the maximum bending-moment of the segment cross-section).
After reaching the maximum load-bearing capacity of the tetrapod, or for loading after reaching the curvature corresponding to the maximum bending-moment of the critical cross-section, the shear deflection consisted of two parts: shear deflection of the tetrapod leg outside the plastic-hinge (calculated as before) and shear deflection of the plastic-hinge part. A shear area equal to the uncracked critical cross-section area multiplied by the shear correction-factor (κS) was considered for the integration of the shear forces with virtual shear-forces for the plastic-hinge part. The crack depth was calculated based on the assumption that the layers of the critical cross-section with tensile strains larger than 0.15‰ are cracked. The portion of the total deflection resulting from flexural and shear deformations (Δfl+s) of the plastic-hinge part was calculated with:
Δ fl + s = 3 · L P 2 · M L leg 0.5 · L P ¯ + M L leg ¯ 2 · κ fl . cs + 3 · L P 2 · V · V ¯ E cm 2 · 1 + ν · κ S · A cs . uncr . ,
where LP is the plastic-hinge length, M ( L leg     0 . 5 · L P ) ¯ and M ( L leg ) ¯ the virtual bending-moments at the beginning and the end of the plastic-hinge part, κfl.cs the curvature of the critical cross-section (considered as uniform curvature along the plastic-hinge length), and Acs.uncr. the uncracked area of the critical cross-section. The deflection resulting from the tetrapod parts outside the plastic-hinge length is calculated according to Equation (19), but with accordingly lower integration-lengths. The deflection calculations with Equations (19) and (20) were performed at each load (force) step.
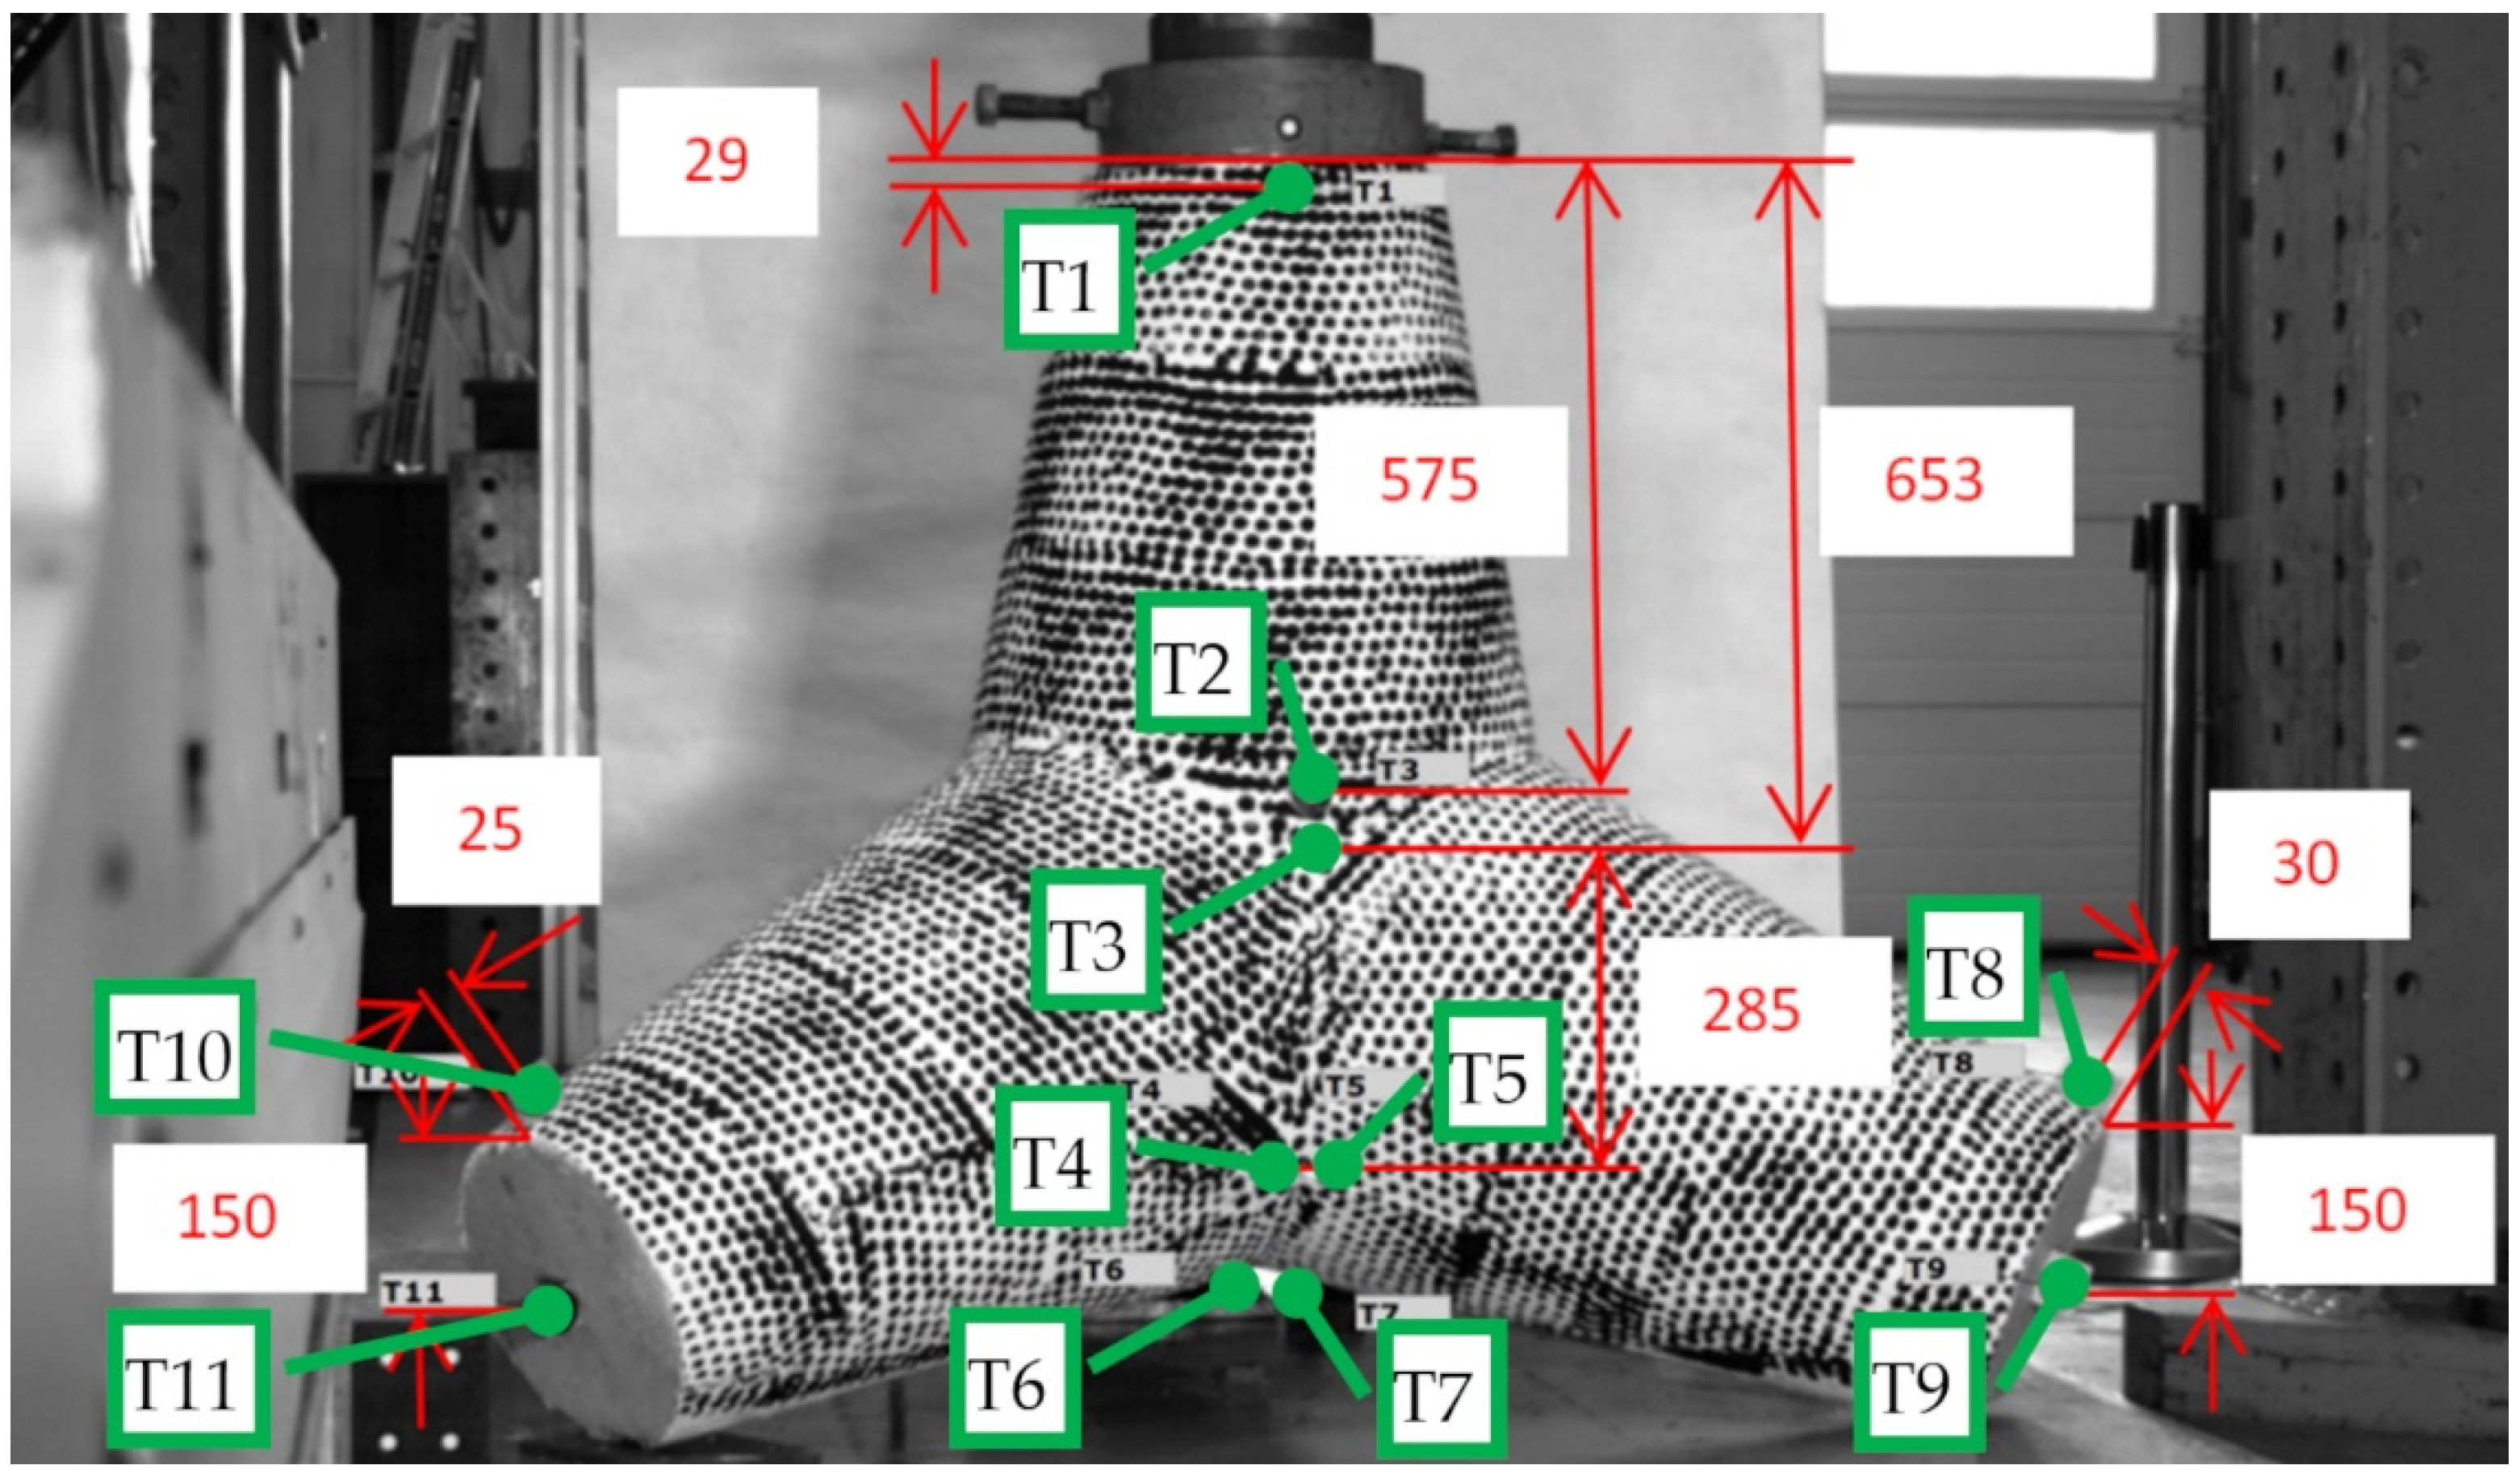
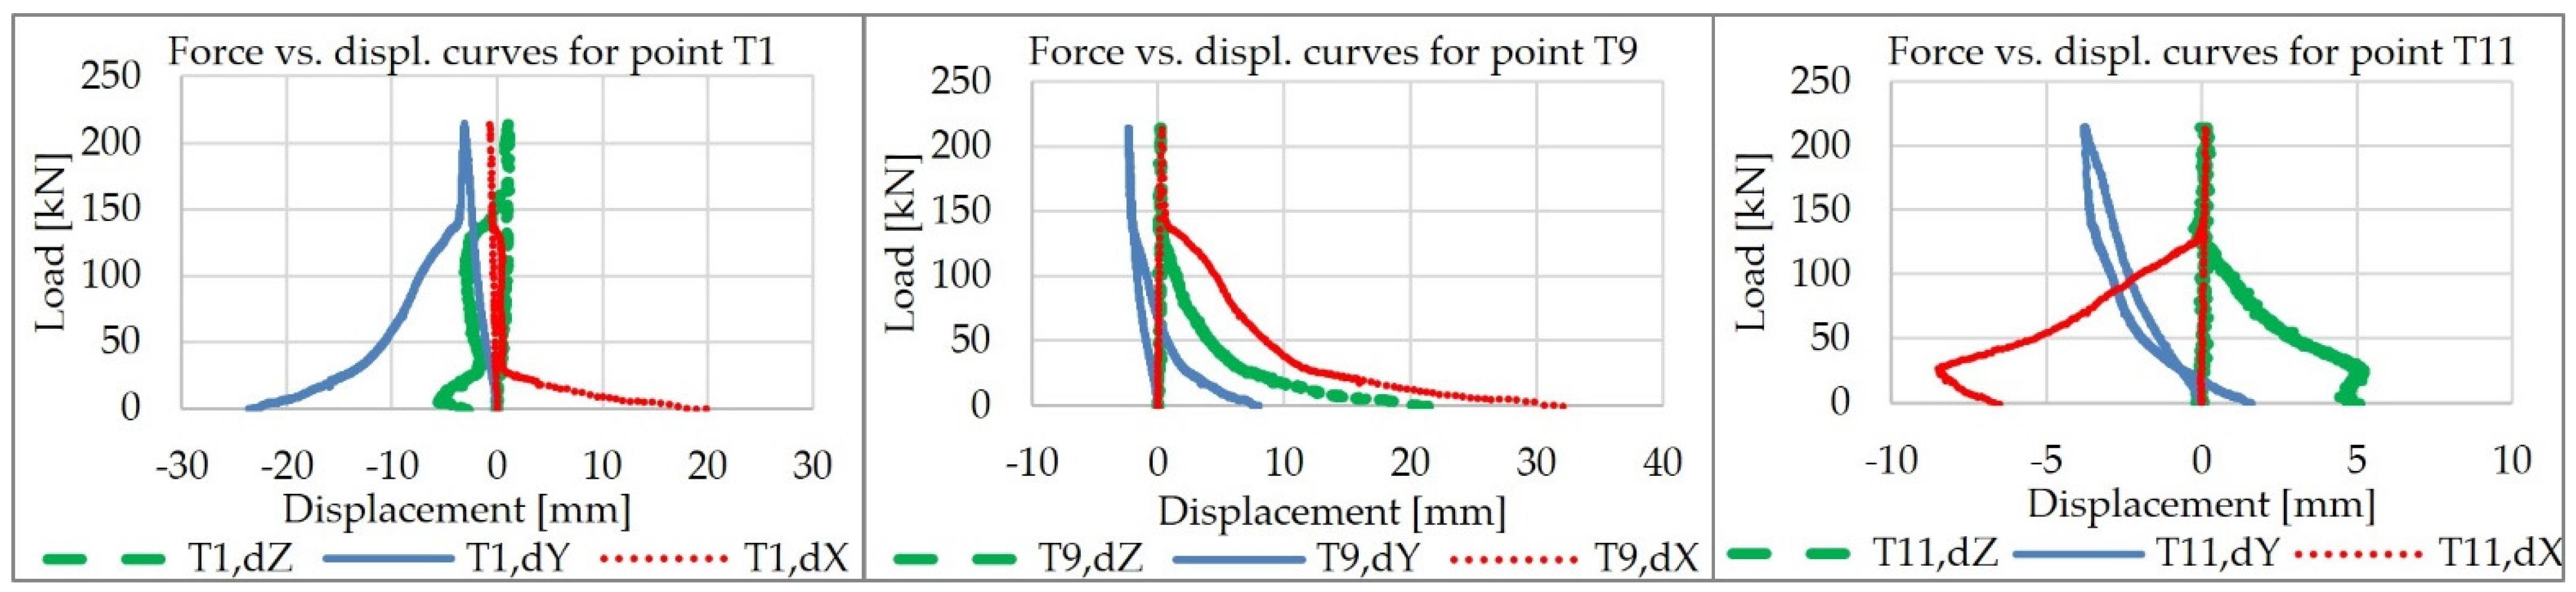
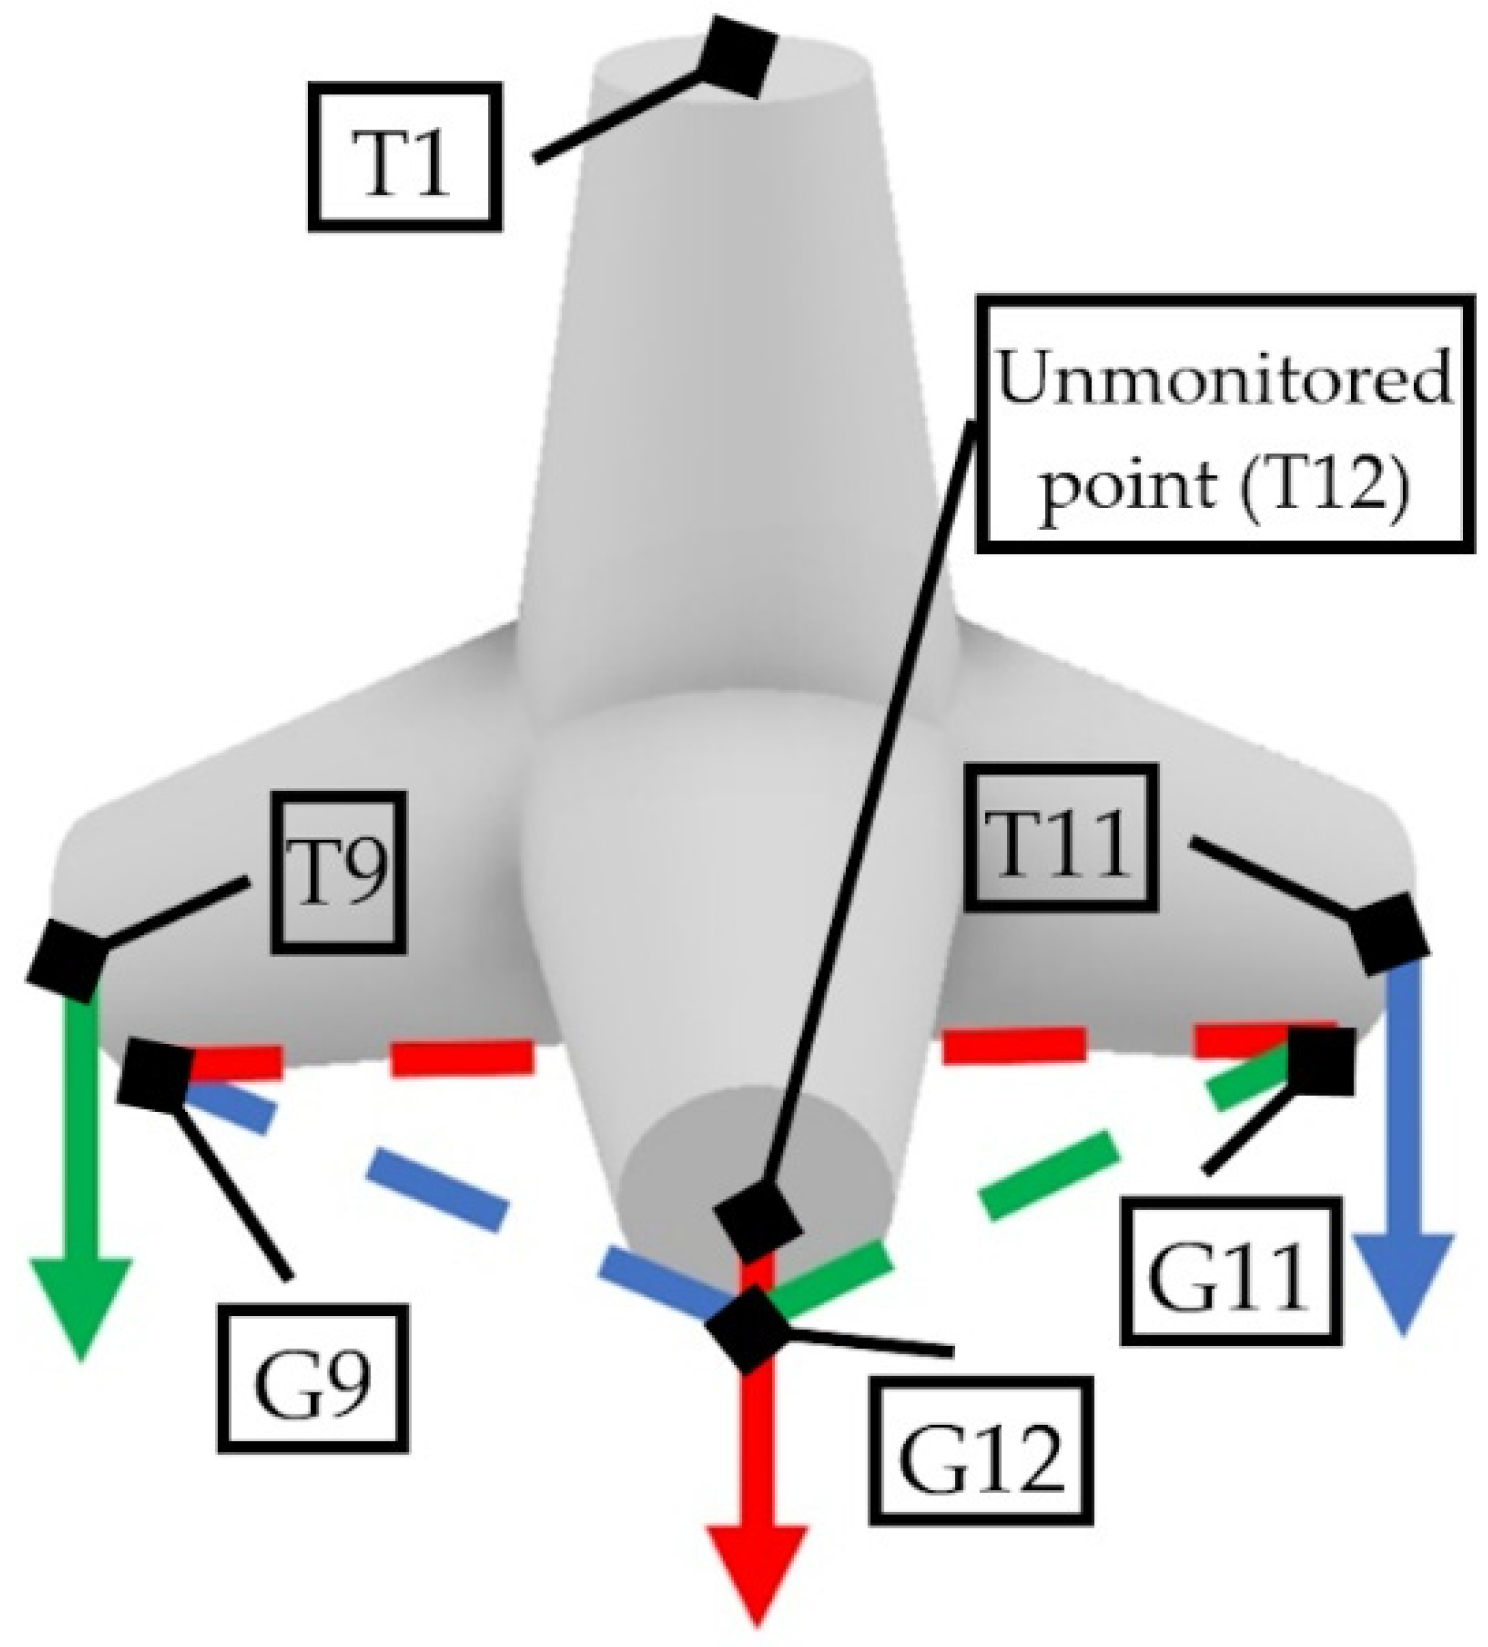
In order to compare the experimental and calculated load-deflection relations, the displacements of the supports had to be subtracted from the total deflection (deflection of point T1 in Figure 3). Only the support displacements of two tetrapod legs were monitored (points T9 and T11 in Figure 3). However, as the displacements were measured in three dimensions, the measured displacements were used to estimate the unmonitored leg-support-point displacement (point T12 in Figure 14). It was assumed that the displacement of point T1 in the vertical direction was mainly the result of the support-point displacements (displacements of points T9, T11, T12) and that the displacements of point T1 result from rotations about the three axes going through the ground-contact points (G9, G11, and G12), as shown in Figure 14.
By knowing the coordinates of the monitored points and the unmonitored support-point (given in Table 5), an algorithm was written to estimate the displacements of the support-point T12. The Rodrigues’ rotation matrix ( R θ ) formula [33] was applied:
R θ = e · θ ,
where θ denotes the rotation angle, and ῶ denotes the antisymmetric matrix:
= 0 ω z ω y ω z 0 ω x ω y ω x 0 .
ωx, ωy, and ωz are components of the unit vector, which specifies the axis of rotation. For each step of the measurement data (measured displacements of point T1 for each load stage), the rotation angles (θ1, θ2, θ3) about the three axes going through the support points were calculated by applying the equality condition of the measured displacements being the same as the calculated displacements of point T1 (with coordinates from Table 5), due to the three rotations θ1, θ2, and θ3. The rotation-axes unit vectors were calculated from the coordinates of points G9, G11, and G12, from Table 5. The three rotation angles and Rodrigues’-rotation-matrix formula were then used to calculate the estimated displacement of the unmonitored support-point T12 (based on the coordinates of point T12, from Table 5).
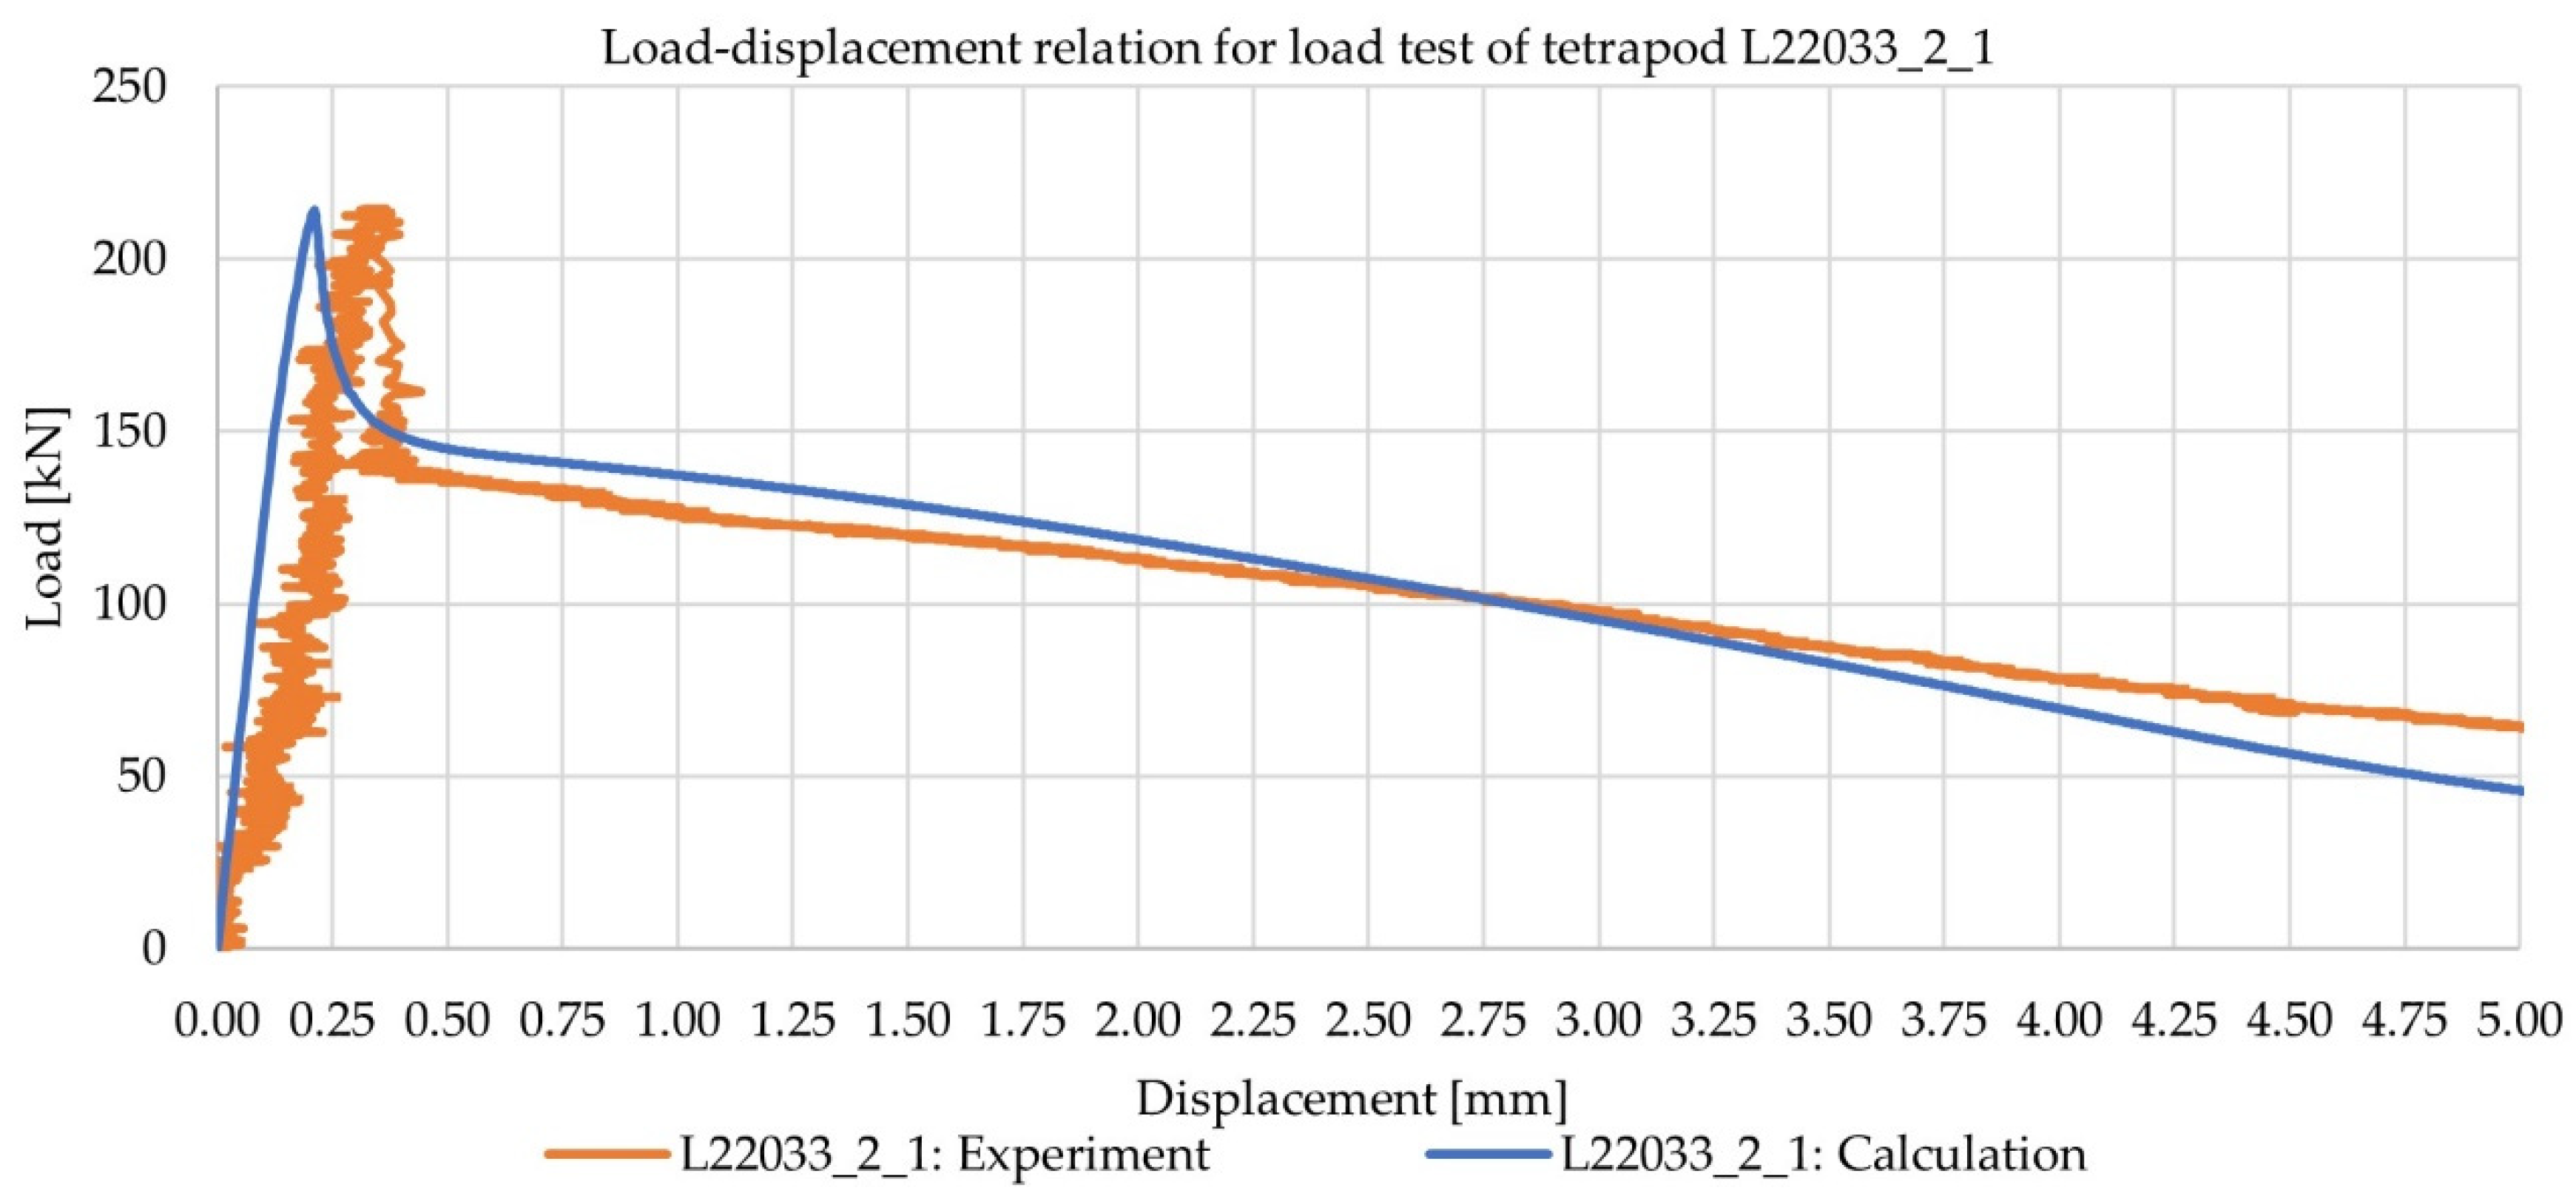
The average of the vertical displacements of the three support points was then subtracted from the measured vertical-displacement of point T1, to extract the deflection portion resulting from the flexural, shear, and axial deformations of the tetrapod legs. The comparison of the measured and calculated load-deflection response can be seen in Figure 15.
A comparison of the load-displacement relations of the tetrapod L22033_2_1 in Figure 15, shows reasonable agreement between the experimental and calculated results. The most significant difference is in the region of displacements less than or equal to the displacement corresponding to the maximum load-bearing capacity. This difference is most likely the result of considering standard material-properties of the specific concrete-strength-class as input parameters for the calculation. However, the post-maximum load-bearing-capacity deflection region (residual load-bearing region of the load-displacement behavior) shows much better agreement between the experimental and calculated results. The latter is another indication of adequate evaluation of the residual strengths of the fiber-reinforced concrete at different crack widths. In future research, the load-displacement results can be used in combination with numerical tools considering fracture and dynamic effects, such as the combined finite–discrete element method (FDEM) in the studies [34,35], where the FDEM method was applied to different structural problems.

5. Conclusions

This paper presents load tests of concrete tetrapods. Two tetrapods made of plain concrete and two fiber-reinforced-concrete tetrapods were tested in quasi-static load conditions up to complete rupture. The selected fibers were the STRUX® 75/32 synthetic-polymer fibers. Two computational procedures for calculating the load-bearing capacity of the tetrapods were presented. The simplified and detailed procedures were applied inversely, where the tensile and residual-tensile strengths were back-calculated, to match the calculated load-bearing capacity to the experimentally observed load-bearing capacity (maximum and residual). A load-displacement relationship calculation employing the calculated moment-versus-curvature relation (calculated with the detailed procedure) was also performed. The following conclusions can be drawn from the present research:
  • The tetrapods failed, due to cracks forming at similar locations, whether the concrete was fiber-reinforced or plain. The plain-concrete tetrapods failed after reaching their maximum load-bearing capacity, while the fiber-reinforced tetrapods retained some load-bearing capacity.
  • The plain concrete tetrapods failed, due to exceeded tensile-strength of plain concrete, while the fiber-reinforced concrete tetrapods failed mainly due to fiber pull-out in the critical (cracked) cross-section.
  • Concrete tetrapods with synthetic-polymer fibers had a similar (maximum) load-bearing capacity and a significantly higher residual-load-bearing capacity (load-bearing capacity at large crack-widths) compared to tetrapods made of plain concrete. The fiber-reinforced tetrapods demonstrated a higher ductility, and consequently ensure a more effective interlocking of the tetrapods, as these are most often stacked together to form a cohesive whole.
  • The comparison of the back-calculated tensile- and residual-tensile-strength values indicated the applicability of the calculation procedures presented in the article, as they give conservative results—the calculated tensile- and residual-tensile-strength values were always equal to or greater than the concrete C25/30 tensile- and residual-tensile-strength values (estimated based on data available in the literature).
  • The detailed calculation-procedure, which considered a realistic stress-distribution in the cross-section (constitutive model), is more appropriate for estimating the concrete tensile-strength from the experimentally observed maximum load-bearing capacity, compared to the simplified procedure, which considered simple linear-stress-distribution in the cross-section.
  • Regarding the residual-strength values calculated from the residual load-bearing capacities at different crack widths, both the simplified procedure (based on the rigid-plastic model with constant compressive- and tensile-stresses in the cross-section) and the detailed procedure (which considers a realistic stress-distribution in the cross-section), resulted in similar residual-strength values. The rigid-plastic model can therefore be considered for calculating the residual load-bearing capacity of fiber-reinforced-concrete elements without a loss of accuracy, compared to the detailed and more demanding calculation-procedure.
  • The calculated load-displacement relationship was reasonably comparable to the experimentally observed load-displacement relationship, which additionally demonstrated the adequacy of the presented detailed-calculation procedure for calculating the deflections of fiber-reinforced concrete tetrapods with strain-softening behavior.

Author Contributions

Conceptualization, Ž.U. and M.K.; methodology, Ž.U. and M.K.; software, Ž.U.; validation, Ž.U. and M.K.; formal analysis, Ž.U. and M.K.; investigation, Ž.U. and M.K.; resources, Ž.U. and M.K.; data curation, Ž.U. and M.K.; writing—original draft preparation, Ž.U.; writing—review and editing, Ž.U. and M.K.; visualization, Ž.U.; supervision, M.K.; project administration, Ž.U.; funding acquisition, Ž.U. All authors have read and agreed to the published version of the manuscript.

Funding

This research was funded by the Slovenian Research Agency, grant number Z2-4425.

Data Availability Statement

Data available on request.

Acknowledgments

Not applicable.

Conflicts of Interest

The authors declare no conflict of interest.

References

  1. Henszey, R.J.; Wesche, T.A.; Skinner, Q.D.; Fanning, E.J. Evaluation of the State-of-the-Art Streambank Stabilization; Wyoming Water Research Center, University of Wyoming: Laramie, WY, USA, 1989. [Google Scholar]
  2. Bakker, P.; van den Berge, A.; Hakenberg, R.; Klabbers, M.; Muttray, M.; Reedijk, B.; Rovers, I. Development of Concrete Breakwater Armour Units. In Proceedings of the 1st Coastal Estuary and Offshore Engineering Specialty Conference of the Canadian Society for Civil Engineering, Moncton, NB, Canada, 4–7 June 2003. [Google Scholar]
  3. Lim, J.H.; Won, D.; Han, T.H.; Kang, Y.-J. Evaluation of the Weak Part for Wave Dissipating Blocks under Various Conditions: Tetrapod. J. Korea Acad. -Ind. Coop. Soc. 2014, 15, 5385–5392. [Google Scholar]
  4. Azenha, M.; Sena-Cruz, J.; Camões, A.; Ferreira, R.M. Numerical Simulation of the Structural Behaviour of Concrete Tetrapods Subject to Imposed Deformations and Applied Loads. In Proceedings of the Congress on Numerical Methods in Engineering 2011, Coimbra, Portugal, 14–17 June 2011. [Google Scholar]
  5. Mitsui, J.; Yamamoto, M.; Noboru, S.; Nishiwaki, I. Impact Force Analysis on Wave Dissipating Concrete Blocks during Rocking Motion. In Proceedings of the 32nd International Conference on Coastal Engineering 2010, Shanghai, China, 30 June – 5 July 2010. [Google Scholar]
  6. Min, E.-J.; Cheon, S.-H.; Suh, K.-D. Comparison of Stability Coefficients of Radial Shape Armor Blocks Depending on Placement Methods. J. Korean Soc. Coast. Ocean. Eng. 2015, 27, 135–141. [Google Scholar] [CrossRef]
  7. Alexander, M. Marine Concrete Structures: Design, Durability and Performance; Woodhead Publishing: Sawston, UK, 2016; ISBN 0-08-100084-7. [Google Scholar]
  8. More, F.M.D.S.; Subramanian, S.S. Impact of Fibres on the Mechanical and Durable Behaviour of Fibre-Reinforced Concrete. Buildings 2022, 12, 1436. [Google Scholar] [CrossRef]
  9. Katman, H.Y.B.; Khai, W.J.; Bheel, N.; Kırgız, M.S.; Kumar, A.; Benjeddou, O. Fabrication and Characterization of Cement-Based Hybrid Concrete Containing Coir Fiber for Advancing Concrete Construction. Buildings 2022, 12, 1450. [Google Scholar] [CrossRef]
  10. Abid, S.R.; Abbass, A.A.; Murali, G.; Al-Sarray, M.L.; Nader, I.A.; Ali, S.H. Post-High-Temperature Exposure Repeated Impact Response of Steel-Fiber-Reinforced Concrete. Buildings 2022, 12, 1364. [Google Scholar] [CrossRef]
  11. Yang, D.; Wang, Z.; Zhang, Y.; Pan, W.; Wang, J.; Shi, J. Seismic Performance of the PVA Fiber Reinforced Concrete Prefabricated Hollow Circular Piers with Socket and Slot Connection. Buildings 2022, 12, 1339. [Google Scholar] [CrossRef]
  12. Hussain, H.K.; Abbas, A.M.; Ojaimi, M.F. Fiber-Type Influence on the Flexural Behavior of Rc Two-Way Slabs with an Opening. Buildings 2022, 12, 279. [Google Scholar] [CrossRef]
  13. Zhou, X.; Zheng, W.; Yan, Y. Effect of Stress–Strength Ratio and Fiber Length on Creep Property of Polypropylene Fiber-Reinforced Alkali-Activated Slag Concrete. Buildings 2022, 12, 91. [Google Scholar] [CrossRef]
  14. Hassan, R.F.; Al-Salim, N.H.; Mohammed, N.S.; Hussein, H.H. Experimental Study on Performance of Steel Fiber-Reinforced Concrete V-Shaped Columns. Buildings 2021, 11, 648. [Google Scholar] [CrossRef]
  15. Bheel, N.; Tafsirojjaman, T.; Liu, Y.; Awoyera, P.; Kumar, A.; Keerio, M.A. Experimental Study on Engineering Properties of Cement Concrete Reinforced with Nylon and Jute Fibers. Buildings 2021, 11, 454. [Google Scholar] [CrossRef]
  16. Shafei, B.; Kazemian, M.; Dopko, M.; Najimi, M. State-of-the-Art Review of Capabilities and Limitations of Polymer and Glass Fibers Used for Fiber-Reinforced Concrete. Materials 2021, 14, 409. [Google Scholar] [CrossRef] [PubMed]
  17. EN 206–1; Concrete–Part 1: Specification, Performance, Production and Conformity. European Committee for Standardization: Brussels, Belgium, 2000.
  18. EN 14889-2:2006; Fibres for Concrete Polymer Fibres. Definitions, Specifications and Conformity. European Committee for Standardization: Brussels, Belgium, 2006.
  19. STRUX® 75/32; Synthetic Macro Fibers Data Sheet. GCP: Alfalita, GA, USA, 2022.
  20. EN 1992-1-1; Eurocode 2: Design of Concrete Structures. General Rules and Rules for Buildings. European Committee for Standardization: Brussels, Belgium, 2004.
  21. BS 5975: 2008+ A1: 2011; Code of Practice for Temporary Structures Procedures and the Permissible Stress Design of Falsework. The British Standards Institution: London, UK, 2014.
  22. Cakiroglu, C.; Islam, K.; Bekdaş, G.; Kim, S.; Geem, Z.W. Interpretable Machine Learning Algorithms to Predict the Axial Capacity of FRP-Reinforced Concrete Columns. Materials 2022, 15, 2742. [Google Scholar] [CrossRef] [PubMed]
  23. International Federation for Structural Concrete. fib Model Code for Concrete Structures 2010; Ernst & Sohn, a Wiley brand: Hoboken, NJ, USA, 2013; ISBN 978-3-433-60421-2. [Google Scholar]
  24. EN 14651: 2005+A1: 2007; Test Method for Metallic Fibre Concrete–Measuring the Flexural Tensile Strength (Limit of Proportionality (LOP), Residual). European Committee for Standardization: Brussels, Belgium, 2007.
  25. Di Prisco, M.; Colombo, M.; Dozio, D. Fibre-reinforced Concrete in Fib Model Code 2010: Principles, Models and Test Validation. Struct. Concr. 2013, 14, 342–361. [Google Scholar] [CrossRef]
  26. GCP Applied Technologies. GCP Applied Technologies Presentation: GCP—Solutions Fibrées; GCP Applied Technologies: Alpharetta, GA, USA, 2021. [Google Scholar]
  27. ASTM C 1018-97; Standard Test Method for Flexural Toughness and First Crack Strength of Fiber Reinforced Concrete (Using Beam with Third Point Loading). American Society for Testing and Materials: West Conshohocken, PA, USA, 2001.
  28. STRUX® 90/40; Fiber Reinforcement. GCP Engineering Bulletin: Alfalita, GA, USA, 2002.
  29. Commission Chargée de Formuler des Avis Techniques (CCFAT) Document Technique d’Application Référence Avis Technique 3.3/17-938_V3/Semelles Filantes STRUX ® 90/40 et 75/32 2019.
  30. Krastev, R. Consistent Presentation of the Beam Deflection Theory Including Shear Correction. Int. Sci. J. Math. Model. 2021, 5, 120–123. [Google Scholar]
  31. de Montaignac, R.; Massicotte, B.; Charron, J.-P. Design of SFRC Structural Elements: Flexural Behaviour Prediction. Mater. Struct. 2012, 45, 623–636. [Google Scholar] [CrossRef]
  32. Soranakom, C.; Mobasher, B. Closed-Form Solutions for Flexural Response of Fiber-Reinforced Concrete Beams. J. Eng. Mech. 2007, 133, 933–941. [Google Scholar] [CrossRef]
  33. Belongie, S. “Rodrigues’ Rotation Formula.” From MathWorld—A Wolfram Web Resource, Created by Eric W. Weisstein. Available online: https://mathworld.wolfram.com/RodriguesRotationFormula.html (accessed on 14 November 2022).
  34. Munjiza, A.; Smoljanović, H.; Živaljić, N.; Mihanovic, A.; Divić, V.; Uzelac, I.; Nikolić, Ž.; Balić, I.; Trogrlić, B. Structural Applications of the Combined Finite–Discrete Element Method. Comput. Part. Mech. 2020, 7, 1029–1046. [Google Scholar] [CrossRef]
  35. Chen, X.; Wang, H.; Chan, A.H.; Agrawal, A.K. Dynamic Failure of Dry-Joint Masonry Arch Structures Modelled with the Combined Finite–Discrete Element Method. Comput. Part. Mech. 2020, 7, 1017–1028. [Google Scholar] [CrossRef]
Figure 1. Views of the tetrapod from different directions, with dimensions (in mm).
Buildings 12 02143 g001
Figure 2. Left: schematic representation of the tetrapod layout for the load test (green arrow indicates the direction of load application, blue cones indicate the supported points of the tetrapod); right: actual load on the tetrapod specimen L22033_2_2.
Buildings 12 02143 g002
Figure 3. Discrete points whose displacements were measured with ARAMIS SRX (distances shown in mm), specimen L22033_2_1.
Buildings 12 02143 g003
Figure 4. Additional inductive-displacement-sensor for measuring the crack width (specimen L22033_2_2).
Buildings 12 02143 g004
Figure 5. Load-versus-displacement curves (displacement of point T1 in the vertical direction).
Buildings 12 02143 g005
Figure 6. Load-versus-crack-width curves (changes of the distance between points T6 and T7 in the horizontal X-direction).
Buildings 12 02143 g006
Figure 7. Load-versus-crack-width curves of specimen L22033_2_2, measured as changes in the distance between points T6 and T7 in the horizontal X-direction, and with inductive displacement sensors R1 and R2.
Buildings 12 02143 g007
Figure 8. Load-versus-displacement-curves for points T1 (left), T9 (center), and T11 (right) of tetrapod L22033_2_1.
Buildings 12 02143 g008
Figure 9. Observed tetrapod crack locations (three sides of the specimen L22033_2_2).
Buildings 12 02143 g009
Figure 10. The crack surface of the specimen L22033_2_1 – fiber pull-out failure.
Buildings 12 02143 g010
Figure 11. Left: critical cross-section for static calculation (marked with red color), actual crack (marked with a blue color); right: the model for static calculation (green icons are the supports, the blue arrow is the load).
Buildings 12 02143 g011
Figure 12. Constitutive law of concrete according to [13], adapted to the load-test results of specimens L22033_2_1 and L22058_2_1 (the graphs have different scales for clarity): (a) in compression (equal for both specimens); (b) in tension for small strains < 1‰ (region of strain where both fiber-reinforced and unreinforced tetrapods demonstrate tensile strength); (c) in tension for large strains > 1‰ (region of strain where only fiber-reinforced tetrapods demonstrate tensile strength).
Buildings 12 02143 g012
Figure 13. Calculated bending-moment-versus-curvature curves for the critical cross-sections of the tetrapods (note that the results include the effect of axial forces dependent on the bending moment, according to Equations (1) and (3)).
Buildings 12 02143 g013
Figure 14. Rotation axes (dashed lines) going through the ground-contact points (G9, G11, G12) and support displacements (solid arrows) corresponding to rotations about the rotation axes (the specific-rotation-axis color is the same as the color of the corresponding support-point (T9, T11, T12) displacement).
Buildings 12 02143 g014
Figure 15. Experimental and calculated load-displacement relations for tetrapod L22033_2_1.
Buildings 12 02143 g015
Table 1. Results of load capacities and residual-load capacities.
Maximum Load CapacityResidual-Load Capacity
Test specimenFmax [kN]FFts [kN]FFtu [kN]
L22033_2_1214.2148.0128.5
L22033_2_2279.5254.9201.6
L22058_2_1200.7//
L22058_2_2229.1//
Table 2. Results of the simplified calculation of the load-bearing capacity of the tetrapods.
Maximum Load CapacityResidual-Load Capacity
Test specimen f ct [MPa]x [cm] f Ftu [MPa] f r 3 [MPa]
L22033_2_13.663.150.521.56
L22033_2_24.774.300.842.52
L22058_2_13.43///
L22058_2_23.91///
Table 3. Results of the detailed calculation of the load-bearing capacity of the tetrapods.
Maximum Load-Bearing CapacityResidual Load-Bearing Capacity
Test specimen f ct [MPa] f Fts [MPa] f r 1 [MPa] f Ftu [MPa] f r 3 [MPa]
L22033_2_11.870.641.720.461.60
L22033_2_23.681.223.290.552.48
L22058_2_11.66////
L22058_2_22.11////
Table 4. Estimated (based on the literature) residual strengths of C25/30 concrete with STRUX® 75/32 fiber dosage 4.13 kg/m3.
f r 1   [ MPa ] f r 3   [ MPa ]
Minimum values1.211.00
Average values1.421.20
Maximum values1.691.39
Table 5. Coordinates of tetrapod points (as marked in Figure 3 and Figure 14).
X-Coordinate [mm]Y-Coordinate [mm]Z-Coordinate [mm]
T1786.99971071.5262−284.3356
T91453.108797.7042−106.9244
G91408.6737−43.7168−129.8494
T11139.8844101.3237−44.7575
G11181.9554−40.0973−71.7775
T12742.999199.5139−1205.9470
G12745.3630−41.9071−1156.0019
Publisher’s Note: MDPI stays neutral with regard to jurisdictional claims in published maps and institutional affiliations.

