
Dynamics, Risk and Management Performance of Urban Real Estate Inventory in Yangtze River Delta


Abstract
:1. Introduction
1.1. Background
1.2. Literature Review
1.3. Aim and Question
2. Materials and Methods
2.1. Study Area: Yangtze River Delta (YRD)
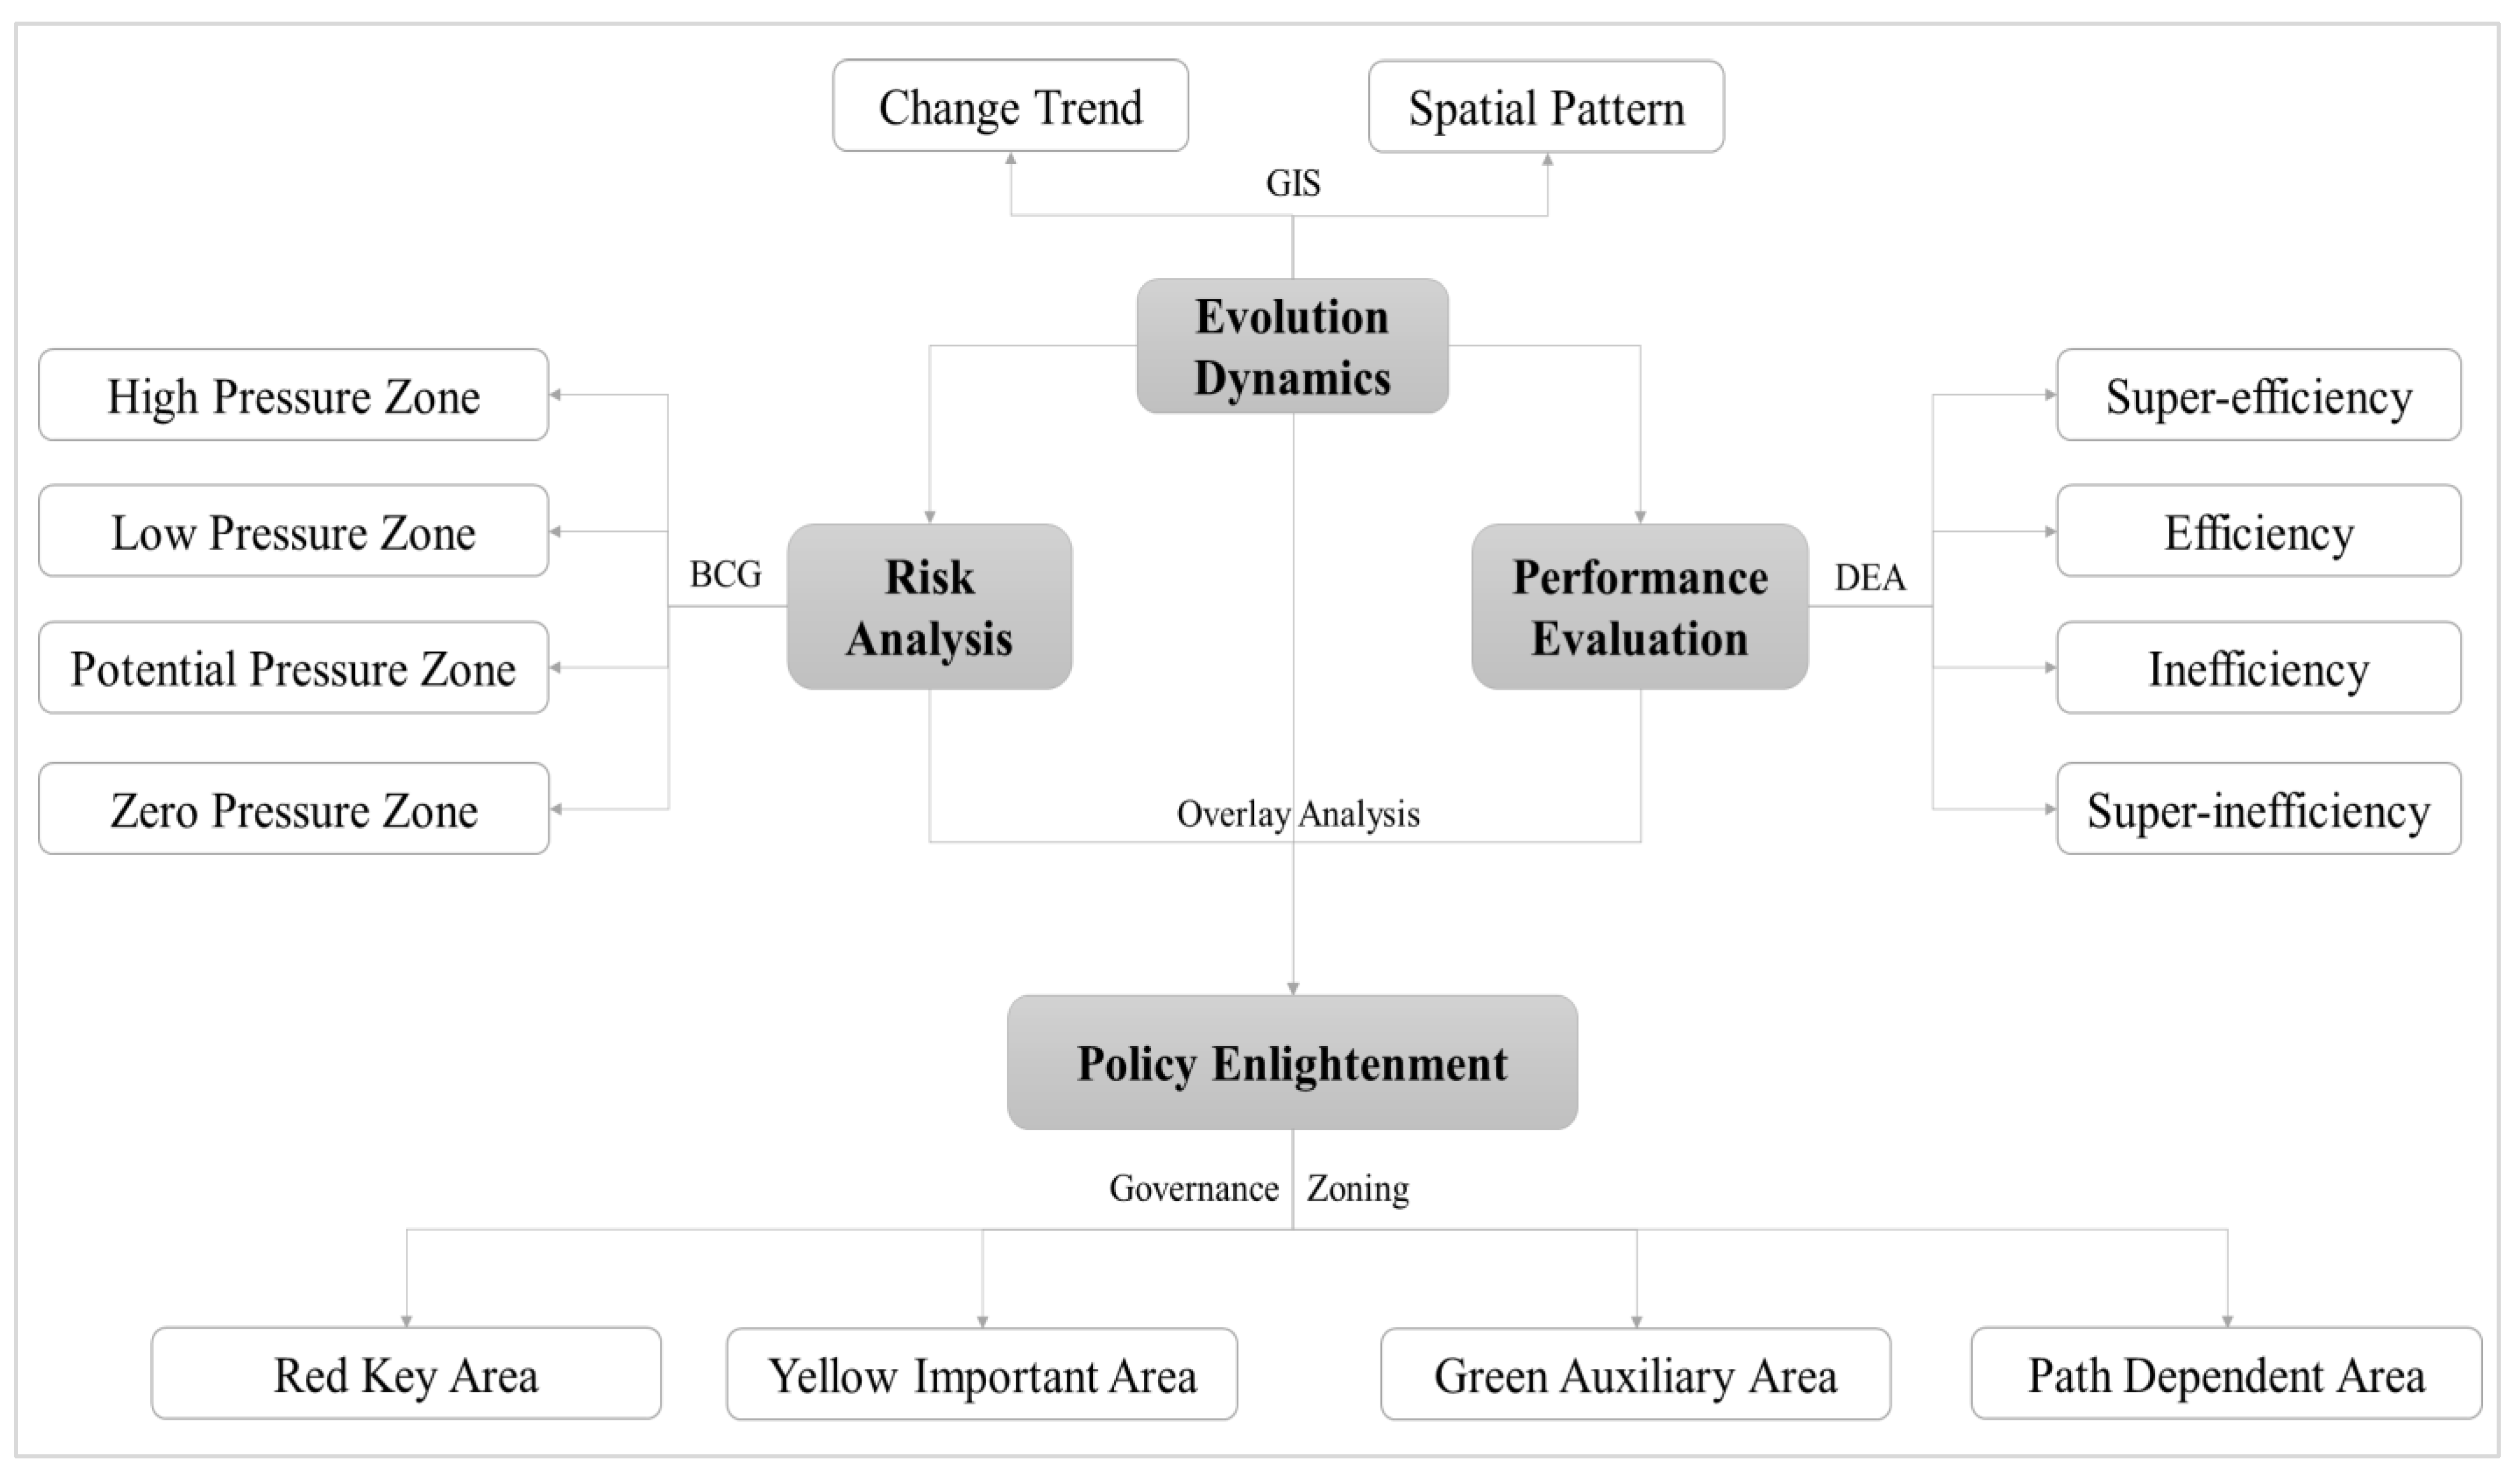
2.2. Research Methods: Decoupling Model
2.2.1. Hotspot Analysis Tool of Geographic Information System (GIS)
2.2.2. Boston Consulting Group Matrix: BCG
2.2.3. Data Envelopment Analysis Model: Super-DEA
2.3. Research Steps and Data Sources
3. Results
3.1. Evolution Dynamics
3.1.1. Change Trend
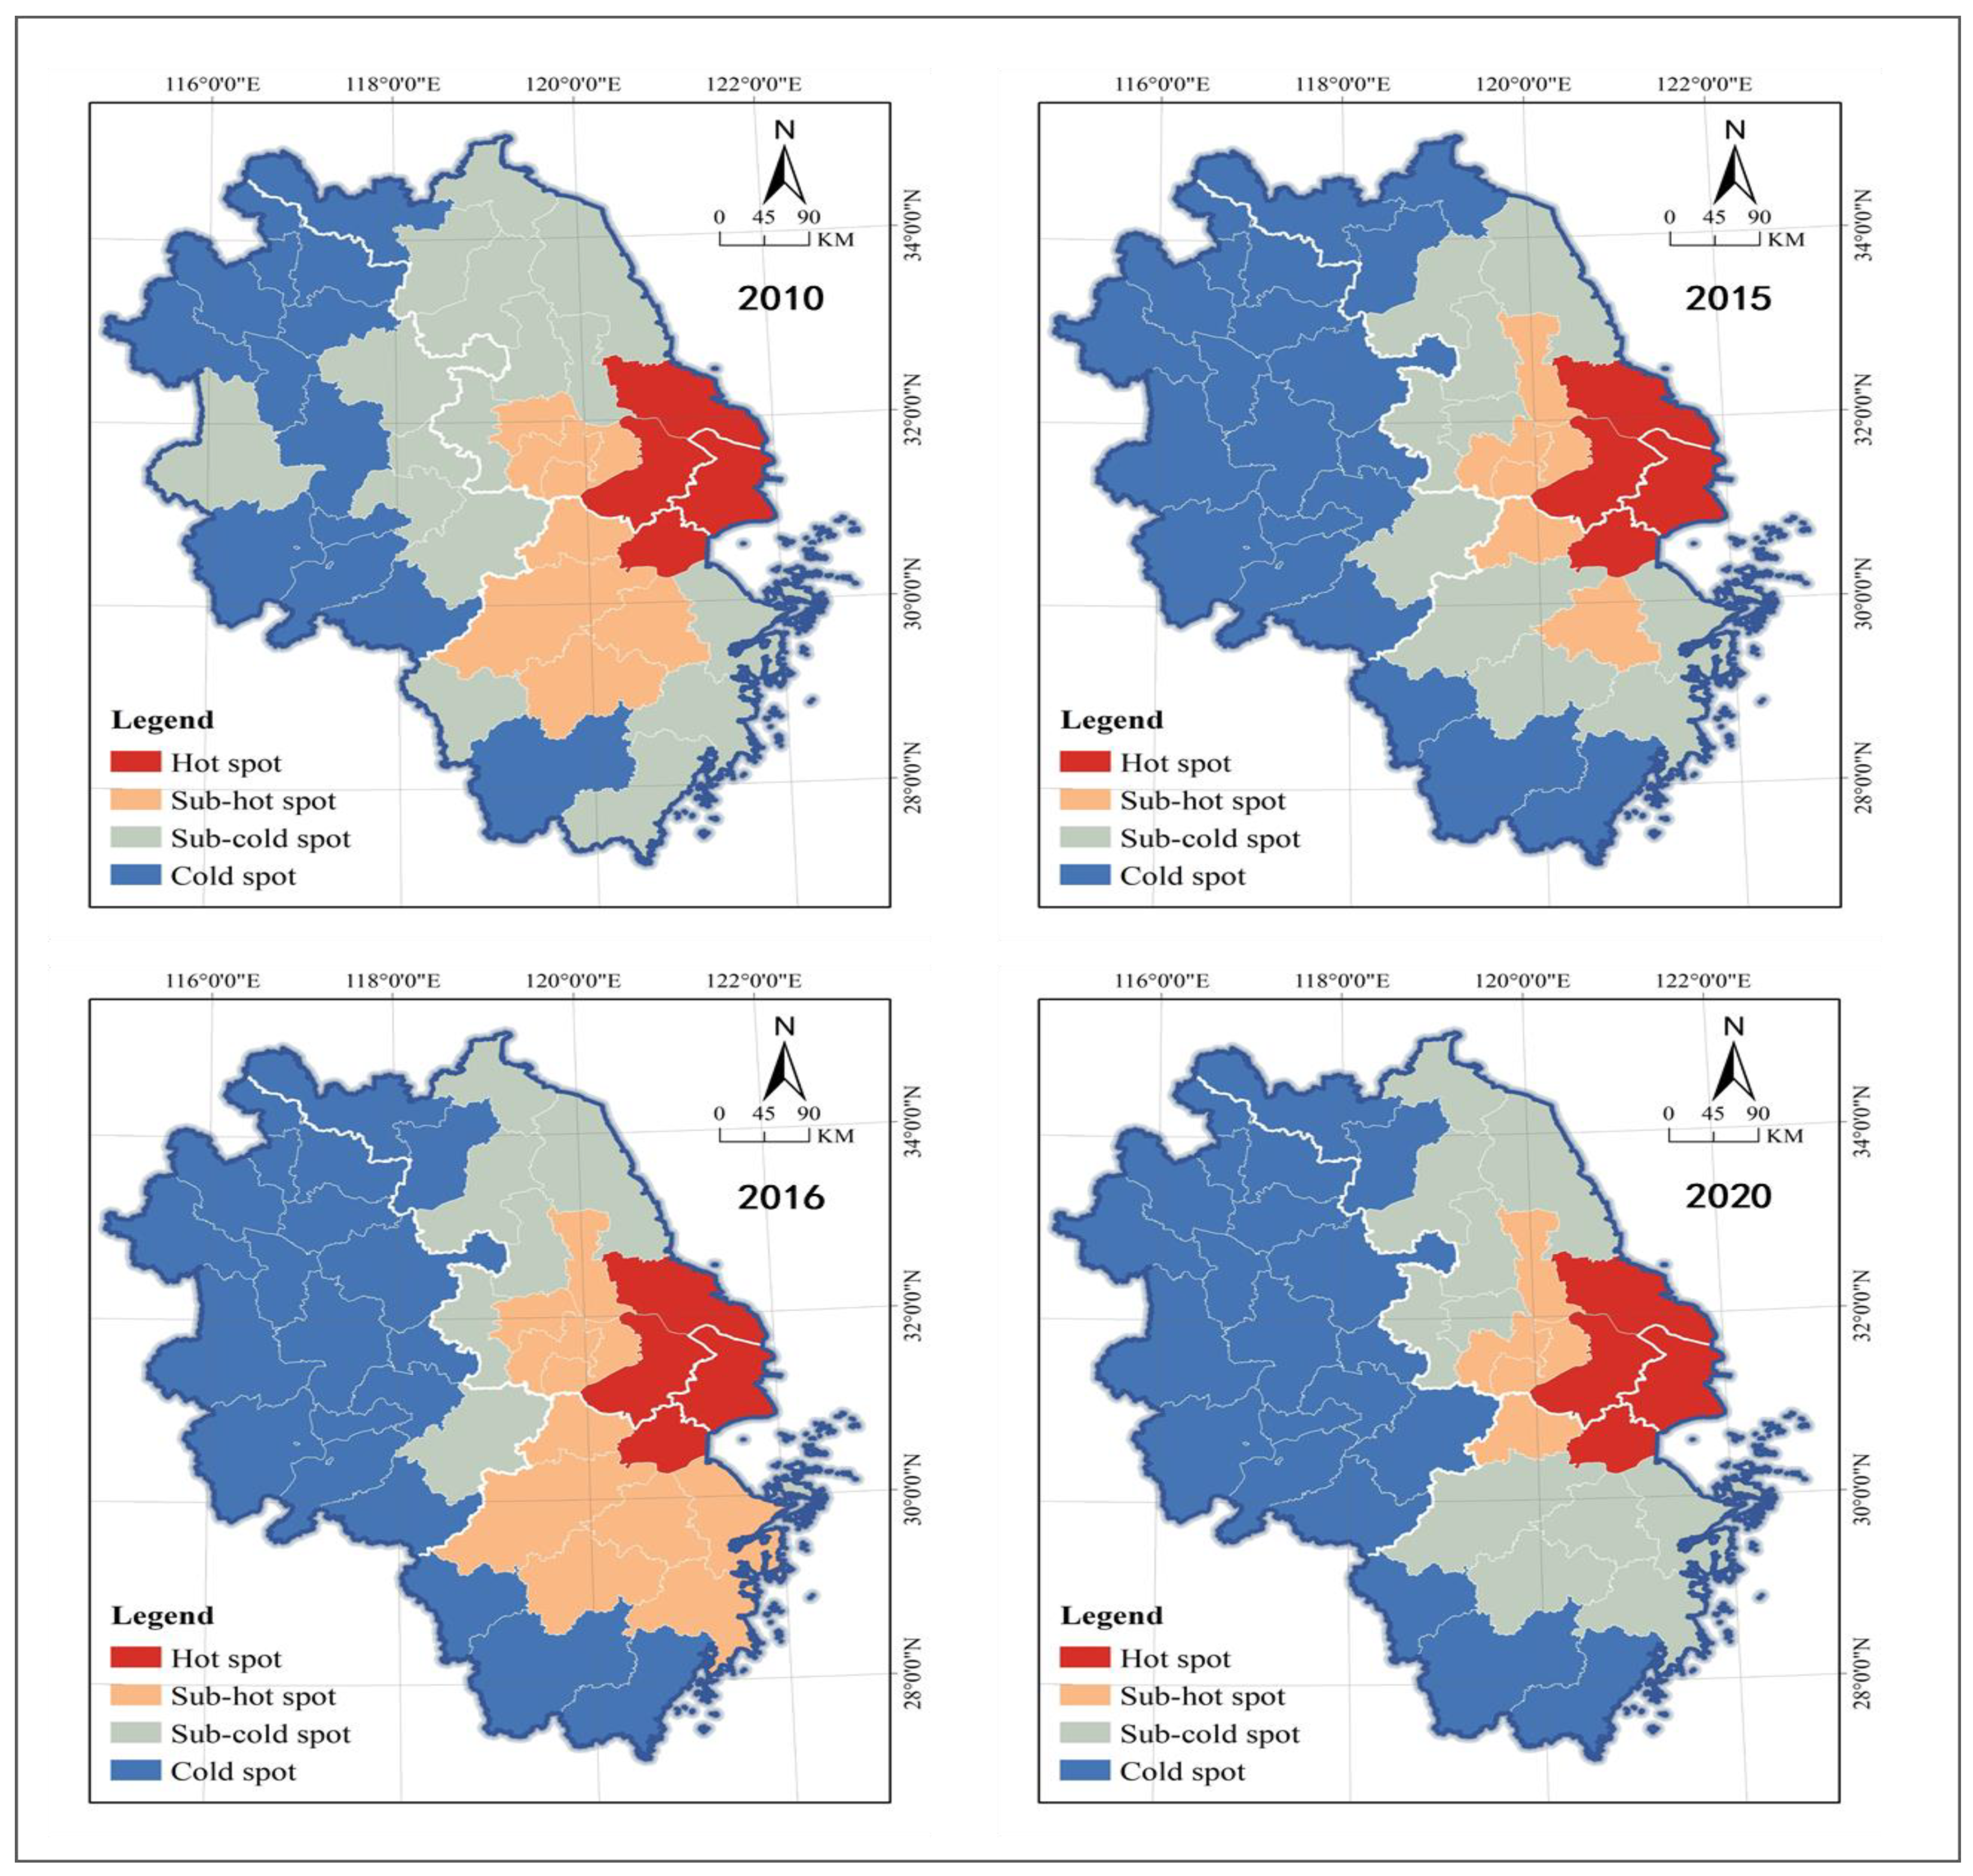
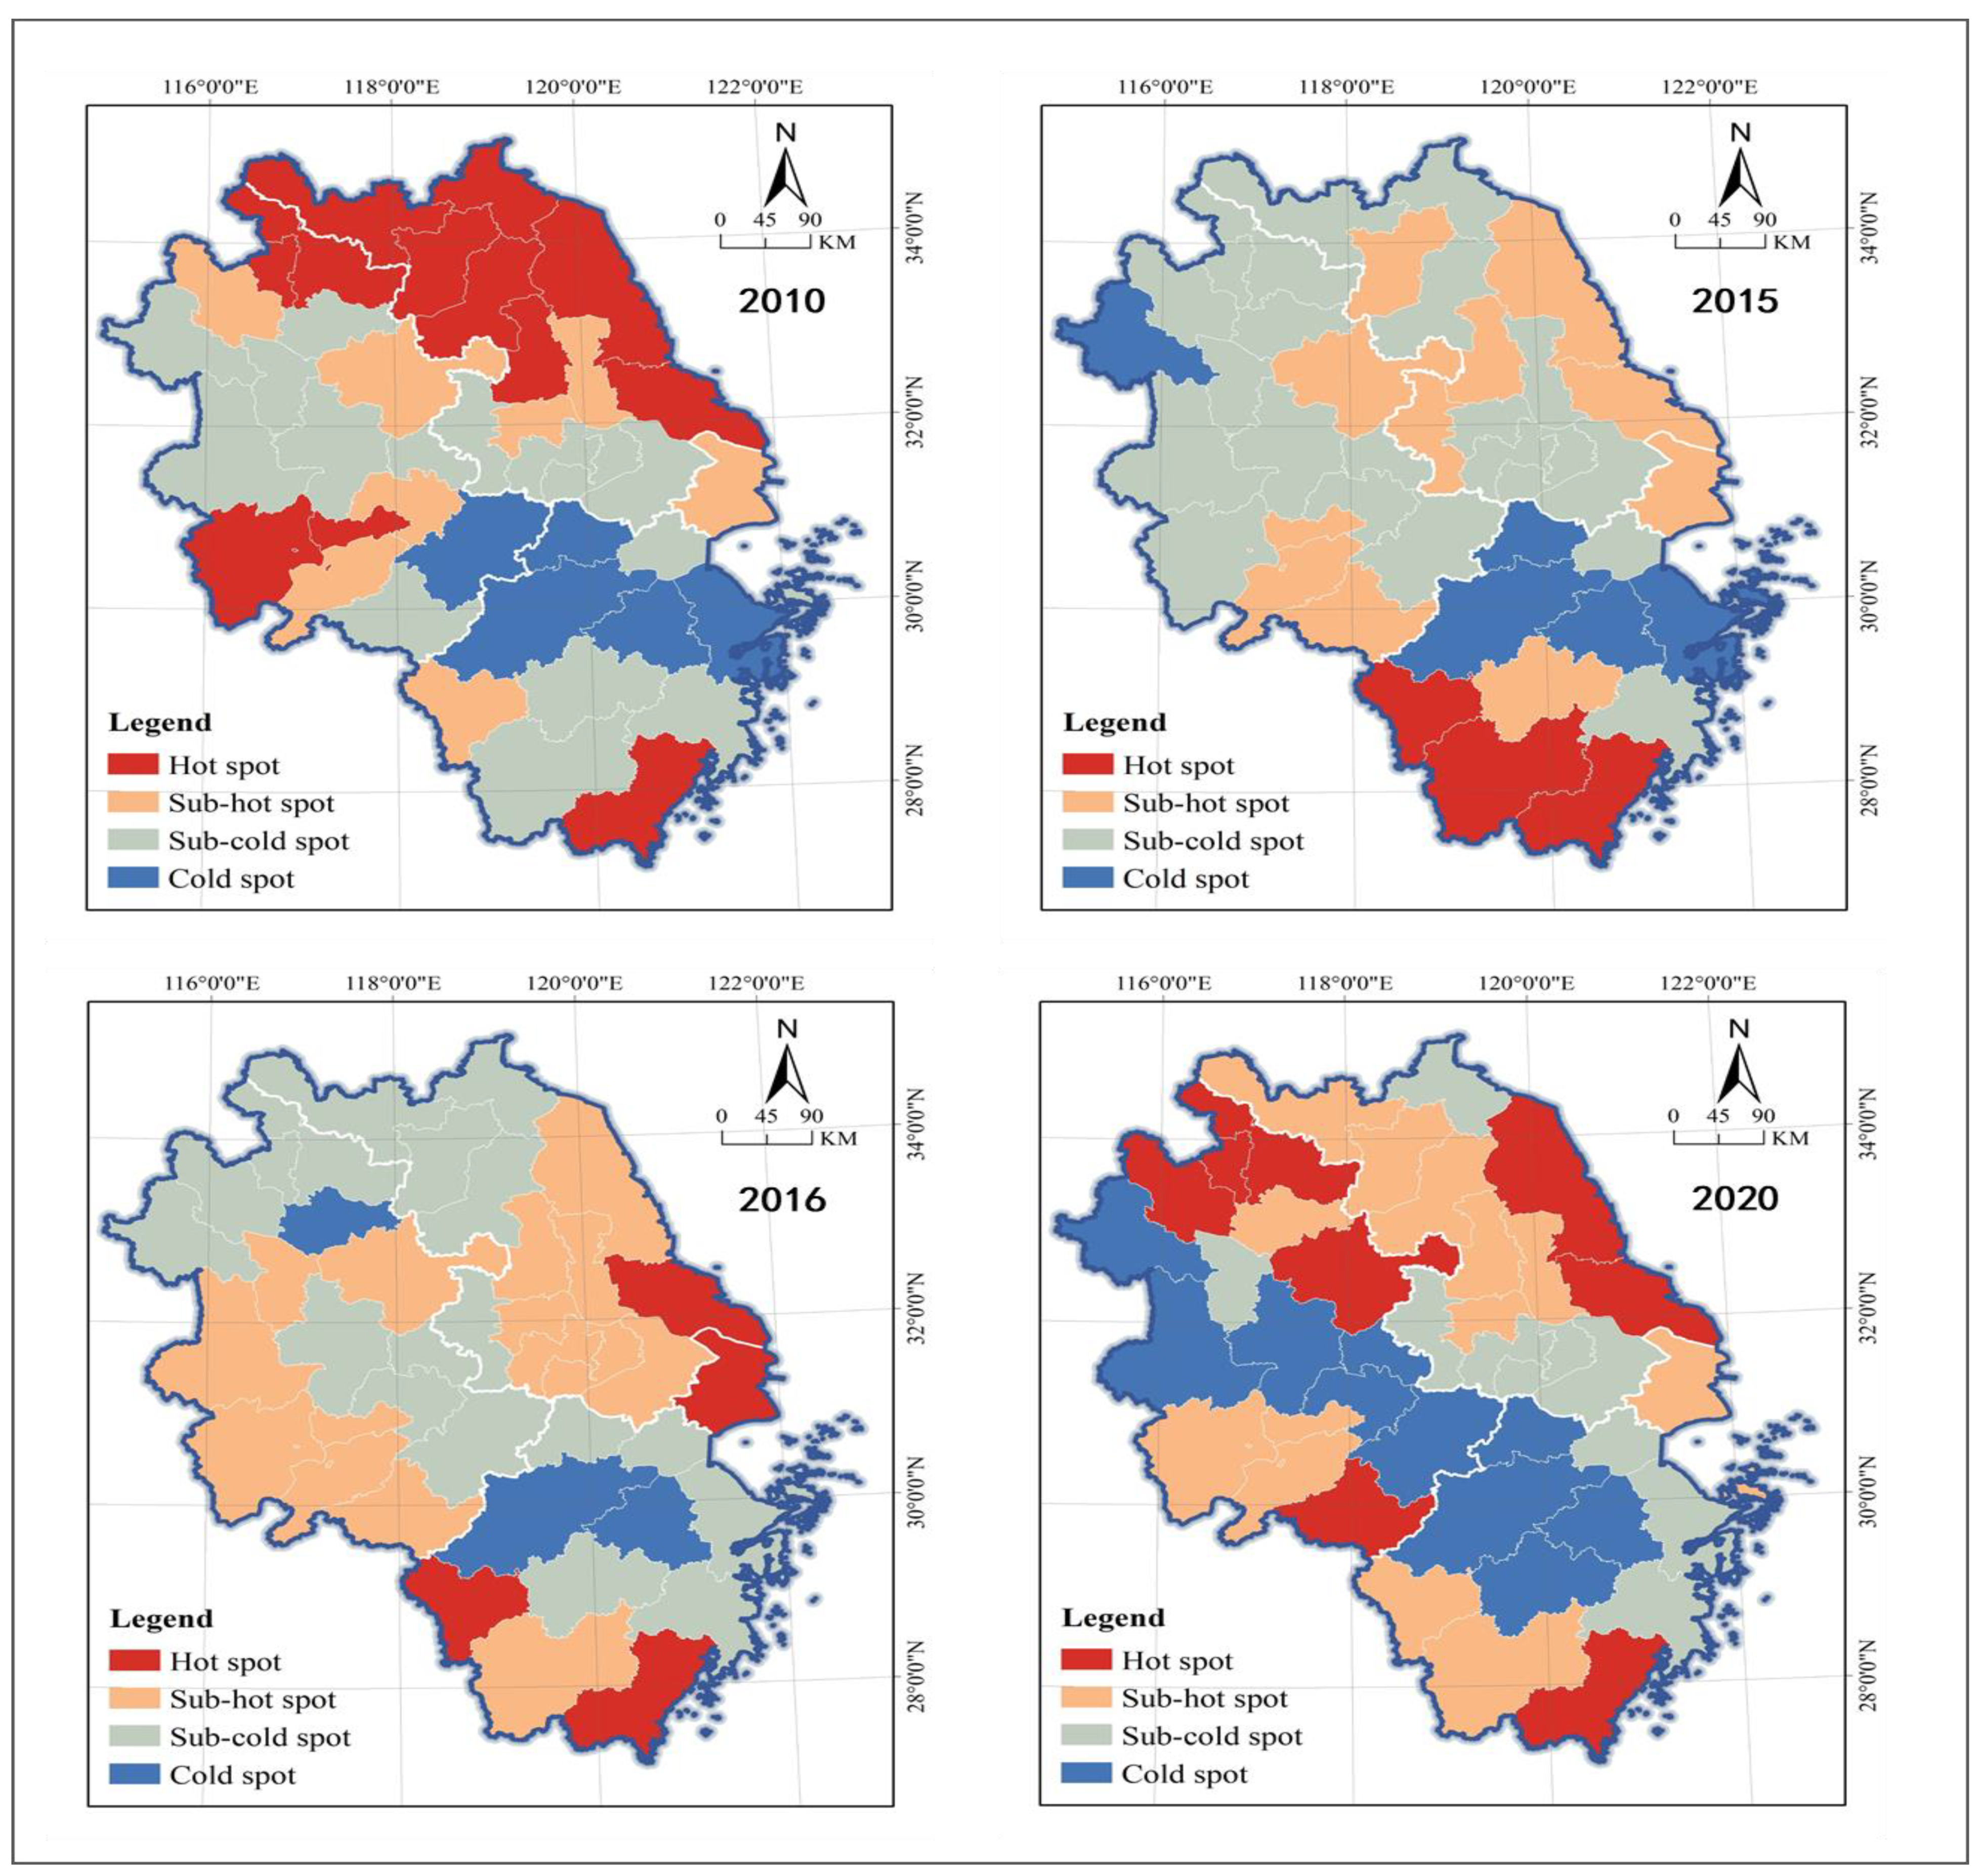
3.1.2. Spatial Pattern
3.2. Risk Evaluation
3.2.1. Risk Pattern in 2011–2015
3.2.2. Risk Pattern in 2016–2020
3.2.3. Risk Level Change
3.3. Management Performance
3.3.1. Technical Efficiency
3.3.2. Pure Technical Efficiency
3.3.3. Scale Efficiency and Scale Effect
4. Discussion
5. Conclusions
- (1)
- The geographical distribution of real estate inventories in the Yangtze River Delta shows significant spatial effects, with hotspot cities clustered in the coastal Shanghai metropolitan area and coldspot cities in the inland region. From the analysis of real estate inventory trend, speed, quantity and spatial pattern, the policy of “destocking” has achieved some results, and the real estate inventory trajectory of most cities in the Yangtze River Delta are in an “inverted U-shape”, changing from the early positive growth at a high speed to the recent negative growth. It should be noted that real estate inventories in the Yangtze River Delta have long remained positive, with Bozhou and Tongling growing even by more than 100% and only Nanjing and Maanshan seeing slight negative growth, therefore, city governments and real estate companies are still facing greater pressure and challenges in inventory management.
- (2)
- The inter-city differentiation and spatial agglomeration of real estate inventory risks are becoming more significant, and the proportion of cities with higher, lower or unchanged risk levels is basically the same. There is a small number of cities in the high-pressure zone, which were early clustered in the coastal region of Jiangsu in a band, but they are currently clustered in Shanghai and southern Jiangsu. Cities in the low-pressure zone are clustered in the Hangzhou Bay region, and the geographical coverage has shrunk significantly. The potential pressure zone covers an increasing area, with the geographical distribution changing from zonal agglomeration to finger-like agglomeration. There are few cities in the zero-pressure zone, and they are scattered in distribution. It is of note that Changzhou and Yancheng have been in the high-risk zone for a long time, while Shanghai, Wuxi, Suzhou-JS, Zhenjiang, and Hefei have changed from low-risk to high-risk areas, requiring the government to optimize the “destocking” policy and continue to promote the management of the high real estate inventory.
- (3)
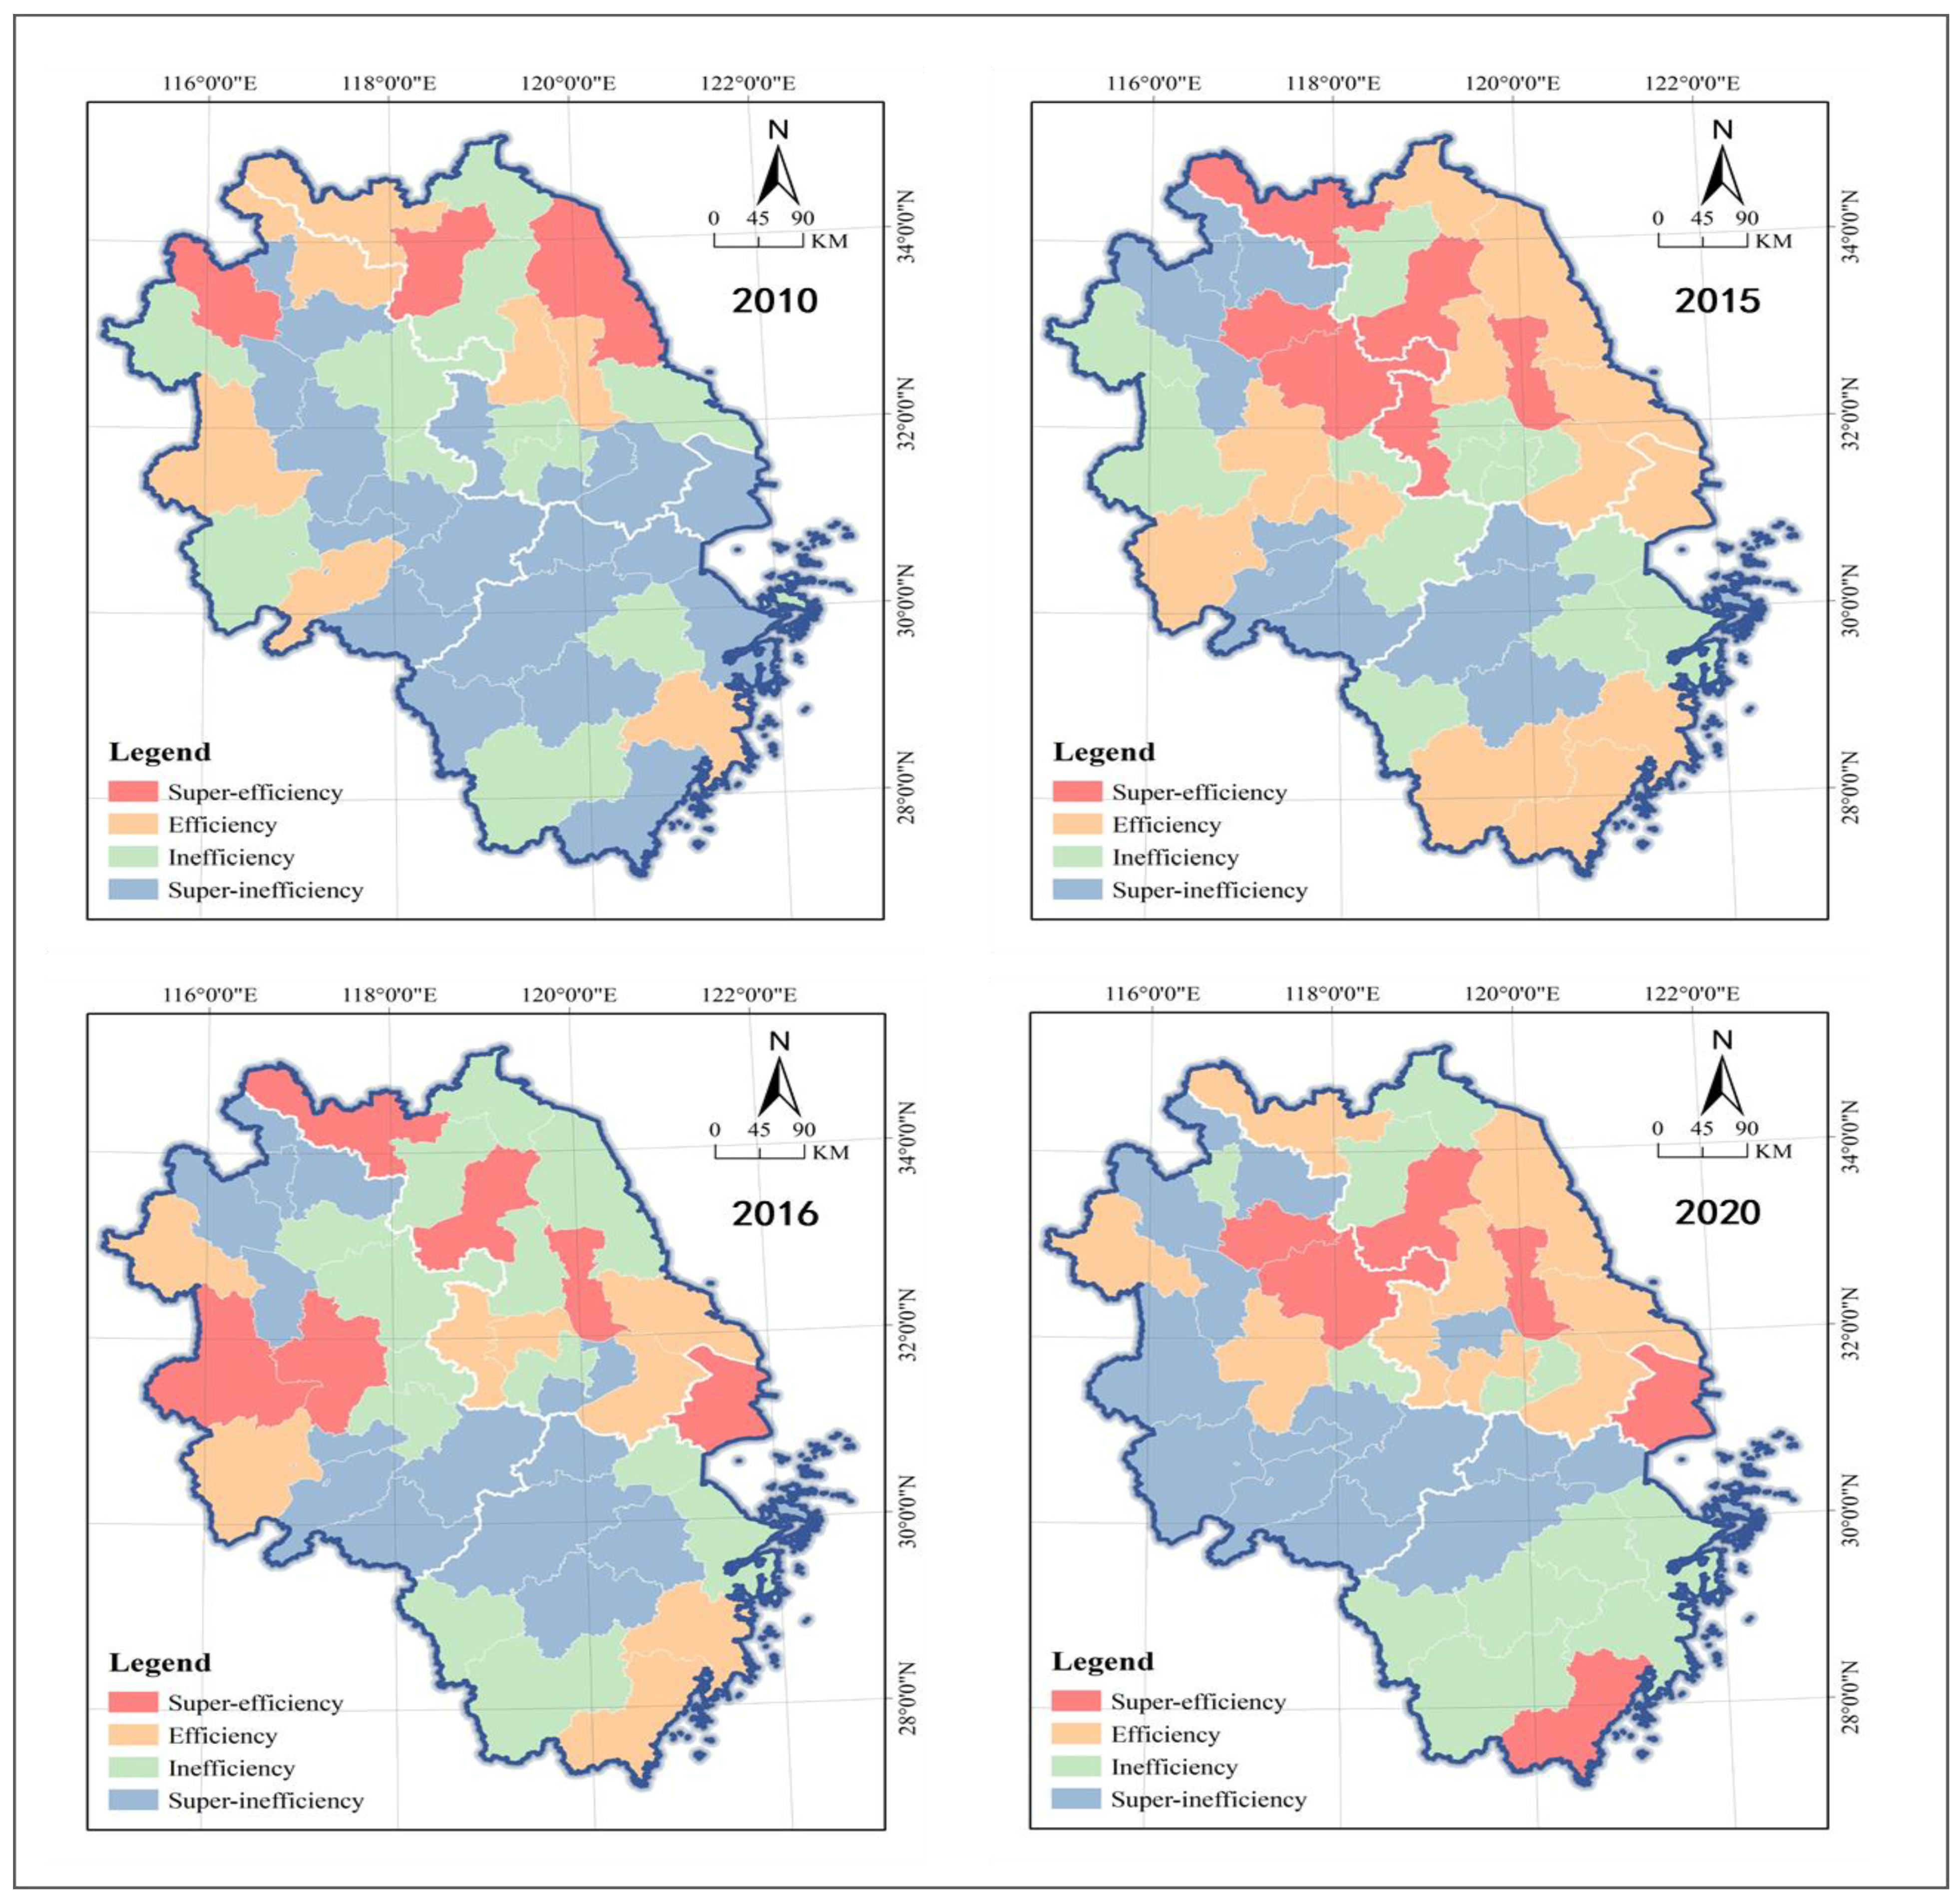
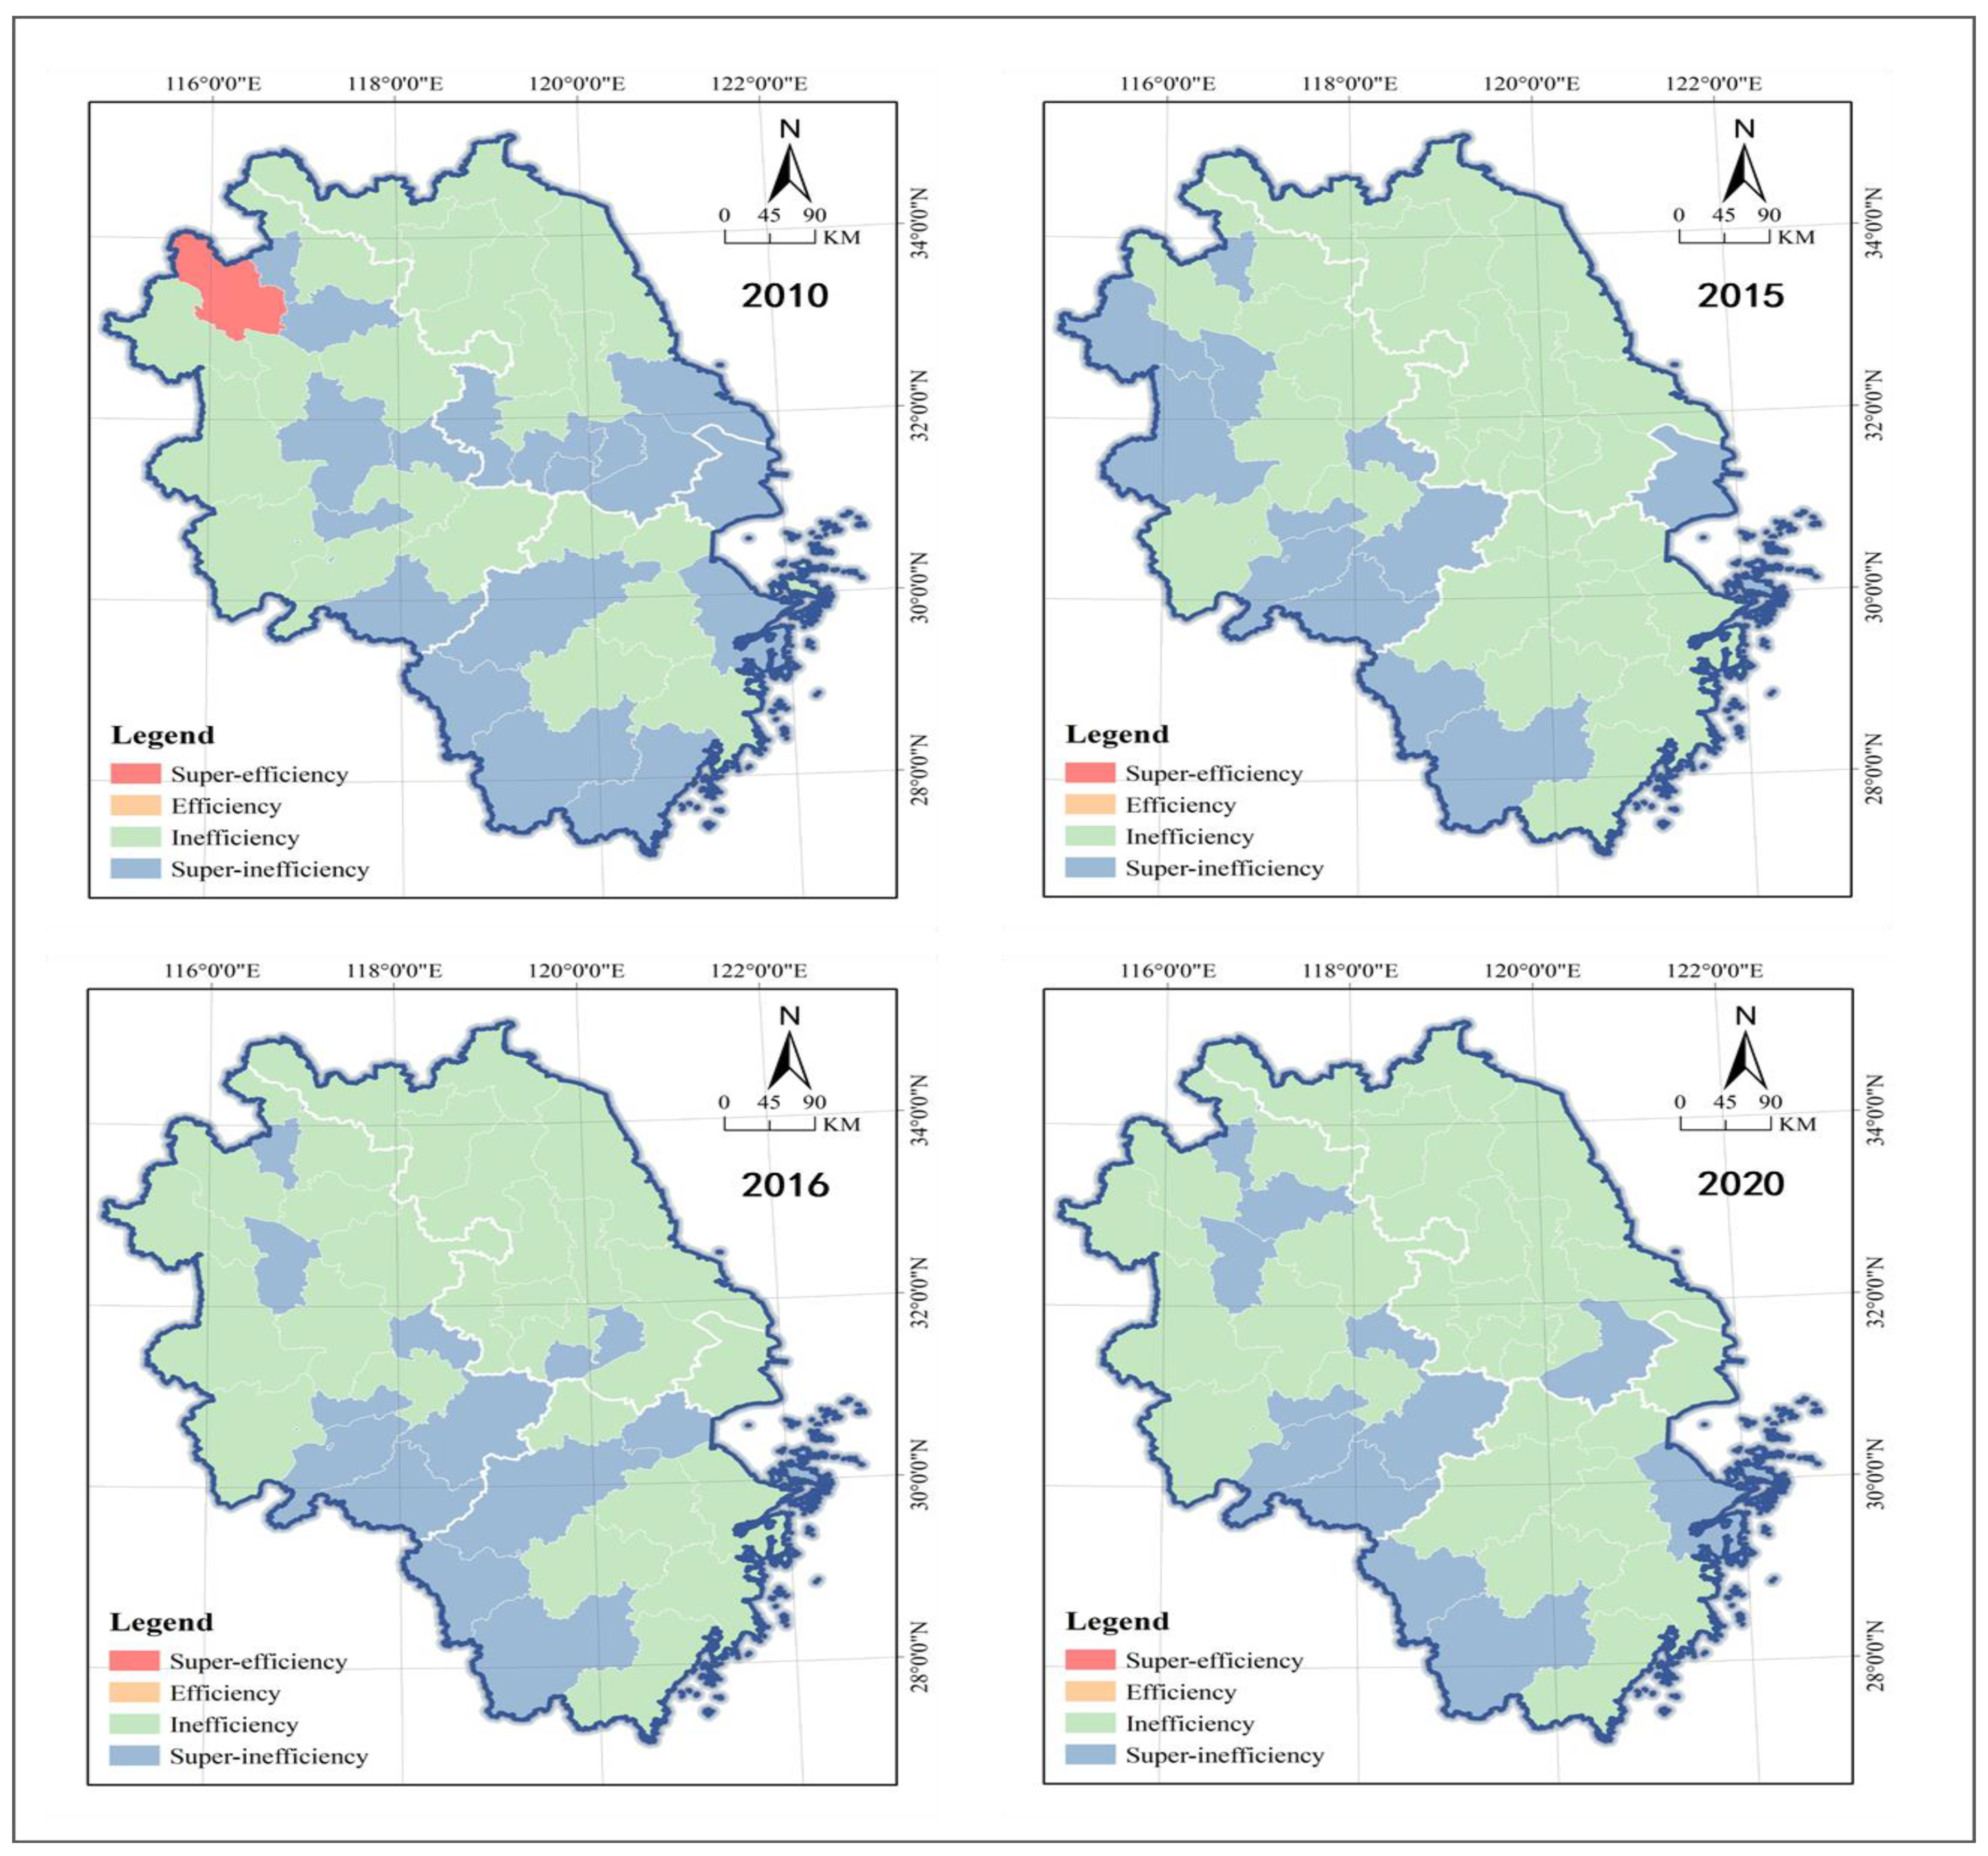
- The performance of real estate inventory management is unsatisfactory, and the cities in an effective state have remained stable at 30–40% despite a steady rise in the average efficiency index. For technical efficiency, pure technical efficiency, and scale efficiency, the geographical distribution of cold and hot cities shows a “center-periphery” spatial pattern. The 41 cities in the study area can be divided into four types of super-efficiency, efficiency, inefficiency, and super-inefficiency, and scale effects appear as long-term—increasing returns to scale, increasing re-turns to scale, return to scale from increasing to decreasing, decreasing returns to scale, and long-term—decreasing returns to scale.
- (4)
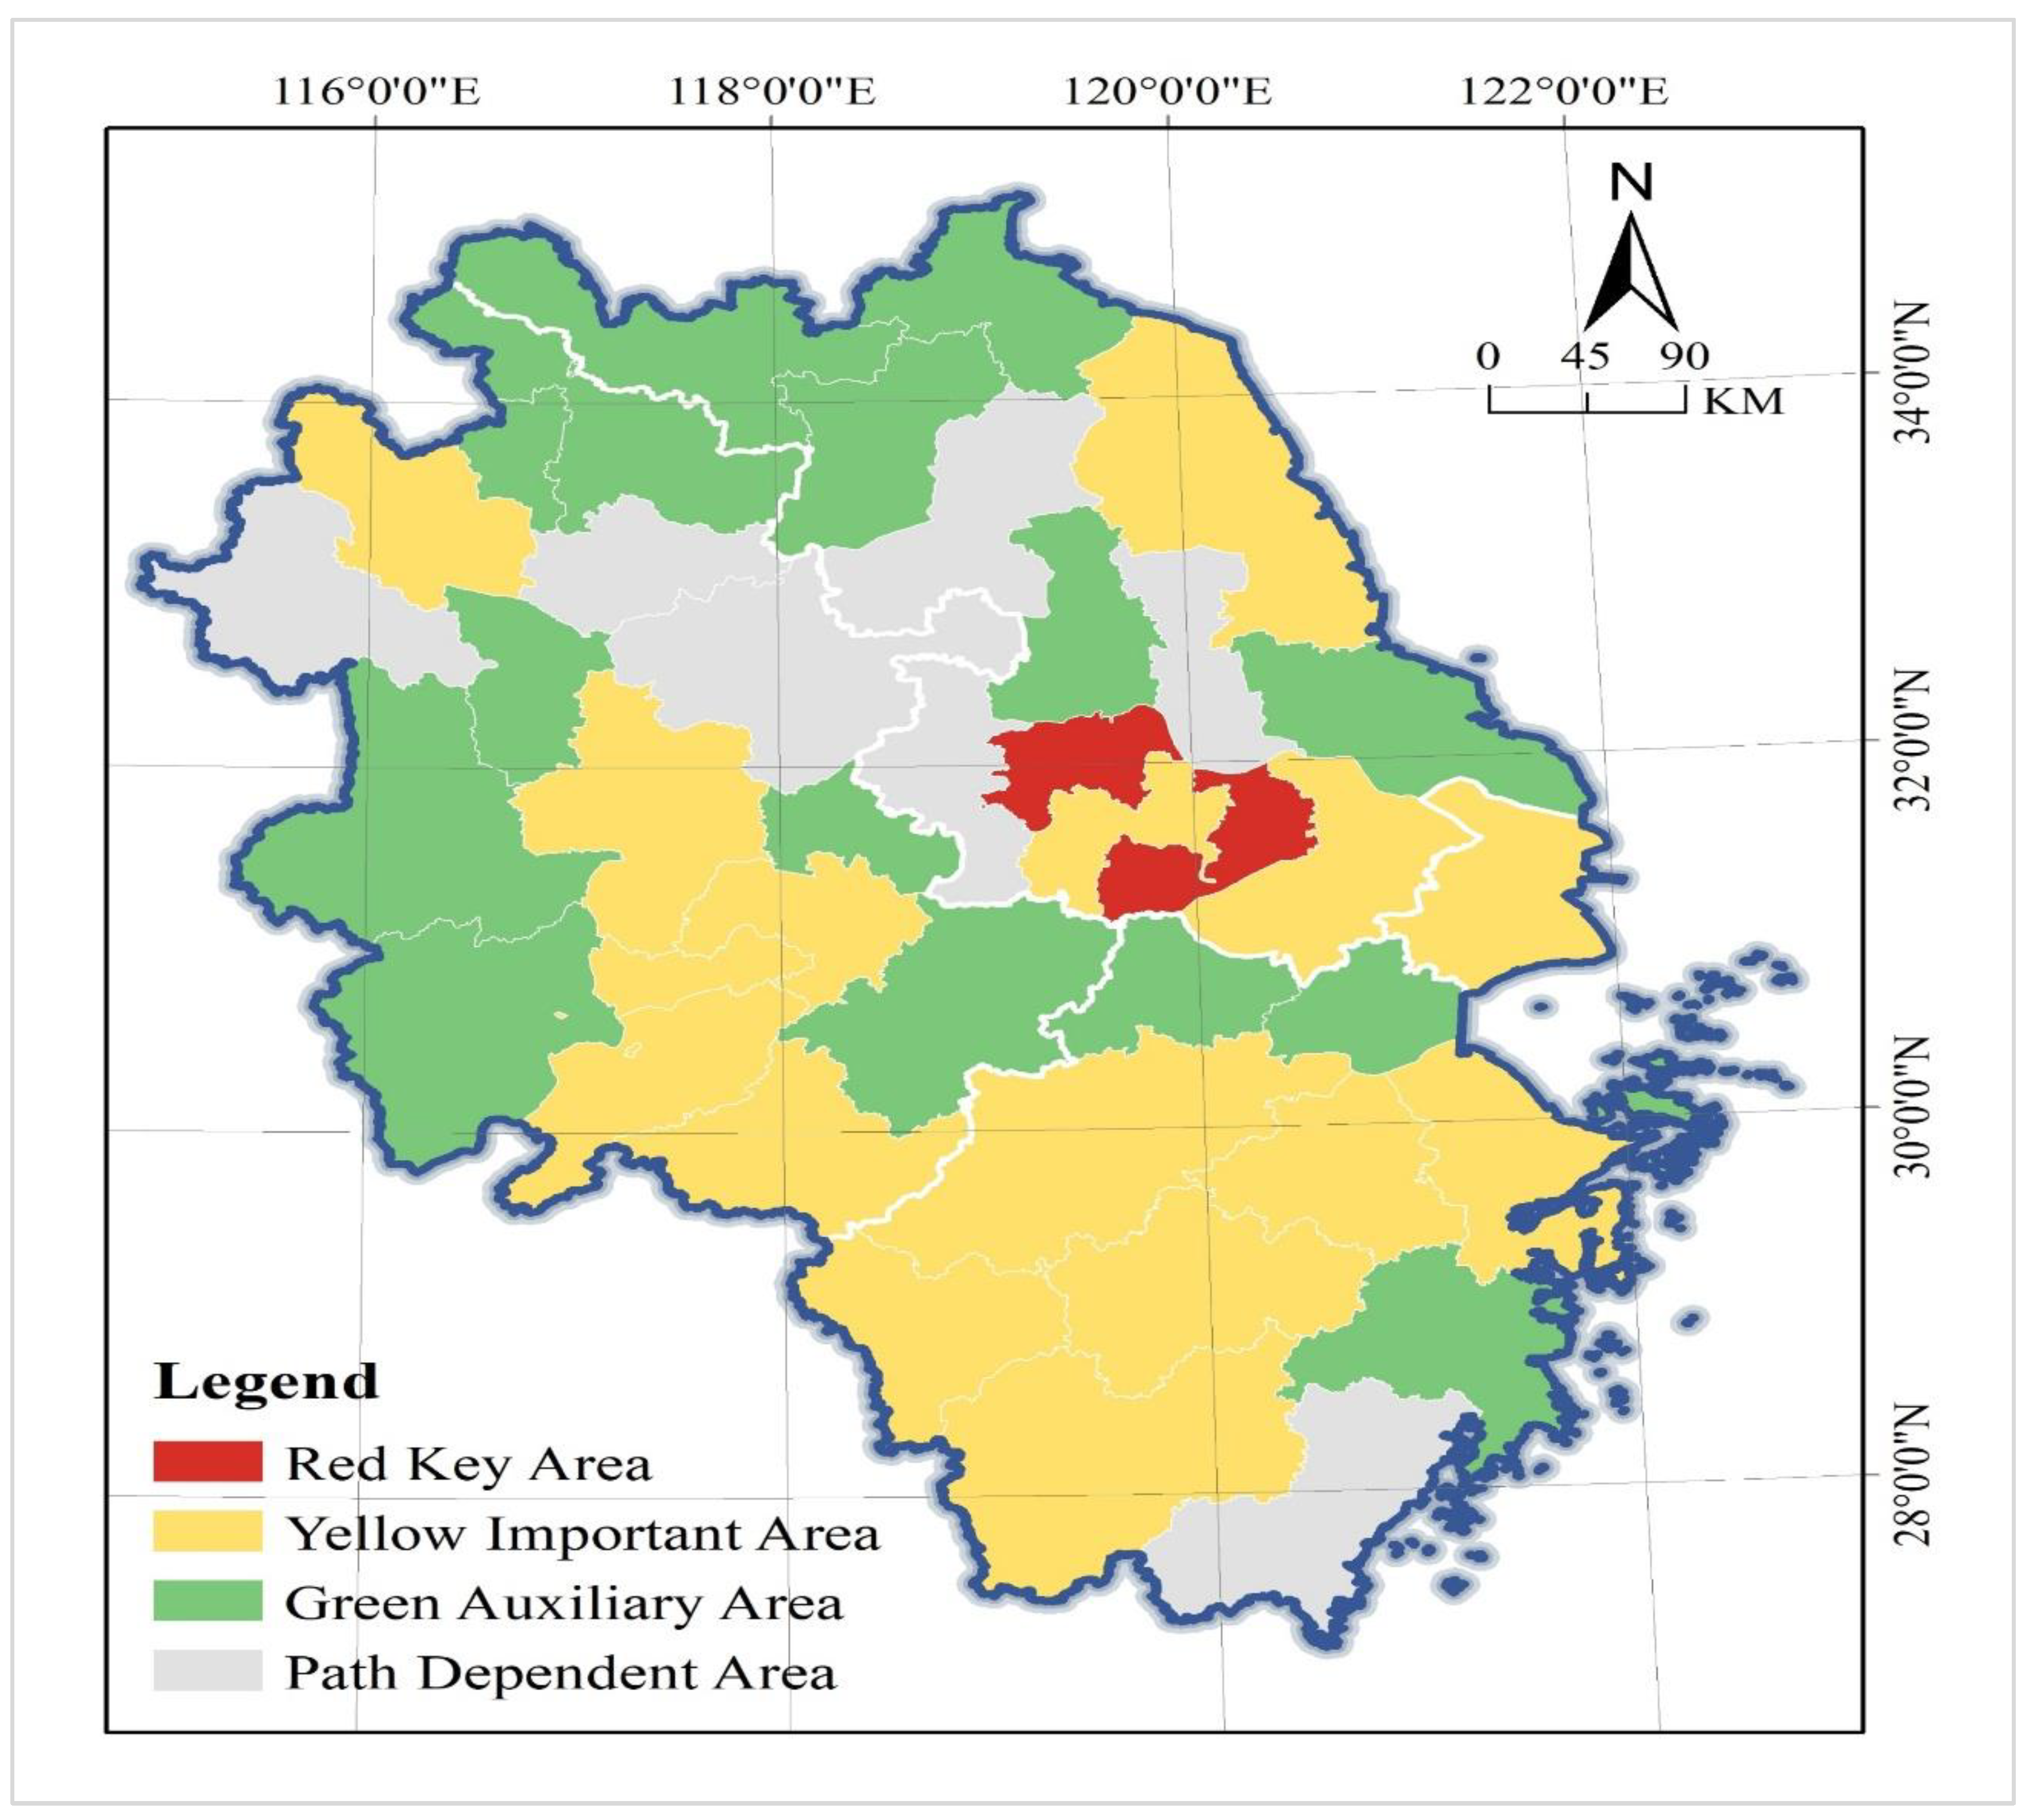
- Overlaying the results of real estate inventory dynamics, risk and performance evaluation, this paper divides the real estate inventory management in the Yangtze River Delta into four types of policy areas, and about 80% of cities are in red key and yellow important areas. Wuxi and Zhenjiang are in the red key area, and they should reduce risk while improving efficiency in the future policy design. Forty percent of the cities are in a yellow important area, and in the future, they should selectively design and implement policies to reduce risks or improve efficiency in accordance with their actual conditions. Forty percent of the cities are in green auxiliary areas, and they should focus on preventing increased risk and reduced efficiency in the future policy design. The rest of the cities are in path-dependent areas, and they should focus on maintaining the status quo in the future policy design. All cities should adhere to goal-oriented real estate inventory management and take advanced cities as a benchmark for development in the future. In particular, cities in a red key area and the yellow important area should control the redundancy of factors to further reduce risks and improve performance.
Author Contributions
Funding
Data Availability Statement
Acknowledgments
Conflicts of Interest
References
- Jakimowicz, A.; Kulesza, S. The Mechanism of Transformation of Global Business Cycles into Dynamics of Regional Real Estate Markets. Acta Phys. Pol. A 2018, 133, 1351–1361. [Google Scholar] [CrossRef]
- Zhao, S.; Zhao, K.; Zhang, P. Spatial Inequality in China’s Housing Market and the Driving Mechanism. Land 2021, 10, 841. [Google Scholar] [CrossRef]
- Song, J.S.; van Houtum, G.J.; Van Mieghem, J.A. Capacity and Inventory Management: Review, Trends, and Projections. MSOM-Manuf. Serv. Oper. Manag. 2020, 22, 36–46. [Google Scholar] [CrossRef]
- Gutierrez, V.; Vidal, C.J. Inventory management models in supply chains: A literature review. Rev. Fac. Ing.-Univ. Antioq. 2008, 43, 134–149. [Google Scholar]
- Seg, M. The impact of taxing vacancy on housing markets: Evidence from France. J. Public Econ. 2020, 185, 104079. [Google Scholar] [CrossRef]
- Monkkonen, P. Empty houses across North America: Housing finance and Mexico’s vacancy crisis. Urban Stud. 2019, 56, 2075–2091. [Google Scholar] [CrossRef]
- Jang, H.; Song, Y.; Sohn, S.; Ahn, K. Real Estate Soars and Financial Crises: Recent Stories. Sustainability 2018, 10, 4559. [Google Scholar] [CrossRef] [Green Version]
- Emmi, P.C.; Magnusson, L. The Predictive Accuracy of Residential Vacancy Chain Models. Urban Stud. 1994, 31, 1117–1131. [Google Scholar] [CrossRef]
- Emmi, P.C.; Magnusson, L. Further Evidence on the Accuracy of Residential Vacancy Chain Models. Urban Stud. 1995, 32, 1361–1367. [Google Scholar] [CrossRef]
- Ben-Shahar, D.; Sulganik, E. Vacancy chains and the degree of mobility in the housing market. Ann. Reg. Sci. 2011, 47, 569–583. [Google Scholar] [CrossRef]
- Ferrari, E. Conceptualising Social Housing within the Wider Housing Market: A Vacancy Chain Model. Hous. Stud. 2011, 26, 95–116. [Google Scholar] [CrossRef]
- Miceli, T.J.; Sirmans, C.F. Efficiency rents: A new theory of the natural vacancy rate for rental housing. J. Hous. Econ. 2013, 22, 20–24. [Google Scholar] [CrossRef] [Green Version]
- Vandell, K.D. Tax structure and natural vacancy rates in the commercial real estate market. Real Estate Econ. 2003, 31, 245–267. [Google Scholar] [CrossRef]
- Shen, X.Y.; Huang, X.J.; Li, H.; Li, Y.; Zhao, X.F. Exploring the relationship between urban land supply and housing stock: Evidence from 35 cities in China. Habitat Int. 2018, 78, 80–89. [Google Scholar] [CrossRef]
- Gabriel, S.A.; Nothaft, F.E. Rental housing markets, the incidence and duration of vacancy, and the natural vacancy rate. J. Urban Econ. 2001, 49, 121–149. [Google Scholar] [CrossRef] [Green Version]
- Wang, H.Y. Stickiness of rental rate and housing vacancy rate. Econ. Lett. 2020, 195, 109487. [Google Scholar] [CrossRef]
- Tse, R.Y.C.; MacGregor, B.D. Housing vacancy and rental adjustment: Evidence from Hong Kong. Urban Stud. 1999, 36, 1769–1782. [Google Scholar] [CrossRef]
- Whitaker, S.; Fitzpatrick, T.J. Deconstructing distressed-property spillovers: The effects of vacant, tax-delinquent, and foreclosed properties in housing submarkets. J. Hous. Econ. 2013, 22, 79–91. [Google Scholar] [CrossRef]
- Boessen, A.; Chamberlain, A.W. Neighborhood crime, the housing crisis, and geographic space: Disentangling the consequences of foreclosure and vacancy. J. Urban Aff. 2017, 39, 1122–1137. [Google Scholar] [CrossRef]
- Jones, R.W.; Pridemore, W.A. A Longitudinal Study of the Impact of Home Vacancy on Robbery and Burglary Rates During the US Housing Crisis, 2005–2009. Crime Delinq. 2016, 62, 1159–1179. [Google Scholar] [CrossRef]
- Chen, X.J.; Rafail, P. Do Housing Vacancies Induce More Crime? A Spatiotemporal Regression Analysis. Crime Delinq. 2020, 66, 1579–1605. [Google Scholar] [CrossRef]
- McClure, K. The allocation of rental assistance resources: The paradox of high housing costs and high vacancy rates. Int. J. Hous. Policy 2019, 19, 69–94. [Google Scholar] [CrossRef]
- Vakili-Zad, C.; Hoekstra, J. High dwelling vacancy rate and high prices of housing in Malta a mediterranean phenomenon. J. Hous. Built Environ. 2011, 26, 441–455. [Google Scholar] [CrossRef] [Green Version]
- Wang, L.Y.; Fan, H.; Wang, Y.K. An estimation of housing vacancy rate using NPP-VIIRS night-time light data and OpenStreetMap data. Int. J. Remote Sens. 2019, 40, 8566–8588. [Google Scholar] [CrossRef]
- Pan, J.H.; Dong, L.L. Spatial Identification of Housing Vacancy in China. Chin. Geogr. Sci. 2021, 31, 359–375. [Google Scholar] [CrossRef]
- Li, J.; Guo, M.; Lo, K. Estimating Housing Vacancy Rates in Rural China Using Power Consumption Data. Sustainability 2019, 11, 5722. [Google Scholar] [CrossRef] [Green Version]
- Deilmann, C.; Effenberger, K.H.; Banse, J. Housing stock shrinkage: Vacancy and demolition trends in Germany. Build. Res. Inf. 2009, 37, 660–668. [Google Scholar] [CrossRef]
- Wang, K.; Immergluck, D. Housing vacancy and urban growth: Explaining changes in long-term vacancy after the US foreclosure crisis. J. Hous. Built Environ. 2019, 34, 511–532. [Google Scholar] [CrossRef]
- Deng, C.B.; Ma, J.J. Viewing urban decay from the sky: A multi-scale analysis of residential vacancy in a shrinking US city. Landsc. Urban Plan. 2015, 141, 88–99. [Google Scholar] [CrossRef]
- Radzimski, A. View Web of Science ResearcherID and ORCID (provided by Clarivate). Cities 2016, 50, 197–205. [Google Scholar] [CrossRef]
- Geman, H.; Tunaru, R. Commercial Real-Estate Inventory and Theory of Storage. J. Futures Mark. 2013, 33, 675–694. [Google Scholar] [CrossRef]
- Caplin, A.; Leahy, J. Trading Frictions and House Price Dynamics. J. Money Credit. Bank. 2011, 43, 283–303. [Google Scholar] [CrossRef] [Green Version]
- Kwoun, M.J.; Lee, S.H.; Kim, J.H. Dynamic cycles of unsold new housing stocks, investment in housing, and housing supply-demand. Math. Comput. Model. 2013, 57, 2094–2105. [Google Scholar] [CrossRef]
- Morales, M.; Moraga, G.; Kirchheim, A.P.; Passuello, A. Regionalized inventory data in LCA of public housing: A comparison between two conventional typologies in southern Brazil. J. Clean. Prod. 2019, 238, 117869. [Google Scholar] [CrossRef]
- Jiang, Y.X.; Zheng, L.Y.; Wang, J.Z. Research on external financial risk measurement of China real estate. Int. J. Financ. Econ. 2020, 26, 5472–5484. [Google Scholar] [CrossRef]
- Muczynski, A. Financial flow models in municipal housing stock management in Poland. Land Use Policy 2020, 91, 104429. [Google Scholar] [CrossRef]
- Olaya, Y.; Vasquez, F.; Muller, D.B. Dwelling stock dynamics for addressing housing deficit. Resour. Conserv. Recycl. 2017, 123, 187–199. [Google Scholar] [CrossRef]
- Immergluck, D. Examining Changes in Long-Term Neighborhood Housing Vacancy During the 2011 to 2014 US National Recovery. J. Urban Aff. 2016, 38, 607–622. [Google Scholar] [CrossRef]
- Wen, X.Q.; Xu, C.; Hu, Q.Y. Dynamic capacity management with uncertain demand and dynamic price. Int. J. Prod. Econ. 2016, 175, 121–131. [Google Scholar] [CrossRef]
- Pham, T.H.V.; Nguyen, M.H.V. Impact of Inventory Size, Staging, and Financing Policies on Sales Growth of Real Estate Companies in Vietnam. Journal of Global Economy. Bus. Financ. 2021, 3. [Google Scholar] [CrossRef]
- Yoo, H.; Yoon, H. The Effect of Green Characteristics in Reducing the Inventory of Unsold Housing in New Residential Developments-A Case of Gyeonggi Province, in South Korea. Land 2021, 10, 377. [Google Scholar] [CrossRef]
- Nam, J.; Han, J.; Lee, C. Factors Contributing to Residential Vacancy and Some Approaches to Management in Gyeonggi Province, Korea. Sustainability 2016, 8, 367. [Google Scholar] [CrossRef] [Green Version]
- Lins, M.P.E.; Novaes, L.F.D.; Legey, L.F.L. Real estate appraisal: A double perspective data envelopment analysis approach. Ann. Oper. Res. 2005, 138, 79–96. [Google Scholar] [CrossRef]
- Liu, X.X.; Song, Y.Y.; Liu, H.H.; Yang, G.L. Regional efficiency of the real estate industry in 35 large and medium-sized cities in China: A meta-frontier SBM approach. Post-Communist Econ. 2021, 34, 376–408. [Google Scholar] [CrossRef]
- Chen, Y.; Cai, Y.; Zheng, C.L. Efficiency of Chinese Real Estate Market Based on Complexity-Entropy Binary Causal Plane Method. Complexity 2020, 2020, 2791352. [Google Scholar] [CrossRef] [Green Version]
- Chen, Q.S.; Kamran, S.M.; Fan, H.Z. Real estate investment and energy efficiency: Evidence from China’s policy experiment. J. Clean. Prod. 2019, 217, 440–447. [Google Scholar] [CrossRef]
- Yang, Z.; Fang, H. Research on Green Productivity of Chinese Real Estate Companies-Based on SBM-DEA and TOBIT Models. Sustainability 2020, 12, 3122. [Google Scholar] [CrossRef] [Green Version]
- Zheng, X.; Chau, K.W.; Hui, E.C.M. Efficiency Assessment of Listed Real Estate Companies: An Empirical Study of China. Int. J. Strateg. Prop. Manag. 2011, 15, 91–104. [Google Scholar] [CrossRef] [Green Version]
- Nguyen, N.T.; Le, V.A.B.; Tran, T.T. Vietnamese real estate corporations’ performance using the hybrid model of data envelopment analysis and grey system theory. Neural Comput. Appl. 2021, 33, 17209–17222. [Google Scholar] [CrossRef]
- Wang, C.N.; Hsu, H.P.; Wang, J.W.; Kao, Y.C.; Nguyen, T.P. Strategic Alliance for Vietnam Domestic Real Estate Companies Using a Hybrid Approach Combining GM (1,1) with Super SBM DEA. Sustainability 2020, 12, 1891. [Google Scholar] [CrossRef] [Green Version]
- Luo, H.; Islam, A.M.; Wang, R. Financing Constraints and Investment Efficiency in Canadian Real Estate and Construction Firms: A Stochastic Frontier Analysis. Sage Open 2021, 11, 21582440211031502. [Google Scholar] [CrossRef]
- Atta Mills, E.F.E.; Baafi, M.A.; Liu, F.B.; Zeng, K.L. Dynamic operating efficiency and its determining factors of listed real-estate companies in China: A hierarchical slack-based DEA-OLS approach. Int. J. Financ. Econ. 2020, 26, 3352–3376. [Google Scholar] [CrossRef]
- Rahman, H.U.; Zahid, M.; Muhammad, A. Connecting integrated management system with corporate sustainability and firm performance: From the Malaysian real estate and construction industry perspective. Environ. Dev. Sustain. 2021, 24, 2387–2411. [Google Scholar] [CrossRef]
- Fauth, R.; Schwarz, J.; Bullesbach, J. Development of a procedure to assess the sustainability of existing buildings—Sustainability in real estate asset management and property management. Bautechnik 2016, 93, 366–370. [Google Scholar] [CrossRef]
- Marona, B.; van den Beemt-Tjeerdsma, A. Impact of Public Management Approaches on Municipal Real Estate Management in Poland and The Netherlands. Sustainability 2018, 10, 4291. [Google Scholar] [CrossRef] [Green Version]
- Ahmad, I.; Alqarni, M.A.; Almazroi, A.A.; Alam, L. Real Estate Management via a Decentralized Blockchain Platform. CMC-Comput. Mater. Contin. 2021, 66, 1813–1822. [Google Scholar] [CrossRef]
- Guarini, M.R.; Battisti, F.; Chiovitti, A. A Methodology for the Selection of Multi-Criteria Decision Analysis Methods in Real Estate and Land Management Processes. Sustainability 2018, 10, 507. [Google Scholar] [CrossRef] [Green Version]
- Lewis, D.; Springer, T.M.; Anderson, R.I. The cost efficiency of real estate investment trusts: An analysis with a Bayesian stochastic frontier model. J. Real Estate Financ. Econ. 2003, 26, 65–80. [Google Scholar] [CrossRef]
- Darrat, A.F.; Glascock, J.L. On the Real-Estate Market-Efficiency. J. Real Estate Financ. Econ. 1993, 7, 55–72. [Google Scholar] [CrossRef]
- Ferrera, J.M.C.; Chaparro, F.P.; Jimenez, J.S. Efficiency assessment of real estate cadastral offices using DEA. Int. Rev. Adm. Sci. 2012, 77, 802–824. [Google Scholar] [CrossRef]
- Klumbyte, E.; Apanaviciene, R. Real Estate Strategic Management Model for Lithuanian Municipalities. Int. J. Strateg. Prop. Manag. 2014, 18, 279–291. [Google Scholar] [CrossRef]
- Liow, K.H.; Song, J.; Lau, J.C.J. Investment Dynamics of Singapore Stock and Real Estate Markets. Singap. Econ. Rev. 2022, 2022, 1–30. [Google Scholar] [CrossRef]
- Wu, Z.H.; Chen, H.J. The Influence of E-Marketing on Performance of Real Estate Enterprises: Based on Super-Efficiency DEA and Grey Entropy Methods. Math. Probl. Eng. 2021, 2021, 7502676. [Google Scholar] [CrossRef]
- Lewis, D.; Anderson, R. Residential real estate brokerage efficiency and the implications of franchising: A Bayesian approach. Real Estate Econ. 1999, 27, 543–560. [Google Scholar] [CrossRef]
- Yilmaz, M.K.; Kusakci, A.O.; Tatoglu, E.; Icten, O.; Yetgin, F. Performance Evaluation of Real Estate Investment Trusts using a Hybridized Interval Type-2 Fuzzy AHP-DEA Approach: The Case of Borsa Istanbul. Int. J. Inf. Technol. Decis. Mak. 2019, 18, 1785–1820. [Google Scholar] [CrossRef]
- Almudhaf, F.; Hansz, A.J. Random Walks and Market Efficiency: Evidence from Real Estate Investment Trusts (Reit) Subsectors. Int. J. Strateg. Prop. Manag. 2018, 22, 81–92. [Google Scholar] [CrossRef] [Green Version]
- Lee, C.L.; Stevenson, S.; Cho, H.Y.B. Listed real estate futures trading, market efficiency, and direct real estate linkages: International evidence. J. Int. Money Financ. 2022, 127, 102693. [Google Scholar] [CrossRef]
- Wang, L.Y.; Hu, H.Q.; Wang, X.Z.; Zhang, X.C.; Wu, Y.B. Synergistic evolution of resilience and efficiency in the real estate industry: Evidence from 35 large and medium-sized cities in China. Appl. Econ. Lett. 2022, 2022, 1–9. [Google Scholar] [CrossRef]
- Zhao, S.; Zhao, K.; Yan, Y.; Zhu, K.; Guan, C. Spatio-Temporal Evolution Characteristics and Influencing Factors of Urban Service-Industry Land in China. Land 2022, 11, 13. [Google Scholar] [CrossRef]
- Wang, B.; Zhao, J.; Hu, X.F. Analysison trade-offs and synergistic relationships among multiple ecosystem services in the Shiyang River Basin. Acta Ecol. Sin. 2018, 38, 7582–7595. [Google Scholar] [CrossRef]
- Zhao, S.; Zhang, P.; Li, W. A Study on Evaluation of Influencing Factors for Sustainable Development of Smart Construction Enterprises: Case Study from China. Buildings 2021, 11, 221. [Google Scholar] [CrossRef]
- Chen, H.; Zhao, S.; Zhang, P.; Zhou, Y.; Li, K. Dynamics, and Driving Mechanism of Real Estate in China’s Small Cities: A Case Study of Gansu Province. Buildings 2022, 12, 1512. [Google Scholar] [CrossRef]
- Zhou, Y.; Zhao, K.; Han, J.; Zhao, S.; Cao, J. Geographical Pattern Evolution of Health Resources in China: Spatio-Temporal Dynamics and Spatial Mismatch. Trop. Med. Infect. Dis. 2022, 7, 292. [Google Scholar] [CrossRef] [PubMed]
- Tone, K. A slacks-based measure of efficiency in data envelopment analysis. Eur. J. Oper. Res. 2001, 130, 498–509. [Google Scholar] [CrossRef] [Green Version]
- Andersen, P.; Petersen, N.C. A procedure for ranking efficient units in data envelopment analysis. Manag. Sci. 1993, 39, 1261–1264. [Google Scholar] [CrossRef]
- Tone, K. A slacks-based measure of super-efficiency in data envelopment analysis. Eur. J. Oper. Res. 2002, 143, 32–41. [Google Scholar] [CrossRef] [Green Version]
- Wang, C.N.; Nguyen, T.L.; Dang, T.T. Analyzing Operational Efficiency in Real Estate Companies: An Application of GM (1,1) and DEA Malmquist Model. Mathematics 2021, 9, 202. [Google Scholar] [CrossRef]
- Liu, X.X.; Liu, H.H.; Yang, G.L.; Pan, J.F. Productivity assessment of the real estate industry in China: A DEA-Malmquist index. Eng. Constr. Archit. Manag. 2021. [Google Scholar] [CrossRef]
- Yang, G.L.; Fukuyama, H.; Chen, K. Investigating the regional sustainable performance of the Chinese real estate industry: A slack-based DEA approach. Omega-Int. J. Manag. Sci. 2019, 84, 141–159. [Google Scholar] [CrossRef]
- Zhang, Q.; Hong, K.R.; Luo, J.H. Comparative Analysis of Regional Real Estate Input-Output Efficiency Based on Super-Efficiency DEA Model—Taking Hunan as an example. Econ. Geogr. 2016, 36, 120–125. [Google Scholar] [CrossRef]
- Zhang, P.; Li, W.; Zhao, K.; Zhao, S. Spatial Pattern and Driving Mechanism of Urban–Rural Income Gap in Gansu Province of China. Land 2021, 10, 1002. [Google Scholar] [CrossRef]
- Li, W.; Zhang, P.; Zhao, K.; Zhao, S. The Geographical Distribution and Influencing Factors of COVID-19 in China. Trop. Med. Infect. Dis. 2022, 7, 45. [Google Scholar] [CrossRef]
- Zhao, S.D.; Li, W.W.; Zhao, K.X.; Zhang, P. Change Characteristics and Multilevel Influencing Factors of Real Estate Inventory-Case Studies from 35 Key Cities in China. Land 2021, 10, 928. [Google Scholar] [CrossRef]
- Chen, K.; Song, Y.Y.; Pan, J.F.; Yang, G.L. Measuring destocking performance of the Chinese real estate industry: A DEA-Malmquist approach. Socio-Econ. Plan. Sci. 2020, 69, 100691. [Google Scholar] [CrossRef]
- Li, W.; Weng, L.; Zhao, K.; Zhao, S.; Zhang, P. Research on the Evaluation of Real Estate Inventory Management in China. Land 2021, 10, 1283. [Google Scholar] [CrossRef]
- Fan, Z.G.; Deng, Z.K.; Qi, Y.W.; Pan, J.S. Spatial-Temporal pattern and evolutionary trend of eco-efficiency of real estate development in the Yangtze River economic belt. Front. Environ. Sci. 2022, 10, 996152. [Google Scholar] [CrossRef]
- Chen, J.Y.; Yang, Q.S.; Zhang, P.; Liu, H.H. Research on the Economic Efficiency of the Real Estate in Jilin Province. J. Northeast. Norm. Univ. (Nat. Sci. Ed.) 2016, 48, 151–157. [Google Scholar]
- Liu, R. Empirical Study on the Efficiency of the Real Estate Industry in China’s Provinces and Municipalities. Spec. Econ. Zone 2010, 6, 259–260. [Google Scholar]
- Fang, J.J. Efficiency Analysis of China’s Real Estate Industry: Empirical Research Based on Provincial Data. Mod. Manag. Sci. 2014, 11, 78–80. [Google Scholar]
- Li, K.; Ma, Z.L.; Zhang, G.Z. Evaluation of the Supply-Side Efficiency of China’s Real Estate Market: A Data Envelopment Analysis. Sustainability 2019, 11, 288. [Google Scholar] [CrossRef] [Green Version]
- Zeng, Z.F.; Hu, J.W. Research on China’s Provincial Real Estate Development Efficiency and Its Influencing Factors. Stat. Decis. Mak. 2013, 13, 98–101. [Google Scholar] [CrossRef]


| Type | Code | Indicator | Meaning |
|---|---|---|---|
| Input | Employee | Number of staff employed by real estate companies, representing human resource input | |
| Construction area | The floor area of all houses constructed in the year, the sum of the building area of each floor of multi-story buildings, representing the material resources input | ||
| Investment amount | Capital investment of real estate enterprises, applied to housing construction, construction of supporting services, land development and acquisition funds, representing financial capital investment | ||
| Output | Industrial added value | The value of output in excess of intermediate inputs in the production and operation of real estate enterprises, including the sum of labor compensation, net production tax, depreciation of fixed assets and operating surplus, according to the relevant regulations of the National Bureau of Statistics of China, representing the macroeconomic efficiency | |
| Sales area | The total contracted area of the houses sold during the year, i.e., the floor area indicated in the official transaction contract signed by the buyer and seller, including both the existing house and the term house sales area, representing the market demand | ||
| Area for sale | The floor area of commercial properties completed and qualified for sale or lease during the year that have not yet been sold or leased, representing the degree of oversupply. Here it refers to the total inventory of real estate, including the total area of residential, office, commercial and other types of commercial housing (the total floor area calculated by floor). |
| Speed (%) | Amount (Million Square Meters) | |||||
|---|---|---|---|---|---|---|
| 2011–2015 | 2016–2020 | 2011–2020 | 2011–2015 | 2016–2020 | 2011–2020 | |
| Shanghai | 10.89 | 7.47 | 16.88 | 6.96 | 6.35 | 11.77 |
| Nanjing | 20.86 | −14.15 | −0.60 | 2.75 | −1.99 | −0.06 |
| Wuxi | 19.24 | −9.58 | 11.79 | 3.68 | −2.79 | 2.02 |
| Xuzhou | 15.02 | 4.64 | 22.69 | 0.60 | 0.30 | 1.02 |
| Changzhou | 49.61 | −6.28 | 34.48 | 5.06 | −1.22 | 2.87 |
| Suzhou-JS | 16.99 | −3.01 | 10.03 | 4.96 | −1.08 | 2.64 |
| Nantong | 55.07 | −16.78 | 29.43 | 8.27 | −5.26 | 3.12 |
| Lianyungang | 25.83 | −13.96 | 11.69 | 0.97 | −0.82 | 0.36 |
| Huai’an | 27.81 | −11.37 | 13.12 | 1.47 | −0.89 | 0.56 |
| Yancheng | 114.19 | 1.16 | 93.17 | 4.68 | 0.15 | 3.02 |
| Yangzhou | 29.66 | −8.53 | 23.00 | 2.03 | −1.09 | 1.43 |
| Zhenjiang | 39.59 | 2.16 | 30.81 | 3.10 | 0.27 | 2.14 |
| Taizhou-JS | 51.88 | −14.38 | 32.37 | 3.29 | −2.01 | 1.58 |
| Suqian | 64.26 | −11.78 | 47.35 | 2.54 | −1.24 | 1.50 |
| Hangzhou | 29.07 | −14.08 | 8.33 | 6.33 | −4.10 | 1.35 |
| Ningbo | 47.33 | −13.18 | 26.44 | 5.95 | −3.12 | 2.50 |
| Wenzhou | 40.84 | −19.71 | 12.05 | 1.58 | −1.20 | 0.31 |
| Jiaxing | 26.58 | −14.25 | 3.61 | 3.25 | −2.03 | 0.32 |
| Huzhou | 30.56 | −17.21 | 4.87 | 2.82 | −2.02 | 0.31 |
| Shaoxing | 30.20 | −22.00 | 5.60 | 4.01 | −4.53 | 0.52 |
| Jinhua | 33.63 | −5.70 | 24.55 | 1.96 | −0.57 | 1.26 |
| Quzhou | 13.23 | −6.81 | 7.63 | 0.40 | −0.27 | 0.21 |
| Zhoushan | 76.09 | −14.09 | 55.35 | 0.96 | −0.54 | 0.54 |
| Taizhou-ZJ | 39.41 | −18.35 | 29.03 | 1.33 | −1.66 | 0.85 |
| Lishui | 18.47 | −3.05 | 29.02 | 0.17 | −0.06 | 0.31 |
| Hefei | 11.01 | 8.22 | 12.49 | 0.89 | 0.74 | 1.03 |
| Wuhu | 29.11 | −5.35 | 29.92 | 0.63 | −0.25 | 0.66 |
| Bengbu | 21.70 | −22.89 | 4.65 | 0.32 | −0.59 | 0.05 |
| Huainan | 32.17 | −19.34 | 2.65 | 0.83 | −0.61 | 0.04 |
| Maanshan | 29.34 | −27.52 | −11.08 | 1.32 | −1.21 | −0.28 |
| Huaibei | 39.12 | −17.15 | 14.41 | 0.58 | −0.40 | 0.15 |
| Tongling | 98.26 | −0.90 | 102.87 | 1.37 | −0.06 | 1.51 |
| Anqing | 50.24 | −11.55 | 35.46 | 1.69 | −0.88 | 0.98 |
| Huangshan | 34.07 | −8.28 | 19.80 | 1.13 | −0.43 | 0.54 |
| Chuzhou | 56.91 | −20.86 | 20.45 | 2.45 | −1.58 | 0.54 |
| Fuyang | 42.11 | −13.08 | 28.20 | 0.57 | −0.38 | 0.31 |
| Suzhou-AH | 45.88 | −16.46 | 24.31 | 1.27 | −0.91 | 0.50 |
| Lu’an | 59.59 | −13.07 | 33.18 | 1.92 | −0.83 | 0.75 |
| Bozhou | 180.02 | −7.44 | 162.38 | 0.88 | −0.25 | 0.68 |
| Chizhou | 40.06 | −4.37 | 31.80 | 0.89 | −0.18 | 0.63 |
| Xuancheng | 47.76 | −14.11 | 22.92 | 1.55 | −0.79 | 0.53 |
| 2011 | 2015 | 2016 | 2020 | |
|---|---|---|---|---|
| Max-Index | 2.32 | 1.17 | 1.16 | 1.15 |
| Min-Index | 0.23 | 0.32 | 0.31 | 0.42 |
| Index average of effective cities | 1.26 | 1.05 | 1.07 | 1.06 |
| Index average of ineffective cities | 0.45 | 0.57 | 0.63 | 0.67 |
| Proportion of effective cities | 24.39 | 43.90 | 34.15 | 36.59 |
| 2011 | 2015 | 2016 | 2020 | |
|---|---|---|---|---|
| Max-Index | 1.59 | 2.54 | 1.41 | 1.71 |
| Min-Index | 0.29 | 0.34 | 0.51 | 0.55 |
| Index average of effective cities | 1.16 | 1.16 | 1.11 | 1.14 |
| Index average of ineffective cities | 0.56 | 0.61 | 0.70 | 0.72 |
| Proportion of effective cities | 51.22 | 58.54 | 58.54 | 56.10 |
| 2011 | 2015 | 2016 | 2020 | Overall | |
|---|---|---|---|---|---|
| Shanghai | 1 | 1 | 1 | 1 | Long term—increasing returns to scale |
| Nanjing | 1 | 1 | 1 | 1 | Long term—increasing returns to scale |
| Wuxi | 1 | 1 | 1 | 1 | Long term—increasing returns to scale |
| Xuzhou | 1 | 1 | −1 | 1 | Increasing returns to scale |
| Changzhou | 1 | 1 | 1 | −1 | Increasing returns to scale |
| Suzhou-JS | 1 | 1 | 1 | 1 | Long term—increasing returns to scale |
| Nantong | 1 | −1 | 1 | 1 | Increasing returns to scale |
| Lianyungang | 1 | −1 | −1 | −1 | Decreasing returns to scale |
| Huai’an | 1 | 1 | −1 | −1 | Return to scale from increasing to decreasing |
| Yancheng | 1 | 1 | 1 | 1 | Increasing returns to scale |
| Yangzhou | 1 | −1 | 1 | −1 | Return to scale from increasing to decreasing |
| Zhenjiang | −1 | −1 | 1 | −1 | Decreasing returns to scale |
| Taizhou-JS | 1 | −1 | −1 | −1 | Decreasing returns to scale |
| Suqian | −1 | −1 | −1 | −1 | Long term—decreasing returns to scale |
| Hangzhou | 1 | 1 | 1 | 1 | Long term—increasing returns to scale |
| Ningbo | 1 | 1 | 1 | 1 | Long term—increasing returns to scale |
| Wenzhou | 1 | 1 | −1 | 1 | Increasing returns to scale |
| Jiaxing | −1 | 1 | 1 | 1 | Increasing returns to scale |
| Huzhou | −1 | −1 | −1 | −1 | Long term—decreasing returns to scale |
| Shaoxing | 1 | 1 | 1 | 1 | Long term—increasing returns to scale |
| Jinhua | −1 | −1 | −1 | −1 | Long term—decreasing returns to scale |
| Quzhou | −1 | −1 | −1 | −1 | Long term—decreasing returns to scale |
| Zhoushan | −1 | −1 | −1 | −1 | Long term—decreasing returns to scale |
| Taizhou-ZJ | 1 | −1 | −1 | −1 | Decreasing returns to scale |
| Lishui | −1 | −1 | −1 | −1 | Long term—decreasing returns to scale |
| Hefei | 1 | 1 | 1 | 1 | Long term—increasing returns to scale |
| Wuhu | −1 | 1 | −1 | −1 | Decreasing returns to scale |
| Bengbu | −1 | −1 | −1 | −1 | Long term—decreasing returns to scale |
| Huainan | −1 | −1 | −1 | −1 | Long term—decreasing returns to scale |
| Maanshan | −1 | −1 | −1 | −1 | Long term—decreasing returns to scale |
| Huaibei | −1 | −1 | −1 | −1 | Long term—decreasing returns to scale |
| Tongling | −1 | −1 | −1 | −1 | Long term—decreasing returns to scale |
| Anqing | 1 | −1 | −1 | −1 | Decreasing returns to scale |
| Huangshan | −1 | −1 | −1 | −1 | Long term—decreasing returns to scale |
| Chuzhou | −1 | 1 | −1 | −1 | Decreasing returns to scale |
| Fuyang | −1 | −1 | −1 | 1 | Decreasing returns to scale |
| Suzhou-AH | −1 | −1 | −1 | −1 | Long term—decreasing returns to scale |
| Lu’an | −1 | −1 | −1 | −1 | Long term—decreasing returns to scale |
| Bozhou | −1 | −1 | −1 | −1 | Long term—decreasing returns to scale |
| Chizhou | −1 | −1 | −1 | −1 | Long term—decreasing returns to scale |
| Xuancheng | −1 | −1 | −1 | −1 | Long term—decreasing returns to scale |
| City | Benchmark |
|---|---|
| Wuxi | Nantong (0.42); Suzhou-JS (0.18); Taizhou-JS (0.14); Yangzhou (0.26) |
| Zhenjiang | Chizhou (0.26); Huai’an (0.24); Taizhou-JS (0.50) |
| Shanghai | Suzhou-JS (1.00) |
| Suzhou-JS | Ningbo (0.80); Shanghai (0.20) |
| Yancheng | Huai’an (0.69); Nantong (0.14); Taizhou-JS (0.16) |
| Ningbo | Chuzhou (0.38); Suzhou-JS (0.40); Xuzhou (0.22) |
| Lishui | Huaibei (0.79); Maanshan (0.14); Wenzhou (0.03); Yangzhou (0.04) |
| Hefei | Nanjing (0.01); Suzhou-JS (0.24); Wenzhou (0.65); Xuzhou (0.10) |
| Changzhou | Chuzhou (0.1); Nantong (0.19); Taizhou-JS (0.26); Yangzhou (0.48) |
| Huangshan | Chizhou (0.70); Quzhou (0.27); Taizhou-JS (0.02) |
| Quzhou | Chizhou (0.60); Huaibei (0.34); Yangzhou (0.06) |
| Chizhou | Quzhou (1.00) |
| Tongling | Chizhou (0.85); Huai’an (0.03); Taizhou-JS (0.12) |
| Hangzhou | Chuzhou (0.36); Nantong (0.03); Suzhou-JS (0.52); Wenzhou (0.10) |
| Shaoxing | Chuzhou (0.46); Nantong (0.26); Yangzhou (0.28) |
| Jinhua | Chuzhou (0.25); Huaibei (0.40); Yangzhou (0.35) |
| Wuhu | Huai’an (0.39); Huaibei (0.54); Yangzhou (0.07) |
| Bozhou | Bengbu (0.05); Chuzhou (0.50); Huaibei (0.45) |
| Xuzhou | Hefei (0.02); Huai’an (0.43); Nantong (0.17); Wenzhou (0.38) |
| Nantong | Chuzhou (0.00); Ningbo (0.04); Wuxi (0.73); Xuzhou (0.23) |
| Yangzhou | Chuzhou (0.14); Huaibei (0.03); Quzhou (0.41); Suzhou-JS (0.18); Taizhou-JS (0.25) |
| Maanshan | Hefei (0.02); Huai’an (0.05); Huaibei (0.93); Yangzhou (0.00) |
| Zhoushan | Huaibei (0.57); Huangshan (0.43) |
| Huaibei | Chizhou (0.31); Lishui (0.69); Zhoushan (0.00) |
| Anqing | Chizhou (0.21); Huai’an (0.46); Huaibei (0.12); Quzhou (0.21) |
| Suqian | Chizhou (0.14); Chuzhou (0.28); Huai’an (0.58) |
| Xuancheng | Chizhou (0.12); Chuzhou (0.21); Huaibei (0.67) |
| Lianyungang | Chuzhou (0.02); Huai’an (0.42); Huaibei (0.47); Wenzhou (0.01); Yangzhou (0.08) |
| Jiaxing | Chuzhou (0.62); Nantong (0.17); Yangzhou (0.21) |
| Huzhou | Chuzhou (0.77); Huaibei (0.23) |
| Taizhou-ZJ | Chuzhou (0.13); Huaibei (0.21); Wenzhou (0.33); Yangzhou (0.33) |
| Huainan | Chuzhou (0.06); Huaibei (0.94) |
| Suzhou-AH | Chuzhou (0.66); Huaibei (0.34) |
| Lu’an | Chuzhou (0.48); Huaibei (0.52) |
| Nanjing | Hefei (0.14); Suzhou-JS (0.17); Wenzhou (0.69) |
| Wenzhou | Bengbu (0.21); Fuyang (0.58); Nanjing (0.21) |
| Chuzhou | Fuyang (0.08); Huaibei (0.73); Nantong (0.12); Xuzhou (0.07) |
| Fuyang | Bengbu (0.79); Chuzhou (0.16); Xuzhou (0.05) |
| Bengbu | Fuyang (0.33); Huaibei (0.59); Wenzhou (0.08) |
| Taizhou-JS | Chizhou (0.50); Nantong (0.20); Yancheng (0.13); Yangzhou (0.17) |
| Huai’an | Chuzhou (0.35); Lianyungang (0.41); Xuzhou (0.07); Yancheng (0.17) |
| City | Employee | Construction Area | Investment Amount |
|---|---|---|---|
| Wuxi | −0.05 | 0 | −55 |
| Zhenjiang | −0.28 | −625 | −45 |
| Tongling | −0.35 | 0 | −31 |
| Hangzhou | −1.12 | −4819 | −1849 |
| Shaoxing | −0.18 | −248 | −110 |
| Jinhua | −0.22 | −596 | −60 |
| Wuhu | −0.75 | −422 | −170 |
| Bozhou | −0.46 | −747 | −68 |
| Anqing | −0.33 | 0 | 0 |
| Suqian | −0.09 | −82 | 0 |
| Xuancheng | −0.11 | −217 | 0 |
| Lianyungang | 0 | −318 | −24 |
| Jiaxing | −0.23 | −1523 | −400 |
| Huzhou | −0.41 | −1211 | −190 |
| Taizhou-ZJ | −0.13 | −1143 | −113 |
| Huainan | −0.55 | −159 | −57 |
| Suzhou-AH | −0.58 | −559 | −45 |
| Lu’an | −0.16 | −1309 | −59 |
Publisher’s Note: MDPI stays neutral with regard to jurisdictional claims in published maps and institutional affiliations. |
© 2022 by the authors. Licensee MDPI, Basel, Switzerland. This article is an open access article distributed under the terms and conditions of the Creative Commons Attribution (CC BY) license (https://creativecommons.org/licenses/by/4.0/).
Share and Cite
Zhang, P.; Chen, H.; Zhao, K.; Zhao, S.; Li, W. Dynamics, Risk and Management Performance of Urban Real Estate Inventory in Yangtze River Delta. Buildings 2022, 12, 2140. https://doi.org/10.3390/buildings12122140
Zhang P, Chen H, Zhao K, Zhao S, Li W. Dynamics, Risk and Management Performance of Urban Real Estate Inventory in Yangtze River Delta. Buildings. 2022; 12(12):2140. https://doi.org/10.3390/buildings12122140
Chicago/Turabian StyleZhang, Ping, Hua Chen, Kaixu Zhao, Sidong Zhao, and Weiwei Li. 2022. "Dynamics, Risk and Management Performance of Urban Real Estate Inventory in Yangtze River Delta" Buildings 12, no. 12: 2140. https://doi.org/10.3390/buildings12122140
APA StyleZhang, P., Chen, H., Zhao, K., Zhao, S., & Li, W. (2022). Dynamics, Risk and Management Performance of Urban Real Estate Inventory in Yangtze River Delta. Buildings, 12(12), 2140. https://doi.org/10.3390/buildings12122140