1. Introduction
In 2011, the European Commission put forward a roadmap for a competitive low-carbon Europe Union (EU) by 2050 [
1], which could enable it to deliver greenhouse gas reductions up to 80–95%. In 2018, the European Commission set out its vision for a climate-neutral by 2050, i.e., an economy with net-zero greenhouse gas emissions. This means reducing greenhouse gas emissions as much as possible and compensating for any remaining emissions. In order to achieve this, an intermediate emission-reduction goal has been set, namely: reducing greenhouse gas (GHG) emissions by at least 55% by 2030 [
2]. The building sector is highly relevant on this path towards decarbonisation since the European building stock is responsible for 40% of energy consumption and 36% of GHG emissions in the EU [
3]. For this reason, intervening in the building sector is a key aspect, which must be carried out through the energy renovation of existing buildings [
4], and through the implementation of circular economy principles.
With the aim of fostering this green transition of buildings, a proposal for the recast of the Directive of the European Parliament and of the Council on the energy performance of buildings [
3] was published in December 2021, which included a battery of measures, such as the replacement of long-term renovation strategies by national building renovation plans, or greater investment in renovation through the Recovery and Resilience Facility (RRF), the Social Climate Fund (SCF), and the Cohesion Policy funds, among others. In addition, new energy efficiency standards were proposed, and new concepts and definitions which were already being addressed in different areas but had not yet been incorporated into European legislation, were finally included [
5]. This is the case of concepts such as ‘zero-emission building’, ‘staged deep renovation’, ‘renovation passport’ or ‘Digital Building Logbook’ (DBL), which are defined in Article 2 of the standard [
3].
Specifically, the Digital Building Logbook (DBL), which is the central theme of this work, is defined in the Proposal for the recast of the energy performance of buildings directive (EPBD) [
3] as a ‘common repository for all relevant building data, including data related to energy performance such as energy performance certificates, renovation passports and smart readiness indicators, which facilitates informed decision making and information sharing within the construction sector, among building owners and occupants, financial institutions and public authorities’. The DBL is considered a measure to improve the durability and adaptability of built assets in line with the circular economy principles for buildings design [
6]. Furthermore, this tool acquires great relevance because it is supposed to serve to mitigate the current lack of data on the building stock [
7].
Through the generation of high-quality data, the DBL will be able to produce the following services/objectives:
To provide data to develop renovation roadmaps and maintenance plans [
8,
9,
10];
To enable the measurement of the progress towards decarbonisation [
5,
7];
To provide data for lifecycle assessment to promote circularity [
6,
11].
However, to produce these services, the DBL must gather data from other sources, such as national cadastres and energy performance certificates registries. Existing digital data sources have already been explored in some countries and they have been found to be insufficient [
5]. These deficiencies have to do with the availability of data, including problems in the collection process, as well as problems of lack of quality and data privacy, lack of interoperability of databases (DB), and absence of certain data.
In the age of the digital revolution, the DBL can benefit from new technologies, such as the Internet of Things (IoT), Artificial Intelligence (AI), Building Information Modelling (BIM) or smart monitoring, that are called to open up new possibilities to collect the needed data on the building stock, with the aim of increasing energy efficiency of buildings [
12], and to supervise the works at the construction sites [
13]. Additionally, the European Commission is working on implementing new frameworks that will promote digitalisation and circularity in the construction sector. The use of the aforementioned technologies and frameworks has the potential to help to considerably increase the data that can be collected, to allow real-time data gathering, to increase data interoperability and to simplify and automate the DBL generation process.
In this paper, the contribution of new technologies for digital data acquisition and analysis in the built environment and new EU tools to support circularity and energy efficiency in buildings are analysed, focusing on the data that will allow us to gather the indicators to be included in the DBL, as well as on the interoperability possibilities of the technologies and tools. So far, only connections between existing databases and the DBL have been studied [
10]. Therefore, the novelty of this paper is the exploration, for the first time, of the interconnection between the DBL and new technologies for data acquisition and analysis, and between the DBL and EU frameworks to support circularity and energy efficiency in buildings. This paper is structured as follows: in
Section 1 the concept of a European DBL is introduced. In
Section 2, the methodology followed in this research is described. In
Section 3 the State of the art of the European DBL is analysed, focusing in the barriers on data gathering. In
Section 4, new possibilities to collect data on buildings are analysed, with focus on new technologies for digital data acquisition and analysis in the built environment and new EU tools to support circularity and energy efficiency in buildings. Finally, discussion, conclusions and future research are presented in
Section 5.
2. Materials and Methods
The research methodology for this work is comprised of three main steps (
Figure 1):
Step 1. Study on the state of the art of the European DBL, focusing on aspects that have not yet been solved; the indicators that the DBL should include and the interoperability with different data sources.
Step 2. The identification and definition of new possibilities to collect data on buildings. Two types of new data sources were identified:
New technologies for digital data acquisition and analysis in the built environment. Among those technologies, three were selected as very relevant for the DBL: 3D scanning, smart monitoring, and digital twins.
New EU tools to support circularity and energy efficiency in buildings. Among them, three were chosen: the Smart Readiness Indicator (SRI) [
14,
15,
16,
17], the Level(s) framework [
18,
19,
20], and the Digital Product Passport (DPP) [
21]. In
Section 4.2 these tools are described.
Step 3. Analysis of the contribution to the DBL of the new data sources identified in the previous step. Assessment according to two parameters:
The indicators. They are the data fields that these tools can provide when linked to the DBL.
Their interoperability features, focusing on how the interconnection and data interchange between them can take place.
Regarding the indicators analysis, the following considerations were made:
Firstly, a set of relevant indicators for the DBL according to the study conducted by Gómez-Gil et al. [
10] and summarised in
Section 3, was compiled.
Indicators belonging to levels 1, 2 and 3 from the Level(s) framework were included in the analysis. Regarding the Smart Readiness Indicator (SRI), the detailed analysis (level B) was considered. This level is recommended just when assessing highly complex or tertiary buildings, but in this study this decision was taken in order to identify the maximum amount of data that can be gathered from the tool.
When it comes to monitoring buildings, the installation of the whole variety of sensors available in the market was considered, as well as all of the known benefits that can be obtained when combining sensors with Artificial Intelligence (AI). For example, energy management solutions enable buildings users to manage their consumption and production and, by using AI, these solutions are able to make recommendations based on energy consumption data [
22]. Furthermore, they are capable of receiving signals from the electrical grid and responding automatically by controlling distributed energy generation or modifying operation in the home to reduce or shift demand.
3. State of the Art of the European Digital Building Logbook
The DBL was first introduced as a European-scale and autonomous tool by the Renovation Wave strategy in 2020 [
7] and was first defined in the European legislation in the aforementioned Proposal for the recast of the EPBD, in 2021.
However, the DBL had already been implemented at the regional and national levels in some European countries before the publication of these two documents. One successful case is the Woningpas, implemented in Flanders, Belgium, and developed by the Flemish Energy Agency. It is a model in permanent evolution and is applicable to single-family homes [
9]. The aim of the Woningpas is to minimise administrative burdens in the key moments of the building (construction, renovation, change in owner, etc.) and to provide users with information and advice on fundamental aspects of the building, including the generation of a roadmap for its improvement [
5]. Another good example is the Madaster initiative [
23], which is available in several European countries. In this platform, data on all of the materials and products of buildings and infrastructures can be recorded—including information on the lifecycle of the product—with the aim of facilitating the application of circular principles to construction and real estate management.
Nevertheless, the DBL is very novel in the scientific literature. So far, there are only about eight scientific papers [
5,
7,
8,
9,
10,
24,
25,
26] dealing with issues related to DBL, such as building renovation passports, where the DBL is associated with a renovation roadmap, and four specific papers on the DBL. The latter include a review paper on the topic and its future development [
5], a recent state of the art of DBLs [
7], a study on the contribution and connection of existing databases to the DBL [
10] and a proposal of a process-based DBL framework integrating data and stakeholder roles [
26].
Despite the steps that have already been taken, a common European DBL model has not yet been implemented, although some important progress has been made in that direction. Four DBL model proposals were designed before the DBL was first mentioned in the European legislation. These proposals were developed by research consortia: three of them are outputs of H2020 research projects and the last one is a three-volume report commissioned by the European Commission. On the one hand, the outcomes of H2020 projects are the iBRoad-Log, focused on single-family homes [
27,
28], the ALDREN BuildLog, for non-residential buildings, mainly hotels and offices [
29,
30], and the X-Tendo Logbook, suitable for the whole building stock [
31,
32]. On the other hand, the report entitled ‘Study on the Development of a European Union Framework for Buildings’ Digital Logbook’ [
33] also seeks to apply to the entire building stock. Even though these proposals constitute an important contribution to the subject, the study carried out by Gómez-Gil et al. [
7] concluded that some key aspects are not yet solved, such as the set of indicators that must be collected, how they can be gathered, how to manage them, how to interconnect existing data sources to the DBL or how they can be linked with new tools, technologies and strategic frameworks that are emerging.
The topic of the interconnection between the existing data sources and new technologies with the DBL is a central one, since currently, most of the proposed DBL models are designed to be developed by a technician or auditor, who gathers the needed information through an audit and consults the available databases and/or includes a linkage to existing data sources. However, according to Gómez-Gil et al. [
10], this linkage has not been solved yet. In fact, a great effort is needed in order to make the existing data sources suitable for the DBL in terms not only of the information gathered, but also of their interoperability features [
10].
On the other hand, it is worth noting the need to collect more real data on buildings to foster the decarbonisation of the building stock. As an example of this statement, Gómez-Gil et al. [
10], conducted an analysis on the indicators proposed by the four aforementioned models for the European DBL and found that few of them could be gathered from the existing digital data sources. In their study, the indicators suggested by ≥50% of the four models were identified and labelled as the most relevant ones, and this set of relevant indicators was compared to the data fields that are currently being gathered in several databases in two case study regions: the Lombardy (Italy) and Aragon (Spain), focusing on the city of Zaragoza. The study concluded that several indicators were considered relevant for these initiatives, but data were not available to collect them in the existing data sources in the case study regions. Specifically, in the Spanish case study, 33 indicators out of 83 (40%) were available, whereas in the Italian case, 29 out of 83 (35%) data fields were being gathered. Regarding data privacy, in the Spanish case, twelve indicators were open source (36%) vs. twenty-one that were not open, whereas in the Italian case study twenty-six indictors were open (90%) vs. three that were not open [
10].
Due to these reasons, it is necessary both that existing data sources are updated and that new data on buildings are collected, for which the use of new technologies and new data exchange standards have a high potential.
4. New Possibilities to Collect Data on Buildings: New Technologies and Frameworks Applicable to the Digital Building Logbook. Identification and Definition
Although the European DBL is not yet implemented and has not even been formally defined, as explained in the previous section, the debate around a ‘second generation’ of this tool has already begun. In this sense, in October 2021 the Horizon call for research projects called ‘Demonstrate the use of Digital Logbook for Buildings’ was launched. It aimed at exploring the maximum potential of the DBL, emphasising the incorporation of new technologies to collect and process information, as well as for the creation of intelligent data environments at the community level.
This ‘second generation’, that would solve some of the problems already identified (
Table 1), will be characterised by the use of the latest technologies for the collection of data—in contrast to the much more manual approach of the ‘first generation’—as well as for its storage and exchange, and will be based on the automation of processes, the collection of real data and the creation of shared data environments. On the other hand, its implementation will be more expensive, take longer to technically solve the challenges it poses, and its coding will be more complex [
5].
In the following paragraphs (
Section 4.1 and
Section 4.2), some new technologies for digital data acquisition and analysis in the built environment, and new EU tools to support circularity and energy efficiency in buildings, are analysed.
4.1. New Technologies for Digital Data Acquisition and Analysis in the Built Environment
During a building’s lifecycle, a great amount of information is generated. These data are very valuable for several stakeholders [
10,
26], from buildings users to technicians, financial institutions, and public administrations. Nowadays, new digital technologies of different natures make it possible to gather, analyse and share those data. Among these technologies, the following have great relevance for the DBL:
The LiDAR (Laser Imaging Detection and Ranging) 3D scanning system is a technology that allows for the generation of high-precision point clouds using a laser emitter that determines the distance between the emitter and the object to be captured. To do so, LiDAR mainly uses a laser scanner and a drone or aerial airborne laser scanner (ALS) that transports it. Flights that take place can be scheduled and automated. However, laser scanners are frequently used without mounting on an ALS, thus, as a terrestrial laser scanner (TLS), simplifying the process and also allowing the generation of interior surveys.
The point clouds generated by ALS and TLS are usually accompanied by hundreds of ultra-high-resolution images and, with these elements, after a transformation process where the raw data must be converted into readable data and imported into a modelling software, it is possible to generate the architectural survey of a building, to create a high-quality 3D model or to generate the georeferenced Building Information Modelling (BIM) of a property. Additionally, O’Donnell et al. [
34] identified the potential of LiDAR to be integrated with Building Energy Performance Simulation (BEPS) software.
In addition, thanks to its ability to cover the entire building and to photograph it with extraordinary quality, it can be used to identify pathologies or to evaluate the state of conservation of inaccessible points [
35,
36].
Currently, other non-destructive as-is survey technologies are gaining popularity due to their simplicity and lower price, such as photogrammetry, which has the advantage of using light sensors that can be also carried by aerial vehicles or Time-of-Flight (ToF) imaging, that allows for the capturing of complex details that are not measured by laser scanning [
37].
Monitoring through sensors is an effective method to gather data on living conditions, operation, use and actual consumption of buildings [
38]. Currently, there is a wide variety of sensors on the market that allow for the measurement of, among other parameters, the ambient and surface temperature, CO
2 concentrations, relative humidity, pressure, real energy consumption, opening time of the windows, presence of people in buildings, lighting, etc. [
39]. Data from IoT sensors can be sent in real time, using different technologies, such as Bluetooth, LoRa, Modbus, CAN Bus, Sigfox, Zigbee, etc. to any remote model or device for their storage and analysis [
40].
These data can be used for control purposes [
41] when combined with AI. This combination makes it possible to improve buildings’ energy management [
42] and comfort conditions, by automatically adjusting the electricity and heating consumption; to support facility managers on systems design, management, and maintenance; and to enhance the maintenance plan, by suggesting preventive actions before a potential failure, but not earlier than necessary [
43].
In recent years, BIM has presented a revolution in the way the architectural projects are developed and represented, upgrading the digitalisation of buildings from 2D to 3D [
44]. It provides the advantage of allowing to us centralise in a model all of the as-is data of the different elements (object-based system) that make up a project, becoming the most reliable database of the building. It also allows for information management and data interchange between stakeholders throughout the project lifecycle [
40,
45,
46].
Currently, a further step is being taken in this technology, trying to link the BIM model with new technological advances [
44,
47], such as big data, cloud computing, artificial intelligence, virtual reality (VR), augmented reality (AR), industry 4.0, and Internet of Things (IoT) [
48], with the aim of expanding its capabilities. This way, an information flow is created between the model and the real object, in this case, the real building. When the flow of information is bidirectional, the model is called Digital Twin (DT) [
49].
For the creation of a DT, technologies are installed in the finished/existing building to capture reality, such as sensors or cameras, which collect data that is transferred to IoT and machine learning platforms, where they are analysed and integrated in the model. The model returns feedback in the form of valuable information for the generation of a preventive maintenance plan, suggestions for improving the use phase—for example, to improve its efficiency—and performing “what-if” analysis [
50,
51]. In addition, the interconnection of different DTs (forming the so-called federated models) would allow for the expansion of their scope of application to the scale of a neighbourhood or city [
51]. Whereas the DT is a digital model identical to an existing building, the DBL is a data repository, which includes not only the information contained in the DT, but also data from many other sources and databases.
4.2. New EU Tools to Support Circularity and Energy Efficiency in Buildings
In order to promote sustainability in the building sector, the European Commission has envisaged several frameworks and tools, mentioned in directives and strategies. In the next paragraphs, the most relevant ones for the DBL are summarised and briefly analysed:
The SRI, introduced by the 2018 revision of the EPBD, is a certification system that measures the ability of a building—or a part of it—to use information and communication technologies and electronic systems [
14,
15] to:
Respond to users’ needs (in terms of health, comfort, wellbeing, etc.);
Optimise its energy performance;
Interact and adapt to the network (flexibility, demand response, integration).
It arose with Directive (EU) 2018/844 and was extended in the Proposal for the recast of the EPBD. Its objective is to contribute to making buildings more efficient, healthy, and comfortable, optimising and reducing their energy consumption, which also translates into economic savings for users.
It will provide administrative and general information on buildings as well as the preparation for intelligent applications class [
16]. In addition, it will also allow us to individually evaluate the different ‘services’ of the building: heating, DHW, cooling, ventilation, lighting, monitoring and control, electric vehicles, electricity, and dynamic envelope. They will be evaluated according to the energy savings they provide, flexibility with the network and storage, comfort, response and adaptability, health and well-being, maintenance and faults prediction, and information to users [
17]. Where applicable, it will also assess the connectivity of the building, particularly the existence of high-speed networks, as well as interoperability, cybersecurity, and data protection issues [
16].
One of its main disadvantages is that, so far, it will only be a voluntary framework, thus, Member States will decide if they want to incorporate it into their national regulations or not.
Since the 1970s, the world population has doubled, and the Gross Domestic Product (GDP) has quadrupled. These trends have required large amounts of natural resources. Extraction reached 92 billion tons in 2017, compared to 27 billion tons in 1970, and historical trends suggest that this number could double to 190 billion tons a year by 2060 [
52]. A circular approach could help reduce the impact on natural resources. A circular economy is an industrial system that is restorative or regenerative by intention and design [
53]. In Europe, the building sector is one of the most resource-consuming sectors. A framework named Level(s) has been created to implement a regenerative economic system that minimises resources and energy consumption. Level(s) helps the user to identify critical points and explains how to reduce the environmental impact through level indicators. This European framework, which has given rise to a free tool, aims to help stakeholders in the building sector to assess and monitor buildings’ lifecycle sustainability in residential and office buildings. This tool is designed to provide a common language for all of the stakeholders around Europe [
18], making it easier to establish a common set of priorities and a standardised basis regarding performance requirements for existing and new buildings [
19]. To achieve this, it counts on a set of 16 indicators that are structured in six macro-objectives: greenhouse gas emissions; resource efficiency and circular materials; efficient use of water resources; healthy and comfortable spaces; adaptation and resilience to climate change and cost and value of optimised lifecycle [
18,
20]. The framework is designed to be flexible, thus it can be applied in different ways according to the user needs and the stage of the project that is assessed. In this sense, three levels of applicability were established [
19]:
Level 1: conceptual design, for early-stage projects;
Level 2: detailed design and construction, to assess the designed performance of the project and to monitor the construction works;
Level 3: as-built and in-use performance, applicable to completed buildings and their occupants.
Digital Product Passport
The European Green Deal [
54], published in 2019, and the Circular Economy Action Plan, published in 2020 by the European Commission, highlighted the need to consider the whole lifecycle of products and materials in circular economy initiatives. With this premise, the Circular Economy Package published in 2022 included a proposal for an Eco-design for Sustainable Products Regulation (ESPR), in which the Digital Product Passport (DPP)—already mentioned in the Green Deal—was a key element [
21]. Additionally, the DPP may also be included in the revision of the Construction Products Regulation (CPR) [
55] as a tool that allows consumers to make more sustainable choices when purchasing products.
The DPP is basically an instrument that serves to digitally register, process, and share data on products amongst all of the stakeholders of the building sector, including professionals, consumers, and authorities. It shall include information and instructions on origin, composition, repair, dismantling and recycling possibilities and end-of-life management.
The tool has not yet been implemented, and several questions have not yet been fully solved, such as the specific indicators that it will collect, its functioning, the way it will be linked to similar data sources, or how the data will be stored and managed [
21,
56,
57].
5. Analysis of the New Data Sources Identified
In this section, the contribution of the previously mentioned digital technologies and frameworks to the DBL is analysed according to two parameters: the indicators collected by these tools and their interoperability features.
5.1. Indicators
As explained previously, more data on buildings need to be collected in order to meet the current sustainability and digitalisation requirements of the building sector, and new technologies and frameworks represent a great opportunity for this. In this section, the data that these tools can provide to the DBL are analysed.
Appendix A collects the full set of relevant DBL indicators obtained following the methodology explained in
Section 3 and clustered into six categories according to the analysis conducted by Gómez-Gil et al. [
10]. In
Table A1,
Table A2,
Table A3,
Table A4,
Table A5 and
Table A6, for each relevant indicator, all of the potential sources among the studied new technologies and EU frameworks are indicated. Additionally, a column is included to indicate whether or not each indicator is currently available in existing data sources in a region of Spain. This information was obtained from the analysis conducted by Gómez-Gil et al. in [
10], where data sources for the DBL in Aragon region (Spain) were analysed in order to identify which data could be gathered from them. The sources considered were the Spanish Cadastre and Land Registry, the Aragon Energy Performance Certificate (EPC) Registry and the Zaragoza city
Inspección Técnica de los Edificios (ITE) Registry.
A summary of
Table A1,
Table A2,
Table A3,
Table A4,
Table A5 and
Table A6 can be found in
Table 2. In this table, the following parameters are shown: the total number of indicators by category according to Gómez-Gil et al. [
10], the number and percentage of indicators that are available in existing data sources in the mentioned region in Spain, the number and percentage of indicators that the three new EU tools to support circularity and energy efficiency in buildings allow us to gather, the number and percentage of indicators that the mentioned new technologies for digital data acquisition and analysis in the built environment allow us to collect, the sum of the last two columns and, finally, the total number and percentage of indicators that can be gathered using the previously mentioned existing and new data sources.
As shown in
Table 2, new digital technologies and new EU frameworks enable the possibility to collect most of the data fields—72 out of 83 (87%)—that were considered relevant for the DBL. Specifically, two categories of indicators can be fully collected (construction information and materials and conservation status and pathologies), whereas within three other categories, more than 75% of indicators can be gathered (general and administrative information, technical systems and Smart Readiness and energy efficiency, operation and us). Within the category titled ‘financial information’, less than 75% of the indicators can be collected.
When comparing indicators gathered through new EU tools to support circularity and energy efficiency in buildings and new technologies for digital data acquisition and analysis in the built environment, it can be seen that the latter provide more indicators than the former, but through their combination a very high percentage of indicators gathering is achieved.
When studying the indicators provided by the new sources individually, there are some that are very relevant due to the information they provide (such as digital twins), whereas others are relevant because they are the basis for the creation of others. An example of this is point clouds, which by themselves do not provide many data but allows for the creation of digital twins, which is the technology that provides the most information.
It should be noticed that, even though existing data sources provide some data that new sources do not, most of the information that existing sources provide is also provided by new ones. In fact, only two indicators provided by existing data sources in the case study region are not provided by new sources. However, their combination is highly desirable, since it allows for the collection of 73 indicators out of 83, i.e., 88% of the relevant indicators.
In addition to the indicators labelled as most relevant, new sources allow for a large amount of additional data to be collected (
Table 3). A future line of research will analyse whether this information should be included in the group of relevant indicators for the DBL.
However, it must also be considered that to exploit the maximum potential of these tools to provide all of the information mentioned above, it is important that they are applied at their highest level, properly using all of their functionalities.
5.2. DBL Interoperability
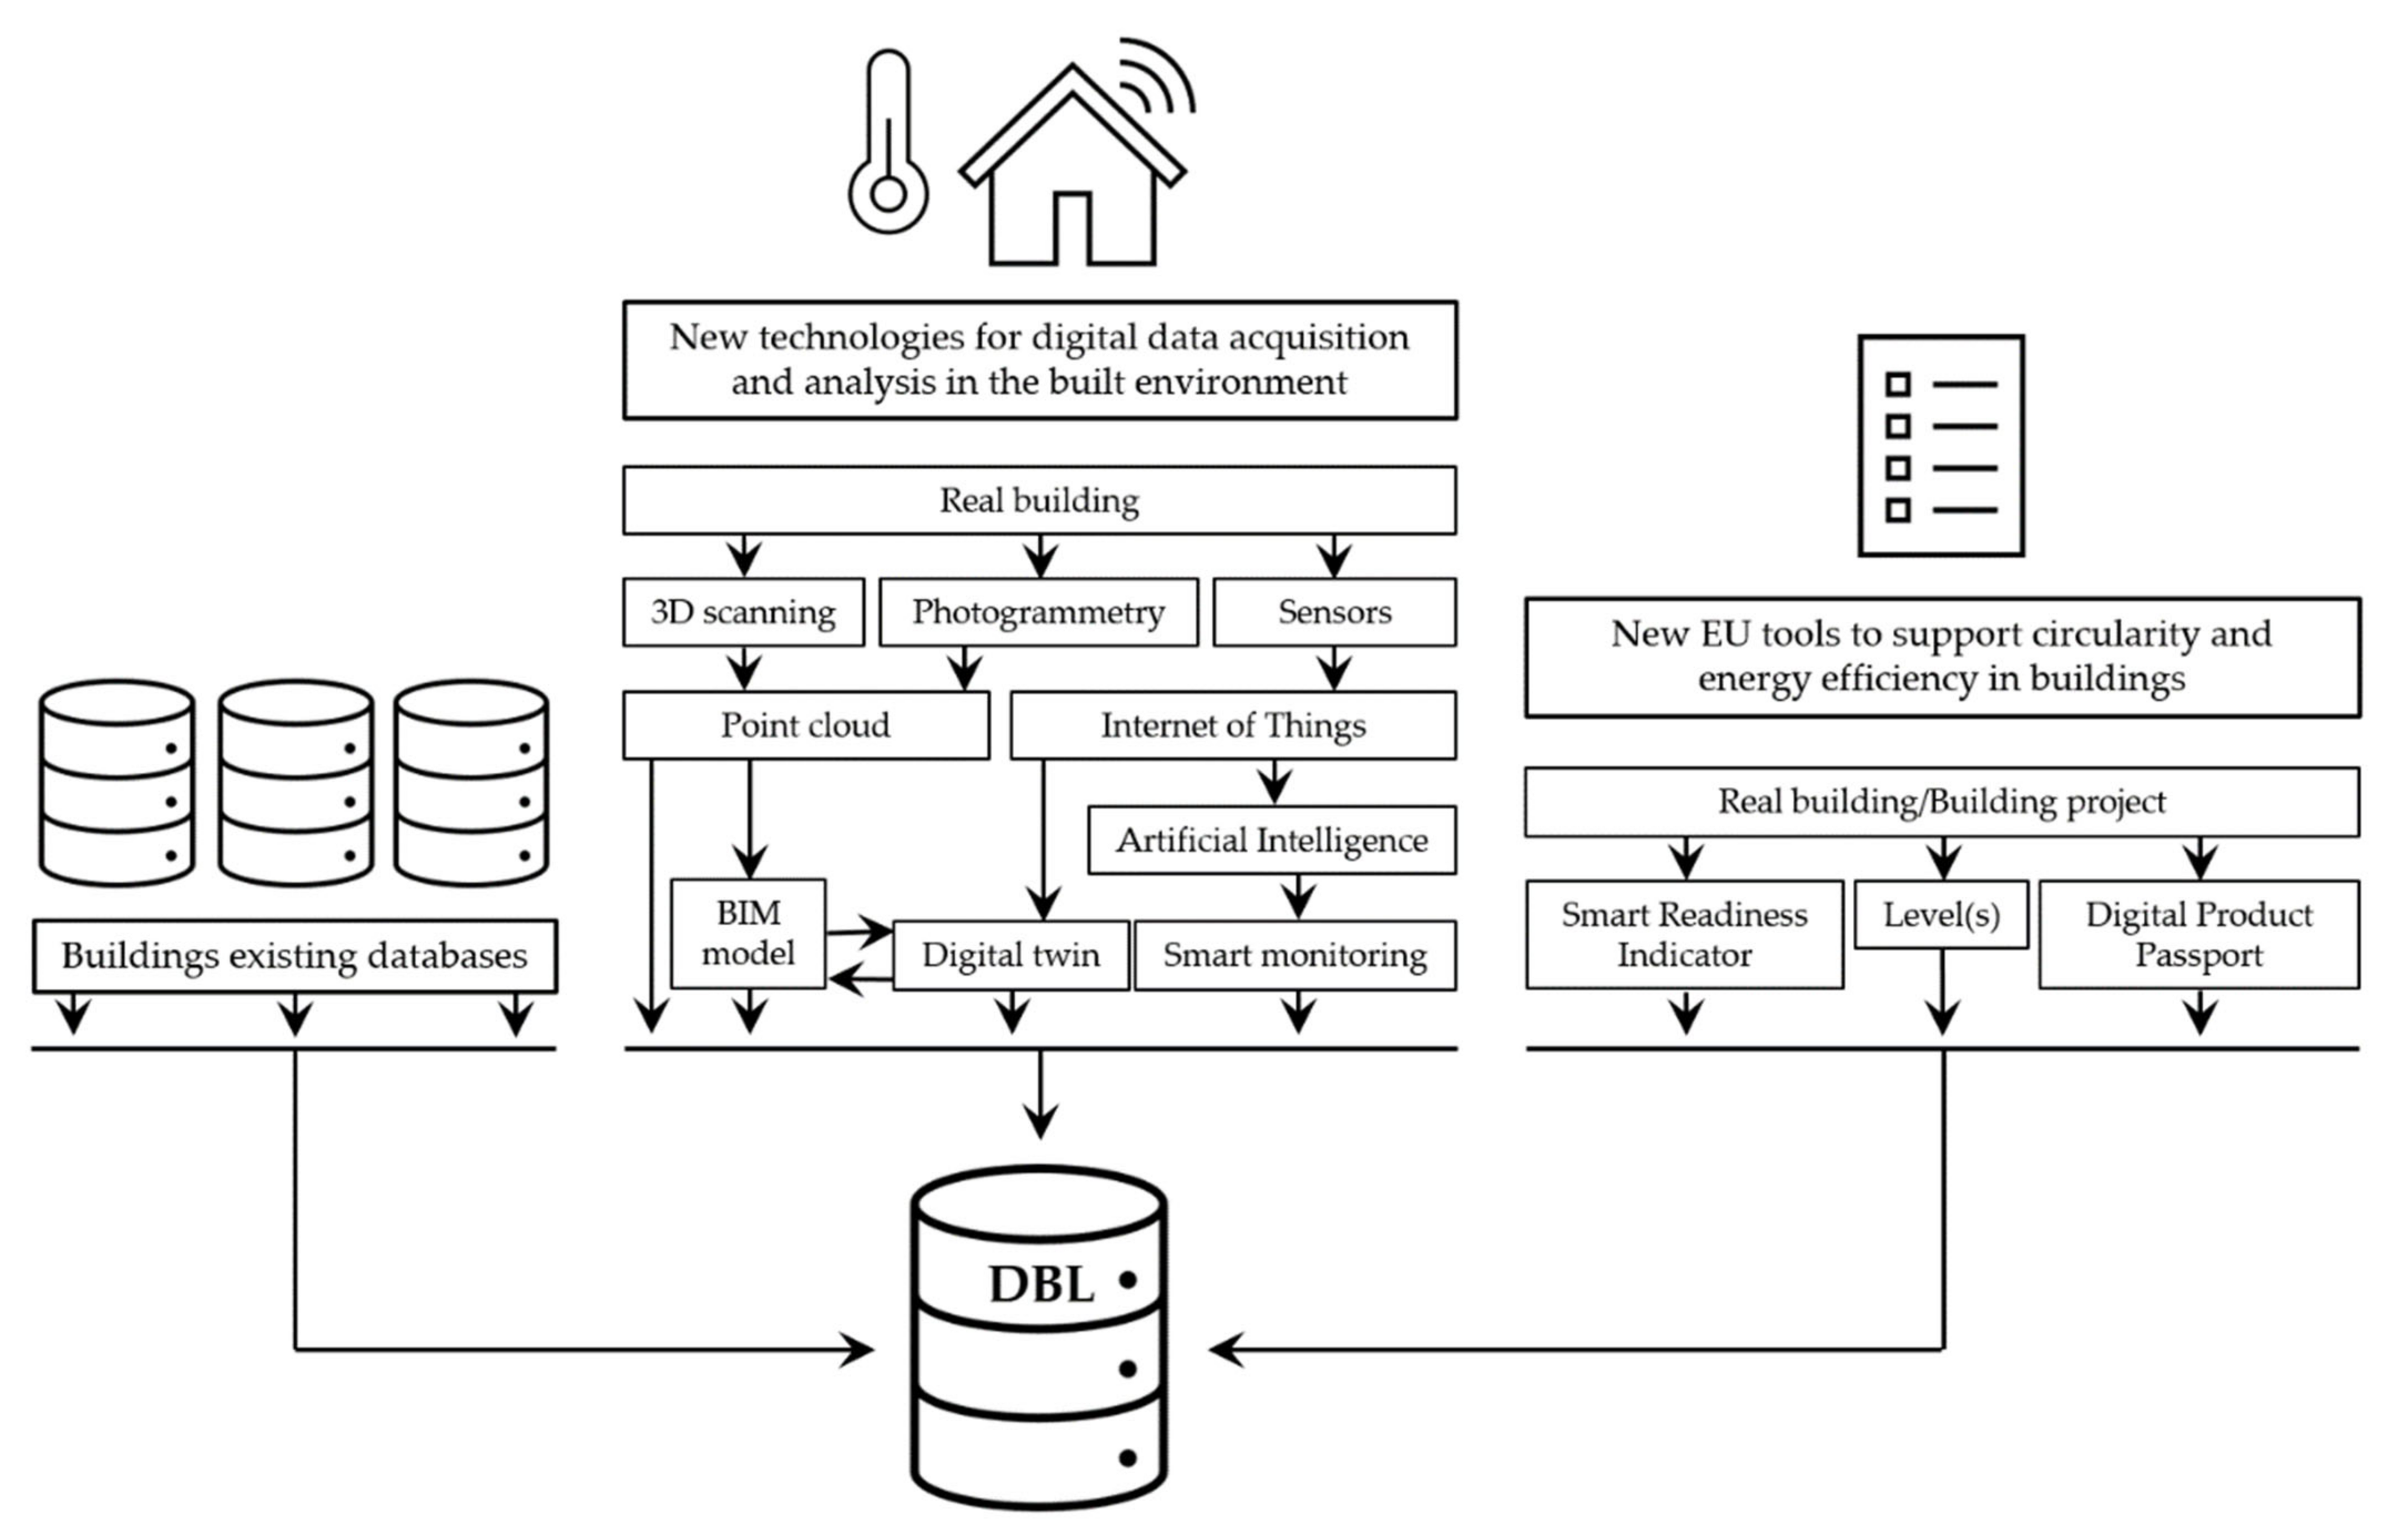
Interoperability is defined by the Institute of Electrical and Electronics Engineers (IEEE) as ‘the ability of two or more systems or components to exchange information and to use the information that has been exchanged’. The DBL is understood as a building related information repository fed with data from different existing and new sources. To fulfil this function, it is essential that all of the data sources are interoperable, so they can interact with each other, and that all of the data formats are compatible.
Figure 2 shows the inputs of the DBL from existing and new data sources.
The interaction among existing databases (such as cadastres and land registries) and the DBL was analysed for two case studies by Gómez et al. [
10], concluding that nowadays essential existing data sources are far from being fully interoperable, which makes them unsuitable for the DBL.
Regarding new data sources, such as new technologies, a new dimension of interoperability needs to be considered. It is not only necessary to guarantee that the new sources can communicate with the DBL, but also with each other. Based on this, in this paper the concept of the DBL interoperability is defined as the ability of data sources to exchange information with each other and with the DBL.
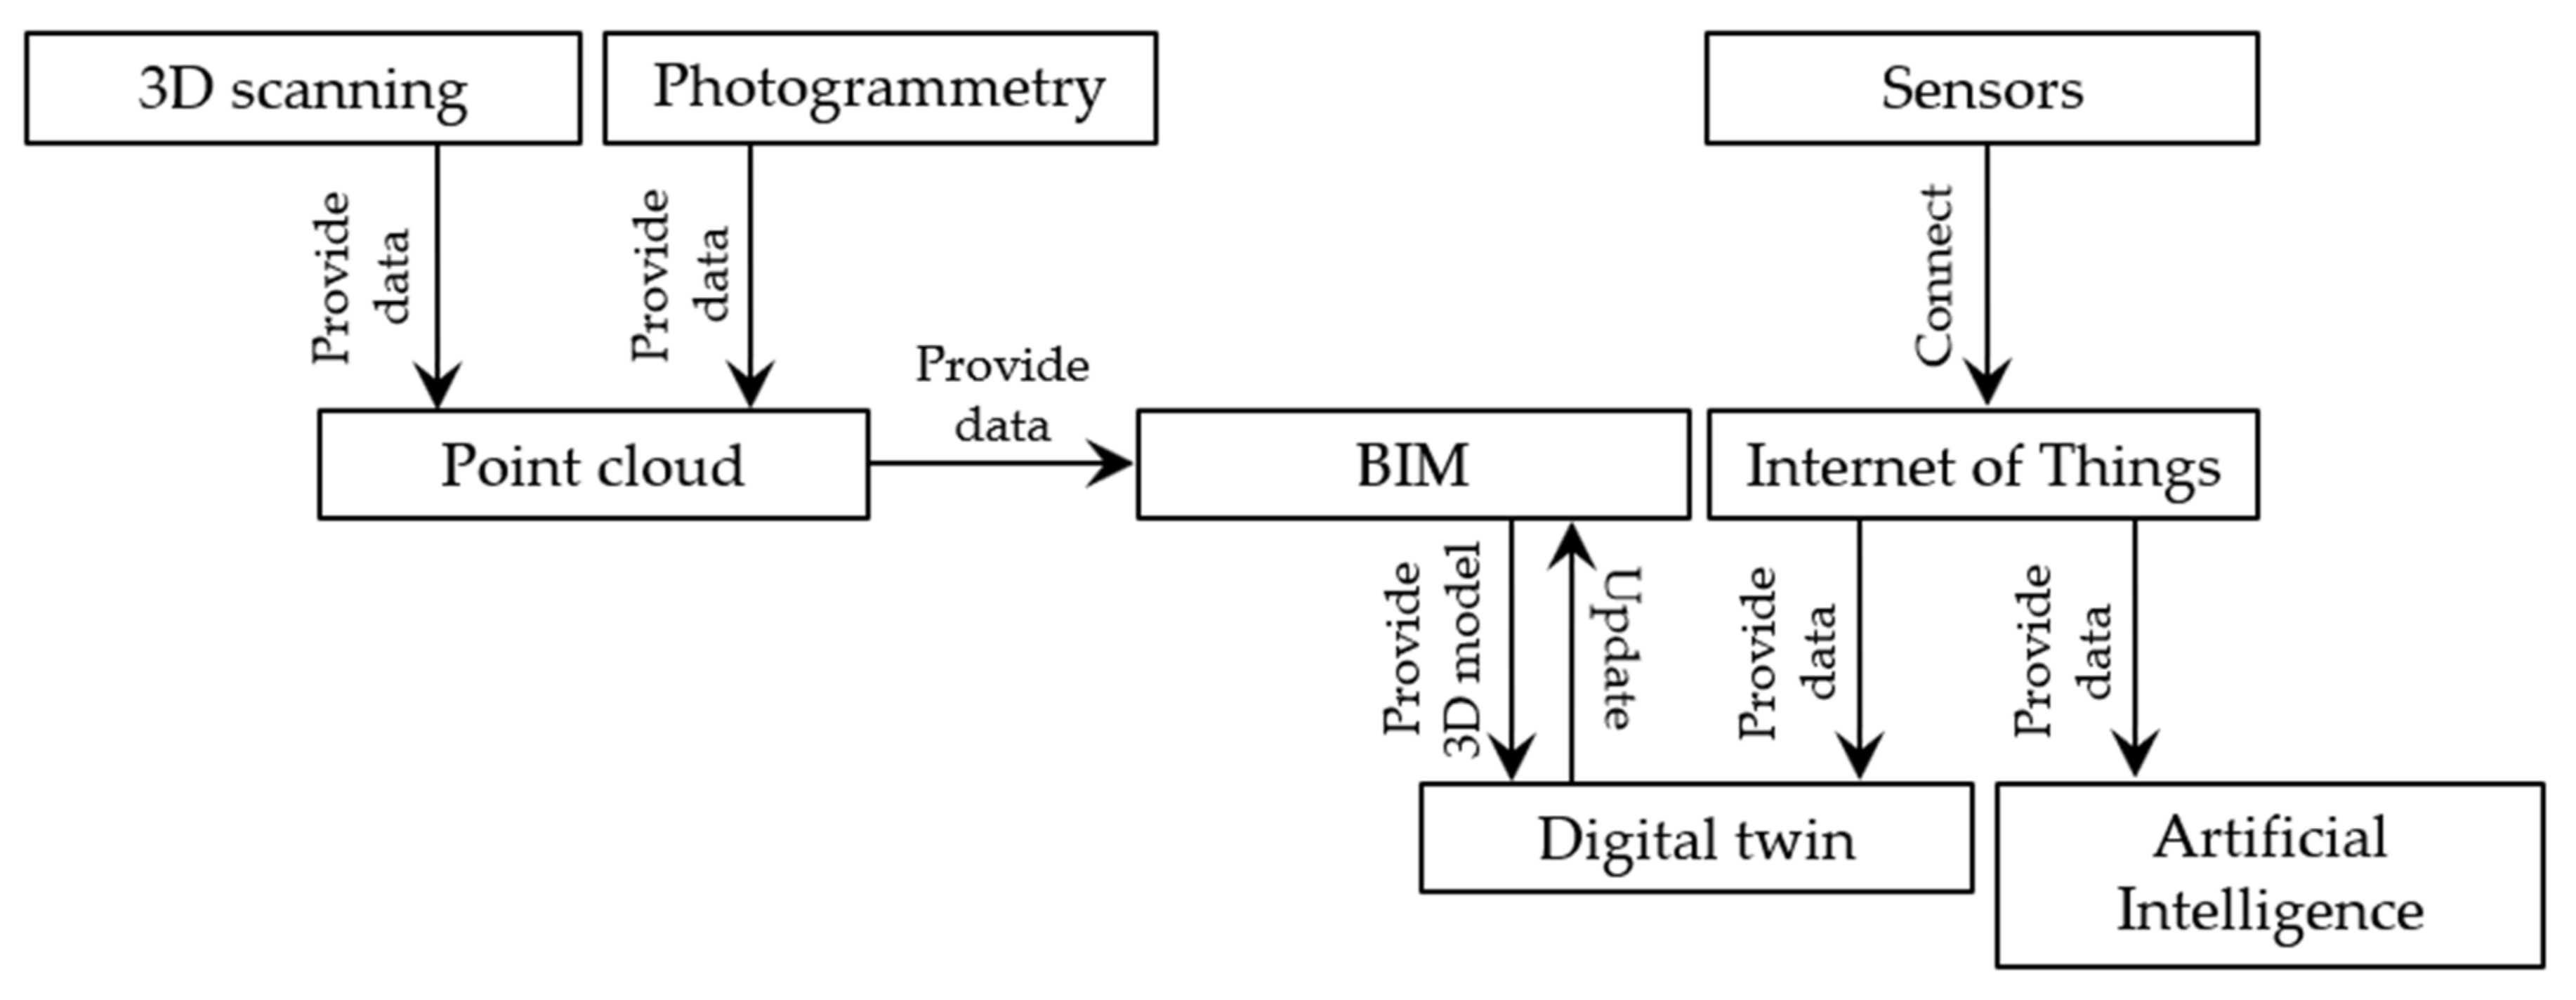
This is especially relevant for new technologies for digital data acquisition and analysis in the built environment, where different technologies and tools, such as sensors, BIM models, digital twins or point clouds, need to be able to interchange data so their contribution is maximised. The interaction among these new technologies is explored in
Figure 3, where data flows among the tools and their functions are displayed.
Nowadays, interoperability among most of these technologies is mostly solved since several data formats are available and most of them are compatible with the most popular software used to work with them, such as ArchiCAD or Autodesk ReCap and Revit. This is the case of .e57, .las, .rcs, or .csv formats for point cloud processing, or IFC (with its variants, such as IFCxml), which is based on ISO 16739-1:2018, for BIM models. Additionally, software for the creation of building’s digital twins has emerged more recently [
50]. This is the case of Project Dasher, which is an ongoing Autodesk Research project, or of Ecodomus software by Siemens, which allows for the creation of BIM-based digital building twins using data from point clouds or BIM models. It supports Revit/IFC, point clouds and CityGML files, but also JPGs, PDFs, and IoT systems inputs. One of its advantages is the possibility of exporting queries to Excel using object attributes for real-time reports. Additionally, Ecodomus web services include an API endpoint that enables access to all UI functionality for 3rd party integration [
58].
The case of new EU tools to support circularity and energy efficiency in buildings is different since they are not designed to exchange data with each other. However, it is recommendable to understand the way they operate to study their potential contribution to the DBL.
In this sense, regarding Level(s) EU framework, a calculator is available at the European portal named “Level(s)” [
59]. In this platform auditors and technicians can create a project, enter the required information based on the desired assessment level (1, 2 or 3) and obtain the evaluation of the building. The result is an assessment report that remains in the application in the form of tabs but is not yet interoperable or downloadable.
Regarding the Smart Readiness Indicator, a platform or calculation tool does not yet exist. However, in 2022, the SRI support team and the European Commission will assess the relevance and feasibility of developing an online SRI calculation tool. At this moment, to conduct an assessment, an SRI assessment package, consisting of a calculation Excel sheet and a practical guide in PDF, can be requested from the SRI support team. For this reason, currently the SRI cannot be considered an interoperable data source suitable for the DBL, since the assessment report is not stored in a common database. Nevertheless, if the SRI online calculation tool is finally implemented, this barrier may be solved.
Finally, regarding the Digital Product Passport, even though a digital infrastructure and software for IT implementation does not yet exist, some stakeholders agree that a platform with these characteristics will need to be interoperable and compatible as far as possible with other systems [
21].
Based on the above, a series of barriers for the connection among new technologies and EU tools and the DBL were identified:
Point clouds, BIM models, digital twins and data from monitoring are usually stored in private repositories, such as technicians’ and builders’ devices, and third-party access is not possible;
In the cases where some contents, such as BIM models, are requested by public administrations to obtain building licenses, these models are usually stored as they are delivered, but they are not entered in databases that allow access through a public API endpoint;
Digital twins have great potential to become a relevant data source for the DBL, but no studies have been found on how and in which format data can be extracted from digital twin software;
Level(s) calculator is implemented, however, further work should be undertaken to establish a common repository that enables data interchange;
SRI and DPP platforms are not yet implemented, so their interoperability features cannot yet be assessed.
To overcome the aforementioned barriers and increase interoperability among data sources, some guidelines are proposed:
It is desirable that all of the building related contents would be requested when applying for a building license and stored in public common repositories;
Those repositories should have an API endpoint that allows us to query data from them in order to be integrated with the DBL. Alternatively, the contents could be stored in the DBL own databases, allowing us to query directly from the DB;
The creation of new digital infrastructures and platforms, such as the incoming SRI and DPP platforms, should constitute an opportunity to integrate best practices on interoperability. Those best practices should include the incorporation of public API endpoints, and the use of homogenised and modern data interchange formats. Specifically, the use of standardised data models, such as FIWARE Smart Data Models, is highly recommended;
Since most of the data that the DBL will host are subject to data protection laws, the implementation of a token-based authentication system is highly recommended in the DBL, so depending on the users’ profile, different actions, such as visualisation, introduction, or modification, can be enabled.
6. Discussion
The data fields and interoperability features of potential new data sources for the DBL were analysed in this paper. The upcoming data sources considered were new technologies for digital data acquisition and building analysis, and new EU tools to support circularity and energy efficiency in buildings.
The research work allowed us to conclude that upcoming data sources have great potential to provide the Digital Building Logbook with relevant indicators on buildings when compared with existing data sources. Specifically, 87% of the relevant indicators could be gathered by linking the studied upcoming digital data sources to the DBL. On the one hand, for the case of the data categories ‘Construction information and materials’ and ‘Technical systems and Smart Readiness’ the contribution is even higher, allowing us to collect 100% and 95% of the relevant indicators identified, respectively. This contrasts with the 38% and 41% that could be collected through existing digital databases as identified in previous studies [
10]. On the other hand, the category in which the contribution of new data sources is less significant is “Financial information”, where only 43% of the relevant indicators can be collected. Nevertheless, considering only existing data sources, just 14% of the indicators could be gathered.
When comparing the potential of new technologies for data acquisition and analysis and EU frameworks to support circularity and energy efficiency, it was concluded that new technologies allow for the collection of a higher number of indicators. Whereas EU frameworks would provide the DBL with 49 relevant indicators, new technologies would provide it with 66. By categories, there are none where the potential of EU frameworks exceeds that of new technologies.
Despite all of the above, the combination of existing and upcoming data sources has great potential, since it would allow us to collect 88% of the relevant indicators.
Additionally, it must be considered that new indicators which are not included as relevant indicators currently could be gathered by using these tools. This is the case of buildings pathology analysis, what-if analysis, or lifecycle assessment, among others.
Regarding interoperability, two levels of data interchange were identified when studying upcoming digital data sources. On the one hand, interoperability among new technologies for digital data acquisition and analysis in the built environment, such as point clouds, BIM, sensors, and digital twins, needs to be considered. Data interchange among these technologies is mostly solved since current software and formats are compatible with each other. On the other hand, data interchange among new digital data sources and the DBL seems to be more difficult due to technical, legal, and infrastructural issues.
7. Conclusions and Future Research
The European Digital Building Logbook is called to contribute to storing and sharing data on the building stock, becoming a data gateway linked to existing and upcoming data sources. Collecting these data will help increase the sustainability of the built environment, contributing to achieving the decarbonisation objective imposed by the European Commission.
In this paper, upcoming digital data sources—new technologies for digital data acquisition and analysis in the built environment and new EU tools to support circularity and energy efficiency in buildings—to be linked to the Digital Building Logbook were identified and analysed according to two parameters: the indicators that they will allow to be collected and their interoperability features. The results showed that these upcoming data sources have a great potential to provide the Digital Building Logbook with data on buildings. Specifically, the contribution of new technologies for digital data acquisition and analysis is highly desirable since they allow for the collection of a significant number of relevant indicators (87%). However, for these sources to be linked to the DBL, it is necessary to solve important barriers in terms of interoperability.
This work presents the limitation that the EU tools that were considered are very recent. Therefore, the available information about them is not fully consolidated, since, for example, the SRI and the DPP are not yet a reality. Additionally, new technologies for digital data acquisition and analysis are highly conditioned by the use that technicians make of them; this means that these tools may have a very high potential that may not be fully exploited. Another aspect that must be considered is that the research on indicators of this paper is based on previous research that had the limitation of having been conducted in only two regions, one in Spain and one in Italy, whose conclusions cannot be extrapolated to the whole European Union. This work, which arises at a time of high uncertainty regarding the DBL, is intended to serve as a first analysis to identify the technologies that could contribute to collect data for the DBL. This preliminary study will be accompanied in the future by a practical case study that will allow us to apply, evaluate, and refine the results and conclusions of the research. Furthermore, future research will focus on rethinking the set of relevant indicators for the Digital Building Logbook, based on the existing literature and DBL models, but also on new approaches, such as the assessment of the progress of decarbonisation, the information required for the design of a renovation roadmap or lifecycle assessment. Additionally, further steps to solve interoperability issues will be taken in order to determine how the interconnection among existing and upcoming data sources and the Digital Building Logbook can be carried out.
Author Contributions
Conceptualisation, M.G.-G. and B.L.-M.; methodology, M.G.-G., B.L.-M. and A.E.-F.; validation, B.L.-M. and A.E.-F.; investigation, M.G.-G.; resources, B.L.-M.; data curation, M.G.-G.; writing—original draft preparation, M.G.-G.; writing—review and editing, B.L.-M. and A.E.-F.; visualization, M.G.-G.; supervision, B.L.-M. and A.E.-F.; project administration, B.L.-M.; funding acquisition, M.G.-G., B.L.-M. and A.E.-F. All authors have read and agreed to the published version of the manuscript.
Funding
This research was funded by the Ministry of Science and Innovation of Spain, grant number PID2019-104871RB-C21/AEI/10.13039/501100011033, and the Gobierno de Aragón, grant number T37_20R: Grupo de Investigación en Arquitectura. The APC was funded by the University of the Basque Country: best paper award in the International Conference on Energy Efficiency and Sustainability in Architecture and Urban Planning (EESAP 13).
Institutional Review Board Statement
Not applicable.
Informed Consent Statement
Not applicable.
Data Availability Statement
Not applicable.
Acknowledgments
We thank Alberto Mur López for the discussions on technical issues on data interoperability and monitoring systems.
Conflicts of Interest
The authors declare no conflict of interest. The funders had no role in the design of the study; in the collection, analyses, or interpretation of data; in the writing of the manuscript; or in the decision to publish the results.
Abbreviations
| AI | Artificial Intelligence |
| ALS | Airborne Laser Scanner |
| BEPS | Building Energy Performance Simulation |
| BIM | Building Information Modelling |
| DB | Database |
| DBL | Digital Building Logbook |
| EC | European Commission |
| EPC | Energy Performance Certificate |
| GHG | Greenhouse Gas |
| IEEE | Institute of Electrical and Electronics Engineers |
| IoT | Internet of Things |
| ITE | Inspección Técnica de los Edificios |
| LiDAR | Laser Imaging Detection and Ranging |
| MS | Member States |
| RRF | Recovery and Resilience Facility |
| TLS | Terrestrial Laser Scanner |
Appendix A
The following acronyms are used:
Y,v: a feature/indicator exists/is collected and a value is given.
Y,-: a feature/indicator exists/is collected but a value is not given.
S,v: a similar feature/indicator exists/is collected and a value is given.
S,-: a similar feature/indicator exists/is collected but a value is not given.
P,v: it is likely this feature/indicator exists/is collected and a value is given.
P,-: it is likely this feature/indicator exists/is collected but a value is not given.
Table A1.
Category 1: General and administrative information.
Table A1.
Category 1: General and administrative information.
| Cat. | Indicator | Existing Digital Sources in Spain [9] | SRI | Level(s) | Digital Product Passport | Point Cloud/3D Scanning | Smart Monitoring | Digital Twins |
|---|
| General and administrative information | Cadastral reference | Y,v | - | - | - | - | - | P,v |
| Property ID (CRU/IDUFIR) | Y,v | - | - | - | - | - | P,v |
| Owner type (public/private) | Y,v | - | Y,v | - | - | - | - |
| Tenancy agreement | - | - | - | - | - | - | - |
| Insurance documents | - | - | - | - | - | - | - |
| Utilities contract | - | - | - | - | - | - | - |
| Location | Y,v | Y,v | Y,v | - | - | - | Y,v |
| Geo Coordinate | Y,v | - | - | - | Y,v | Y,v | Y,v |
| Climatic zone | - | Y,v | Y,v | - | - | - | P,v |
| Heating degree days | - | - | Y,v | - | - | - | - |
| Soil/terrain (urban/rural) | Y,v | - | - | - | - | - | - |
| Main use | Y,v | Y,v | Y,v | - | - | - | Y,v |
| Type of building | Y,v | Y,v | Y,v | - | - | - | Y,v |
| Number of occupants | - | - | Y,v | - | - | Y,v | Y,v |
| User profile/behavioural insights | - | - | S | - | - | Y,v | Y,v |
| Built area (total and by dwelling) | Y,v | Y,v | Y,v | - | - | - | Y,v |
| Heated/cooled floor area | - | - | - | - | - | - | Y,v |
| Heated/cooled volume | - | - | - | - | - | - | Y,v |
| Number of floors | Y,v | - | - | - | - | - | Y,v |
| Year of construction | Y,v | Y,v | Y,v | - | - | - | Y,v |
| Accessibility | - | - | - | - | - | - | Y,v |
| Geometry (plans) | - | - | - | - | Y,v | - | Y,v |
| BIM, twins, etc. | - | - | - | - | - | - | Y,v |
| Urban licenses | - | - | - | - | - | - | - |
Table A2.
Category 2: Construction information and materials.
Table A2.
Category 2: Construction information and materials.
| Cat. | Indicator | Existing Digital Sources in Spain [9] | SRI | Level(s) | Digital Product Passport | Point Cloud/3D Scanning | Smart Monitoring | Digital Twins |
|---|
| Construction information and materials | Façades composition | Y,v | - | Y,v | - | - | - | Y,v |
| Façades U-value | Y,v | - | - | - | - | - | Y,v |
| Roofs U-value | Y,v | - | - | - | - | - | Y,v |
| Floors U-value | Y,v | - | - | - | - | - | Y,v |
| Shutter box | - | - | - | - | - | - | Y,v |
| Solar protections | Y,v | - | - | - | - | - | Y,v |
| Windows frame U-value | Y,v | - | - | - | - | - | Y,v |
| Windows glazing U-value | Y,v | - | - | - | - | - | Y,v |
| Doors description | - | - | Y,v | - | - | - | Y,v |
| Thermal bridges description | Y,v | - | - | - | - | - | Y,v |
| Material X type | - | - | Y,v | Y,v | - | - | Y,v |
| Material X location | - | - | - | Y,v | - | - | Y,v |
| Material X volume | - | - | - | Y,v | - | - | Y,v |
| Material X weight | - | - | Y,v | Y,v | - | - | P,v |
| Material X embodied carbon | - | - | S,v | Y,v | - | - | P,v |
| Material X life span | - | - | Y,v | Y,v | - | - | P,v |
| Material X fire resistance class | - | - | - | Y,v | - | - | P,v |
| Material X waste category | - | - | Y,v | Y,v | - | - | P,v |
| Material X certificate | - | - | - | Y,v | - | - | P,v |
| Material X chemical declaration | - | - | - | Y,v | - | - | P,v |
| Material X Global Trade Item Number | - | - | - | Y,v | - | - | P,v |
Table A3.
Category 3: Technical systems and Smart Readiness.
Table A3.
Category 3: Technical systems and Smart Readiness.
| Cat. | Indicator | Existing Digital Sources in Spain [9] | SRI | Level(s) | Digital Product Passport | Point Cloud/3D Scanning | Smart Monitoring | Digital Twins |
|---|
| Technical systems and Smart Readiness | DHW system description | Y,v | - | Y,v | - | - | - | Y,v |
| DHW system energetic vector | Y,v | - | Y,v | - | - | - | Y,v |
| Heating system description | Y,v | - | Y,v | - | - | - | Y,v |
| Heating system year of installation | - | - | - | - | - | - | Y,v |
| Heating system energetic vector | Y,v | - | Y,v | - | - | - | Y,v |
| Heating system efficiency | Y,v | Y,v | Y,v | - | - | Y,v | Y,v |
| Cooling system description | Y,v | - | Y,v | - | - | - | Y,v |
| Cooling system energetic vector | Y,v | - | Y,v | - | - | - | Y,v |
| Cooling system efficiency | Y,v | Y,v | - | - | - | Y,v | Y,v |
| Mechanical ventilation description | - | - | Y,v | - | - | - | Y,v |
| Mechanical ventilation efficiency | - | Y,v | Y,v | - | - | Y,v | Y,v |
| Lighting description | - | - | Y,v | - | - | - | Y |
| Renewable energy production | Y,v | Y,- | S,v | - | - | Y,v | Y,v |
| District heating access | - | - | Y,- | - | - | - | Y |
| Storage of locally generated energy | - | Y,- | - | - | - | Y,v | Y,v |
| Control system for heating and cooling | - | Y,- | - | - | - | - | Y,v |
| Emission control for TABS | - | Y,- | - | - | - | - | Y |
| EV Charging points features | - | Y,v | - | - | - | - | Y,v |
| Smart Readiness Indicator (SRI) | - | Y,v | - | - | - | - | - |
| Smart district indicators | - | - | - | - | - | - | - |
| Climate resilience potential | - | - | Y,- | - | - | - | - |
| Demand response potential | - | - | - | - | - | Y,- | Y,- |
Table A4.
Category 4: Energy efficiency, operation and use.
Table A4.
Category 4: Energy efficiency, operation and use.
| Cat. | Indicator | Existing Digital Sources in Spain [9] | SRI | Level(s) | Digital Product Passport | Point Cloud/3D Scanning | Smart Monitoring | Digital Twins |
|---|
| Energy efficiency, operation and use | Energy label | - | - | - | - | - | - | P,v |
| Energy demand by use | Y,v | - | Y,v | - | - | - | Y,v |
| Energy consumption by use | Y,v | - | Y,v | - | - | Y,v | Y,v |
| Solar potential | - | - | - | - | - | - | P,v |
| Conservation and maintenance plan | - | - | - | - | - | Y,v | Y,v |
| Maintenance and service contracts | - | - | - | - | - | - | - |
| Safety manual | - | - | - | - | - | - | - |
| Tailored renovation recommendations | Y,v | - | S,v | - | - | - | - |
Table A5.
Category 5: Financial information.
Table A5.
Category 5: Financial information.
| Cat. | Indicator | Existing Digital Sources in Spain [9] | SRI | Level(s) | Digital Product Passport | Point Cloud/3D Scanning | Smart Monitoring | Digital Twins |
|---|
| Financial information | Annual property tax | - | - | - | - | - | - | - |
| Property value | Y,v | - | - | - | - | - | - |
| Valuation information | - | - | - | - | - | - | - |
| Property yield | - | - | - | - | - | - | - |
| Annual maintenance costs | - | - | Y,v | - | - | - | Y,v |
| Annual electricity cost | - | - | Y,v | - | - | Y,v | Y,v |
| Annual water cost | - | - | Y,v | - | - | Y,v | Y,v |
Table A6.
Category 6: Conservation status and pathologies.
Table A6.
Category 6: Conservation status and pathologies.
| Cat. | Indicator | Existing Digital Sources in Spain [9] | SRI | Level(s) | Digital Product Passport | Point Cloud/3D Scanning | Smart Monitoring | Digital Twins |
|---|
| Conservation status and pathologies | Expected lifetime | - | - | Y,v | - | - | - | Y,v |
References
- Hübler, M.; Löschel, A. The EU Decarbonisation Roadmap 2050—What way to walk? Energy Policy 2013, 55, 190–207. [Google Scholar] [CrossRef] [Green Version]
- European Commission. Regulation (EU) 2021/1119 of the European Parliament and of the Council of 30 June 2021 Establishing the Framework for Achieving Climate Neutrality and Amending Regulations (EC) No 401/2009 and (EU) 2018/1999 (‘European Climate Law’). Available online: https://eur-lex.europa.eu/legal-content/EN/TXT/?uri=CELEX:32021R1119 (accessed on 18 October 2022).
- European Commission. Proposal for a Directive of the European Parliament and of the Council on the Energy Performance of Buildings (Recast). Belgium. 2021. Available online: https://eur-lex.europa.eu/resource.html?uri=cellar:c51fe6d1-5da2-11ec-9c6c-01aa75ed71a1.0001.02/DOC_1&format=PDF (accessed on 17 May 2022).
- Gómez-Gil, M. Economic incentives to boost building renovation in Portugal. CiTET 2022, 54, 483–498. [Google Scholar] [CrossRef]
- Gómez-Gil, M.; López-Mesa, B.; Espinosa-Fernández, A. European Digital Building Logbook: Definition of its functionalities to maximize its potential. In Proceedings of the 13th International Conference on Energy Efficiency and Sustainability in Architecture and Urbanism (EESAP 13), San Sebastian, Spain, 5 October 2022. [Google Scholar]
- European Commission and Directorate-General for Communication. Circular Economy Action Plan: For a Cleaner and More Competitive Europe. Available online: https://data.europa.eu/doi/10.2779/717149 (accessed on 9 September 2022).
- Gómez-Gil, M.; Espinosa-Fernández, A.; López-Mesa, B. Review and Analysis of Models for a European Digital Building Logbook. Energies 2022, 15, 1994. [Google Scholar] [CrossRef]
- Signorini, M.; Spagnolo, S.L.; Dejaco, M.C. A Digital Logbook as an Interactive Tool to Fulfil Service Companies’ Needs and Requirements in Building Renovations. IOP Conf. Ser. Mater. Sci. Eng. 2021, 1044, 012010. [Google Scholar] [CrossRef]
- Sesana, M.M.; Rivallain, M.; Salvalai, G. Overview of the available knowledge for the data model definition of a building renovation passport for non-residential buildings: The ALDREN project experience. Sustainability 2020, 12, 642. [Google Scholar] [CrossRef] [Green Version]
- Gómez-Gil, M.; Sesana, M.M.; Salvalai, G.; Espinosa-Fernández, A.; López-Mesa, B. The Digital Building Logbook as a gateway linked to existing national data sources: The cases of Spain and Italy. J. Build. Eng. 2022, 63, 105461. [Google Scholar] [CrossRef]
- Mêda, P.; Calvetti, D.; Hjelseth, E.; Sousa, H. Incremental Digital Twin Conceptualisations Targeting Data-Driven Circular Construction. Buildings 2021, 11, 554. [Google Scholar] [CrossRef]
- Manfren, M.; Tagliabue, M.C.; Re Cecconi, F.; Ricci, M. Long-Term Techno-Economic Performance Monitoring to Promote Built Environment Decarbonisation and Digital Transformation—A Case Study. Sustainability 2022, 14, 644. [Google Scholar] [CrossRef]
- Calvetti, D.; Mêda, P.; Gonçalves, M.C.; Sousa, H. Worker 4.0: The future of sensored construction sites. Buildings 2020, 10, 169. [Google Scholar] [CrossRef]
- European Parliament and Council of the European Union. Directive (EU) 2018/844 of the European Parliament and of the Council of 30 May 2018. Available online: https://eur-lex.europa.eu/legal-content/EN/TXT/PDF/?uri=CELEX:32018L0844&from=ES (accessed on 13 October 2022).
- VITO; Research to Market (R2M) Solution; Luxembourg Institute of Science and Technology (LIST); Smart Readiness Indicator (SRI). Training Slide Deck. 2022. Available online: https://energy.ec.europa.eu/system/files/2022-06/SRI%20training%20slide%20deck%20-%20Version%202%20-%20Jan%202022%20-%20updated.pdf (accessed on 29 October 2022).
- European Commission. Commission Implementing Regulation (EU) 2020/2156 of 14 October 2020 Detailing the Technical Modalities for the Effective Implementation of an Optional Common Union Scheme for Rating the Smart Readiness of Buildings. Available online: https://eur-lex.europa.eu/legal-content/EN/TXT/?uri=CELEX:32020R2156 (accessed on 6 October 2022).
- European Commission; Directorate-General for Energy; Verbeke, S.; Aerts, D.; Reynders, G.; Ma, Y.; Waide, P. Final Report on the Technical Support to the Development of a Smart Readiness Indicator for Buildings: Final Report; Publications Office of the European Union: Luxembourg, 2020. [Google Scholar] [CrossRef]
- European Commission; Directorate-General for Environment. Level(s): A Common Language for Building Assessment; Publications Office of the European Union: Luxembourg, 2021. [Google Scholar] [CrossRef]
- European Commission; Directorate-General for Environment. Level(s), What’s in it for Cities? Publications Office of the European Union: Luxembourg, 2022. [Google Scholar] [CrossRef]
- European Commission; Directorate-General for Environment. Level(s): Putting Whole Life Carbon Principles into Practice; Publications Office of the European Union: Luxembourg, 2021. [Google Scholar] [CrossRef]
- University of Cambridge Institute for Sustainability Leadership (CISL); The Wuppertal Institute. Digital Product Passport: The Ticket to Achieving a Climate Neutral and Circular European Economy? 2022. Available online: https://www.corporateleadersgroup.com/files/cisl_digital_products_passport_report_v6.pdf (accessed on 21 October 2022).
- Heidari, A.; Jafari Navimipour, N.; Unal, M. Applications of ML/DL in the management of smart cities and societies based on new trends in information technologies: A systematic literature review. Sustain. Cities Soc. 2022, 85, 104089. [Google Scholar] [CrossRef]
- Madaster Platform. Available online: https://madaster.com/ (accessed on 27 October 2022).
- Sesana, M.M.; Salvalai, G.; Brutti, D.; Mandin, C.; Wei, W. ALDREN: A methodological framework to support decision-making and investments in deep energy renovation of non-residential buildings. Buildings 2021, 11, 3. [Google Scholar] [CrossRef]
- Sesana, M.M.; Salvalai, G. A review on Building Renovation Passport: Potentialities and barriers on current initiatives. Energy Build. 2018, 173, 195–205. [Google Scholar] [CrossRef] [Green Version]
- Mêda, P.; Calvetti, D.; Kifokeris, D.; Kassem, M. A Process-Based Framework for Digital Building Logbooks. In Proceedings of the 2022 European Conference on Computing in Construction, Ixia, Rhodes, Greece, 24–26 July 2022. [Google Scholar]
- CORDIS iBRoad. Available online: https://cordis.europa.eu/project/id/754045 (accessed on 15 October 2022).
- iBRoad Project. Available online: https://ibroad-project.eu/ (accessed on 15 October 2022).
- CORDIS ALDREN. Available online: https://cordis.europa.eu/project/id/754159/es (accessed on 16 October 2022).
- ALDREN Project. Available online: https://aldren.eu/ (accessed on 16 October 2022).
- CORDIS X-Tendo. Available online: https://cordis.europa.eu/project/id/845958/es (accessed on 17 October 2022).
- X-Tendo Project. Available online: https://x-tendo.eu/ (accessed on 17 October 2022).
- European Commission; Executive Agency for Small and Medium-sized Enterprises; Dourlens-Quaranta, S.; Carbonari, G.; De Groote, M.; Borragán, G.; De Regel, S.; Toth, Z.; Volt, J.; Glicker, J.; et al. Study on the Development of a European Union Framework for Digital Building Logbooks; Final Report; Publications Office of the European Union: Luxembourg, 2021. [Google Scholar] [CrossRef]
- O’Donnell, J.; Truong-Hong, L.; Boyle, N.; Corry, E.; Cao, J.; Laefer, D.F. LiDAR point-cloud mapping of building façades for building energy performance simulation. Autom. Constr. 2019, 107, 102905. [Google Scholar] [CrossRef]
- Oliveros-Esco, J.; Gracia-Villa, L.; López-Mesa, B. 2D image-based crack monitoring: An affordable, sufficient and non-invasive technique for the democratization of preventive conservation of listed buildings. Herit. Sci. 2022, 10, 146. [Google Scholar] [CrossRef]
- El-Din Fawzy, H. 3D laser scanning and close-range photogrammetry for buildings documentation: A hybrid technique towards a better accuracy. Alex. Eng. J. 2019, 58, 1191–1204. [Google Scholar] [CrossRef]
- Altuntas, C.; Yildiz, F.; Scaioni, M. Laser Scanning and Data Integration for Three-Dimensional Digital Recording of Complex Historical Structures: The Case of Mevlana Museum. ISPRS Int. J. Geo-Inf. 2016, 5, 18. [Google Scholar] [CrossRef] [Green Version]
- Lucas Bonilla, M.; Muriel Delgado, B.; Montalbán Pozas, B. Implementing a monitoring system’s proposal for the improvement of public buildings. An. Edif. 2020, 6, 35–39. [Google Scholar] [CrossRef]
- Martínez, I.; Zalba, B.; Trillo-Lado, R.; Blanco, T.; Cambra, D.; Casas, R. Internet of Things (IoT) as Sustainable Development Goals (SDG) Enabling Technology towards Smart Readiness Indicators (SRI) for University Buildings. Sustainability 2021, 13, 7647. [Google Scholar] [CrossRef]
- Baghalzadeh Shishehgarkhaneh, M.; Keivani, A.; Moehler, R.C.; Jelodari, N.; Roshdi Laleh, S. Internet of Things (IoT), Building Information Modeling (BIM), and Digital Twin (DT) in Construction Industry: A Review, Bibliometric, and Network Analysis. Buildings 2022, 12, 1503. [Google Scholar] [CrossRef]
- Määttä, K.; Rehu, J.; Tanner, H.; Klaus, K. Building Intelligence—Home operating system for smart monitoring and control. In Proceedings of the 2017 IEEE International Conference on Electro Information Technology (EIT), Lincoln, NE, USA, 14 May 2017. [Google Scholar] [CrossRef]
- Aguilar, J.; Garces-Jimenez, A.; R-Moreno, M.D.; García, R. A systematic literature review on the use of artificial intelligence in energy self-management in smart buildings. Renew. Sustain. Energy Rev. 2021, 151, 111530. [Google Scholar] [CrossRef]
- European Construction Sector Observatory. Digitalisation in the Construction Sector. Analytical Report. 2021. Available online: https://ec.europa.eu/docsroom/documents/45547 (accessed on 28 October 2022).
- Pedral Sampaio, R.; Aguiar Costa, A.; Flores-Colen, I. A Systematic Review of Artificial Intelligence Applied to Facility Management in the Building Information Modeling Context and Future Research Directions. Buildings 2022, 12, 1939. [Google Scholar] [CrossRef]
- Baghalzadeh Shishehgarkhaneh, M.; Azizi, M.; Basiri, M.; Moehler, R.C. BIM-Based Resource Tradeoff in Project Scheduling Using Fire Hawk Optimizer (FHO). Buildings 2022, 12, 1472. [Google Scholar] [CrossRef]
- Safikhani, S.; Keller, S.; Schweiger, G.; Pirker, J. Immersive virtual reality for extending the potential of building information modeling in architecture, engineering, and construction sector: Systematic review. Int. J. Digit. Earth 2022, 15, 503–526. [Google Scholar] [CrossRef]
- Matarneh, S.; Elghaish, F.; Rahimian, F.P.; Dawood, N.; Edwards, D. Automated and interconnected facility management system: An open IFC cloud-based BIM solution. Automat. Constr. 2022, 143, 104569. [Google Scholar] [CrossRef]
- Qiuchen, L.; Parlikad, A.K.; Woodall, P.; Ranasinghe, G.D.; Xie, X.; Liang, Z.; Konstantinou, E.; Heaton, J.; Schooling, J. Developing a dynamic digital twin at building and city levels: A case study of the West Cambridge campus. J. Manag. Eng. 2019, 36, 05020004. [Google Scholar] [CrossRef]
- Sepasgozar, S.M.E. Differentiating Digital Twin from Digital Shadow: Elucidating a Paradigm Shift to Expedite a Smart, Sustainable Built Environment. Buildings 2021, 11, 151. [Google Scholar] [CrossRef]
- Haghighat Khajavi, S.; Hossein Motlagh, N.; Jaribion, A.; Werner, L.C.; Holmström, J. Digital Twin: Vision, Benefits, Boundaries, and Creation for Buildings. IEEE Access 2019, 7, 147406–147419. [Google Scholar] [CrossRef]
- Shahzad, M.; Tariq Shafiq, M.; Douglas, D.; Kassem, M. Digital Twins in Built Environments: An Investigation of the Characteristics, Applications, and Challenges. Buildings 2022, 12, 120. [Google Scholar] [CrossRef]
- International Resource Panel. Global Resource Outlook 2019: Natural Resources for the Future We Want. Nairobi: United Nations Environment Programme. Available online: https://wedocs.unep.org/handle/20.500.11822/27517;jsessionid=0222A765436634E804BABD6F5558116C (accessed on 21 November 2022).
- Ellen MacArthur Foundation. Towards the Circular Economy. Economic and Business Rationale for an Accelerated Transition. 2013. Available online: https://ellenmacarthurfoundation.org/towards-the-circular-economy-vol-1-an-economic-and-business-rationale-for-an (accessed on 21 November 2022).
- European Commission. The European Green Deal. Available online: https://eur-lex.europa.eu/legal-content/ES/TXT/?qid=1576150542719&uri=COM%3A2019%3A640%3AFIN (accessed on 14 September 2022).
- European Commission. Proposal for a Regulation Laying down Harmonised Conditions for the Marketing of Construction Products, Amending Regulation (EU) 2019/1020 and Repealing Regulation (EU) 305/2011. Available online: https://ec.europa.eu/docsroom/documents/49315 (accessed on 13 October 2022).
- Adisorn, T.; Tholen, L.; Götz, T. Towards a Digital Product Passport Fit for Contributing to a Circular Economy. Energies 2021, 14, 2289. [Google Scholar] [CrossRef]
- Donetskaya, J.V.; Gatchin, Y.A. Development of Requirements for The Content of a Digital Passport and Design Solutions. J. Phys. Conf. Ser. 2021, 1828, 012102. [Google Scholar] [CrossRef]
- Ecodomus Software. Available online: https://new.siemens.com/global/en/products/buildings/digital-building-lifecycle/ecodomus-software.html (accessed on 29 October 2022).
- Level(s) Calculator. Available online: https://environment.ec.europa.eu/topics/circular-economy/levels_en (accessed on 29 October 2022).
| Publisher’s Note: MDPI stays neutral with regard to jurisdictional claims in published maps and institutional affiliations. |
© 2022 by the authors. Licensee MDPI, Basel, Switzerland. This article is an open access article distributed under the terms and conditions of the Creative Commons Attribution (CC BY) license (https://creativecommons.org/licenses/by/4.0/).


