Article

Fracture Behavior of Headed Studs: Ductile Fracture of Cold Heading Steel ML15

School of Civil Engineering, Northeast Forestry University, Harbin 150040, China
*
Author to whom correspondence should be addressed.
Buildings 2022, 12(12), 2128; https://doi.org/10.3390/buildings12122128
Submission received: 14 November 2022 / Accepted: 25 November 2022 / Published: 4 December 2022
(This article belongs to the Special Issue Advanced Research on Building Materials Performance)

Abstract

:
In this paper, the fracture behavior of ML15 cold heading steel was investigated based on the ductile fracture theory. Smooth and notched bar, flat grooved and tensile–shear mixed flat plate specimens were designed, and tensile tests were carried out to examine the fracture mechanism of ML15. The micromechanical characteristics of the fracture surfaces of different specimens were studied by performing scanning electron microscopy. The results showed that the specimens under different stress states showed different micro fracture morphologies. The Rice–Tracey model and Bai–Wierzbicki model were calibrated using test results. Based on the calibrated fracture locus, a finite element model is developed and compared to the test results, which confirms the feasibility of the calibrated fracture locus for metal failure analysis.

1. Introduction

Cold heading is widely used in the production of metal parts due to its advantages of normal temperature fabrication, mechanical property improvement, high surface finish, and high accuracy, as well as material usability and productivity improvement. ML15 cold heading steel is a stud material specified in Chinese steel–concrete composite beams. As they have good mechanical and construction performances and high reliability, studs have become the most widely used connectors in the steel–concrete composite beam. They are affected by concrete via effects that include bending, shearing and lift. Added to that, the reinforcement in the concrete has an impact on the studs. Analyzing the studs’ fracture locus under complex stress states reveals a point of great interest as it helps predict the failure of the steel–concrete composite structures and prevent disaster.
Fracture is an important failure mode in steel structures and has been extensively studied and analyzed. In recent years, researchers have developed micromechanical models, based on microfracture and continuous damage mechanics, to allow the analysis of material fractures under different stress states. It was found that stress triaxiality is an important parameter affecting ductile fractures in metal materials [1]. Additionally, Rice and Tracey [2] proposed a 2D fracture model that would consider the effects of stress triaxiality. They believed that hole growth was a monotonic decreasing function of stress triaxiality. Then, based on the void growth theory, researchers proposed a series of metal fracture models, such as the VGM model [3], the SMCs model [3] and the Johnson-Cook model [4]. In 2004, Bao [5,6] proved that it was impossible to accurately describe the metal materials fracture loci under different stress states referring only to stress triaxiality. Xue and Wierzbicki [7] analyzed Bao’s test results and found out that the third invariants of the stress deviator, J3, was also an important variable affecting material fracture strain, and proposed the Xue–Wierzbicki (X-W) 3D fracture model. Bai and Wierzbicki proposed B–W model [8] and modified the Mohr–Coulomb (MMC) criterion [9]. Lou [10] proposed a fracture criterion which considers the effect of the maximum shear stress and stress triaxiality. Mohr and Marcadet [11] proposed a fracture criterion and verified it by various types of high-strength steels. Hu [12] proposed a fracture criterion for the metal plasticity formed questions. Mu [13] developed a ductile fracture model to forecast ductile damage accumulation over each identified strain path. Cerik [14], Cho [15], Peng [16], Panwitt [17], Li [18], Yan [19] and Wilson-Heid [20] investigated the fracture loci of different materials.
After presenting some previous results concerning the failure of metal structures, this study considers the fracture locus of ML15 cold heading steel when exposed to complex stress conditions. This metal is widely used in studs of steel–concrete composite structures in China. Zhang [21] and Alsharari [22] studied the mechanical property of studs, but did not investigate the ductile failure of studs. To do so, tensile tests of smooth and notched bars, flat grooved and tensile–shear flat specimens were tested. The micromechanical characteristics of fracture surfaces of different specimens were studied by scanning electron microscopy. Rice–Tracey and Bai–Wierzbicki models were calibrated after applying the test results. Based on the calibrated fracture locus, a finite element model was obtained and compared to the test results to study the feasibility of using the calibrated fracture locus for metal failure analysis.

2. Characteristics of Stress States

The ductility of structural steels under multiaxial stress is measured using the equivalent plastic strain ε - f . Under monotonic loading, the fracture strain ε - f of steel is expressed in Equation (1), where ε 1 , ε 2 and ε 3 represent, respectively, the plastic principal strains in three directions.
ε ¯ f = 2 3 ( ε 1 2 + ε 2 2 + ε 3 2 )
Stress triaxiality η is a parameter related to the fracture loci of materials to characterize the stress state of materials [1,2,4]. This latter is defined by Equations (2)–(4), where σ m and σ ¯ represent the hydrostatic stress and von Mises equivalent stress, respectively, and σ 1 , σ 2 and σ 3 are three principal stresses, where η = 0 corresponds to pure shear, η = 1/3 corresponds to uniaxial tension, and η = −1/3 corresponds to uniaxial compression. Experimental study of tensile fracture of round bars showed that this parameter has a huge impact on the fracture strain and mode [1,2,4,23]. While the pressure increases, the fracture mechanism changes from micropore growth to shear slip as the physical meaning of stress triaxiality specifies that the stress state of a material is sensitive to fracture.
η = σ m σ ¯ ,
σ m = 1 3 ( σ 1 + σ 2 + σ 3 ) ,
σ ¯ = 1 2 [ ( σ 1 σ 2 ) 2 + ( σ 1 σ 3 ) 2 + ( σ 2 σ 3 ) 2 ] .
Recent studies have revealed that the Lode angle parameter θ ¯ should also be considered in the fracture locus of metal [5,6]. Thus, the Lode angle of the material θ is expressed by the included angle between the π plane and the principal axis of deviator stress in the principal stress space, as shown in Equations (5)–(7), where ξ is the normalized third deviatoric stress invariant (−1 ≤ ξ ≤ 1).
θ = 1 3 arccos ( ξ ) ,
ξ = 27 2 ( σ 1 σ m ) ( σ 2 σ m ) ( σ 3 σ m ) / σ ¯ 3 ,
θ ¯ = 1 6 θ π = 1 2 π arccos ( ξ ) .

3. Tests and Setup

In this study, tensile tests were carried out on specimens of different sizes of the Chinese ML15 cold heading steel with a nominal yield strength equal to 320 MPa [24]. In order to analyze the fracture locus of ML15 under different stress conditions, some specimens were designed. They have the following features (their dimensions are shown in Figure 1):
  • smooth round bar η = 1/3, θ ¯ = 1;
  • notched round bar with η > 1/3, θ ¯ = 1;
  • flat grooved plate with η > 1/3, θ ¯ = 0;
  • tensile–shear flat plate.

3.1. Specimen Design

Added to the calibration of the stress–strain behavior of the ML15 steel, the tensile test of smooth round-bar specimens can also be used to investigate the ML15 fracture strain while applying a stress triaxiality equal to one-third and a Lode angle parameter θ ¯ equal to the unit [8]. The geometrical dimensions of smooth round-bar specimens are shown in Figure 1a and numbered as follows: RS-1, 2, 3.
Under different stress triaxiality ( θ ¯ = 1), fracture strains can be investigated at the root of circular arc notches with different radii cut from smooth round-bar specimens. According to Bridgman [23], after cutting a circular arc with a radius R on the smooth round-bar specimens, different stress triaxiality can be obtained at the root of the notch with Equation (8), which is related to the minimum section radius a of the specimen. Equation (8) shows clearly that several stress triaxiality can be obtained by changing the size of the cut. With the value of R tending to be infinite (smooth-round bar tensile specimens), the initial stress triaxiality at the centrum of the specimen section is equal to the third (1/3).
η = 1 3 + ln ( 1 + a 2 R )
Based on Equation (8), keep the radius of the minimum section a 3.123 mm, and cut round-bar specimens with radii of 1.5 mm, 3.125 mm and 6.25 mm, respectively. The dimensions of the remaining parts were equal to those of the specimens, as shown in Figure 1b. Two specimens of each size, with notch radii of 1.5 mm, 3.125 mm, 6.25 mm, were prepared and numbered RN-1 to RN-6 in turn.
To examine the ML15 fracture strain under plane strain, flat grooved plate specimens, designed by Bao and Wierzbicki [5] as shown in Figure 1c, were used in this study. By cutting symmetrical arc notches in the middle of the flats, different triaxial stress states can be tested at the root of the notch. Bai [8] proposed Equation (9) as a calculate the stress triaxiality at the minimum section of plate specimens using Equation (9), where t and R represent, respectively, the thickness of the minimum section and the arc radius of the specimen notch. According to Equation (9), stress triaxiality of the specimens under plane strain can be varied by changing the minimum section’s thickness and the notch’s radius.
η = 3 3 ( 1 + 2 ln ( 1 + t 4 R )
In this study, the radius value of the notch selected for flat notch specimens are equal to 1 mm, 5 mm and 10 mm, and the minimum section thickness is equal to 2 mm. Two specimens have been prepared for each notch radius and they were labeled as FN-1 to FN-6.
To examine the fracture locus of ML15 under tensile–shear stress state, the models displayed in Figure 1d [5] defined by Bao and Wierzbicki were used and tested. The test was performed on the tensile–shear flat plate specimens with 200 mm long and 60 mm wide, as shown in Figure 1d. The whole specimen is in an antisymmetric shape. The angle between the notch orientation and the tension orientation θ s is 15°, 20°, 30° (labelled as FT-1 to FT-6). The grip section on both sides is provided with loading round holes whose diameter is equivalent to 13 mm. The transition was conducted between the grip section and the gauge section with a radius arc to guarantee that the fracture appeared in the specimen gauge segment. Applying uniaxial tension, the central gauge section of the tensile–shear flat plate specimen was under tensile–shear composite stress in such a way that the ML15 fracture locus, under tensile–shear composite stress, could be tested.

3.2. Experimental Design

The experiment loading equipment was a hydraulic servo material tester with a maximum load of 10,000 kN. The axial strains of specimens were measured by an electronic extensometer, having a distance equal to 50 mm and a deformation equal to 25 mm. A displacement-controlled loading mode was used in these tests. To succeed in catching the fracture position of the specimens and minimize the effect of strain rate on the results of different specimens, a low-speed loading rate of 0.4 mm/min was adopted. The extension rate of the smooth round-bar specimens was measured using an extensometer with 50 mm long gauge in the experiment.

4. Test Results

4.1. Smooth Round-Bar Specimens

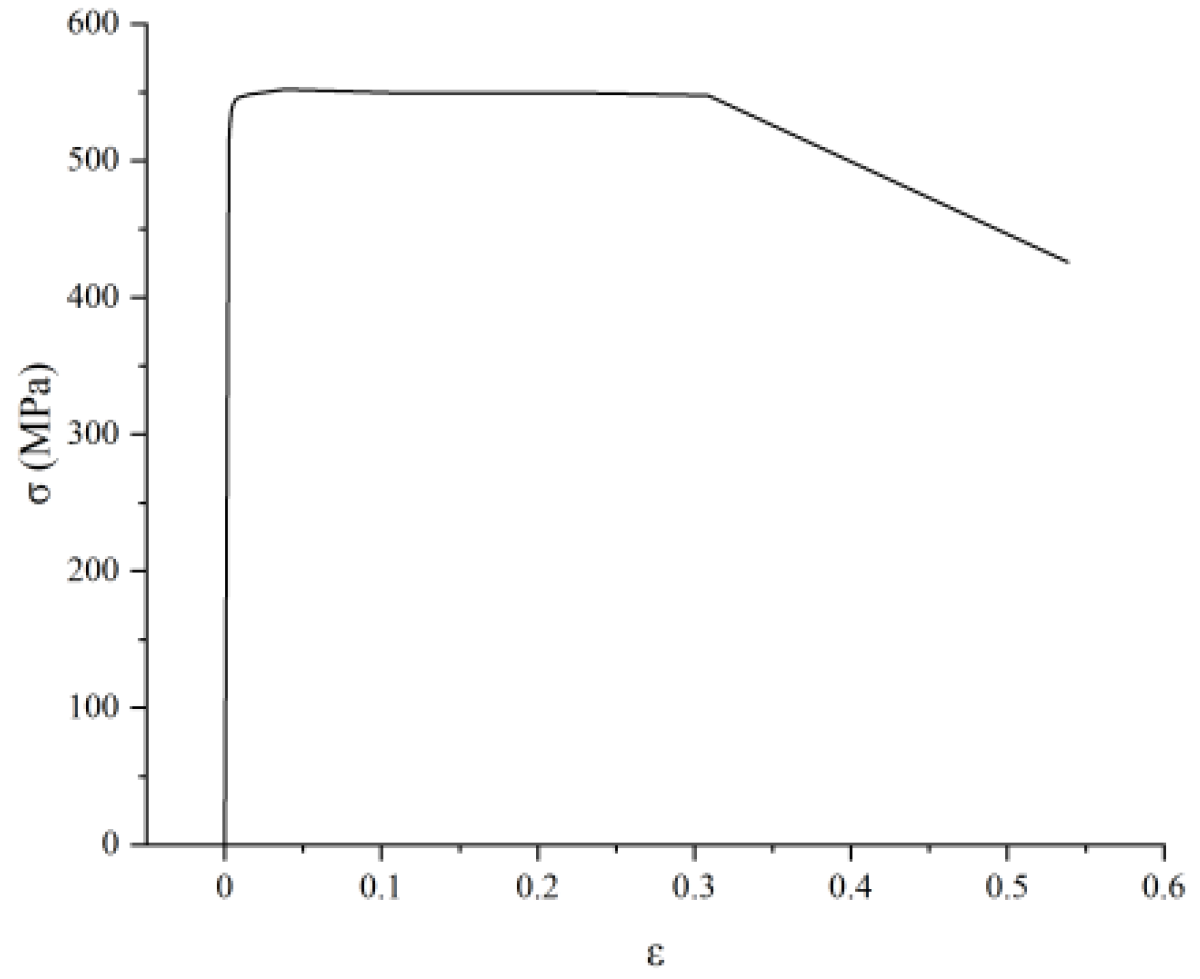
The fracture topographies of smooth round-bar specimens are shown in Figure 2. The maximum loads of the three specimens are consistent and equal to 57.53 kN, 57.92 kN and 56.75 kN, respectively. The measured engineering stress–strain curve σ E ( ε E ) , before necking, was calculated as the true stress–strain curve σ ¯ ( ε ¯ ) by using the classical transformation law, σ ¯ = σ E ( 1 + ε E ) and ε ¯ = ln ( 1 + ε E ) . Subsequently, the diameter at the fracture position of each test object was measured using a vernier caliper. If the constancy of volume of the material at the neck was assumed, Bridgman’s approximate solution [6,18,23] of average fracture stress and strain, based on the hypothesis of well-distributed equivalent strain in the necking cross section of the round-bar specimens, was applied, i.e., Equations (10) and (11), where P f is the load at the time separation of the specimens, A 0 is the initial and A f the final area of the neck. The true stress–strain curve of ML15 extends to the point ( σ ¯ f , ε ¯ f ) as shown in Figure 3. It can be seen from this figure that, unlike ordinary steel, ML15 cold heading steel has no obvious yield point, nor a yield stage. Although its yield load is specified to be greater than 320 MPa in the Chinese standard [24], it is shown, in these tests, that the stress–strain behavior is basically linear before the reaching the ultimate load, which demonstrated well the hardening effect of the cold heading process on steel. The true stress–strain behavior of ML15 includes linear elasticity, non-linear hardening steady deformation and strain softening.
σ ¯ f = P f π d f 2 / 4
ε ¯ f = ln ( A 0 A f )

4.2. Notched Round-Bar Specimens

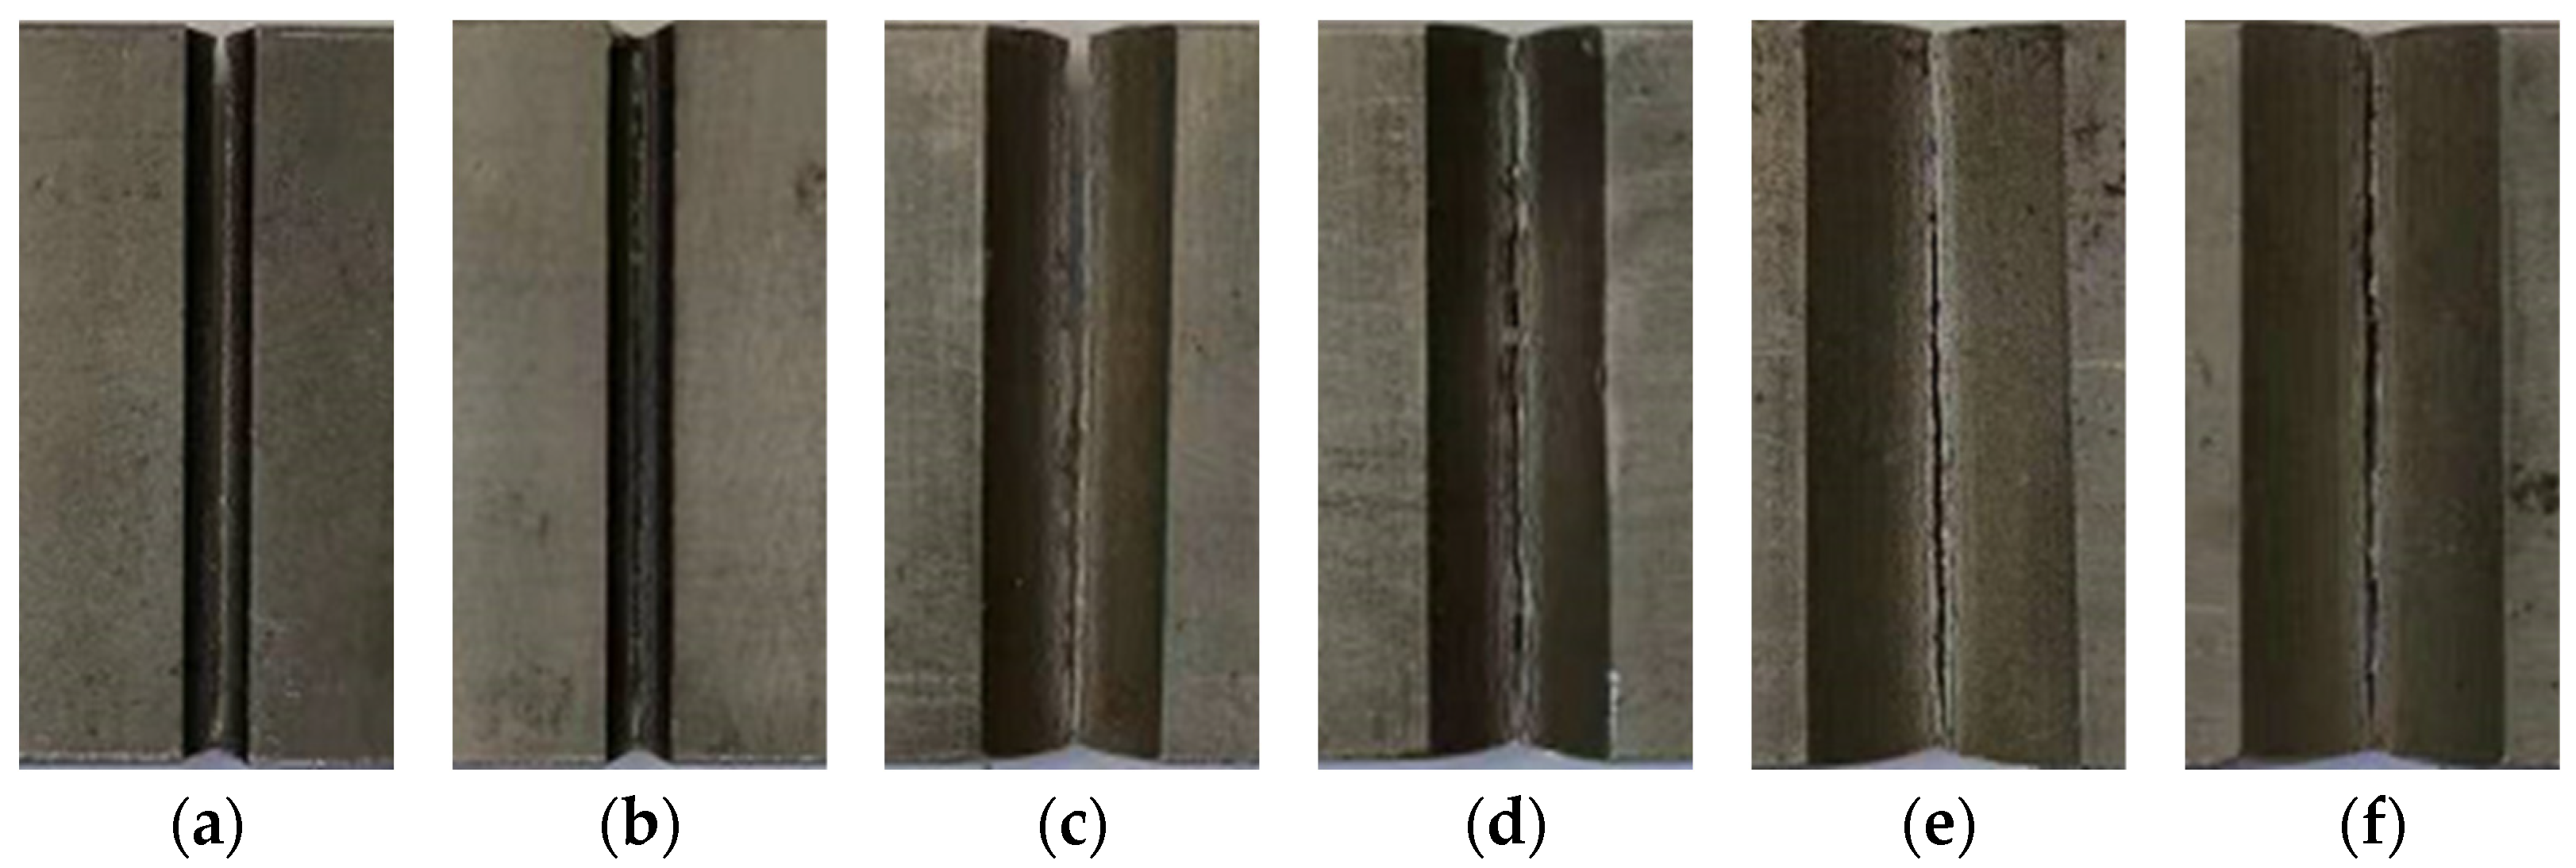
Notched round-bar specimens’ fracture topographies are shown in Figure 4. 17.11 kN, 20.07 kN and 22.86 kN are the average maximum loads of test objects with cut radii of 6.25 mm, 3.125 mm and 1.5 mm detected from the test machine, and their average fracture loads are 14.29 kN, 23.8 kN and 26.1 kN, respectively. The fracture areas of RN-1 to RN-6 formed in the minimum section. The diameter at the fracture surface of each specimen was measured with vernier caliper, and Equation (11) was used to obtain the fracture strain.

4.3. Flat Notched Specimens

As for the fracture topography of flat notched tensile test objects, they are shown in Figure 5. The loads of FN-1 to FN-6 are also inversely proportional to the notch radius. The average ultimate loads of cut radius 10 mm, 5 mm and 1 mm test objects are, respectively 56.87 kN, 57.52 kN and 75.18 kN, and their average fracture loads are, respectively 53.68 kN, 54.03 kN and 70.04 kN. The fracture appeared first in the middle of the notch (plane strain state area) and then it ends along its both sides. Bridgman [23] proposed Equation (12) to calculate the mean value of the strain at the fracture position of notch root of the specimens, where t 0 is the original thickness of notch root and t f is the thickness of the fracture position measured with a vernier caliper after the test.
ε ¯ f = 2 3 ln ( t 0 t f )
Table 1 showed the results of the above experiments for systematic comparative analysis. The geometry of the notch at its root are the decisive factors affecting the ultimate load and extensibility of the specimens. The ultimate and fracture loads of ML15 are proportional to the notch sharpness and stress triaxiality, while the ductility (necking area and fracture strain) is inversely proportional to the notch sharpness and stress triaxiality.

4.4. Tensile–Shear Flat Specimens

The fracture topographies of FT-1 to FT-6 are shown in Figure 6. FT-1 and FT-2, with θ s equal to 15 degrees, showed obvious tensile deformation and the sections, at the minimum sections of the specimens, extended towards the tensile direction. The fracture sections were not smooth and have obvious necking, leading to the conclusion that the specimens have ductile fractures. While comparing FT-1 and FT-2, FT-3 and FT-4, where θ s is equal to 20 degrees, the tensile–shear flat specimens did not extend toward the tensile direction; however, there was certain tensile deformation at the edge of the indentation. Relatively smooth and complete planes were observed on the surface of FT-5 and FT-6 at the fracture position. The starting points of the fracture cannot be accurately captured due to the simultaneous fracture of the cut root area in tensile–shear tests in the tensile–shear flat plate specimen tests. Therefore, finite element analysis was performed to analyze the fracture phenomena.

5. Fracture Locus Calibration

Rice and Tracey [2] have theoretically analyzed the growth of spherical voids model under hydrostatic tension and have proposed a 2D fracture model as shown in Equation (13), where C1 and C2 represent the material constants. The Rice–Tracey model is currently widely used in the fracture analysis of steel structures.
ε ¯ f = C 1 e C 2 η
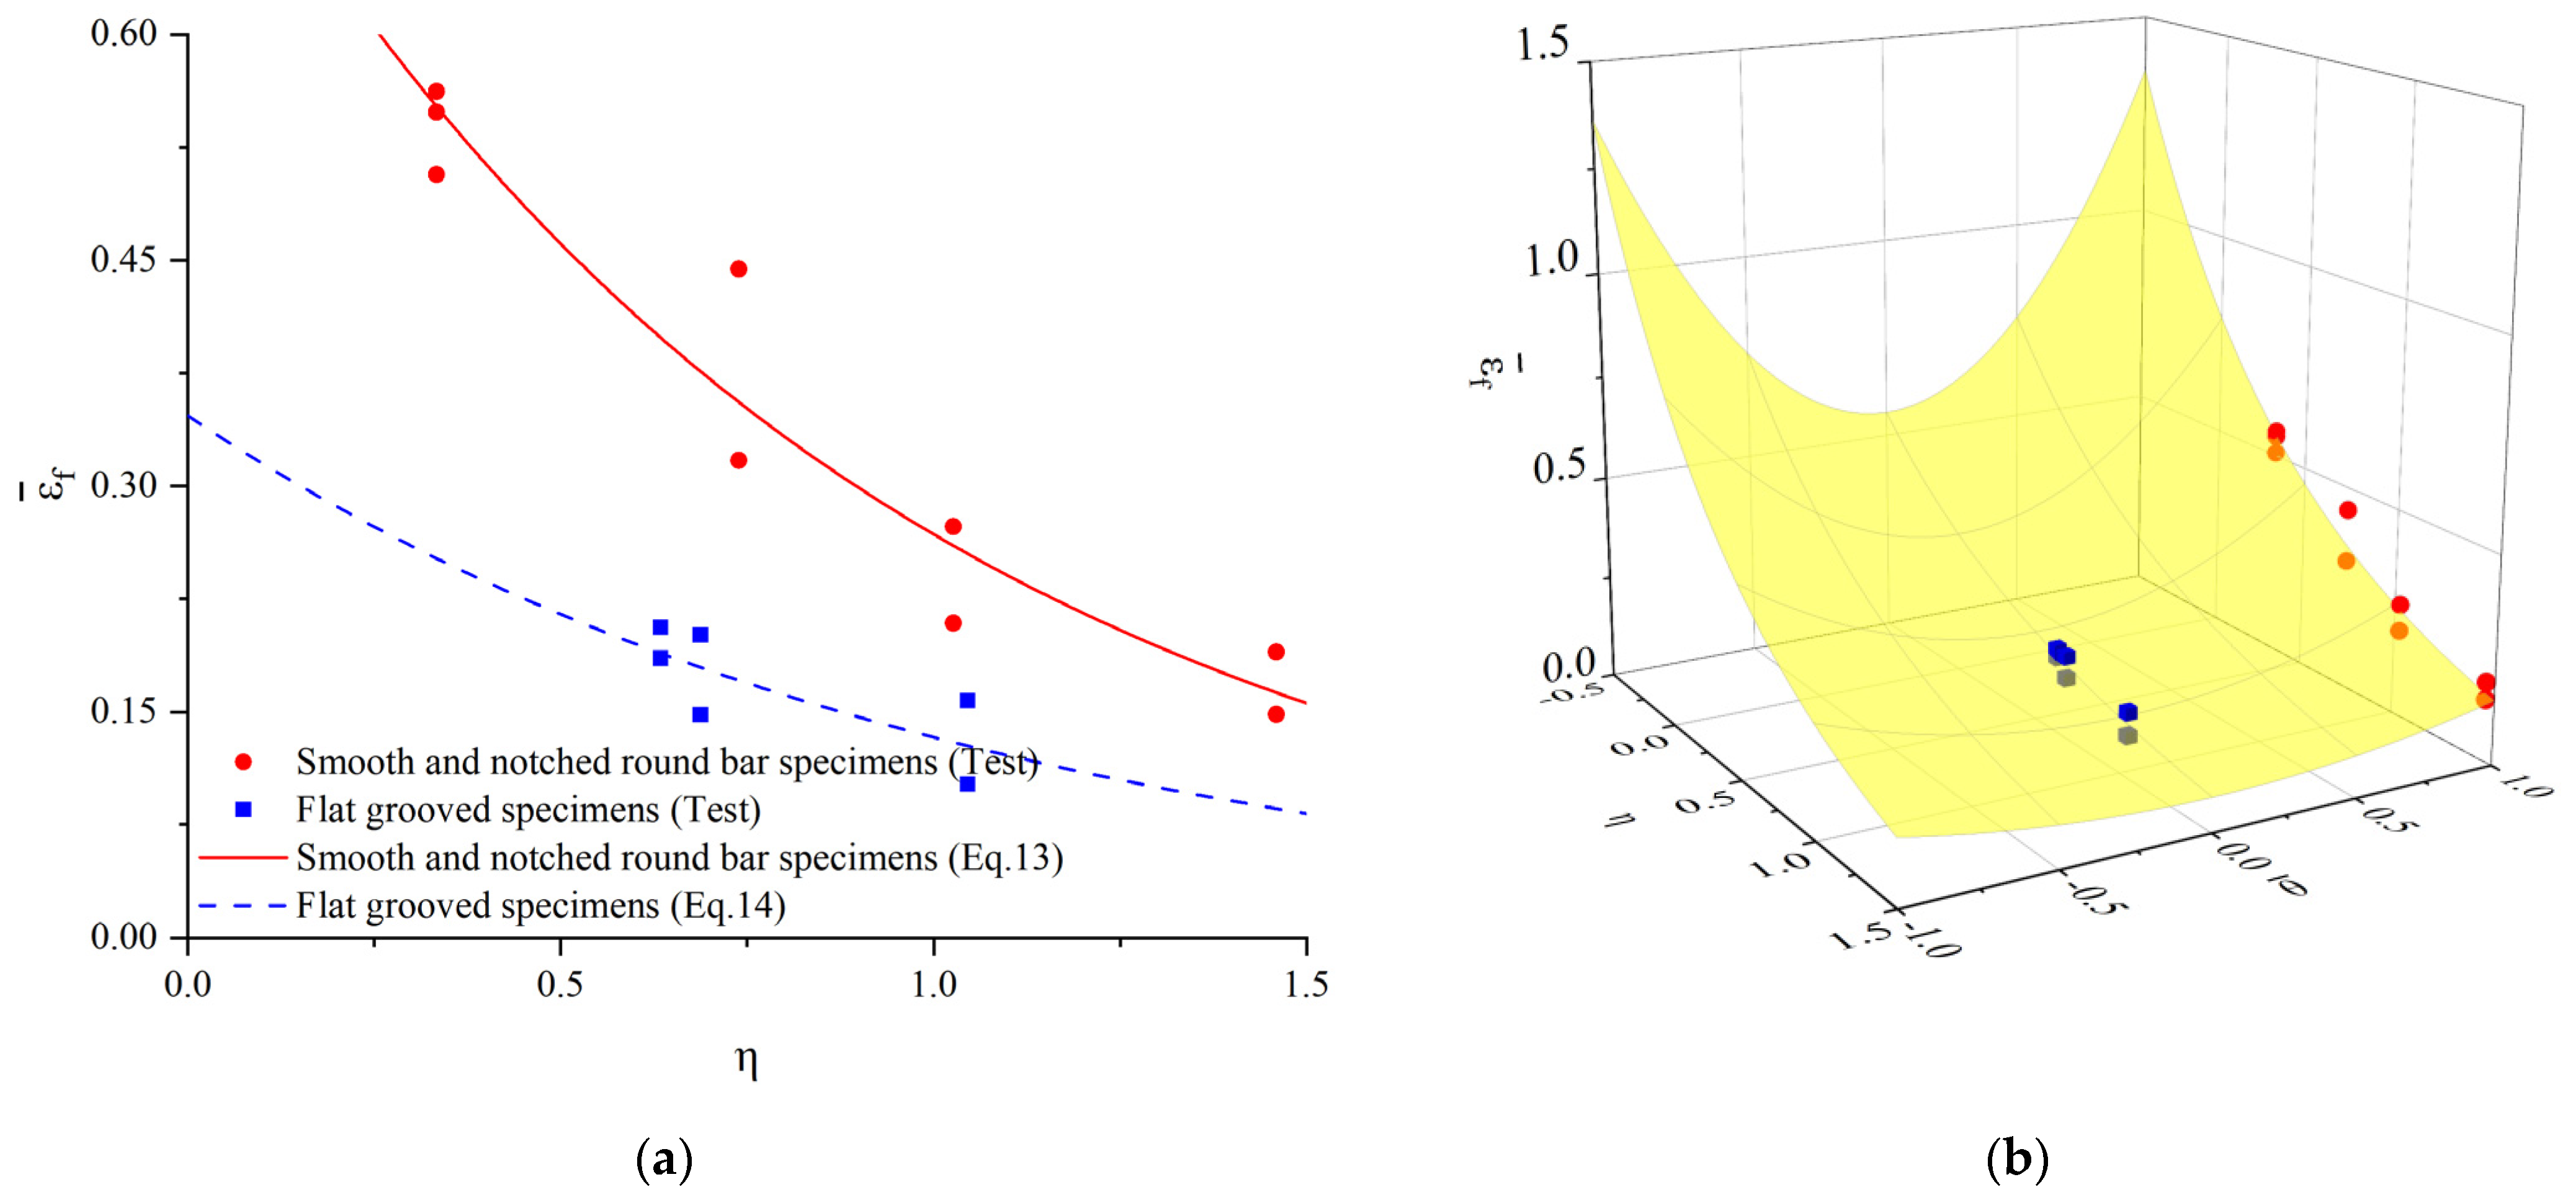
To calibrate the Rice–Tracey fracture criterion of ML15 steel, several data points were fitted within a non-linear curve using Maltab. The equivalent plastic strain to fracture ( ε ¯ f ) representations, calibrated using the experimental results of round-bar and flat groove specimens, are shown in Equations (14) and (15), respectively.
ε ¯ f = 0.7932 e 1.085 η
ε ¯ f = 0.3468 e 0.9572 η
Figure 7a shows the values of fracture strain of round-bar specimens and flat groove specimens as well as Rice–Tracey fracture curves fitted based on the test results. In Figure 7a, the 2D Rice–Tracey model indicates that the ductility of ML15 decreases exponentially when the triaxial stress increases under the same Lode angle. Additionally, based on Figure 7a, it is clear that the fracture strain of ML15 steel was significantly subject to the Lode angle parameter. The Rice–Tracey model, considering stress triaxiality alone, is not able to forecast the difference in fracture strain of steels with a different third deviatoric stress invarian. Therefore, in order to accurately forecast the fracture locus of ML15 with a different third deviatoric stress invarian, the effect of Lode angle parameter should be taken into consideration.
In 2008, Bai [8] introduced the Lode angle parameters, based on the Rice–Tracey model of the equivalent plastic strain to fracture ε ¯ f under different stress states, and proposed the Bai–Wierzbicki model as shown in Equation (16).
ε ¯ f = [ C 1 e C 2 η C 3 e C 4 η ] θ ¯ 2 + C 3 e C 4 η
Referring to Equation (16), the B–W model corresponds to the Rice–Tracey model under the stress state of round-bar test objects at θ ¯ = 1, where the parameters C1 and C2 can be calibrated. When θ ¯ = 0 (Equation (16)), the equation corresponds to the Rice–Tracey model in the stress state of flat grooved plate specimens, and the parameters C3, C4 can be calibrated. Accordingly, Equation (17) is defined and the test outcomes are shown in Figure 7b.
ε ¯ f = ( 0.7932 e 1.085 η 0.3468 e 0.9572 η ) θ ¯ 2 + 0.3468 e 0.9572 η

6. Microscopic Crack Characteristics of ML15 Steel Specimens

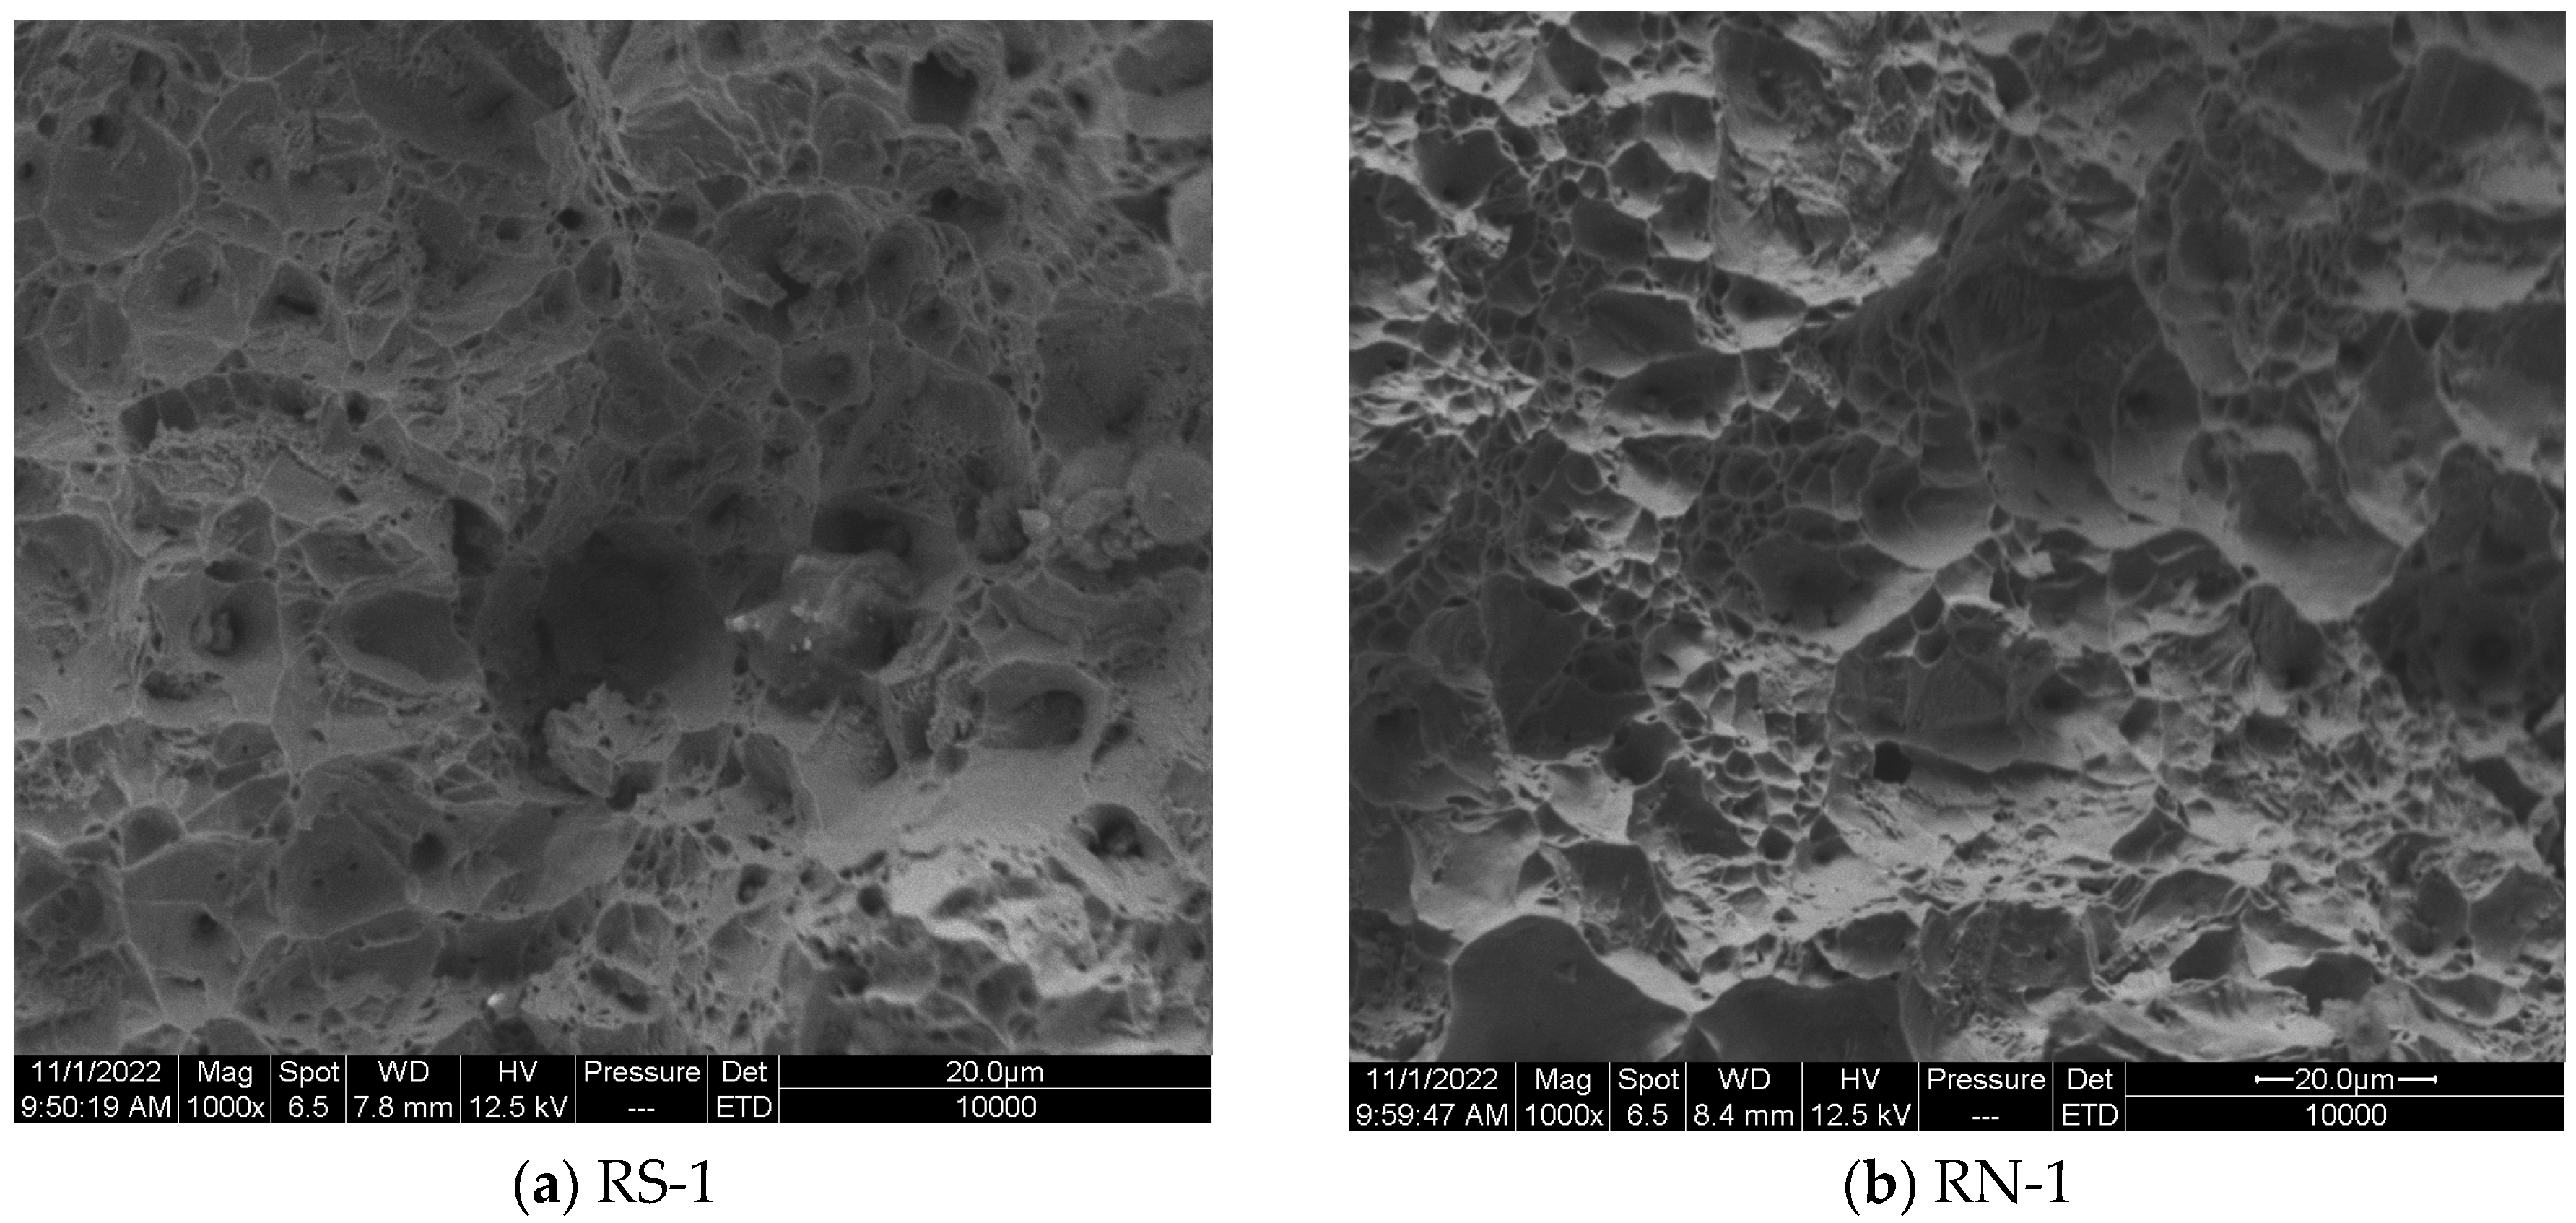
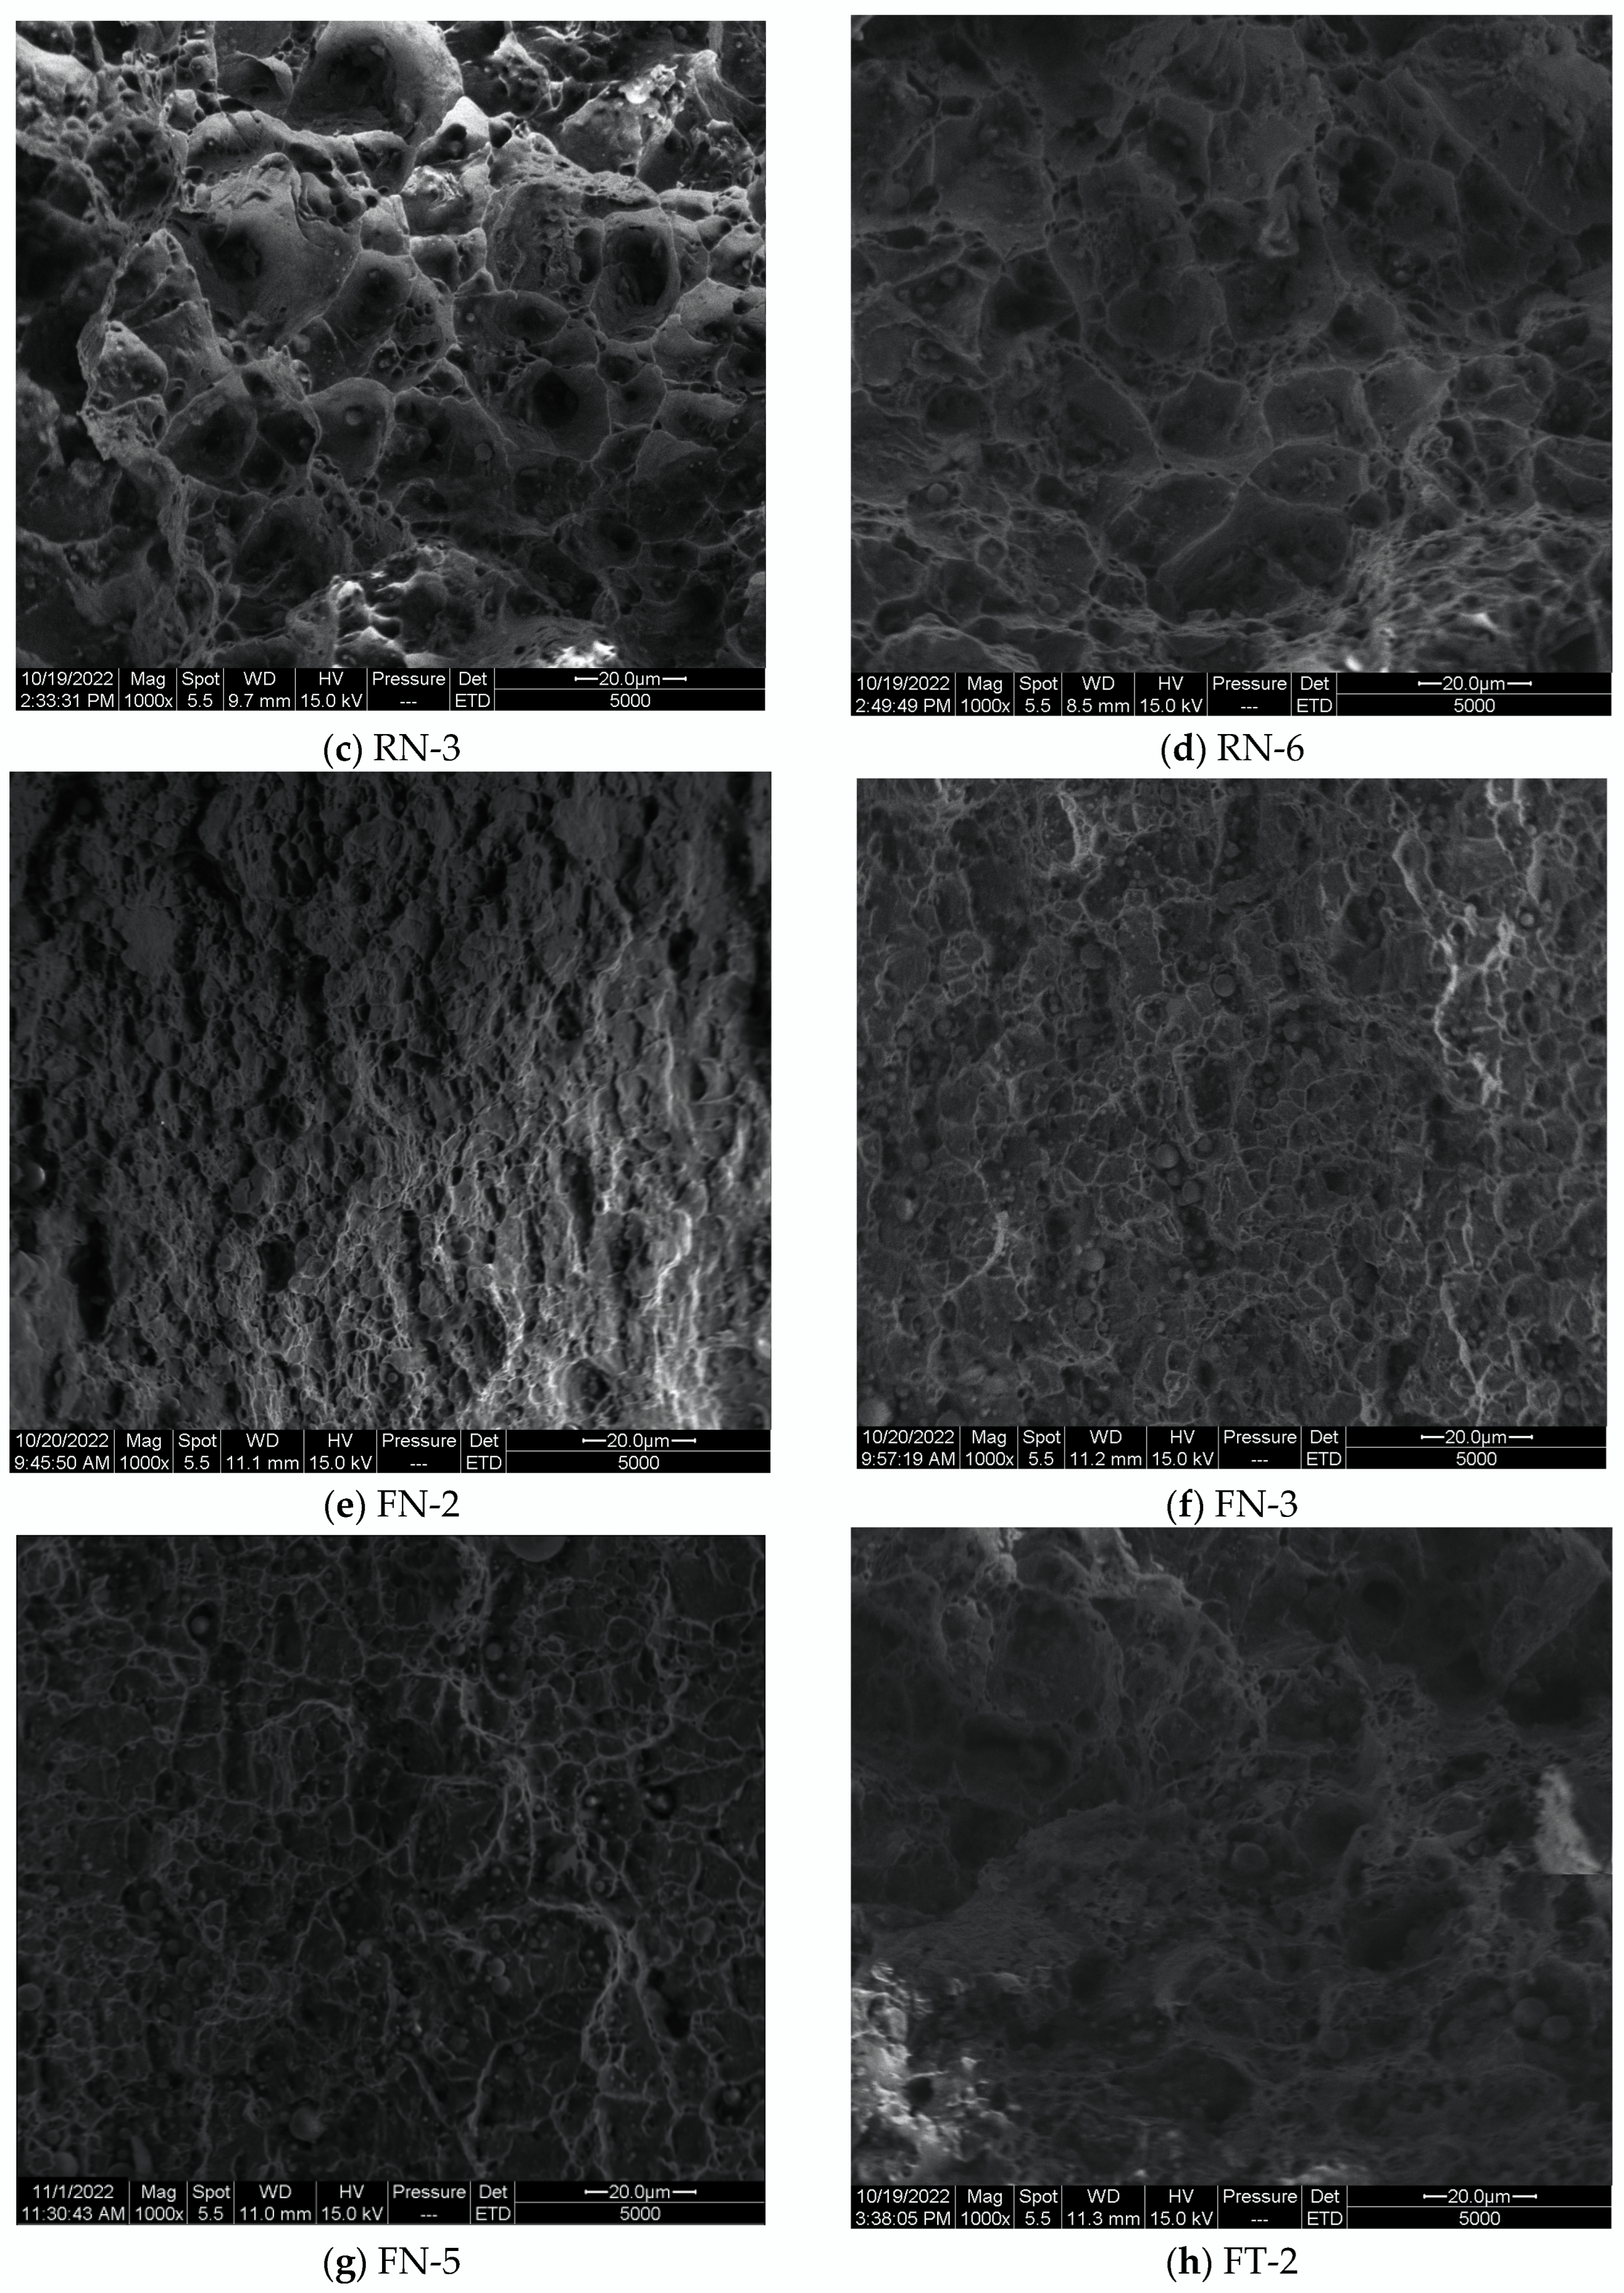
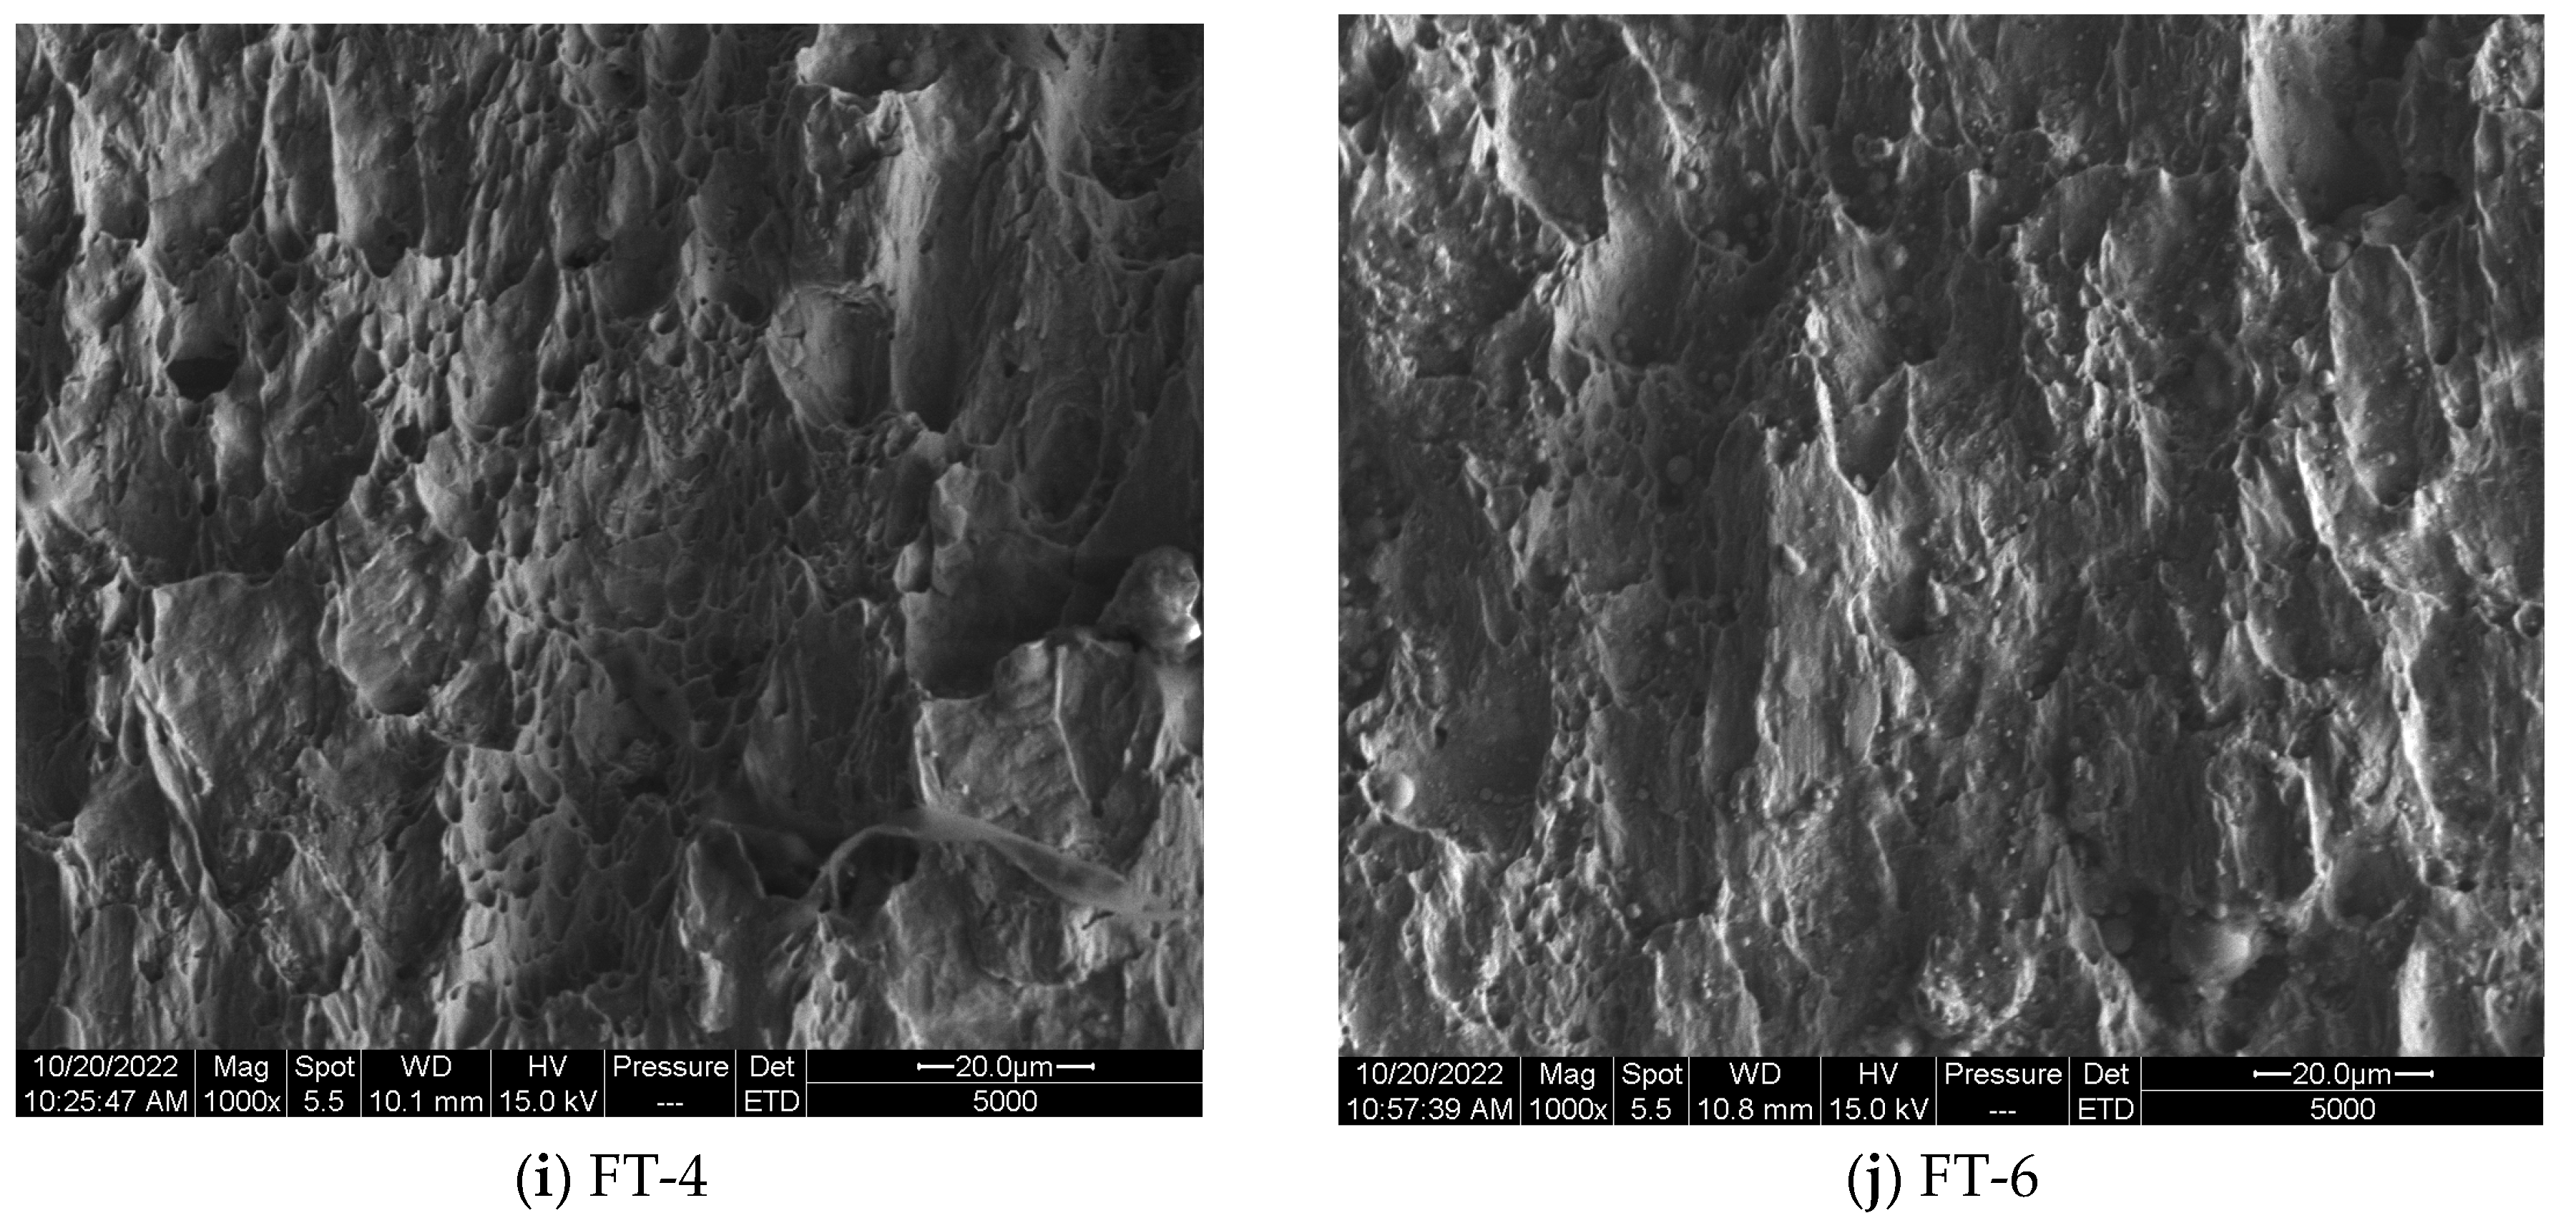
Scanning electron microscopes are particularly useful in studying the microfracture mechanism of ML15 steel. The results of the specimens at 1000× magnification using a Quanta-200 environment scan electron microscope are shown in Figure 8.
The microscopic crack characteristics of all round-bar tensile specimens were revealed by the scanning electron microscope showed wide and deep dimples, which indicated that the failure mode of all the round bar tensile specimens was ductile fracture. Compared with the smooth and notched bar specimens, the dimples observed microscopically in the flat notched specimens are smaller and shallower. Microscopic phenomena that change dimple size due to different Lode angle parameters explain why Rice–Tracey model cannot accurately predict the fracture strain of ML15 steel.
Three different tensile–shear mixed plate specimens show three different fracture mechanisms. For tensile–shear plate specimen FT-2, the fracture morphology observed on the fracture surface is dominated by nucleated voids, and the dimples were similar in distribution and size to those of the round-bar specimens. Twisted voids were shown in the scanning electron micrographs of the fracture surface of FT-4 due to the significant shearing effect. Mainly shear fracture mechanism was revealed on the fracture surface of FT-6, but there were still obvious dimples at the beginning of the fracture, and the fracture surface was not completely flat.

7. Numerical Simulations

7.1. Finite Element Model

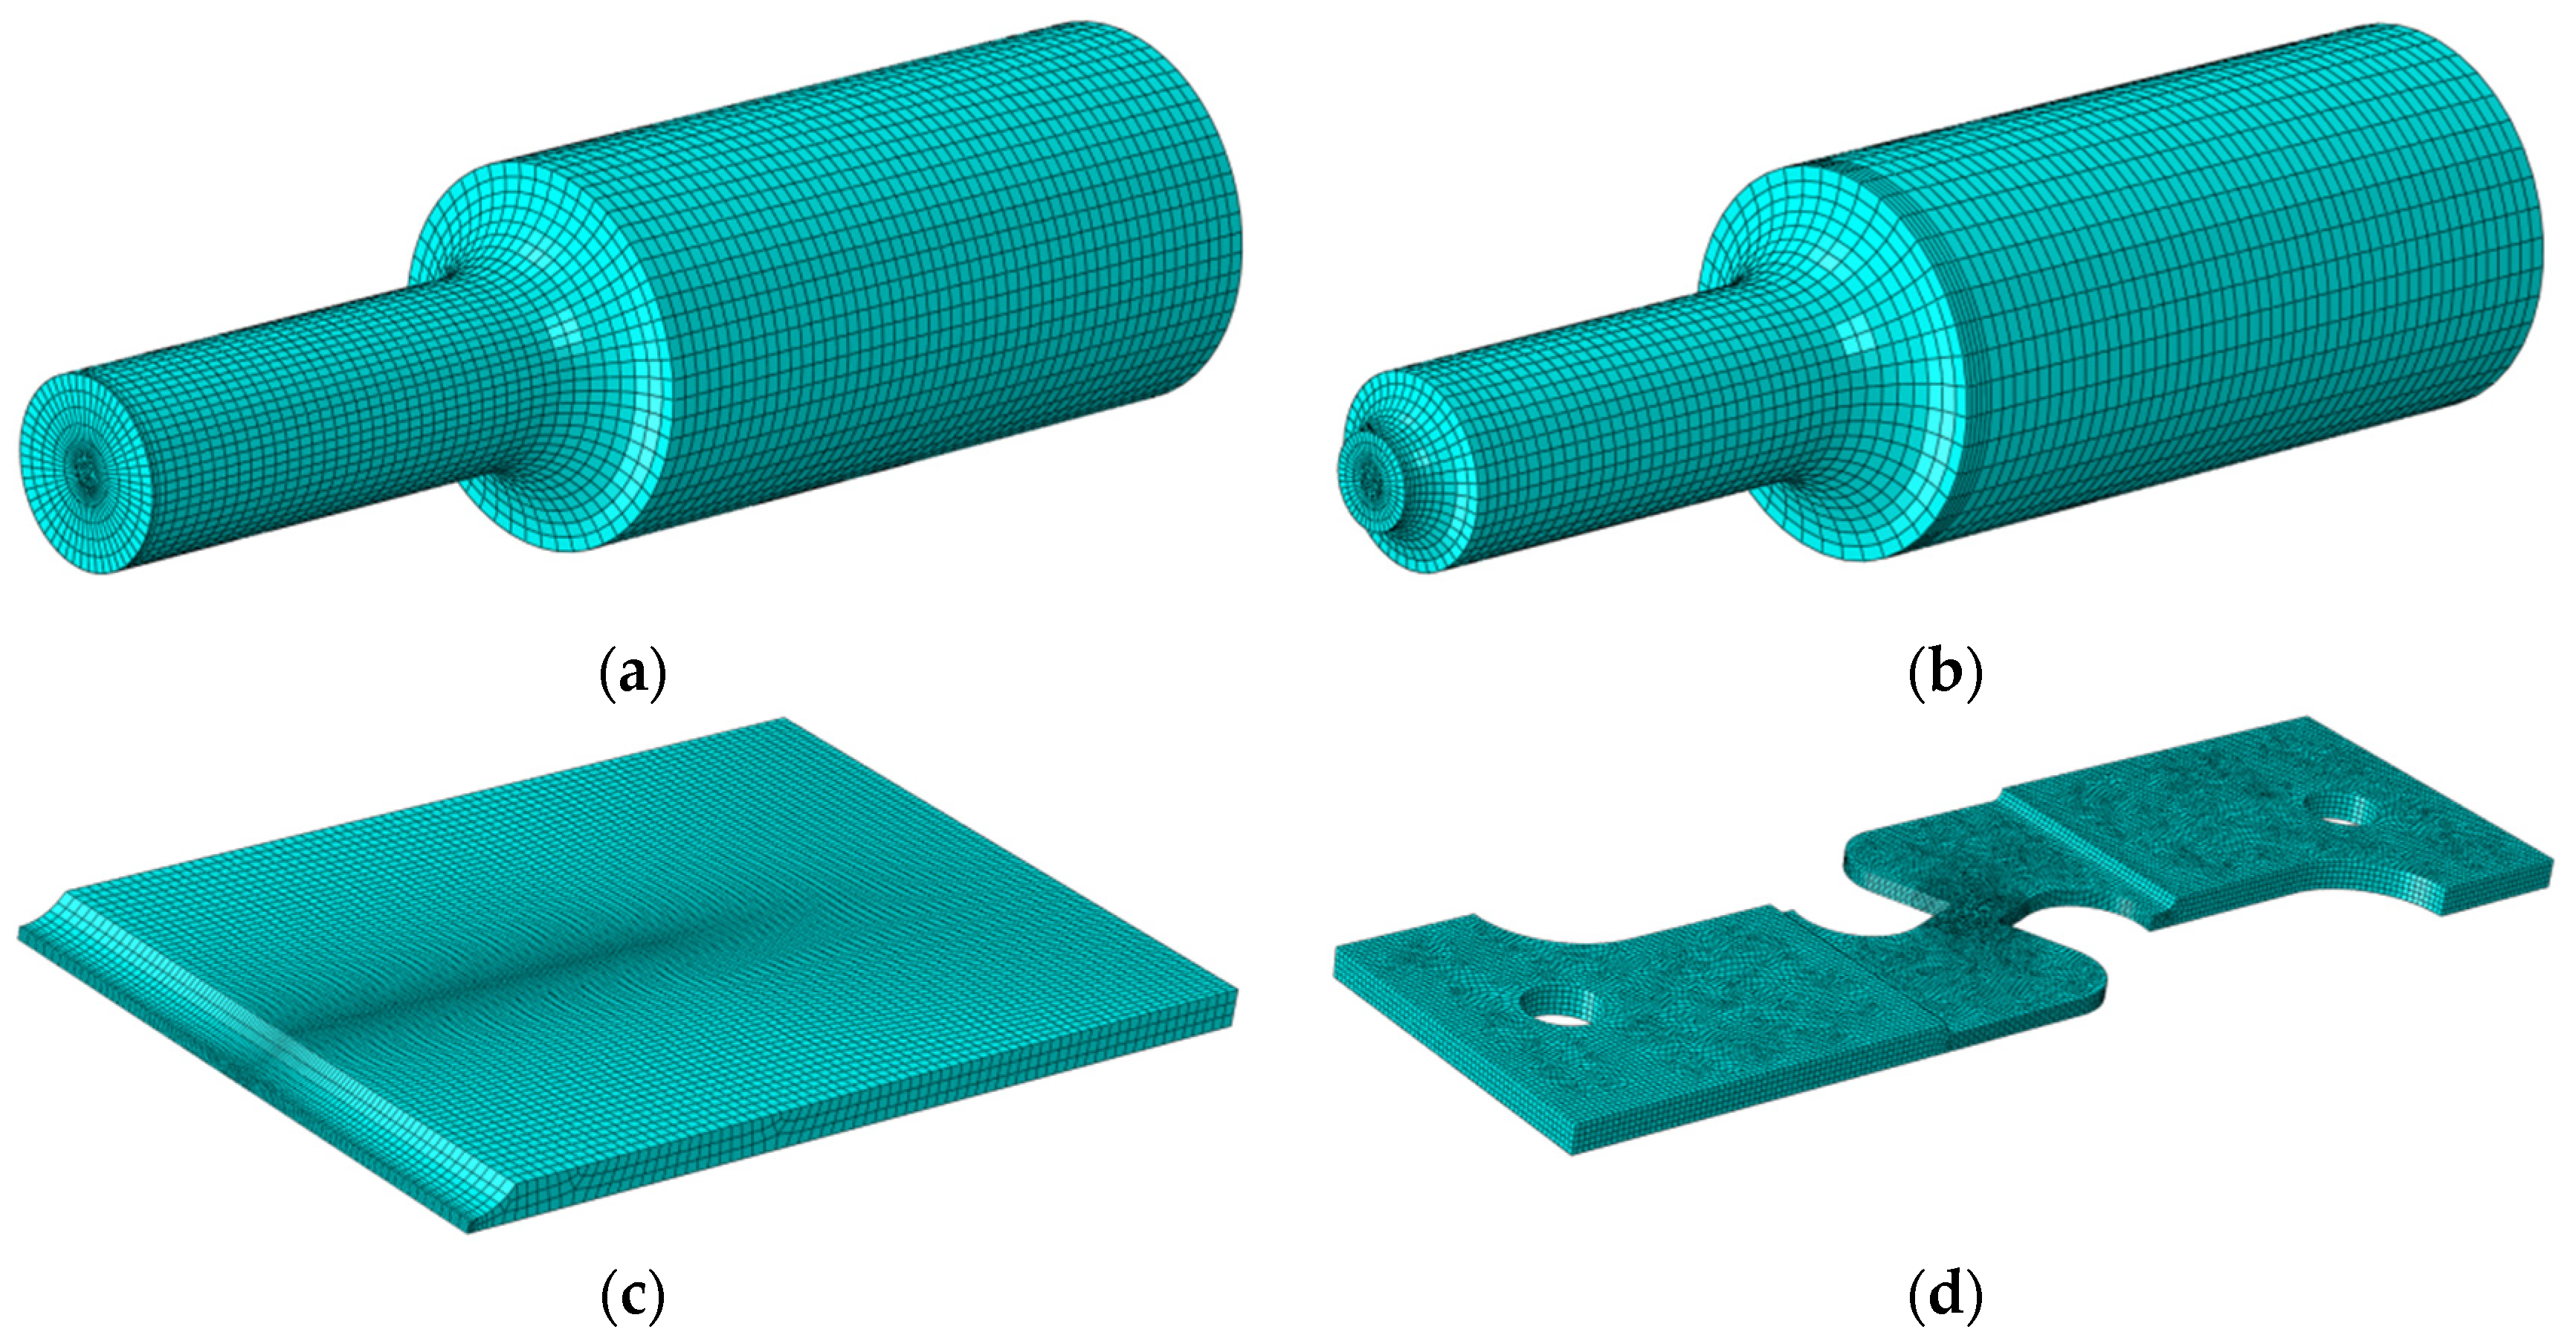
The finite element method was used to analyze the above tests with ABAQUS/standard. Since the analysis involves large plastic deformations, complex shapes, and stress states, the geometric nonlinearity of the model was set. To input the true stress–strain curves in Figure 3 into ABAQUS Material Property without an obvious yield point, the elastic modulus of the linear phase was chosen and calculated to be 189,730.59 MPa. The end value of the linear stage was chosen as the yield strength of 355.54 MPa. All finite element models use C3D8R elements to keep the consistency of the results. To ensure the correctness of the outcome, the minimum grid size of the critical part was set to 0.2 mm and the transitions were set to 1 mm for the non-critical part. Due to the symmetry of the specimens, symmetrical boundary conditions were set to the tensile direction for smooth and notched round-bar specimens, to the tensile and thickness direction for flat grooved plate specimens, and to the thickness direction for tensile–shear flat plate specimens. Figure 9 represents the five models for the specimens shown in Figure 1. The boundary conditions and the loading scheme of each model are in accordance with those of the test set. In the models, the material properties of ML15 were selected according to the stress–strain behavior displayed in Figure 3 and the equivalent plastic strain to fracture ε ¯ f is considered referring to Equation (16).

7.2. Numerical Results

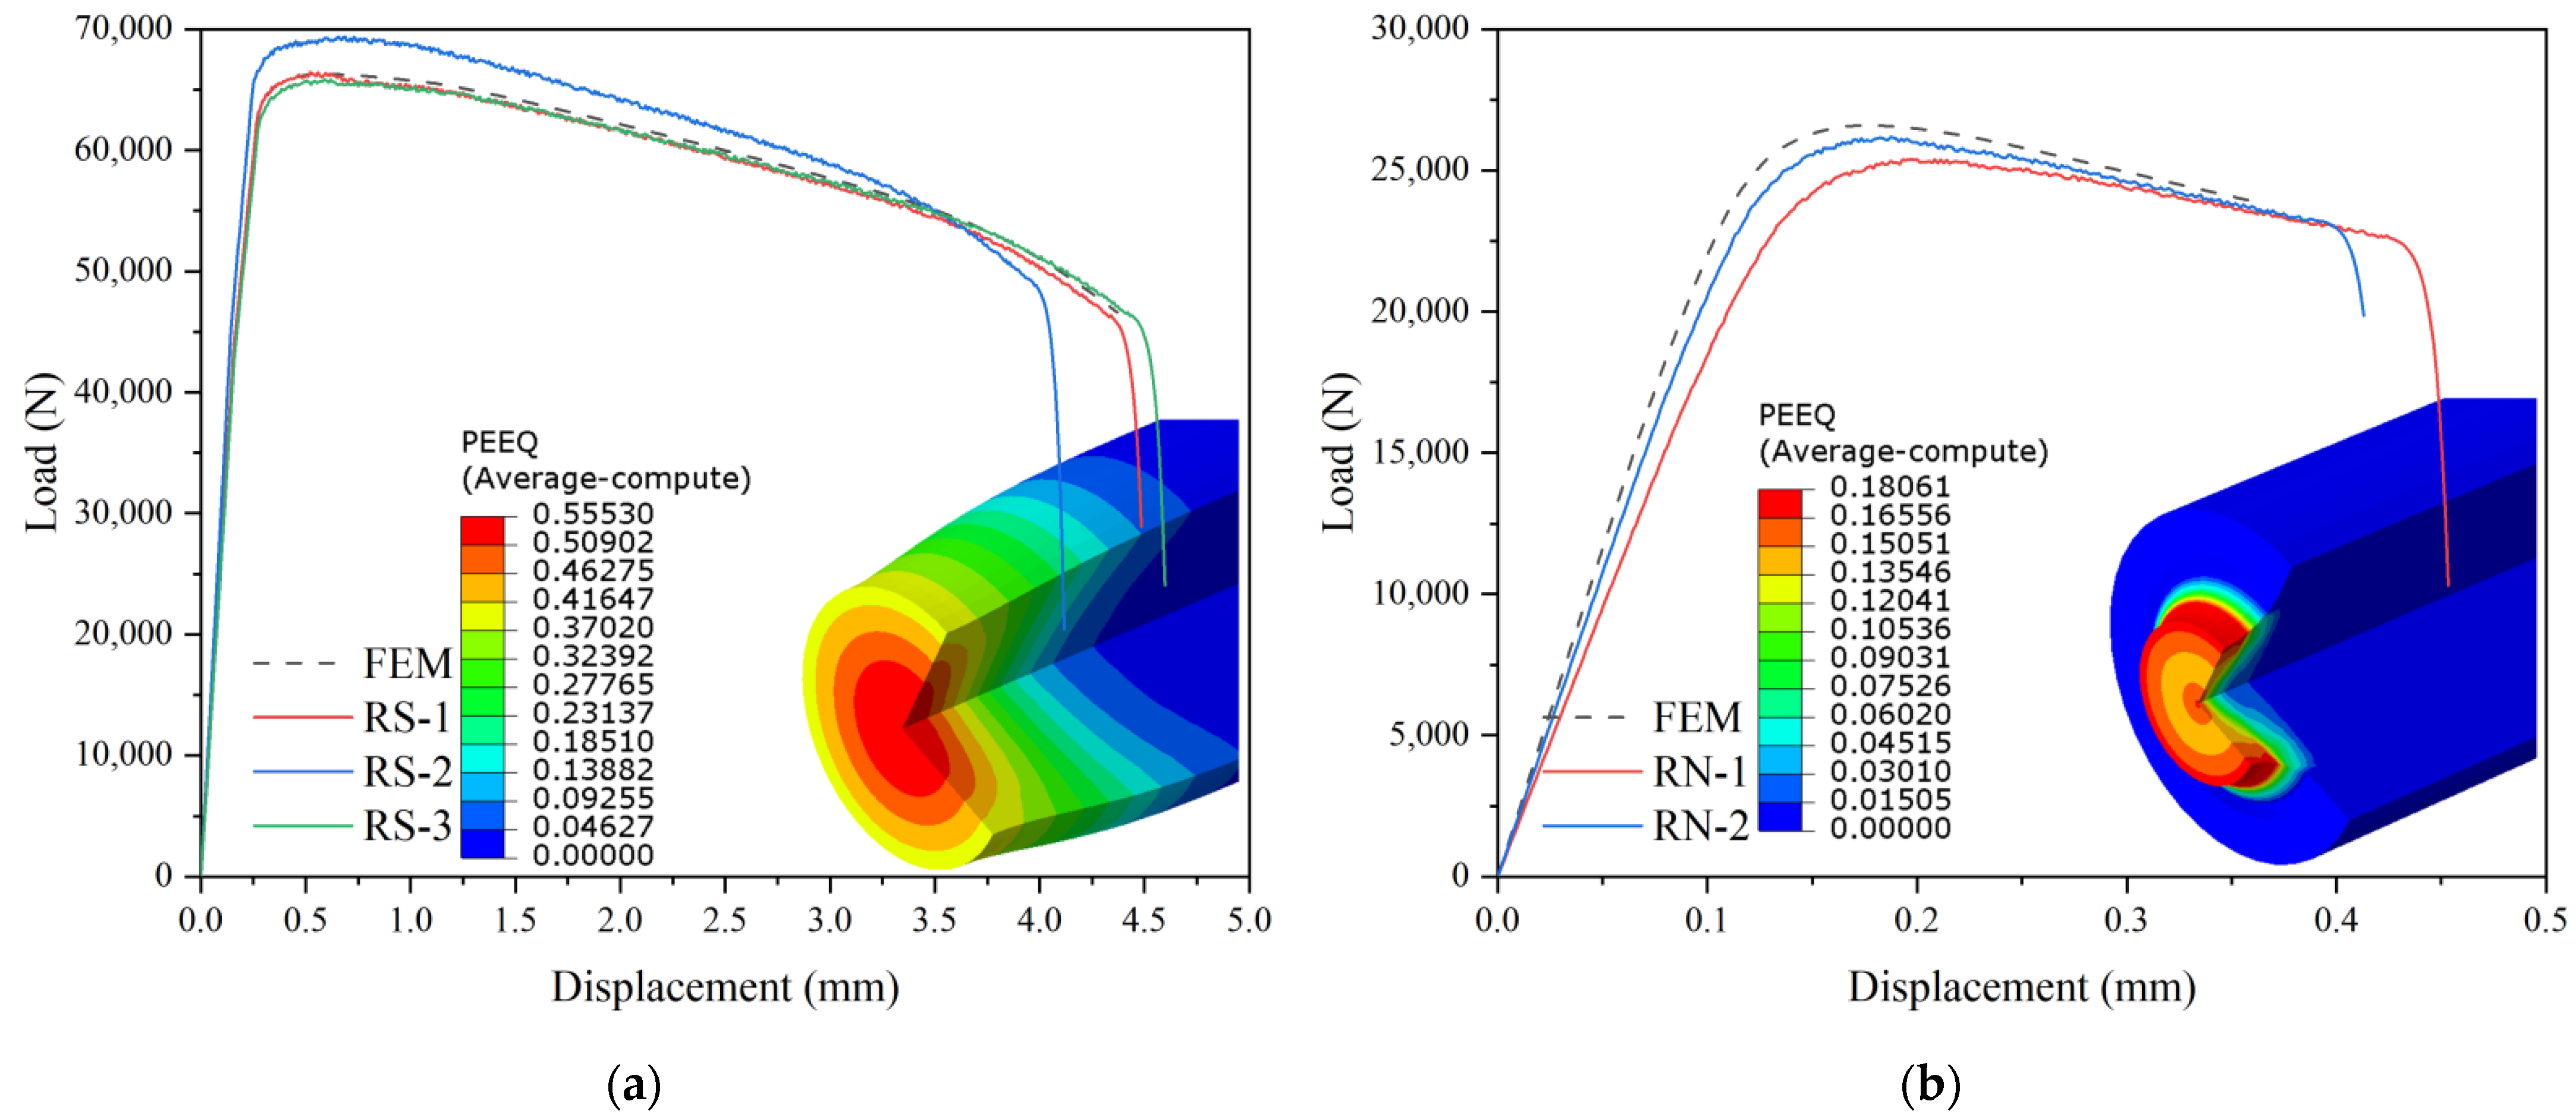
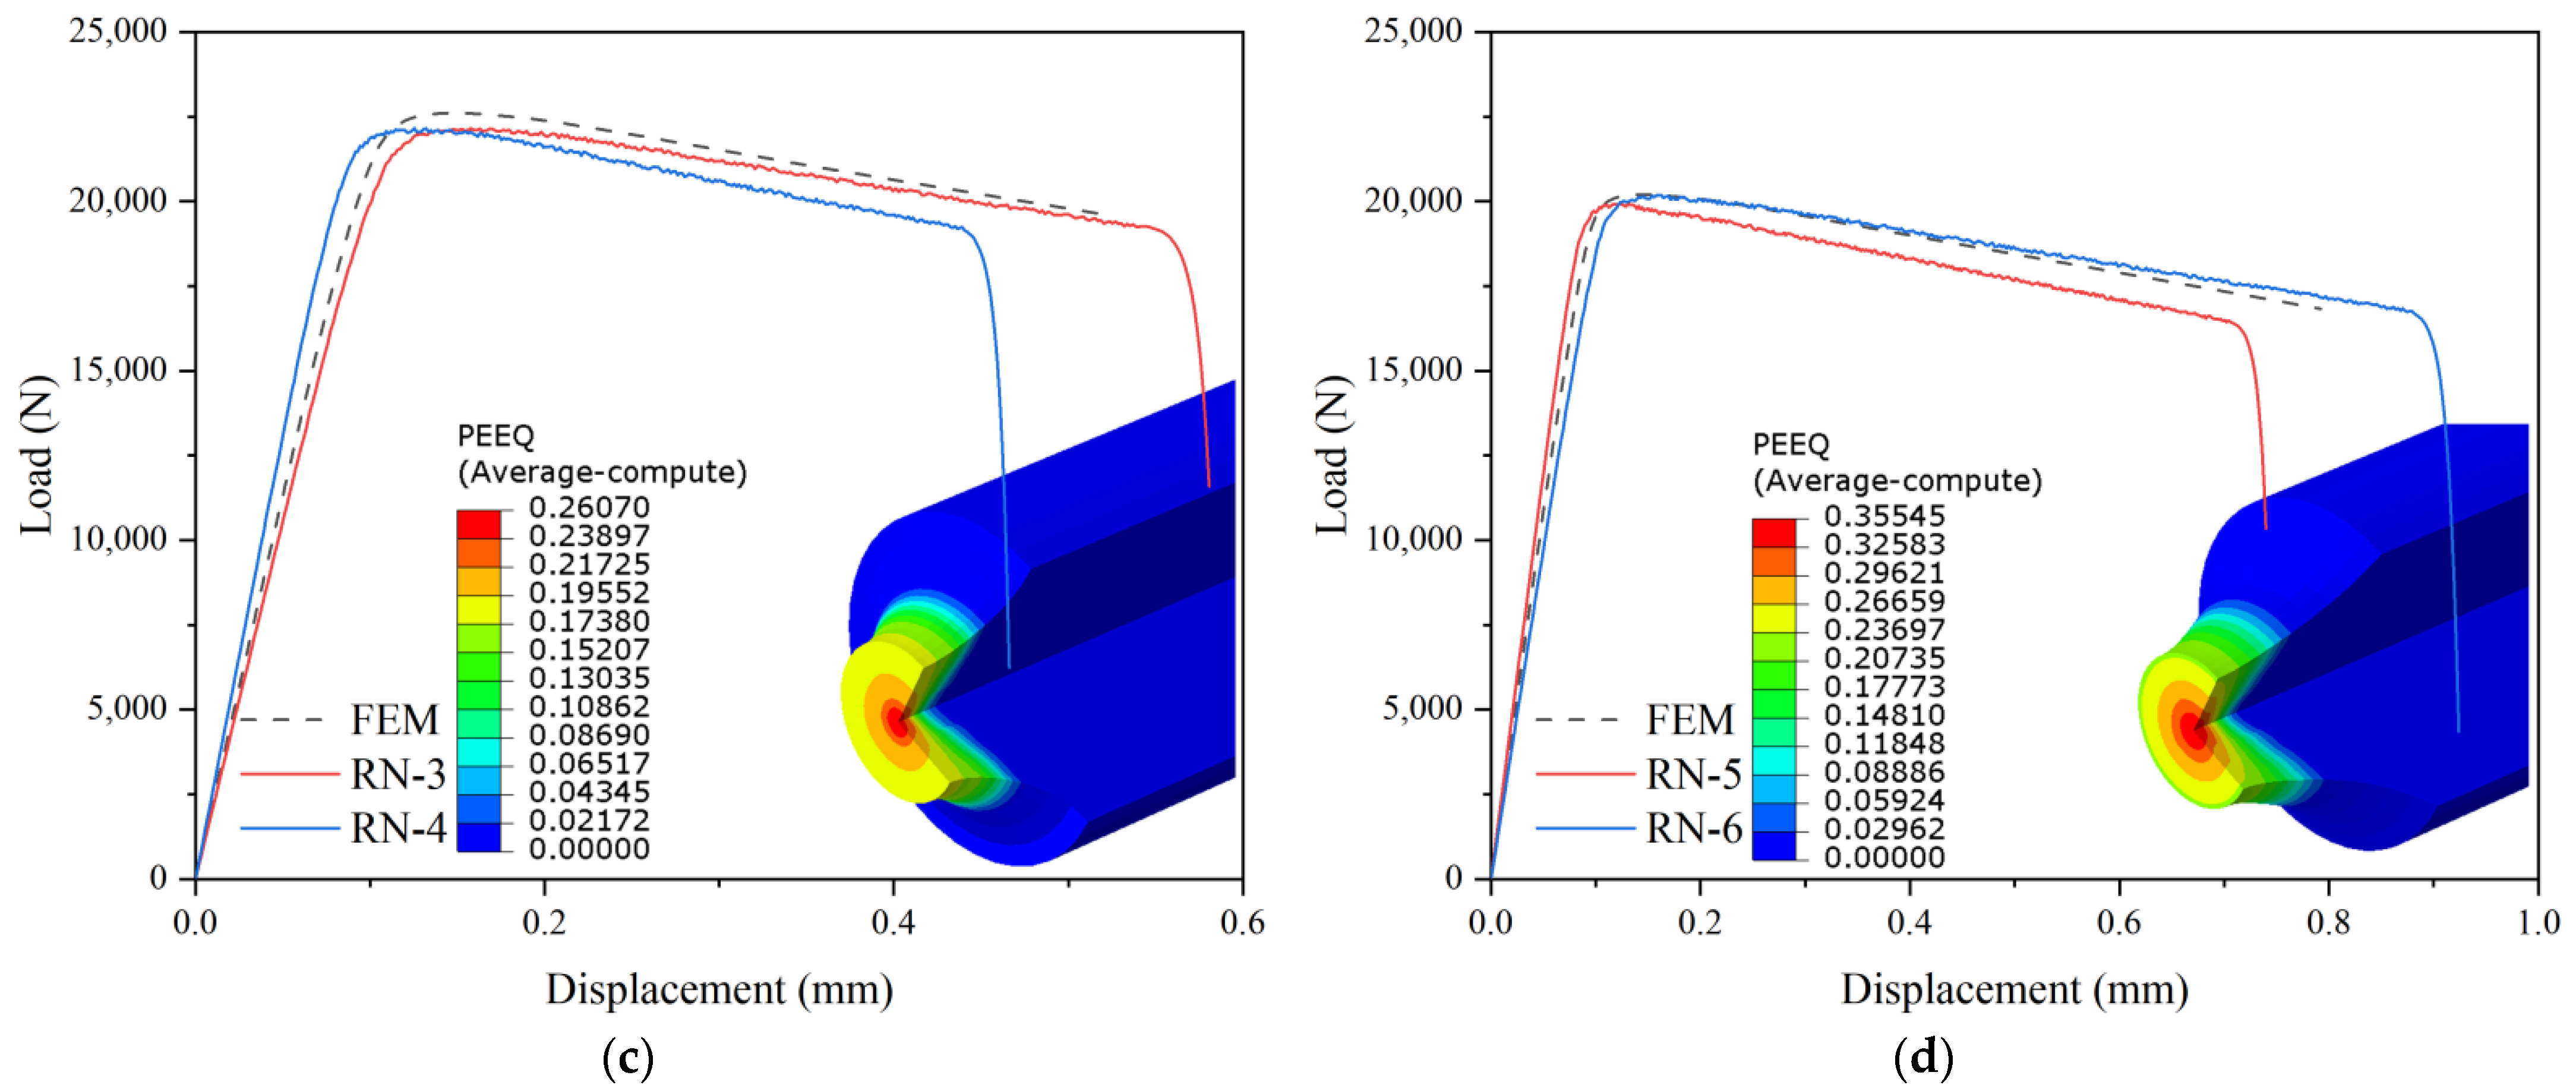
Figure 10 shows the load–displacement behaviors of bar tensile specimens measured during the experimental tests and calculated using the finite element method, together with the plastic strain distribution when failure occurs in the finite element model. The plastic strains in all specimens are symmetrically circular and the failure positions are located at the center of the minimum section, as shown in Figure 10. In the finite element model, having a stress triaxiality equal to 1.46, high plastic strain areas are distributed on the notch surface, and a small number are propagated across the centrum of the circle. When stress triaxiality decreases, the high plastic strain areas around the notch surface decrease also and disappear at a given point, and the high plastic strain area at the center of the notch increases and is produced in the direction of tension. The high plastic strain areas are evenly distributed across the failure section of the smooth circular bar specimens and an obvious necking occurs.
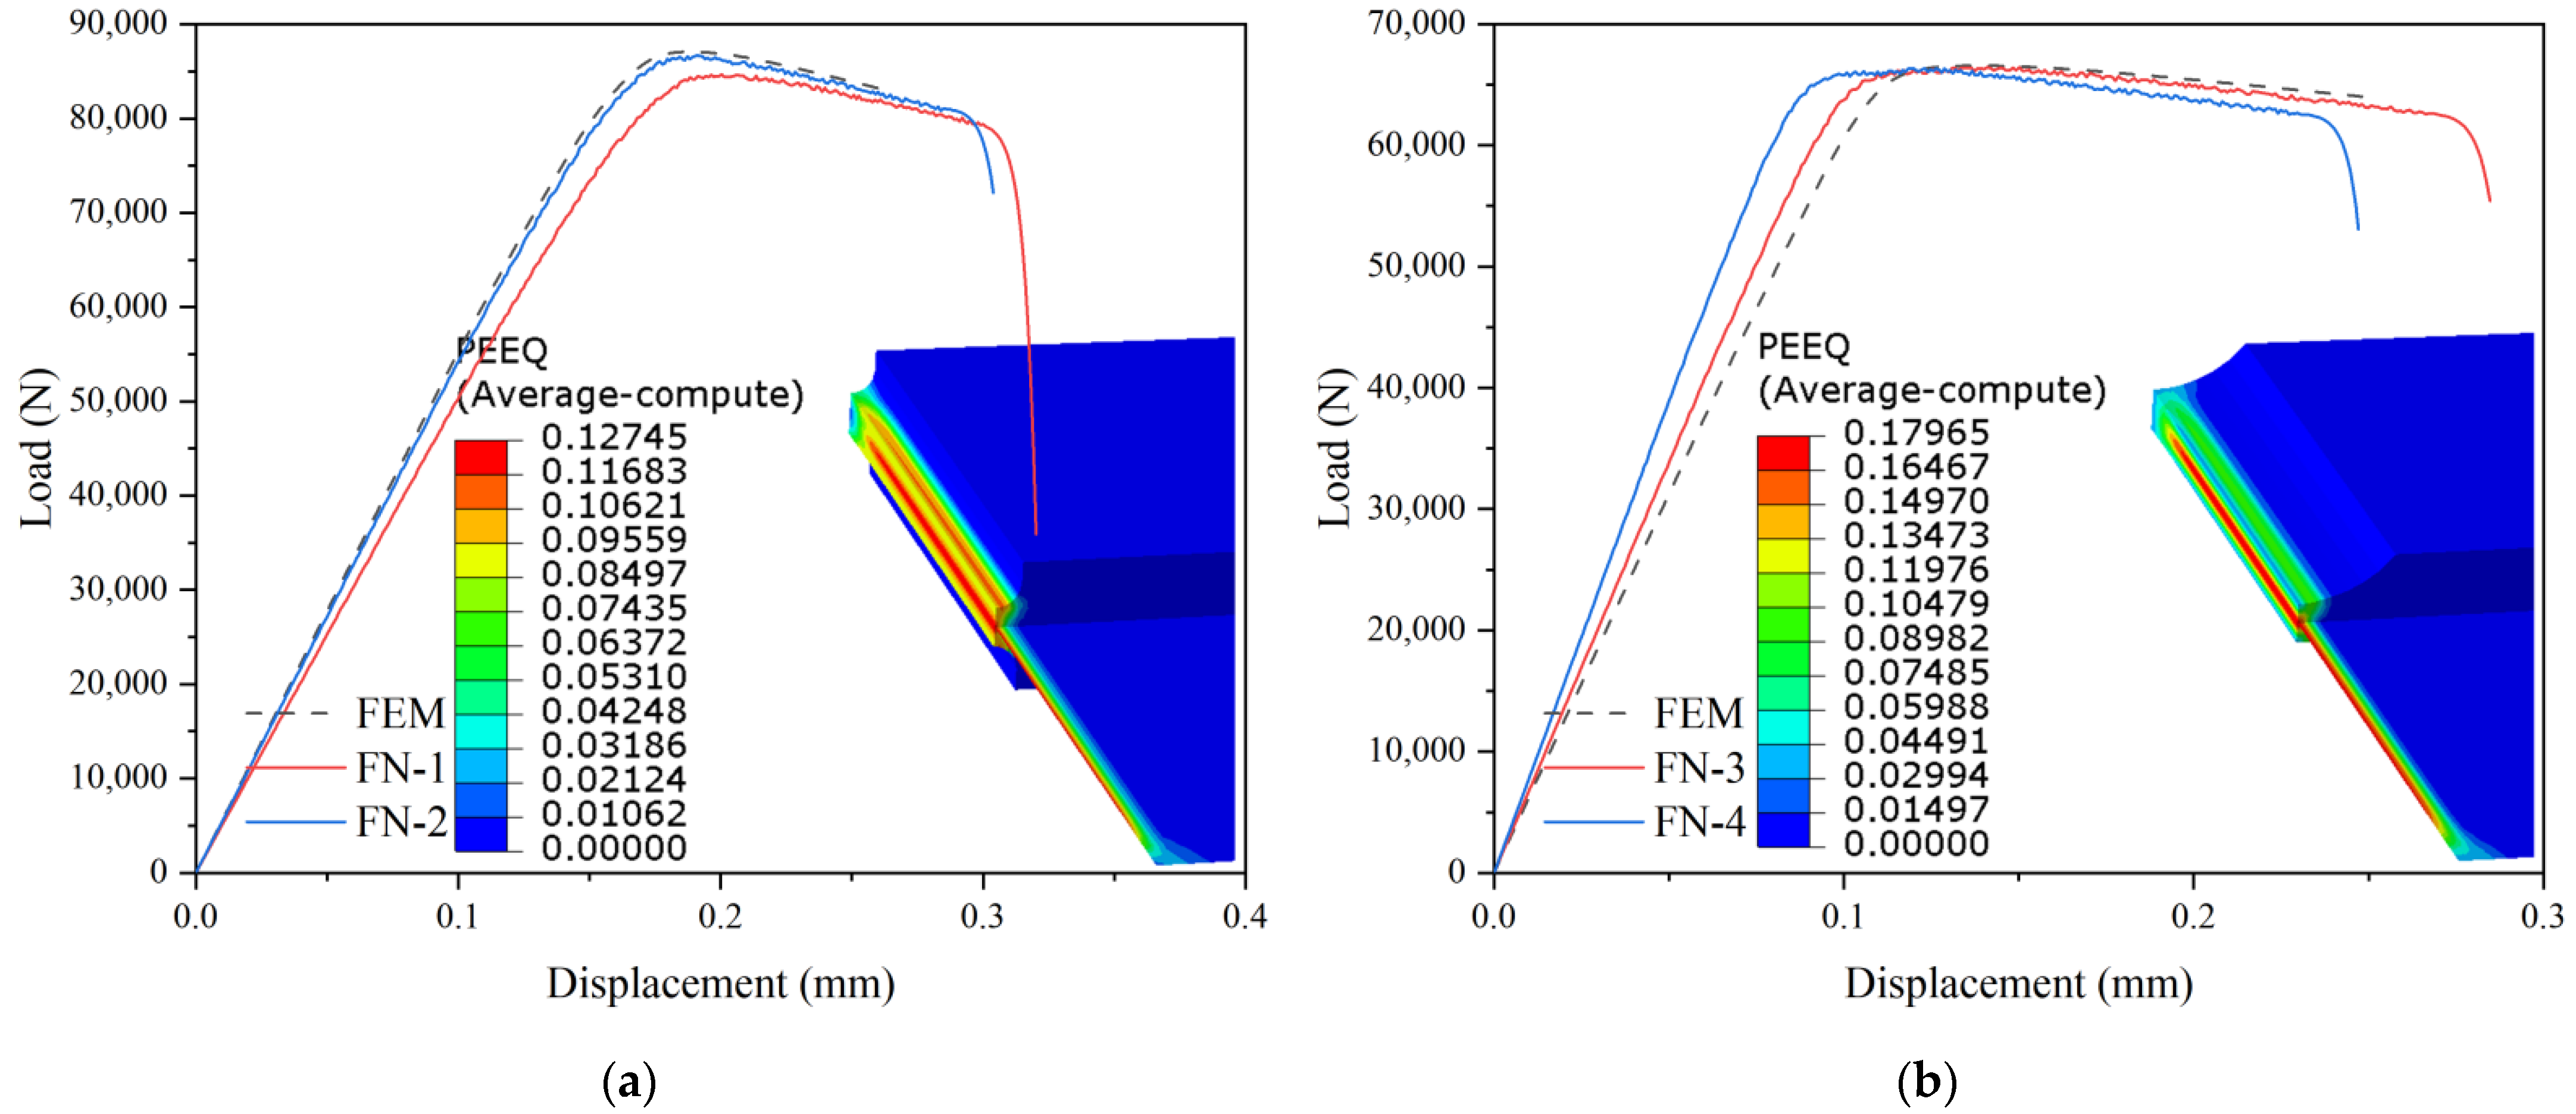
Figure 11 shows the test results compared to the calculation results using ABAQUS of flat grooved plate specimens. Similar to smooth and notched round-bar specimens, the fracture appeared at the centrum of the minimum sections of those specimens. When the stress triaxiality decreases, the large strain areas near the notch surface decrease too and disappear at a certain level. Added to that, the large strain areas become concentrated toward the center and are developed in the direction of tension.
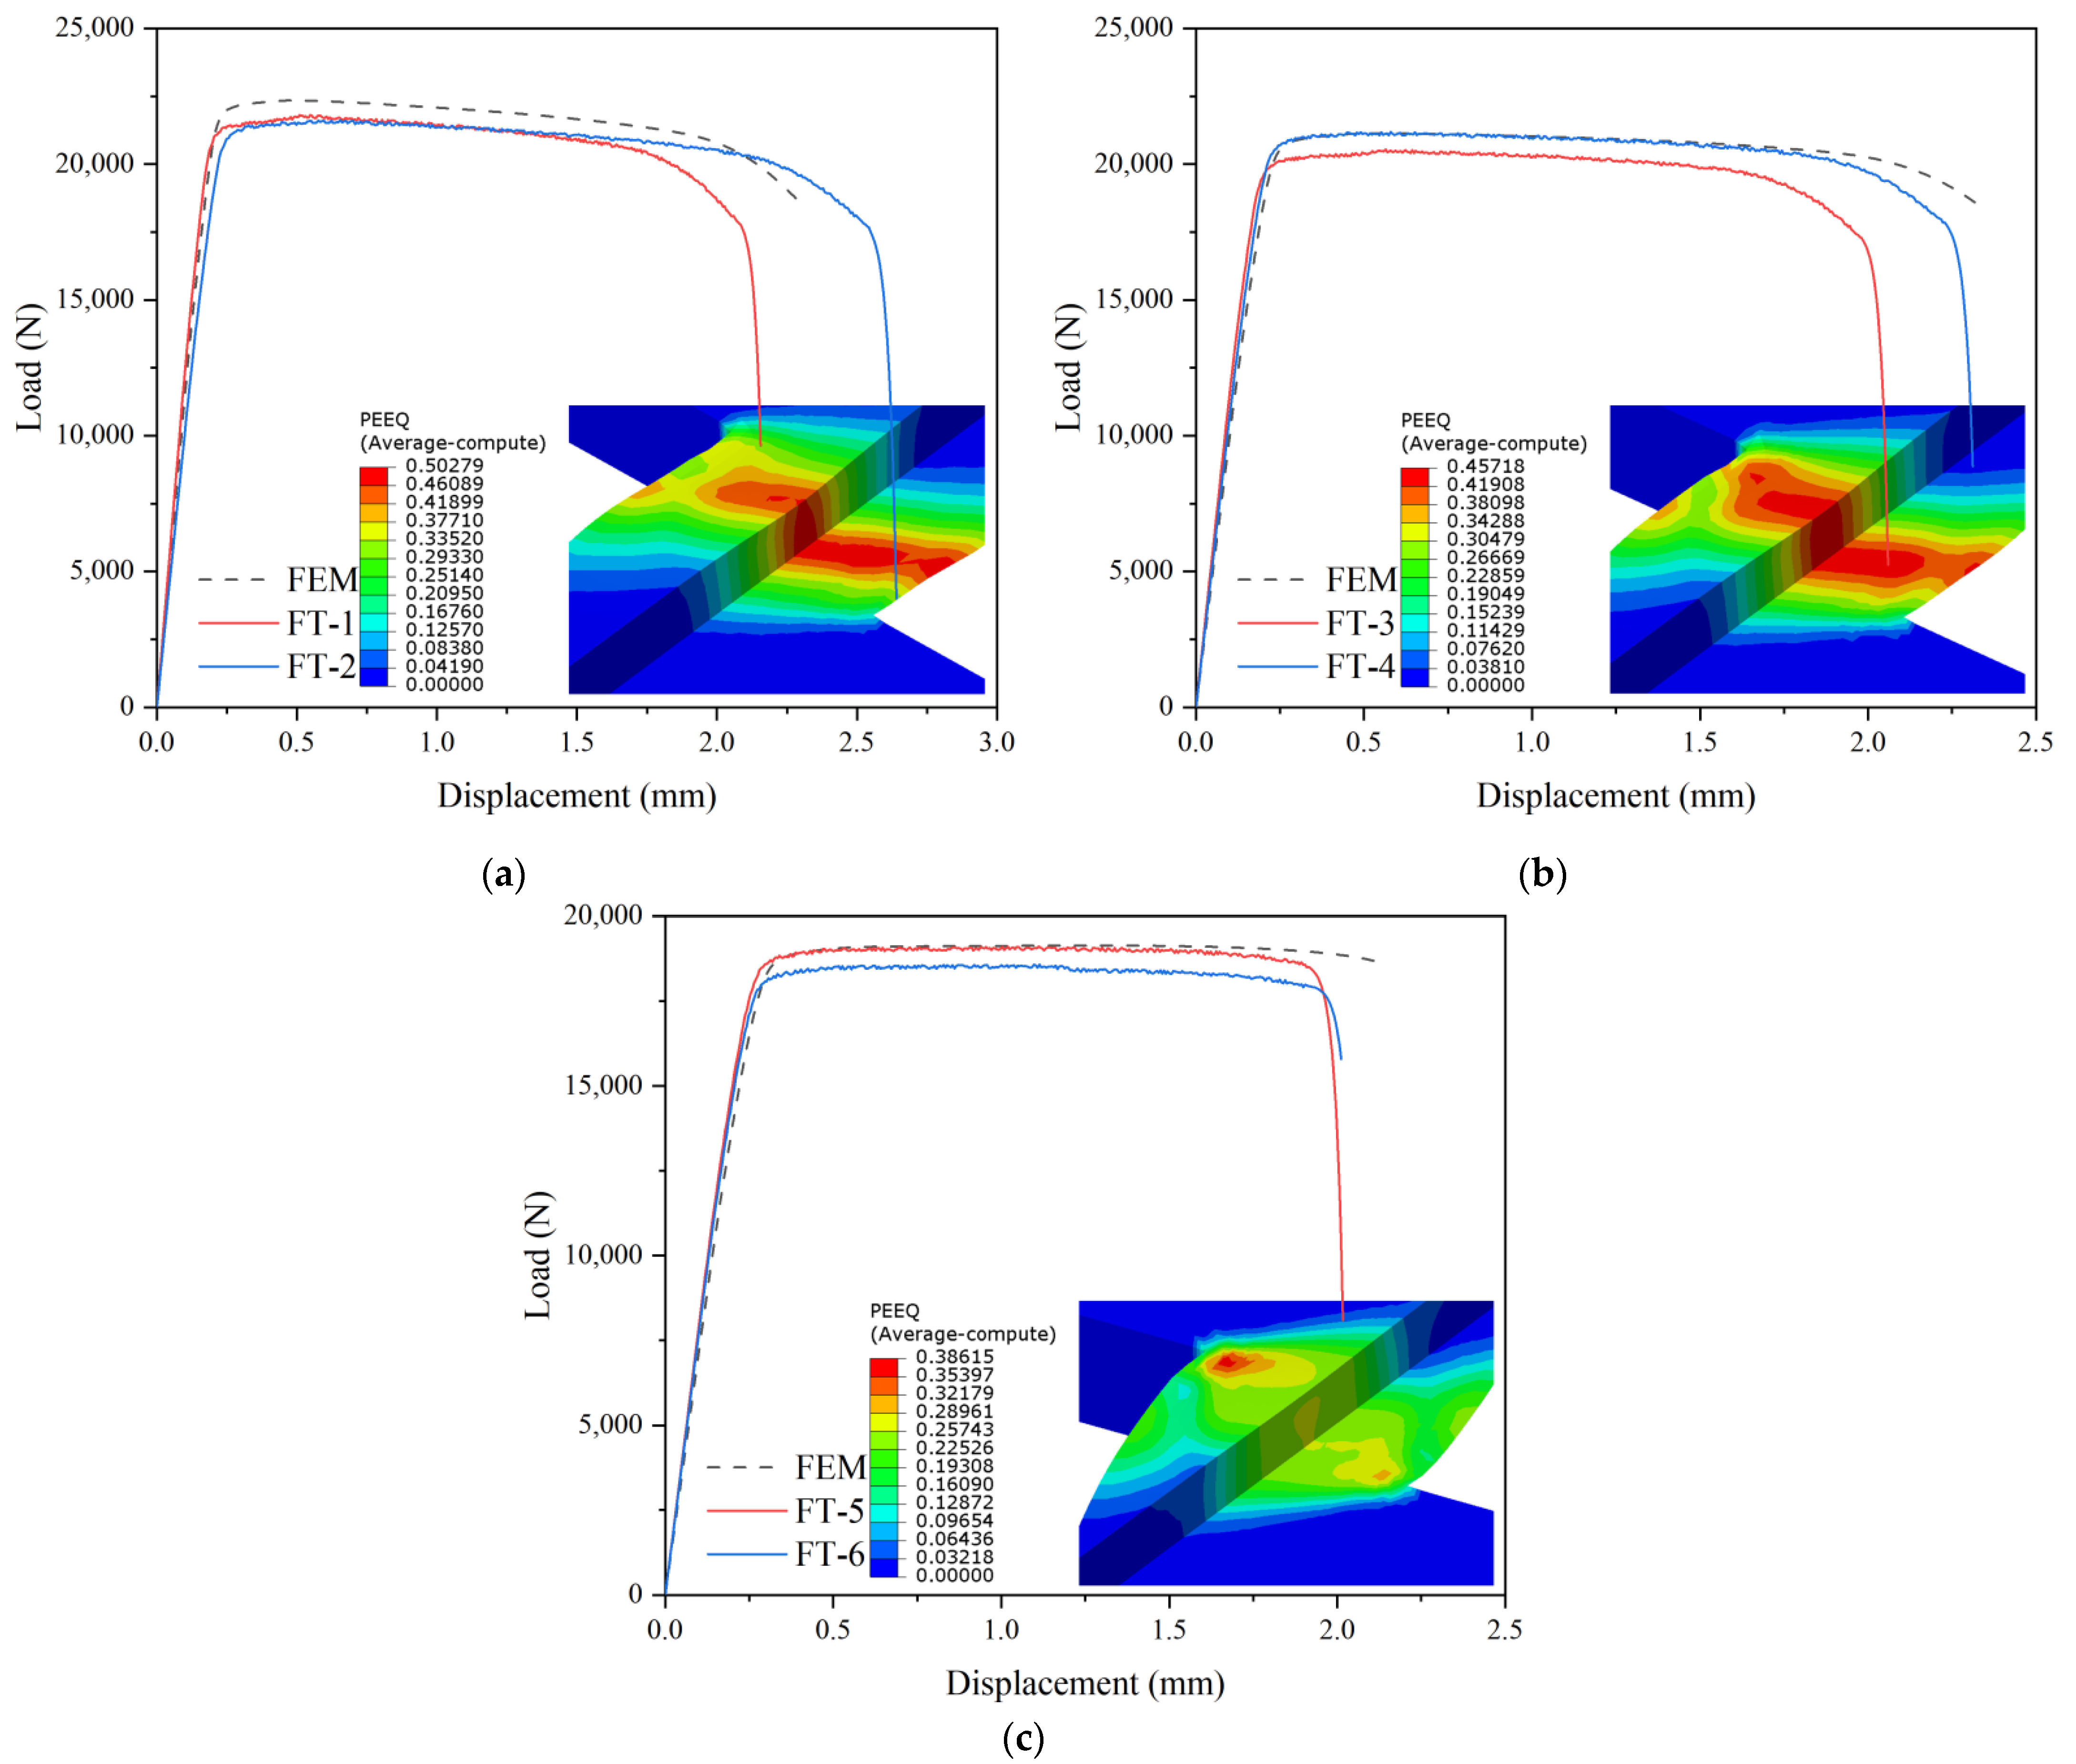
Figure 12 shows the test results and the calculation results of the tensile–shear flat plate specimens. Figure 10, Figure 11 and Figure 12 showed the displacements between the upper and lower grip sections of the specimens, and the repeatability of the grip effect was difficult to control, especially in the tests of the flat grooved plate specimens. The data shown in Figure 10, Figure 11 and Figure 12 was not used in the measurement of true stress–strain curve and fracture strains in this paper. The post-processing plastic strain nephogram revealed that, with the increase in θ s , the stress triaxiality and the Lode angle parameters decrease. The stress triaxialities of the specimens, with θ s = 15°, 20°, 30°, are, respectively equal to 0.195, 0.160 and 0.101, and the Lode angle parameters are 0.778, 0.654 and 0.423, respectively, which is consistent with the microfracture mechanism of the tensile–shear flat plate specimens. The fracture phenomenon of the specimens, with θ s = 15° and 20°, appeared first at the center of these specimens, and the large strain areas are concentrated near their center. The fracture phenomena of tensile–shear specimens with θ s = 30°, were also located on the anti-symmetry surface in the middle of the specimens and not at their center; this indicates that, with the decrease in stress triaxiality, the failure form of shear failure is significantly different from tensile failure.
The load–displacement behaviors of the specimens include linear elasticity, non-linear hardening steady deformation, and strain softening; however, no obvious yield stage has been encountered. This phenomenon indicates that the mechanical properties of materials, produced by cold heading, are quite different from those of ordinary structural steels. Rapid stress-drop phenomena occurred in the finite element models in smooth round-bar specimens and tensile–shear mixed specimens, which were under low stress triaxiality. In the model with high stress triaxiality, no fast stress drop phenomenon has been observed before the fracture of the finite element models, and the fracture occurred suddenly during steady deformation. The expansion of high strain areas towards the increase in stress triaxiality was revealed in the finite element models of round-bar tensile specimens and flat grooved plate tensile specimens, indicating that the deformation of the failure sections become more uniform with the increase in stress triaxiality. On one hand, this may explain the increase in the ultimate load of specimens proportionally with the stress triaxiality. On the other hand, as the stress triaxiality decreases, the high strain areas extend towards the direction of the tension, which increases the ductility of the specimens. It can also explain the phenomenon that the failure displacements of the round-bar test objects and the flat grooved plate test objects increase when the stress triaxiality decreases.

8. Conclusions

In this study, the fracture locus of ML15 cold heading steel was studied by means of tensile testing, microstructure analysis and the finite element method. The influence of stress triaxiality and Lode angle parameters on the fracture behavior of ML15 were investigated. The main conclusions can be summarized as follows:
(1)
The true stress–strain curve of ML15 is basically a straight line before the ultimate load, which clearly demonstrated the hardening of cold heading process on steel. The true stress–strain behavior of ML15 includes linear elasticity, non-linear hardening steady deformation, and strain softening, but no obvious yield stage;
(2)
The fracture locus of ML15 depends on the stress state, which decreases exponentially when the stress triaxiality increases and has different trends under different Lode angle parameters. The Rice–Tracey 2D criterion, which only considers the stress triaxiality, cannot describe the difference in the fracture properties of structural steels under different deviating stress states. The Bai–Wierzbicki 3D criterion, considering the parameters of stress triaxiality and Lode angle, gives a better description of the fracture locus of ML15;
(3)
The microscopic crack characteristics of all round-bar tensile specimens revealed by the scanning electron microscope showed wide and deep dimples, which indicated that the failure mode of all round-bar tensile specimens was ductile fracture. Contrasted with the smooth and notched round round bar specimens, the dimples observed microscopically in the flat notched specimens are smaller and shallower. Microscopic phenomena that change dimple size due to different Lode angle parameters explain why Rice–Tracey model can not accurately predict the fracture strain of ML15 steel. Different microfracture mechanisms were observed in tensile–shear plate specimens including tensile fracture, combined tensile–shear fracture and shear fracture;
(4)
The expansion of high strain areas with the increment of stress triaxiality indicates that the deformation of the failure sections become more uniform with the increase in stress triaxiality. It also explains the increment in ultimate load of specimens along with the stress triaxiality increase. As the stress triaxiality decreases, the high strain areas extend towards the direction of tension, which explains the phenomenon that the ductility of the round bar as well as the flat grooved plate specimens change inversely proportional to the stress triaxiality.

Author Contributions

Y.D.: Conceptualization, Methodology, Writing—Original draft preparation, Visualization, Software. Y.J.: Data curation, Supervision, Software, Validation, Writing—Reviewing and Editing, Project administration, Resources. All authors have read and agreed to the published version of the manuscript.

Funding

This research was funded by “the Fundamental Research Funds for the Central Universities”, grant number 2572019AB15. And funding for this research was also provided by “the Blue Valley to Jiaodong International Airport Fast Track Project”.

Data Availability Statement

Not applicable.

Conflicts of Interest

The authors declare no conflict of interest.

References

  1. McClintock, F.A. A Criterion for Ductile Fracture by the Growth of Holes. J. Appl. Mech. 1968, 35, 363–371. [Google Scholar] [CrossRef]
  2. Rice, J.R.; Tracey, D.M. On the ductile enlargement of voids in triaxial stress fields. J. Mech. Phys. Solids 1969, 17, 201–217. [Google Scholar] [CrossRef] [Green Version]
  3. Kanvinde, A.M. Micro Mechanical Simulation of Earthquake-Induced Fracture in Micro Mechanical Simulation of Earthquake-Induced Fracture in Steel Structures; Stanford University: Stanford, CA, USA, 2004. [Google Scholar]
  4. Johnson, G.R.; Cook, W.H. Fracture characteristics of three metals subjected to various strains, strain rates, temperatures and pressures. Eng. Fract. Mech. 1985, 21, 31–48. [Google Scholar] [CrossRef]
  5. Bao, Y.; Wierzbicki, T. On fracture locus in the equivalent strain and stress triaxiality space. Int. J. Mech. Sci. 2004, 46, 81–98. [Google Scholar] [CrossRef]
  6. Bao, Y.; Wierzbicki, T. On the cut-off value of negative triaxiality for fracture. Eng. Fract. Mech. 2005, 72, 1049–1069. [Google Scholar] [CrossRef]
  7. Xue, L.; Wierzbicki, T. Ductile fracture initiation and propagation modeling using damage plasticity theory. Eng. Fract. Mech. 2008, 75, 3276–3293. [Google Scholar] [CrossRef]
  8. Bai, Y.; Wierzbicki, T. A new model of metal plasticity and fracture with pressure and Lode dependence. Int. J. Plast. 2008, 24, 1071–1096. [Google Scholar] [CrossRef]
  9. Bai, Y.; Wierzbicki, T. Application of extended Mohr–Coulomb criterion to ductile fracture. Int. J. Fract. 2010, 161, 1. [Google Scholar] [CrossRef]
  10. Lou, Y.; Huh, H.; Lim, S.; Pack, K. New ductile fracture criterion for prediction of fracture forming limit diagrams of sheet metals. Int. J. Solids Struct. 2012, 49, 3605–3615. [Google Scholar] [CrossRef] [Green Version]
  11. Marcadet, S.J.; Mohr, D. Effect of compression-tension loading reversal on the strain to fracture of dual phase steel sheets. Int. J. Plasticity 2015, 72, 21–43. [Google Scholar] [CrossRef]
  12. Hu, Q.; Li, X.; Han, X.; Chen, J. A new shear and tension based ductile fracture criterion: Modeling and validation. European J. Mech.-A/Solids 2017, 66, 370–386. [Google Scholar] [CrossRef]
  13. Mu, L.; Zang, Y.; Wang, Y.; Li, X.L.; Stemler, P. Phenomenological uncoupled ductile fracture model considering different void deformation modes for sheet metal forming. Int. J. Mech. Sci. 2018, 141, 408–423. [Google Scholar] [CrossRef]
  14. Cerik, B.C.; Choung, J. Ductile Fracture Behavior of Mild and High-Tensile Strength Shipbuilding Steels. Appl. Sci. 2020, 10, 7034. [Google Scholar] [CrossRef]
  15. Cho, Y.; Lee, C.; Yee, J.-J.; Kim, D.-K. Modeling of Ductile Fracture for SS275 Structural Steel Sheets. Appl. Sci. 2021, 11, 5392. [Google Scholar] [CrossRef]
  16. Peng, J.; Zhou, P.; Wang, Y.; Dai, Q.; Knowles, D.; Mostafavi, M. Stress Triaxiality and Lode Angle Parameter Characterization of Flat Metal Specimen with Inclined Notch. Metals 2021, 11, 1627. [Google Scholar] [CrossRef]
  17. Panwitt, H.; Heyer, H.; Sander, M. Experimental and Numerical Investigation of the Fracture Behavior of Welded Aluminum Cross Joints under Axial Compression. Materials 2020, 13, 4310. [Google Scholar] [CrossRef]
  18. Li, W.; Liao, F.; Zhou, T.; Askes, H. Ductile fracture of Q460 steel: Effects of stress triaxiality and Lode angle. J. Constr. Steel Res. 2016, 123, 1–17. [Google Scholar] [CrossRef]
  19. Yan, S.; Zhao, X.; He, P. Ductility and fracture models of G20Mn5 cast steel. J. Constr. Steel Res. 2020, 175, 106363. [Google Scholar] [CrossRef]
  20. Wilson-Heid, A.E.; Furton, E.T.; Beese, A.M. Contrasting the Role of Pores on the Stress State Dependent Fracture Behavior of Additively Manufactured Low and High Ductility Metals. Materials 2021, 14, 3657. [Google Scholar] [CrossRef]
  21. Zhang, S.; Jia, Y.; Ding, Y. Study on the Flexural Behavior of Steel-Concrete Composite Beams Based on the Shear Performance of Headed Stud Connectors. Buildings 2022, 12, 961. [Google Scholar] [CrossRef]
  22. Alsharari, F.; El-Sisi, A.E.-D.; Mutnbak, M.; Salim, H.; El-Zohairy, A. Effect of the Progressive Failure of Shear Connectors on the Behavior of Steel-Reinforced Concrete Composite Girders. Buildings 2022, 12, 596. [Google Scholar] [CrossRef]
  23. Bridgman, P.W. Studies in Large Plastic Flow and Fracture: With Special Emphasis on the Effects of Hydrostatic Pressure; McGraw-Hil: New York, NY, USA, 1952. [Google Scholar]
  24. GB/T 10433-2002; Cheese Head Studs for Arc Stud Welding. China Machinery Industry Federation: Beijing, China, 2002.
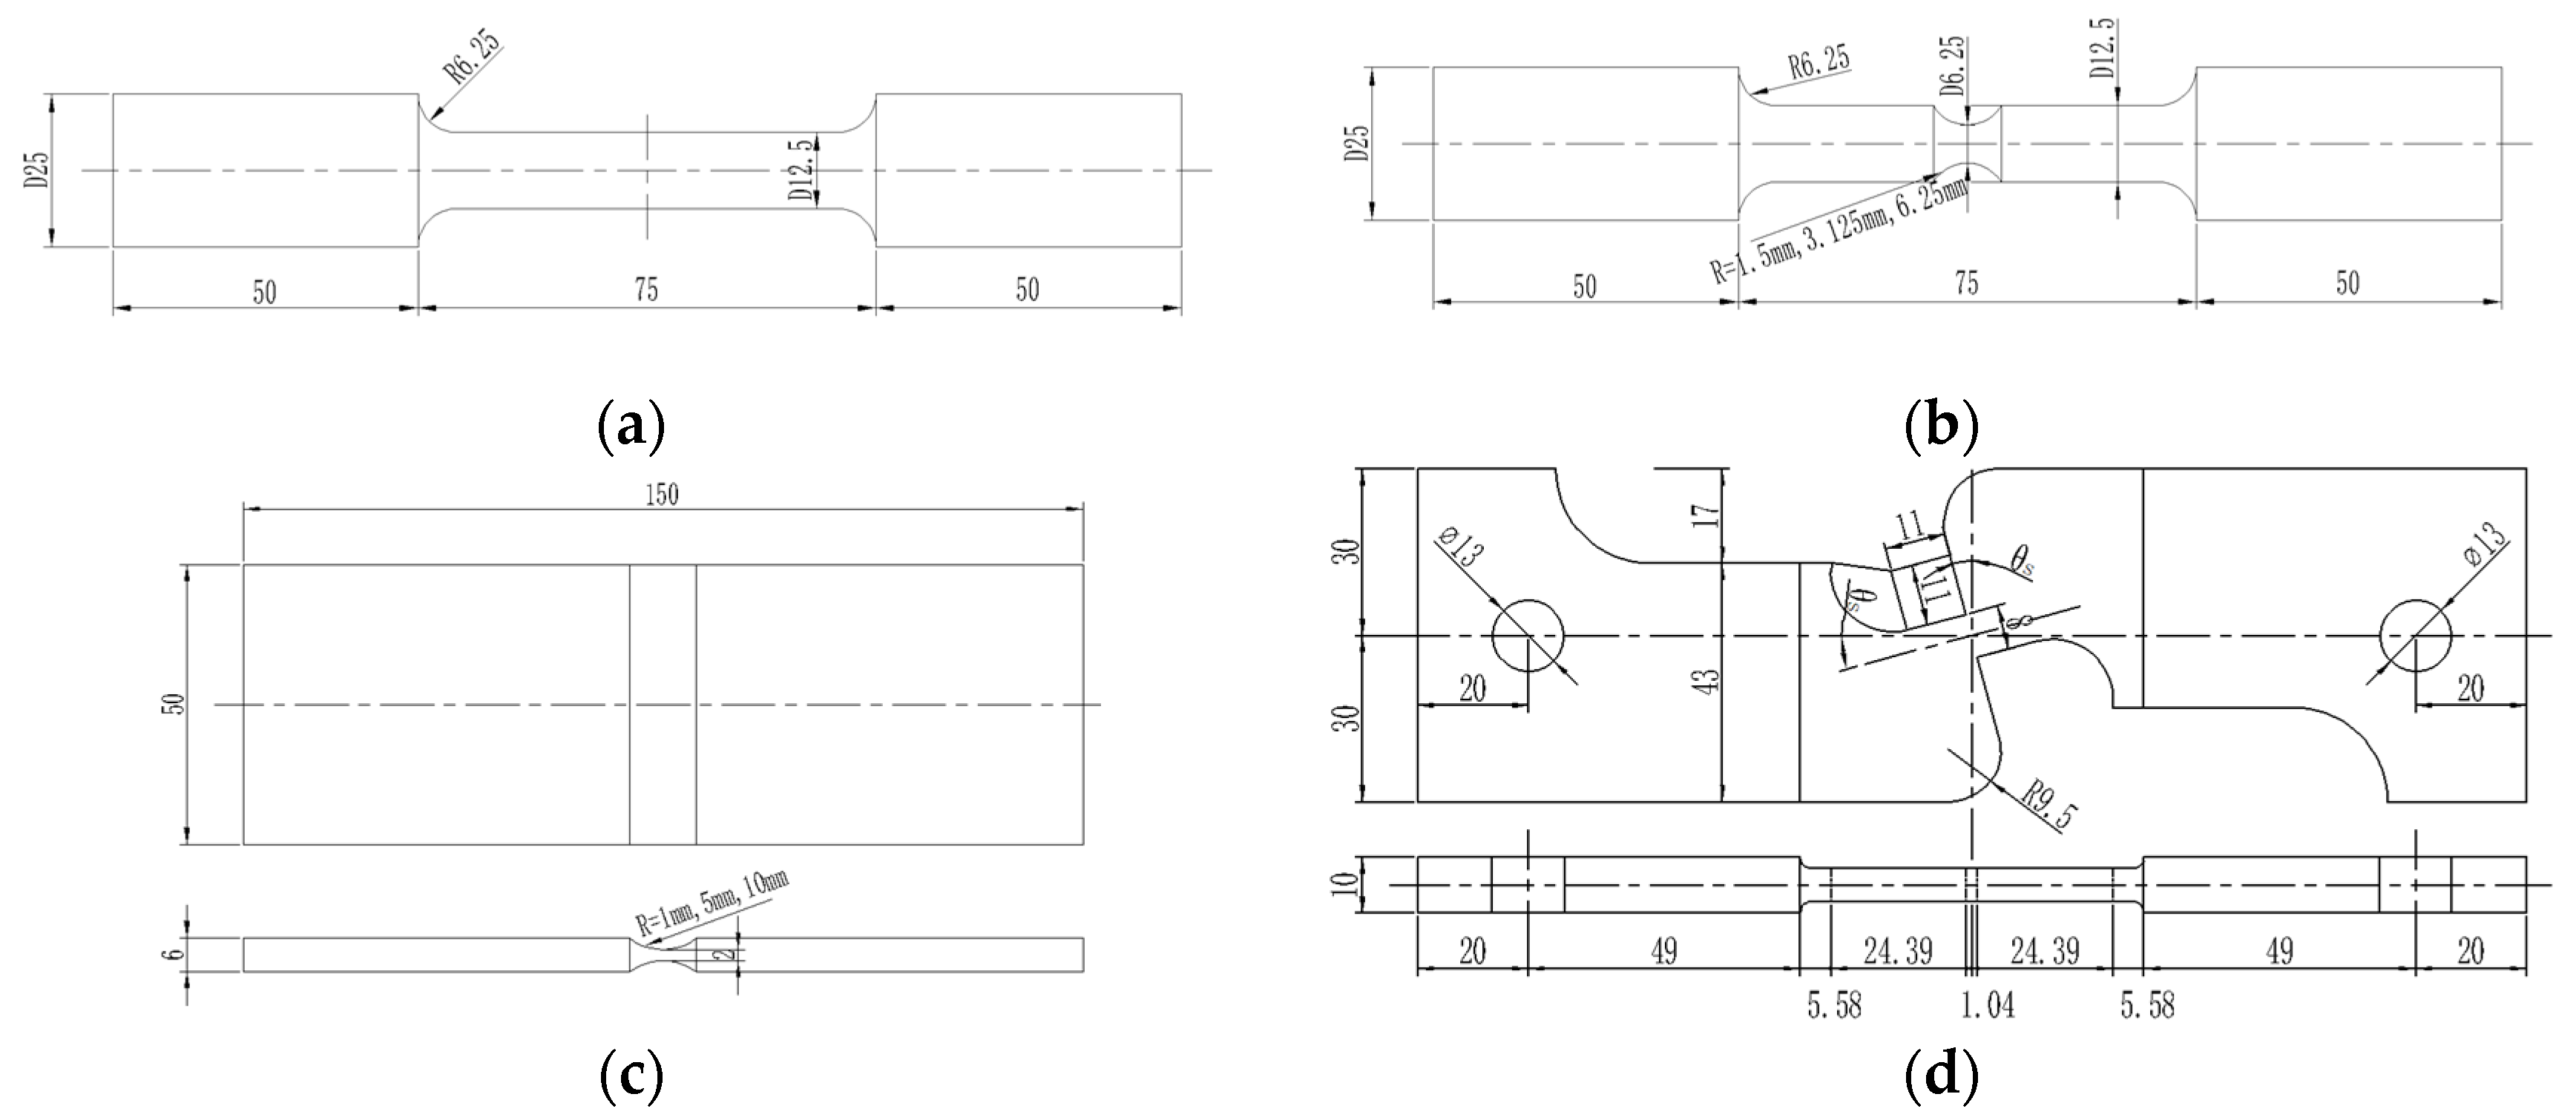
Figure 1. Geometries of the test specimens (dimensions in millimeters): (a) smooth round bars, (b) notched round bars, (c) flat grooved plates, (d) tensile–shear flat plates.
Buildings 12 02128 g001
Figure 2. Fracture topography of smooth round bars: (a) RS-1, (b) RS-2, (c) RS-3.
Buildings 12 02128 g002
Figure 3. True stress–strain curve of ML15.
Buildings 12 02128 g003
Figure 4. Fracture topography of notched round bars: (a) RN-1 (1.5 mm), (b) RN-2 (1.5 mm), (c) RN-3 (3.125 mm), (d) RN-4 (3.125 mm), (e) RN-5 (6.25 mm), (f) RN-6 (6.25 mm).
Buildings 12 02128 g004
Figure 5. Fracture topography of flat grooved plates: (a) FN-1 (1 mm), (b) FN-2 (1 mm), (c) FN-3 (5 mm), (d) FN-4 (5 mm), (e) FN-5 (10 mm), (f) FN-6 (10 mm).
Buildings 12 02128 g005
Figure 6. Fracture topography of tensile–shear flat plates: (a) FT-1 ( θ s = 15°), (b) FT-2 ( θ s = 15°), (c) FT-3 ( θ s = 20°), (d) FT-4 ( θ s = 20°), (e) FT-5 ( θ s = 30°), (f) FT-6 ( θ s = 30°).
Buildings 12 02128 g006
Figure 7. Fracture locus of ML15: (a) Rice–Tracey model, (b) Bai–Wierzbicki model.
Buildings 12 02128 g007
Figure 8. The microscopic fracture characteristics of the ML15 steel as assessed by the scanning electron microscope.
Buildings 12 02128 g008aBuildings 12 02128 g008bBuildings 12 02128 g008c
Figure 9. Finite element model of specimens: (a) smooth round bars, (b) notched round bars, (c) flat grooved plates, (d) tensile–shear flat plates.
Buildings 12 02128 g009
Figure 10. Contrast of load–displacement behavior between the tensile test and the finite element mothod for the smooth and notched round bar: (a) smooth round bar (RS-1, 2, 3), (b) RN-1 and RN-2 (notch radius = 1.5 mm), (c) RN-3 and RN-4 (notch radius = 3.125 mm), (d) RN-5 and RN-6 (notch radius = 6.25 mm).
Buildings 12 02128 g010aBuildings 12 02128 g010b
Figure 11. Contrast of load–displacement behavior between the tensile test and the finite element method for the flat grooved plate specimens: (a) FN-1 and FN-2 (notch arc radius = 1 mm), (b) FN-3 and FN-4 (notch arc radius = 5 mm), (c) FN-5 and FN-6 (notch arc radius = 10 mm).
Buildings 12 02128 g011aBuildings 12 02128 g011b
Figure 12. Contrast of load–displacement behavior between the tensile test and the finite element mothod for tensile–shear flat plate: (a) FT-1 and FT-2 ( θ s = 15°), (b) FT-3 and FT-4 ( θ s = 20°), (c) FT-5 and FT-6 ( θ s = 30°).
Buildings 12 02128 g012
Table 1. Analysis of the test results with respect to the different parameters related to stress and fracture.
Specimenη θ ¯ ε ¯ f Specimenη θ ¯ ε ¯ f
RN-10.7410.1898FN-11.0500.1575
RN-20.7410.1484FN-21.0500.1020
RN-31.0310.2731FN-30.6900.2010
RN-41.0310.2091FN-40.6900.1482
RN-51.4610.3172FN-50.6300.2063
RN-61.4610.4443FN-60.6300.1857
RS-10.3310.5485RS-20.3310.5071
RS-30.3310.5623
Publisher’s Note: MDPI stays neutral with regard to jurisdictional claims in published maps and institutional affiliations.