Article

The Seismic Performance and Global Collapse Resistance Capacity of Infilled Reinforced Concrete Frames Considering the Axial–Shear–Bending Interaction of Columns

1
College of Civil Engineering, Nanjing Forestry University, Nanjing 210037, China
2
Key Laboratory of Disaster Prevention and Mitigation in Civil Engineering of Gansu Province, Lanzhou University of Technology, Lanzhou 730050, China
3
Key Laboratory of Roads and Railway Engineering Safety Control, Shijiazhuang Tiedao University, Ministry of Education, Shijiazhuang 050043, China
*
Author to whom correspondence should be addressed.
Buildings 2022, 12(11), 2030; https://doi.org/10.3390/buildings12112030
Submission received: 29 October 2022 / Revised: 17 November 2022 / Accepted: 18 November 2022 / Published: 20 November 2022

Abstract

:
This paper presents a mechanism and method for simulating the axial–shear–bending interaction of a reinforced concrete (RC) column. The three-dimensional model of a multi-story infilled RC frame was modeled using the OpenSees software. Static pushover and nonlinear dynamic analyses under fortification and rare earthquakes were conducted using the model. Finally, based on the incremental dynamic analyses of 22 suites of ground-motion records, the global collapse resistance capacity of the infilled RC frame was evaluated using the evaluation method of a normal distribution. The analytical results show that the axial–shear–bending interaction is a key factor that affects the seismic response of infilled RC frames. Under the fortification earthquake condition, no obvious damage to physical structures was evident; the influence was relatively minor. However, under the condition of a rare earthquake, severe damage to physical structures was evident, resulting in the underestimation of the lateral inter-story drift ratio, while the degradation rates of the load capacity and global collapse resistance capacities for the infilled concrete frames were highly overestimated when the axial–shear–bending interaction was not considered.

1. Introduction

In recent years, the investigation of the seismic performance and global collapse resistance capacity of structures exposed to major earthquakes has become a major research topic in the field of earthquake engineering [1,2,3,4,5,6,7]. Correspondingly, some methodologies used to forecast the global behavior of buildings under earthquake conditions have been proposed in the literature, prior to determining the resources available for seismic risk mitigation [8]. At present, the research relating to the infilled reinforced concrete (RC) frame mainly focuses on structural components [9,10], whereas non-structural components, such as unreinforced masonry infill walls, are generally overlooked in seismic analyses [11]. During the design phase, only the contribution of unreinforced masonry infill walls to the overall lateral stiffness of structures is considered, but the interaction between the unreinforced masonry infill walls and overall frame is not explicitly considered. However, it can be concluded from the effects of earthquake damage that unreinforced masonry infill walls have a clear effect on the lateral stiffness, horizontal bearing capacity, force-transfer mechanism, and failure modes of the overall frame [10].
Additionally, the damage to the RC columns is mainly caused by the bending moment, shear force, and axial force. A considerable amount of research and seismic codes relating to the bending damage of columns have been conducted in this research area. It can be concluded that bending deformation is caused by the moment generated by the horizontal load and varies with the moment along the entire length of the column. Under the action of moment, the longitudinal reinforcement of the column may be subjected to an outward pulling force, and slip occurs along the anchorage area, which may result in the bond slip deformation of the column members. Under the action of horizontal load, the full-length section of the column may bear a shear force, and shear deformation is generated [12]. Considering the complexity of shear damage and the interaction between shear, axial, and bending forces, some seismic design codes have provided some beneficial qualities to strengthen materials to guarantee that columns, during an earthquake, are only exposed to bending damage. Previous earthquake-damage investigations [4,5,6,7] showed that shear failure is an important failure mode for RC frame columns or piers, which is the main reason for the decline in the axial-bearing capacity and sudden collapse of structures, and should receive more attention in the research. Previous research [13,14,15] has shown that the stirrup-reinforcement ratio may affect the degradation rates of the deformation, shear, and axial-load capacities of columns, thus causing severe damage to, or even the collapse of, structures during major earthquakes. Moreover, if shear and slip deformations are overlooked in the analysis, it is easy to underestimate the overall deformation rate of the structure, leading to safety hazards. Therefore, it is necessary to study the seismic performance of RC columns, while considering the shear action to evaluate the limit state of near-collapse for reinforced concrete frames.
As previously mentioned, the damage inflicted on columns may be caused by three deformation components: bending, shear, and axial. Therefore, it is a great challenge to accurately stimulate these three deformation components using finite element analysis software and to perform further evaluations of their seismic performance and global collapse resistance capacity [13,14]. Although the mainstream finite element model based on a fiber-based section can precisely stimulate the axial and bending deformations of a column, the shear deformation and the interaction between the shear, bending, and axial deformations cannot be modeled [16,17]. However, as previously mentioned, the RC columns exposed to earthquakes indicate that lateral deformations are mainly caused by the axial–shear–bending interaction of the beam-to-column connection [18]. Therefore, it is necessary to consider the axial–shear–bending interaction of RC columns in the seismic analyses of RC frames. Incorporating the experimental tests and theoretical analysis, Elwood [18] proposed that the method of using a shear spring attached to the end of a common fiber-based, nonlinear beam–column element can effectively simulate the coupling effect of the axial–shear–bending response.
In this study, firstly, a model using a shear spring attached to the end of a common fiber-based, nonlinear beam–column element to consider the axial–shear–bending interaction of RC columns was derived. Secondly, a three-dimensional numerical model of an infilled RC-frame model considering the axial–shear–bending interaction was built via OpenSees. Finally, a static pushover analysis and incremental dynamic analysis (IDA) using 22 suites of ground-motion records were conducted. The results are used to understand the influence of the axial–shear–bending interaction of RC columns on the seismic behavior of structures during fortification and rare earthquakes, so as to evaluate the global collapse resistance capacity of the RC frames during major earthquake events.

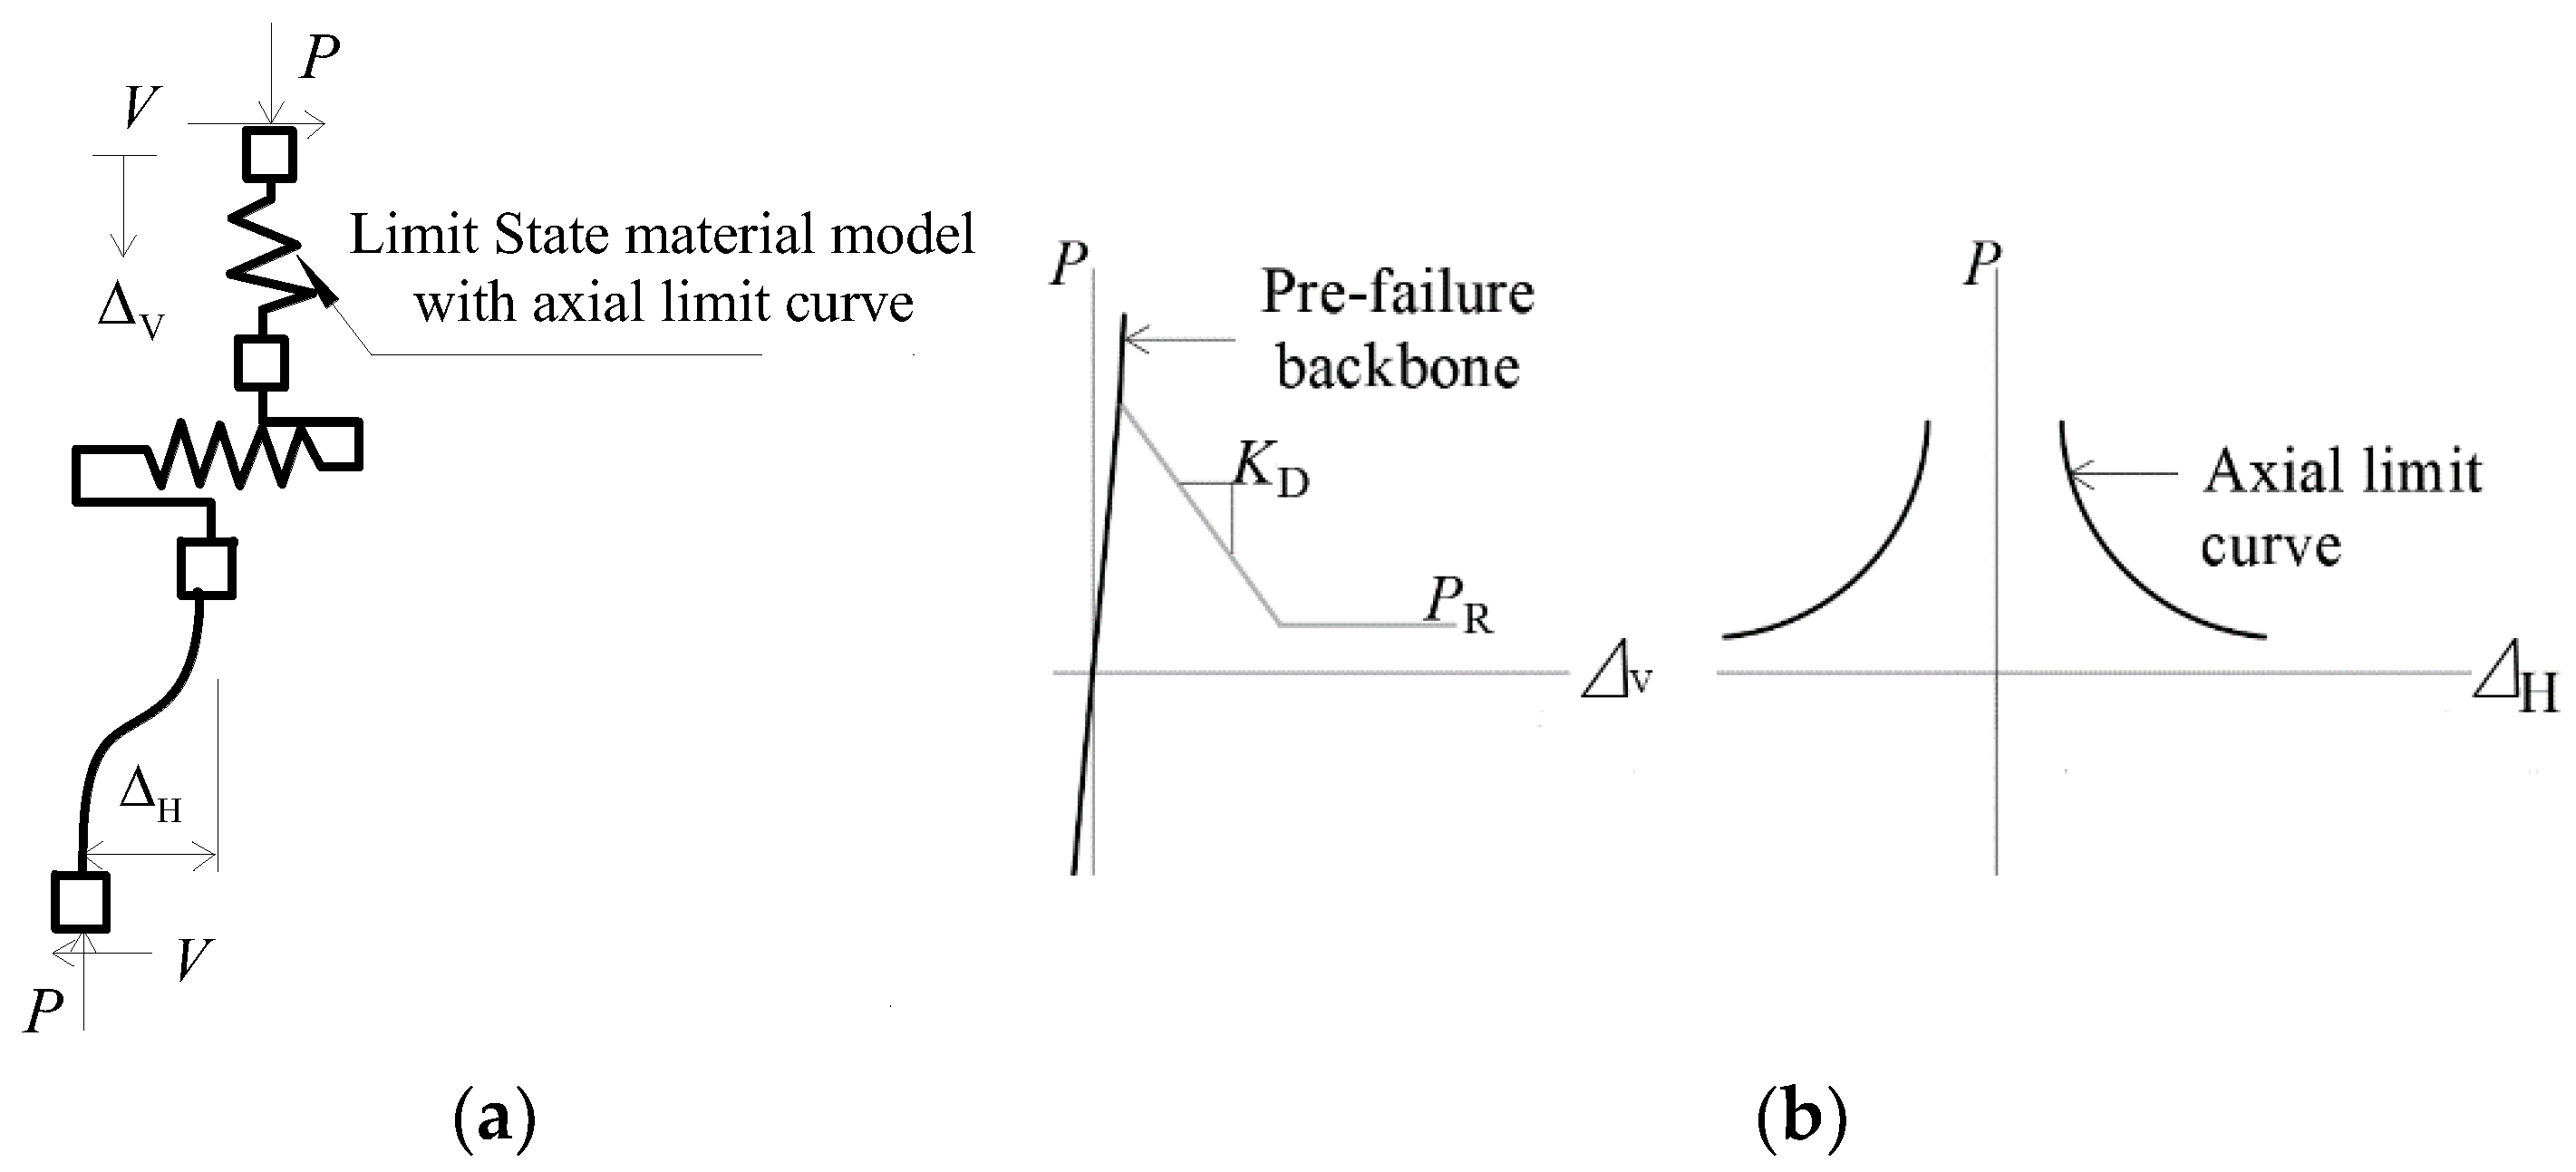
2. Model Method for RC Columns Considering the Axial–Shear–Bending Interaction

Considering that the shear deformation of the RC column is one of the main failure modes of RC frames during earthquake events, and the fiber-based, nonlinear beam–column element used in the present study cannot effectively simulate this failure mode, the alternative method used to consider the shear deformation, in addition to the interaction between shear, axial, and bending damage, is illustrated in Figure 1. For this method, the shear behavior of the column was modeled using a shear spring placed at the end of the column. Moreover, the axial and bending behaviors of the RC columns were decoupled. Therefore, an axial spring placed at the end of column was also used to model the axial behavior of the RC columns. The fiber-based, nonlinear beam–column element was defined only by the bending moment of the columns.

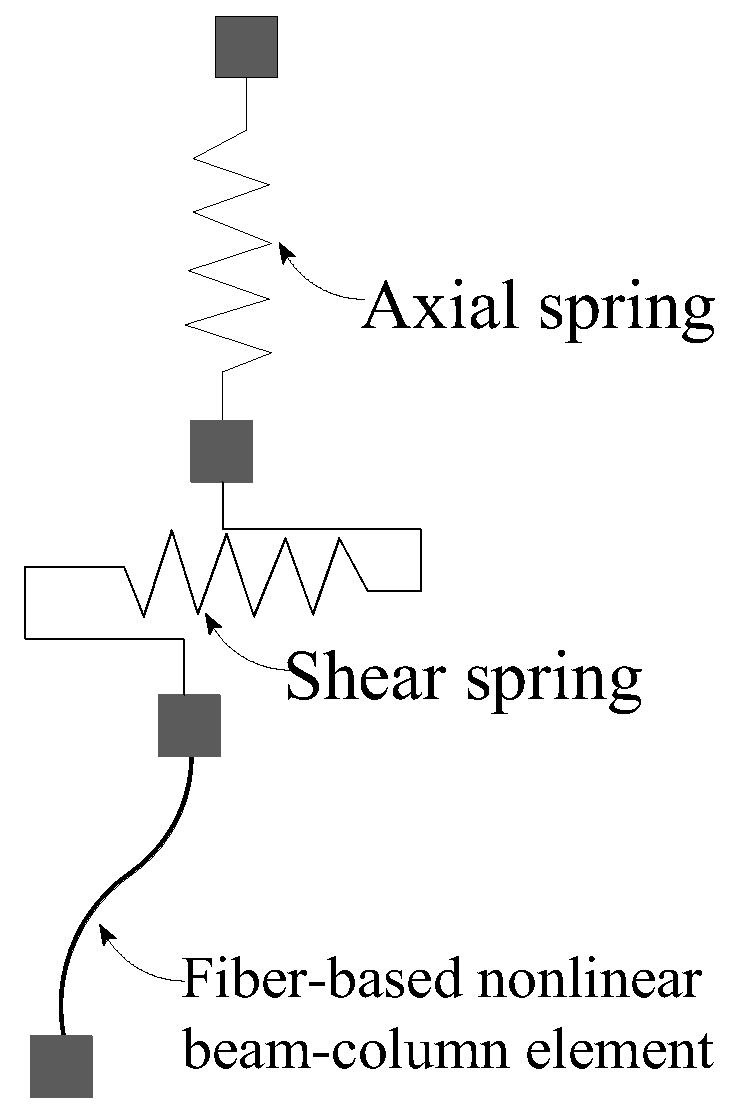
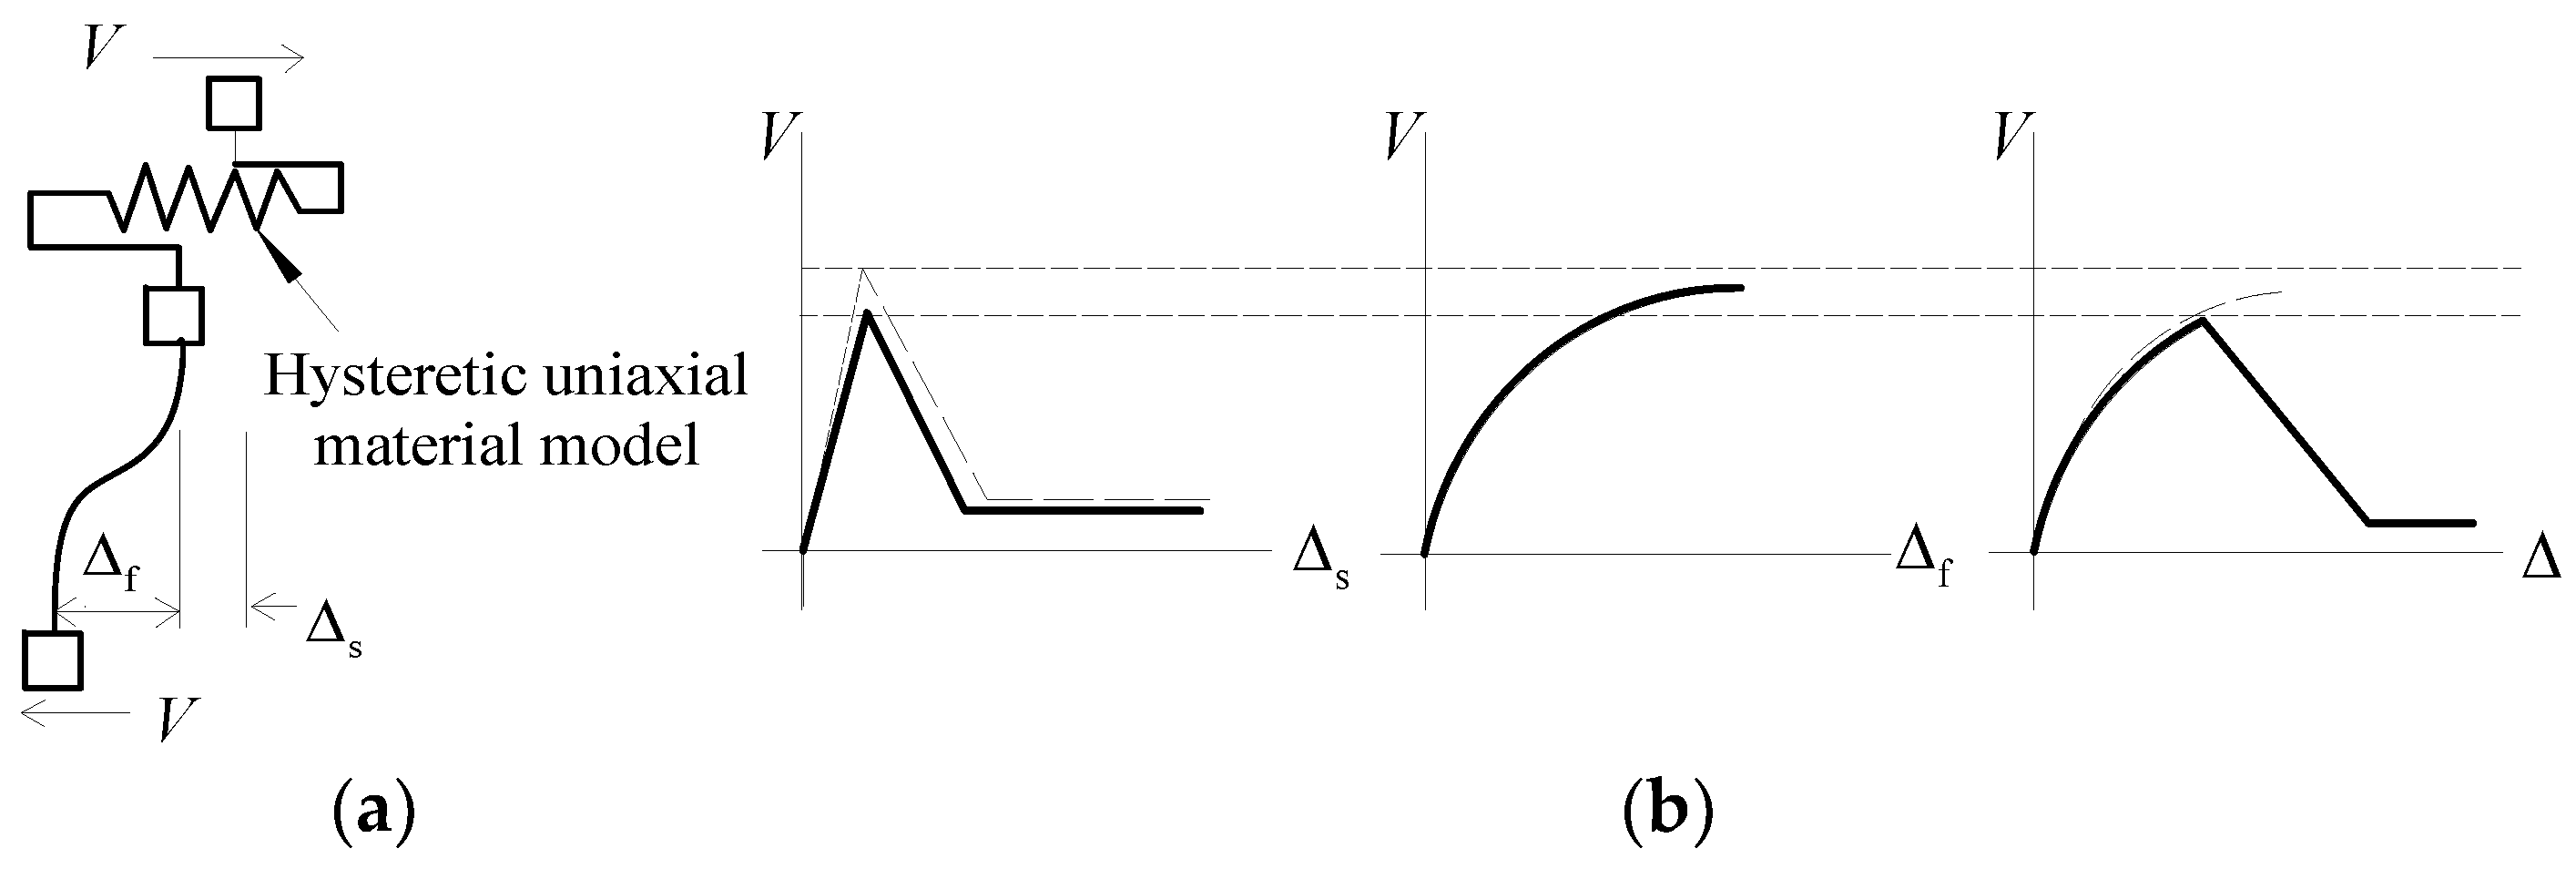
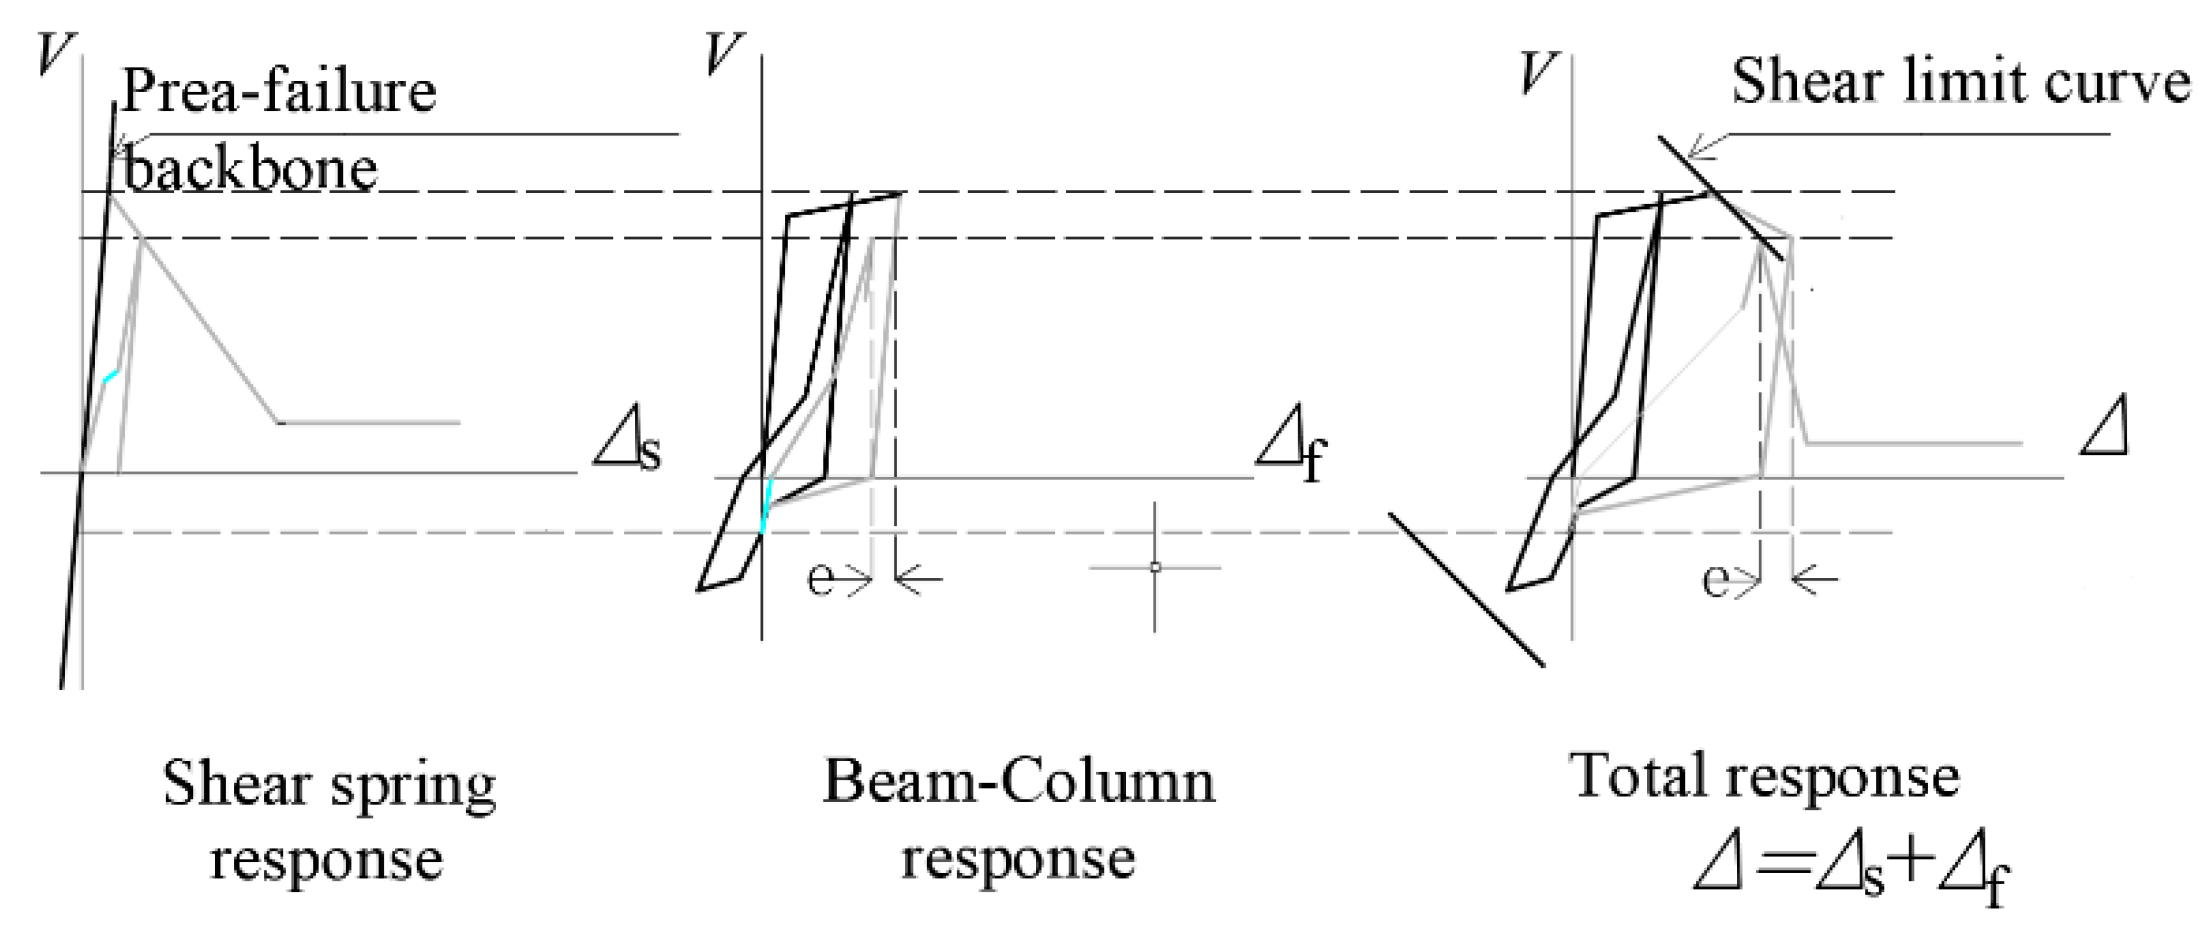
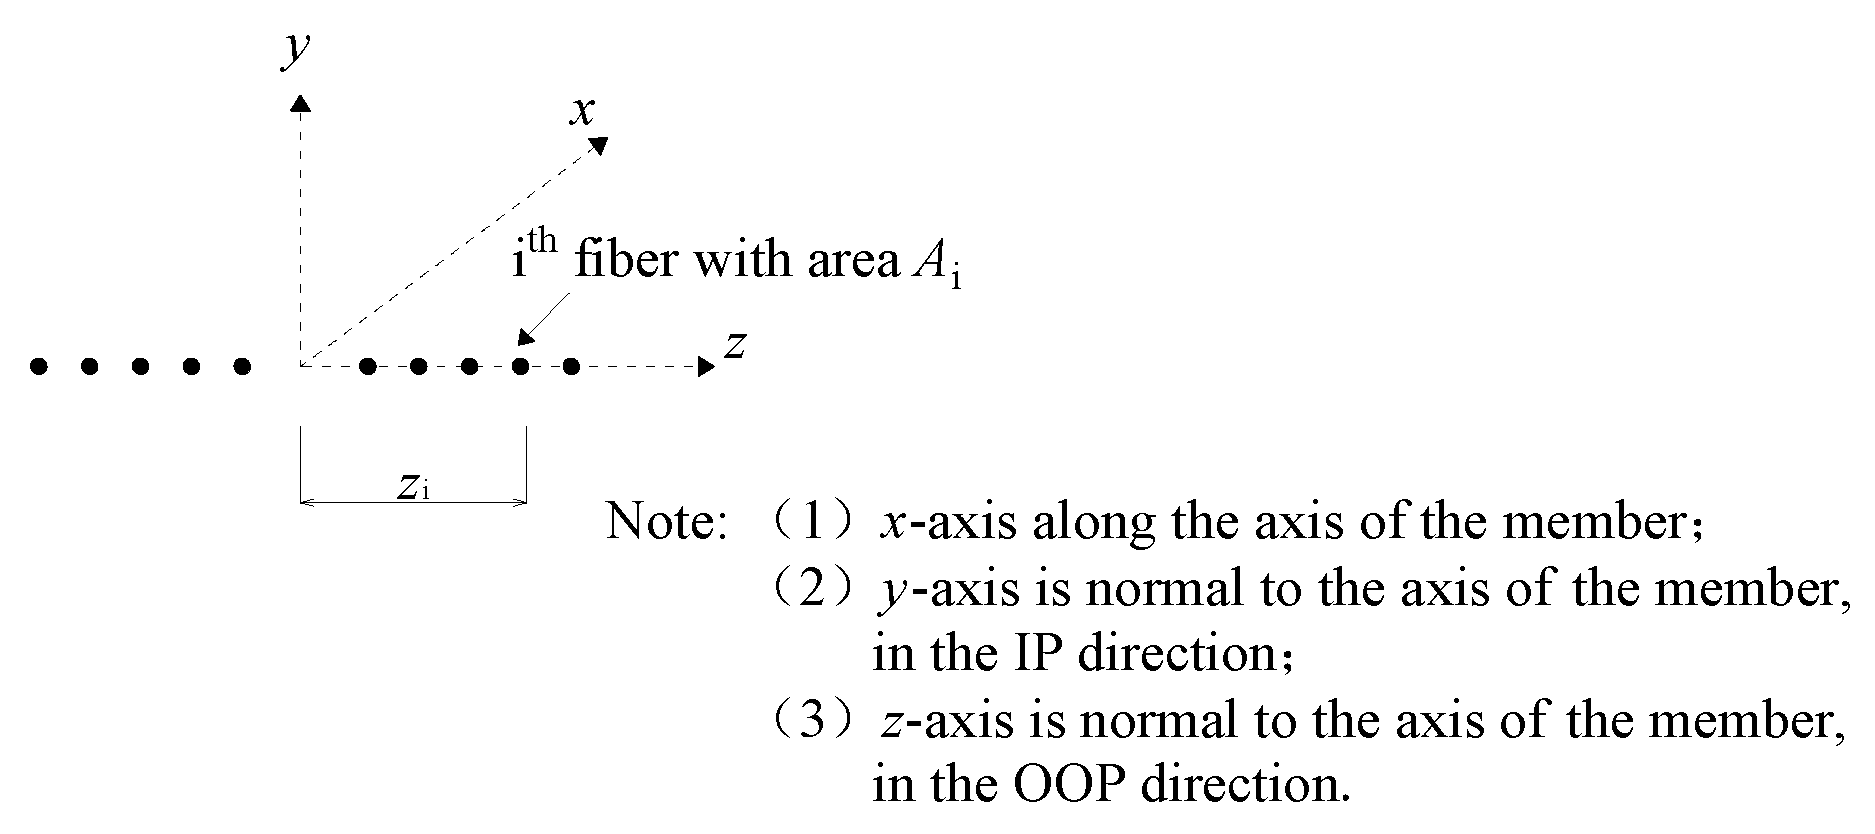
2.1. Stimulation for the Shear Deformation of RC Columns

2.1.1. Mechanism of the Interaction between Axial and Bending Deformations

Figure 2 presents the shear-critical column model based on a uniaxial hysteretic material model, where V is the shear force applied to the column ends; Δs and Δs are the shear and bending deformations of the column, respectively; and Δ is the total deformation caused by moment and shear forces. As presented in Figure 2a, a horizontal shear spring placed at the end of column is used to simulate the shear deformation, which is coupled with the bending deformation of the RC column. The coupled bending–shear-failure model is presented in Figure 2b; the shear deformation of the column is simulated by the shear spring, and the bending deformation is simulated by the fiber-based, nonlinear beam–column element. Therefore, the definition of the hysteretic behaviors includes two aspects: one describes the shear spring, which is used to model the shear force versus shear deformation curves and stiffness degradation of the RC frames caused by shear failure; the other describes the fiber-based, nonlinear beam–column element. It can be understood from the research that the axial deformation of a column mainly occurs following the occurrence of shear and bending damage [17,18]. Therefore, for decoupling the bending from the axial response of the columns, the fiber-based, nonlinear beam–column element should be defined only according to the bending moment of the column. The axial deformation is defined by an axial spring, as illustrated in Figure 1. When the external load is less than the shear-resistance capacity of the RC columns, the deformation of the RC column mainly includes the bending deformation, and the shear deformation is not developed. Otherwise, when the external load is greater than the shear-resistance capacity, the deformation of the RC column mainly includes the shear deformation.
The shear-resistance capacity of the RC columns is presented as Equation (1) [17]:
V u = A sv f sv h 0 s + [ 0.5 f c a / h 0 1 + P 0.5 f c A g ] 0.8 A g
where Vu is the shear-resistance capacity of the RC columns, Asv is the area of transverse stirrups, s is the stirrup spacing, a is the shear-deformation span of the RC column, h0 is the effective height of the column section, P is the axial force loaded on the column, Ag is the total area of the column section, fyv is the yield strength of the transverse stirrups, and fc′ is the axial compressive strength of concrete.

2.1.2. Limit Curve of a Shear Spring Based on Limit-State Uniaxial Material

It should be noted that the inter-story drift ratio corresponding to the shear deformation was less than that of the bending deformation of the columns. Therefore, the limit conditions for the shear deformation of the columns should be defined to accurately distinguish between their shear and bending deformations. Based on the theoretical and experimental analyses performed, a shear limit curve was proposed to define the range of the inter-story drift ratio corresponding to the shear deformation of the column, as shown in Figure 3. The shear limit curve is a function related to the capacity of the inter-story drift ratio, as shown in Equation (2) [17]:
Δ s L = 3 100 + 4 ρ 1 40 v f c 1 40 p A g f c 1 100
where Δ s L is the inter-story drift ratio of the column corresponding to the shear failure, ρ is the transverse reinforcement ratio, and v is the nominal shear stress.
Figure 4 shows the shear limit curve. It can be observed that prior to the occurrence of shear failure, the shear force linearly increases with the shear deformation, Δ s ; the stiffness of the increased linear stage is equal to the shear stiffness of columns without the cracking of the concrete. Once the shear force attains the appropriate shear capacity, the shear deformation value reaches the shear limit curve; the shear force versus shear deformation curve presents an obvious degradation. Figure 4 shows that the degradation stage is also defined as a linear decreasing stage; the slope for this degradation stage is defined as K D . According to Elwood [19,20], the shear force is not degraded to zero while at a constant value, which is defined as the residual strength, F R . The calculation of K D and F R is presented in Section 2.1.3.

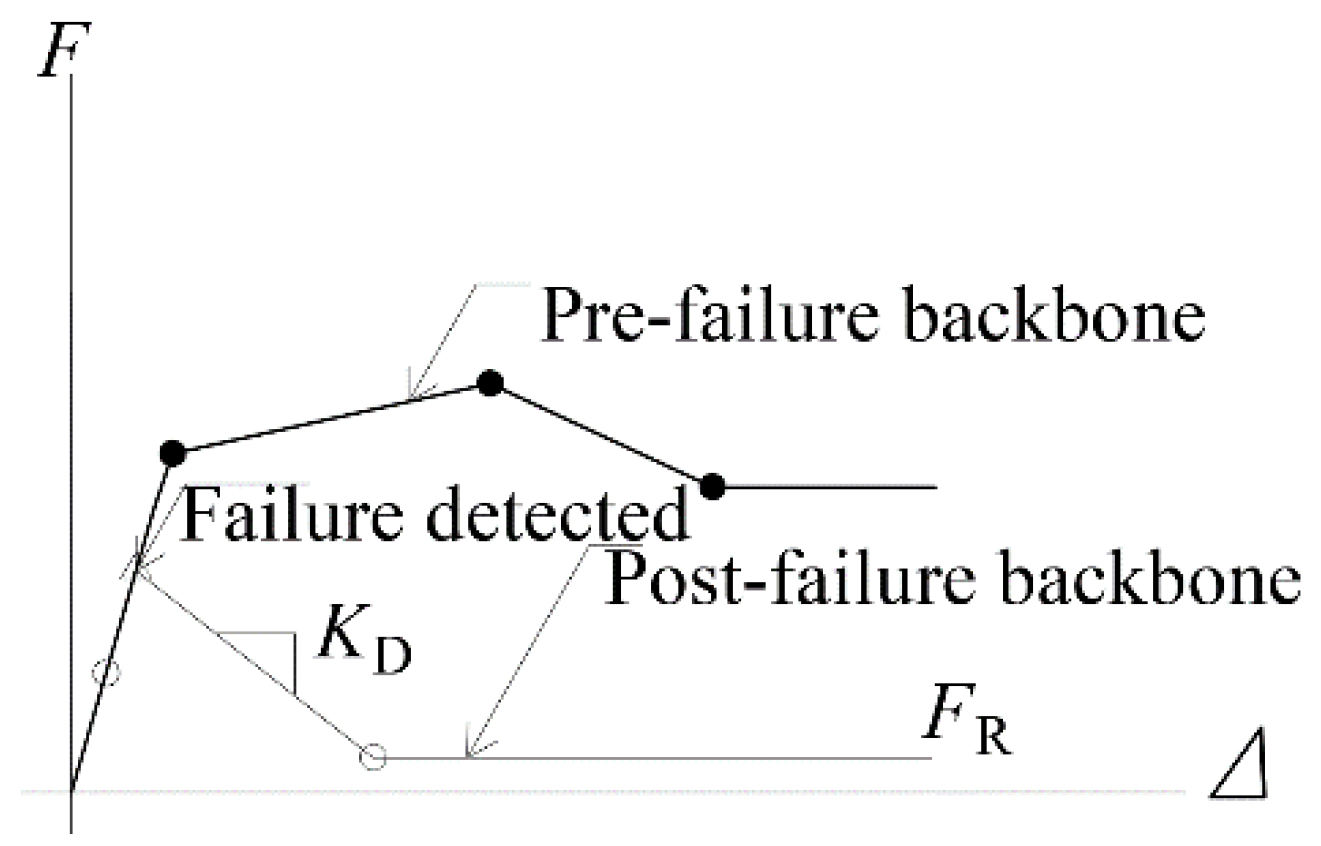
2.1.3. The Calculation of Degrading Stiffness K D

Experimental studies have shown that for RC columns, K D is mainly affected by the axial and bending deformations during the unloading stage [21]. Therefore, K D can be calculated based on the displacement corresponding to the axial failure [22], as presented as Equation (3) [17]:
K D = ( 1 K D t 1 K Unload ) 1
where K D t is the degrading stiffness caused by the total response of the column, which can be calculated as Equation (4); K Unload is the unloading bending stiffness of the column during the failure stage, which can be calculated as Equation (5) [17]:
K D t = V u ( Δ a Δ s )
K Unload = V u V f , u
where V u is the ultimate shear capacity of the column, Δ s is the displacement corresponding to shear failure, and Δ a is the axial displacement corresponding to shear failure. V f , u is the bending displacement corresponding to shear failure.

2.2. Modeling of Column Axial Failures

As previously mentioned, only the bending behavior was modeled in the fiber-based, nonlinear beam–column element. Therefore, an axial spring was attached to the shear spring model, as shown in Figure 5a, to model the axial behavior of the columns. For this model, the inter-story drift ratio, ( Δ L ) Axial , was used to define the axial limit curve. It was assumed that the axial failure of the column occurred following shear failure, which means that the axial deformation was assumed to be the continuation of the shear deformation; therefore, ( Δ L ) Axial is directly influenced by the stirrup spacing and angle of the shear crack θ . Moreover, the geometric properties and longitudinal reinforcement directly affected the axial load capacity of the column. The calculation of ( Δ L ) Axial is presented in Equation (6) [17]:
( Δ L ) Axial = 4 100 + 1 + ( tan θ ) 2 tan θ + p ( s / A st f yt d c tan θ )
where d c represents the distance between the center of the column to the longitudinal reinforcement. A st and f yt are the total area and yield strength, respectively, of the longitudinal reinforcement.
It can be observed in Figure 5b that prior to failure occurring, the axial force increases linearly with the vertical deformation, Δ V . Once the axial force attains the axial load capacity, the axial deformation reaches the axial limit curve; the axial force linearly decreases with the vertical deformation. Following the failure of the column during the axial deformation stage, the axial force does not decrease to zero while at a constant value, which is defined as the residual strength: P R . According to Elwood [23], P R is equal to 0.02Ag fc′.

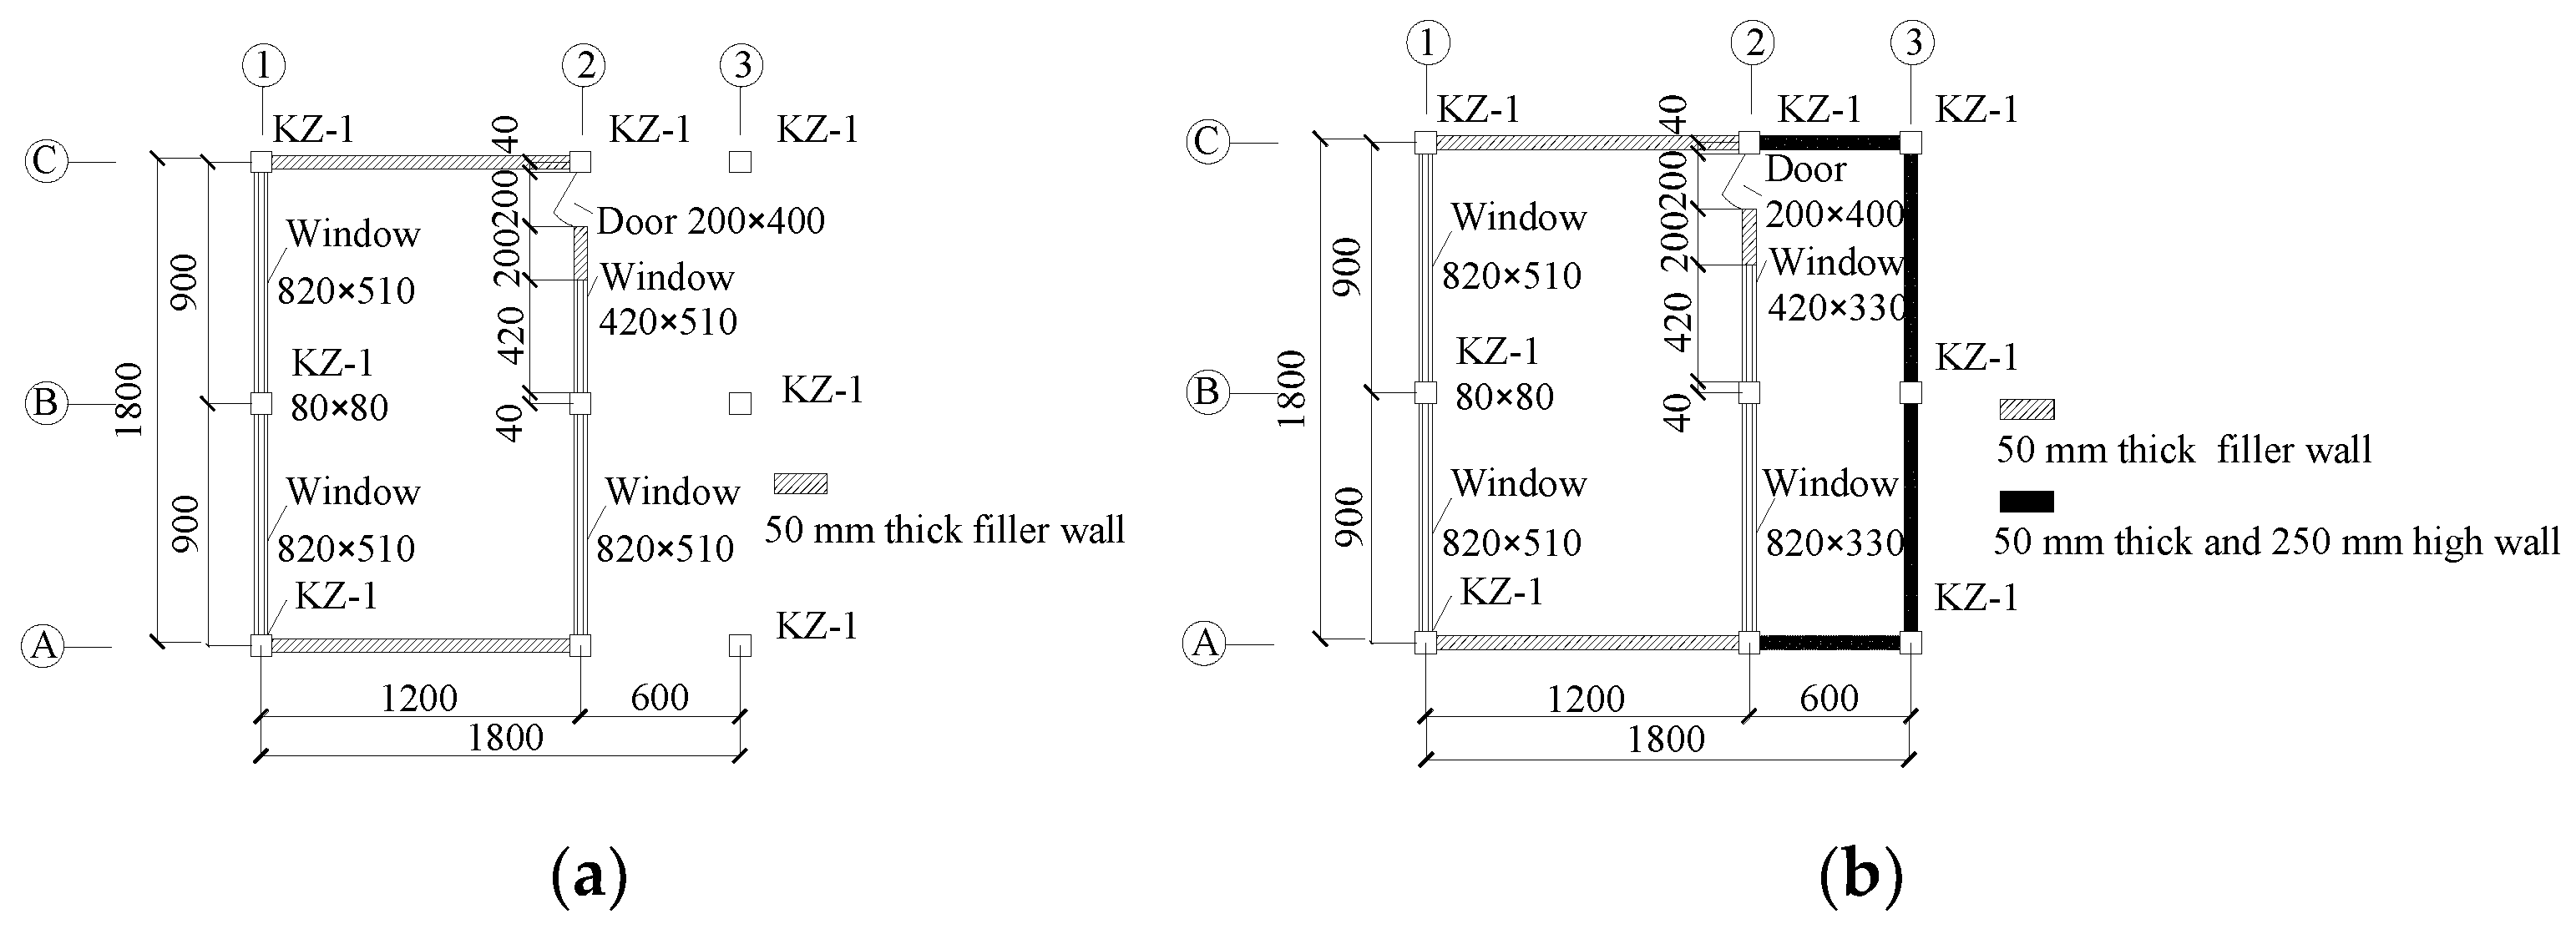
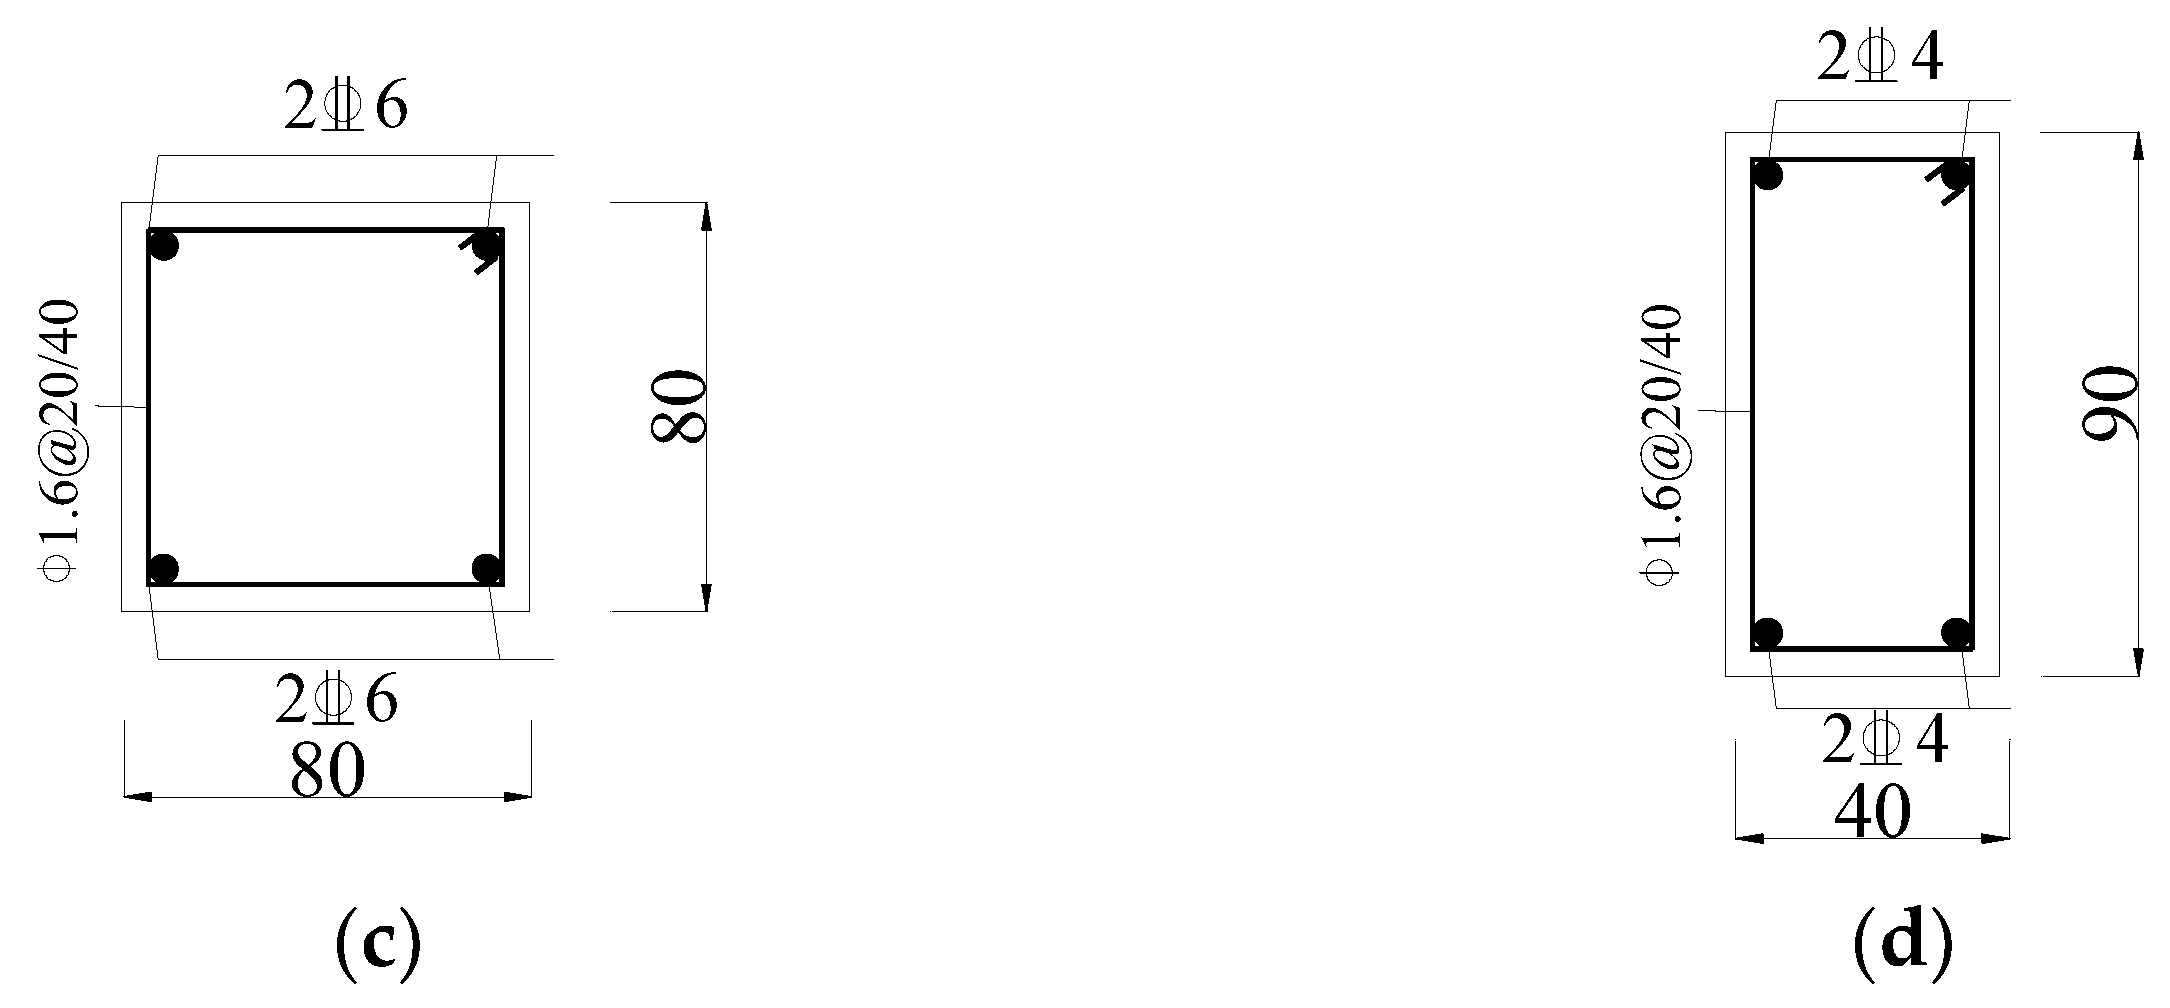
3. The Prototype Structures and Numerical Models

3.1. The Prototype Structures of the Infilled RC-Frame Structure

A three-dimensional model for a four-story infilled RC frame was selected as the case study for the influence of the axial–shear–bending interaction of RC columns on the seismic behavior of structures. The infilled RC frame was used as the case study building, which is a teaching building and located in a seven-degree seismic area in China. The seismic fortification has a basic ground-acceleration value of 0.10 g, according to GB 50011–2010 [24]. According to Han et al. [25], the two bays in each direction were designed for this structure to determine the lateral seismic resistance. To study the seismic behavior of the structure, a 0.2-scale model, presented in Figure 6, was built for a shaking-table test. The reinforcement information and section size of the beam and column are presented in Figure 6c,d, respectively. The material properties for the reinforced bars are shown in Table 1.
The ground-motion record, used as the table excitation, is shown in Figure 7. The peak ground-acceleration (PGA) value for the ground-motion record was 0.23 g; the duration was 22.996 s. The recorded interval was 0.04 s. During the test, the ground-motion record was adjusted according to the peak ground-acceleration (PGA) value to input the model and predict the time–history curve of the top displacements [23].
The bottom-story height of the model was 780 mm; the height of the other layers was 600 mm. The infill materials were hollow, concrete blocks, the mean compressive strength of the seven specimens was 1.78 MPa, and the density was approximately 1120 kg / m 3 . The mean compressive strength of the masonry mortar specimens was 3.49 MPa. The thickness of the floor slab was 30 mm. A total of 2.0 t of additional weight was applied from one to three stories, and 1.5 t of additional weight was applied to the fourth story. The mean compressive strength of the concrete for seven cube specimens was 10.25 N/mm2.

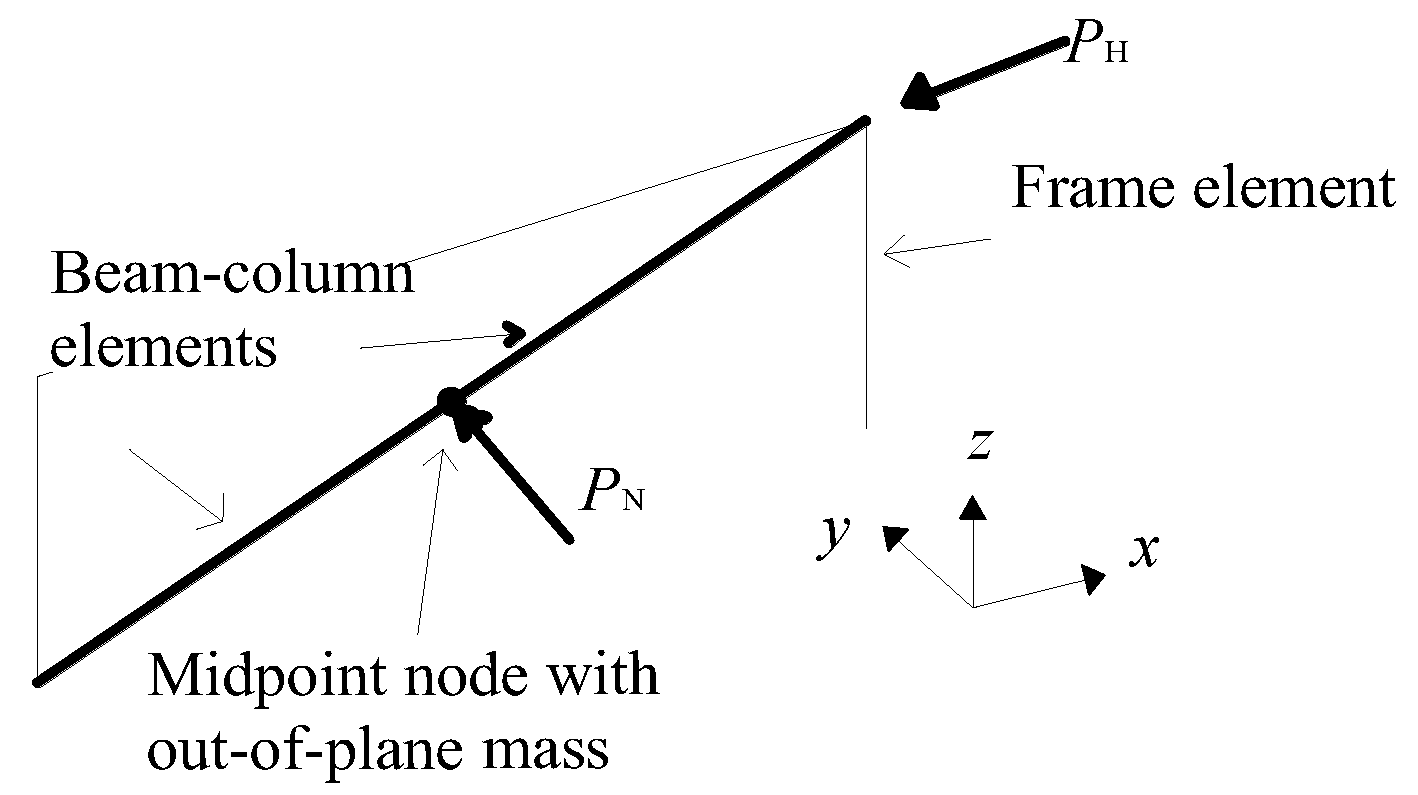
3.2. Three Numerical Models Based on OpenSees

The finite element software, OpenSees [26], was used to establish the numerical model of the shaking-table test model. The columns and beams were modeled using a nonlinear, fiber-based beam–column element to capture the distributed nonlinear behavior of the components. Each longitudinal steel specimen was taken as an individual fiber, in which the uniaxial, reinforcing steel material was selected to define the strain versus stress relationship, and the deterioration in the stiffness could be captured [26]. All the concrete fibers in the column and beam were simulated using uniaxial Material Concrete02 in OpenSees. To simulate the confinement effect of the stirrup on the core concrete, the strength of the core concrete was multiplied by an amplification coefficient, which was the function used for the volumetric percentages of the stirrup, yield strength of the stirrup, and compressive strength of the concrete [26], considering that a larger, horizontal displacement may occur during the action of a horizontal earthquake. Moreover, the heavier self-weight of the structures may increase such lateral displacements, so as to cause additional, internal forces in the columns. Therefore, a gravity second-order effect was considered to simulate additional internal forces in the columns. The shear spring used to model the shear deformation of the columns was defined by a ZeroLength element assigned to the uniaxial hysteretic material, as shown in Equation (1). It should be noted that a limit state material should be incorporated in the uniaxial hysteretic material to capture the shear limit curve of the shear spring. Similarly, the axial spring, used to model axial deformation after shear damage to the columns, was also defined by a ZeroLength element assigned to the uniaxial hysteretic material. The limit state material was incorporated in the uniaxial hysteretic material to capture the axial limit curve of the axial spring. The experimental results of a beam–column connection were used to verify the effectiveness of the modeling method [27]. The comparison between the test and simulation results is shown in Figure 8. The comparison results show that the numerical simulation agrees well with the experimental results. The degradation characteristics of the RC structural system can be effectively captured when the axial–shear–bending interaction is simulated.
The infill walls were modeled using two beam–column elements characterized by fiber discretization [11], as shown in Figure 9. Both the in-plane behavior and out-of-plane response of the infill walls [10] were considered. For each infill panel, the two beam–column elements were connected as a hinge and formed a diagonal member, representing a single bay in a single story. A lumped mass was assigned to the hinge to model the out-of-plane response of the infill walls [10].
The in-plane and out-of-plane capacities of the infill walls can be presented as Equation (7) [10]:
( M N M N 0 ) 3 2 + ( P H P H 0 ) 3 2 1.0
where M N is the moment resistance capacity of the infill wall in the direction of the out-of-plane load when the infill wall is forced by the in-plane load, and M N 0 is the moment resistance capacity of the infill wall in the direction of the out-of-plane load when the infill wall is not forced by the in-plane load. P H is the axial-load capacity of the infill walls if the out-of-plane load is applied, and P H 0 is the axial-load capacity of the infill walls if the out-of-plane load is not applied.
Figure 10 presents the fiber discretization process for the beam with hinge elements. The yield strength of the discrete points used to divide the fiber section must satisfy the interaction function shown in Equation (8). Therefore, based on the interaction–function curve, the yield strength, location, and area of each fiber section can be calculated by the axial load and moment of these discrete points. Additionally, the calculation for the yield strength of each fiber and its distance from the centroid of the cross-section are shown in Equation (9) [10]:
F yi = 1 2 [ P j P j + 1 ]
Z i = 1 2 [ M j + 1 M j F yi ]
where F yi is the yield strength of the ith fiber, P j is the axial (IP) load for the jth point of the interaction curve (when j = 1 , P = P H 0 ), Z i is the distance of the ith fiber from the centroid of the cross-section, and M j is the moment strength of the cross-section for the jth point of the interaction curve (when j = N pts , M = M N 0 ).
The area of each fiber must satisfy Equations (10) and (11) [10]:
i = 1 2 ( N pts 1 ) A i = t inf × a
i = 1 2 ( N pts 1 ) A i × Z i 2 = I eq
where A i is the area of the ith fiber, I eq is moment of inertia of the cross-section of the diagonal member.
The following exponential function can satisfy the above two conditions and can be used to calculate A i and Z i [10]:
A i = γ × | z i | η

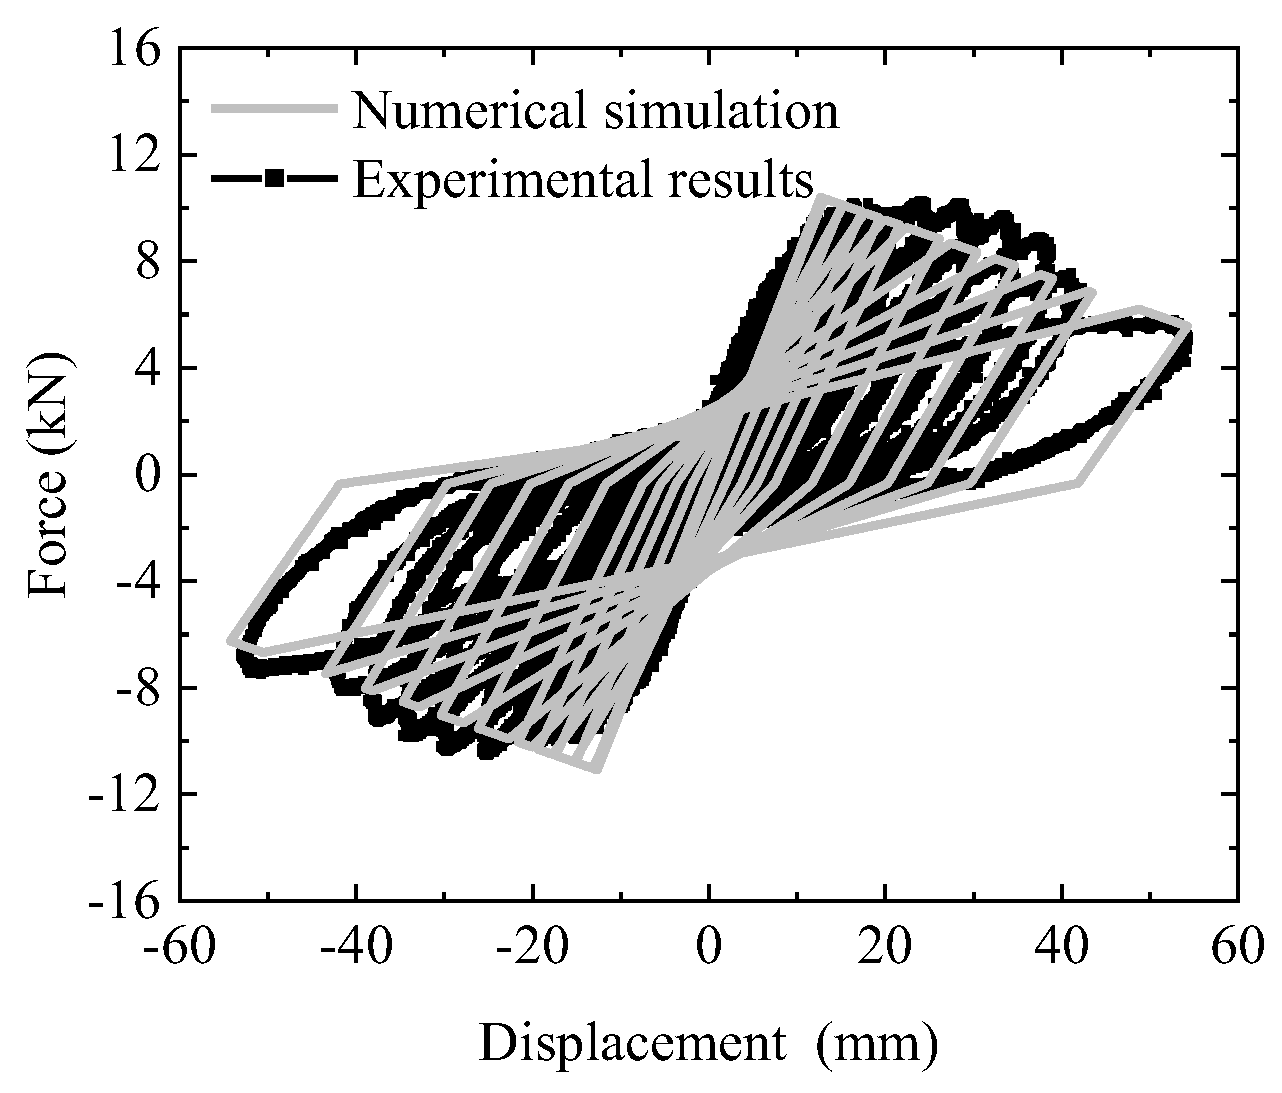
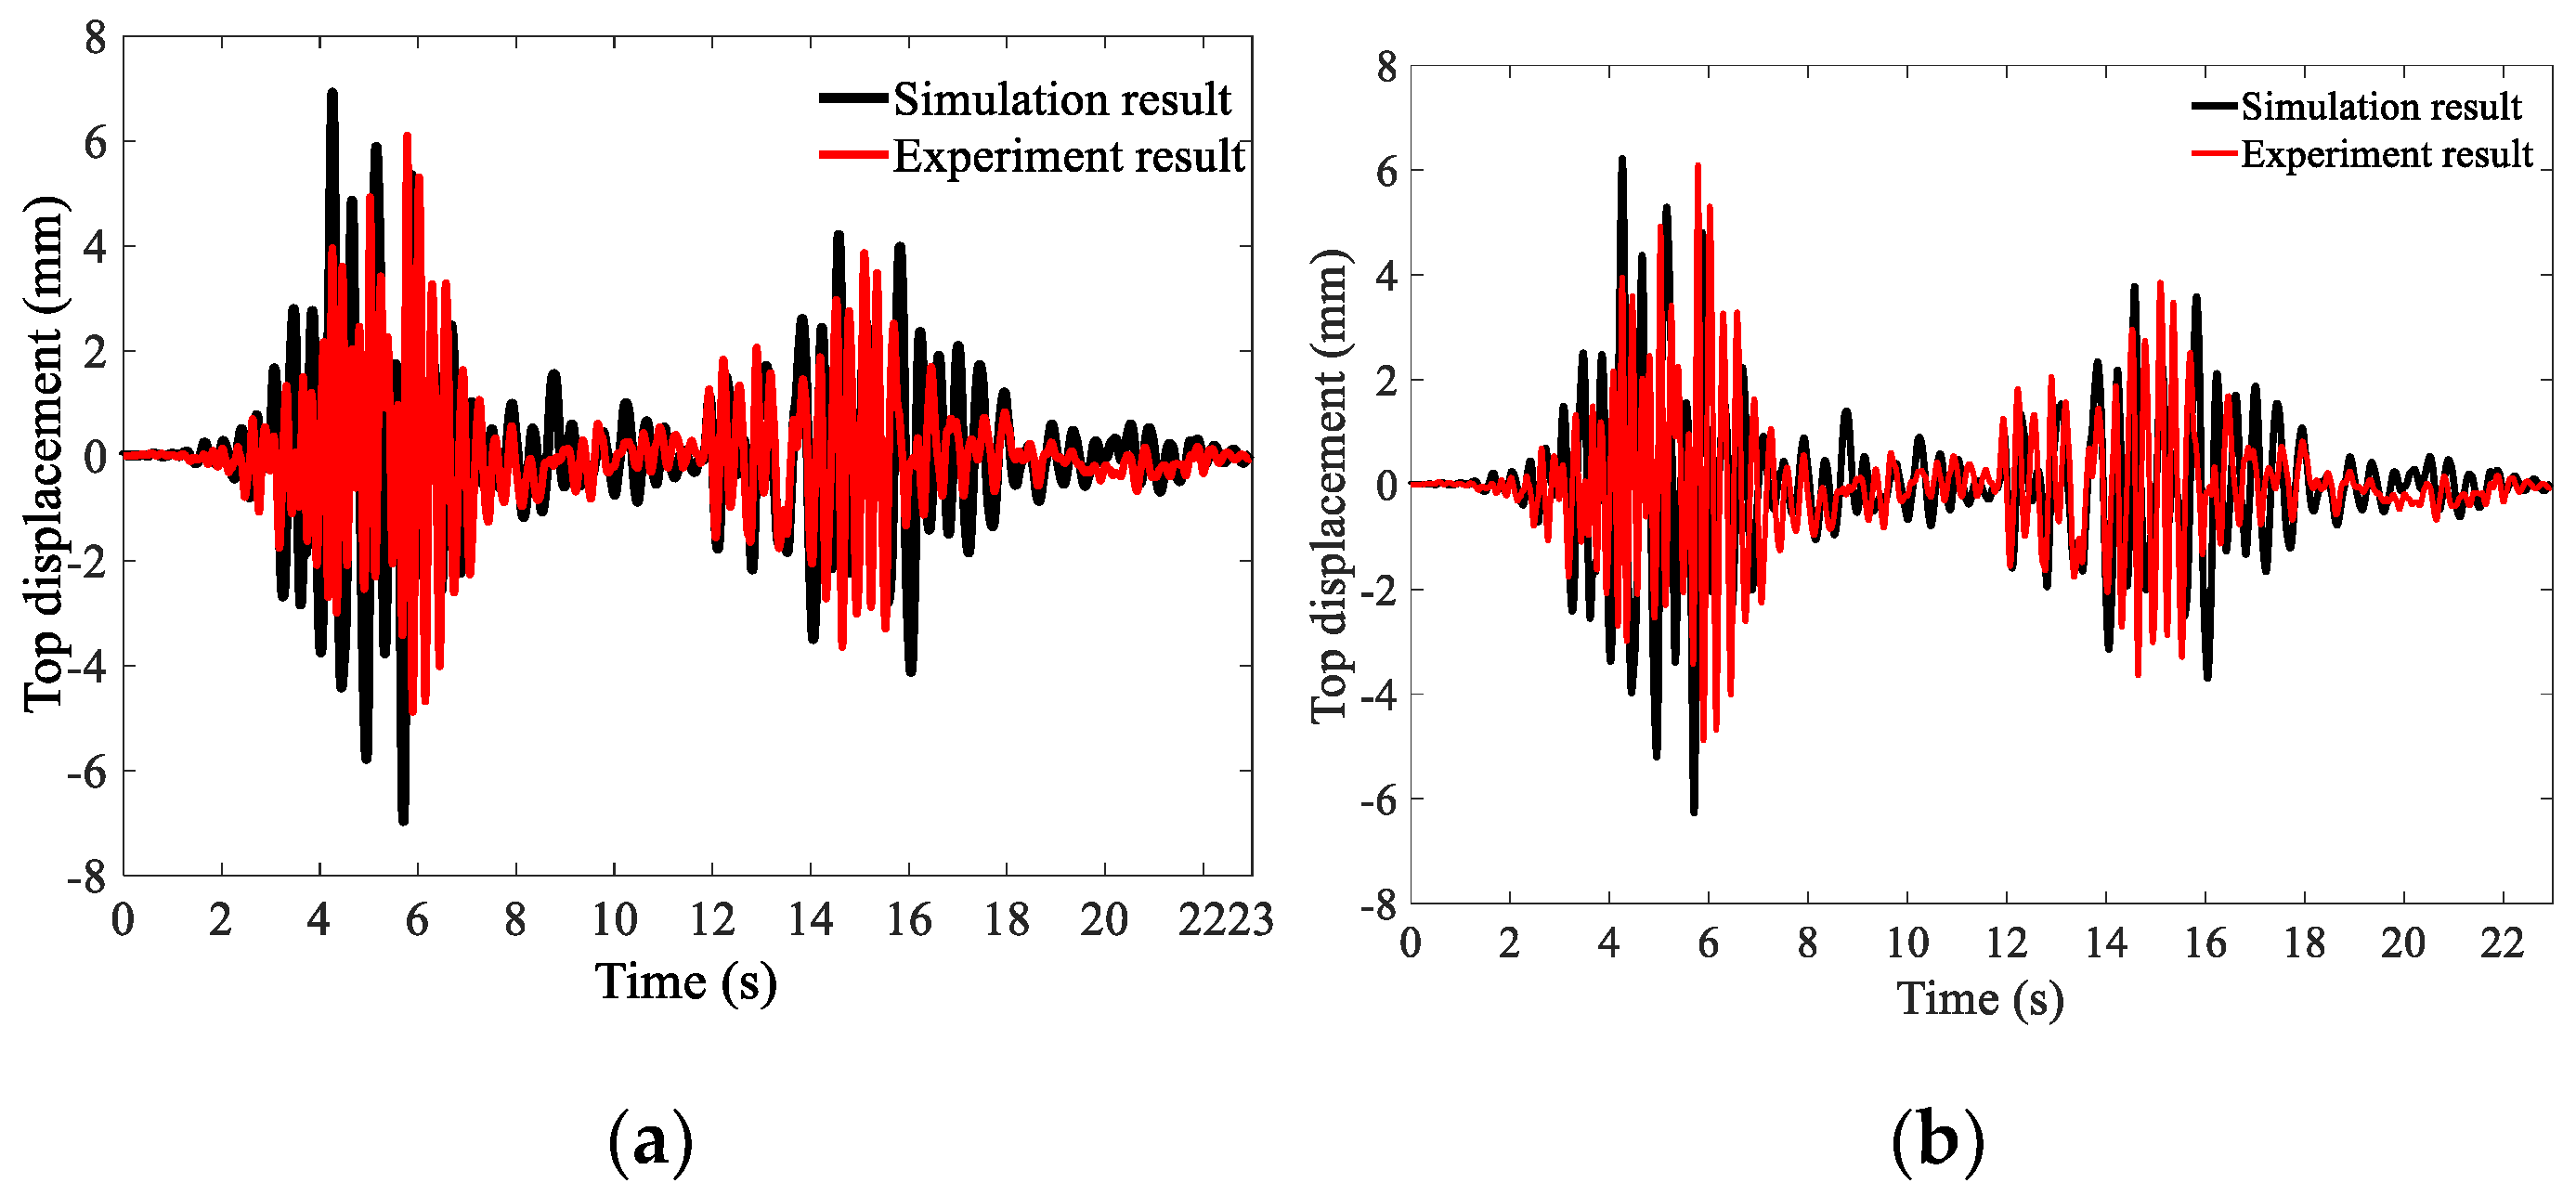
4. Comparison of Test and Numerical Stimulation Results

The top displacement comparison of the test and numerical stimulation results with and without considering the axial–shear–bending interaction of RC columns is plotted in Figure 11. The comparison results indicate that if the axial–shear–bending interaction of the RC columns is considered, the numerical curve is consistent with the test results; otherwise, the numerical curve is not consistent with the test results. By taking the coincidence degree between the stimulation and test results as the evaluation criterion, and using its root mean square error, e r r o r RMS = 1 N × i = 1 n ( F com p i F ex p i ) 2 , we can perform further quantitative calculations. The top displacement obtained from the test was 6.34 mm, the top displacement obtained from the model considering the axial–shear–bending interaction of the RC columns was 7.17 mm, and errorRMS = 1.34. Additionally, the top displacement value obtained from the model without considering the axial–shear–bending interaction of the RC columns was 6.96 mm, errorRMS = 1.72. The results indicate that the series model can effectively stimulate the axial–shear–bending interaction of RC columns.

5. Performance Analysis of Infilled RC Frame

5.1. The Incremental Dynamic Analysis of a Structure during Earthquake Events

According to the experiment requirements, an incremental dynamic analysis (IDA) [28] under the table excitation, used for the shaking-table test, was performed on the model, in which the peak ground-acceleration (PGA) value was adjusted from low to high, and the maximum lateral displacement was recorded accordingly. Finally, the IDA curves with and without considering the axial–shear–bending interaction of the RC columns are plotted in Figure 12 to analyze the influence of the axial–shear–bending interaction of the RC columns on the seismic behavior of infilled RC frames.
It can be observed from Figure 12 that, when the PGA varies from 0 to 0.22 g, the IDA curve considering the axial–shear–bending interaction of the RC columns is almost consistent with the model, without considering the axial–shear–bending interaction of the RC columns, which indicates that the axial–shear–bending interaction of the RC columns has no apparent influence on the seismic behavior of the structure at a low ground-motion intensity. If the PGA is greater than 0.22 g, compared to the model without considering the axial–shear–bending interaction of RC columns, the model considering the axial–shear–bending interaction of RC columns has a larger, maximum lateral displacement at any earthquake motion intensity, which indicates that the axial–shear–bending interaction of RC columns has a significant impact on the seismic behavior of structures during major earthquake events.

5.2. Structural Degradation Characteristics under Static Load

The comparison of the base shear force–top displacement curves for the two models is plotted in Figure 13.
It can be observed from Figure 13 that, when the top displacement is less than 50 mm, the pushover curves obtained from the two models are almost equal. When the top displacement is greater than 50 mm, yield occurs when considering the axial–shear–bending interaction of RC columns; then, the pushover curve shows a degradation stage. Similarly, after the top displacement exceeds 53 mm, yield occurs without considering the axial–shear–bending interaction of RC columns and the pushover curve also shows a continued degradation stage. As the top displacement increases, the curve considering the axial–shear–bending interaction of RC columns degrades more rapidly than the curve without considering the axial–shear–bending interaction of the RC columns. When the roof drift ratio reaches 3.5% (top displacement equal to 100 mm) and 5.0% (top displacement equal to 150 mm), the difference in the load capacity between the two models is approximately 20% and 35%, respectively. The results demonstrate that, without considering the axial–shear–bending interaction of the RC columns, the degradation characteristics of the structure under higher displacement (e.g., 3.5% roof drift ratio) values are overestimated.

5.3. Evaluation of Seismic Performance and Global Collapse Resistance Capacity of Structures

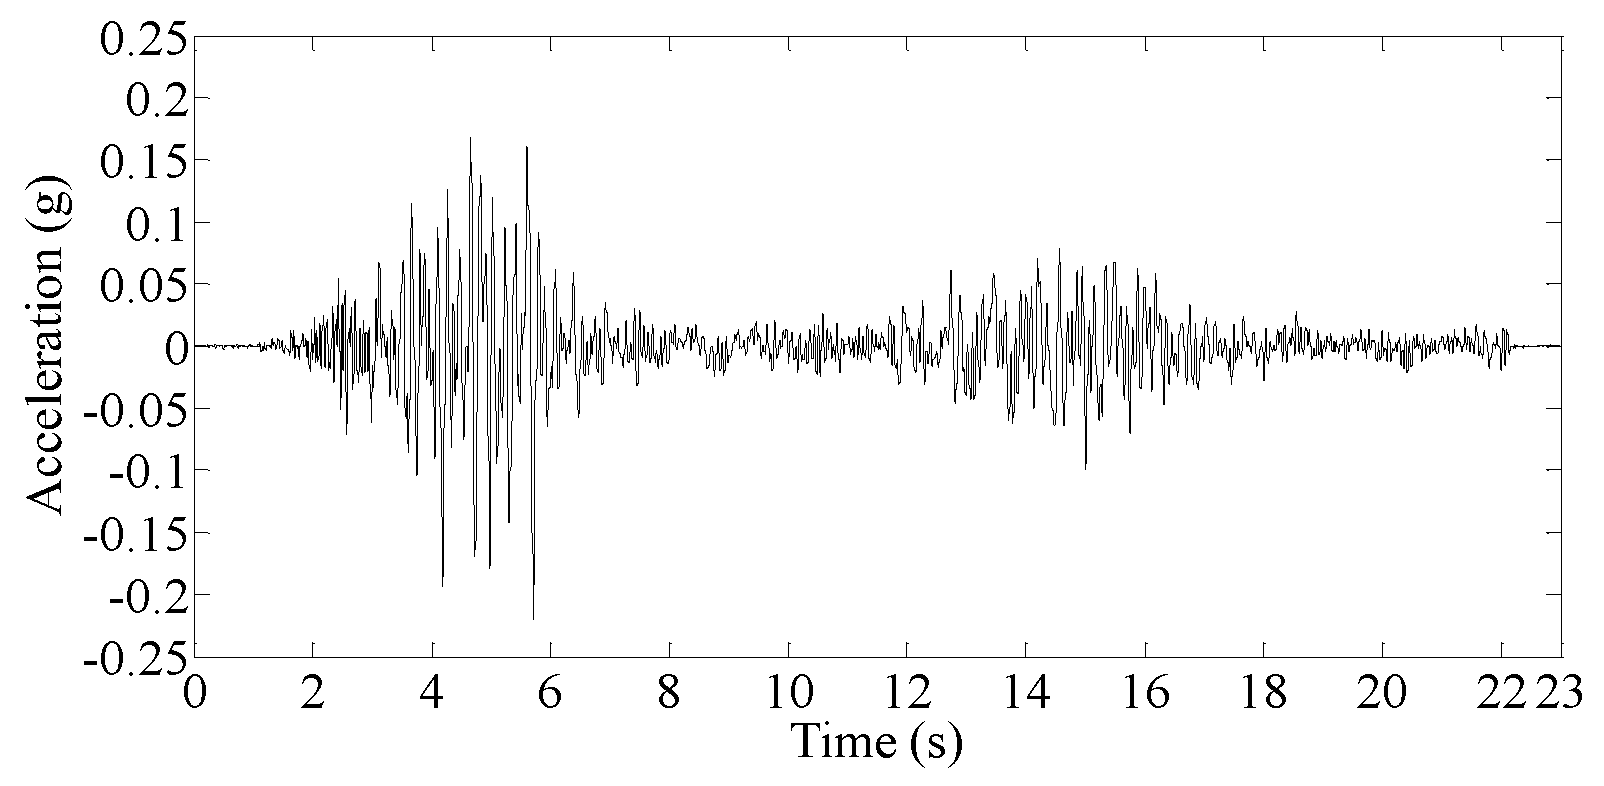
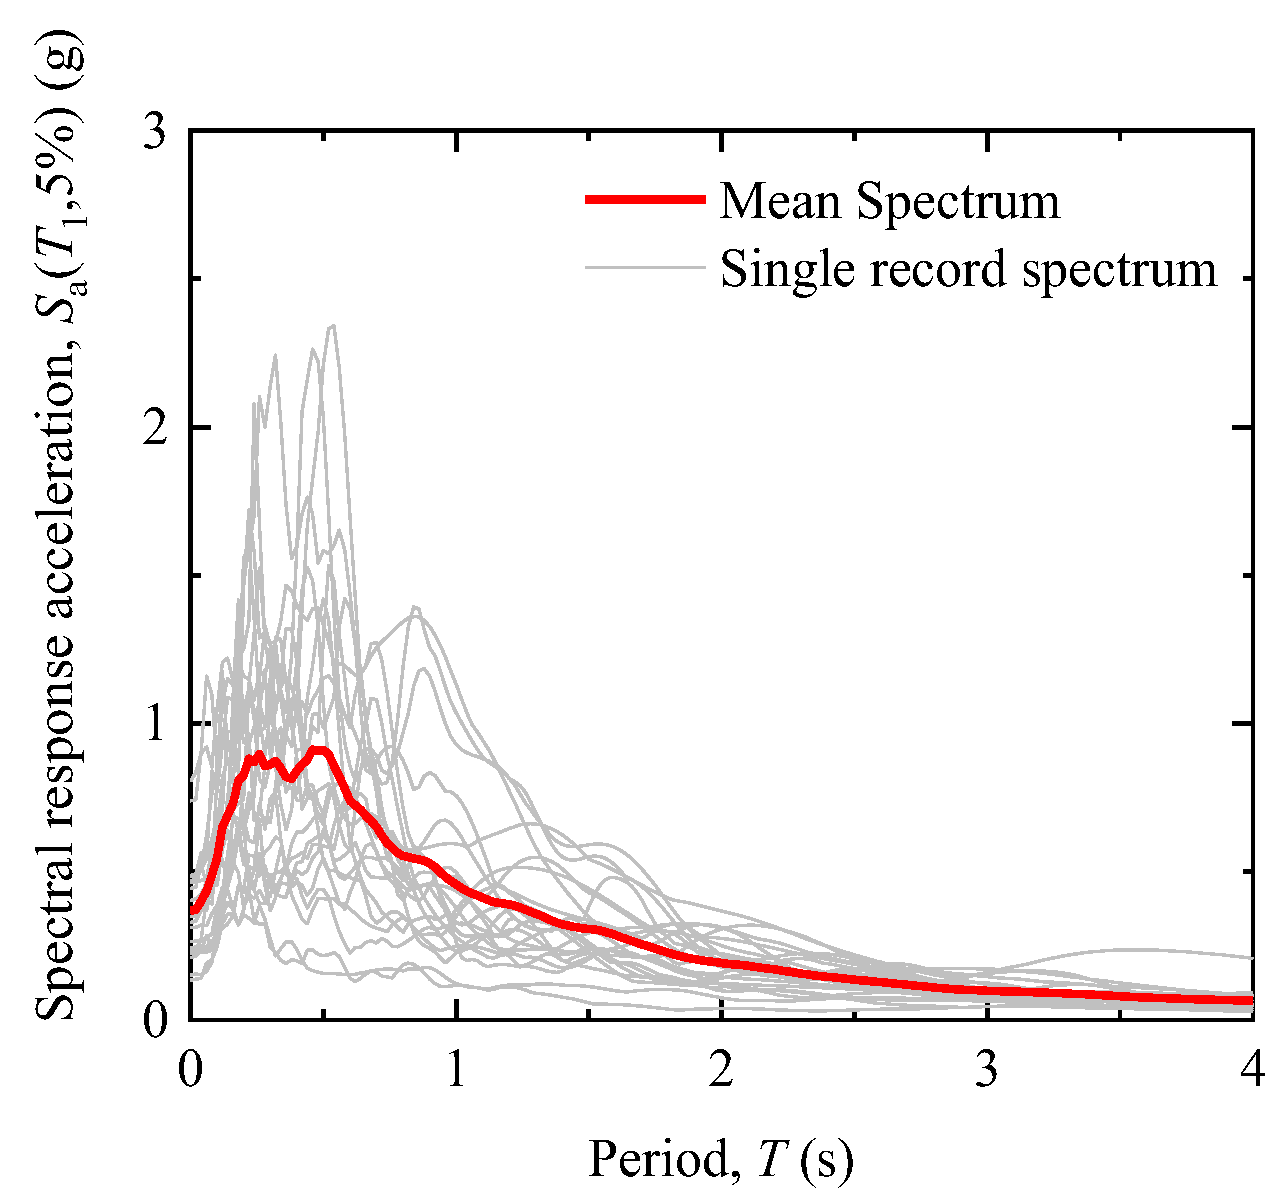
5.3.1. The Selection of Ground-Motion Records

According to ATC 63 [29], the ground-motion records used to perform the dynamic analyses should satisfy the following requirements: (1) an earthquake magnitude greater than 6.5; (2) a focus located on strike-skip or thrust faults; (3) an observation site that is bedrock or hard soil; and (4) a fault distance of the near-field earthquake shorter than 10 km and longer than 10 km for the far-field earthquake. Based on the selection principle of ground motions proposed by ATC-63 [29], 22 suites of far-fault ground-motion records were selected as the excitation to conduct the nonlinear and incremental dynamic analyses of the structures shown in Figure 6. The detailed information for these 22 ground-motion records is shown in reference [25]; only their spectra are illustrated and shown in Figure 14.

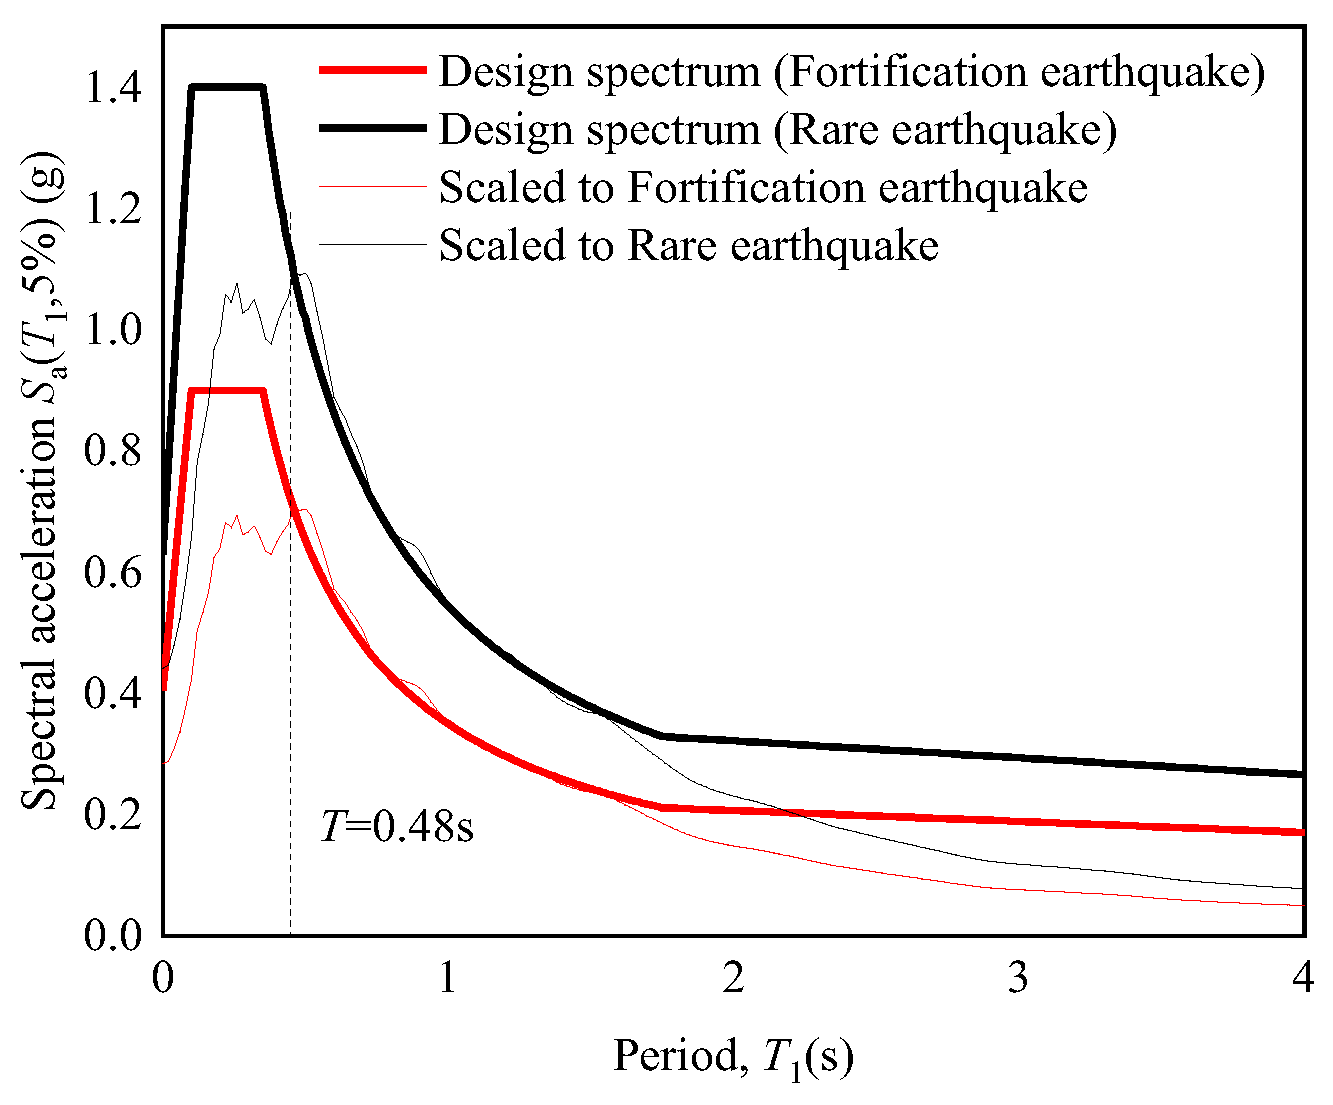
5.3.2. Nonlinear Dynamic Analysis during Fortification and Rare Earthquakes

The 22 ground-motion records were adjusted to the seismic level of a fortification earthquake, corresponding to the earthquake with a 10% probability of exceedance in 50 years [24], and a rare earthquake, corresponding to the earthquake with a 2% probability of exceedance in 50 years [24], to conduct the nonlinear dynamic analysis to investigate the influence of the axial–shear–bending interaction of columns on the seismic response of structures. The adjustment approach adjusts the average spectrum greater than 22 ground motions to match well the design spectra of the target earthquakes (fortification and rare earthquakes), at the point of a basic period T1 (0.46 s). For the mean and design spectra during fortification and rare earthquake events, Sa (T1,5%) was determined at the point of basic period T1 (0.46 s). The adjustment coefficient was acquired by dividing Sa (T1,5%) corresponding to the design spectrum during fortification and rare earthquake events from Sa (T1,5%). The comparison between the ground-motion and target spectra is shown in Figure 15.
The peak inter-story drift ratio, θmax, for the infilled RC frames with and without considering the axial–shear–bending interaction of columns during fortification and rare earthquake events is shown in Figure 16. It can be observed in Figure 16 that, during both fortification and rare earthquake events, the peak inter-story drift ratio of the infilled RC frames considering the axial–shear–bending interaction of the columns is greater than that of infilled RC frames without considering the axial–shear–bending interaction of the columns.
The average peak inter-story drift ratio for the two models for fortification and rare earthquakes was calculated and is shown in Figure 16. Moreover, the standard deviation was acquired to measure the dispersion of the analytical results. It can be observed that, under fortification earthquake events, the average peak inter-story drift ratio was 0.54% for the model without considering the axial–shear–bending interaction of columns, while it was 0.86% for the model considering the axial–shear–bending interaction of columns. In particular, the difference between the two models for rare earthquake events was more obvious than the difference for the fortification earthquake model. We believe that the increase in the average peak inter-story drift ratio during rare earthquake events was caused by the increase in the shear deformation. During both the fortification and rare earthquake events, the standard deviation of the model without considering the axial–shear–bending interaction was greater than that of the model considering the axial–shear–bending interaction. This indicates that the axial–shear–bending interaction was a key factor in influencing the responses of the structures. During a fortification earthquake event, no obvious damage was done to the structures and the influence was relatively minor, whereas during rare earthquake events, severe damage was done to the structures; thus, the responses of the structures were highly overestimated if the axial–shear–bending interaction was not considered.

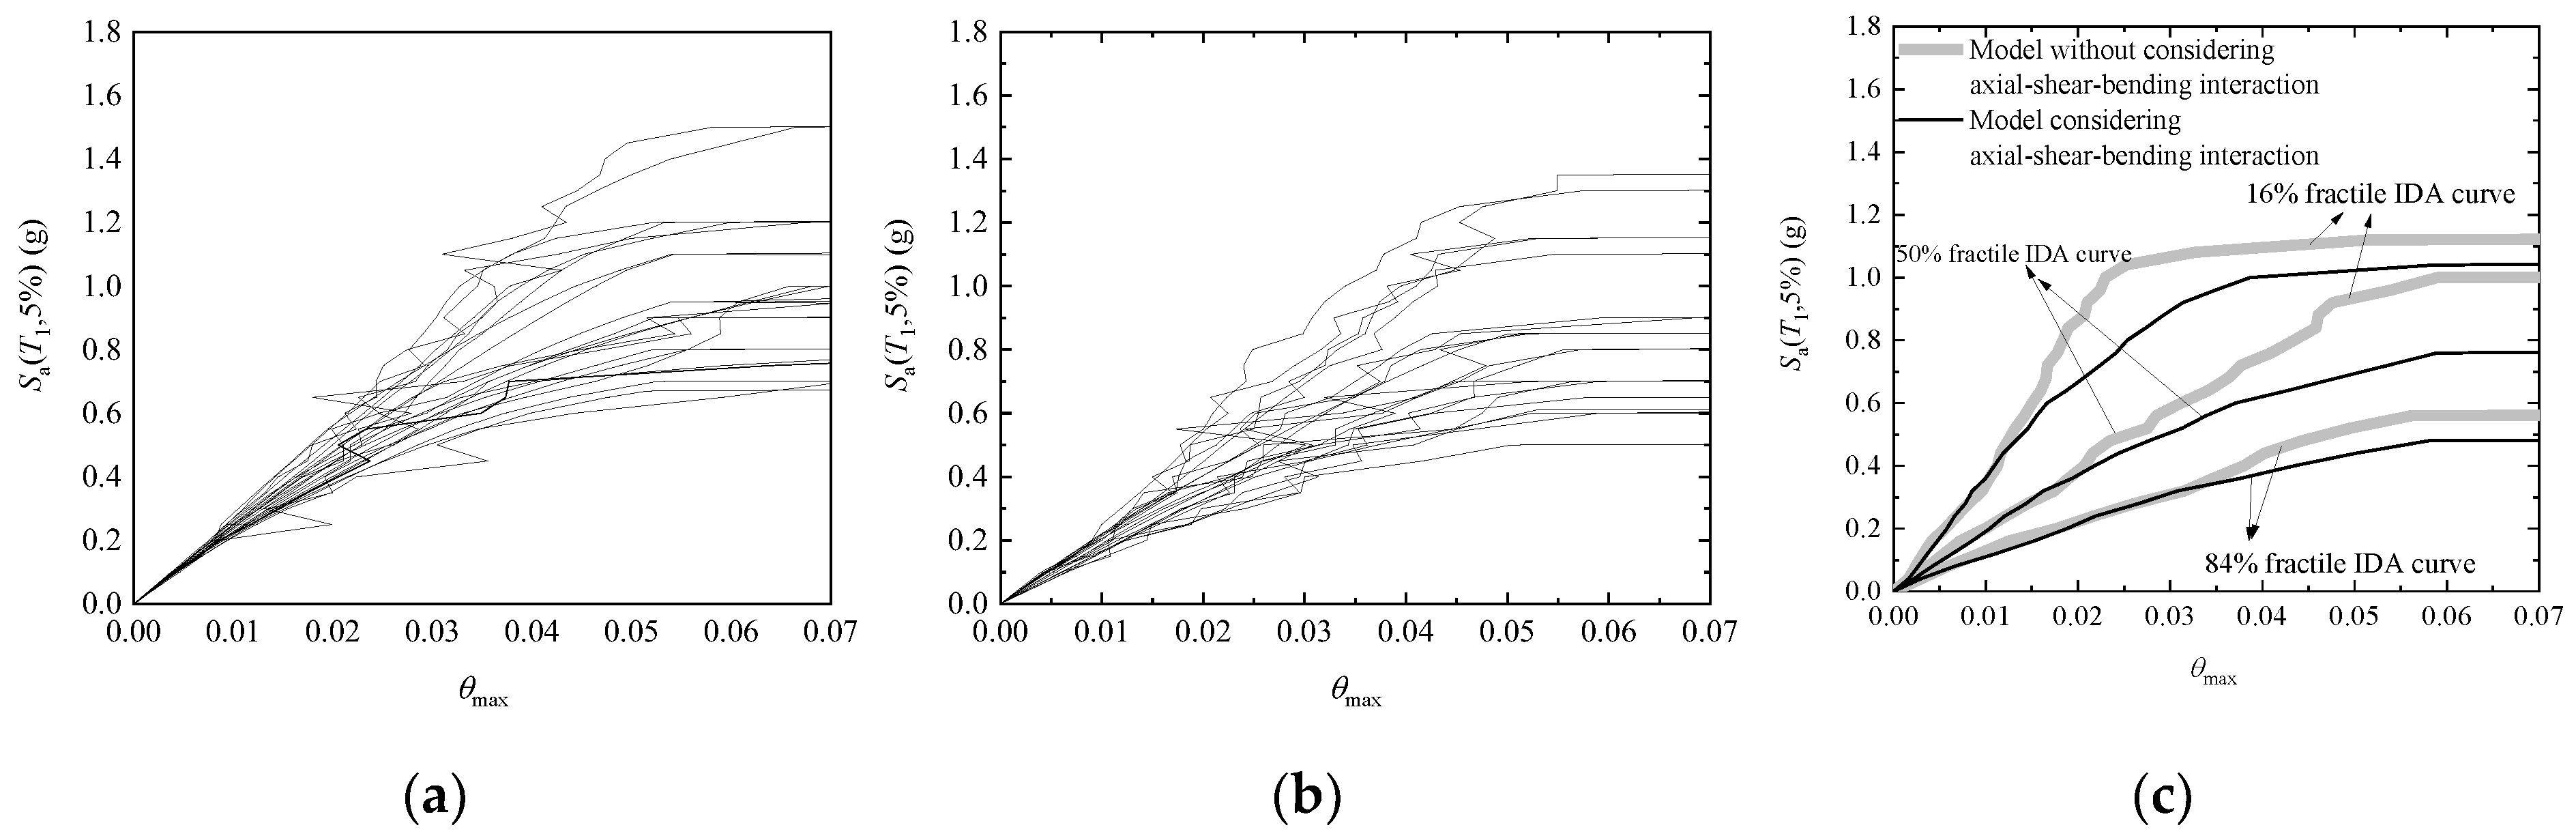
5.3.3. The Results of the Incremental Dynamic Analysis

Taking the above 22 suites of ground-motion records as the input values and the spectral acceleration corresponding to the fundamental period S a ( T 1 , 5 % ) as the intensity measurement to adjust the ground-motion records, an incremental dynamic analysis (IDA) was conducted. The maximum inter-story drift ratio, θ max , of each time analysis was recorded. The results of the IDA obtained for the models with and without considering the axial–shear–bending interactions of the RC columns are shown in Figure 17.
If θ max does not exceed 0.008, the results obtained from the two analytical models do not show obvious differences. This was because the ground-motion intensity is minor and no shear deformation was developed by the shear spring, and the deformation for both models mainly focused on bending deformation; therefore, the axial–shear–bending interaction did not influence the seismic response of the structures during the elastic stage. As θ max increased, an obvious difference in the IDA results was observed in the two models. For S a ( T 1 , 5 % ) , θ max acquired from the model without considering the axial–shear–bending interaction of the RC columns was less obvious than the value acquired from the analytical model considering the axial–shear–bending interaction of the RC columns. The common method can be used without considering the fact that the shear deformation may cause damage to the structures, which cannot be entirely captured during seismic analyses when greater deformation occurs on the structures. More specifically, θ max = 5.0% was taken as the criterion of collapse for the structures in some studies [30]. It can be observed in the 50% fractile IDA curves that, when θ max reaches 5.0%, S a ( T 1 , 5 % ) for the model without considering the axial–shear–bending interaction of RC columns increased by 28.3%, corresponding to that for the model considering the axial–shear–bending interaction of RC columns. This indicates that the collapse resistance capacity of the structures would be overestimated if the axial–shear–bending interaction of the RC columns was not taken into account.

5.3.4. Assessment of Collapse Resistance Capacity

Based on FEMA350, S a ( T 1 , 5 % ) and θ max as the intensity measure (IM) and damage measure (DM) values, respectively, were used to assess the collapse resistance capacity of the infilled RC frames [30]. The value of θ max = 0.05 and the slope of the IDA curve attained a 20% initial slope gradient constituting the collapse criterion [31,32,33,34]. For each S a ( T 1 , 5 % ) , θ max and the slope of the IDA curves were calculated to acquire the probability of collapse. For certain S a ( T 1 , 5 % ) values, the probability of collapse was defined as nc/nt. nc is the number of ground-motion records corresponding to the occurrence of collapse. nt is the total number of ground-motion records used for incremental dynamic analyses.
The collapse probability for the S a ( T 1 , 5 % ) values used for incremental dynamic analyses was calculated, and is shown as discrete points in Figure 18. Then, the collapse probability curves, shown in Figure 18, were calculated by fitting the discrete points using the standard normal distribution function [25]. According to FEMA, 350 S a ( T 1 , 5 % ) corresponds to a 50% of collapse of the structures (noted as S a ( T 1 , 5 % ) 50 % ), which can be perceived as the collapse resistance capacity. Therefore, S a ( T 1 , 5 % ) 50 % is also presented in Figure 18 to evaluate the collapse resistance capacity of the structures.
It can be observed from Figure 18 that the collapse resistance capacity for the model considering the axial–shear–bending interaction of RC columns is less than that for the model that does not consider the axial–shear–bending interaction of RC columns. For example, for the model that does not consider the axial–shear–bending interaction of RC columns, S a ( T 1 , 5 % ) 50 % is 0.97 g, which is overestimated by 24.5% compared to the model considering the axial–shear–bending interaction of RC columns. From the analyses presented above, it can be concluded that the collapse resistance capacity of structures cannot be assessed if the axial–shear–bending interaction of RC columns is not simulated in common fiber-based beam–column elements.

6. Conclusions

A shaking-table-test model of a four-story, two-bay infilled RC frame was modeled and analyzed via the finite element software, OpenSees, in which the axial–shear–bending interaction of RC columns and the effect of infill walls were considered. The nonlinear dynamic analysis of fortification and rare earthquake events, and a pushover analysis, were conducted to study the influence of the axial–shear–bending interaction of RC columns on the degradation characteristic of structures. Finally, based on the incremental dynamic analysis results under 22 suites of ground-motion records, the global collapse resistance capacity of the structure with a 50% collapse probability was evaluated. The following conclusions can be determined.
(1)
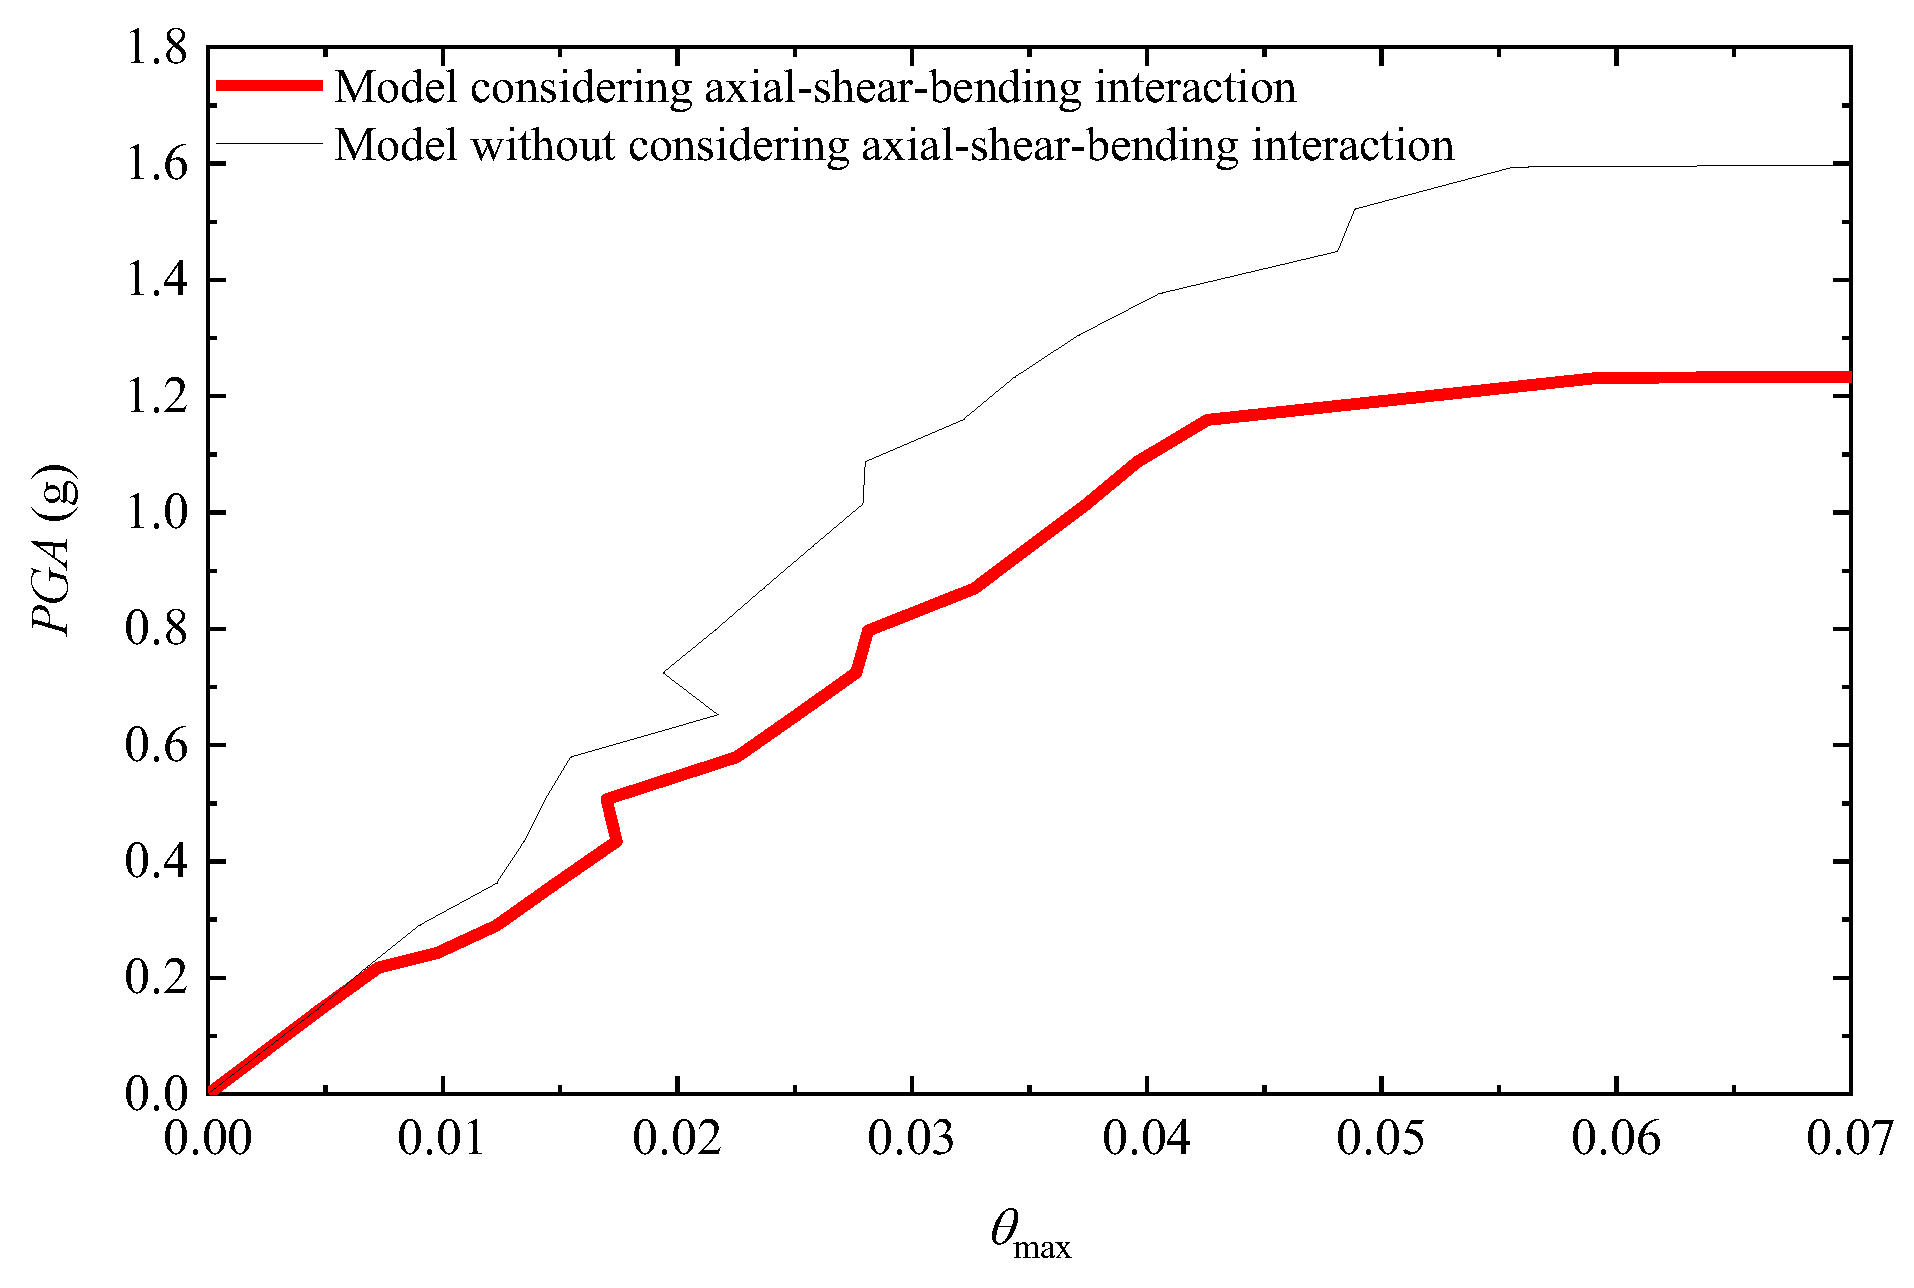
When the PGA of the ground motion is less than 0.2 g, the IDA curve for the model considering the axial–shear–bending interaction of RC columns is consistent with the model that does not consider the axial–shear–bending interaction of RC columns, indicating that the axial–shear–bending interaction of RC columns does not have an apparent influence on the seismic behavior of structures at a low ground-motion intensity. If the PGA of the earthquake recorded is greater than 0.2 g, compared to the model that does not consider the axial–shear–bending interaction of RC columns, the model that does consider the axial–shear–bending interaction of RC columns has a larger maximum lateral displacement during any earthquake motion intensity, indicating that the axial–shear–bending interaction of RC columns has a significant impact on the seismic behavior of structures during major earthquake events.
(2)
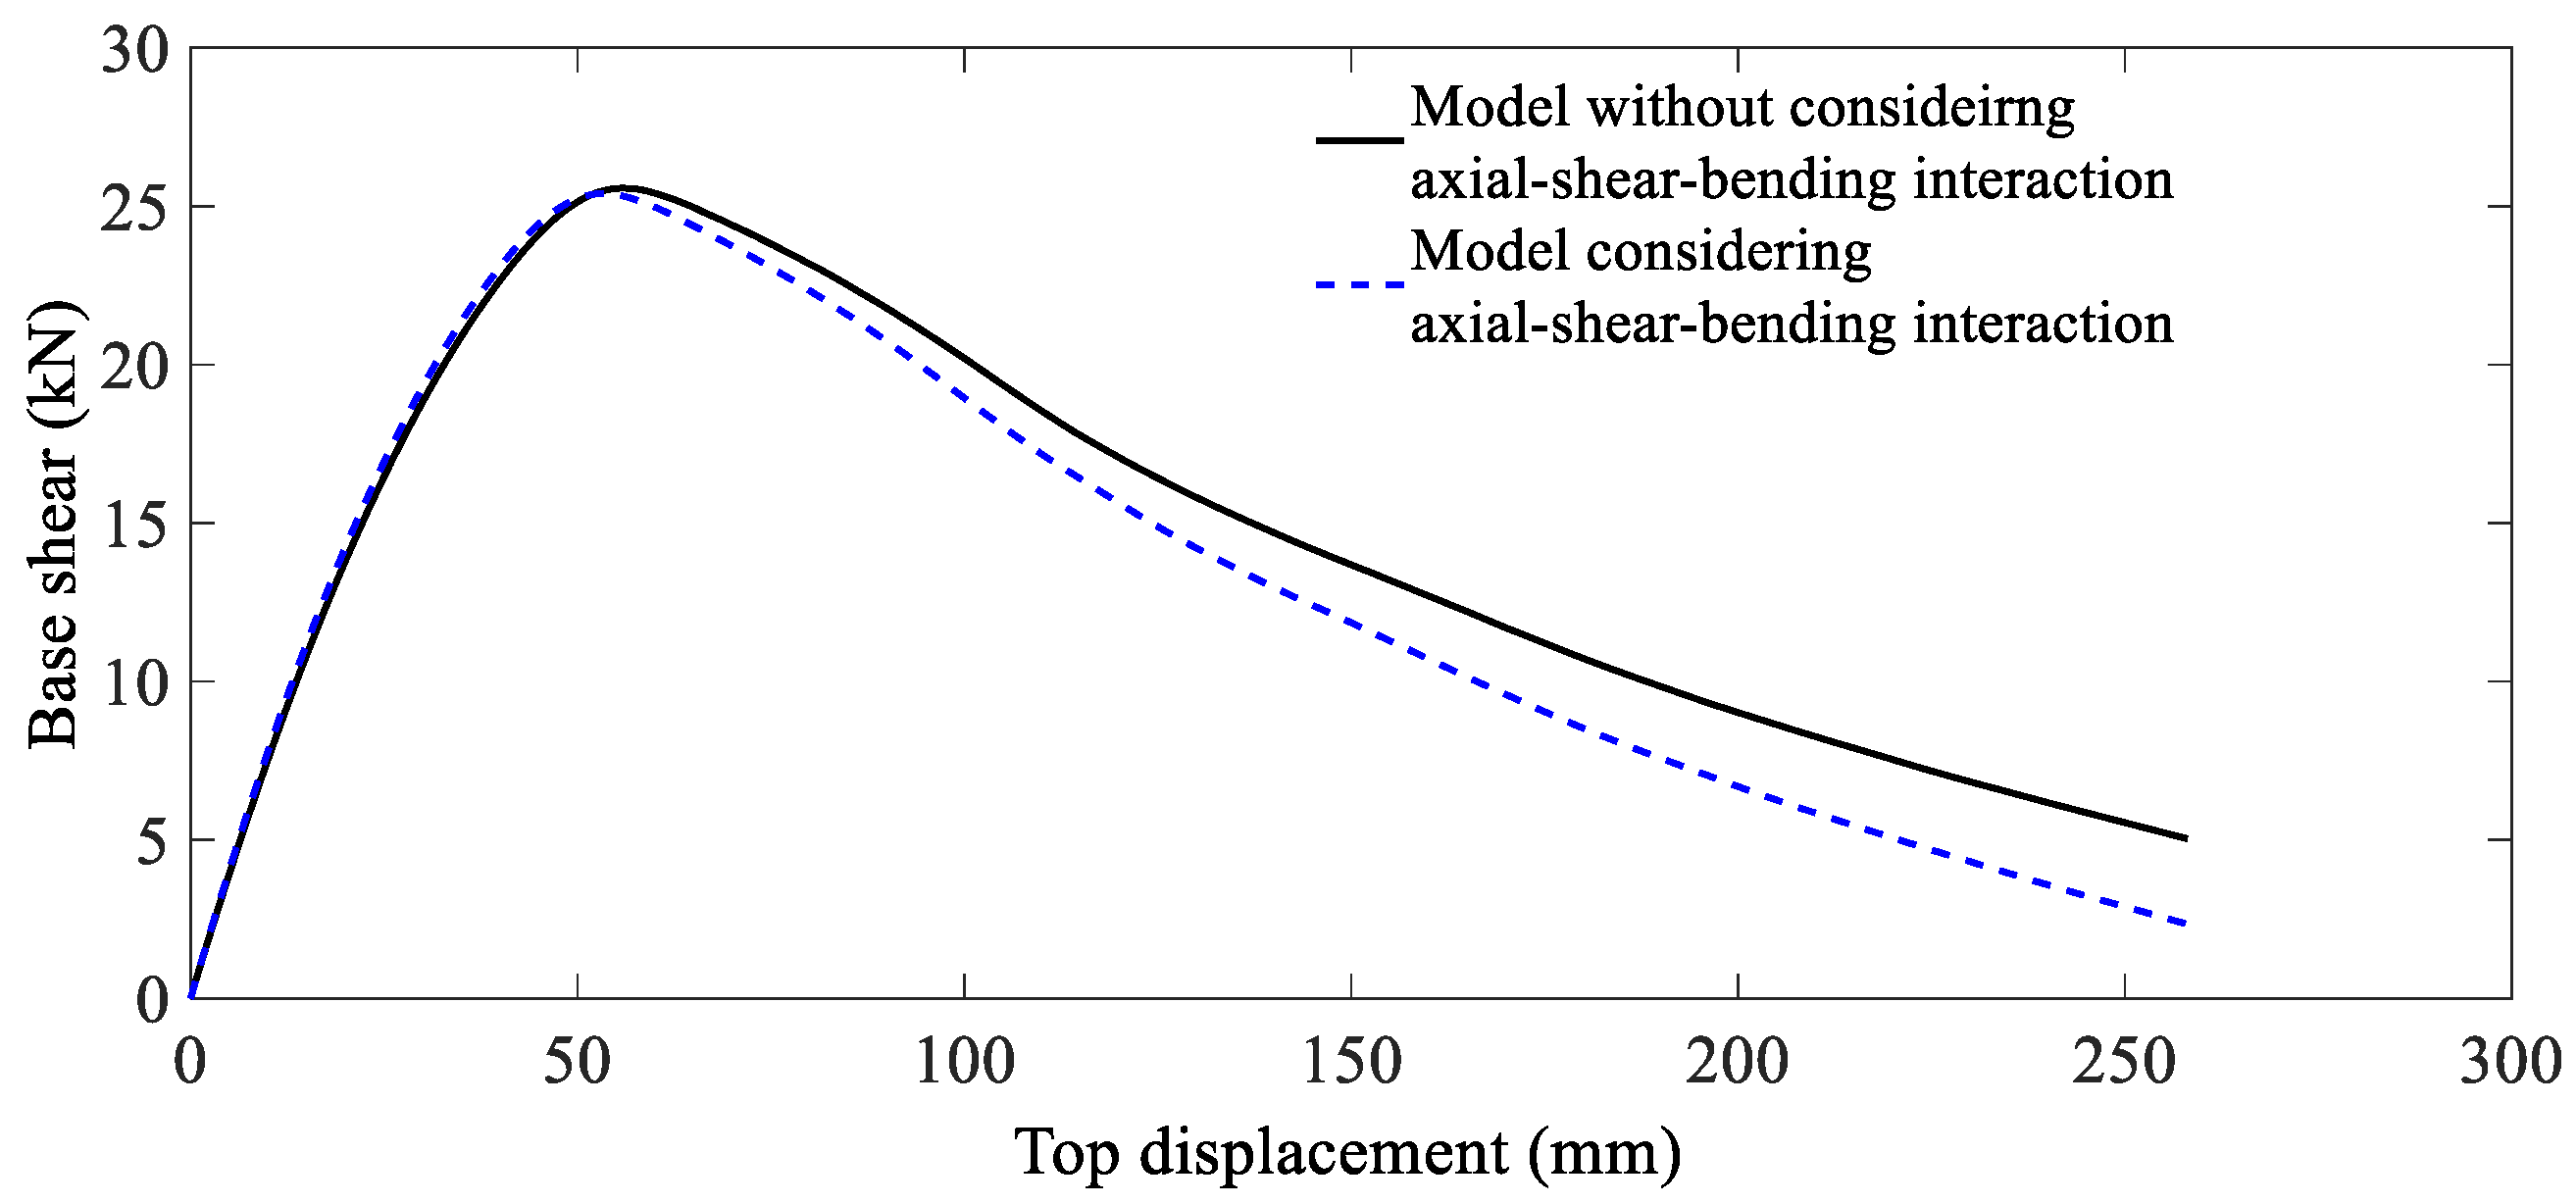
When the roof inter-story drift ratio is less than 1.9%, the pushover curves obtained from the two models are almost identical. When the deformation of structures is greater than 3.5%, the degradation of the model considering the axial–shear–bending interaction of columns is more obvious than that of the model that does not consider the axial–shear–bending interaction of columns, which indicates that not considering the axial–shear–bending interaction of RC columns results in the ductility and degradation characteristics of the structure being overestimated.
(3)
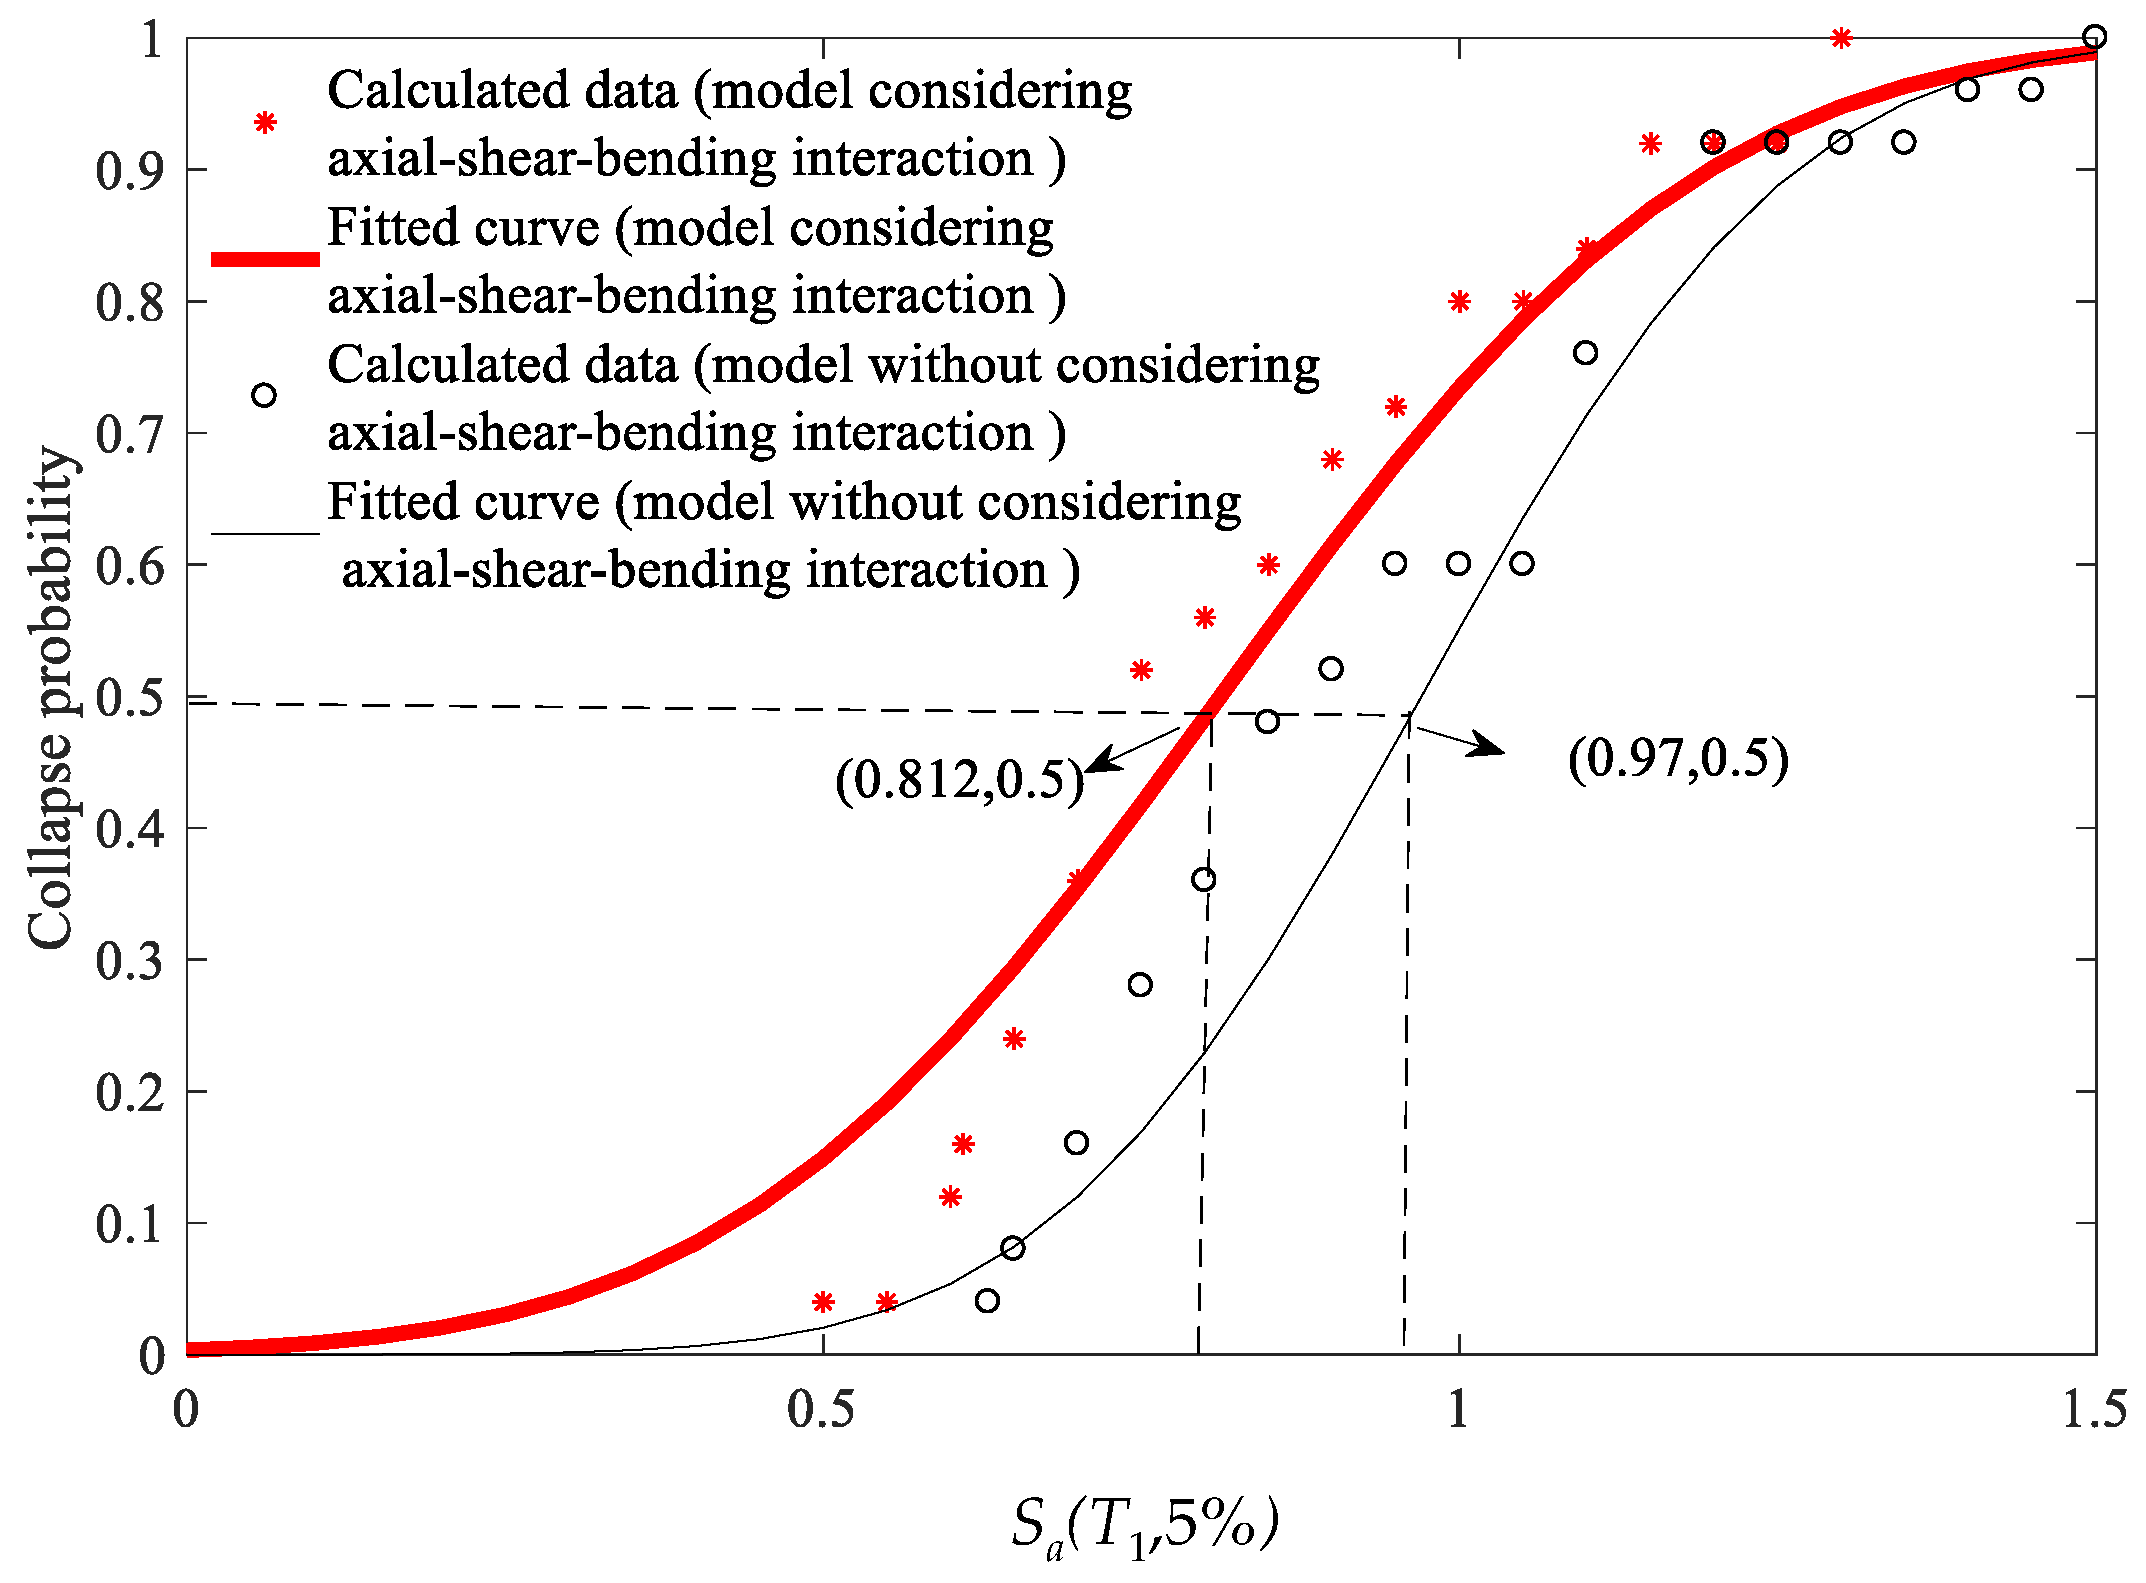
The axial–shear–bending interaction is a key factor that influences the seismic response of structures. During a fortification earthquake event, no obvious damage was done to the structures; the influence was relatively minor. However, during rare earthquake events, severe damage was done to the structures. This resulted in a seismic demand, Sa (T1, 5%), corresponding to a 5.0% inter-story drift ratio being overestimated by approximately 28.3% if the axial–shear–bending interaction was not considered.
(4)
The deformation of infilled concrete frames increases as the ground-motion intensity increases; the pushover curves with and without considering the axial–shear–bending interaction of RC columns show obvious differences, where the deformation for the model considering the axial–shear–bending interaction of reinforced columns is greater than that for the model that does not consider the axial–shear–bending interaction of RC columns.
(5)
Taking the spectral acceleration corresponding to a 50% collapse probability, S a ( T 1 , 5 % ) 50 % , as the index for evaluating the structural collapse resistance capacity, the results indicate that the collapse resistance capacity can be overestimated by 24.5% if the axial–shear–bending interaction of RC columns is not considered.
(6)
Based on the abovementioned analyses and conclusions, the model that considers the shear behavior of columns is useful for acquiring the relative accurate seismic behavior of structures. It is suggested the axial-shear-column interaction of columns should be considering during the evaluation for the seismic performance and global collapse resistance capacity of infilled reinforced concrete frames. Although a teaching building with infilled RC frames in China was selected as the case study, the conclusions attained may also shed light on other types of structures combined with reinforced concrete frames, e.g., a frame-shear wall structure.

Author Contributions

Conceptualization, L.H. and J.H.; Methodology, L.H. and J.H.; Software, H.W.; Validation, H.H., C.L. and Z.Q.; Formal analysis, Y.L.; Investigation, Z.Q.; resources, Y.L.; Data curation, H.W. All authors have read and agreed to the published version of the manuscript.

Funding

The research described in this paper was sponsored by the National Natural Science Foundation of China (52208480), Natural Science Foundation of the Jiangsu Higher Education Institutions of China (22KJB560007), Natural Science Foundations of Hebei Province, China (E2021210096), Central Guidance on Local Science and Technology Development Fund of Hebei Province, China (226Z7602G), Doctor of Entrepreneurship and Innovation in Jiangsu Province (JSSCBS20210553), Nanjing Forestry University Undergraduate Innovation Training Program (202210298100Y and 2022NFUSPITP0134).

Conflicts of Interest

The authors declare no conflict of interest.

References

  1. Feng, Y.; Li, H.; Yu, J.; Jiang, L.; Zhou, W.; Wu, G. Applicability of existing CRTS II ballastless track—Continuous girder bridge system under near-field transverse rare earthquake. Eng. Struct. 2022, 273, 115076. [Google Scholar] [CrossRef]
  2. Feng, Y.; Hou, Y.; Jiang, L.; Zhou, W.; Li, H.; Yu, J. Failure mode of interlayer connection of longitudinally-connected ballastless track-bridge system under uneven pier settlement. Constr. Build. Mater. 2022, 351, 128805. [Google Scholar] [CrossRef]
  3. Cao, X.Y.; Shen, D.; Feng, D.C.; Wang, C.-L.; Qu, Z.; Wu, G. Seismic retrofitting of existing frame buildings through externally attached sub-structures: State of the art review and future perspectives. J. Build. Eng. 2022, 57, 104904. [Google Scholar] [CrossRef]
  4. Cao, X.Y.; Feng, D.C.; Wang, Z.; Wu, G. Parametric investigation of the assembled bolt-connected buckling-restrained brace and performance evaluation of its application into structural retrofit. J. Build. Eng. 2022, 48, 103988. [Google Scholar] [CrossRef]
  5. Dabaghi, M.; Saad, G.; Allhassania, N. Seismic Collapse Fragility Analysis of Reinforced Concrete Shear Wall Buildings. Earthq. Spectra 2019, 35, 35383–35404. [Google Scholar] [CrossRef]
  6. Zhang, Y.R.; Wei, Y.; Miao, K.T.; Li, B. A novel seawater and sea sand concrete-filled FRP-carbon steel composite tube column: Seismic behavior and Finite-Element Analysis. Eng. Struct. 2022, 270, 114872. [Google Scholar] [CrossRef]
  7. Haselton, C.B.; Liel, A.B.; Deierlein, G.G.; Dean, B.S.; Chou, J.H. Seismic Collapse Safety of Reinforced Concrete Buildings. I: Assessment of Ductile Moment Frames. J. Struct. Eng. 2011, 137, 481–491. [Google Scholar] [CrossRef] [Green Version]
  8. Ruggieri, S.; Calò, M.; Cardellicchio, A.; Uva, G. Analytical-mechanical based framework for seismic overall fragility analysis of existing RC buildings in town compartments. Bull. Earthq. Eng. 2022, 1–38. [Google Scholar] [CrossRef]
  9. Huang, X.; Eatherton, M.R.; Zhou, Z. Initial stiffness of self-centering systems and application to self-centering-beam moment-frames. Eng. Struct. 2020, 203, 109890. [Google Scholar] [CrossRef]
  10. Kadysiewski, S.; Mosalam, K.M. Modeling of Unreinforced Masonry Infill Walls Considering in-Plane and out-of-Plane Interaction; Report No. PEER 2008/102; Pacific Earthquake Engineering Research Center, University of California: Berkeley, CA, USA, 2009. [Google Scholar]
  11. D’Angela, D.; Magliulo, G.; Cosenza, E. Characterization of local and global capacity criteria for collapse assessment of code-conforming RC buildings. Bull. Earthg. Eng. 2021, 19, 3701–3743. [Google Scholar] [CrossRef]
  12. Zhang, Y.; Chen, B.; Liu, A.; Pi, Y.L.; Zhang, J.; Wang, Y.; Zhong, L. Experimental study on shear behavior of high strength bolt connection in prefabricated steel-concrete composite beam. Composites 2019, 159, 481–489. [Google Scholar] [CrossRef]
  13. Zhang, Y.T.; Shen, R.H.; Sun, B.Y.; Liu, T.T.; Shi, Y.; Li, L.Y. Selection of Ground Motion Intensity Measures in Fragility Analysis of a Mega-Scale Steel Frame Structure at Separate Limit States: A Case Study. Build 2022, 12, 1530. [Google Scholar] [CrossRef]
  14. Zhang, Y.T.; Ouyang, X.Y.; Sun, B.Y.; Shi, Y.; Wang, Z. A comparative study on seismic fragility analysis of RC frame structures with consideration of modeling uncertainty under far-field and near-field ground motion excitation. Bull. Earthq. Eng. 2022, 20, 1455–1487. [Google Scholar] [CrossRef]
  15. Huang, X.G.; Zhou, Z.; Eatherton, M.R.; Zhu, D.P.; Guo, C.M. Experimental Investigation of Self-Centering Beams for Moment-Resisting Frames. J. Struct. Eng. 2019, 146, 04019214. [Google Scholar] [CrossRef]
  16. Lin, Y.; He, X.; Igarashi, A. Influence of directionality of spectral-compatible bi-directional ground motions on critical seismic performance assessment of base-isolation structures. Earthq. Eng. Struct. Dyn. 2022, 51, 1477–1500. [Google Scholar] [CrossRef]
  17. Elwood, K.J.; Moehle, J.P. Dynamic collapse analysis for a reinforced concrete frame Sustaining shear and axial failures. Earthq. Eng. Struct. Dyn. 2008, 37, 991–1012. [Google Scholar] [CrossRef]
  18. Sezen, H.; Chowdhury, T. Hysteretic model for reinforced concrete columns including the effect of shear and axial load failure. J. Struct. Eng. 2009, 135, 139–146. [Google Scholar] [CrossRef]
  19. Xu, S.; Zhang, J. Axial-shear-flexure interaction hysteretic model for RC columns under combined actions. Eng. Struct. 2012, 34, 548–563. [Google Scholar] [CrossRef]
  20. Lodhi, M.S.; Sezen, H. Estimation of monotonic behavior of reinforced concrete columns considering shear-flexure-axial load interaction. Earthq. Eng. Struct. Dyn. 2012, 41, 2159–2175. [Google Scholar] [CrossRef]
  21. Mullapudi, T.; Ayoub, A. Analysis of reinforced concrete columns subjected to combined axial, flexure, shear, and torsional loads. ASCE J. Struct. Eng. 2013, 139, 561–573. [Google Scholar] [CrossRef]
  22. Mostafaei, H.; Vecchio, F.J. Uniaxial shear-flexure model for reinforced concrete elements. ASCE J. Struct. Eng. 2008, 134, 1538–1547. [Google Scholar] [CrossRef] [Green Version]
  23. Elwood, K.J. Modelling failures in existing reinforced concrete columns. Can. J. Civil. Eng. 2004, 31, 846–859. [Google Scholar] [CrossRef]
  24. GB 50011-2010; Code for Seismic Design of Buildings. National Standards of the People’s Republic of China: Beijing, China, 2010; (In Chinese). Available online: http://www.doc88.com/p-3037442363978.html (accessed on 28 October 2022).
  25. Han, J.P.; Huang, L.; Sun, X.Y. Global collapse resistance capacity investigation of infilled RC frame considering in-plane and out-of-plane interaction of infill walls. Eng. Mech. 2016, 33, 146–154. (In Chinese) [Google Scholar]
  26. Mazzoni, S.; McKenna, F.; Fenves, G.L. The OpenSees Getting Started Manual. 2010. Available online: http://opensees.berkeley.edu (accessed on 28 October 2022).
  27. Essa, A.S.A.T.; Badr, M.R.K.; El-Zanaty, A.H. Effect of infill wall on the ductility and behavior of high strength reinforced concrete frames. HBRC J. 2014, 10, 258–264. [Google Scholar] [CrossRef] [Green Version]
  28. FEMA. FEMA 356, Prestandard and Commentary for the Seismic Rehabilitation of Buildings; Federal Emergency Management Agency: Washington, DC, USA, 2000.
  29. Zhang, Y.; Sun, B.; Shi, Y.; Wang, Z. Estimation of Aleatory Randomness by Sa(T1)-Based Intensity Measures in Fragility Analysis of Reinforced Concrete Frame Structures. CMES-Comput. Model. Eng. Sci. 2022, 130, 73–96. [Google Scholar] [CrossRef]
  30. Ouyang, X.; Zhang, Y.; Ou, X.; Shi, Y.; Liu, S.; Fan, J. Seismic fragility analysis of buckling-restrained brace-strengthened reinforced concrete frames using a performance-based plastic design method. Structures 2022, 43, 338–350. [Google Scholar] [CrossRef]
  31. Huang, L.; Zeng, B.; Zhou, Z.; Zhang, W.; Wei, Y.; Li, C. Seismic behavior and reliability of variable friction damped self-centering prestressed concrete frames considering bolt bearing. Soil Dyn. Earthq. Eng. 2023, 164, 107643. [Google Scholar] [CrossRef]
  32. Zhang, Y.; Wei, Y.; Bai, J.; Zhang, Y. Stress-strain model of an FRP-confined concrete filled steel tube under axial compression. Thin-Walled Struct. 2019, 142, 149–159. [Google Scholar] [CrossRef]
  33. Zhang, Y.R.; Wei, Y.; Bai, J.W.; Wu, G.; Dong, Z.Q. A novel seawater and sea sand concrete filled FRP-carbon steel composite tube column: Concept and behavior. Compos. Struct. 2020, 246, 112421. [Google Scholar] [CrossRef]
  34. Wei, Y.; Bai, J.; Zhang, Y.; Miao, K.; Zheng, K. Compressive performance of high-strength seawater and sea sand concrete filled circular FRP-steel composite tube columns. Eng. Struct. 2021, 240, 112357. [Google Scholar] [CrossRef]
Figure 1. Model method of axial and shear behaviors of column [17].
Buildings 12 02030 g001
Figure 2. The shear-critical column model based on the uniaxial hysteretic material model [17]. (a) Model of shear–bending interaction. (b) The displacement response of the column caused by shear and bending deformations.
Buildings 12 02030 g002
Figure 3. Hysteretic curve of shear–bending interaction model [17].
Buildings 12 02030 g003
Figure 4. Backbone curve of shear–bending interaction model (shear limit curve) [17].
Buildings 12 02030 g004
Figure 5. Axial spring in series model based on shear failure [23]. (a) Axial spring model. (b) P Δ V and P Δ H curves.
Buildings 12 02030 g005
Figure 6. Shaking-table test model for four-story, infilled RC-planar-frame structure. (a) Plan view of first floor. (b) Plan view of other floors. (c) Reinforcement of column. (d) Reinforcement of beam.
Buildings 12 02030 g006aBuildings 12 02030 g006b
Figure 7. Table excitation for the shaking-table test.
Buildings 12 02030 g007
Figure 8. Verification of numerical models.
Buildings 12 02030 g008
Figure 9. Simulation of infill walls [10].
Buildings 12 02030 g009
Figure 10. Fiber discretization of beam–column elements [10].
Buildings 12 02030 g010
Figure 11. Comparison of top displacement curves. (a) Model considering axial–shear–bending interaction. (b) Model without considering axial–shear–bending interaction.
Buildings 12 02030 g011
Figure 12. Comparison of IDA curves.
Buildings 12 02030 g012
Figure 13. Comparison of pushover curves.
Buildings 12 02030 g013
Figure 14. Acceleration spectra of ground motions.
Buildings 12 02030 g014
Figure 15. Design spectrum during fortification and rare earthquake events.
Buildings 12 02030 g015
Figure 16. Maximum inter-story drift ratio of structures under 22 ground motions. (a) Fortification earthquakes. (b) Rare earthquakes.
Buildings 12 02030 g016
Figure 17. IDA curves with and without considering axial–shear–bending interaction of RC columns. (a) Model without considering the axial–shear–bending interaction of columns. (b) Model considering the axial–shear–bending interaction of columns. (c) The 16%, 50%, and 80% fractile IDA curves.
Buildings 12 02030 g017
Figure 18. Collapse probability curves.
Buildings 12 02030 g018
Table 1. Material properties for the reinforced bars.
DiameterElasticity Modulus (N/mm2)Yield Strength (N/mm2)Ultimate Strength (N/mm2)
1.61.82 × 105252.3346.8
41.85 × 105360.4422.1
61.91 × 105366.9420.3
Publisher’s Note: MDPI stays neutral with regard to jurisdictional claims in published maps and institutional affiliations.

