Article

Research on the Shear Behaviour of Composite Shear Connectors

1
School of Civil Engineering, Xijing University, Xi’an 710123, China
2
School of Highway, Chang’an University, Xi’an 710064, China
*
Author to whom correspondence should be addressed.
Buildings 2022, 12(10), 1726; https://doi.org/10.3390/buildings12101726
Submission received: 25 September 2022 / Revised: 12 October 2022 / Accepted: 17 October 2022 / Published: 18 October 2022
(This article belongs to the Special Issue Research on Statics and Dynamics of Structures)

Abstract

:
In order to make full use of the advantages of welded stud and perfobond rib shear connectors, a new type of composite shear connector is proposed. Studs are welded to the perforated steel plate of the PBL connectors. Six specimens were designed and tested to investigate the shear behaviour of the composite connectors. The effects of the hole number, welded stud number, and end-bearing modes on the shear behaviour of the composite connectors were discussed. In addition, the composite connectors were compared with the conventional welded stud and perfobond rib connectors to analyse the difference in shear performance. The composite connectors’ shear behaviours are significantly better than those of welded stud connectors and PBL connectors. The experimental results show that increasing the number of welded studs and perforated holes and end-bearing concrete can significantly improve the shear performance of composite connectors. Secondly, a finite element model was established considering the nonlinearity of the structure and was validated based on the experimental results. Finally, the effects of reinforcement diameter, welded stud diameter, and concrete strength on the shear performance of composite connectors were analysed. The shear resistance increases as the penetrating rebar diameter, welded stud diameter, and concrete strength increase. Moreover, the overall damage level of the concrete can be significantly affected.

1. Introduction

Steel–concrete composite bridges are widely used in large-span cable-stayed bridges, suspension bridges, and continuous girder bridges because of their excellent mechanical properties, economy, and ease of construction [1,2,3,4]. In composite structures, shear connectors are the key to ensuring that the steel girders and concrete slabs are jointly stressed and that the performance of both is fully utilised [5]. The welded stud connector is one of the most widely used shear connectors in bridge engineering [6,7]. It has the characteristics of convenient construction, low cost, and consistent shear resistance in all directions [8,9,10,11].
The performance of welded stud connectors in steel–concrete composite structures has been studied extensively by scholars at home and abroad using push-out tests and numerical analysis. Viest [12] proposed a formula for assessing welded stud connectors’ shear resistance by push-out tests. Later, Ollgaard et al. [13] proposed formulas for the effect of the elastic modulus and compressive strength of concrete on the shear resistance of welded stud connectors by 48 push-out tests. With the development of technology, people started to analyse the mechanical properties of welded stud connectors by combining numerical simulations. Nguyen et al. [14] established a refined finite element model by considering the nonlinearities of the material and the damage to the welded stud. The shear resistance, ductility, failure mode, and load–slip curve characteristics were investigated, and the Eurocode-4 [15] and AASHTO LRFD codes [16] shear resistance calculation equation were evaluated. Xu et al. [17] investigated the effect of concrete cracks on the mechanical properties of welded stud connectors based on finite element analysis. The results showed that the development of concrete cracks damaged the transfer of shear force between the welded stud and concrete and reduced the shear stiffness of the welded stud. However, the cracks had less effect on the shear resistance of the welded stud, and a simplified analysis method for the depth of concrete cracks was proposed. Dönmez and Ahmet [18] studied the mechanical properties of welded stud connectors under monotonic load by push-out tests and finite element simulations. It was verified that the size effect law proposed by Bazant [19] can fit the size effect properties of shear joints well. The size effect of welded stud shear connectors in steel–concrete composite beams is revealed.
In practical application, however, it has been found that there are also some problems with using welded stud shear connectors in steel–concrete composite beams. On the one hand, the welding workload is too great in large-span composite beams, and welding quality control is challenging. On the other hand, welded studs have insufficient fatigue properties and are prone to fracture at the weld [20,21,22]. These problems limit further applications.
In order to overcome the shortcomings of welded stud connectors, a new type of connector is proposed—a perfobond rib (PBL) shear connector [23]. The PBL connector consists of the perforated steel plate, the concrete dowel, and the penetrating rebar. Compared with the welded stud connector, the PBL connector not only has higher shear resistance and shear stiffness but also has the the advantages of excellent fatigue resistance and simple construction [24,25,26,27,28,29].
Since the emergence of PBL connectors, scholars have conducted extensive research on mechanical properties. Su et al. [30] analyzed the failure mechanism of PBL connectors by push-out tests and summarized the failure modes of push-out specimens. The results indicated that brittle failure often occurs in PBL connectors under the ultimate load state. Zhang et al. [31] and Liu et al. [32] investigated the internal force transfer mechanism of PBL connectors. The load distribution applied to multiple rows of PBL connectors was not uniform and became more pronounced as the PBL connectors underwent plastic deformation. Yang and Chen [25] obtained the shear stiffness calculation equation of PBL connectors based on elastic foundation beam theory through multiple sets of measured data. They proposed the corresponding equation for evaluating the shear resistance based on theory. Wang et al. [24] included the concrete stress state around the PBL connectors into the factors affecting the shear capacity for the first time. In addition, the influencing factors, such as the penetrating rebar diameter, hole diameter, and perforated steel plate thickness, were also considered, and the push-out tests were carried out based on these factors. The test results demonstrated that the transverse compressive stress and other factors were positively correlated with the shear resistance. Finally, a calculation equation for shear resistance was proposed based on the measured data.
The results of existing studies show that although PBL connectors have many advantages, there are some disadvantages. Firstly, the high stiffness of PBL connectors makes them susceptible to brittle failure, adversely affecting structural safety [33,34,35]. Secondly, PBL connectors use a large amount of steel and require additional opening processes. In the case of similar shear resistance, the amount of steel used for PBL connectors is much higher than that of steel used for welded stud connectors, resulting in a relatively high cost. In addition, PBL connectors are arranged in a continuous pattern on the steel beam, which does not take full advantage of the contribution of the end-bearing concrete to the shear resistance [36,37].
It is evident that both welded stud shear connectors and PBL shear connectors have some shortcomings when used alone. Therefore, this study combines the shear resistance mechanism and structural characteristics of both shear connectors to propose a new composite shear connector. This new composite shear connector has studs welded to the perforated steel plate, which further improves the shear performance. On the other hand, the transverse headed studs also increase the pulling resistance between the concrete slab and the steel flange. Firstly, specimens were designed for push-out tests to investigate the mechanical properties of composite shear connectors and compared with conventional shear connectors. Then, the effects of the perforated hole number, welded stud number, and end-bearing modes on the shear behaviour were investigated. Finally, the factors affecting the shear resistance of the structure are analysed by numerical simulation.

2. Experimental Program

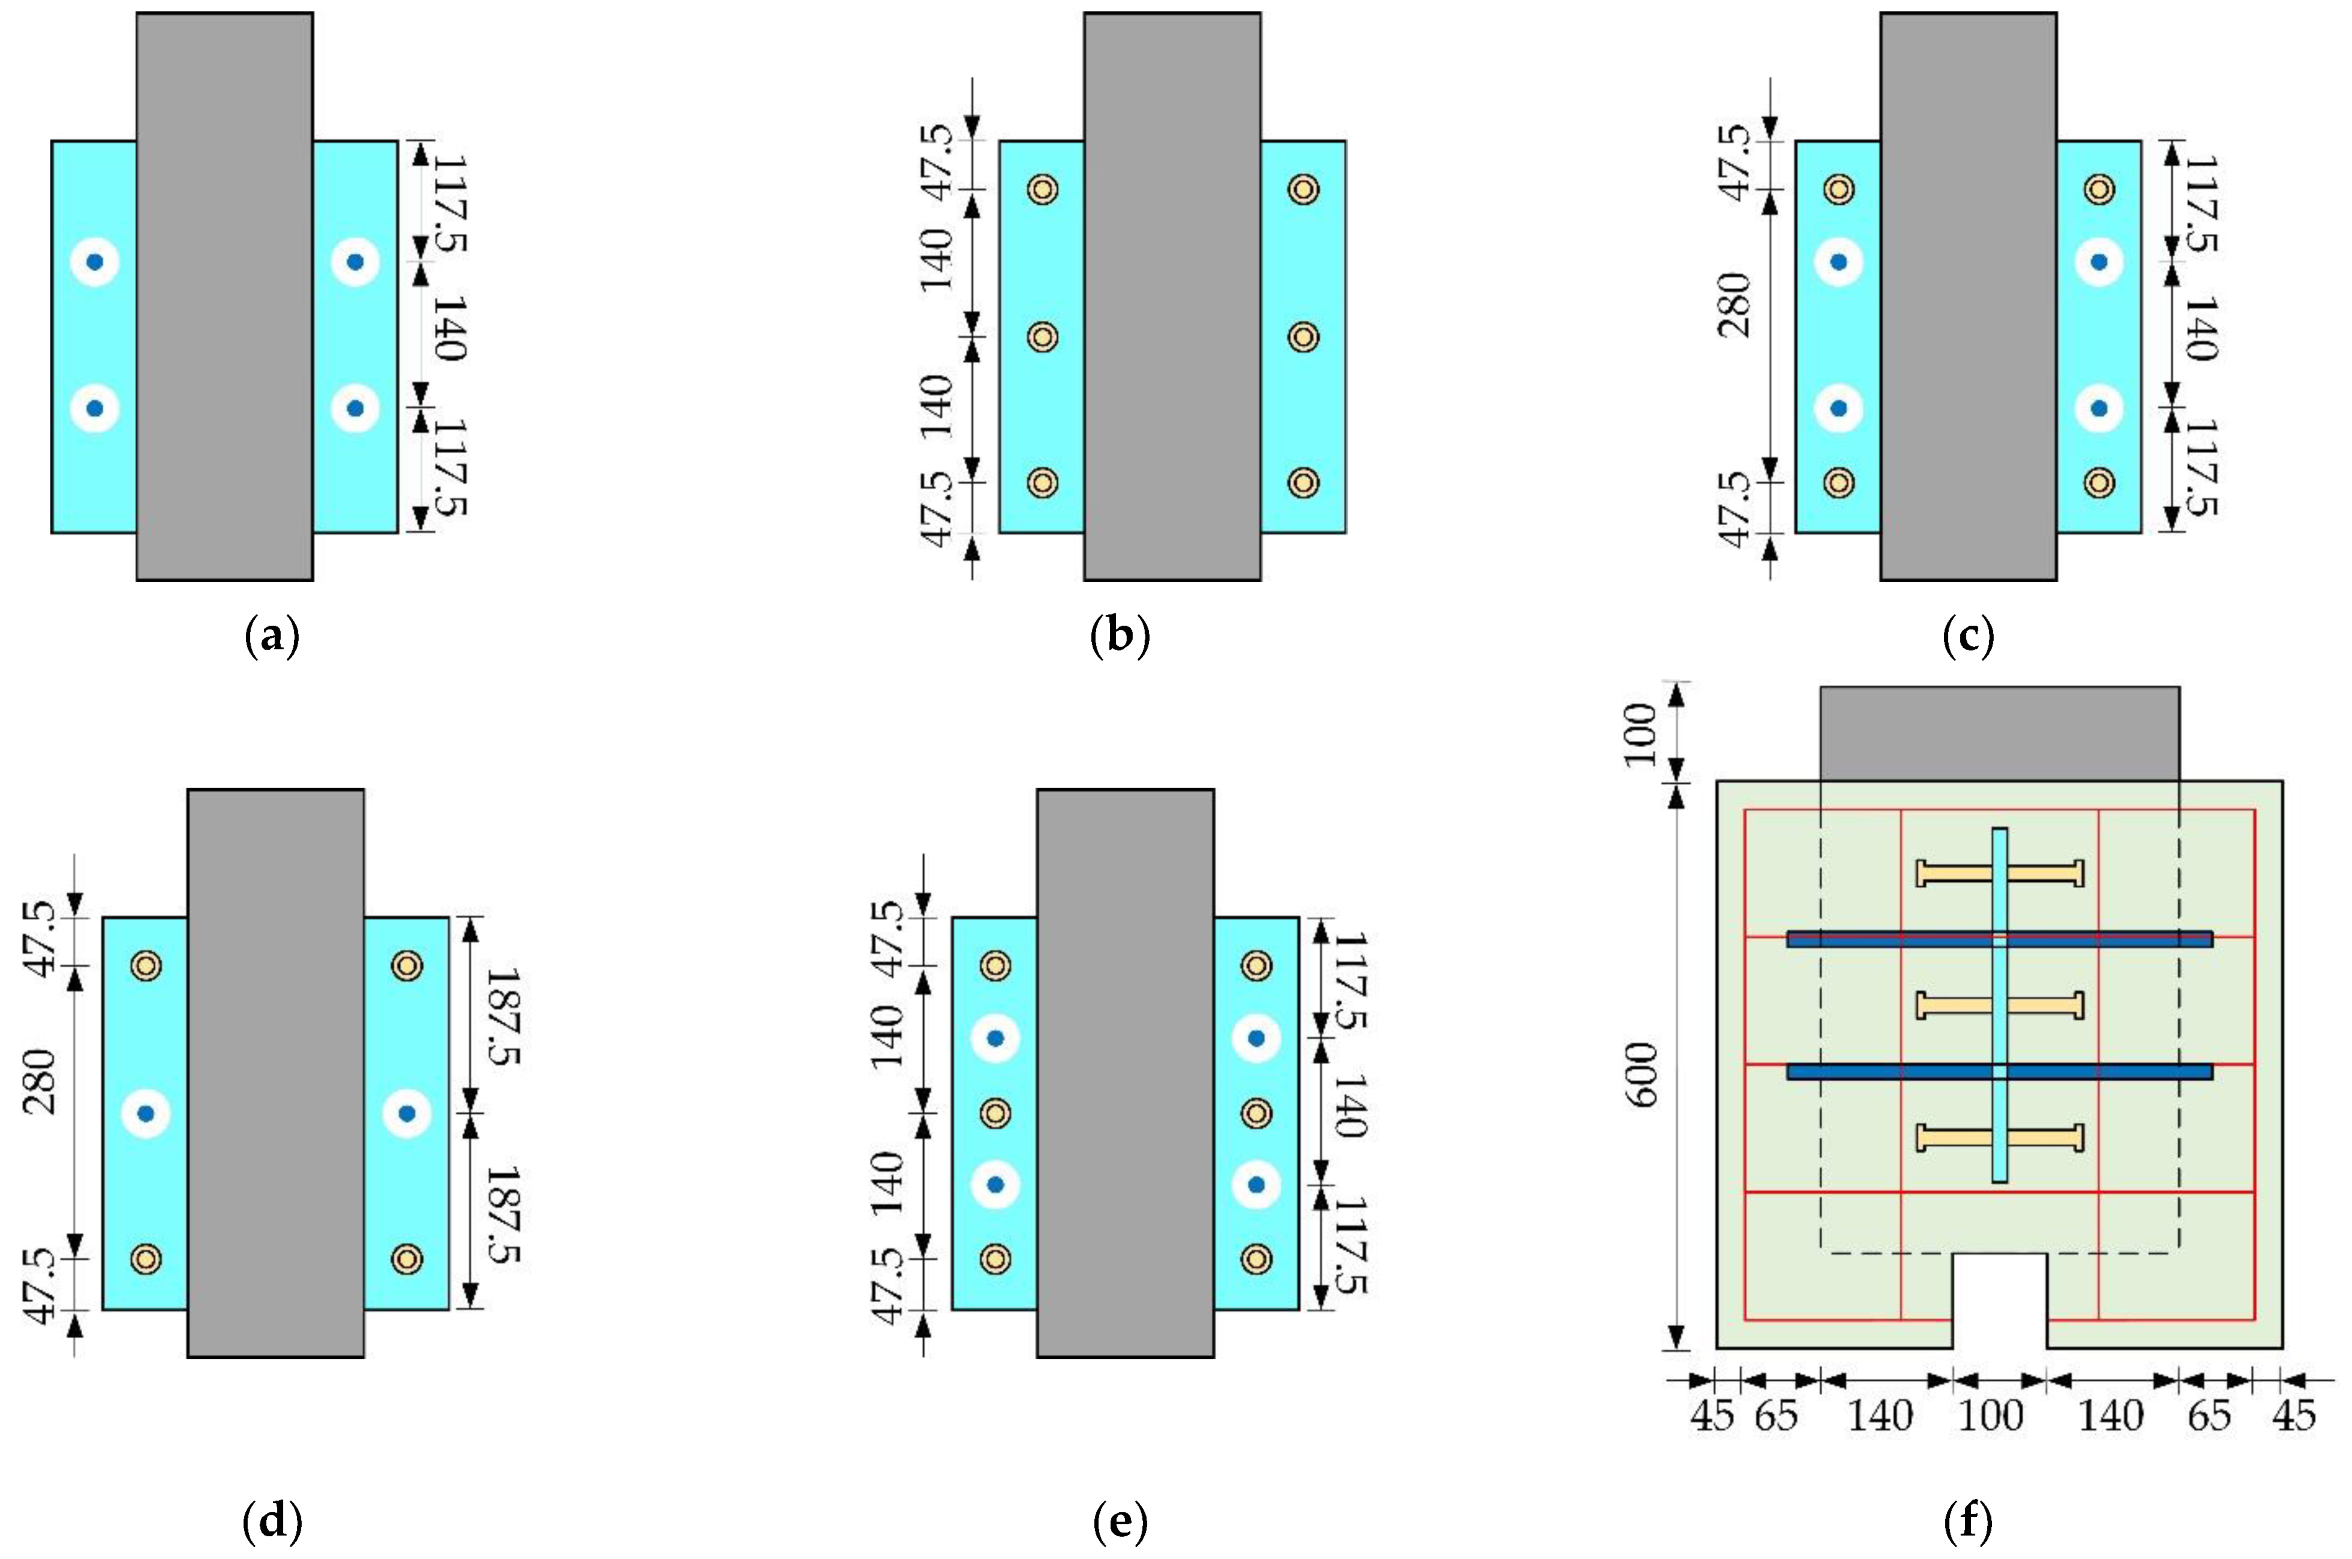
2.1. Design of Specimens

Six push-out specimens were designed to investigate the shear behaviour of composite connectors, and static tests were conducted as shown in Figure 1. These included one welded stud connector, one PBL connector and four composite connectors. The specific design parameters are shown in Table 1.
The arrangement of the welded studs and the penetrating rebars is shown in Figure 2. The concrete slab dimensions are 600 mm × 600 mm × 150 mm, and the material is C50 concrete. The perforated steel plate and H-beam are made of Q355 steel. The penetrating rebar is HRB400E rebar, and the welded stud is Q235 steel. To ensure the quality of the specimens, gas shielded welding is used for welding the perforated steel plates, studs, and H-beams. The diameter of the structural rebar is 8 mm, and the material is HRB400E rebar. The structural rebars are processed by a combination of binding and spot welding.
In order to better grasp the properties of the structure, the mechanical properties of various materials were obtained through material property tests. Concrete axial compressive strength and elastic modulus are 35.64 MPa and 34.26 GPa, respectively. Tensile strength tests were performed on steel plates and rebars. The yield strength, ultimate tensile strength and elastic modulus measured by tests are shown in Table 2.

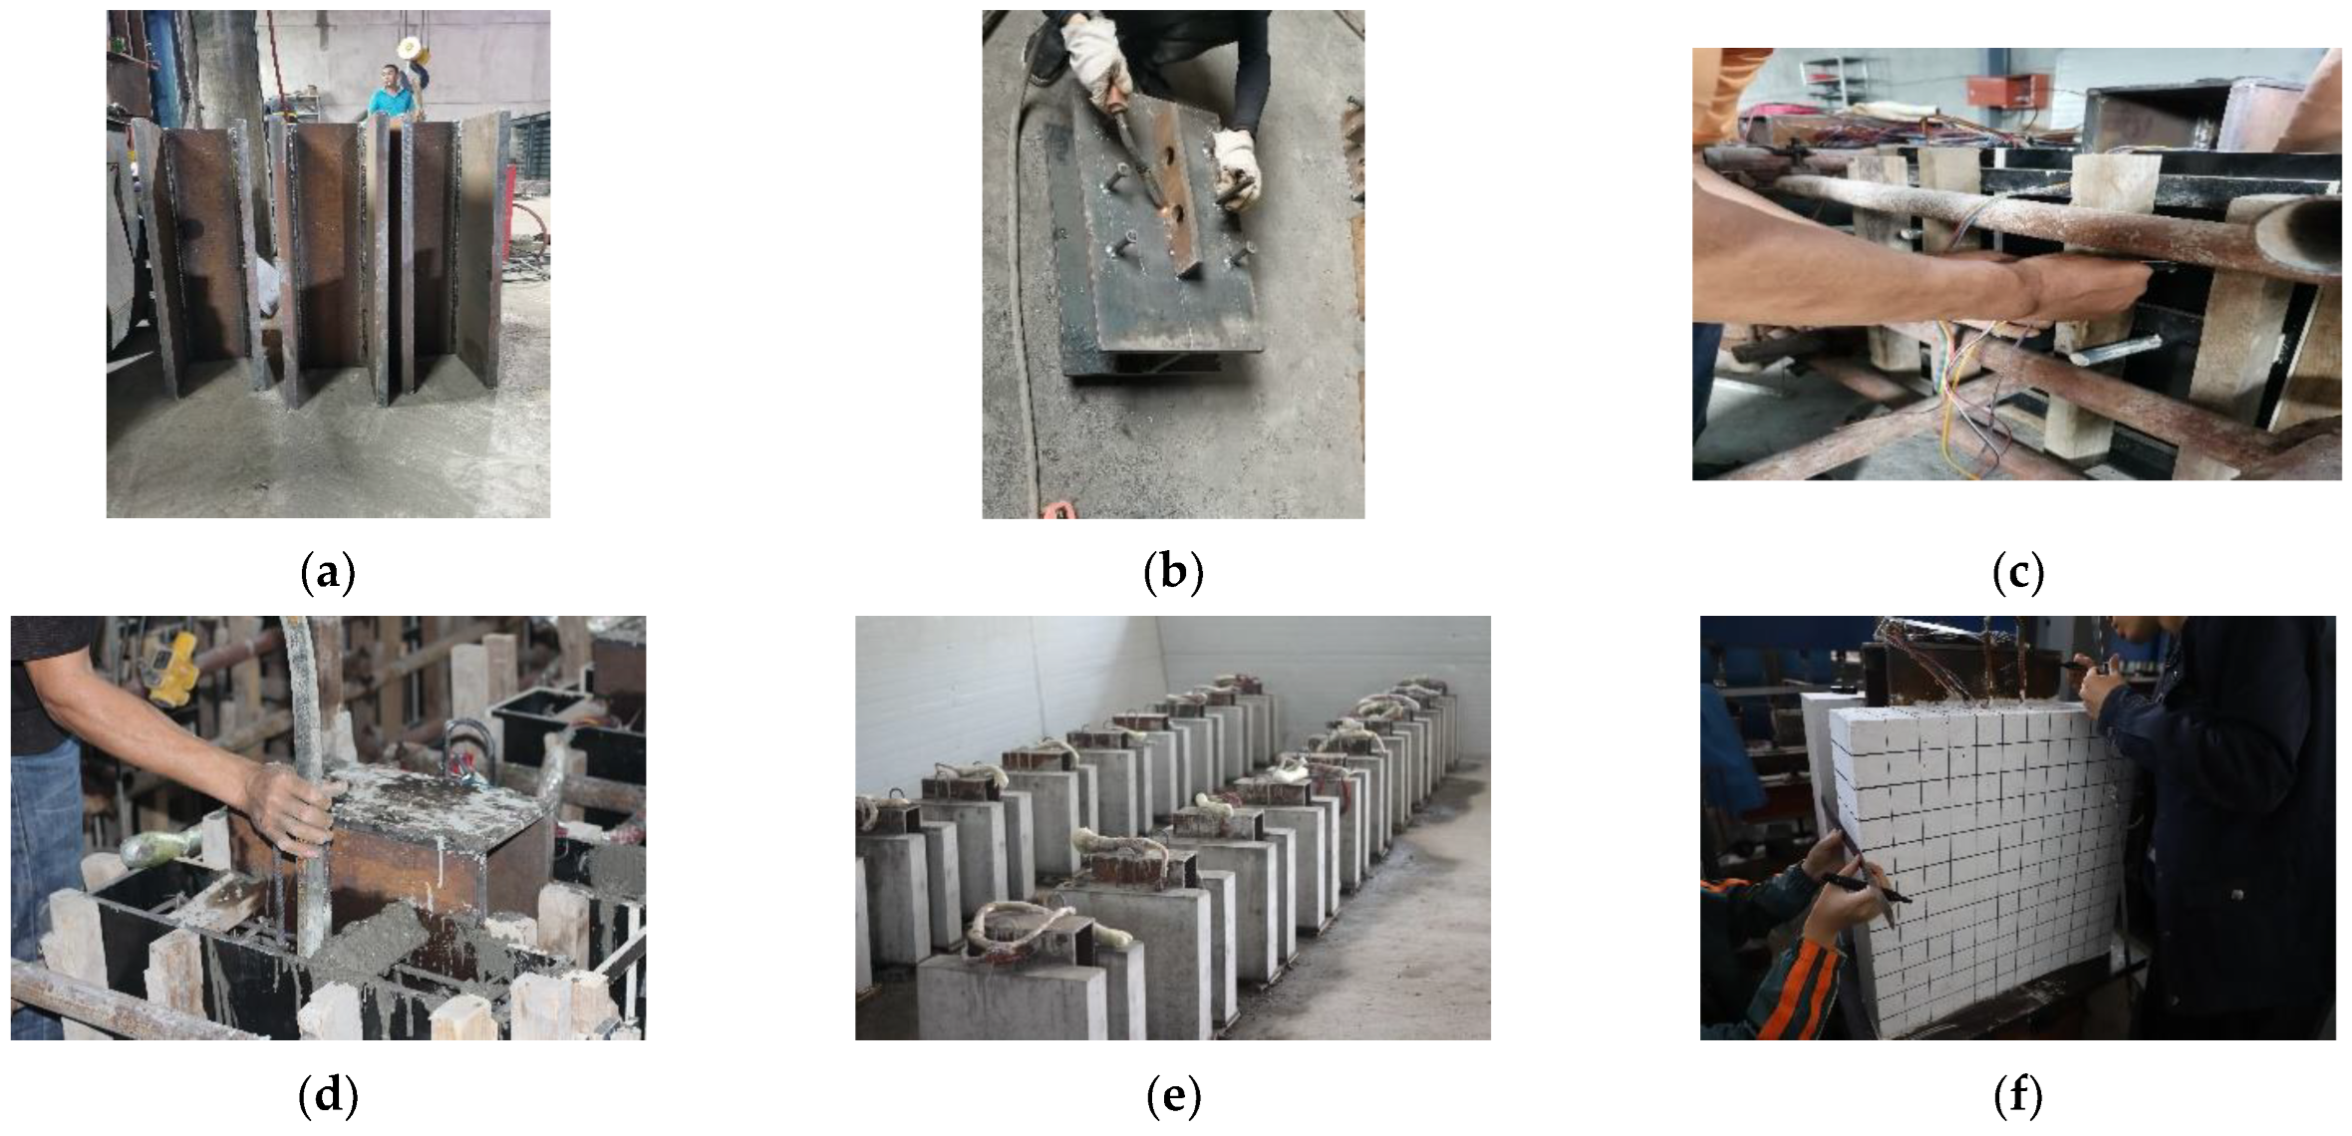
2.2. Specimen Fabrication

The H-beam was first processed and cut into 600 mm segments when fabricating the specimen. According to the design drawings, weld studs and perforated steel plates were at the corresponding positions on both sides of the H-beam. The formwork was preformed according to the concrete slab dimensions, ensuring that the penetrating rebars were in the centre of the perforated holes. To reduce friction between the concrete and the H-beam, the surface of the H-beam was brushed with oil. Concrete is poured in layers. Several days after pouring, the mould was removed and covered with geotextiles. Water was sprinkled daily and regularly during the curing time. After the scheduled age, a layer of emulsion paint was applied to the concrete slab’s surface and the 50 mm × 50 mm grid was drawn with black markers to facilitate the location of cracks during the loading process. The concrete slab inside the specimen was ground, and the angle steel was pasted to make it easier to install the linear variable differential transformers (LVDTs). The fabrication process of the specimen is shown in Figure 3.

2.3. Loading Scheme and Measurements

The loading equipment and LVDTs used for the push-out tests are shown in Figure 4. The specimens were preloaded according to Eurocode-4 with a loading value of 40% of the simulated shear resistance. In the formal test, the load was applied at a rate of 0.5 kN/s. A force sensor is used to measure the load to control the force better. After the load has reached the shear resistance, the loading is continued at a rate of 0.02 mm/s instead. Loading was stopped when the slip reached 40 mm or when the residual shear resistance was less than 40% of the peak shear resistance. The development of cracks on the concrete surface and the damage to the connectors were observed and recorded.
In the test, the relative slip of the H-beam and concrete slab was mainly measured by LVDTs. In order to avoid measurement errors in the test, the relative slip was replaced by the average value of four LVDT measurements.

3. Test Results and Analysis
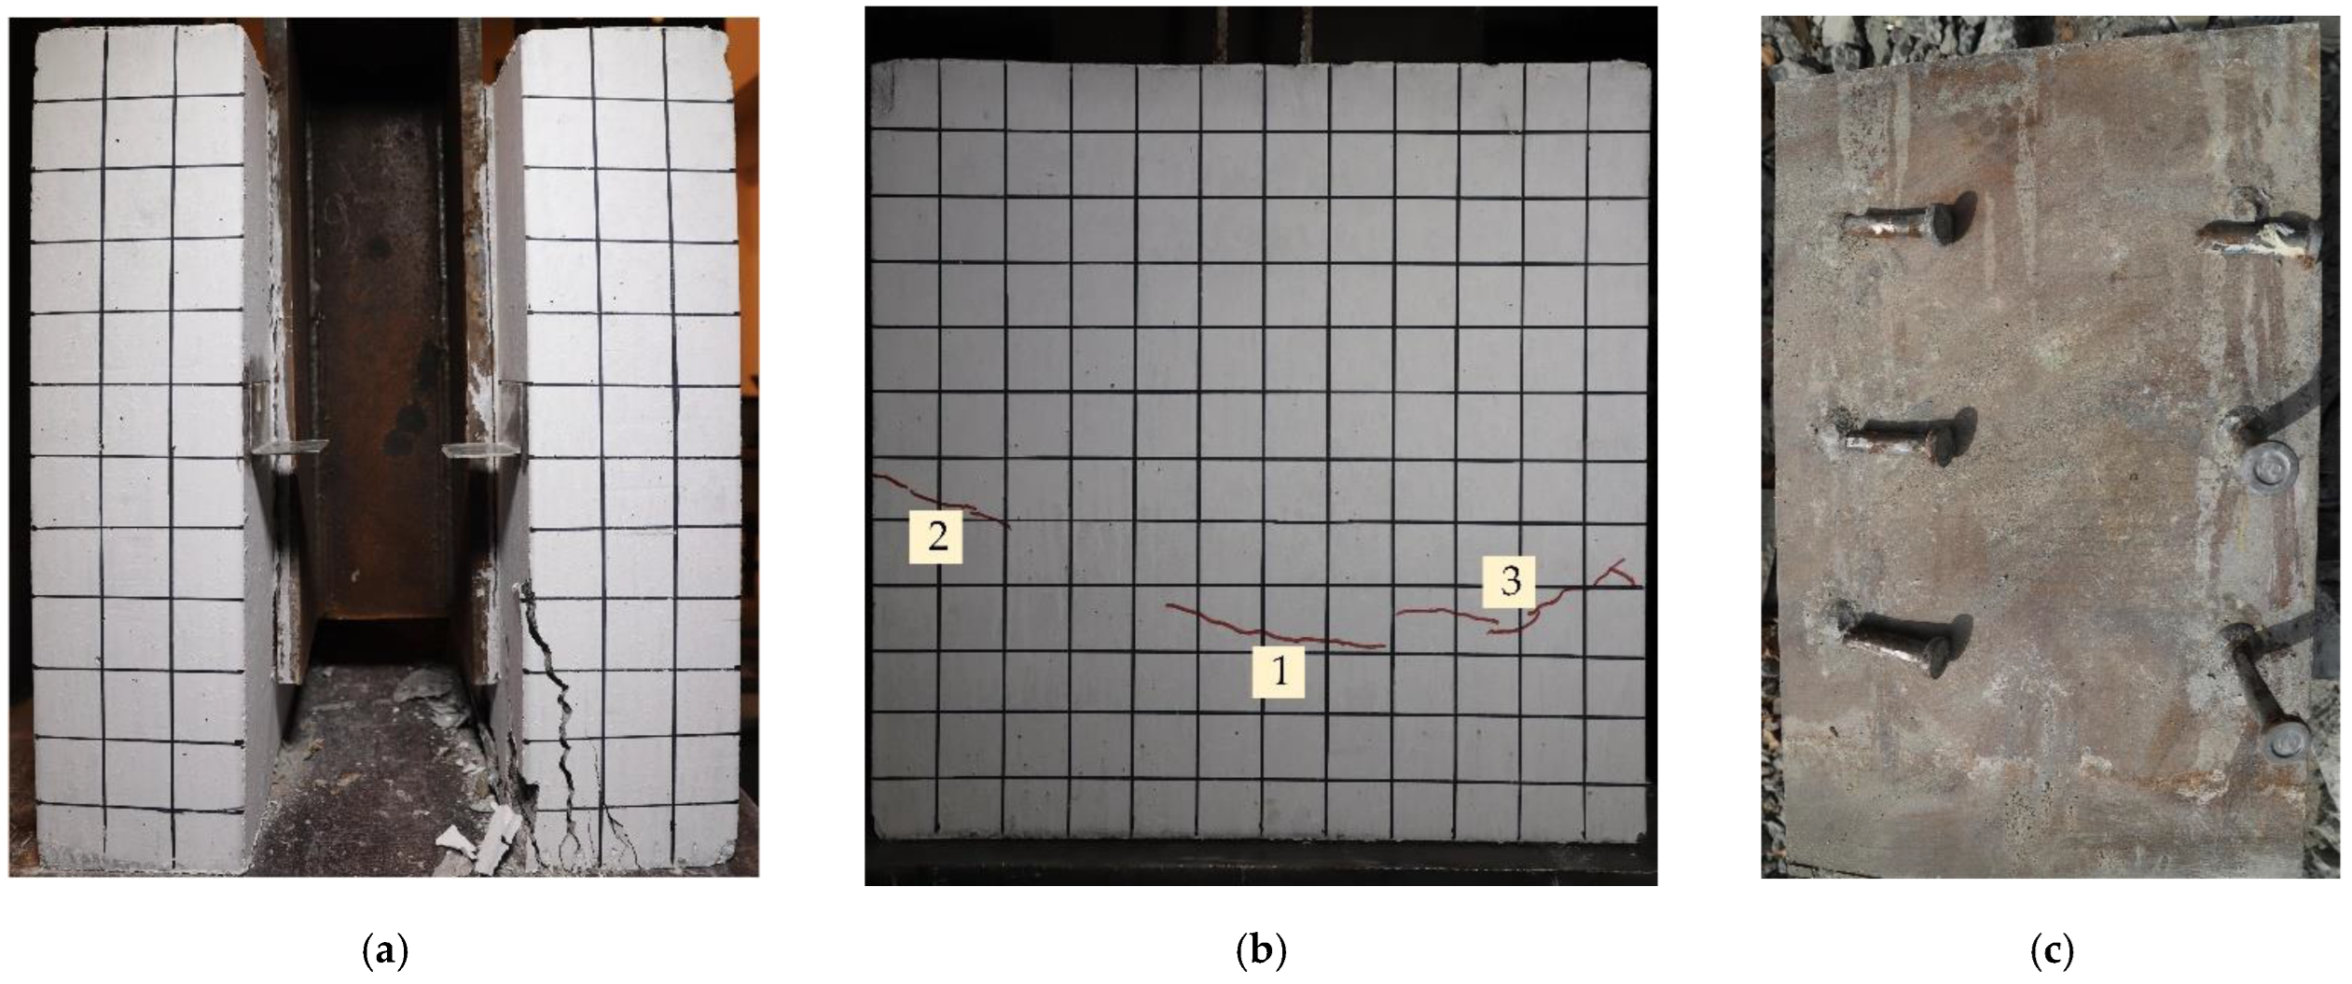
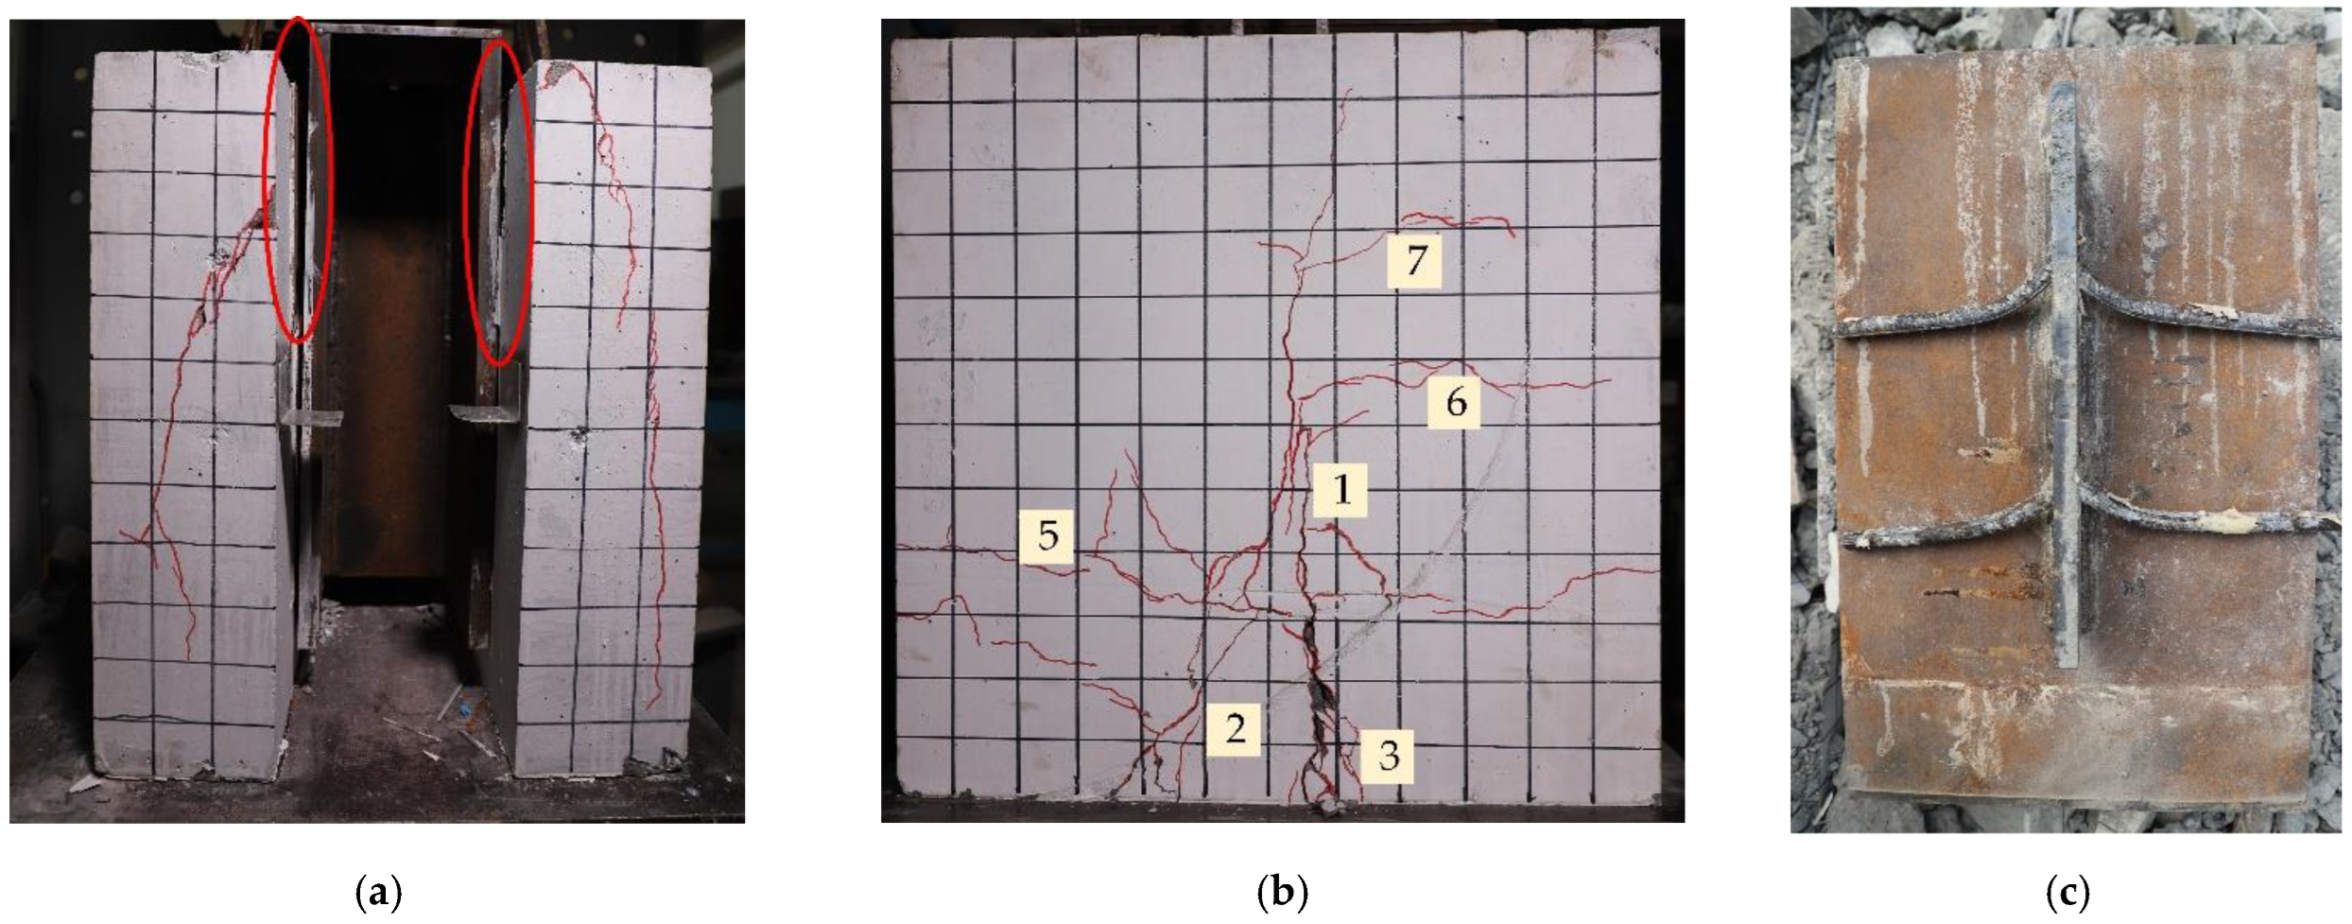
3.1. Failure Modes

3.1.1. Welded Stud Shear Connector

The failure modes for the specimen are shown in Figure 5. The welded stud connector was in an elastic stage at the beginning of the loading, without apparent phenomena. When the load reached 527 kN, the structure entered a plastic stage, and the root of the welded stud was deformed, generating a large slip with the surrounding concrete. At the load of 753 kN, the first crack in the concrete slab on the right side of the front of the specimen appeared to extend inward, as shown in Figure 5a. When the load reached the ultimate shear resistance, there were multiple cracking sounds, indicating that the internal welded studs were not sheared simultaneously. The relative slip increased rapidly while the load decreased significantly. A small number of cracks appeared in the concrete, as Figure 5b shows. The numbers in Figure 5b indicate the order in which the cracks appeared. When the concrete slab was chiselled away, it was found that the top welded studs were all fractured. One welded stud in each of the other two rows was not broken, as illustrated in Figure 5c. However, the degree of bending was different, verifying the phenomenon of uneven stress distribution in the welded stud group.

3.1.2. PBL Shear Connector

The damage to the PBL connector is shown in Figure 6. Vertical crack 1 appeared on the side of the specimen at 1108 kN, followed by diagonal crack 2 and transverse cracks 3, 4, 5, and 6 in succession, as illustrated in Figure 6b. In particular, transverse cracks 3 and 4 appeared in the concrete end-bearing zone. The initial location of the emergence of cracks 5 and 6 was at the location of the perforated holes, due to the interaction between the penetrating rebars in the hole and the concrete dowels. When the load reached the shear resistance, there was no apparent violent sound or significant displacement, and at this moment, cracks 3 and 4 extended through the entire plane, but the crack width was narrow. Crack 1 continued to develop upwards, and the width of the crack at the bottom end of the specimen widened. When the load dropped to 948 kN, fine diagonal cracks developed in the middle and bottom of the front of the specimen and continued towards the inner side of the concrete. Flake spalling continued to occur at the bottom of the concrete. When the specimen was damaged, the H-beam detached significantly from the concrete on both sides in Figure 6a.

3.1.3. Composite Shear Connector with End-Bearing Concrete

The failure modes of the three composite connectors with end-bearing concrete are similar, so the analysis focuses on the failure mode of specimen C-2-3. No visible damage occurred in specimen C-2-3 during the initial loading. At 1724 kN, the first vertical crack 1 in Figure 7b appeared on the side of the specimen. At 1940 kN, as demonstrated in Figure 7a, a crack appeared at the front of the specimen. As the load continued to increase, other cracks appeared one after another. After the specimen reached the shear resistance, the load suddenly dropped, but the welded studs were not cut off, while symmetrical diagonal shear cracks appeared in the concrete slab. When the load dropped to 1673 kN, cracks 5 and 6 appeared at the welding position of the welded studs, which were caused by the bending deformation of the welded studs. Meanwhile, the local stress concentration in the concrete caused the concrete to break and fall off at the junction of cracks 1 and 4. The tests ended with the longitudinal splitting of the concrete slab at the side of the specimen and the diagonal cracking of the concrete slab at the front of the specimen. As the load increased, the concrete tensile stress gradually reached the ultimate tensile strength and cracks extended to the outer surface of the concrete. Eventually, cracking developed along the height of the concrete slab, leading to the splitting damage. Symmetrical diagonal shear cracks appeared in the concrete slab on both sides, with a maximum crack width of 11 mm. In addition, the spalled concrete at the bottom is mainly flaky, as shown in Figure 7a. The welded studs underwent bending deformation without shear damage, and the penetrating rebars showed significant bending deformation at the location of the perforated holes, as Figure 7c showed. There was a significant gap between the H-beam and the concrete slab.

3.1.4. Composite Shear Connector without End-Bearing Concrete

The shear resistance of specimen C-2-3# was 1422.03 kN, about 800 kN lower than that of specimen C-2-3. The failure mode is displayed in Figure 8. When the load reached 1341 kN, crack 1 appeared at the concrete slab slot and continued to extend towards the top. Crack 2 was located at the root position of the welded studs due to the compression of the surrounding concrete by the welded studs. The concrete was almost in shear at the two corners above the slot. The convergence of the cracks resulted in the formation of triangular wedges in the upper part of the slot. When the specimen was damaged, the wedge fell off, and the welded studs and penetrating rebars were deformed by bending.

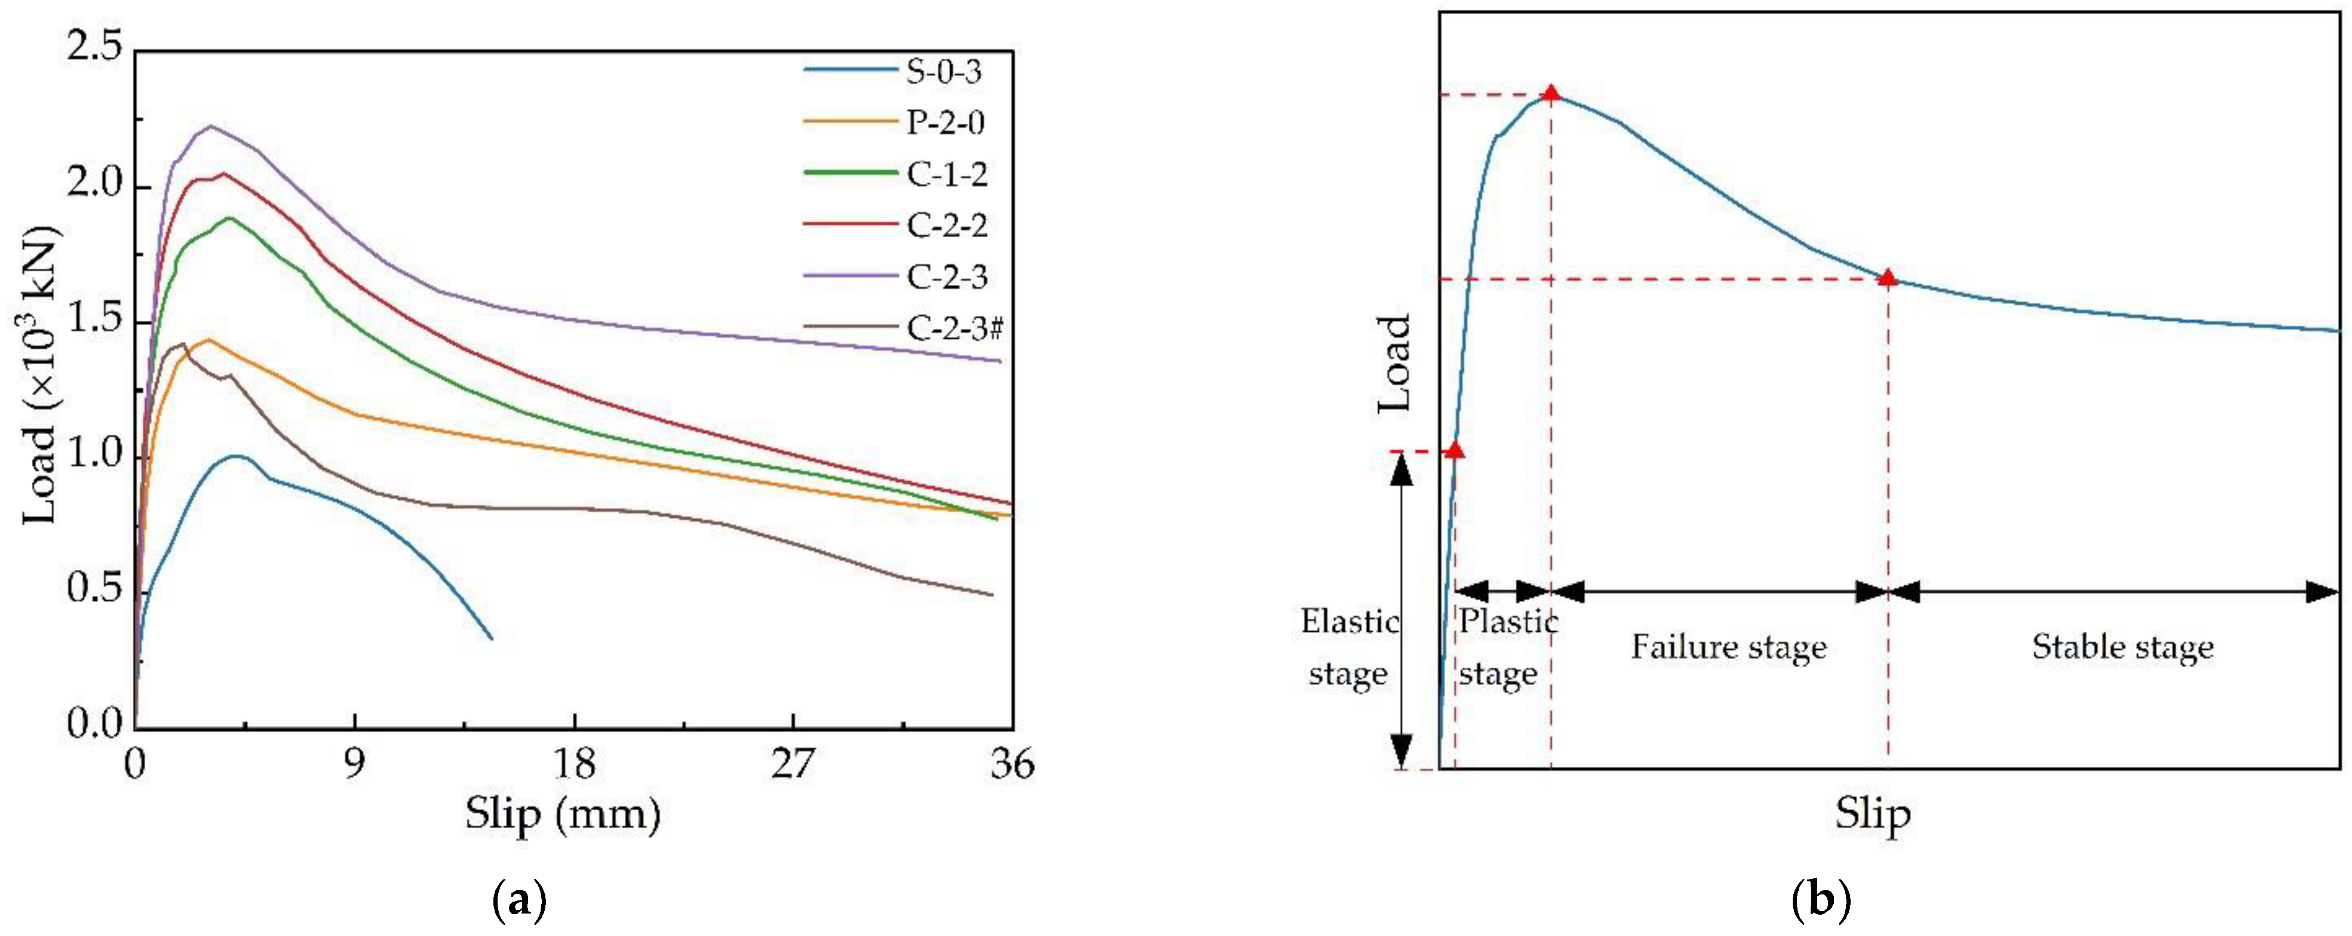
3.2. Load–Slip Curves

To reduce errors in the test, the relative slip is averaged from four LVDTs. The load–slip curves for the push-out tests are presented in Figure 9a. The load–slip curves of the composite connectors indicate that they experience four stages: “elastic”, “plastic”, “failure”, and “stable“, as Figure 9b shows. In the elastic stage, the slip of the interface is minor, and the concrete slab does not appear cracked. The overall shear stiffness of the specimen is large; the bearing capacity at this stage is borne by the welded studs, end-bearing concrete, concrete dowels and penetrating rebars. After the elastic stage, the slip of the interface between the H-beam and concrete slab grows faster, and the load–slip curves are nonlinear until the load increases to the shear resistance. As the loading continues, the curve drops rapidly, and damage occurs to the specimen. The structure enters the failure stage. At this point, the concrete dowels in the hole are crushed, the concrete at the bottom is spalled, and large deformations occur in the welded studs and penetrating rebars; the bearing capacity of the specimens degrades and decreases rapidly. However, the load does not decrease to 0 but remains high, as the penetrating rebars in the perforated holes continue to provide the shear resistance. The structure enters the stable stage. This suggests that even if the structure is damaged, it still has a certain shear resistance and can ensure structural safety. In addition, comparing the load–slip curves of the three different connectors shows that the curves of the PBL connector and the composite connector have a similar trend, and both have an obvious four-stage characteristic. The curves for the welded stud connectors do not have a stable stage. This is because the structure cannot continue to bear the load after the welded studs are cut off.

3.3. Result Analysis

In order to better investigate the influence of each parameter on the shear behaviour of composite shear connectors, the three aspects of shear resistance, shear stiffness, and ductility are analyzed. The shear resistance represents the maximum load at which the connector can resist the slip between the H-beam and the concrete slab. In this paper, the ductility of composite connectors is evaluated using the ductility evaluation method proposed by Kim [3,33,38,39,40,41]. Among them, the slip capacity δu and the characteristic load value Prk of the connectors proposed by Eurocode-4 are adopted. Prk is 90% of the shear resistance Pmax. δ90 and δu denote the slip values corresponding to Prk, respectively, as shown in Figure 10. The ductility of the specimen is described by the ratio of the slip value δu in the descending section to the slip value δ90 in the ascending section. Mechanical properties of shear connectors are listed in Table 3. K in the table indicates that a slip of 0.2 mm is the corresponding secant stiffness.

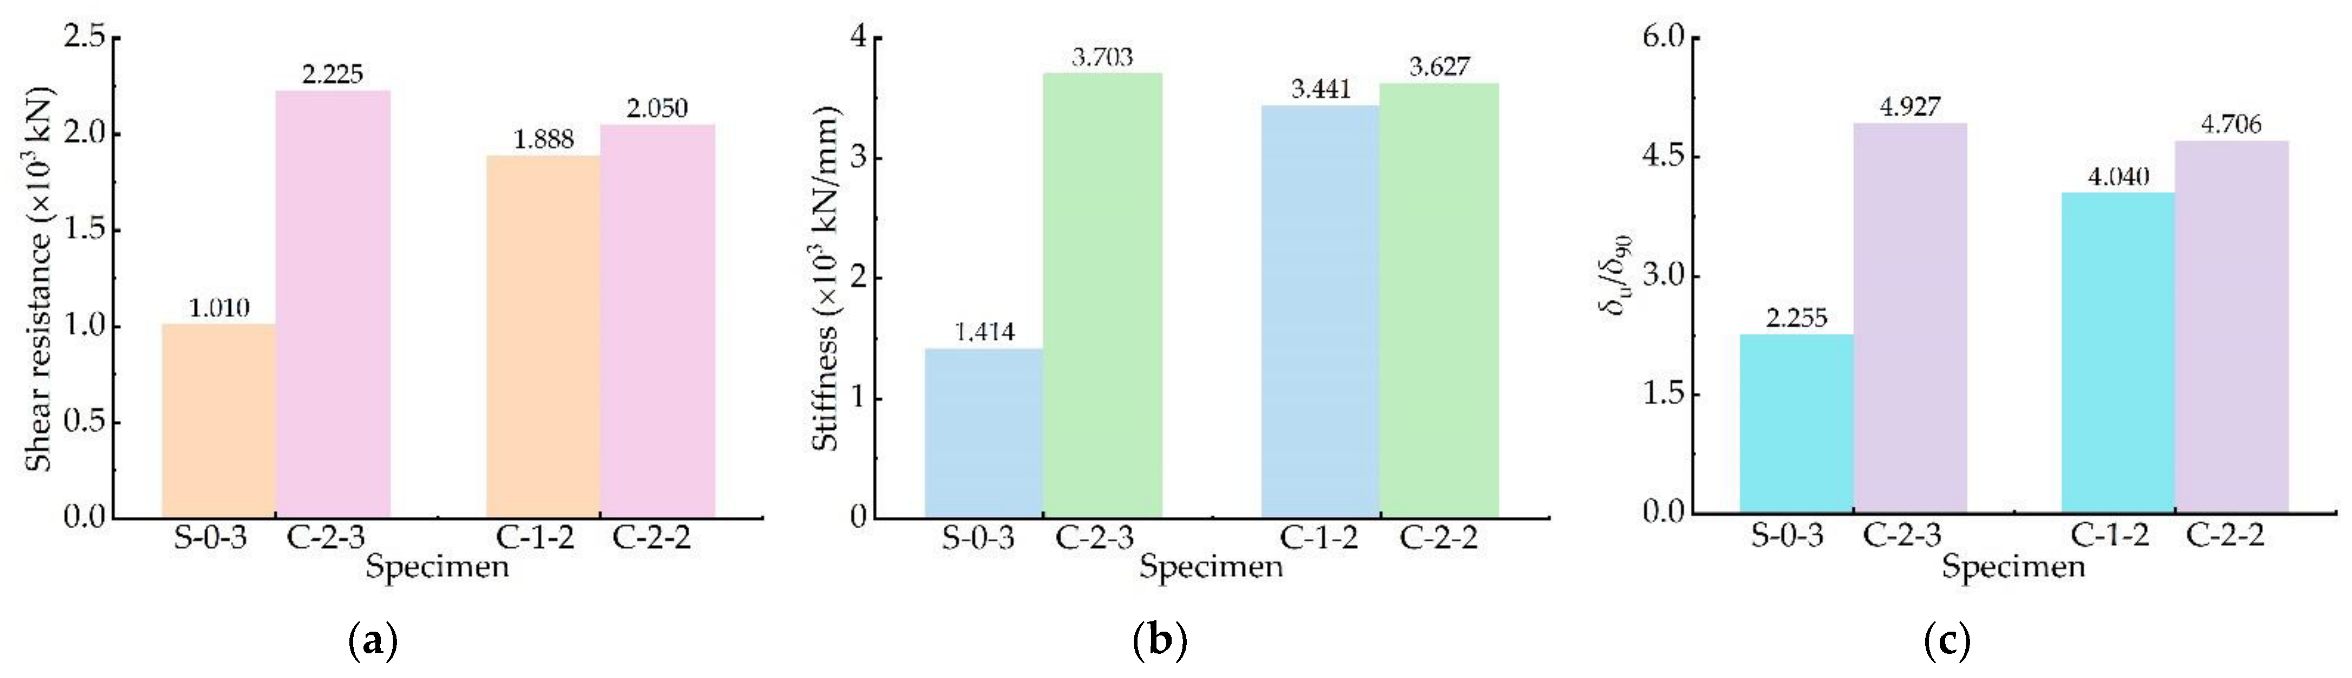
3.3.1. Influence of Welded Stud Number

The influence of welded stud number on the shear behaviour of the connectors is shown in Figure 11. Compared with specimen P-2-0, the shear resistance of specimen C-2-2 was increased by 42.50%. When the number of welded studs was increased from 4 to 6, the shear resistance of the composite connector was increased by another 8.57%. Welding studs can increase the strength of the local concrete, thus improving the shear resistance of the specimen. In addition, the increase in the number of welded studs is beneficial to share the load of penetrating rebars, further enhancing the shear performance of the structure. This indicates that welding studs in the PBL connectors can effectively improve the shear resistance. The composite connectors have higher stiffness than the PBL connectors. Increasing the number of welded studs can also improve the shear stiffness of the composite connectors. In addition, δu/δ90 gradually increases as the number of welded studs increases. This means that the ductility of the structure gradually increases. In summary, it can be seen that composite connectors have better shear behaviour than PBL connectors and that increasing the number of welded studs is beneficial to the structural performance.

3.3.2. Influence of Perforated Hole Number

The shear behaviour of welded stud connectors and composite connectors with the different perforated holes is shown in Figure 12. The shear resistance and stiffness of composite connector C-2-3 increase by 120.29% and 161.88%, respectively, compared to the welded stud connector. This is because the number of concrete dowels and penetrating rebars increases as the number of perforated holes increases. The penetrating rebars can provide shear resistance through tensile deformation. Therefore, the increase in penetrating rebars can effectively increase the shear resistance of the specimen. In addition, the increased area of the concrete dowels results in a more uniform distribution of shear force, increasing the shear stiffness of the composite connectors. Comparing specimens S-0-3 and C-2-3, and specimens C-1-2 and C-2-2, it can be found that δu/δ90 increases by 119.11% and 16.58%, respectively, indicating that the ductility of the composite connectors can be significantly enhanced with an increase in the number of perforated holes.

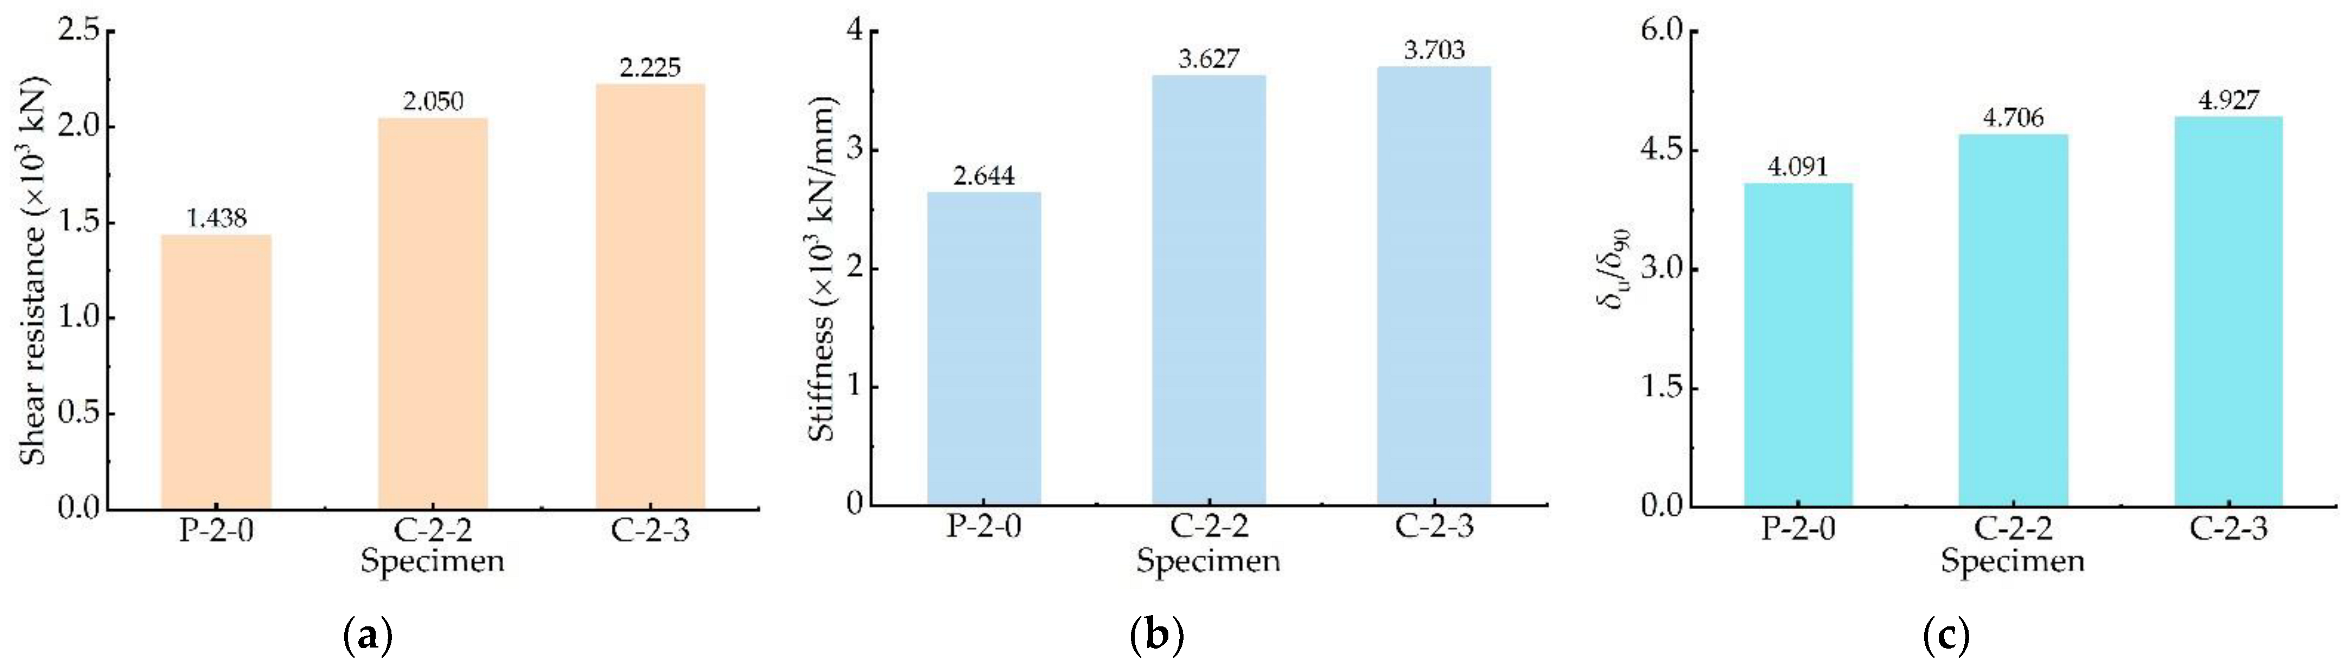
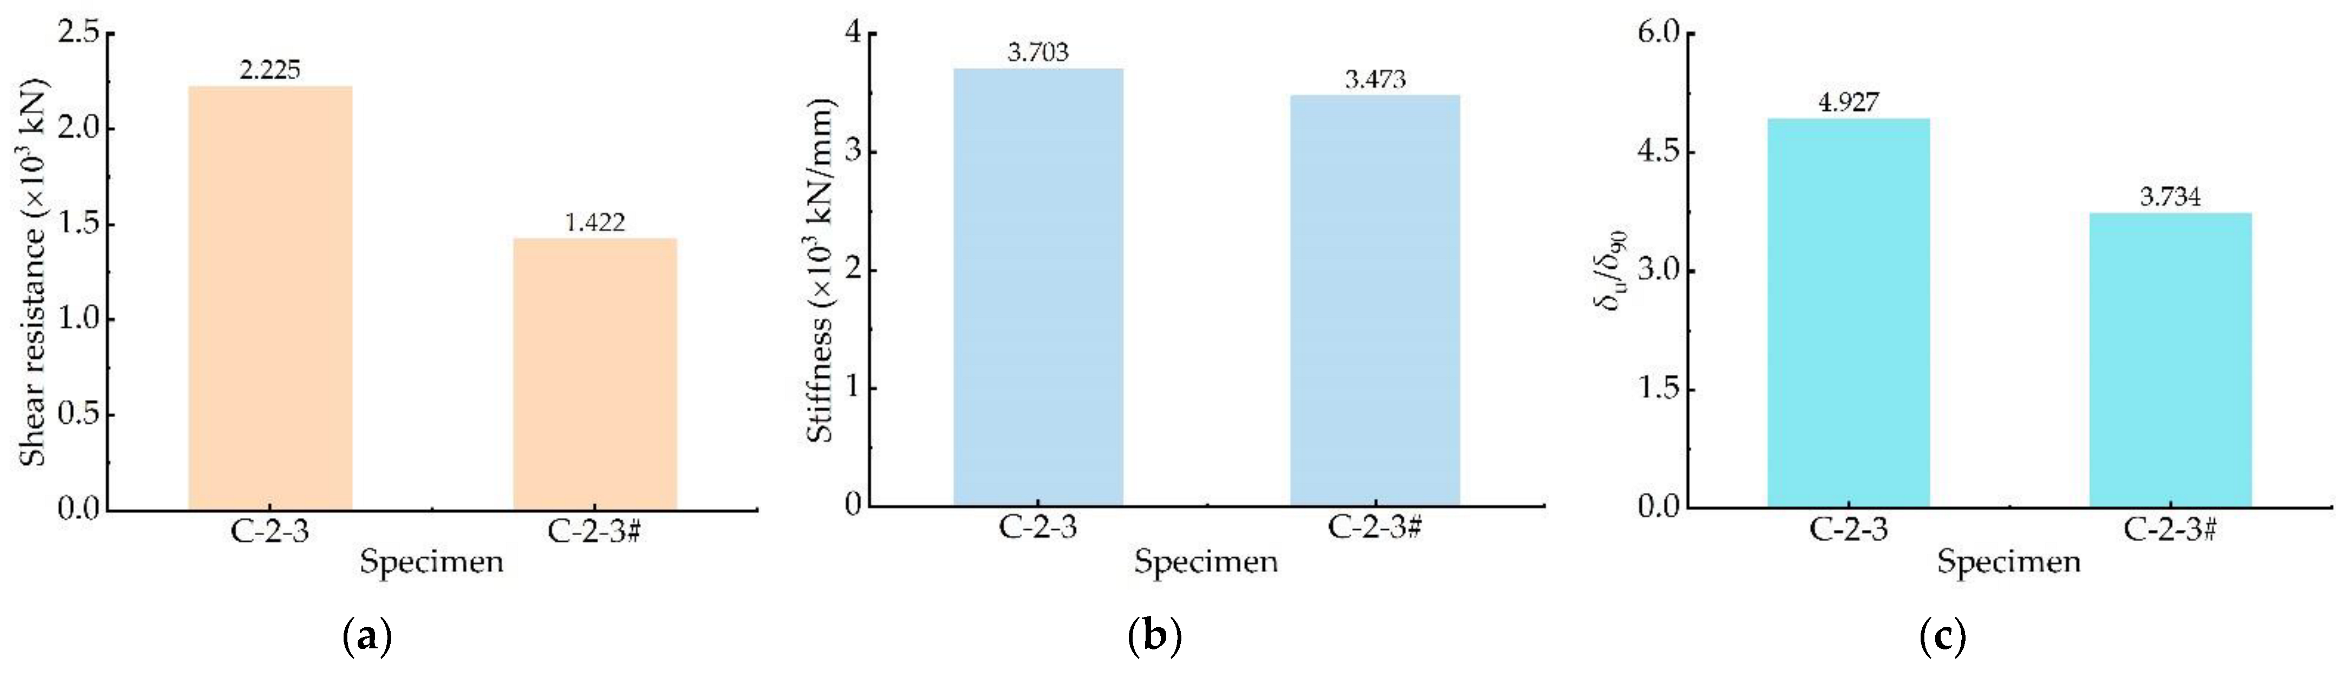
3.3.3. Influence of End-Bearing Mode

The influence of end-bearing mode on the shear behaviour of composite connectors is demonstrated in Figure 13. The shear resistance and stiffness of specimen C-2-3 are 2225.26 kN and 3702.63 kN/mm, an increase of 56% and 10%, respectively, compared with specimen C-2-3#. This indicates that the end-bearing concrete can improve shear resistance and stiffness. The specimen without end-bearing concrete does not have the compressive effect of the concrete at the bottom. The shear resistance is mainly provided by the concrete dowels and penetrating rebars. When the load reaches the shear resistance, the welded studs and penetrating rebars yield, and shear failure occurs to the concrete in the perforated holes. In addition, the δu of specimen C-2-3# is less than the 6 mm required in Eurocode-4, which shows brittle failure. There is stress concentration at the end slots of the specimen C-2-3# concrete slab, which leads to brittle failure of the concrete at the slots and reduces the shear stiffness and ductility. It suggests that the discontinuous arrangement of the connectors has better shear performance than the continuous arrangement.

4. Numerical Analysis

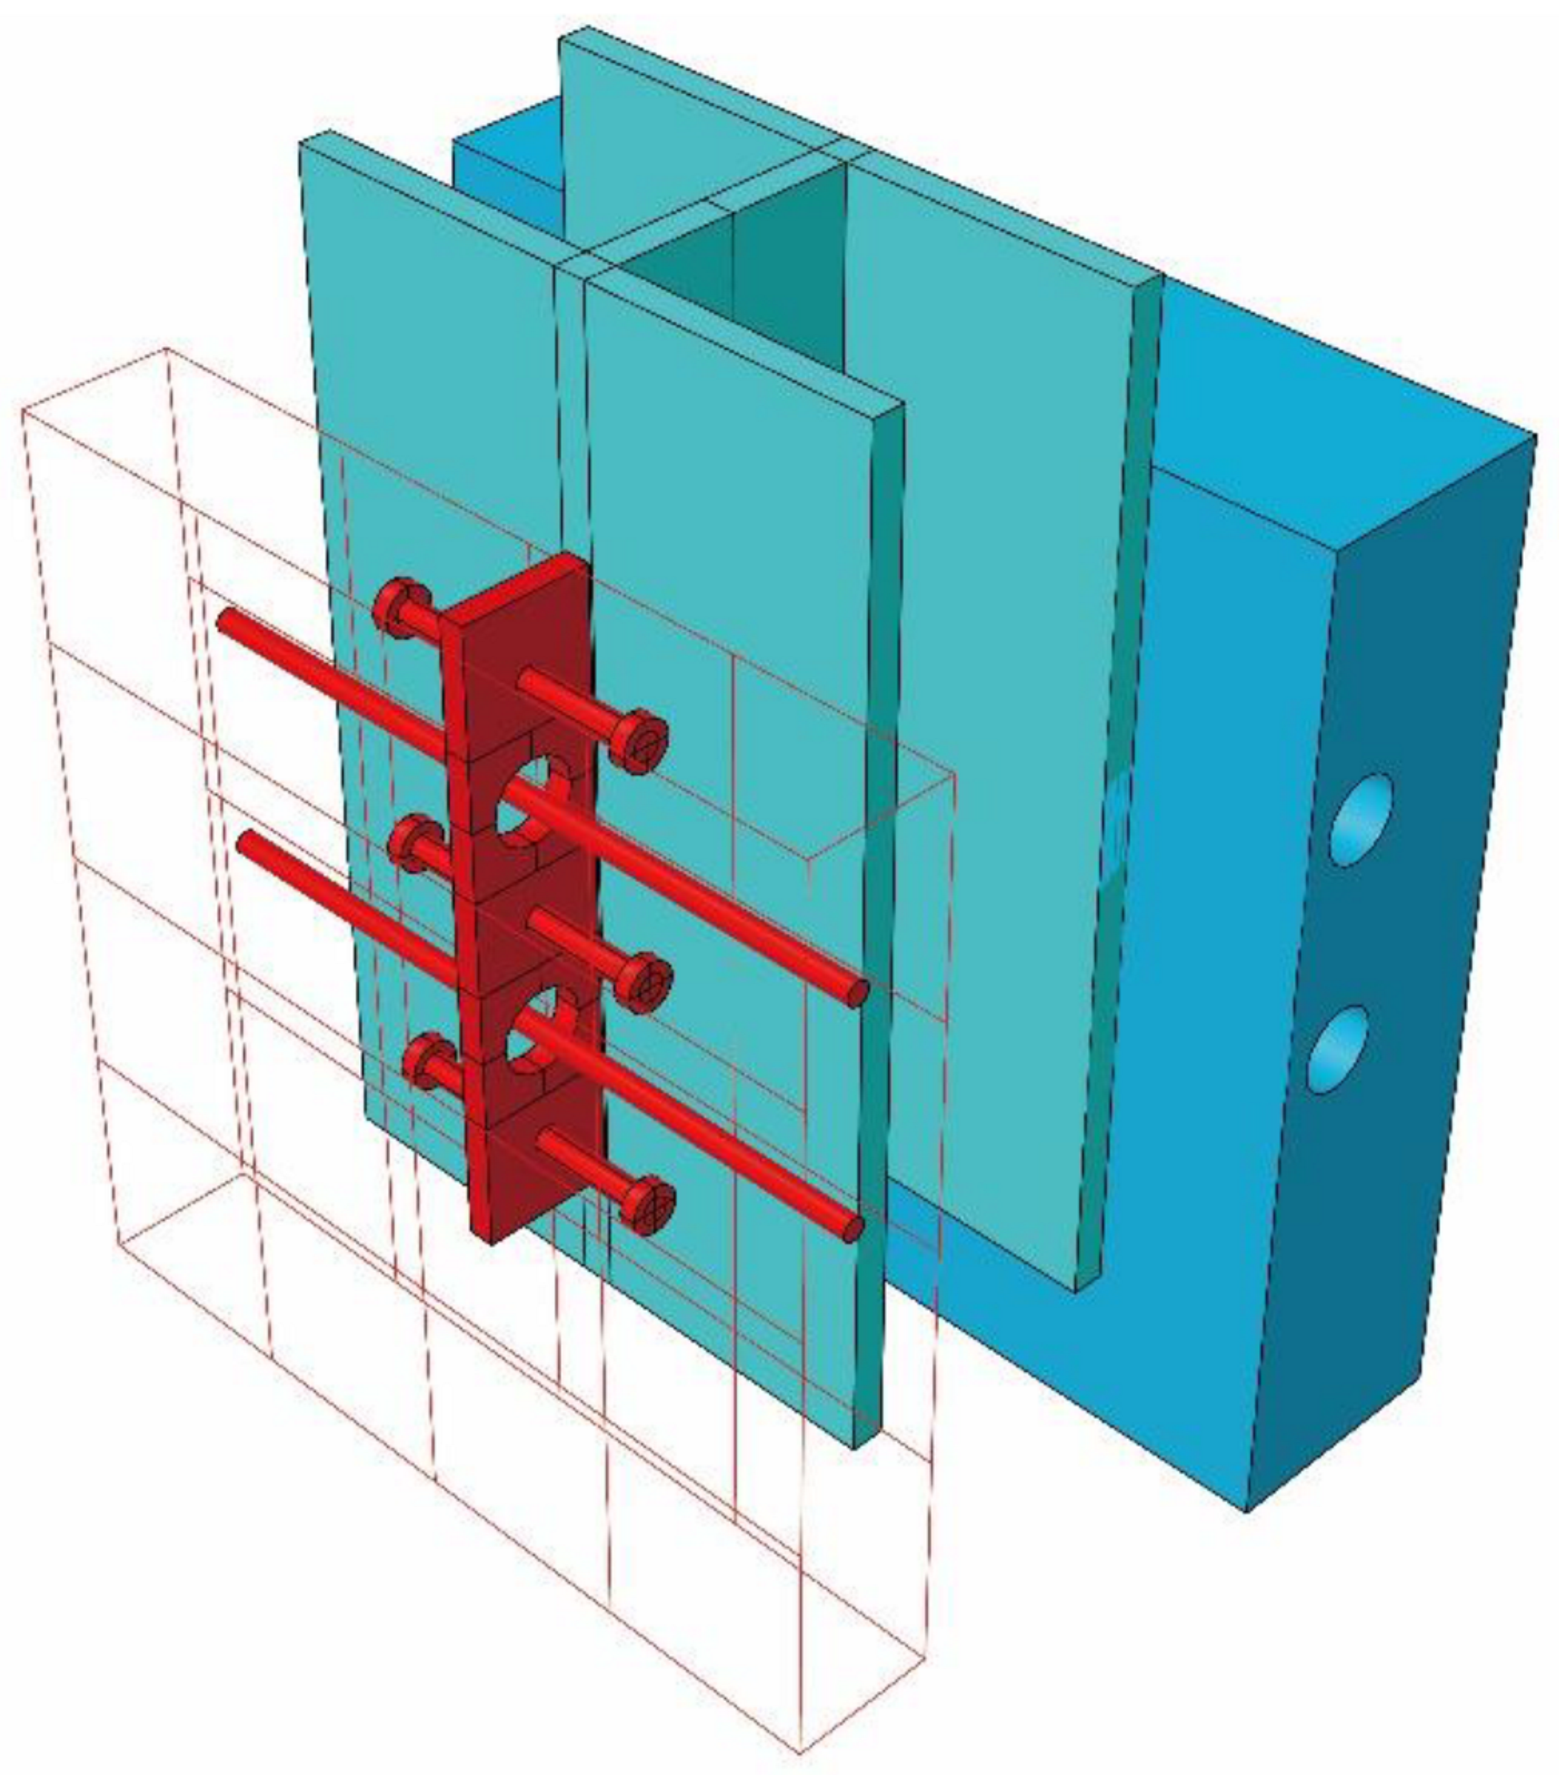
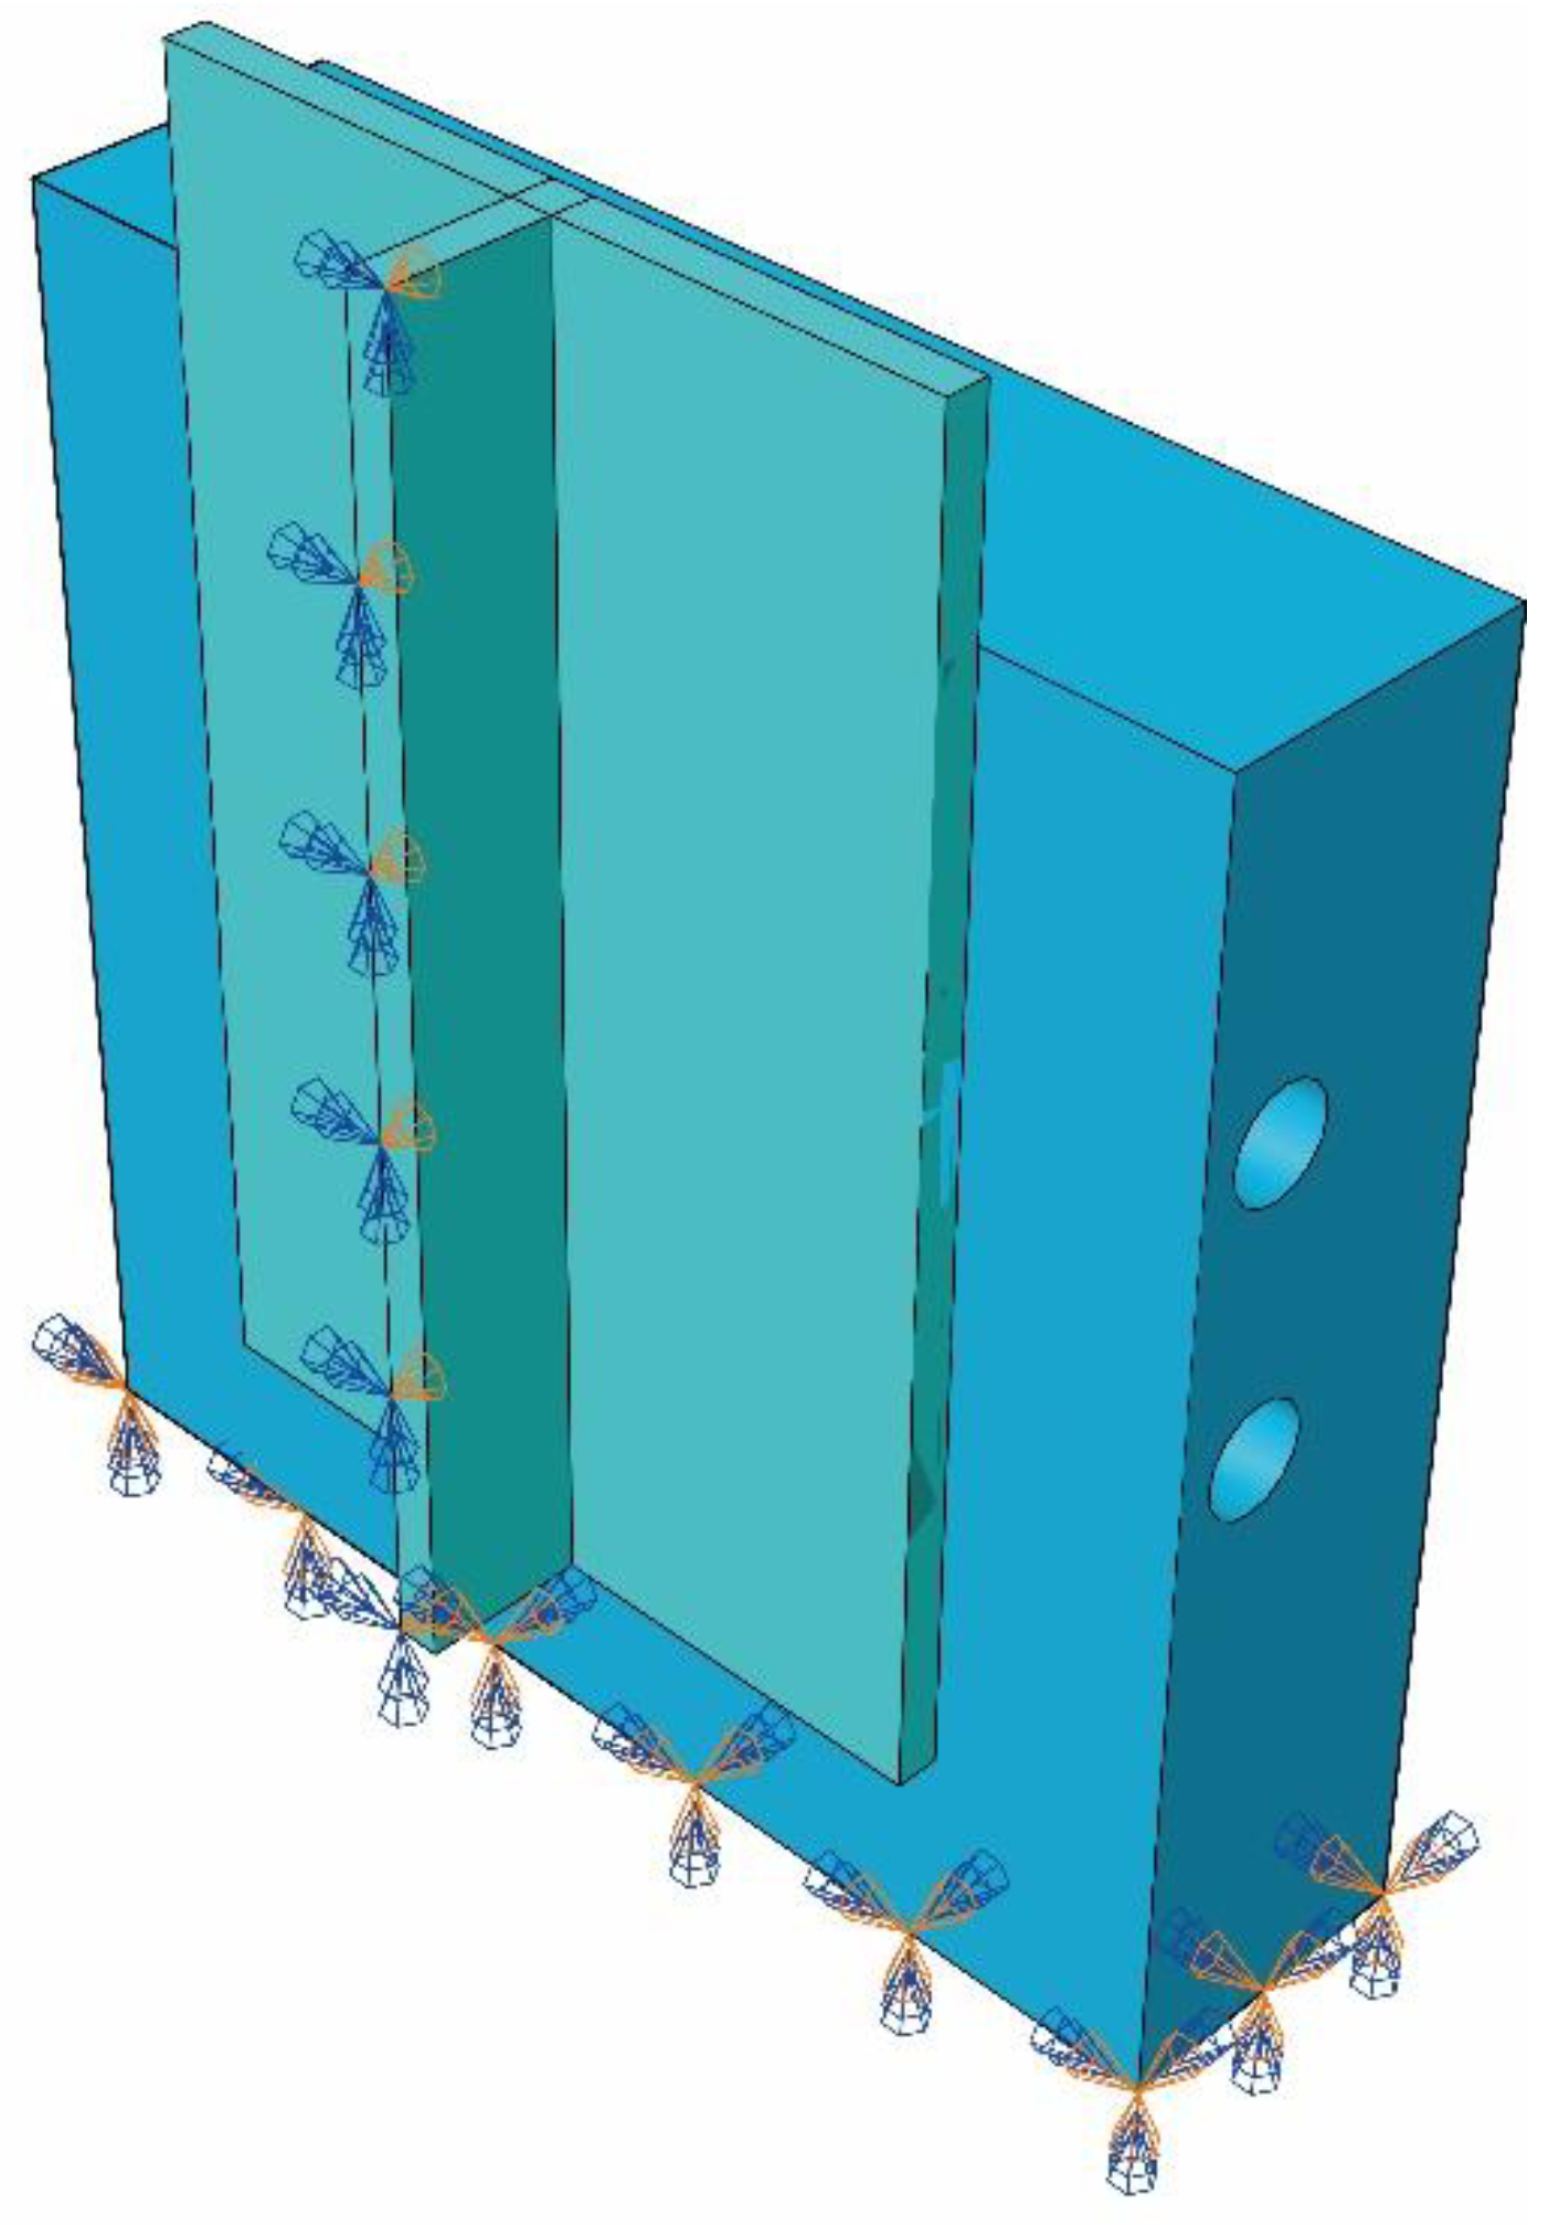
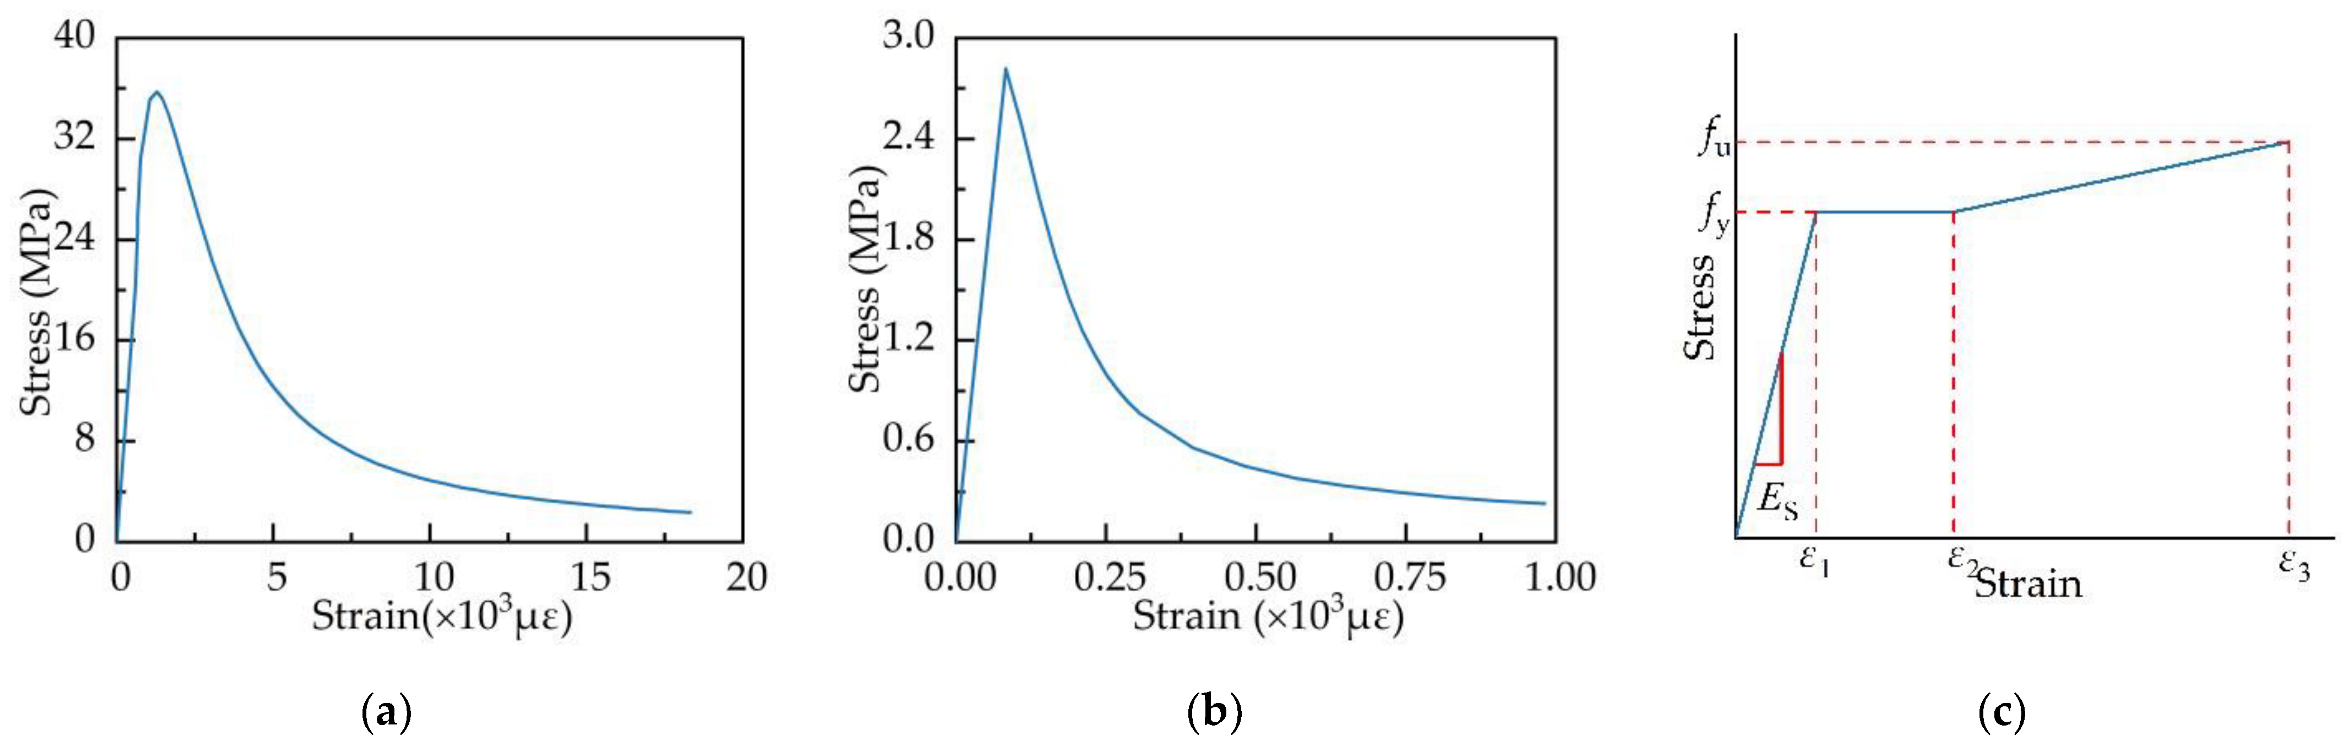
4.1. Finite Element Models

The push-out tests were simulated using ABAQUS nonlinear finite element software, as shown in Figure 14. Different elements were attributed to each component due to the different materials used, the different stress state, and the relatively complex contact relationships between the components. Concrete slabs, H-beams, perforated steel plates, penetrating rebars, and welded studs were simulated using C3D8R solid elements, and structural rebars were simulated using T3D2 truss elements. The mesh sizes for the composite connections were 2 mm, 4 mm, 4 mm and 5 mm for the welded studs, perforated steel plates, penetrating rebars and concrete dowels, respectively. Meanwhile, to improve the calculation efficiency, the mesh of noncritical components such as concrete slab, H-beam, and structural rebars was divided into large size elements, and the mesh size was 10 mm.
To accurately simulate the stress state of the composite connectors, the contact nonlinearity, geometric nonlinearity, and material nonlinearity were taken into account. The model mainly used hard and tie contact to set up the contact relationship, as shown in Table 4 and Figure 15. Fixed end constraints were set at the bottom of the concrete slab to simulate the actual constraints better, as shown in Figure 16. The 1/2 models were established to simulate the push-out tests of the composite connectors. The loading method of finite element model in this paper adopts displacement loading; the displacement loading value is 40 mm, and the loading amplitude is preset to 1 mm.
The material properties of concrete were modelled using the plastic damage model, and the stress–strain relationship can be referred to GB 50010-2010 [42], as shown in Figure 17a,b. In ABAQUS, it is also necessary to define the concrete plasticity parameters in addition to defining the stress–strain relationship for concrete. The expansion angle is 35°, the eccentricity is 0.1, and the ratio of initial biaxial compressive yield stress to initial uniaxial compressive yield stress is taken as 1.16. In addition, the ratio of the second stress invariant on the tensile meridian to that on the compressive meridian is taken as 0.6667, and the viscosity coefficient is 0.0005. H-beams, structural rebars, perforated steel plates, welded studs, and penetrating rebars were all modelled using the constitutive model according to Figure 17c and Table 5, assuming the same stress–strain relationship between the material in tension and compression. The mechanical properties of the various materials are measured through material properties tests.

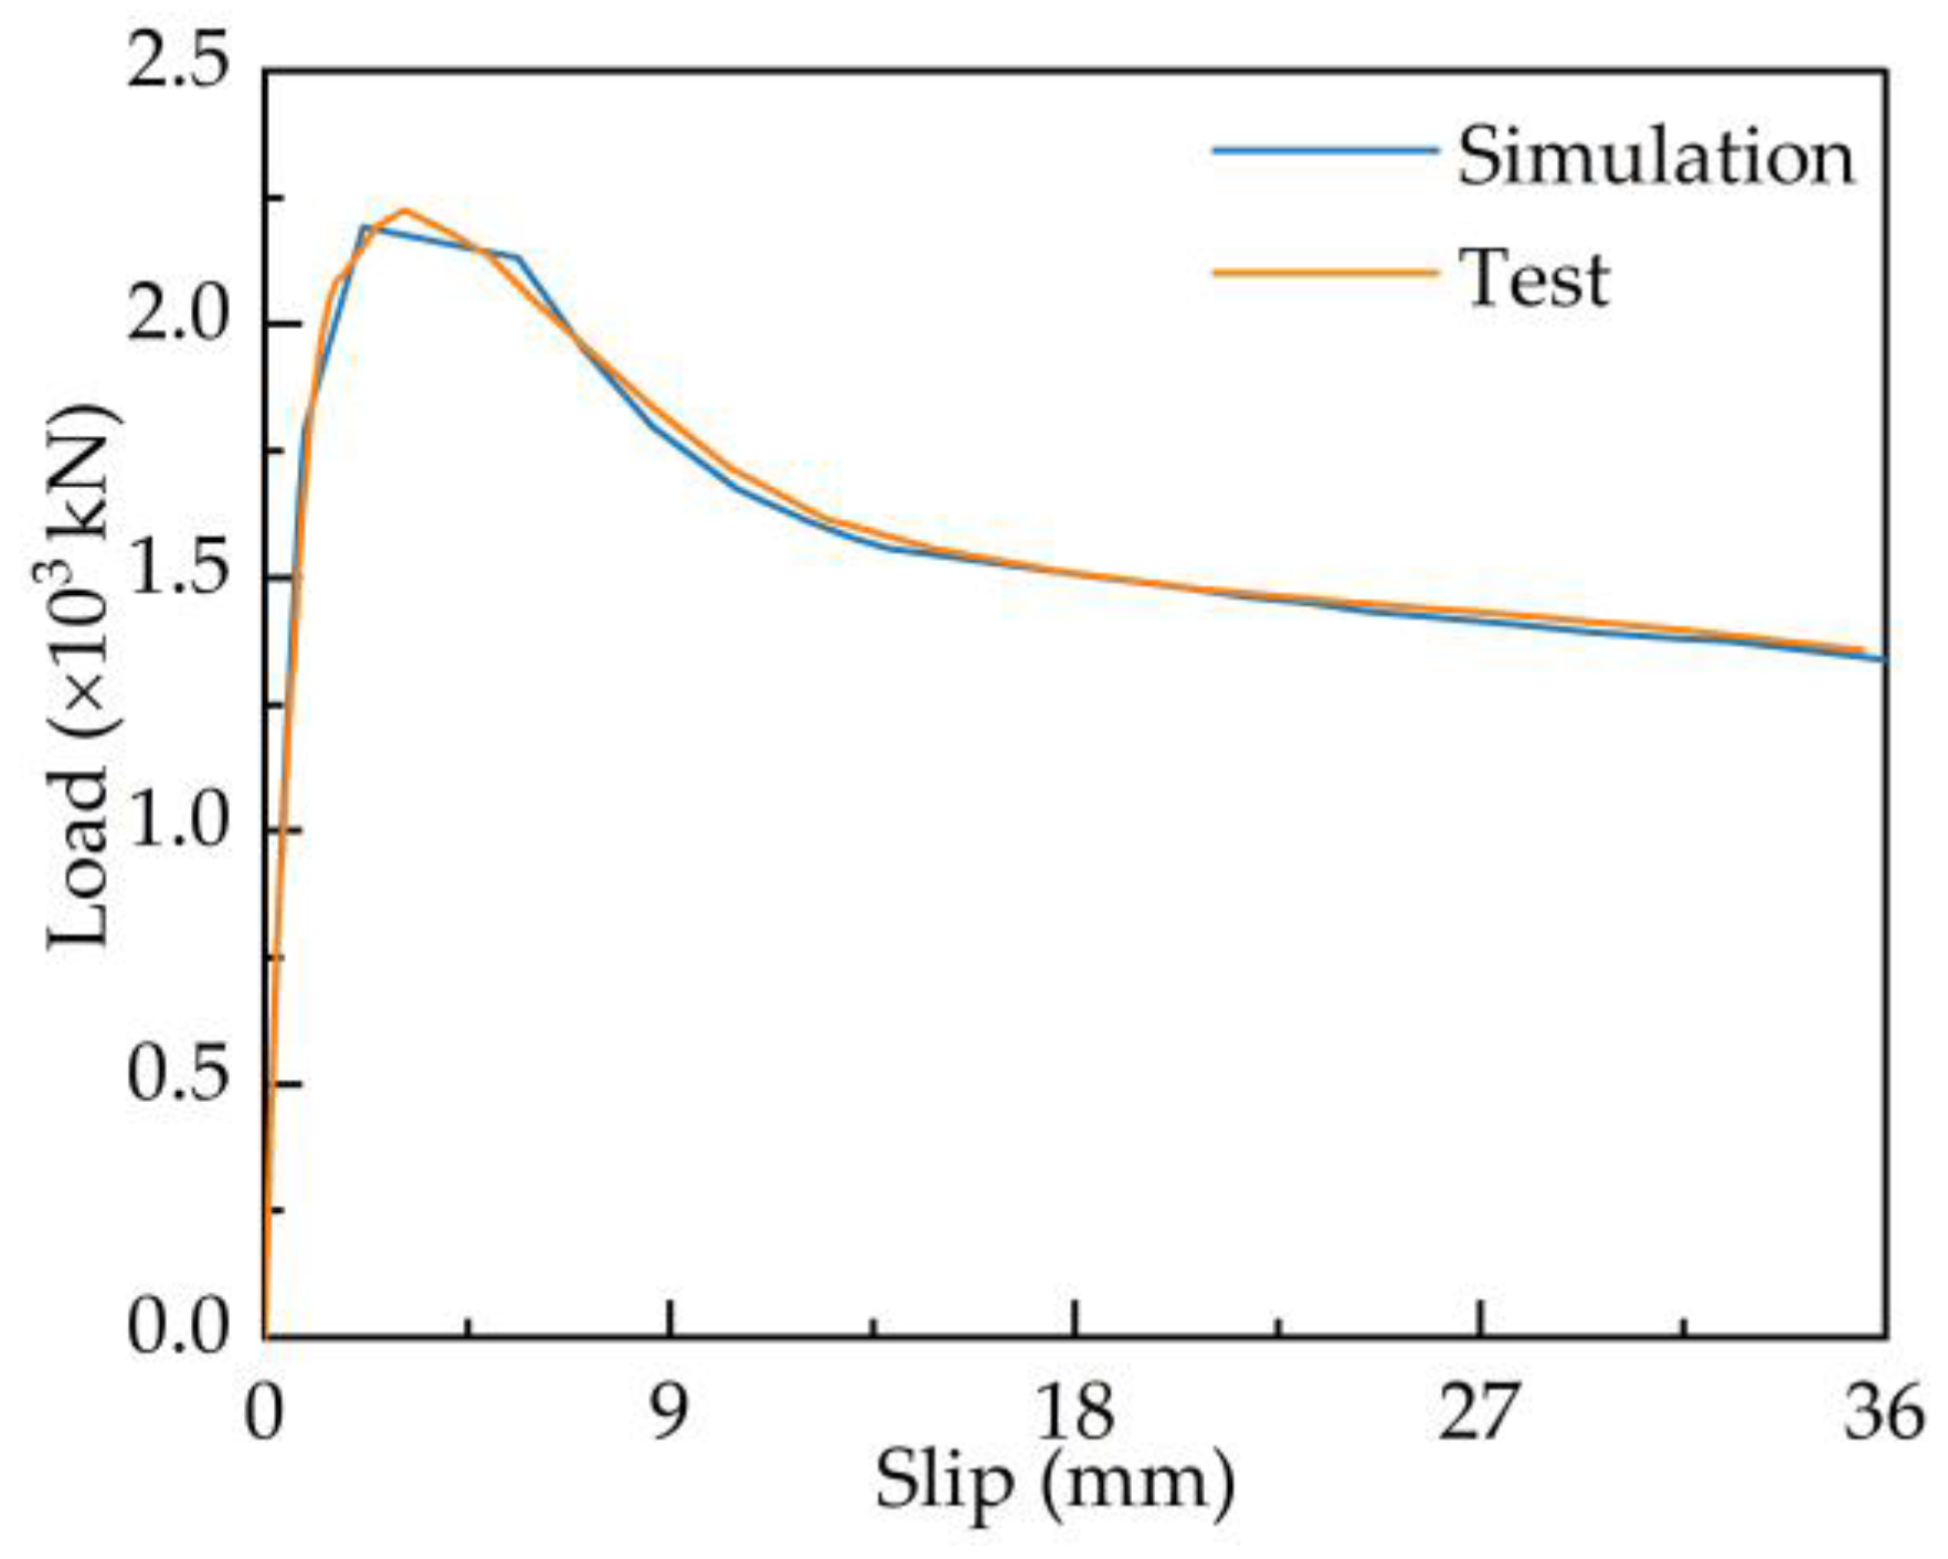
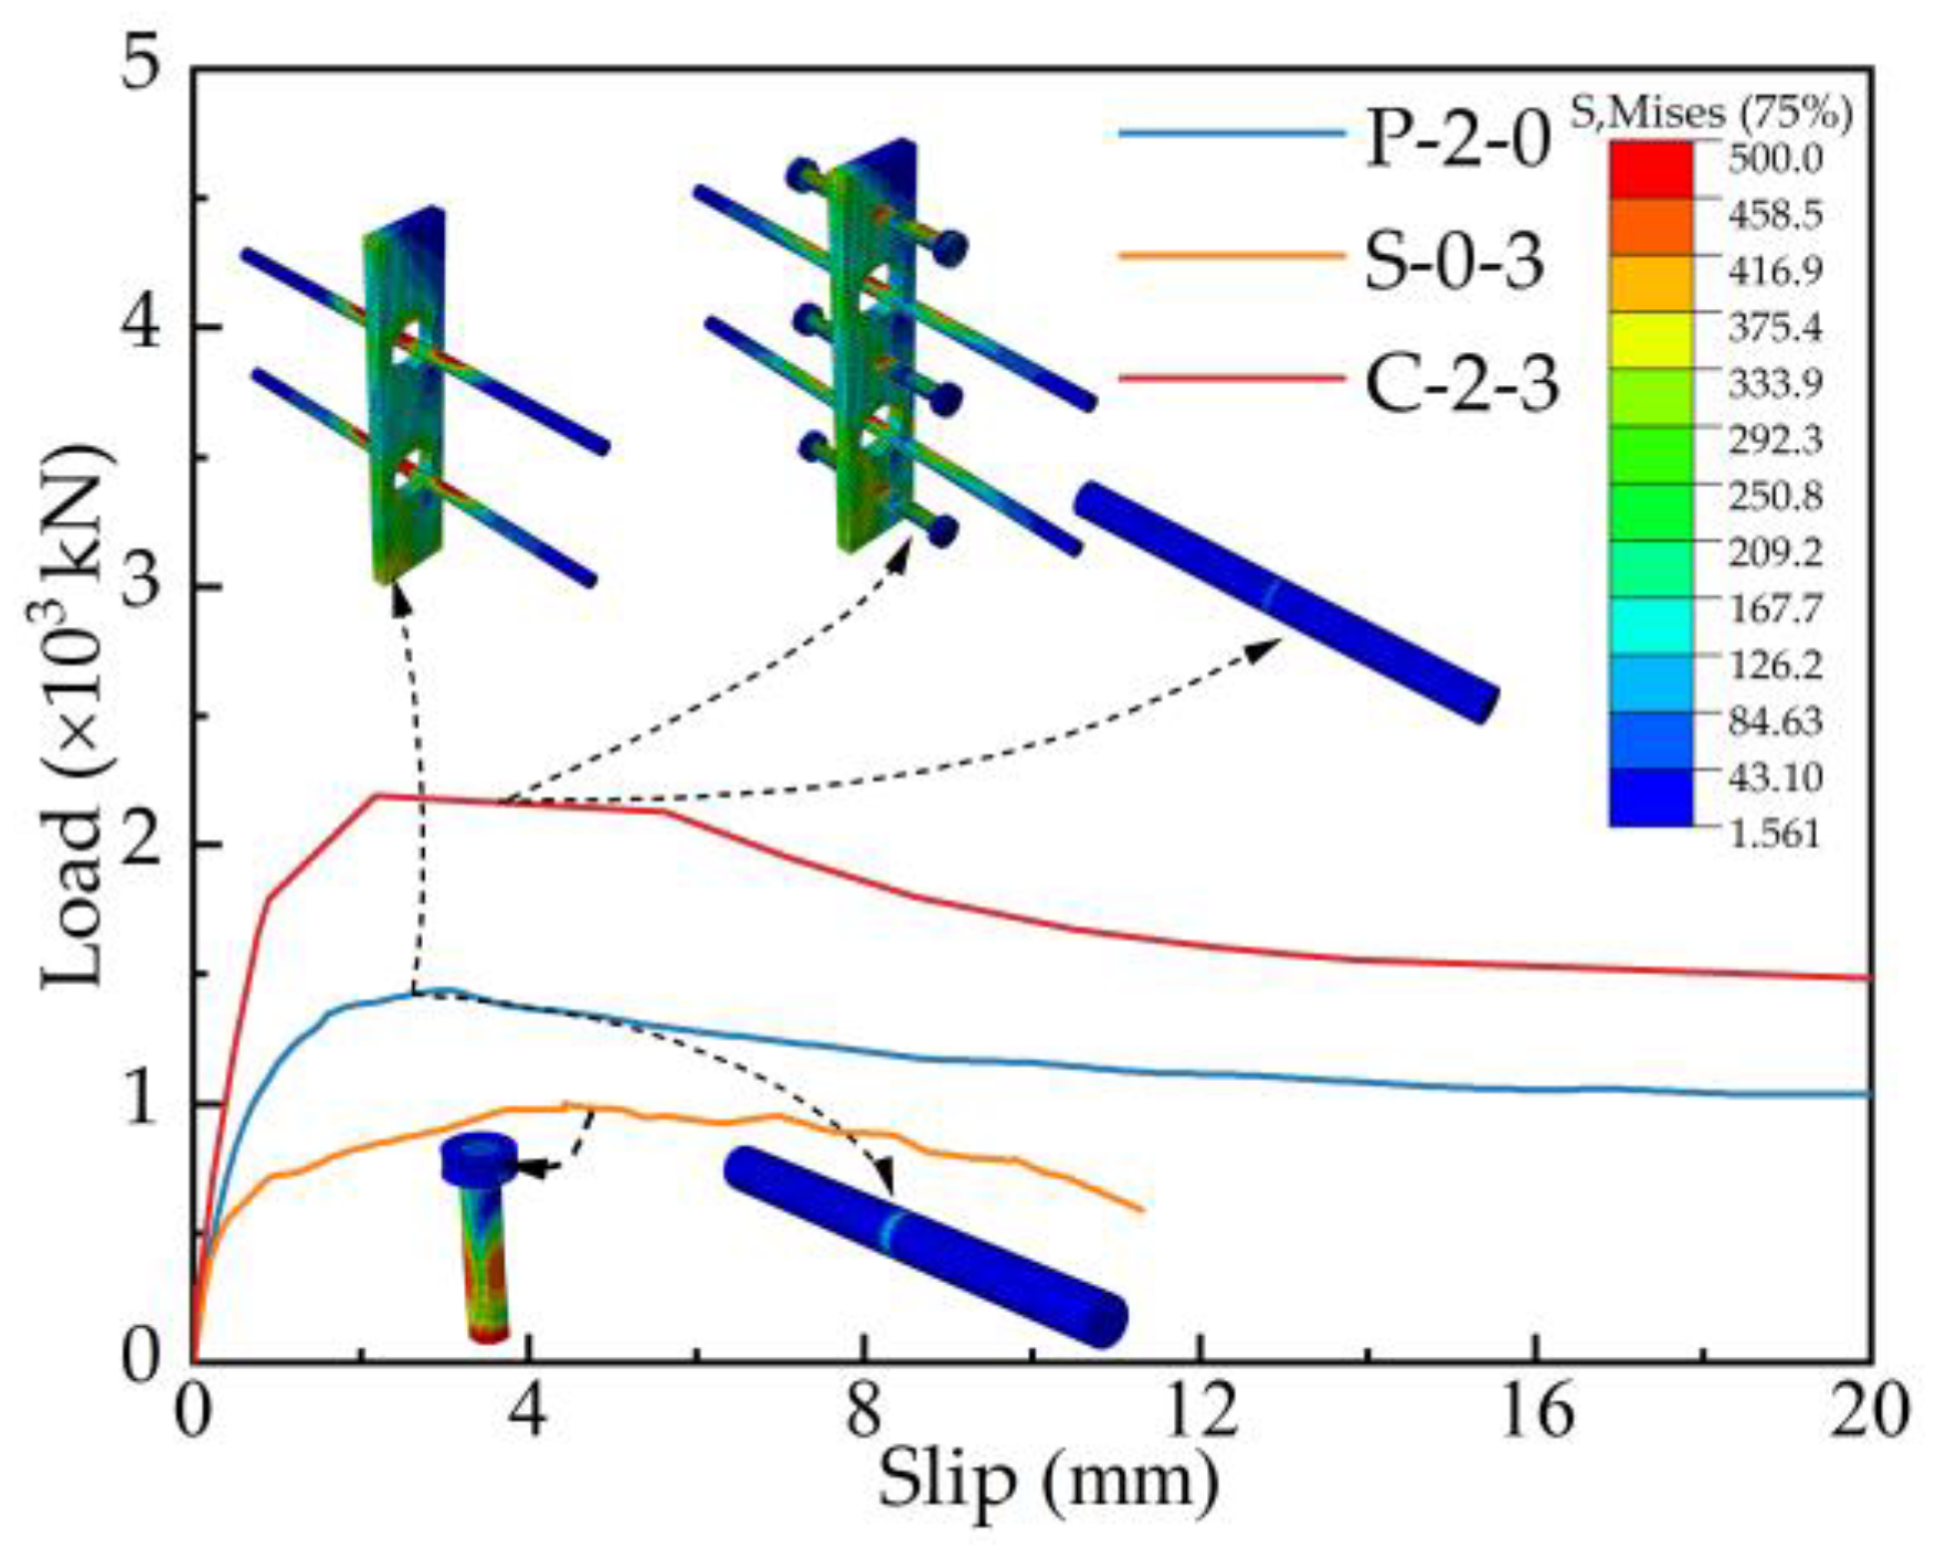
4.2. Model Validation

The accuracy of the finite element model needs to be validated further to investigate the stress state of the composite connectors. The finite element model was analysed and verified regarding the shear resistance, stress state, and load–slip curves. The simulated shear resistance was compared with the tested one, as shown in Table 6. The average accuracy is 97.22%, and the worst accuracy is 95.36%, within the reasonable range. In addition, the load–slip curves of the specimens were extracted for comparative analysis and illustrated with C-2-3 as an example, as illustrated in Figure 18. The simulated load–slip curves are consistent with the overall trend of the test, and they all experience the four stages of elastic, plastic, failure, and stable stages. Figure 19 shows the failure modes of three shear connectors, which are consistent with the tested ones. In conclusion, the finite element analysis has a high reliability.

4.3. Parametric Analysis

Based on the validated finite element model, the parametric investigation was conducted to analyse the effect of the concrete strength, welded stud diameter, and penetrating rebars’ diameter on the shear behaviour of the composite connectors. The C-2-3 specimen was used for the parametric investigation due to its better mechanical properties.

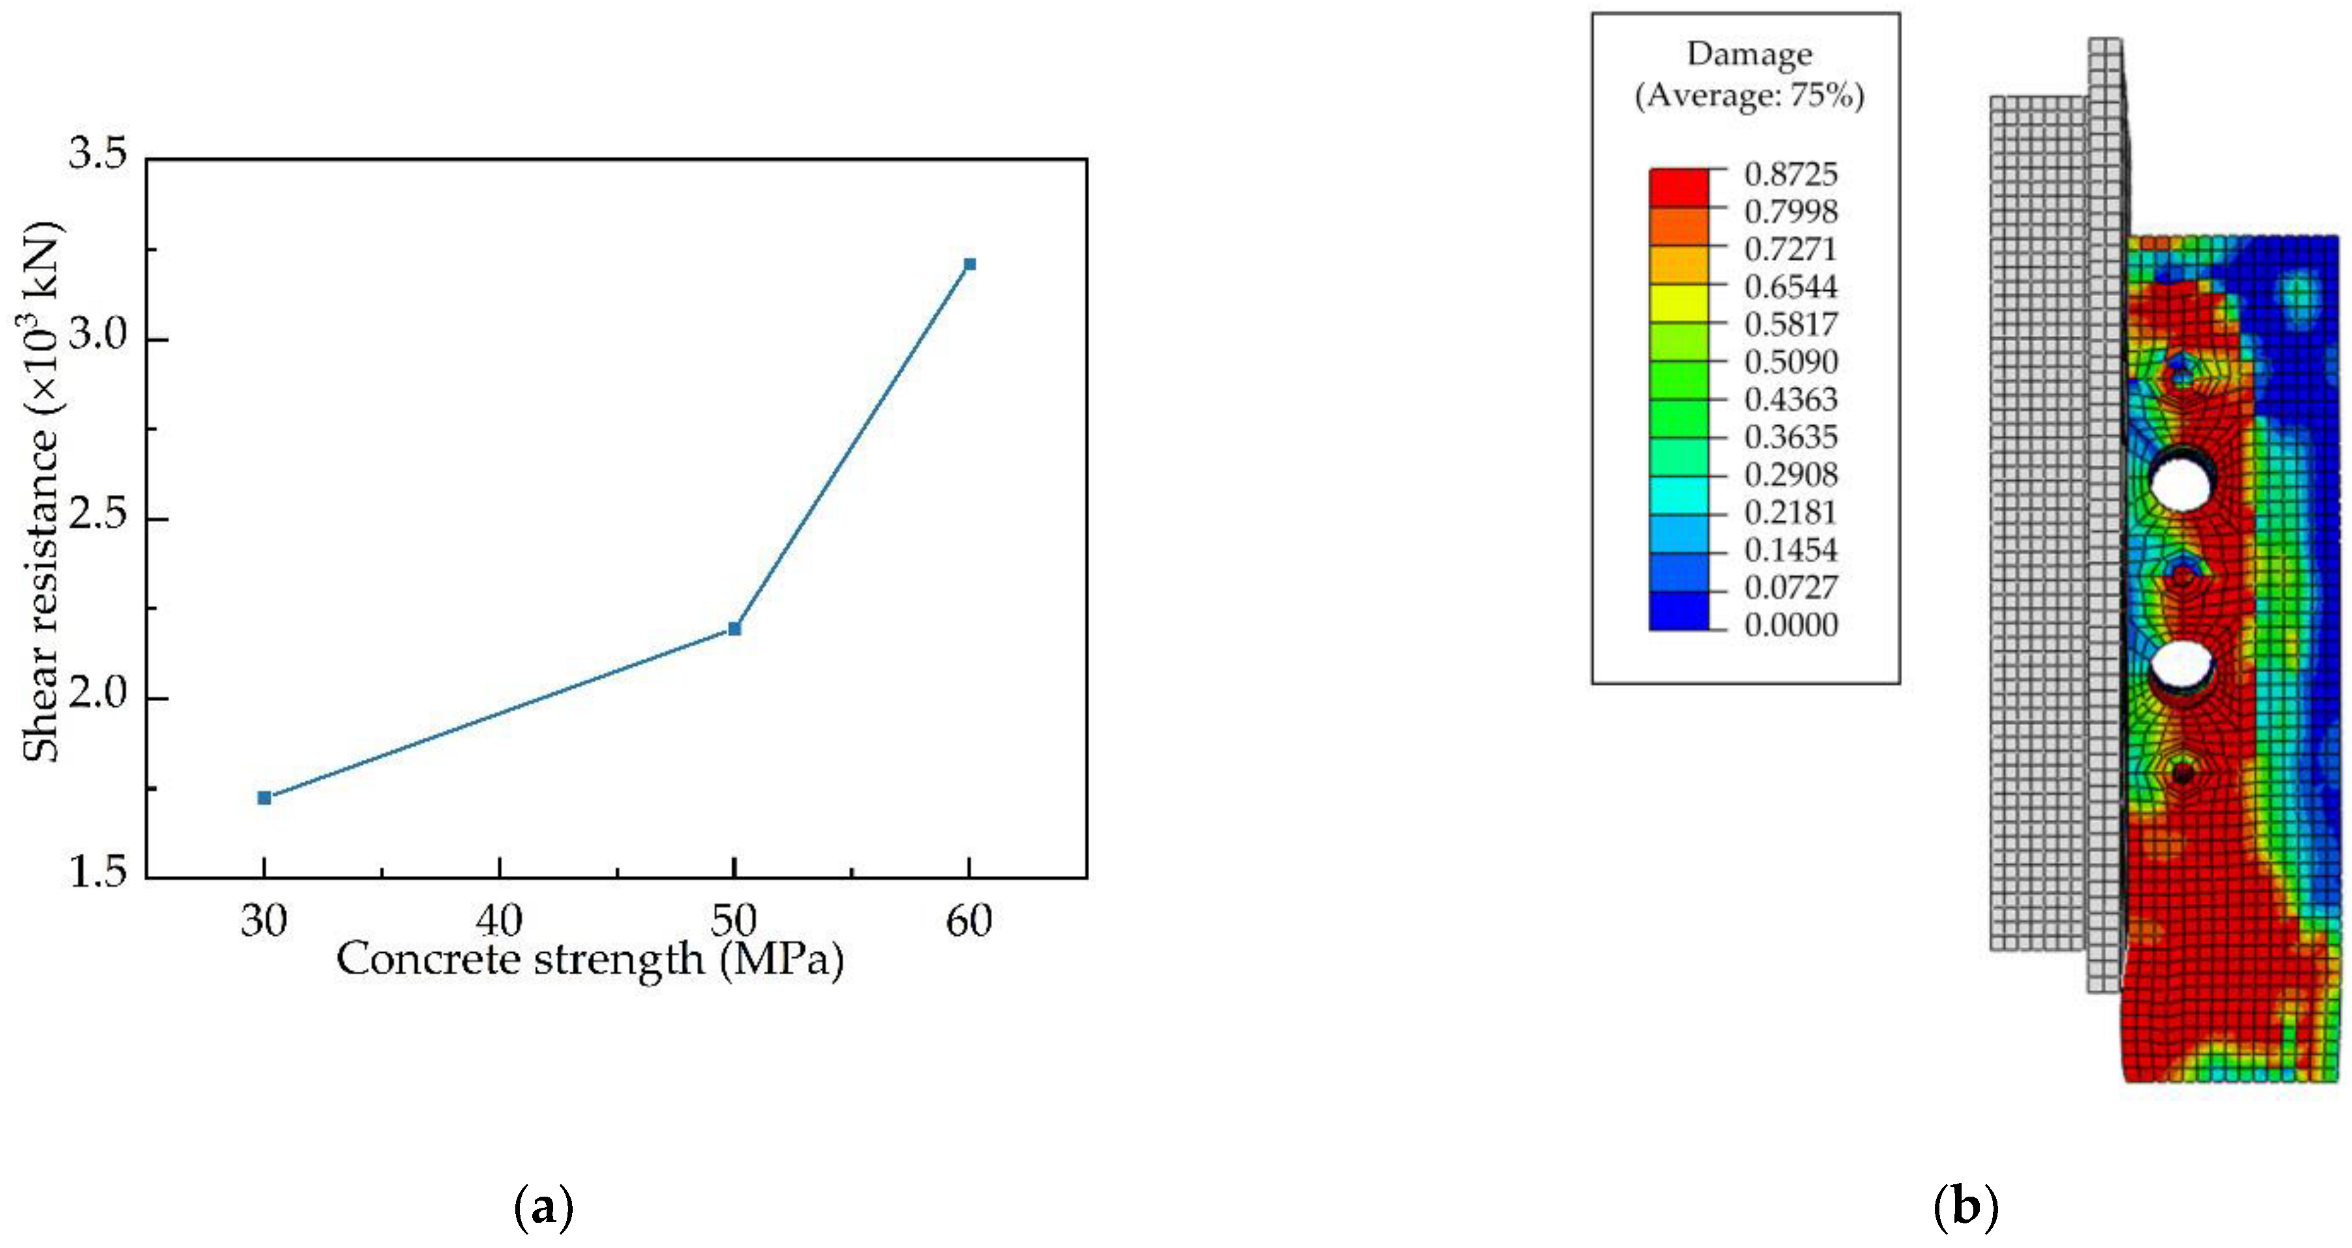
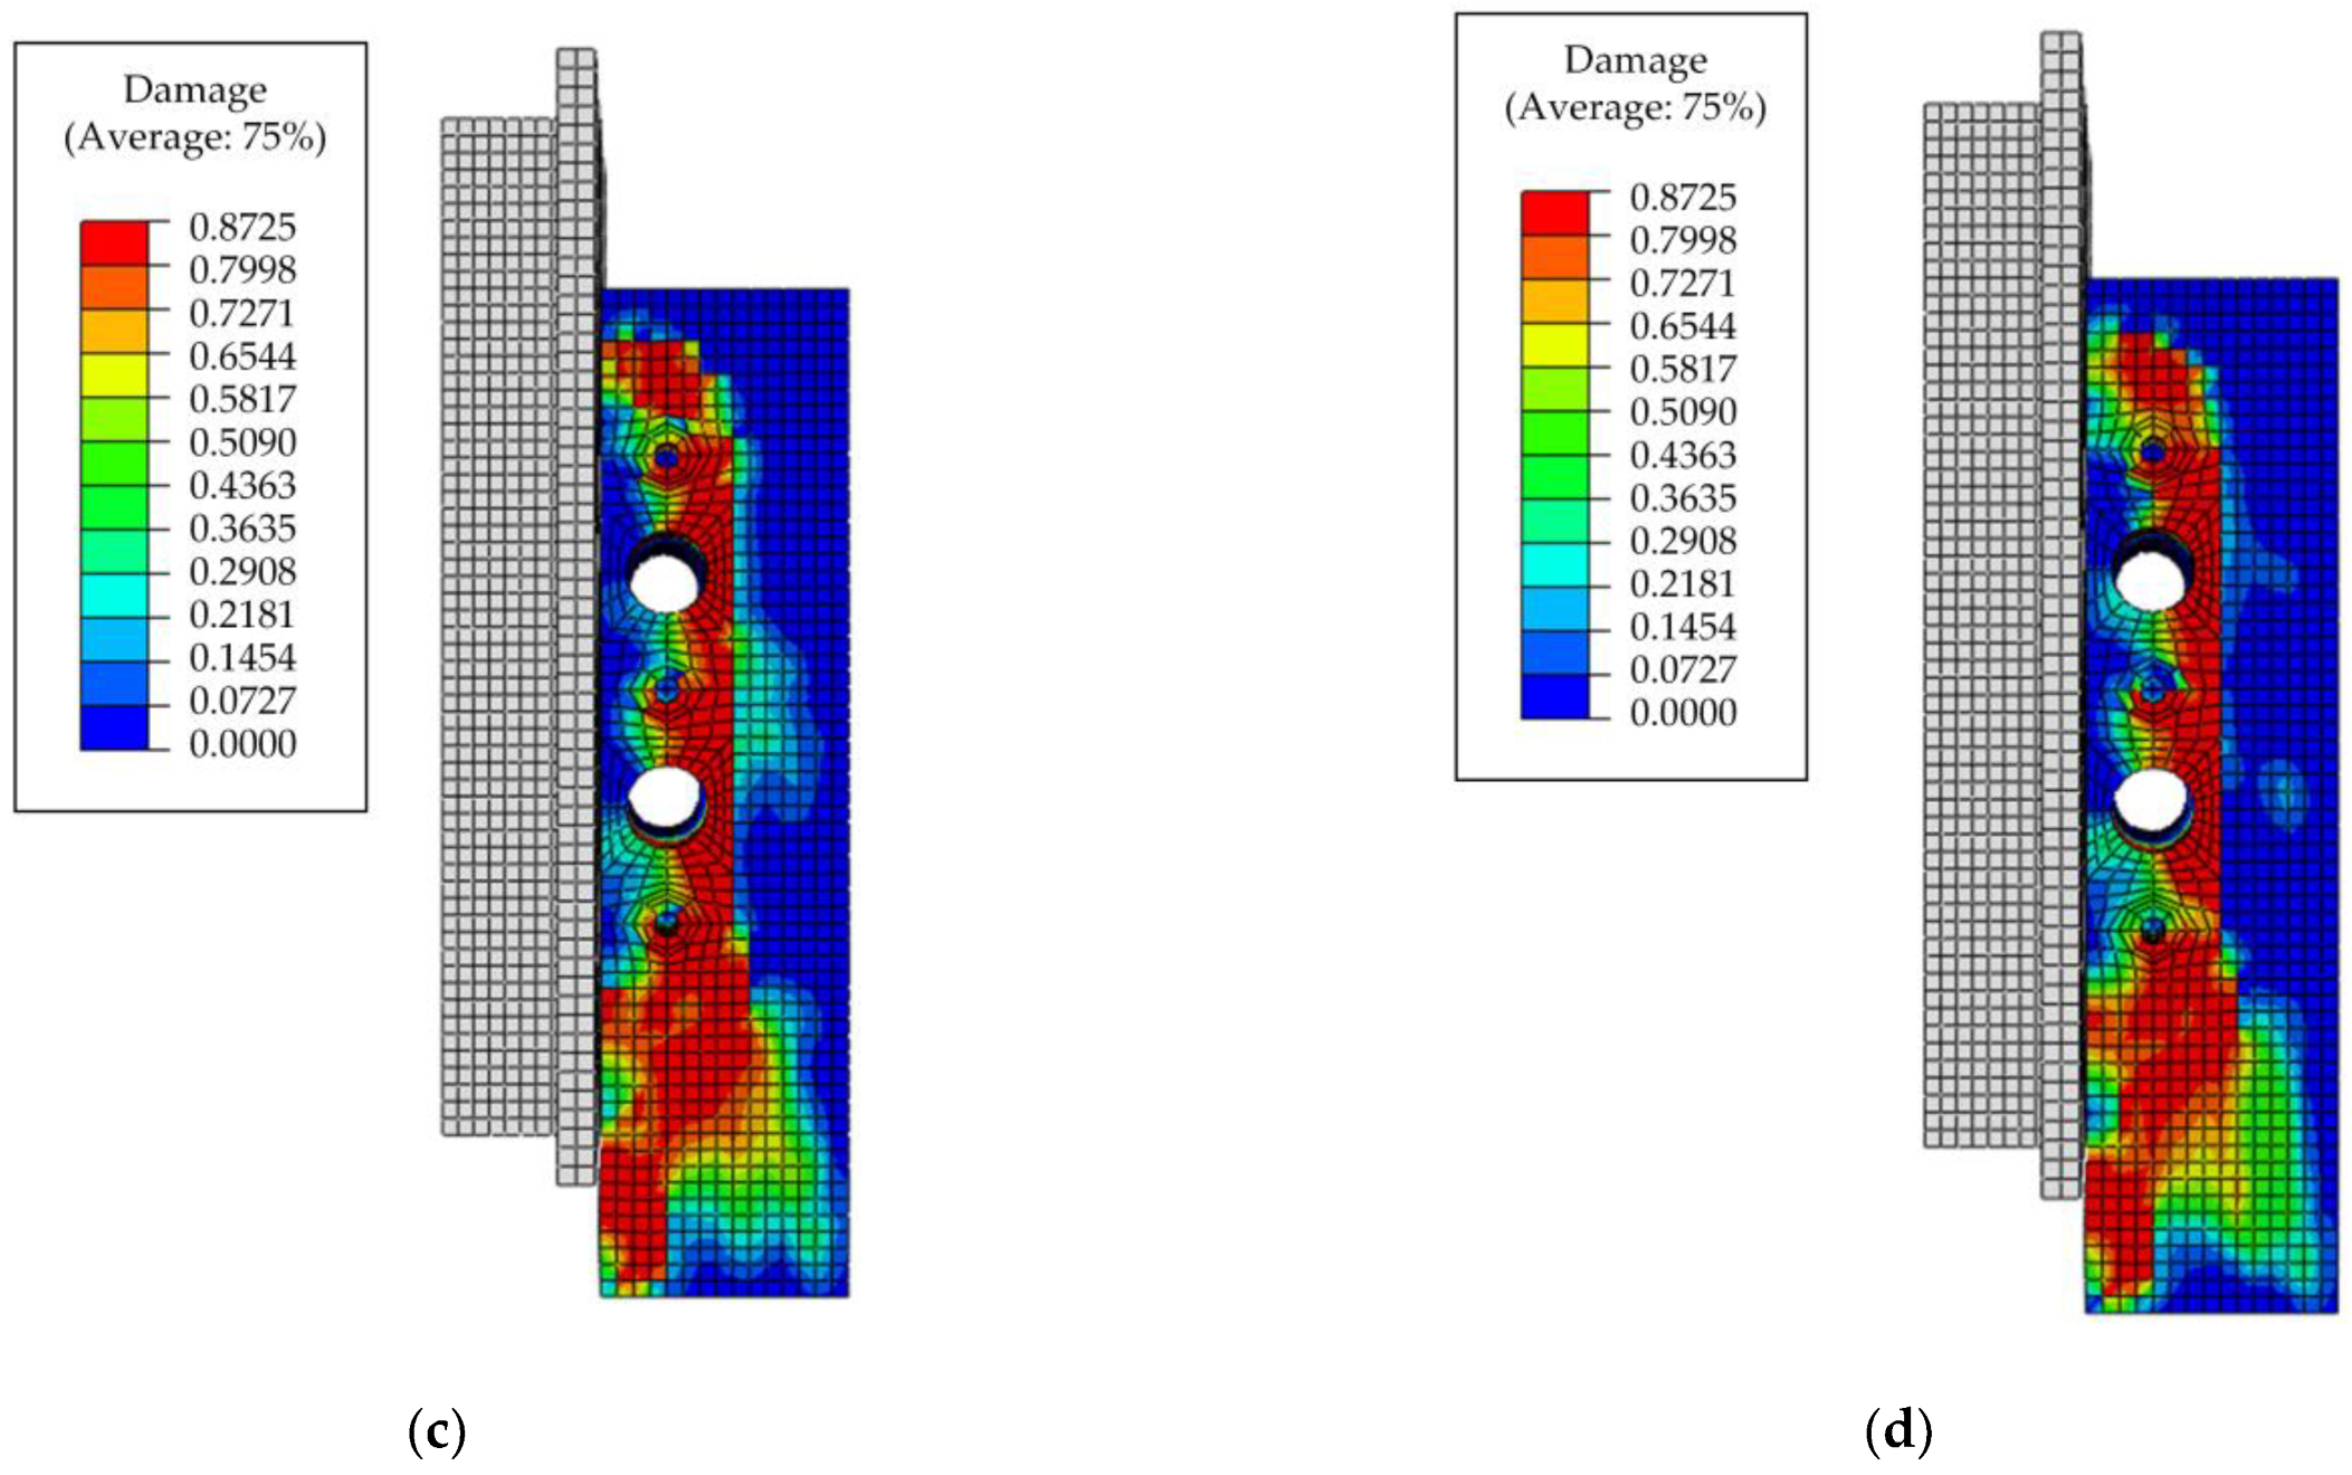
4.3.1. Concrete Strength

When the concrete strength is increased from 30 MPa to 50 MPa, the shear resistance is increased by 27.30%, and when it is increased from 30 MPa to 60 MPa, the shear resistance is increased by 46.43%, as shown in Figure 20a. It is evident from the results that the concrete strength significantly increases the shear resistance of the composite connectors. In Figure 20b–d, the colours indicate the degree of damage to the structure. Blue indicates a low level of damage and red indicates a high level of damage. With the increase in concrete strength, the damage to end-bearing concrete and the compressive zone at the bottom of the concrete dowels and welded studs decreases. In addition, the compressive damage to the concrete slab is reduced, effectively reducing the development of concrete cracks. This is due to the increased strength of the concrete, which significantly improves the mechanical properties of the concrete and reduces the overall stress level in the concrete slab.

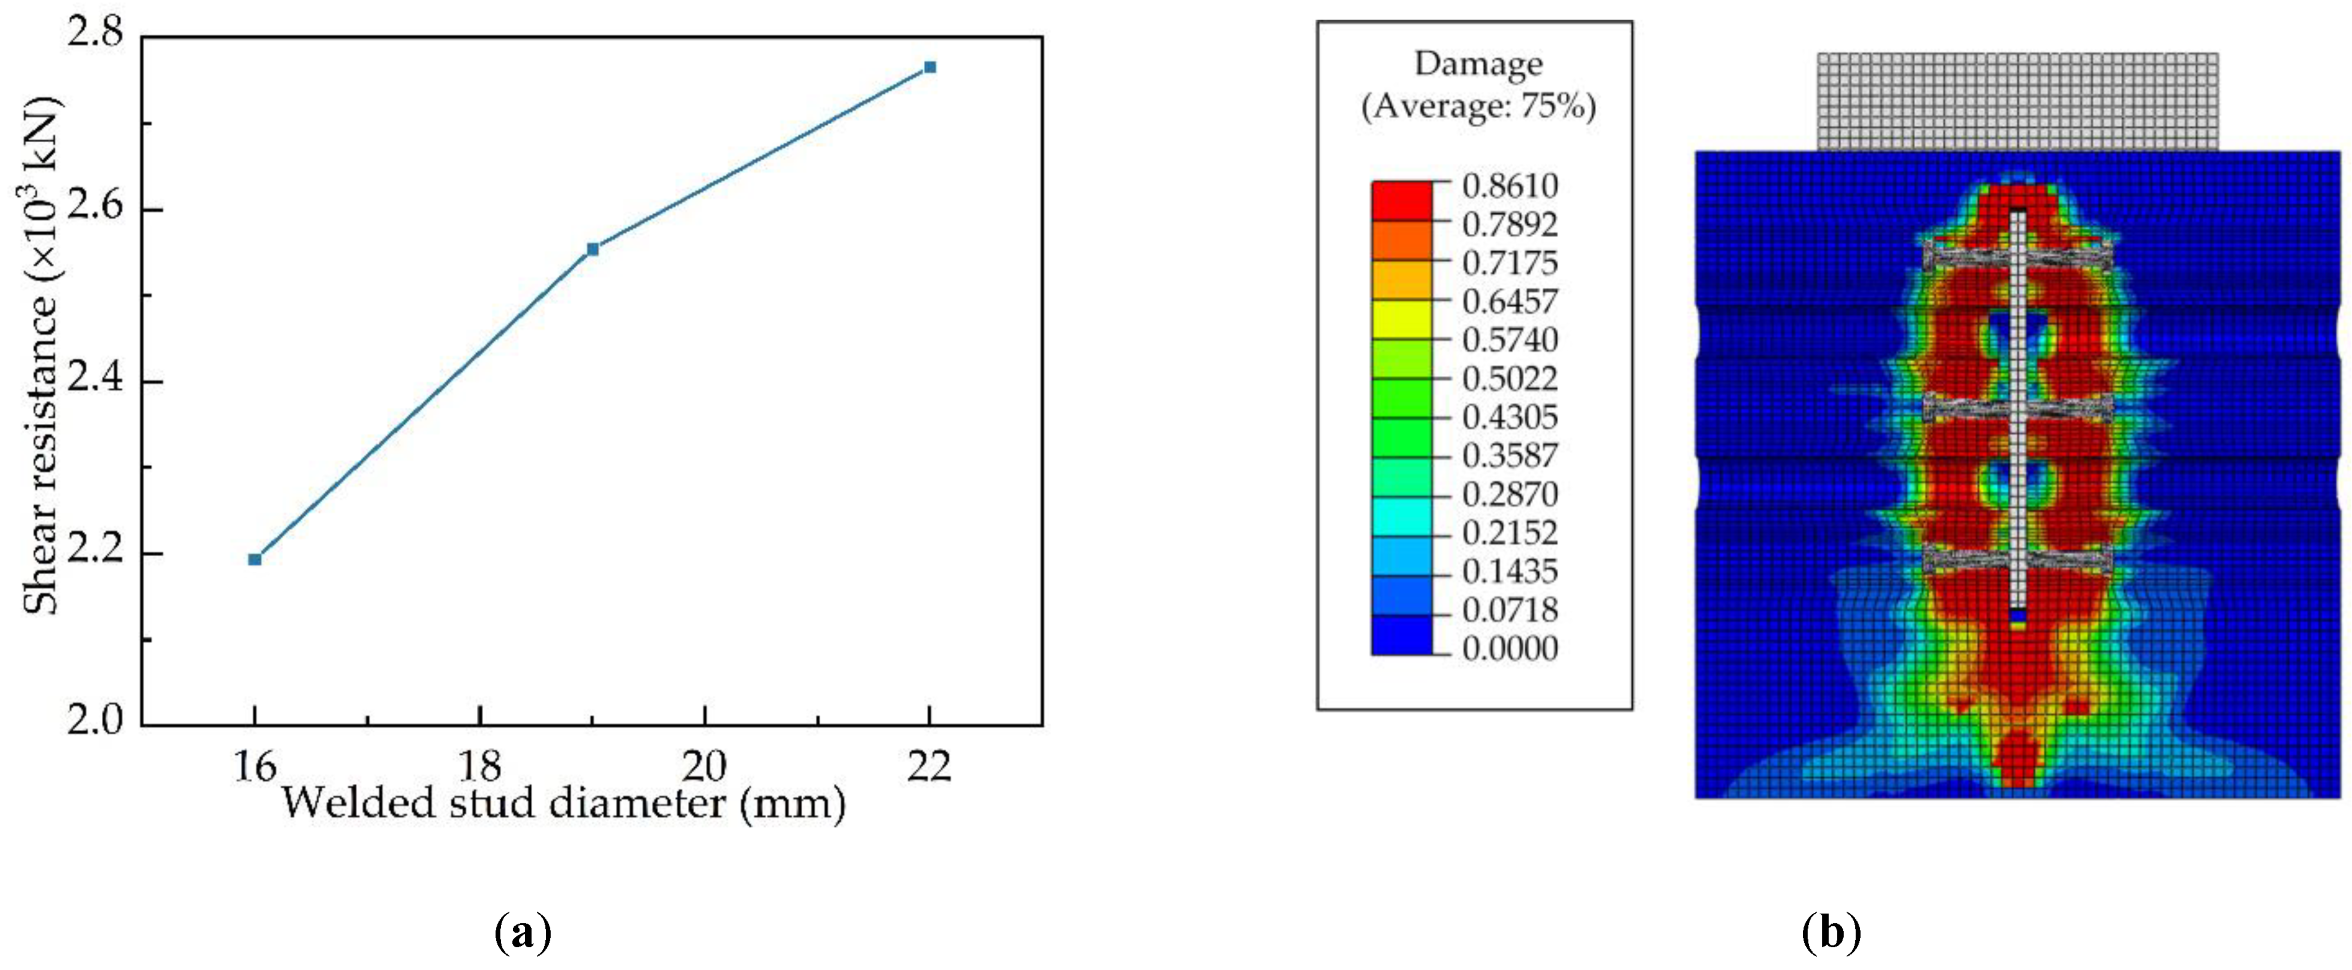
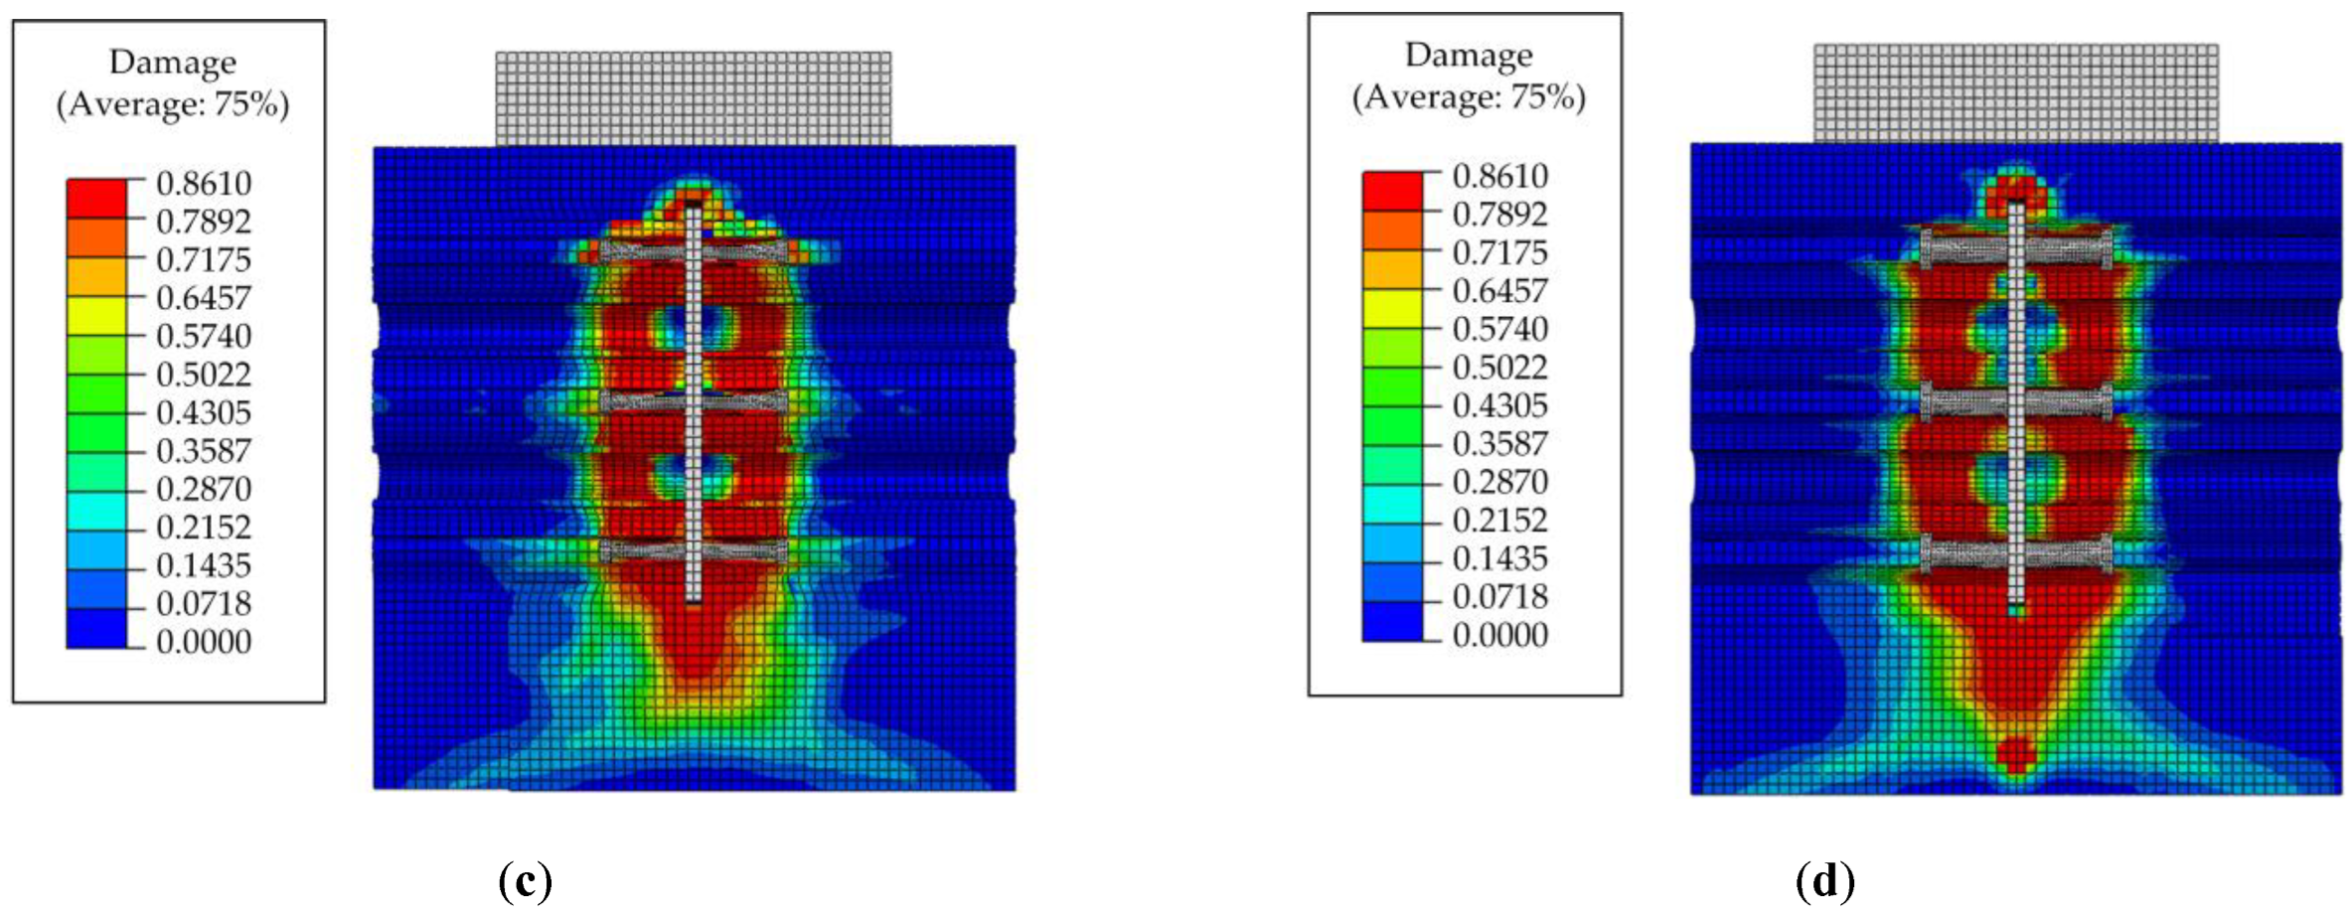
4.3.2. Welded Stud Diameter

In Figure 21a, the shear resistance increased from 2193.18 kN to 2554.82 kN when the diameter of the welded studs was increased from 16 mm to 19 mm, an increase of 16.49%; the shear resistance increased from 2193.18 kN to 2765.71 kN when the diameter of the welded studs was increased from 16 mm to 22 mm, an increase of 26.11%. The parametric analysis results show that the welded stud diameter significantly affects the shear resistance of this type of composite connector. By analysing the compressive damage cloud of the concrete slab in Figure 21b–d, the analysis results show that increasing the welded stud diameter increases the compressive damage area of the concrete around the tensile zone, further indicating that the surrounding concrete participating in shear resistance is improving.

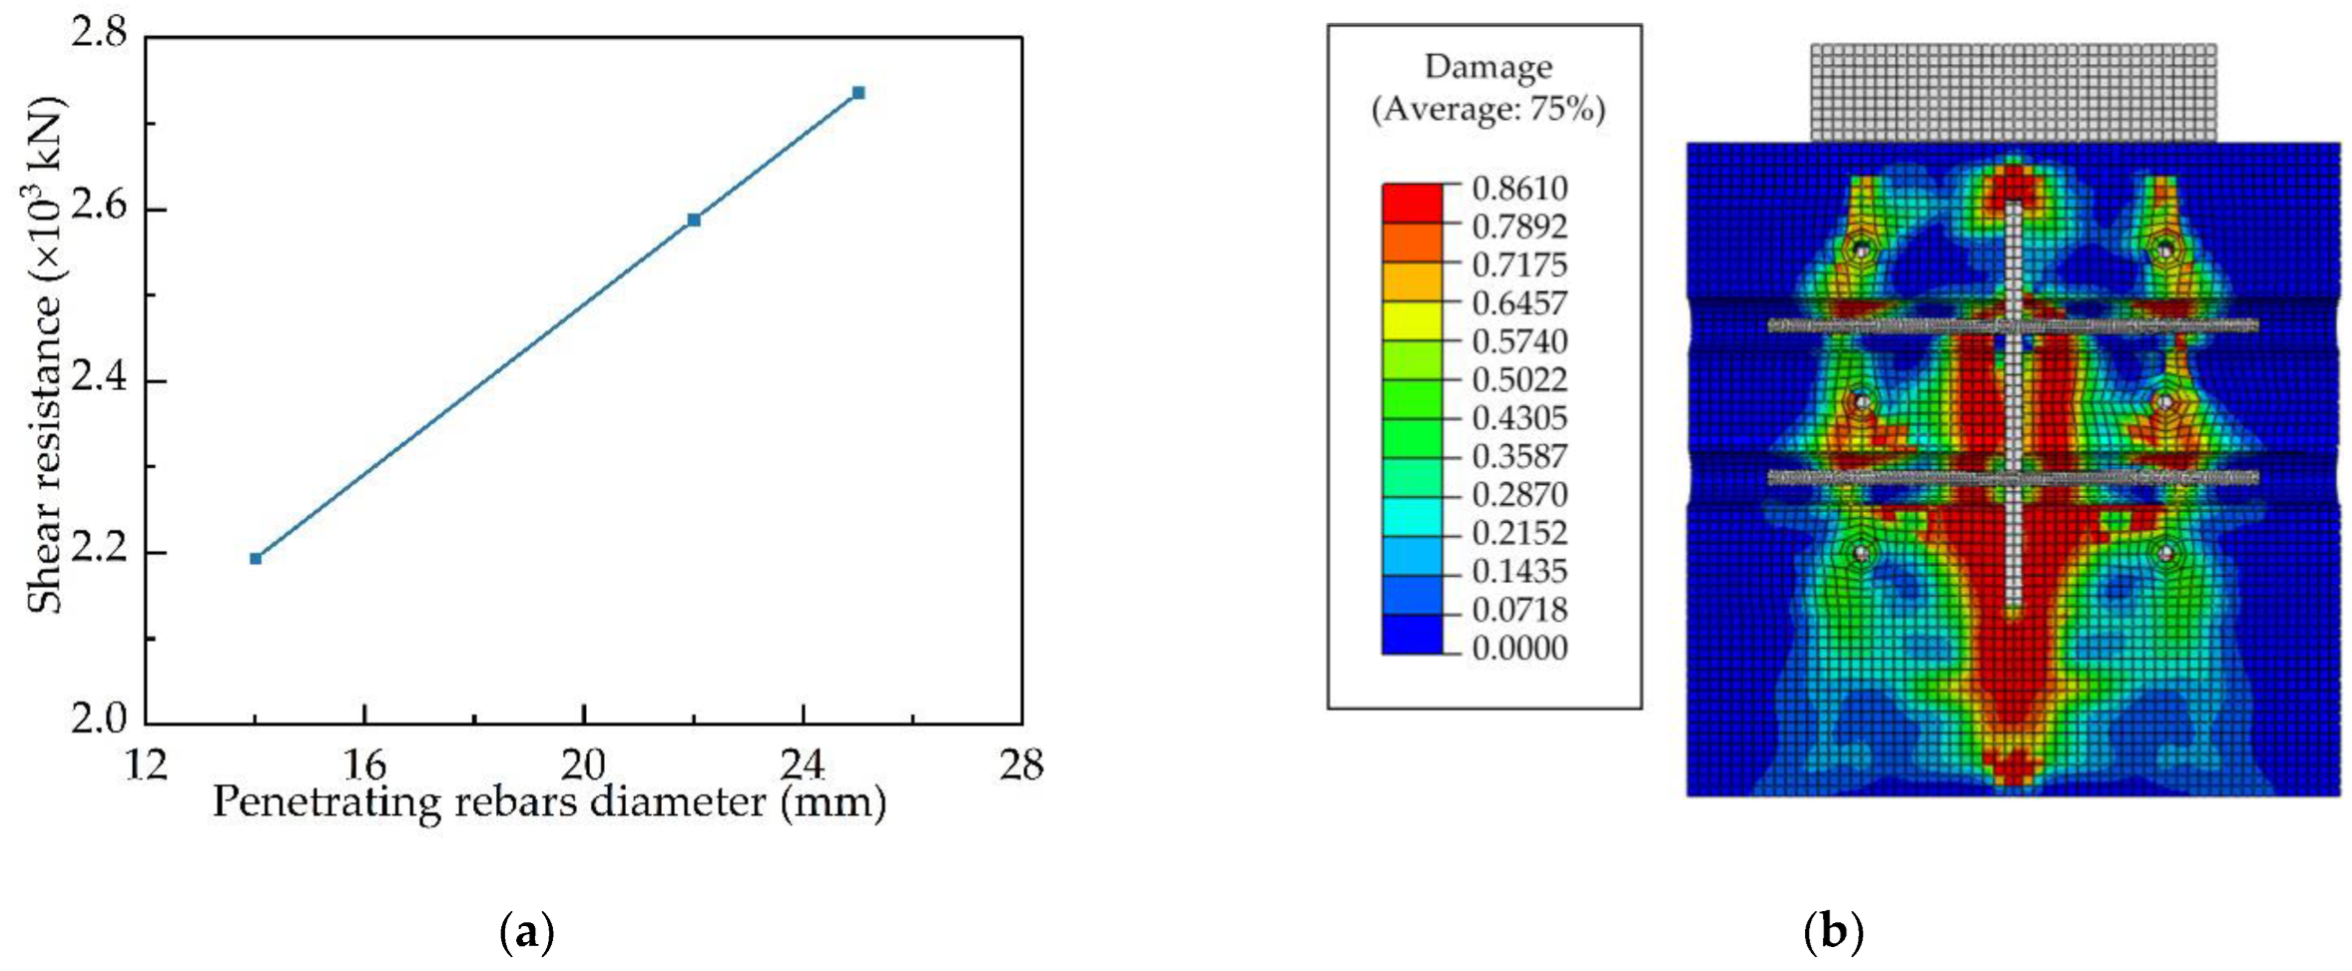
4.3.3. Penetrating Rebars Diameter

Finite element models were established and analysed using different diameters (14 mm, 22 mm, and 25 mm) of penetrating rebars as parameters, as demonstrated in Figure 22a. Increasing the penetrating rebars’ diameter significantly increases the composite connectors’ shear resistance. This is due to two main reasons. On the one hand, the shear resistance of the penetrating rebars is increasing significantly. On the other hand, the concrete in the hole is in triaxial compression under the combined action of the penetrating rebars, the perforated steel plate, and the surrounding concrete. This increases the compressive strength of the concrete in the hole to a certain extent, thus enhancing the shear resistance of the composite connectors. The increased penetrating rebar diameter increased the compressive damage area around the concrete dowels, as shown in Figure 22b–d. The change in damage area further illustrates that the area of surrounding concrete participating in shear resistance is increasing.

5. Conclusions

In this paper, the shear behaviour of composite connectors is investigated by push-out tests with six shear connectors. Theoretical and numerical analyses were also conducted on the composite connectors. Moreover, the following conclusions were obtained.
(1)
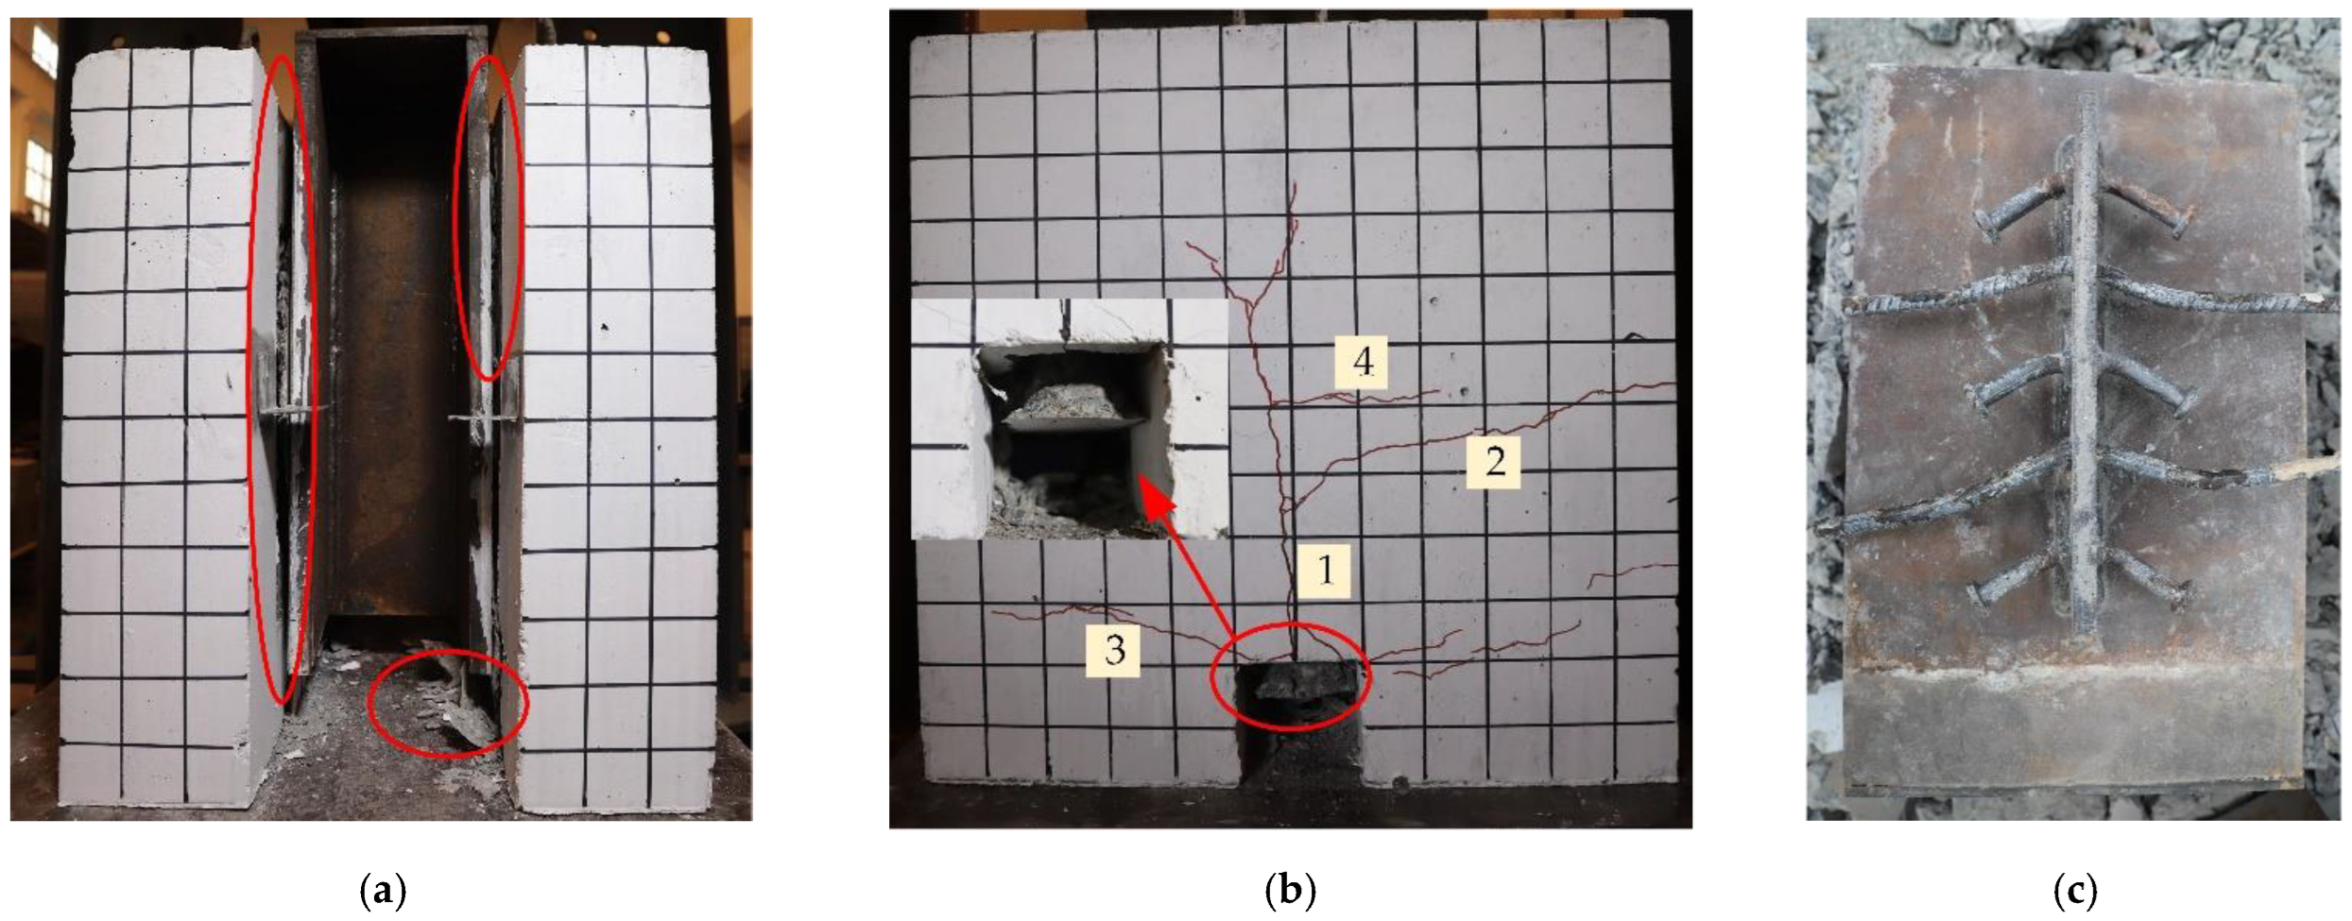
There are apparent differences in the failure modes of the three types of connectors. When the welded stud connector was damaged, the studs were cut off. Splitting failure occurred in the side of the concrete slab of the PBL connector, and the H-beam detached from the concrete. The concrete slab of the composite connectors with end-bearing concrete had splitting cracks, diagonal shear symmetric cracks, and bending deformation of the welded studs and penetrating rebars. For the composite connector without end-bearing concrete, brittle failure occurred in the concrete in the slotted area.
(2)
The composite connectors’ shear resistance, stiffness, and ductility meet the code requirements and are significantly better than those of welded stud connectors and PBL connectors. Increasing the number of welded studs and perforated holes and setting end-bearing concrete significantly improve the shear behaviours. The concrete in the slotted area is prone to brittle failure for the specimen without end-bearing concrete, reducing the overall performance.
(3)
Numerical investigations were carried out to parametrically analyse the composite connectors’ penetrating rebar diameter, welded stud diameter and concrete strength. The results indicate that the shear resistance increases as the penetrating rebar diameter, welded stud diameter, and concrete strength increase. In addition, as the strength of the concrete increases, the compressive damage area and overall damage level of the concrete can be effectively reduced.
(4)
Generally, the new composite shear connectors have a more excellent performance than conventional connectors. It has a promising application in bridge engineering. In addition, the noncontinuous arrangement of composite shear connectors is recommended in large-span composite bridges for ease of transport and to reduce welding deformation, which also can fully utilise the end-bearing concrete.

Author Contributions

Conceptualization, C.X. and Z.F.; data curation, C.X.; formal analysis, C.X.; funding acquisition, C.X. and F.W.; investigation, C.X., L.L. and L.H.; methodology, C.X., Z.F. and F.W.; project administration, C.X., Z.F. and F.W.; resources, Z.F. and F.W.; software, Z.F.; supervision, Z.F. and X.C.; validation, Z.F., F.W., L.L. and L.H.; visualization, F.W. and X.C.; writing—original draft, Z.F.; writing—review & editing, C.X., F.W. and L.L. All authors have read and agreed to the published version of the manuscript.

Funding

This research was funded by the Natural Science Basic Research Program of Shaanxi Province (Grant No. 2022JZ-32) and Fundamental Research Funds for the Central Universities (Grant No. 300102212212).

Institutional Review Board Statement

Not applicable.

Informed Consent Statement

Not applicable.

Data Availability Statement

Data is contained within the article.

Acknowledgments

The authors sincerely appreciate the selfless support provided by Xijing University and Chang’an University during the progress of this study.

Conflicts of Interest

The authors declare no conflict of interest.

References

  1. Zhang, Q.; Jia, D.; Bao, Y.; Cheng, Z.; Xiao, L.; Bu, Y. Internal Force Transfer Effect-Based Fatigue Damage Evaluation for PBL Shear Connector Groups. J. Constr. Steel Res. 2018, 148, 469–478. [Google Scholar] [CrossRef]
  2. Classen, M. Limitations on the Use of Partial Shear Connection in Composite Beams with Steel T-sections and Uniformly Spaced Rib Shear Connectors. J. Constr. Steel Res. 2018, 142, 99–112. [Google Scholar] [CrossRef]
  3. Kim, S.; Kim, K.; Park, S.; Jung, C.; Choi, J. Comparison of Hysteretic Performance of Stubby Y-type Perfobond Rib and Stud Shear Connectors. Eng. Struct. 2017, 147, 144. [Google Scholar] [CrossRef]
  4. Zhang, S.; Jia, Y.; Ding, Y. Study on the Flexural Behavior of Steel-Concrete Composite Beams Based on the Shear Performance of Headed Stud Connectors. Buildings 2022, 12, 961. [Google Scholar] [CrossRef]
  5. Vasdravellis, G.; Valente, M.; Castiglioni, C.A. Dynamic Response of Composite Frames with Different Shear Connection Degree. J. Constr. Steel Res. 2009, 65, 2050–2061. [Google Scholar] [CrossRef]
  6. Xu, X.; Zeng, S.; He, W.; Hou, Z.; He, D.; Yang, T. Numerical Study on the Tensile Performance of Headed Stud Shear Connectors with Head-Sectional Damage. Materials 2022, 15, 2802. [Google Scholar] [CrossRef]
  7. He, S.; Fang, Z.; Fang, Y.; Liu, M.; Liu, L.; Mosallam, A.S. Experimental Study on Perfobond Strip Connector in Steel–Concrete Joints of Hybrid Bridges. J. Constr. Steel Res. 2016, 118, 169–179. [Google Scholar] [CrossRef]
  8. Wu, F.; Tang, W.; Xue, C.; Sun, G.; Feng, Y.; Zhang, H. Experimental Investigation on the Static Performance of Stud Connectors in Steel-HSFRC Composite Beams. Materials 2021, 14, 2744. [Google Scholar] [CrossRef]
  9. Peng, K.; Liu, L.; Wu, F.; Wang, R.; Lei, S.; Zhang, X. Experimental and Numerical Analyses of Stud Shear Connectors in Steel–SFRCC Composite Beams. Materials 2022, 15, 4665. [Google Scholar] [CrossRef]
  10. Zhang, H.; Ling, Z. Finite Element Modeling on Shear Performance of Grouted Stud Connectors for Steel–Timber Composite Beams. Materials 2022, 15, 1196. [Google Scholar] [CrossRef]
  11. Wu, F.; Feng, Y.; Dai, J.; Wang, G.; Zhang, J. Study on Mechanical Properties of Stud Shear Connectors in Steel-UHPC Composite Structures. Eng. Mech. 2022, 39, 222–234, 243. [Google Scholar]
  12. Viest, I.M. Investigation of Stud Shear Connectors for Composite Concrete and Steel T-Beams. ACI J. Proc. 1956, 52, 875–892. [Google Scholar] [CrossRef]
  13. Ollgaard, J.G.; Slutter, R.G.; Fisher, J.W. Shear Strength of Stud Connectors in Lightweight and Normal Weight Concrete. Eng. J. Am. Inst. Steel Constr. 1971, 8, 55–64. [Google Scholar]
  14. Nguyen, H.T.; Kim, S.E. Finite Element Modeling of Push-Out Tests for Large Stud Shear Connectors. J. Constr. Steel Res. 2009, 65, 1909–1920. [Google Scholar] [CrossRef]
  15. EN 1994-2; Eurocode-4: Design of Composite Steel and Concrete Structures, Part 2: Composite Bridges. CEN-European Committee for Standardization: Brussels, Belgium, 1997.
  16. AASHTO LRFD. Bridge Design Specifications, 3rd ed; American Association of State Highway and Transportation Officials: Washington, DC, USA, 2004. [Google Scholar]
  17. Xu, C.; Sugiura, K. Parametric Push-Out Analysis on Group Studs Shear Connector Under Effect of Bending-Induced Concrete Cracks. J. Constr. Steel Res. 2013, 89, 86–97. [Google Scholar] [CrossRef]
  18. Dönmez, A.A. Size Effect on the Shear Capacity of Headed Studs. Adv. Struct. Eng. 2021, 24, 815–826. [Google Scholar] [CrossRef]
  19. Bazant, Z.P.; Vitek, J.L. Compound Size Effect in Composite Beams with Softening Connectors. I: Energy Approach. J. Eng. Mech. 1999, 125, 1308–1314. [Google Scholar]
  20. Gattesco, N.; Giuriani, E.; Gubana, A. Low-Cycle Fatigue Test on Stud Shear Connectors. J. Struct. Eng. 1997, 123, 145–150. [Google Scholar] [CrossRef]
  21. Xu, C.; Su, Q.; Masuya, H. Static and Fatigue Behavior of the Stud Shear Connector in Lightweight Concrete. Int. J. Steel Struct. 2018, 18, 569–581. [Google Scholar] [CrossRef]
  22. Gu, J.; Liu, D.; Deng, W.; Zhang, J. Experimental Study on the Shear Resistance of a Comb-Type Perfobond Rib Shear Connector. J. Constr. Steel Res. 2019, 158, 279–289. [Google Scholar] [CrossRef]
  23. Leonhardt, F.; Andra, W.; Andra, H.; Harre, W. New Improved Bonding Means for Composite Loadbearing Structures with High Fatigue Strength. Beton-Und Stahlbetonbau 1987, 82, 325–331. [Google Scholar] [CrossRef]
  24. Wang, X.; Zhu, B.; Cui, S.; Lui, E.M. Experimental Research on PBL Connectors Considering the Effects of Concrete Stress State and Other Connection Parameters. J. Bridge Eng. 2018, 23, 04017125. [Google Scholar] [CrossRef]
  25. Yang, Y.; Chen, Y. Experimental Study on Mechanical Behavior of PBL Shear Connectors. J. Bridge Eng. 2018, 23, 04018062. [Google Scholar] [CrossRef]
  26. Deng, W.; Xiong, Y.; Liu, D.; Zhang, J. Static and Fatigue Behavior of Shear Connectors for a Steel-Concrete Composite Girder. J. Constr. Steel Res. 2019, 159, 134–146. [Google Scholar] [CrossRef]
  27. Li, Z.; Zhao, C.; Deng, K.; Wang, W. Load Sharing and Slip Distribution in Multiple Holes of a Perfobond Rib Shear Connector. J. Struct. Eng. 2018, 144, 04018147. [Google Scholar] [CrossRef]
  28. Kim, H.; Jeong, Y. Experimental Investigation on Behaviour of Steel–Concrete Composite Bridge Decks with Perfobond Ribs. J. Constr. Steel Res. 2006, 62, 463–471. [Google Scholar] [CrossRef]
  29. Wu, F.; Liu, S.; Xue, C.; Yang, K.; Feng, Y.; Zhang, H. Experimental Study on the Mechanical Properties of Perfobond Rib Shear Connectors with Steel Fiber High Strength Concrete. Materials 2021, 14, 3345. [Google Scholar] [CrossRef]
  30. Su, Q.; Wang, W.; Luan, H.; Yang, G. Experimental Research on Bearing Mechanism of Perfobond Rib Shear Connectors. J. Constr. Steel Res. 2014, 95, 22–31. [Google Scholar] [CrossRef]
  31. Zhang, Q.; Pei, S.; Cheng, Z.; Bao, Y.; Li, Q. Theoretical and Experimental Studies of the Internal Force Transfer Mechanism of Perfobond Rib Shear Connector Group. J. Bridge Eng. 2017, 22, 04016112. [Google Scholar] [CrossRef]
  32. Liu, Y.; Xin, H.; Liu, Y. Load Transfer Mechanism and Fatigue Performance Evaluation of Suspender-Girder Composite Anchorage Joints at Serviceability Stage. J. Constr. Steel Res. 2018, 145, 82–96. [Google Scholar] [CrossRef]
  33. Kim, S.; Choi, K.; Park, S.; Park, S.; Jung, C. Experimental Shear Resistance Evaluation of Y-type Perfobond Rib Shear Connector. J. Constr. Steel Res. 2013, 82, 1–18. [Google Scholar] [CrossRef]
  34. Su, Q.; Li, C.; Wang, W. Experiment on Shear Transferring Mechanics of Perfobond Rib Connector. J. Tongji Univ. (Nat. Sci.) 2013, 41, 1623–1629. [Google Scholar]
  35. Wang, B.; Huang, Q.; Liu, X. Comparison of Static and Fatigue Behaviors between Stud and Perfobond Shear Connectors. KSCE J. Civ. Eng. 2019, 23, 217–227. [Google Scholar] [CrossRef]
  36. Xu, H.; Zhang, S.; Rong, B. Investigation on Shear Behavior of Studs and PBL Shear Connectors in Steel-Concrete Hybrid Bridge Girder. Structures 2022, 43, 1422–1435. [Google Scholar] [CrossRef]
  37. Yang, Y.; Chen, Y. Experimental Study on the Shear Capacity of PBL Shear Connectors. Eng. Mech. 2018, 35, 89–96. [Google Scholar]
  38. Kim, S.; Choi, J.; Park, S.; Ahn, J.; Jung, C. Behavior of Composite Girder with Y-type Perfobond Rib Shear Connectors. J. Constr. Steel Res. 2014, 103, 275–289. [Google Scholar] [CrossRef]
  39. Kim, S.; Heo, W.; Woo, K.; Jung, C.; Park, S. End-Bearing Resistance of Y-type Perfobond Rib According to Rib Width–Height Ratio. J. Constr. Steel Res. 2014, 103, 101–116. [Google Scholar] [CrossRef]
  40. Kim, S.; Park, S.; Heo, W.; Jung, C. Shear Resistance Characteristic and Ductility of Y-type Perfobond Rib Shear Connector. Steel Compos. Struct. 2015, 18, 497–517. [Google Scholar] [CrossRef]
  41. Kim, S.; Park, S.; Kim, K.; Jung, C. Generalized Formulation for Shear Resistance on Y-type Perfobond Rib Shear Connectors. J. Constr. Steel Res. 2017, 128, 245–260. [Google Scholar] [CrossRef]
  42. GB 50010-2010; Code for Design of Concrete Structures. China Architecture & Building Press: Beijing, China, 2011.
Figure 1. Common dimensions of specimens: (a) overall view; (b) front view; (c) side view; (d) top view (unit: mm).
Buildings 12 01726 g001
Figure 2. Details of specimen: (a) S-0-3; (b) P-2-0; (c) C-1-2; (d) C-2-2; (e) C-2-3; (f) C-2-3# (unit: mm).
Buildings 12 01726 g002
Figure 3. Fabrication of specimens: (a) machining H-beams; (b) welding perforated steel plate; (c) fixing penetrating rebar; (d) pouring concrete; (e) curing concrete; (f) drawing grids.
Buildings 12 01726 g003
Figure 4. Loading equipment and measurements.
Buildings 12 01726 g004
Figure 5. Failure modes of welded stud shear connector: (a) front of concrete slab; (b) side of concrete slab; (c) perforated steel plate.
Buildings 12 01726 g005
Figure 6. Failure modes of PBL shear connector: (a) front of concrete slab; (b) side of concrete slab; (c) perforated steel plate.
Buildings 12 01726 g006
Figure 7. Failure modes of composite connectors with end-bearing concrete: (a) front of concrete slab; (b) side of concrete slab; (c) perforated steel plate.
Buildings 12 01726 g007
Figure 8. Failure modes of composite connectors without end-bearing concrete: (a) front of concrete slab; (b) side of concrete slab; (c) perforated steel plate.
Buildings 12 01726 g008
Figure 9. Load–slip curves of specimens: (a) experiment curves; (b) typical curve of composite connectors.
Buildings 12 01726 g009
Figure 10. Evaluation of shear resistance and ductility.
Buildings 12 01726 g010
Figure 11. Influence of welded stud number: (a) shear resistance; (b) shear stiffness; (c) ductility.
Buildings 12 01726 g011
Figure 12. Influence of perforated hole number: (a) shear resistance; (b) shear stiffness; (c) ductility.
Buildings 12 01726 g012
Figure 13. Influence of end-bearing mode: (a) shear resistance; (b) shear stiffness; (c) ductility.
Buildings 12 01726 g013
Figure 14. Finite element model.
Buildings 12 01726 g014
Figure 15. Interaction of components.
Buildings 12 01726 g015
Figure 16. Boundary conditions of the model.
Buildings 12 01726 g016
Figure 17. Material constitutive relationships: (a) concrete in compression; (b) concrete in tension; (c) other materials.
Buildings 12 01726 g017
Figure 18. Load–slip curve comparison of specimen C-2-3.
Buildings 12 01726 g018
Figure 19. Failure modes of three shear connectors.
Buildings 12 01726 g019
Figure 20. Influence of concrete strength: (a) shear resistance; (b) compressive damages cloud map of C30 concrete; (c) compressive damages cloud map of C50 concrete; (d) compressive damages cloud map of C60 concrete.
Buildings 12 01726 g020aBuildings 12 01726 g020b
Figure 21. Influence of welded stud diameter: (a) shear resistance; (b) compressive damages cloud map of 16 mm welded stud; (c) compressive damages cloud map of 19 mm welded stud; (d) compressive damages cloud map of 22 mm welded stud.
Buildings 12 01726 g021aBuildings 12 01726 g021b
Figure 22. Influence of penetrating rebars’ diameter: (a) shear resistance; (b) compressive damages cloud map of 14 mm rebar; (c) compressive damages cloud map of 22 mm rebar; (d) compressive damages cloud map of 25 mm rebar.
Buildings 12 01726 g022aBuildings 12 01726 g022b
Table 1. Design parameters of the specimens.
SpecimensPerforated Steel PlateHolePenetrating RebarWelded Stud
Height
(mm)
Thickness
(mm)
Diameter
(mm)
NumberDiameter
(mm)
NumberLength
(mm)
Diameter
(mm)
Number
S-0-3//////80162 × 3
P-2-08016502142///
C-1-2801650114180162 × 2
C-2-2801650214280162 × 2
C-2-3801650214280162 × 3
C-2-3#801650214280162 × 3
Note: S indicates welded stud connector, P denotes PBL connector, and C denotes composite connector. The first number indicates the number of penetrating rebars, and the second number indicates the number of rows of welded studs. # represents concrete without end-bearing. For example, C-2-3# indicates a composite connector without end-bearing concrete, with two penetrating rebars and three rows of welded studs.
Table 2. Mechanical properties of materials.
MaterialYield Strength
fy (MPa)
Ultimate Strength
fu (MPa)
Elastic Modulus
Es (GPa)
Structural rebar554700206
Penetrating rebar483677212
Welded stud367420207
H-beam383501209
Perforated steel plate419561208
Table 3. Mechanical properties of shear connectors.
SpecimenPmax (kN)Prk (kN)δ90 (mm)δu (mm)K (kN/mm)δu/δ90
S-0-31010.13909.122.686.041413.862.25
P-2-01438.381294.541.506.152644.464.09
C-1-21887.871699.081.646.623440.674.04
C-2-22049.691844.721.386.513626.654.71
C-2-32225.262002.741.336.553702.634.93
C-2-3#1422.031279.831.114.153473.363.73
Table 4. Contact relationship.
NumberContact TypeNormal BehaviorTangential Behavior
Contact 1General ContactHard contact0.1 (Penalty function)
Contact 2General ContactHard contact0.904 (Penalty function)
Table 5. Characteristic point values for other material constitutive relationships.
Materialfy (MPa)fu (MPa)ε1ε2ε3
Structural rebar5547000.0026890.0106090.024509
Penetrating rebar4836770.0022780.0115250.025745
Welded stud3674200.0017730.0097730.013582
H-beam3835010.0018330.0173420.047949
Perforated steel plate4195610.0020140.0192720.050558
Table 6. Accuracy of simulated shear resistance.
SpecimenTest Result Ft (kN)Simulation Fs (kN)Accuracy (Fs/Ft)
S-0-31010.131000.0899.01%
P-2-01438.381400.2397.35%
C-1-21887.871817.6396.28%
C-2-22049.691983.4996.77%
C-2-32225.262193.1898.56%
C-2-3#1422.031356.0495.36%
Publisher’s Note: MDPI stays neutral with regard to jurisdictional claims in published maps and institutional affiliations.

