Article

Categorization of Factors Affecting the Resistance and Parameters Optimization of Ultra-Fine Cemented Paste Backfill Pipeline Transport

1
School of Mining Engineering, North China University of Science and Technology, Tangshan 063200, China
2
Mining Development and Safety Technology Key Lab of Hebei Province, Tangshan 063200, China
*
Author to whom correspondence should be addressed.
Buildings 2022, 12(10), 1697; https://doi.org/10.3390/buildings12101697
Submission received: 13 September 2022 / Revised: 10 October 2022 / Accepted: 13 October 2022 / Published: 15 October 2022
(This article belongs to the Special Issue Materials in Sustainable Buildings)

Abstract

:
Ultra-fine cemented paste backfill (UCPB) is prepared using tailings, binder and water. The factors affecting the resistance of UCPB pipe transport are numerous and complex, and the factor interactions restrict the rational development of the filling pipe transport design, which is not conducive to reducing the resistance. This paper categorizes and integrates the factors of pipe transport resistance by theoretical analysis and uses response surface methodology (RSM) to study the influence of different types of factors on the UCPB pipe transport resistance. The results show that the pipe transport resistance factors are classified into endogenous and exogenous factors. According to the classification, the reduction rate of the optimized pipe transport resistance is as high as 25.31% and 15.81%. This shows that the categorization of factors affecting the pipe transport resistance is important for investigating UCPB pipe flow. The single-factor terms with the highest significance under the effect of endogenous and exogenous factors are mass concentration and pipe diameter, respectively. The two interaction terms with highest significance are mass concentration and slurry temperature, pipe diameter and flow velocity, respectively. The results provide new ideas to reduce the resistance of mine pipeline and improve the filling benefit and convenience of pipeline design.

Graphical Abstract

1. Introduction

The reuse of solid waste materials is now one of the key objectives of sustainable economic development [1,2,3]. More and more industrial sectors are focusing on waste recycling [4,5,6], and mines are one of them. Tailings are solid wastes remaining after ore beneficiation, which are difficult to be further utilized due to economic and technical constraints [7,8,9]. According to the China solid waste treatment industry analysis report in 2019, the total accumulated tailings stockpile in China is about 20.7 billion tons, and the annual emission is up to more than 1.5 billion tons. Although the utilization rate of tailings is increasing daily, the amount of utilization is smaller than the new addition; therefore, a large number of tailings are stored in tailings reservoirs as “solid waste” [10,11,12,13]. Currently, iron tailings in China are mainly utilized in the following ways: valuable elements and minerals recovery, construction materials, elemental fertilizers and soil conditioners, mine void filling, tailings pond reclamation, etc. [14,15,16]. As a green mining method with comprehensive utilization of tailings, the back-filling method could control and manage ground pressure to a great extent, alleviate the surface collapse problem caused by mining activities, and reduce the establishment of tailings ponds, which is gradually favored by many mines [17,18]. With the rapid development of social economy, the consumption of mineral resources is increasing, and the amount of high-grade selectable ores is decreasing. Furthermore, the progress of mineral processing technology has led to the continuous reduction of the size of the separable ore [19]. Driven by this, tailings with d80 ≤ 20 μm have emerged, of which researchers call ultrafine tailings [20]. Due to the extremely small size of ultra-fine tailings, they usually form an “anti-wrapping” flow pattern with the binder during pipeline transport, which increases the contact area between tailings particles and the pipe wall, resulting in increased resistance to pipeline transport and inducing pipeline transport safety and stability problems [21,22,23]. Therefore, it is important to investigate the characteristics of UCPB pipeline transport.
The pipeline transport characteristics of UCPB are influenced by various factors, including rheological properties and pipeline transport design parameters. Among them, the influence of rheological properties mainly depends on the slurry temperature (ST), mass concentration (MC), cement–sand ratio (C/S), and external additives (EA), etc. [24,25,26,27]. The influence of pipeline transport design parameters includes pipe diameter (PD), flow velocity (FV), stowing gradient (SG), etc. [28,29]. Based on this, scholars were the first to carry out experimental studies on the effect of cemented paste backfill (CPB) rheological properties on the resistance of pipe transport, and many results were found. It has been shown that the mass concentration has a positive relationship with the CPB friction loss, i.e., the friction loss increases when the mass concentration increases [30]. Furthermore, some scholars conducted experimental studies on the flowability and pipe resistance of CPB with different waste rock and tailings materials, which showed that the CPB flowability was optimal and the pipe resistance was minimal when the waste rock and tailings gradation was 6:4 [31]. Kaushal et al. [32] studied the pipeline pressure drop and concentration distribution of tailings with different particle sizes, which indicated that the flow velocity of particles with an average concentration of 50% could reach 5 m/s, and the coarser particles would move in the low flow velocity zone in a slippery bed state, thereby increasing the pipe transport resistance. Ren et al. [33] investigated the rheological properties of UCPB under the action of ultrasonic fields and showed that ultrasonic waves could reduce the plastic viscosity and yield stress of UCPB and decrease the pipe transport resistance. In addition, studies on the influence of pipe design parameters on the slurry resistance loss are also becoming widespread. Cheng et al. [34] considered the effect of slurry temperature variation on the rheological properties of UCPB and proposed a time–temperature effective model. Zhou et al. [35] carried out a CPB transport test to investigate the effect of large pipe diameter on the flowability of CPB as well as the bleeding rate and optimized the slurry proportioning and transport parameters. The above research concludes that the strength of UCPB fluidity is an important factor considered in back-filling mining, and how to reduce the resistance loss is an urgent problem for mines. However, the existing research results do not classify and integrate the key factors affecting the resistance of pipe transport, and there are relatively few studies on the influence of the interaction between factors on the resistance of pipe transport. This would lead to the low completeness of the UCPB pipeline resistance theory system, which has certain constraints on the design and optimization of the filling pipeline transportation. Response surface methodology (RSM) is commonly used to analyze experimental studies of multi-factor interactions and has been applied in the mining field, including CPB flocculation and sedimentation optimization [36], optimal fit ratio analysis [37,38,39,40], rheological parameter prediction [41,42], and resistance loss optimization [43]. In this paper, through theoretical analysis, the key factors affecting the pipe transport resistance of UCPB are categorized and integrated. The RSM is used to investigate the influence of different categories of factors on the pipe transport resistance of UCPB, to construct a regression model of pipe transport resistance, to analyze the interaction between factors, and to find out the significance of the influence of different factors on pipe transport resistance. In combination with the mine engineering, a multi-angle influence factor categorization and integration optimization analysis is carried out to provide a multi-way analysis method for mine filling pipeline design based on economy and operational convenience.

2. Factors Influencing the Pipe Transport Resistance of UCPB

2.1. Pipeline Transport Resistance Model

UCPB could be generally described by the power-law model, Herschel–Bulkley model, and Bingham fluid model. In this paper, UCPB is described using the Bingham rheological relationship model, as follows:
τ = τ u + d v d y η u
where τ is the shear stress of UCPB, Pa; τu is the yield stress of UCPB, Pa; ηu is the plastic viscosity of UCPB, Pa·s; dv/dy is the shear rate of UCPB, s−1.
The UCPB pipe transport resistance model is derived as follows [44]: As shown in Figure 1, in a pipe of radius R, the radius of the flow nucleus is r0. Taking the fluid at r for analysis, the flow velocity is v, the internal shear stress is τ, the pressure difference between the two ends of the pipe can be calculated as Δp = p0p1, and the shear stress is analytically derived from the expression; see Equation (2).
τ = Δ p r 2 L
where L is the pipe length, mm.
It can be seen from Equation (2) that the shear stress is linearly and positively related to the radius in the shear flow zone.
When r = r0, the maximum dynamic shear stress value can be derived, and then, the flow nucleus r0 can be found; see Equation (3).
r 0 = 2 L τ 0 Δ p
From Equation (3), it can be seen that the radius of the flow nucleus is inversely proportional to the pressure difference between the two ends of the pipe. Therefore, the larger the pressure difference, the smaller the radius of the flow nucleus, and the flow nucleus zone will disappear when the pressure difference increases to a certain degree. Combining Equations (2) and (3) into Equation (1), the new expression of the Bingham rheological model for UCPB is derived as follows:
Δ p r 2 L = Δ p r 0 2 L η u d v d r
Considering the radius change from the pipe wall to the shear flow region (i.e., from Rr), the flow velocity increases from 0 to v. After integrating Equation (4), the velocity of UCPB in the structural flow state in any flow zone is derived, as shown in Equation (5).
v = Δ p 4 L η u [ ( R r 0 ) 2 ( r r 0 ) 2 ]
The total flow rate of UCPB in the pipeline consists of two parts: the flow nucleus zone as well as the shear flow zone. Combining the flow rate and flow velocity calculation method of Equations (5) and (6), the relationship model of the total flow rate of UCPB can be obtained, as shown in Equation (7).
v = 4 Q π D 2
Q = π Δ p R 4 8 L η u ( 1 4 r 0 3 R + r 0 4 3 R 4 )
where D is the pipe diameter, mm.
Because of the transport process r04 << R4, the last term in the parentheses of Equation (7) can be ignored, the total flow calculation method can be reduced to Equation (8).
Q = π Δ p R 4 8 L η u ( 1 4 r 0 3 R )
Equation (8) represents the calculation method of the flow rate of UCPB in a pipe with structured flow state.
The flow velocity of UCPB in the structural flow state can be found by combining Equations (3), (6) and (8).
v = γ S D 2 32 η u ( Δ p γ S L 16 τ 0 3 γ S D )
The resistance loss of UCPB in the pipeline is calculated as Equation (10). Combining with Equation (9), a new model for calculating the resistance of UCPB pipe transport is derived, as shown in Equation (11).
i u = Δ p γ S L
i u = 16 3 γ D τ u + 32 v γ D 2 μ u
where iu is the UCPB pipe conveying resistance, Pa; γs is the ultra-fine tailings solid material density, kg·m−3.
In addition, scholars have designed empirical formulas for calculating the pipe transport resistance by monitoring the pressure drop and other parameters of the slurry transport process in the field [47,48], as shown in Equations (12) and (13).
i u = 1 + 3.68 g D v u ρ u ρ w ρ w 33 ρ u ρ w i w
i u = 1 + 108 c u 2 g D γ s g D v u 2 C x 33 i w
where g is the acceleration of gravity, m·s−2; ρu is the UCPB density, kg·m−3; ρw is the water density, kg·m−3; iw is the water hydraulic gradient; cu is the UCPB mass concentration; vu is the UCPB flow velocity, m·s−1; and Cx is the empirical coefficient.
The above three models require a combination of UCPB’s property parameters and transport design parameters to calculate the pipe transport resistance loss, which requires more factors to be considered. For the mine, changing the design parameters and slurry properties would bring different degrees of impact on the mine efficiency. For example, when the ore grade is more balanced, the difference in particle size distribution of the tailings after beneficiation is small. When changing the mining area for filling operations, the pipe diameter or flow velocity can be changed to improve the flowability of the backfill based on the rheological properties of the backfill in the mined area. This approach reduces the resistance of the pipeline and alleviates the costs associated with laboratory-based rheological testing, which in turn improves the economic efficiency of the mine company. When the ore grade varies widely, the grain size distribution of the tailings after beneficiation in different grade ore areas is wider. In this case, the rheological properties of the backfill are significantly changed by the influence of the tailings gradation. Therefore, the slurry flowability cannot be accurately controlled by changing the pipeline parameters only, and the comprehensive influence of slurry rheology as well as transport parameters on the pipeline flow characteristics should be considered. However, when the filling pipeline is long and relatively complex, it is difficult to change the pipeline design parameters, which is not conducive to the sustainable development of a mine economy. Therefore, the rheological characteristics of the backfill under different tailings particle size distribution conditions can be investigated. The variables such as mass concentration and cement–sand ratio can be changed to realize the change of slurry flowability, and then to improve the pipeline transport efficiency and reduce the resistance loss. From the above analysis, it is clear that the necessity of categorizing and integrating the factors affecting the resistance to pipeline transport is pretty significant. Based on the categorization results to construct the regression model of pipe transport resistance with different categories of factors, choosing the optimal method to calculate the pipe transport resistance and carry out the correction of proportioning parameters or design parameters is a new way to improve the economic efficiency and convenience of the mine.

2.2. Classification of Influencing Factors

When the CPB flows in the pipe, the shearing effect between the flow layers and the collision friction between the particles will lead to resistance loss and kinetic energy reduction. Different properties of the CPB itself is the direct cause of the difference in the size of this resistance loss. When the cement–sand ratio, mass concentration, slurry temperature and other factors affecting the properties of the CPB change, the plastic viscosity, yield stress changes, solid phase particle interaction, CPB and pipe wall friction degree are different, and they lead to changes in the resistance loss.
In addition, the design parameters such as pipe diameter, flow velocity (initial energy) and stowing gradient are also important factors affecting the resistance loss. Among them, the pipe diameter and the flow velocity have a mutual constraint relationship. When the pipe diameter is larger, the average flow velocity of the CPB pipeline is relatively small, which leads to the reduction of transport efficiency and induces the pipe plugging. When the pipe diameter is smaller, the average flow velocity is larger, intensifying the friction between the CPB and the pipe, increasing the resistance loss, seriously shortening the life of the pipe or even causing pipe burst. Therefore, the relationship between pipe diameter and flow velocity needs to be coordinated to improve mine filling efficiency and reduce friction losses. However, these factors have an impact on the interaction between the CPB and the pipe wall as well as the particles within the CPB, but have a low influence on the change in the properties of the CPB itself.
Based on the above analysis, this paper classifies the influencing factors of UCPB pipe transport resistance into two categories (as shown in Figure 2). One is the variation of pipeline resistance caused by the properties of the UCPB itself (endogenous effect), including slurry temperature, mass concentration, and cement–sand ratio. The other is the change of pipeline resistance caused by the pipeline design parameters (exogenous effect), including pipe diameter, flow velocity, and stowing gradient.

3. Materials and Methods

3.1. Test Materials

3.1.1. Tailings and Binder

An iron ore deposit in Hebei, China, is a contact-accounted silica-type magnetite deposit. The ore body is produced in the interlayer fissures of crystalline tuff or dacite. The ore grade is high. The selectable minerals are relatively abundant. However, the ore body is relatively fragmented. Table 1 shows the filling scheme of this mine. After several accelerated and decelerated flows, the pipe wear is greater in the L-pipe flow area formed by vertical pipe-bend-horizontal pipe at a certain stage, as shown in Figure 3. Therefore, it is crucial to decrease the pipe transport resistance in UCPB flow at this stage to improve the reliability of mine pipeline transport.
The mine tailings particle size distribution is relatively concentrated in general. Using the laboratory laser particle size meter to analyze, the tailings particle size distribution is shown in Figure 4. The analysis showed that the maximum particle size was 34.20 μm and the minimum particle size was 0.305 μm. The accumulated content of −20 μm particles was up to about 90%, which belonged to ultra-fine tailings. The physical properties and chemical composition content of the tailings were analyzed, and the results are shown in Table 2 and Table 3. When the Cn is greater than or equal to 5, the Cc is between 1 and 3 for good grading, not meeting the above two conditions at the same time is bad grading. The binder material is P.S 42.5 slag silicate cement.

3.1.2. UCPB

This paper integrates the filling scheme of the mine and takes into account the uniaxial compressive strength and fluidity of the UCPB. The mass concentration is set to 61, 63 and 65 wt%, and the cement–sand ratio is 1:6, 1:8 and 1:10. Figure 5 shows the flow pattern of the UCPB under some mass concentration and cement–sand ratio conditions. It can be seen from Figure 5 that the bleeding rate and flowability can meet the filling requirements.

3.2. Test Methods

In this paper, the research includes UCPB rheological test, UCPB pipeline transport flow simulation and UCPB response surface test optimization based on different categories of factors. The specific experimental flow chart is shown in Figure 6.

3.2.1. Rheological Test

The plastic viscosity and yield stress of UCPB are important parameters to explore the slurry flowability and pipe transport resistance. In this paper, slurry temperatures were selected as 30, 40 and 50 °C, and the cement–sand ratio and mass concentration are as described in Section 3.1.2 UCPB with different slurry temperatures, cement–sand ratios and mass concentrations were prepared, and the rheological parameters were tested by HAKKES rheometer. The results are shown in Table 4.

3.2.2. Pipeline Transport Simulation Test

Mining work gradually pursues high quality, high efficiency and high production development, only high filling efficiency can match with the mine production capacity. Therefore, high flow rate pipe transport design becomes the development trend of mine filling work. During the UCPB transportation process, the hydration reaction, and effect from collision and friction cause the UCPB temperature variation. Combined with the influence of the ambient temperature, the magnitude of change is relatively large. Based on the above analysis, the following test factors and levels are selected to investigate the influence of different types of factors of UCPB on the pipe transport resistance, as shown in Table 5.
The numerical simulation method is gradually matured. The simulation results maintain strong consistency with the experimental test results within the error tolerance as well as high credibility. In this paper, mass concentration, ash–sand ratio, slurry temperature, pipe diameter, flow velocity and stowing gradient are used as variables. Based on COMSOL software, an L-pipe transport model of UCPB is constructed to investigate the resistance of UCPB pipe transport under different categories of factors and to provide reliable data for a response surface test.
Figure 7 provides the model and meshing of the UCPB L-pipe conveying model. In the model, the vertical orifice is set as velocity inlet. The horizontal orifice is pressure outlet. The fluid flow module and the fluid heat transfer module are coupled for analysis. The heat transfer mode is heat flux. The type of heat transfer is divided into two categories. One is the heat transfer effect inside the pipe due to the shear between the flow layers of the UCPB flow, inter-particle collision and frictional effect with the pipe wall. The second is the internal and external heat exchange effect under the combined influence of temperature difference between the inside and outside of the pipe, external environmental humidity, wind and wind direction, etc. The grid is divided into refinement. The flow process follows the energy conservation equation, momentum conservation equation and particle transport equation, etc. [47,48,49]. The results of the resistance loss calculation are presented in the response surface test results, which are detailed in Section 3.2.3.

3.2.3. Response Surface Test Based on Central Composite Designs

A three-factor, three-level response surface test consisting of mass concentration, cement–sand ratio, and slurry temperature was designed using Minitab software to investigate the effect of changes in the properties of the UCPB itself on the resistance to pipeline transport. The experimental design is shown in Table 6.
Based on the contents of the experimental design in Table 6, six center points were added in order to analyze the interaction between the factors and to determine the experimental error. Table 7 shows the results of the response surface test.
The test parameter settings and codification for the effect of exogenous factors are shown in Table 8. Based on the simulation test results, the response surface test results under the influence of exogenous factors are derived and are shown in Table 9.

4. Analysis of Test Results

4.1. Regression Model of Pipeline Transport Resistance

Based on the experimental results, the complete fit analysis of each factor and its interaction term and quadratic term in different categories was carried out to establish the regression models of the pipe transmission resistance of UCPB, respectively. It can be seen from Equations (14) and (15) that the correlation coefficients R2 of the UCPB pipe transport resistance models under different categories of factors are less than 0.9, indicating their low correlation and poor reliability [49].
i u = 13811 43788 c u 5899 C / S + 22.3 T u + 34764 c u 2 1598 C / S 2 + 0.0218 T u 2 + 10504 c u C / S 36.85 c u T u 7.38 C / S T u · ( R 2 = 0.743 )
i u = 177.6 0.529 D u 51.7 v u 3.09 N u + 0.00107 D u 2 + 24.18 v u 2 + 0.28 N u 2 0.0974 D u v u + 0.00803 D u N u + 0.229 v u N u · ( R 2 = 0.721 )
When the correlation coefficient between the established regression model of the response variable and the test factor is low, an appropriate transformation of the response variable should be performed followed by a high-precision fit. Using the Box–Cox transformation method, the 95% confidence interval of the transformation parameter λ is solved to derive the transformed values of the response variables, and the optimal relationships between the pipe transport resistance and different categories of factors are explored. The confidence intervals of the transformation parameters λ under different categories of factors were calculated to be (−1.57094, 2.06006), (−2.00277,1.37423), respectively. The specific values of the estimated transformation parameters λ were 0.458557, −0.096269, rounded to 0.5, 0. After using the transformation Equation (16) to vary the response variables, the high-precision regression models of pipeline transmission resistance were constructed for different types of factors.
As shown in Equations (17) and (18), the correlation coefficients of the regression models with changes to the response variables are 0.988 and 0.976, respectively, which are greater than 0.9. This indicates that the transformed models are highly correlated and have high predictive accuracy.
i u * = i u λ , λ 0 ln i u , λ = 0
i u = 918 2897 c u 365 C / S + 1.37 T u + 2299 c u 2 122 C / S 2 + 0.00155 T u 2 + 655 c u C / S 2.304 c u T u 0.378 C / S T u 2 · ( R 2   = 0.988 )
i u = Exp 6.041 0.00851 D u 0.914 v u 0.0415 N u + 0.000015 D u 2 + 0.38 v u 2 + 0.00325 N u 2 0.001089 D u v u + 0.000184 D u N u 0.0016 v u N u · ( R 2   = 0.976 )  
where iu* is the transformed UCPB pipe transport resistance, kPa; C/S is the UCPB cement–sand ratio; Tu is the UCPB slurry temperature, °C; vu is the UCPB flow rate, m·s−1; Nu is the UCPB stowing gradient.

4.2. Effect of Endogenous Factors

4.2.1. Variance Analysis

In this paper, the ANOVA test is used to conduct the result error analysis. Based on the parameters such as F value and p value, the variance table of endogenous factors influencing the resistance of the UCPB pipeline is derived and is shown in Table 10. The significance of the effects of mass concentration, cement–sand ratio, slurry temperature and their interactions can be analyzed from Table 10.
As can be seen from Table 10, the regression model p = 0.002 < 0.005. This indicates that the regression model is significant. Among the single factor influence terms, all terms had F values >> 1 and p values < 0.05. This shows that mass concentration, cement–sand ratio, and slurry temperature are significant and statistically significant for the response variable resistance loss. Among the factor squared terms, the squared term of the cement–sand ratio and the squared term of slurry temperature have F value < 1 and p value >0.05. This indicates that they are not significant and statistically significant, while the concentration squared term F value >> 1 and p value < 0.05. Thus, it is significant and statistically significant. Among the interaction terms, only the interaction of cement–sand ratio and slurry temperature is not significant and statistically significant.
Based on the F values of the single factors, the sensitivity order of the endogenous factors effect of UCPB on the resistance loss of the response variable is mass concentration (20.88) > slurry temperature (11.30) > cement–sand ratio (8.94).

4.2.2. Endogenous Factors Interaction

Based on the results of the response surface test, 3D surface plots and contour plots were drawn for the interaction of the endogenous factors causing the change in pipe transport resistance, as shown in Figure 8, Figure 9 and Figure 10.
As seen in Figure 8b, Figure 9b and Figure 10b, the contour slopes of mass concentration and cement–sand ratio and mass concentration and slurry temperature are significantly higher than those of cement–sand ratio and slurry temperature. Combined with the variance analysis table, it can be seen that the first two are much more significant than the latter. It can be obtained from the Figure 8 and Figure 9 that when the cement–sand ratio and slurry temperature are fixed values, the pipe transport resistance of UCPB shows a trend of first decreasing and then increasing with the increase in mass concentration, which shows the difference with the conventional CPB. As can be seen from Figure 10, the resistance loss shows a trend of decreasing and then increasing with the increase in slurry temperature when the cement–sand ratio is fixed. This indicates that there is a slurry temperature between 40 and 60 °C that minimizes the resistance. When the slurry temperature is fixed, the resistance of pipe transport tends to increase and then decrease with the increase in the cement–sand ratio. This shows that at a certain ash–sand ratio, the pipe resistance will reach the maximum. Based on the above analysis, the order of sensitivity of the endogenous interaction terms affecting the pipe transport resistance of UCPB is mass concentration and slurry temperature (15.29) > mass concentration and cement–sand ratio (13.76) > cement–sand ratio and slurry temperature (1.20).

4.3. Effect of Exogenous Factors

4.3.1. Variance Analysis

Based on the response surface results, the variance table of response surface test analysis of UCPB resistance loss under the influence of exogenous factors was obtained and is shown in Table 11.
As can be seen from Table 11, the regression model, single factor term has a p value = 10−4 and F value > 1. This indicates that the regression model and single factor term are extremely significant. In the quadratic squared term, the p values of pipe diameter and flow velocity are 0.002 and 0.008, > 0.05, respectively, and the F value > 1. This shows that it is significant and statistically significant. While the p value for the stowing gradient squared term = 0.495 > 0.05 and the F value = 0.495 < 1, which indicates that this term is not significant and statistically significant. For the interaction term, only the interaction term between flow velocity and stowing gradient has a p value = 0.909 > 0.05 and a low F value. This suggests that it is not significant and statistically significant.
Based on the F values in the variance analysis table, it can be seen that the order of exogenous sensitivity affecting the pipe transport resistance of UCPB is pipe diameter (200.36) > flow velocity (51.74) > stowing gradient (49.98).

4.3.2. Exogenous Factor Interaction

Based on the response surface test results, 3D surface plots and contour plots are drawn for the interaction of pipe diameter, flow velocity and stowing gradient, as shown in Figure 11, Figure 12 and Figure 13.
From Figure 11, it can be seen that when the pipe diameter is 320 mm, the increase in UCPB pipe transport resistance with the increase in the flow velocity is gentler, but when the pipe diameter is 180 mm, the increase trend is significant and exponential. When the flow velocity increases from 1.4 to 2.2 m/s, the decreasing trend of the UCPB pipe resistance with increasing pipe diameter increases. Figure 12 shows that when the stowing gradient is fixed, the UCPB pipe resistance decreases with the increase in pipe diameter, and the decreasing trend increases with the increase in stowing gradient and then decreases. It can be seen from Figure 13 that when the stowing gradient is fixed, the UCPB pipe transport resistance increases with the increase in flow velocity. However, the increasing trend is similar between different values of stowing gradient, which indicates that the interaction between flow velocity and stowing gradient is weak. In summary, the sensitivity order of the interaction effect on the UCPB pipe transport resistance is pipe diameter and flow velocity (8.00) > pipe diameter and filling multiplier (5.68) > flow velocity and stowing gradient (0.01).

5. Engineering Optimization

5.1. Optimization Results

According to the data provided by the mine, the flow resistance loss of UCPB at this stage (L-pipe) is 57.44 kPa. After parameter optimization, when the pipe transport parameters remain unchanged, the optimized slurry proportioning parameters (Endogenous) are mass concentration 62.9 wt%, cement–sand ratio 1:6, slurry temperature 47.2 °C, and pipe transport resistance 42.90 kPa. When the UCPB property parameters remain unchanged, the optimized pipe transport parameters (Exogenous) are pipe diameter 320 mm, flow velocity 1.67 m/s, stowing gradient 3, and pipe transport resistance 48.36 kPa, which indicates that the UCPB pipe transport resistance is reduced after optimization of both endogenous and exogenous factors. The reduction rate of pipe resistance is 25.31% and 15.81%, respectively, which is a significant effect of optimization.

5.2. Results Validation

To verify the reliability of the optimized results, the simulation software was used to conduct five replicate tests to obtain the UCPB pipe transport resistance. If the mean value of resistance loss is within the 95% confidence interval level, the optimization results are proven to be reliable. The 95% confidence interval calculation method is shown in Equation (19) [50], and the simulation results of the validation test are shown in Table 12.
y ± t 1 α / 2 ( n p ) ( F i t S E ) 2 + M S E m
where y is the resistance loss of the UCPB pipeline transport under the optimization-seeking parameters; n is the number of response surface tests in solving the model; p is the number of regression model terms; FitSE is the standard error of fit; MSE is the mean square; m is the number of validation tests, and t1-α/2 is the t-statistic, which can be obtained from the database.
The calculated parameters, mean values of pipe transport resistance and confidence interval calculations in Equation (19) can be obtained based on the endogenous and exogenous factors response surface experimental design and t-statistic database, as shown in Table 13.
Comparing Table 12 and Table 13, it can be seen that the mean values of the UCPB pipe transport resistance in the validation test fall within the 95% confidence interval, which indicates that the search results are reliable and accurate.

6. Discussion

The results show that the categorization method proposed in this paper contributes to the optimization of the UCPB pipeline resistance, and the optimization effect is significant. The method reduces the complexity of adjusting the filling scheme and improves the operability of the optimization of the pipeline transport resistance. The method will be well applicable to either CPB or UCPB.

7. Conclusions

This paper classified and integrated the factors influencing UCPB pipe transport resistance and explored the significance and interaction of different types of factors on UCPB flow resistance loss by RSM. Finally, an optimization-seeking analysis was conducted on the filling pipe transport parameters of an iron ore mine in Hebei, China. The main conclusions are as follows:
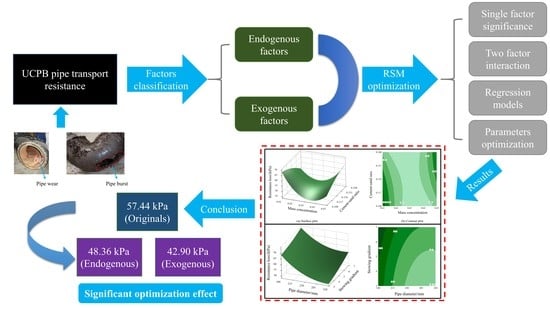
  • The influencing factors of UCPB resistance are categorized and integrated into endogenous and exogenous effects. The endogenous factors include mass concentration, cement–sand ratio, and slurry temperature, which change the plastic viscosity and yield stress of UCPB and thus the pipeline resistance. The exogenous factors include pipe diameter, flow velocity, and stowing gradient.
  • The sensitivity for the effect of endogenous factors on the UCPB pipe transport resistance is mass concentration > slurry temperature > cement–sand ratio. The sensitivity for the interaction effect is mass concentration and slurry temperature > mass concentration and cement–sand ratio > cement–sand ratio and slurry temperature. The sensitivity order of univariate factors for UCPB pipe transport resistance under the influence of exogenous factors is pipe diameter > flow velocity > stowing gradient. The order of sensitivity under the interaction effect is pipe diameter and flow velocity > pipe diameter and stowing gradient > flow velocity and stowing gradient.
  • Regression models were constructed for different categories of factors and UCPB pipe transport resistance. When the exogenous factors were fixed, the optimized UCPB properties were: 63% mass concentration, 1:6 cement–sand ratio, and 47.2 °C slurry temperature. When the endogenous factors were fixed, the optimized pipe design parameters were: pipe diameter 320 mm, flow velocity 1.67 m/s, and stowing gradient 3. The mine should make corresponding changes to the filling pipeline design based on the comprehensive analysis of economy and convenience to reduce the pipeline resistance.
In the future, the authors will be devoted to researching more methods of pipe transport resistance optimization. Mines should be guided by the green development of resources and should realize waste-free mining in mines by using solid waste tailings materials. In addition, economy and convenience are to be considered comprehensively when carrying out optimization of pipe transport parameters. A suitable method for mine engineering is adopted for the correction of design parameters.

Author Contributions

H.S., Writing—original draft, Formal analysis, Validation, Visualization, Methodology. D.G., Funding acquisition, Conceptualization, Writing—review and editing, Resources. Z.X., Supervision, Writing—review and editing. Y.Z., Data curation. All authors have read and agreed to the published version of the manuscript.

Funding

This work was supported by the National Natural Science Foundation of China (nos. 51774137, 52074124).

Data Availability Statement

The data for this study all appear in the article.

Conflicts of Interest

The authors declare no conflict of interest.

References

  1. Kleib, J.; Amar, M.; Aouad, G.; Bourbon, X.; Benzerzour, M.; Abriak, N.-E. The Use of Callovo-Oxfordian Argillite as a Raw Material for Portland Cement Clinker Production. Buildings 2022, 12, 1421. [Google Scholar] [CrossRef]
  2. Daher, J.; Kleib, J.; Benzerzour, M.; Abriak, N.-E.; Aouad, G. Recycling of Flash-Calcined Dredged Sediment for Concrete 3D Printing. Buildings 2022, 12, 1400. [Google Scholar] [CrossRef]
  3. Jiao, H.Z.; Chen, W.L.; Wu, A.X.; Yu, Y.; Ruan, Z.E.; Honaker, R.; Chen, X.M.; Yu, J.X. Flocculated unclassified tailings settling efficiency improvement by particle collision optimization in the feedwell. Int. J. Miner. Metall. Mater. 2022. [Google Scholar] [CrossRef]
  4. Kragović, M.; Stojmenović, M.; Ristić, N.; Milićević, S.; Živković, S.; Liu, S.-K.; Gulicovski, J. Application of the Hazardous Waste Vitreous Enamel Generated in the Production Process of Heating Devices as a Partial Replacement for Cement. Buildings 2022, 12, 1287. [Google Scholar] [CrossRef]
  5. Bartulović, B.; Juradin, S.; Žižić, D.; Galić, M. Influence of Cotton Knitted Fabric Waste Addition on Concrete Properties. Buildings. 2022, 12, 1121. [Google Scholar] [CrossRef]
  6. Jiao, H.Z.; Wu, Y.C.; Wang, H.; Chen, X.M.; Li, Z.; Wang, Y.F.; Zhang, B.Y.; Liu, J.H. Micro-scale mechanism of sealed water seepage and thickening from tailings bed in rake shearing thickener. Miner. Eng. 2021, 173, 107043. [Google Scholar] [CrossRef]
  7. Suppes, R.; Heuss-aßbichlerc, S. Resource potential of mine wastes: A conventional and sustainable perspective on a case study tailings mining project. J. Cleaner Prod. 2021, 297, 126446. [Google Scholar] [CrossRef]
  8. Bilibio, C.; Retz, S.; Schellert, C.; Hensel, O. Drainage properties of technosols made of municipal solid waste incineration bottom ash and coal combustion residues on potash-tailings piles: A lysimeter study. J. Clean. Prod. 2021, 279, 123442. [Google Scholar] [CrossRef]
  9. Li, Z.F.; Zhang, J.; Li, S.C.; Lin, C.J.; Gao, Y.F.; Liu, C. Feasibility of preparing red mud-based cementitious materials: Synergistic utilization of industrial solid waste, waste heat, and tail gas. J. Clean. Prod. 2021, 285, 124896. [Google Scholar] [CrossRef]
  10. Guo, D.F.; Hou, H.M.; Long, J.; Guo, X.Y.; Xu, H. Underestimated environmental benefits of tailings resource utilization: Evidence from a life cycle perspective. Environ. Impact Asses. 2022, 96, 106832. [Google Scholar] [CrossRef]
  11. Wu, F.; Liu, X.; Qu, G.; Ning, P.; Jin, C.; Cui, Q.; Ren, Y.; He, M.; Yang, Y.; Li, J. Solidification and stabilization of harmful elements in antimony tailings and synergistic utilization of multiple solid wastes. Cem. Concr. Compos. 2022, 133, 104718. [Google Scholar] [CrossRef]
  12. Gao, W.; Ni, W.; Zhang, Y.Y.; Li, Y.Y.; Shi, T.Y.; Li, Z.F. Investigation into the semi-dynamic leaching characteristics of arsenic and antimony from solidified/stabilized tailings using metallurgical slag-based binders. J. Hazard. Mater. 2020, 381, 120992. [Google Scholar] [CrossRef] [PubMed]
  13. Li, Y.Y.; Ni, W.; Gao, W.; Zhang, S.Q.; Fu, Q.F.; Li, Y. Study on Solidification and Stabilization of Antimony-Containing Tailings with Metallurgical Slag-Based Binders. Mater 2022, 15, 1780. [Google Scholar] [CrossRef] [PubMed]
  14. Adigamov, A.; Zotov, V.; Kovalev, R.; Kopylov, A. Calculation of transportation of the stowing composite based on the waste of water-soluble ores. Transport. Res. Procedia. 2021, 57, 17–23. [Google Scholar] [CrossRef]
  15. Khayrutdinov, M.M.; Kongar-Syuryun, C.B.; Tyulyaeva, Y.S.; Khayrutdinov, A.M. Cementless backfill mixtures based on water-soluble manmade waste. Bull. Tomsk. Polytech. 2020, 331, 30–36. [Google Scholar]
  16. Ermolovich, E.A.; Ivannikov, A.L.; Khayrutdinov, M.M.; Kongar-Syuryun, C.B.; Tyulyaeva, Y.S. Creation of a Nanomodified Backfill Based on the Waste from Enrichment of Water-Soluble Ores. Materials 2022, 15, 3689. [Google Scholar] [CrossRef]
  17. Cao, H.; Gao, Q.; Zhang, X.Z. Research Progress and Development Direction of Filling Cementing Materials for Filling Mining in Iron Mines of China. Gels 2022, 8, 192. [Google Scholar] [CrossRef]
  18. Wu, J.; Feng, M.; Xu, J.; Qiu, P.; Wang, Y.; Han, G. Particle Size Distribution of Cemented Rockfill Effects on Strata Stability in Filling Mining. Miner 2018, 8, 407. [Google Scholar] [CrossRef] [Green Version]
  19. Xing, B.D.; Fan, W.Y.; Lyu, Y.C.; Sun, H.D.; Che, J.L. Influence of particle mineralogy and size on the morphological characteristics of mineral fillers. J. Mater. Res. Technol. 2021, 15, 3995–4009. [Google Scholar] [CrossRef]
  20. Xue, Z.L.; Gan, D.Q.; Zhang, Y.Z.; Liu, Z.Y. Rheological behavior of ultrafine-tailings cemented paste backfill in high-temperature mining conditions. Constr. Build. Mater. 2020, 253, 119212. [Google Scholar] [CrossRef]
  21. Li, M.; Xiang, Y.; Chen, T.; Gao, X.; Liu, Q. Separation of ultra-fine hematite and quartz particles using asynchronous flocculation flotation. Miner. Eng. 2021, 164, 106817. [Google Scholar] [CrossRef]
  22. Guo, Z.B.; Qiu, J.P.; Jiang, H.Q.; Xing, J.; Sun, X.G.; Ma, Z.Y. Flowability of ultrafine-tailings cemented paste backfill incorporating superplasticizer: Insight from water film thickness theory. Powder Technol. 2021, 381, 509–517. [Google Scholar] [CrossRef]
  23. Li, S.; Wang, X.M.; Zhang, Q.L. Dynamic experiments on flocculation and sedimentation of argillized ultrafine tailings using fly-ash-based magnetic coagulant. Trans. Nonferrous Met. Soc. China. 2016, 26, 1975–1984. [Google Scholar] [CrossRef]
  24. Wei, C.B.; Apel, D.; Zhang, Y.H. Shear behavior of ultrafine magnetite tailings subjected to freeze-thaw cycles. Int. J. Min. Sci. Technol. 2019, 29, 609–616. [Google Scholar] [CrossRef]
  25. Amaral, L.M.D.; Rodrigues, C.; Poggiali, F. Hornification on vegetable fibers to improve fiber-cement composites: A critical review. J. Build. Eng. 2021, 48, 103947. [Google Scholar] [CrossRef]
  26. Thanushan, K.; Sathiparan, N. Mechanical Performance and Durability of Banana Fibre and Coconut Coir Reinforced Cement Stabilized Earth Blocks. SSRN Electron. J. 2021, 21, 101309. [Google Scholar] [CrossRef]
  27. Zhao, Y.L.; Ma, Z.Y.; Qiu, J.P.; Sun, X.G.; Gu, X.W. Experimental study on the utilization of steel slag for cemented ultra-fine tailings backfill. Powder Technol. 2020, 375, 284–291. [Google Scholar]
  28. Zhang, M.; Li, K.; Ni, W.; Zhang, S.; Liu, Z.; Wang, K.; Wei, X.; Yu, Y. Preparation of mine backfilling from steel slag-based non-clinker combined with ultra-fine tailing. Constr. Build. Mater. 2022, 320, 126248. [Google Scholar] [CrossRef]
  29. Panda, L.; Biswal, S.K.; Venugopal, R. Recovery of Ultra-Fine Iron Ore from Iron Ore Tailings. Trans. Indian Inst. Met. 2018, 71, 463–468. [Google Scholar] [CrossRef]
  30. Li, W.C.; Fall, M. Strength and self-desiccation of slag-cemented paste backfill at early ages: Link to initial sulphate concentration. Cem. Concr. Compos. 2018, 89, 160–168. [Google Scholar] [CrossRef]
  31. Xin, J.; Liu, L.; Long, H.X.; Wang, J.Y.; Yang, P.; Qu, H.S. A preliminary study of aeolian sand-cement-modified gasification slag-paste backfill: Fluidity, microstructure, and leaching risks. Sci. Total Environ. 2022, 830, 154766. [Google Scholar] [CrossRef] [PubMed]
  32. Kaushal, D.R.; Sato, K.; Toyota, T.; Funatsu, K.; Tomita, Y. Effect of particle size distribution on pressure drop and concentration profile in pipeline flow of highly concentrated slurry. Int. J. Multiph. Flow. 2005, 31, 809–823. [Google Scholar] [CrossRef]
  33. Ren, W.; Gao, R.; Zhang, Y.; Hou, M. Rheological Properties of Ultra-Fine Tailings Cemented Paste Backfill under Ultrasonic Wave Action. Minerals 2021, 11, 718. [Google Scholar] [CrossRef]
  34. Cheng, H.Y.; Wu, S.C.; Li, H.; Zhang, X.Q. Utilization of mill tailings, fly ash and slag as mine paste backfill material: Review and future perspective. Constr. Build. Mater. 2020, 231, 117117. [Google Scholar] [CrossRef]
  35. Zhou, S.H.; Li, X.; Ji, C.; Xiao, J. Back-fill grout experimental test for discharged soils reuse of the large-diameter size slurry shield tunnel. KSCE J. Civ. Eng. 2017, 21, 725–733. [Google Scholar] [CrossRef]
  36. Wu, A.; Ruan, Z.; Bürger, R.; Yin, S.; Wang, J.; Wang, Y. Optimization of flocculation and settling parameters of tailings slurry by response surface methodology. Miner. Eng. 2020, 156, 106488. [Google Scholar] [CrossRef]
  37. Bayramov, F.; Taşdemir, C.; Taşdemir, M.A. Optimization of steel fiber reinforced concretes by means of statistical response surface method. Cem. Concr. Compos. 2004, 26, 665–675. [Google Scholar] [CrossRef]
  38. Mohammed, B.S.; Fang, O.C.; Hossain, K.M.A.; Lachemi, M. Mix proportioning of concrete containing paper mill residuals using response surface methodology. Constr. Build. Mater. 2012, 35, 63–68. [Google Scholar] [CrossRef]
  39. Fall, M.; Benzaazoua, M.; Saa, E.G. Mix proportioning of underground cemented tailings backfill. Tunn. Undergr. Sp. Tech. 2008, 23, 80–90. [Google Scholar] [CrossRef]
  40. Ofuyatan, O.M.; Agbawhe, O.B.; Omole, D.O.; Igwegbe, C.A.; Ighalo, J.O. RSM and ANN modelling of the mechanical properties of self-compacting concrete with silica fume and plastic waste as partial constituent replacement. Clean. Mater. 2022, 4, 100065. [Google Scholar] [CrossRef]
  41. Zhu, L.L.; Jin, Z.H.; Zhao, Y.; Duan, Y. Rheological properties of cemented coal gangue backfill based on response surface methodology. Constr. Build. Mater. 2021, 306, 124836. [Google Scholar] [CrossRef]
  42. Hamada, H.M.; Al-Attar, A.A.; Tayeh, B.; Yahaya, F.B.M. Optimizing the concrete strength of lightweight concrete containing nano palm oil fuel ash and palm oil clinker using response surface method. Case Stud. Constr. Mat. 2022, 16, e01061. [Google Scholar] [CrossRef]
  43. Fauzi, M.A.; Arshad, M.F.; Md Nor, N.; Ghazali, E. Modeling and optimization of properties for unprocessed-fly ash (u-FA) controlled low-strength material as backfill materials. Clean. Eng. Tech. 2022, 6, 100395. [Google Scholar] [CrossRef]
  44. Long, T.Y.; Cai, Z.J. Fluid mechanics, 3rd ed.; China Architecture & Building Press: Beijing, China, 2019; pp. 92–118+177–218. [Google Scholar]
  45. Pragya, M.; Tiwari, A.K.; Chhabra, R.P. Effect of orientation on the drag of a cone settling in a Bingham plastic fluid. Particuology 2018, 43, 157–170. [Google Scholar]
  46. Naramgari, S.; Olubode, K.K.; Isaac, L.A. Modified kinematic viscosity model for 3D-Casson fluid flow within boundary layer formed on a surface at absolute zero. J. Mol. Liq. 2016, 221, 1197–1206. [Google Scholar]
  47. Gupta, A.K.; Mishra, P.; Chhabra, R.P. Momentum and heat transfer characteristics of a thin circular disk in Bingham plastic fluids. Numer. Heat Transfer. Part A 2017, 72, 844–868. [Google Scholar] [CrossRef]
  48. Chiloane, N.M.; Mulenga, F.K. Revisiting factors contributing to the strength of cemented backfill support system: A review. J. Rock Mech. Geotech. Eng. 2022. [Google Scholar] [CrossRef]
  49. Dalhat, N.M.; Sunday, O.O. K-nearest neighbor based computational intelligence and RSM predictive models for extraction of Cadmium from contaminated soil. Ain. Shams. Eng. J. 2022, 5, 101944. [Google Scholar] [CrossRef]
  50. Xu, X.H.; He, M.Z. Experimental Design and Application of Design-Expert and SPSS, 3rd ed.; Science Press: Beijing, China, 2010; pp. 59–88. [Google Scholar]
Figure 1. Flow model of UCPB in pipe [45,46].
Buildings 12 01697 g001
Figure 2. Classification and integration of factors affecting pipeline resistance.
Buildings 12 01697 g002
Figure 3. Wear diagram of backfill pipe.
Buildings 12 01697 g003
Figure 4. Accumulative tailing content and proportion curve of each particle size.
Buildings 12 01697 g004
Figure 5. UCPB flow pattern.
Buildings 12 01697 g005
Figure 6. Experimental flow chart.
Buildings 12 01697 g006
Figure 7. L-pipe transport model of UCPB.
Buildings 12 01697 g007
Figure 8. Interaction of mass concentration and cement–sand ratio with resistance loss: the other factor is held at the center level.
Buildings 12 01697 g008
Figure 9. Interaction of mass concentration and slurry temperature with resistance loss: the other factor is held at the center level.
Buildings 12 01697 g009
Figure 10. Interaction of cement–sand ratio and slurry temperature with resistance loss: the other factor is held at the center level.
Buildings 12 01697 g010
Figure 11. Interaction of pipe diameter and inlet velocity with resistance loss: the other factor is held at the center level.
Buildings 12 01697 g011
Figure 12. Interaction of pipe diameter and stowing gradient with resistance loss: the other factor is held at the center level.
Buildings 12 01697 g012
Figure 13. Interaction of inlet velocity and stowing gradient with resistance loss: the other factor is held at the center level.
Buildings 12 01697 g013
Table 1. Mine filling parameters.
Parameter TypeParameter NameParameter Value
Slurry PropertiesMass concentration/wt%62
Cement–sand ratio1:8
Slurry temperature/°C25
Pipe transport parametersPipe diameter/mm200
Flow velocity/(m·s−1)1.5
Stowing gradient5
Table 2. Physical properties of tailings.
d10/μmd30/μmd60/μmPW/μmSw /μmCcCn
1.392.677.107.296.7150.725.10
Note: dx denotes the value of x% tailings particle diameter by volume fraction less than dx μm. Cc coefficient of curvature (Cc = d30×d30/(d10×d60)). Cu Coefficient of uniformity (Cu = d60/d10). Pw denotes weighted mean particle size. Sw weighted standard deviation.
Table 3. Chemical composition and content of tailings.
Chemical CompositionTFeSiO2CaOMgOAl2O3
Content6.00%67.58%4.04%5.60%7.30%
Note: TFe denotes total iron.
Table 4. Plastic viscosity and yield stress of UCPB.
Cement–Sand RatioMass ConcentrationSlurry Temperature/°CPlastic Viscosity/Pa·sYield Stress/Pa
1:661 wt%300.69633.927
400.66931.661
500.65430.001
1:663 wt %300.80247.905
400.76243.177
500.74334.770
1:665 wt %301.091102.753
400.90282.224
500.89074.248
1:861 wt%300.64323.296
400.53510.455
500.4689.268
1:863 wt%300.71141.407
400.66437.315
500.63531.511
1:865 wt%300.78498.588
400.72280.211
500.70371.863
1:1061 wt%300.63616.108
400.5199.654
500.4466.837
1:1063 wt%300.68240.323
400.63333.015
500.62130.044
1:1065 wt%300.73686.201
400.71578.875
500.69867.014
Table 5. Experimental factor levels.
Factor TypeTest FactorsFactor Values
Endogenous effectMass concentration/wt%61, 63, 65
Cement–sand ratio1:10, 1:8, 1:6
Slurry temperature/°C30, 40, 50
Exogenous effectPipe diameter/mm180, 250, 320
Flow velocity/(m·s−1)1.4, 1.8, 2.2
Stowing gradient3, 5, 7
Table 6. Endogenous factor parameters and level codes.
Test Level CodeMass Concentration/wt%Cement–Sand RatioSlurry Temperature/°C
−1611:1030
0631:840
1651:650
Table 7. Response surface test results of endogenous factors effect.
StandardRunningMass Concentration/wt%Cement–Sand RatioSlurry Temperature/°CResistance loss/kPa
131631:83049.068
102651:84056.422
63651:105047.354
204631:84048.889
125631:64041.982
46651:63084.032
57611:105074.382
28651:103061.268
189631:84048.686
110611:103061.246
1511631:84048.579
812651:65057.843
1713631:84046.778
914611:84070.212
1915631:84049.976
316611:63053.557
1617631:84042.796
718611:65059.273
1419631:85054.105
1120631:104053.287
Table 8. Exogenous factor parameters and level codes.
Test Level CodePipe Diameter/mmFlow Velocity/(m·s−1)Stowing Gradient
−11801.43
02501.85
13202.27
Table 9. Response surface results of exogenous factors effect.
StandardRunningPipe Diameter/mmFlow Velocity/(m·s−1)Stowing GradientResistance Loss/kPa
1412501.8761.668
1322501.8353.881
331802.2381.591
1142501.4557.865
551801.4771.851
663201.4760.908
473202.2355.242
283201.4350.648
1692501.8559.758
9101801.8570.470
10113201.8553.326
17122501.8558.211
7131802.2788.090
19142501.8559.779
15152501.8555.443
20162501.8554.598
18172501.8557.691
8183202.2766.911
1191801.4365.410
12202502.2563.180
Table 10. Variance analysis of endogenous response surface test.
SourceFreedomSum of SquaresMean SquareF Valuep ValueRemark
Regression model97.951820.883547.950.002Significant
Mass concentration12.319092.3190920.880.001Significant
Cement–sand ratio10.993670.993678.940.014Significant
Slurry temperature11.255761.2557611.300.007Significant
Mass concentration and Mass concentration12.326482.3264820.940.001Significant
Cement–sand ratio and Cement–sand ratio10.050870.050870.460.514-
Slurry temperature and Slurry temperature10.065790.065790.590.459-
Mass concentration and Cement–sand ratio11.528521.5285213.760.004Significant
Mass concentration and Slurry temperature11.698851.6988515.290.003Significant
Cement–sand ratio and Slurry temperature10.133480.133481.200.299-
Table 11. Variance analysis of exogenous response surface test.
SourceFreedomSum of SquaresMean SquareF Valuep ValueRemark
Regression model90.3784030.04204545.23<10−4Extremely significant
Pipe diameter10.1862570.186257200.36<10−4Extremely significant
Flow velocity10.0480950.04809551.74<10−4Extremely significant
Stowing gradient10.0464640.04646449.98<10−4Extremely significant
Pipe diameter and Pipe diameter10.0152810.01528116.440.002significant
Flow velocity and Flow velocity10.0101620.01016210.930.008significant
Stowing gradient and Stowing gradient10.0004650.0004650.500.495-
Pipe diameter and Flow velocity10.0074410.0074418.000.018significant
Pipe diameter and Stowing gradient10.0052810.0052815.680.038significant
Flow velocity and Stowing gradient10.0000130.0000130.010.909-
Table 12. Verification test results.
Test TypePipe Diameter/mmFlow Velocity/(m·s−1)Stowing GradientMass Concentration/wt%Cement–Sand RatioSlurry Temperature/°CResistance Loss/kPa
Endogenous
optimization
2001.5562.91:647.245.49
43.66
46.38
42.03
46.42
Exogenous
optimization
3201.673621:82548.33
51.50
44.42
49.07
49.65
Table 13. Comparison of pipe transport resistance mean values and confidence interval calculations.
Test TypenpFitSEMSEmt0.975(10)Resistance Loss Mean Value/kPa95% Confidence Interval
Endogenous201000.33330552.22844.80(37.15, 48.65)
Exogenous201000.03048952.22848.59(46.62, 50.10)
Publisher’s Note: MDPI stays neutral with regard to jurisdictional claims in published maps and institutional affiliations.

