


Critical Factors Affecting the Promotion of Emerging Information Technology in Prefabricated Building Projects: A Hybrid Evaluation Model


Abstract
1. Introduction
2. Literature Review
2.1. EIT in PBPs
2.2. Technology–Organization–Environment Framework
2.3. Critical Challenges of EIT Promotion in PBPs
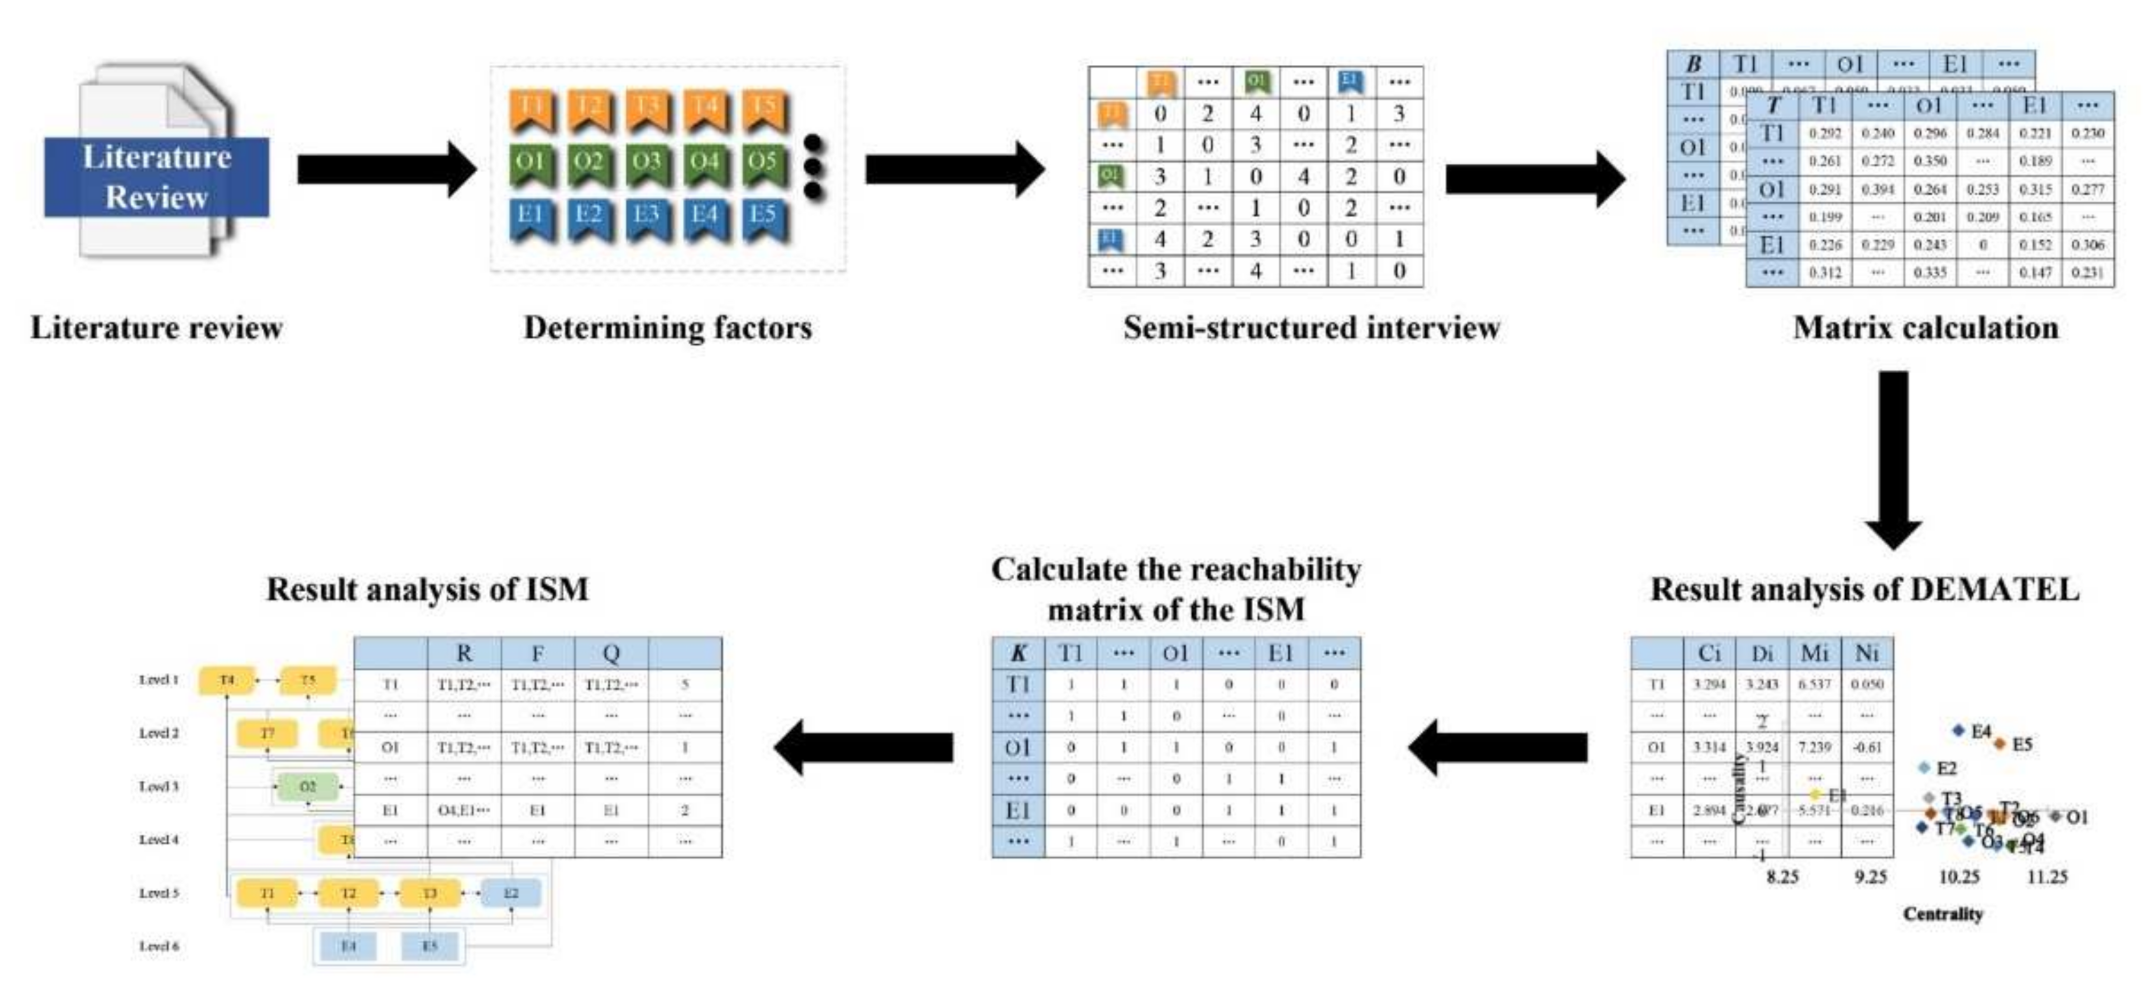
3. Methodology
3.1. Data Collection
3.2. Process Based on DEMATEL-ISM Method
- Determine the influencing factors of EIT adoption and promotion in PBPs. X represents the set of factors, and the factors are labeled as x1, x2,…, xn;
- Determine the direct influence matrix A. The semi-structured interview method was used to compare the influence of xi on xj and its degree of influence (0–4). The comparison of the factor with itself is considered to have no effect; that is, the value of the diagonal in the direct influence matrix is 0. Therefore, the matrix A is shown in Equation (1):
- 3.
- Calculate the normalized direct relation matrix B through the method of the largest sum of rows. In other words, summing each row of matrix A, and normalizing the values in matrix A according to the rows’ maximum value to obtain normative influence matrix B, whose expression is shown in Equation (2):
- 4.
- Calculate the comprehensive influence matrix T. Matrix T represents the comprehensive effect of the direct and indirect influences between the influencing factors. When the matrix B conducts successive self-multiplication, all the values of the matrix will approach 0, that is, limBk = 0. Its expression is shown in Equation (3):where I is the identity matrix of the same order as B;
- 5.
- Calculate the influencing degree, influenced degree, centrality, and causality of the factors. The influencing degree refers to the sum of the values of each row in the comprehensive influence matrix, which represents the comprehensive influence value of factor xi on all other factors, denoted as Ci. The influenced degree refers to the sum of the values of each column in matrix T, which means that xi receives the comprehensive influence of all other factors, which is denoted as Di. The centrality of xi (Mi) is the sum of its influencing and influenced degree, while the cause degree of xi (Ni) is the difference between its influencing and influenced degree. If Ni is greater than 0, then xi is the cause factor; otherwise, xi is the effect factor. The above calculation equation is shown in (4)–(7):
- 6.
- Determine the overall influence matrix E. The matrix E is composed of the matrix T plus the identity matrix I. Its expression is shown in Equation (8):
- 7.
- Determine the reachability matrix K. When calculating the reachability matrix, a threshold λ needs to be introduced to eliminate the relationship between factors with less influence and facilitate the division of the structural hierarchy.
- 8.
- Construct a multi-level ISM model. The hierarchical division needs to determine the antecedent set (F(xi)), reachable set (R(xi)), and common set (Q(xi)), which can be divided by Equations (11)–(13). If Q(xi) = R(xi), then factor xi belongs to the first level; and repeating Equations (11)–(13) can perform the hierarchical division for all factors:
4. Results and Analysis
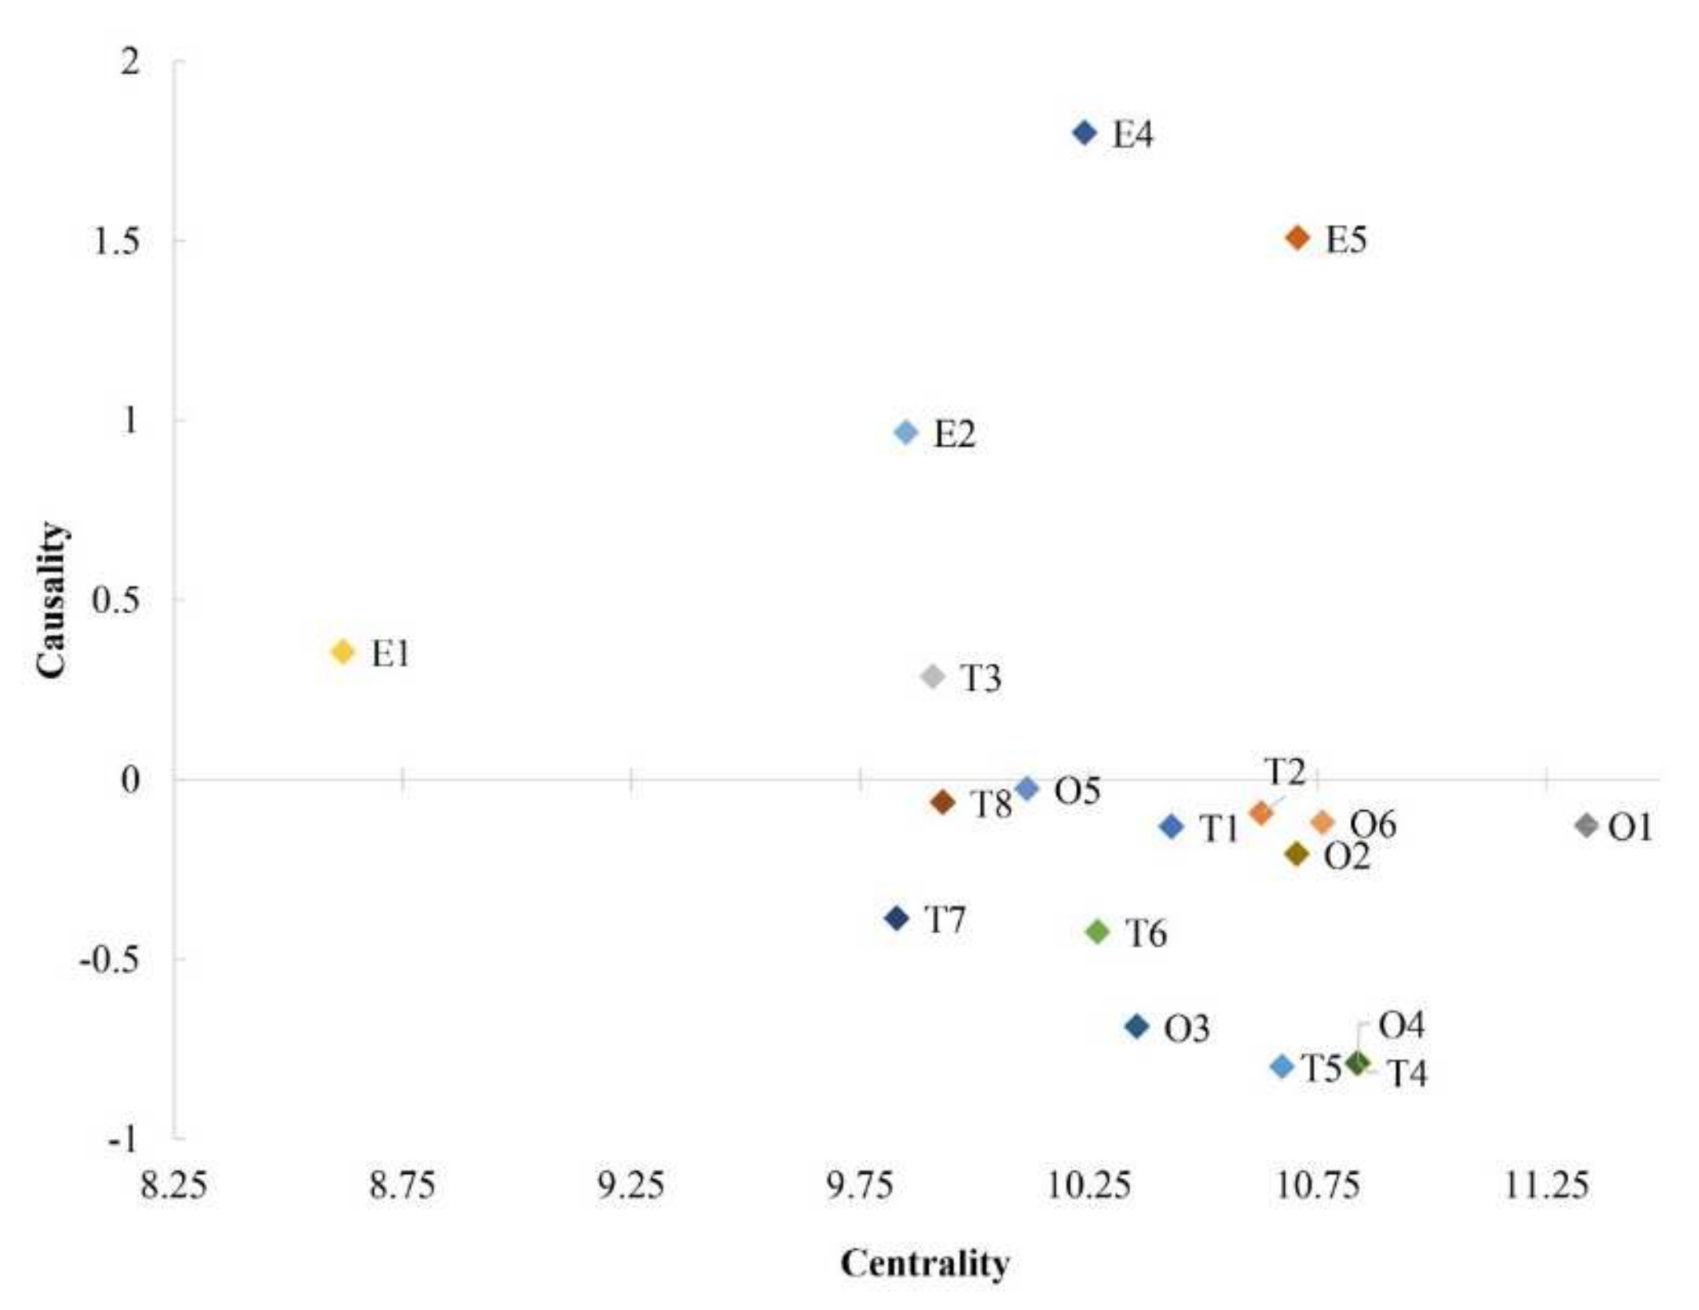
4.1. Result Analysis of DEMATEL
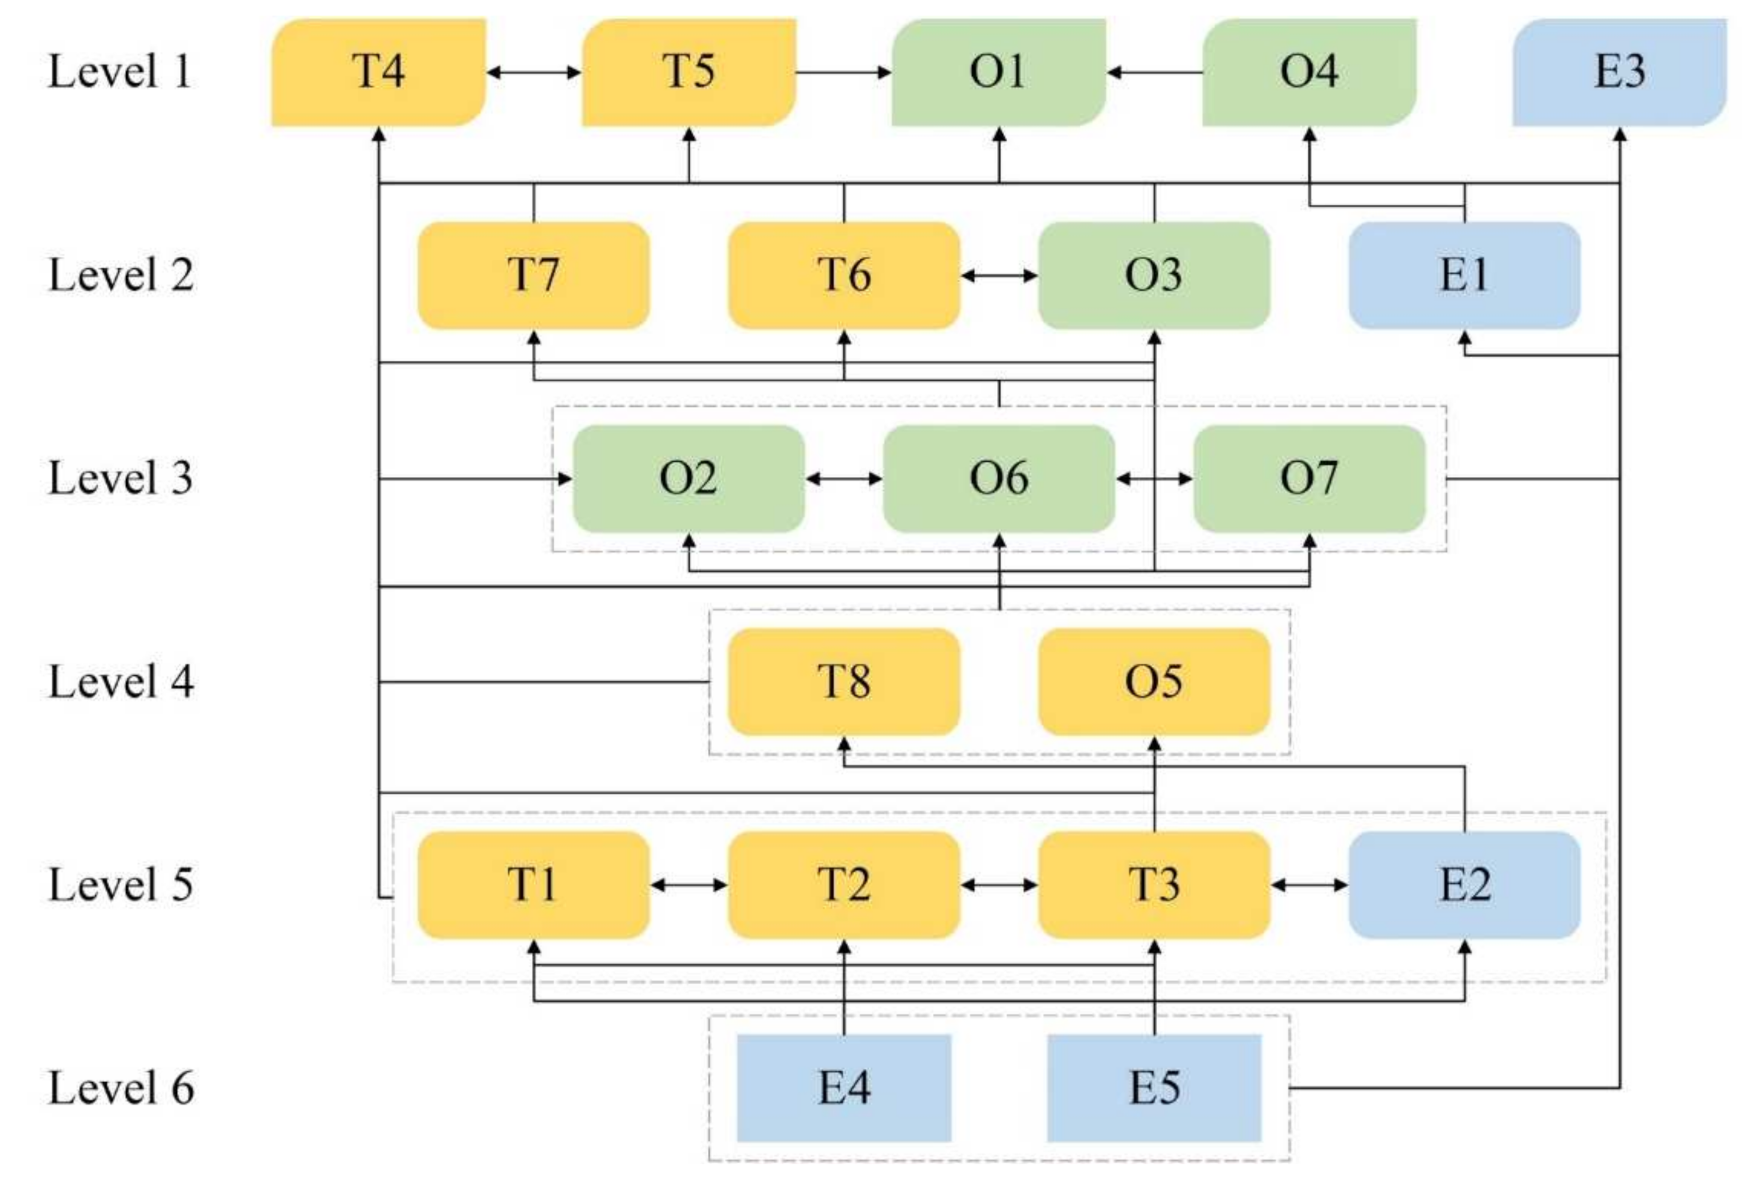
4.2. Result Analysis of ISM
5. Discussion and Recommendations
5.1. Discussion
5.2. Recommendations for Future Research
6. Conclusions
- Through the DEMATEL analysis, 20 influencing factors were divided into 6 cause factors and 14 effect factors. The evaluation results show that most of the cause factors belong to the environmental dimension, indicating that environmental factors have a significant influencing degree and can drive the adoption and promotion of EIT in BPBs. Although O1, O6, and O7 belong to the effect factors, they have a high influencing degree, influenced degree, and centrality at the same time, reflecting that the enterprises in PBPs are profit-oriented, and their decision-making power is in the hands of top managers;
- The ISM was used to develop the multilevel hierarchical model of 20 influencing factors, including direct factors (Level 1), middle factors (Level 2–4), and fundamental factors (Level 5), and to provide influence paths that promote EIT adoption and promotion. With the information provided by the model, researchers and industry practitioners can make targeted solutions to promote EIT in PBPs in actual projects.
Author Contributions
Funding
Institutional Review Board Statement
Informed Consent Statement
Data Availability Statement
Conflicts of Interest
References
- Innella, F.; Arashpour, M.; Bai, Y. Lean Methodologies and Techniques for Modular Construction: Chronological and Critical Review. J. Constr. Eng. Manag. 2019, 145, 04019076. [Google Scholar] [CrossRef]
- Li, L.; Li, Z.; Li, X.; Zhang, S.; Luo, X. A New Framework of Industrialized Construction in China: Towards on-Site Industrialization. J. Clean. Prod. 2020, 244, 118469. [Google Scholar] [CrossRef]
- Wu, Z.; Luo, L.; Li, H.; Wang, Y.; Bi, G.; Antwi-Afari, M.F. An Analysis on Promoting Prefabrication Implementation in Construction Industry towards Sustainability. Int. J. Environ. Res. Public Health 2021, 18, 11493. [Google Scholar] [CrossRef] [PubMed]
- Jin, R.; Gao, S.; Cheshmehzangi, A.; Aboagye-Nimo, E. A Holistic Review of Off-Site Construction Literature Published between 2008 and 2018. J. Clean. Prod. 2018, 202, 1202–1219. [Google Scholar] [CrossRef]
- Yu, T.; Man, Q.; Wang, Y.; Shen, G.Q.; Hong, J.; Zhang, J.; Zhong, J. Evaluating Different Stakeholder Impacts on the Occurrence of Quality Defects in Offsite Construction Projects: A Bayesian-Network-Based Model. J. Clean. Prod. 2019, 241, 118390. [Google Scholar] [CrossRef]
- Zhang, S.; Li, Z.; Li, T.; Yuan, M. A Holistic Literature Review of Building Information Modeling for Prefabricated Construction. J. Civ. Eng. Manag. 2021, 27, 485–499. [Google Scholar] [CrossRef]
- Teng, Y.; Mao, C.; Liu, G.; Wang, X. Analysis of Stakeholder Relationships in the Industry Chain of Industrialized Building in China. J. Clean. Prod. 2017, 152, 387–398. [Google Scholar] [CrossRef]
- Wang, Z.; Wang, T.; Hu, H.; Gong, J.; Ren, X.; Xiao, Q. Blockchain-Based Framework for Improving Supply Chain Traceability and Information Sharing in Precast Construction. Autom. Constr. 2020, 111, 103063. [Google Scholar] [CrossRef]
- Qin, X.; Shi, Y.; Lyu, K.; Mo, Y. Using a Tam-Toe Model to Explore Factors of Building Information Modelling (Bim) Adoption in the Construction Industry. J. Civ. Eng. Manag. 2020, 26, 259–277. [Google Scholar] [CrossRef]
- Ben Mahmoud, B.; Lehoux, N.; Blanchet, P.; Cloutier, C. Barriers, Strategies, and Best Practices for BIM Adoption in Quebec Prefabrication Small and Medium-Sized Enterprises (SMEs). Buildings 2022, 12, 390. [Google Scholar] [CrossRef]
- Chen, Y.; Yin, Y.; Browne, G.J.; Li, D. Adoption of Building Information Modeling in Chinese Construction Industry: The Technology-Organization-Environment Framework. Eng. Constr. Archit. Manag. 2019, 26, 1878–1898. [Google Scholar] [CrossRef]
- Qi, B.; Razkenari, M.; Li, J.; Costin, A.; Kibert, C.; Qian, S. Investigating U.S. Industry Practitioners’ Perspectives towards the Adoption of Emerging Technologies in Industrialized Construction. Buildings 2020, 10, 85. [Google Scholar] [CrossRef]
- Kamali, M.; Hewage, K. Life Cycle Performance of Modular Buildings: A Critical Review. Renew. Sustain. Energy Rev. 2016, 62, 1171–1183. [Google Scholar] [CrossRef]
- Goodier, C.; Gibb, A. Future Opportunities for Offsite in the UK. Constr. Manag. Econ. 2007, 25, 585–595. [Google Scholar] [CrossRef]
- Liu, D.; Li, X.; Chen, J.; Jin, R. Real-Time Optimization of Precast Concrete Component Transportation and Storage. Adv. Civ. Eng. 2020, 2020, 5714910. [Google Scholar] [CrossRef]
- Zhong, R.Y.; Peng, Y.; Xue, F.; Fang, J.; Zou, W.; Luo, H.; Thomas Ng, S.; Lu, W.; Shen, G.Q.P.; Huang, G.Q. Prefabricated Construction Enabled by the Internet-of-Things. Autom. Constr. 2017, 76, 59–70. [Google Scholar] [CrossRef]
- Zhai, Y.; Chen, K.; Zhou, J.X.; Cao, J.; Lyu, Z.; Jin, X.; Shen, G.Q.P.; Lu, W.; Huang, G.Q. An Internet of Things-Enabled BIM Platform for Modular Integrated Construction: A Case Study in Hong Kong. Adv. Eng. Inform. 2019, 42, 100997. [Google Scholar] [CrossRef]
- Cao, D.; Wang, G.; Li, H.; Skitmore, M.; Huang, T.; Zhang, W. Practices and Effectiveness of Building Information Modelling in Construction Projects in China. Autom. Constr. 2015, 49, 113–122. [Google Scholar] [CrossRef]
- Phang, T.C.H.; Chen, C.; Tiong, R.L.K. New Model for Identifying Critical Success Factors Influencing BIM Adoption from Precast Concrete Manufacturers’ View. J. Constr. Eng. Manag. 2020, 146, 04020014. [Google Scholar] [CrossRef]
- Li, C.Z.; Hong, J.; Xue, F.; Shen, G.Q.; Xu, X.; Luo, L. SWOT Analysis and Internet of Things-Enabled Platform for Prefabrication Housing Production in Hong Kong. Habitat Int. 2016, 57, 74–87. [Google Scholar] [CrossRef]
- Luo, L.; Jin, X.; Shen, G.Q.; Wang, Y.; Liang, X.; Li, X.; Li, C.Z. Supply Chain Management for Prefabricated Building Projects in Hong Kong. J. Manag. Eng. 2020, 36, 05020001. [Google Scholar] [CrossRef]
- Ding, W.; Jing, X.; Yan, Z.; Yang, L.T. A Survey on Data Fusion in Internet of Things: Towards Secure and Privacy-Preserving Fusion. Inf. Fusion 2019, 51, 129–144. [Google Scholar] [CrossRef]
- Tao, X.; Mao, C.; Xie, F.; Liu, G.; Xu, P.P. Greenhouse Gas Emission Monitoring System for Manufacturing Prefabricated Components. Autom. Constr. 2018, 93, 361–374. [Google Scholar] [CrossRef]
- Li, C.Z.; Xue, F.; Li, X.; Hong, J.; Shen, G.Q. An Internet of Things-Enabled BIM Platform for on-Site Assembly Services in Prefabricated Construction. Autom. Constr. 2018, 89, 146–161. [Google Scholar] [CrossRef]
- Zheng, S.; Si, H.; Zhang, L. The Empirical Research of BIM Technology Adoption Intention Based on UTAUT. Sci. Technol. Manag. Res. 2018, 36, 323–326. [Google Scholar] [CrossRef]
- Le, Y.; Zheng, S.; Li, Y.; Lu, Y.; Bai, J. Study on the Value Flows and Driver Paths of BIM Technology Application Based on SVN. J. Ind. Eng. Manag. 2018, 32, 71–78. [Google Scholar] [CrossRef]
- Azhar, S.; Hein, M.; Sketo, B. Building Information Modeling (BIM): Benefits, Risks and Challenges Related Papers. In Proceedings of the 44th Annual Conference, Auburn, AL, USA, 2–5 April 2008. [Google Scholar]
- Oesterreich, T.D.; Teuteberg, F. Understanding the Implications of Digitisation and Automation in the Context of Industry 4.0: A Triangulation Approach and Elements of a Research Agenda for the Construction Industry. Comput. Ind. 2016, 83, 121–139. [Google Scholar] [CrossRef]
- Li, C.Z.; Hu, M.; Xiao, B.; Chen, Z.; Tam, V.W.Y.; Zhao, Y. Mapping the Knowledge Domains of Emerging Advanced Technologies in the Management of Prefabricated Construction. Sustainability 2021, 13, 8800. [Google Scholar] [CrossRef]
- Oztemel, E.; Gursev, S. Literature Review of Industry 4.0 and Related Technologies. J. Intell. Manuf. 2020, 31, 127–182. [Google Scholar] [CrossRef]
- Qi, B.; Razkenari, M.; Costin, A.; Kibert, C.; Fu, M. A Systematic Review of Emerging Technologies in Industrialized Construction. J. Build. Eng. 2021, 39, 102265. [Google Scholar] [CrossRef]
- Zhang, C.; Hu, M.; Dong, L.; Xiang, P.; Zhang, Q.; Wu, J.; Li, B.; Shi, S. Co-Benefits of Urban Concrete Recycling on the Mitigation of Greenhouse Gas Emissions and Land Use Change: A Case in Chongqing Metropolis, China. J. Clean. Prod. 2018, 201, 481–498. [Google Scholar] [CrossRef]
- Qi, B.; Qian, S.; Costin, A. A Predictive Analysis on Emerging Technology Utilization in Industrialized Construction in the United States and China. Algorithms 2020, 13, 180. [Google Scholar] [CrossRef]
- Lu, Y. Industry 4.0: A Survey on Technologies, Applications and Open Research Issues. J. Ind. Inf. Integr. 2017, 6, 1–10. [Google Scholar] [CrossRef]
- Xu, L.D.; Xu, E.L.; Li, L. Industry 4.0: State of the Art and Future Trends. Int. J. Prod. Res. 2018, 56, 2941–2962. [Google Scholar] [CrossRef]
- Pan, Y.; Zhang, L. Roles of Artificial Intelligence in Construction Engineering and Management: A Critical Review and Future Trends. Autom. Constr. 2021, 122, 103517. [Google Scholar] [CrossRef]
- Zhu, K.; Kraemer, K.L.; Xu, S.; Dedrick, J. Information Technology Payoff in E-Business Environments: An International Perspective on Value Creation of E-Business in the Financial Services Industry. J. Manag. Inf. Syst. 2004, 21, 17–54. [Google Scholar] [CrossRef]
- Malik, S.; Chadhar, M.; Chetty, M. Factors Affecting the Organizational Adoption of Blockchain Technology: An Australian Perspective. In Proceedings of the 54th Hawaii International Conference on System Sciences, Maui, HI, USA, 5 January 2021; pp. 5597–5606. [Google Scholar] [CrossRef]
- Zhao, Y.; Sun, Y.; Zhou, Q. How A/E/C Professionals Accept BIM Technologies in China: A Technology Acceptance Model Perspective. Eng. Constr. Archit. Manag. 2022. ahead-of-print. [Google Scholar] [CrossRef]
- Lutfi, A.; Alsyouf, A.; Almaiah, M.A.; Alrawad, M.; Abdo, A.A.K.; Al-Khasawneh, A.L.; Ibrahim, N.; Saad, M. Factors Influencing the Adoption of Big Data Analytics in the Digital Transformation Era: Case Study of Jordanian SMEs. Sustainability 2022, 14, 1802. [Google Scholar] [CrossRef]
- Teo, T.S.H.; Devadoss, P.; Pan, S.L. Towards a Holistic Perspective of Customer Relationship Management (CRM) Implementation: A Case Study of the Housing and Development Board, Singapore. Decis. Support Syst. 2006, 42, 1613–1627. [Google Scholar] [CrossRef]
- Ma, G.; Jiang, S.; Jia, J. Investigating the Adoption of Social Media in the Construction Industry: Empirical Evidence from Project Teams in China. Eng. Constr. Archit. Manag. 2021. ahead-of-print. [Google Scholar] [CrossRef]
- Pan, M.; Pan, W. Determinants of Adoption of Robotics in Precast Concrete Production for Buildings. J. Manag. Eng. 2019, 35, 05019007. [Google Scholar] [CrossRef]
- Ahuja, R.; Sawhney, A.; Jain, M.; Arif, M.; Rakshit, S. Factors Influencing BIM Adoption in Emerging Markets—The Case of India. Int. J. Constr. Manag. 2020, 20, 65–76. [Google Scholar] [CrossRef]
- Won, J.; Lee, G.; Dossick, C.; Messner, J. Where to Focus for Successful Adoption of Building Information Modeling within Organization. J. Constr. Eng. Manag. 2013, 139, 04013014. [Google Scholar] [CrossRef]
- Qin, X.; Mancini, M.; Travaglini, A.; Lv, K.; Wang, M. A Comparative Study on Barriers between China and Italy in BIM Adoption from the Construction Market Perspective. Chin. J. Manag. 2016, 13, 1718–1727. [Google Scholar] [CrossRef]
- Arayici, Y.; Coates, P.; Koskela, L.; Kagioglou, M.; Usher, C.; O’Reilly, K. Technology Adoption in the BIM Implementation for Lean Architectural Practice. Autom. Constr. 2011, 20, 189–195. [Google Scholar] [CrossRef]
- Poulis, E.; Poulis, K.; Dooley, L. “Information Communication Technology” Innovation in a Non-High Technology Sector: Achieving Competitive Advantage in the Shipping Industry. Serv. Ind. J. 2013, 33, 594–608. [Google Scholar] [CrossRef]
- Gu, N.; London, K. Understanding and Facilitating BIM Adoption in the AEC Industry. Autom. Constr. 2010, 19, 988–999. [Google Scholar] [CrossRef]
- Grandon, E.E.; Pearson, J.M. Electronic Commerce Adoption: An Empirical Study of Small and Medium US Businesses. Inf. Manag. 2004, 42, 197–216. [Google Scholar] [CrossRef]
- Ahuja, R.; Jain, M.; Sawhney, A.; Arif, M. Adoption of BIM by Architectural Firms in India: Technology–Organization–Environment Perspective. Archit. Eng. Des. Manag. 2016, 12, 311–330. [Google Scholar] [CrossRef]
- Ramaji, I.J.; Memari, A.M.; Messner, J.I. Product-Oriented Information Delivery Framework for Multistory Modular Building Projects. J. Comput. Civ. Eng. 2017, 31, 04017001. [Google Scholar] [CrossRef]
- Pradhananga, P.; ElZomor, M.; Santi Kasabdji, G. Identifying the Challenges to Adopting Robotics in the US Construction Industry. J. Constr. Eng. Manag. 2021, 147, 05021003. [Google Scholar] [CrossRef]
- Lee, S.; Yu, J.; Jeong, D. BIM Acceptance Model in Construction Organizations. J. Manag. Eng. 2015, 31, 04014048. [Google Scholar] [CrossRef]
- Hosseini, M.R.; Azari, E.; Tivendale, L.; Chileshe, N. Barriers to Adoption of Building Information Modeling (BIM) in Iran: Preliminary Results. In Proceedings of the 6th International Conference on Engineering, Project, and Production Management (EPPM2015), Gold Coast, Australia, 2–4 September 2015; pp. 384–394. [Google Scholar] [CrossRef]
- Costin, A.; Eastman, C. Need for Interoperability to Enable Seamless Information Exchanges in Smart and Sustainable Urban Systems. J. Comput. Civ. Eng. 2019, 33, 04019008. [Google Scholar] [CrossRef]
- Solihin, W.; Eastman, C. Classification of Rules for Automated BIM Rule Checking Development. Autom. Constr. 2015, 53, 69–82. [Google Scholar] [CrossRef]
- Tsai, M.H.; Mom, M.; Hsieh, S.H. Developing Critical Success Factors for the Assessment of BIM Technology Adoption: Part I. Methodology and Survey. J. Chin. Inst. Eng. Trans. Chin. Inst. Eng. A 2014, 37, 845–858. [Google Scholar] [CrossRef]
- Amuda-Yusuf, G. Critical Success Factors for Building Information Modelling Implementation. Constr. Econ. Build. 2018, 18, 55–73. [Google Scholar] [CrossRef]
- Liao, L.; Teo, E.A.L. Critical Success Factors for Enhancing the Building Information Modelling Implementation in Building Projects in Singapore. J. Civ. Eng. Manag. 2017, 23, 1029–1044. [Google Scholar] [CrossRef]
- Davila Delgado, J.M.; Oyedele, L.; Ajayi, A.; Akanbi, L.; Akinade, O.; Bilal, M.; Owolabi, H. Robotics and Automated Systems in Construction: Understanding Industry-Specific Challenges for Adoption. J. Build. Eng. 2019, 26, 100868. [Google Scholar] [CrossRef]
- Stanley, R.; Thurnell, D. The Benefits of, and Barriers to, Implementation of 5D BIM for Quantity Surveying in New Zealand. Australas. J. Constr. Econ. Build. 2014, 14, 105–117. [Google Scholar] [CrossRef]
- Minichiello, V.; Aroni, R.; Hays, T. In-Depth Interviewing: Principles, Techniques, Analysis; Pearson Education Australia: Frenchs Forest, Australia, 2008; Available online: https://hdl.handle.net/1959.11/2448 (accessed on 1 September 2022).
- Young, J.C.; Rose, D.C.; Mumby, H.S.; Benitez-Capistros, F.; Derrick, C.J.; Finch, T.; Garcia, C.; Home, C.; Marwaha, E.; Morgans, C.; et al. A Methodological Guide to Using and Reporting on Interviews in Conservation Science Research. Methods Ecol. Evol. 2018, 9, 10–19. [Google Scholar] [CrossRef]
- Bosch, A.; Volker, L.; Koutamanis, A. BIM in the Operations Stage: Bottlenecks and Implications for Owners. Built Environ. Proj. Asset Manag. 2015, 5, 331–343. [Google Scholar] [CrossRef]
- Yazdi, M.; Khan, F.; Abbassi, R.; Rusli, R. Improved DEMATEL Methodology for Effective Safety Management Decision-Making. Saf. Sci. 2020, 127, 104705. [Google Scholar] [CrossRef]
- Keskin, G.A. Using Integrated Fuzzy DEMATEL and Fuzzy C: Means Algorithm for Supplier Evaluation and Selection. Int. J. Prod. Res. 2015, 53, 3586–3602. [Google Scholar] [CrossRef]
- Lin, R.J. Using Fuzzy DEMATEL to Evaluate the Green Supply Chain Management Practices. J. Clean. Prod. 2013, 40, 32–39. [Google Scholar] [CrossRef]
- Yadegaridehkordi, E.; Hourmand, M.; Nilashi, M.; Alsolami, E.; Samad, S.; Mahmoud, M.; Alarood, A.A.; Zainol, A.; Majeed, H.D.; Shuib, L. Assessment of Sustainability Indicators for Green Building Manufacturing Using Fuzzy Multi-Criteria Decision Making Approach. J. Clean. Prod. 2020, 277, 122905. [Google Scholar] [CrossRef]
- Wang, W.; Zhu, Z.; Mi, H.; Wang, J.; Liu, Y.; Jiang, X. Pursuit and Determination of the Influential Factors of the Urban Underground Integrated Pipe Gallery Fire Accidents Based on the DEMATEL-ISM. J. Saf. Environ. 2020, 20, 793–800. [Google Scholar] [CrossRef]
- Tzeng, G.H.; Chiang, C.H.; Li, C.W. Evaluating Intertwined Effects in E-Learning Programs: A Novel Hybrid MCDM Model Based on Factor Analysis and DEMATEL. Expert Syst. Appl. 2007, 32, 1028–1044. [Google Scholar] [CrossRef]
- Hsu, C.Y.; Chen, K.T.; Tzeng, G.H. FMCDM with Fuzzy DEMATEL Approach for Customers’ Choice Behavior Model. Int. J. Fuzzy Syst. 2007, 9, 236–246. [Google Scholar]
- Rezahoseini, A.; Ahmadi, E.; Saremi, P.; BagherPour, M. Implementation of Building Information Modeling (BIM) Using Hybrid Z-DEMATEL-ISM Approach. Adv. Civ. Eng. 2021, 2021, 6686761. [Google Scholar] [CrossRef]
- Li, G.; Yan, Y.; Liu, W.; Chen, Y.; Wu, Z. Research on Formation Factors of Miners’ Unsafe Emotions Based on DEMATEL-ISM. China Saf. Sci. J. 2021, 31, 30–37. [Google Scholar] [CrossRef]
- Sharma, M.; Joshi, S.; Kannan, D.; Govindan, K.; Singh, R.; Purohit, H.C. Internet of Things (IoT) Adoption Barriers of Smart Cities’ Waste Management: An Indian Context. J. Clean. Prod. 2020, 270, 122047. [Google Scholar] [CrossRef]
- Gangwar, H.; Date, H.; Ramaswamy, R. Understanding Determinants of Cloud Computing Adoption Using an Integrated TAM-TOE Model. J. Enterp. Inf. Manag. 2015, 28, 107–130. [Google Scholar] [CrossRef]
- Brewer, G.; Gajendran, T. Attitudes, Behaviours and the Transmission of Cultural Traits: Impacts on ICT/BIM Use in a Project Team. Constr. Innov. 2012, 12, 198–215. [Google Scholar] [CrossRef]
- Cao, D.; Li, H.; Wang, G. Impacts of Isomorphic Pressures on BIM Adoption in Construction Projects. J. Constr. Eng. Manag. 2014, 140, 04014056. [Google Scholar] [CrossRef]
- Ding, Z.; Zuo, J.; Wu, J.; Wang, J.Y. Key Factors for the BIM Adoption by Architects: A China Study. Eng. Constr. Archit. Manag. 2015, 22, 732–748. [Google Scholar] [CrossRef]
- Ku, K.; Taiebat, M. BIM Experiences and Expectations: The Constructors’ Perspective. Int. J. Constr. Educ. Res. 2011, 7, 175–197. [Google Scholar] [CrossRef]
- Tsai, M.H.; Kang, S.C.; Hsieh, S.H. Lessons Learnt from Customization of a BIM Tool for a Design-Build Company. J. Chin. Inst. Eng. Trans. Chin. Inst. Eng. A 2014, 37, 189–199. [Google Scholar] [CrossRef]
- Cao, J.; Chen, C. Analysis of the Strategy of Government’s BIM under the International Comparative Perspective. In Proceedings of the 2017 3rd International Forum on Energy, Environment Science and Materials (IFEESM 2017), Shenzhen, China, 25–26 November 2017. [Google Scholar] [CrossRef]
- Mahalingam, A.; Yadav, A.K.; Varaprasad, J. Investigating the Role of Lean Practices in Enabling BIM Adoption: Evidence from Two Indian Cases. J. Constr. Eng. Manag. 2015, 141, 05015006. [Google Scholar] [CrossRef]
- Jin, R.; Hancock, C.M.; Tang, L.; Wanatowski, D. BIM Investment, Returns, and Risks in China’s AEC Industries. J. Constr. Eng. Manag. 2017, 143, 04017089. [Google Scholar] [CrossRef]
- Ling, Y. Research on Construction Enterprise Acceptance of BIM Technology. Constr. Econ. 2015, 36, 21–26. [Google Scholar] [CrossRef]
- Lim, J.N. The Government as Marketer of Innovation. Eng. Constr. Archit. Manag. 2014, 21, 551–570. [Google Scholar] [CrossRef]


| Dimension | Code | Factors | Reference |
|---|---|---|---|
| Technological | TE1 | Integrating the workflows in PBPs | [11,48] |
| TE2 | Matching the workflows in PBPs | [11,46,49] | |
| TE3 | Complexity of EIT Implementation | [44,50,51,52] | |
| TE4 | Maturity of EIT | [9,19,39,43,53] | |
| TE5 | Standardization level of EIT | [9,19,45,54] | |
| TE6 | Interoperability between EITs | [12,34,55,56] | |
| TE7 | Continual updating of EIT | [10,12] | |
| TE8 | Ensure the security of information | [10,34,57] | |
| Organizational | OR1 | Attitudes of top management towards EIT | [11,19,44,58] |
| OR2 | Organizational structure to support EIT | [19,47,49] | |
| OR3 | EIT training programs | [45,59,60] | |
| OR4 | Acquire professional knowledge and talents related to EIT | [12,46,61] | |
| OR5 | Change-resistant attitudes in PBPs | [53,62] | |
| OR6 | The cost of applying, training, updating and development EIT | [9,10,19,39,44,53] | |
| OR7 | The benefit of adopting EIT | [9,19,53] | |
| Environmental | EN1 | Pressure on competitors to adopt EIT in PBPs | [11,39,43,53] |
| EN2 | Customer demand for EIT in PBPs | [11,43,44] | |
| EN3 | Pressure on partners to adopt EIT in PBPs | [9,11,43] | |
| EN4 | EIT-related national policy requirements | [12,19,43,53] | |
| EN5 | The need for EIT in PBPs | [11,39,43] |
| Categories | Respondent Types | Number of Respondents | Percentage (%) |
|---|---|---|---|
| Occupation type | Designers | 2 | 33.3% |
| Manufacturers | 1 | 16.7% | |
| Contractors | 1 | 16.7% | |
| Research units | 2 | 33.3% | |
| Educational background | Ph.D. | 2 | 33.3% |
| Master’s degree | 1 | 16.7% | |
| Undergraduate or below | 3 | 50% | |
| Years of experience in EIT | 6–10 | 1 | 16.7% |
| 3–5 | 3 | 50% | |
| <3 | 2 | 33.3% |
| T1 | T2 | T3 | T4 | T5 | T6 | T7 | T8 | O1 | O2 | O3 | O4 | O5 | O6 | O7 | E1 | E2 | E3 | E4 | E5 | |
|---|---|---|---|---|---|---|---|---|---|---|---|---|---|---|---|---|---|---|---|---|
| T1 | 0 | 4 | 2 | 3 | 4 | 3 | 2 | 2 | 3 | 3 | 2 | 2 | 3 | 3 | 3 | 2 | 2 | 2 | 2 | 3 |
| T2 | 4 | 0 | 2 | 3 | 3 | 3 | 2 | 2 | 3 | 3 | 3 | 3 | 3 | 3 | 3 | 1 | 2 | 2 | 3 | 3 |
| T3 | 3 | 3 | 0 | 4 | 3 | 4 | 3 | 2 | 2 | 2 | 3 | 3 | 3 | 3 | 3 | 2 | 2 | 2 | 1 | 2 |
| T4 | 3 | 3 | 2 | 0 | 3 | 3 | 3 | 3 | 3 | 3 | 2 | 3 | 2 | 3 | 2 | 2 | 3 | 2 | 2 | 2 |
| T5 | 3 | 3 | 3 | 3 | 0 | 3 | 3 | 2 | 3 | 3 | 3 | 3 | 2 | 2 | 3 | 1 | 2 | 2 | 2 | 2 |
| T6 | 3 | 3 | 2 | 3 | 3 | 0 | 3 | 3 | 3 | 2 | 3 | 3 | 2 | 2 | 3 | 2 | 2 | 2 | 2 | 2 |
| T7 | 2 | 2 | 3 | 3 | 3 | 3 | 0 | 3 | 3 | 2 | 2 | 3 | 2 | 3 | 2 | 2 | 2 | 2 | 2 | 2 |
| T8 | 2 | 2 | 3 | 3 | 3 | 2 | 3 | 0 | 3 | 3 | 3 | 3 | 2 | 2 | 2 | 2 | 3 | 2 | 2 | 3 |
| O1 | 3 | 3 | 2 | 3 | 3 | 3 | 3 | 3 | 0 | 4 | 3 | 3 | 3 | 3 | 4 | 2 | 3 | 3 | 2 | 2 |
| O2 | 3 | 3 | 2 | 3 | 4 | 2 | 2 | 2 | 4 | 0 | 3 | 3 | 3 | 3 | 4 | 2 | 2 | 2 | 2 | 2 |
| O3 | 3 | 3 | 3 | 3 | 3 | 2 | 2 | 2 | 2 | 3 | 0 | 3 | 2 | 3 | 3 | 2 | 2 | 2 | 2 | 2 |
| O4 | 3 | 3 | 2 | 3 | 3 | 3 | 2 | 2 | 3 | 3 | 3 | 0 | 2 | 3 | 3 | 3 | 2 | 2 | 2 | 2 |
| O5 | 2 | 2 | 3 | 3 | 3 | 3 | 2 | 2 | 3 | 3 | 3 | 3 | 0 | 3 | 3 | 2 | 2 | 2 | 3 | 2 |
| O6 | 3 | 3 | 2 | 3 | 3 | 3 | 3 | 3 | 3 | 3 | 3 | 3 | 2 | 0 | 4 | 3 | 2 | 2 | 2 | 2 |
| O7 | 3 | 3 | 3 | 3 | 2 | 3 | 3 | 3 | 4 | 3 | 4 | 4 | 3 | 4 | 0 | 3 | 3 | 2 | 2 | 3 |
| E1 | 2 | 2 | 2 | 2 | 2 | 2 | 3 | 3 | 2 | 2 | 3 | 3 | 3 | 2 | 2 | 0 | 2 | 3 | 2 | 2 |
| E2 | 2 | 2 | 3 | 3 | 3 | 2 | 3 | 4 | 3 | 3 | 3 | 3 | 3 | 3 | 3 | 2 | 0 | 3 | 2 | 3 |
| E3 | 2 | 2 | 2 | 2 | 2 | 2 | 2 | 2 | 2 | 2 | 2 | 2 | 3 | 2 | 2 | 1 | 1 | 0 | 2 | 2 |
| E4 | 2 | 3 | 3 | 4 | 3 | 3 | 3 | 3 | 4 | 3 | 3 | 3 | 3 | 3 | 3 | 3 | 3 | 3 | 0 | 4 |
| E5 | 3 | 3 | 3 | 3 | 3 | 3 | 3 | 3 | 3 | 3 | 3 | 4 | 4 | 3 | 3 | 3 | 3 | 3 | 4 | 0 |
| T1 | T2 | T3 | T4 | T5 | T6 | T7 | T8 | O1 | O2 | O3 | O4 | O5 | O6 | O7 | E1 | E2 | E3 | E4 | E5 | |
|---|---|---|---|---|---|---|---|---|---|---|---|---|---|---|---|---|---|---|---|---|
| T1 | 0.000 | 0.067 | 0.033 | 0.050 | 0.067 | 0.050 | 0.033 | 0.033 | 0.050 | 0.050 | 0.033 | 0.033 | 0.050 | 0.050 | 0.050 | 0.033 | 0.033 | 0.033 | 0.033 | 0.050 |
| T2 | 0.067 | 0.000 | 0.033 | 0.050 | 0.050 | 0.050 | 0.033 | 0.033 | 0.050 | 0.050 | 0.050 | 0.050 | 0.050 | 0.050 | 0.050 | 0.017 | 0.033 | 0.033 | 0.050 | 0.050 |
| T3 | 0.050 | 0.050 | 0.000 | 0.067 | 0.050 | 0.067 | 0.050 | 0.033 | 0.033 | 0.033 | 0.050 | 0.050 | 0.050 | 0.050 | 0.050 | 0.033 | 0.033 | 0.033 | 0.017 | 0.033 |
| T4 | 0.050 | 0.050 | 0.033 | 0.000 | 0.050 | 0.050 | 0.050 | 0.050 | 0.050 | 0.050 | 0.033 | 0.050 | 0.033 | 0.050 | 0.033 | 0.033 | 0.050 | 0.033 | 0.033 | 0.033 |
| T5 | 0.050 | 0.050 | 0.050 | 0.050 | 0.000 | 0.050 | 0.050 | 0.033 | 0.050 | 0.050 | 0.050 | 0.050 | 0.033 | 0.033 | 0.050 | 0.017 | 0.033 | 0.033 | 0.033 | 0.033 |
| T6 | 0.050 | 0.050 | 0.033 | 0.050 | 0.050 | 0.000 | 0.050 | 0.050 | 0.050 | 0.033 | 0.050 | 0.050 | 0.033 | 0.033 | 0.050 | 0.033 | 0.033 | 0.033 | 0.033 | 0.033 |
| T7 | 0.033 | 0.033 | 0.050 | 0.050 | 0.050 | 0.050 | 0.000 | 0.050 | 0.050 | 0.033 | 0.033 | 0.050 | 0.033 | 0.050 | 0.033 | 0.033 | 0.033 | 0.033 | 0.033 | 0.033 |
| T8 | 0.033 | 0.033 | 0.050 | 0.050 | 0.050 | 0.033 | 0.050 | 0.000 | 0.050 | 0.050 | 0.050 | 0.050 | 0.033 | 0.033 | 0.033 | 0.033 | 0.050 | 0.033 | 0.033 | 0.050 |
| O1 | 0.050 | 0.050 | 0.033 | 0.050 | 0.050 | 0.050 | 0.050 | 0.050 | 0.000 | 0.067 | 0.050 | 0.050 | 0.050 | 0.050 | 0.067 | 0.033 | 0.050 | 0.050 | 0.033 | 0.033 |
| O2 | 0.050 | 0.050 | 0.033 | 0.050 | 0.067 | 0.033 | 0.033 | 0.033 | 0.067 | 0.000 | 0.050 | 0.050 | 0.050 | 0.050 | 0.067 | 0.033 | 0.033 | 0.033 | 0.033 | 0.033 |
| O3 | 0.050 | 0.050 | 0.050 | 0.050 | 0.050 | 0.033 | 0.033 | 0.033 | 0.033 | 0.050 | 0.000 | 0.050 | 0.033 | 0.050 | 0.050 | 0.033 | 0.033 | 0.033 | 0.033 | 0.033 |
| O4 | 0.050 | 0.050 | 0.033 | 0.050 | 0.050 | 0.050 | 0.033 | 0.033 | 0.050 | 0.050 | 0.050 | 0.000 | 0.033 | 0.050 | 0.050 | 0.050 | 0.033 | 0.033 | 0.033 | 0.033 |
| O5 | 0.033 | 0.033 | 0.050 | 0.050 | 0.050 | 0.050 | 0.033 | 0.033 | 0.050 | 0.050 | 0.050 | 0.050 | 0.000 | 0.050 | 0.050 | 0.033 | 0.033 | 0.033 | 0.050 | 0.033 |
| O6 | 0.050 | 0.050 | 0.033 | 0.050 | 0.050 | 0.050 | 0.050 | 0.050 | 0.050 | 0.050 | 0.050 | 0.050 | 0.033 | 0.000 | 0.067 | 0.050 | 0.033 | 0.033 | 0.033 | 0.033 |
| O7 | 0.050 | 0.050 | 0.050 | 0.050 | 0.033 | 0.050 | 0.050 | 0.050 | 0.067 | 0.050 | 0.067 | 0.067 | 0.050 | 0.067 | 0.000 | 0.050 | 0.050 | 0.033 | 0.033 | 0.050 |
| E1 | 0.033 | 0.033 | 0.033 | 0.033 | 0.033 | 0.033 | 0.050 | 0.050 | 0.033 | 0.033 | 0.050 | 0.050 | 0.050 | 0.033 | 0.033 | 0.000 | 0.033 | 0.050 | 0.033 | 0.033 |
| E2 | 0.033 | 0.033 | 0.050 | 0.050 | 0.050 | 0.033 | 0.050 | 0.067 | 0.050 | 0.050 | 0.050 | 0.050 | 0.050 | 0.050 | 0.050 | 0.033 | 0.000 | 0.050 | 0.033 | 0.050 |
| E3 | 0.033 | 0.033 | 0.033 | 0.033 | 0.033 | 0.033 | 0.033 | 0.033 | 0.033 | 0.033 | 0.033 | 0.033 | 0.050 | 0.033 | 0.033 | 0.017 | 0.017 | 0.000 | 0.033 | 0.033 |
| E4 | 0.033 | 0.050 | 0.050 | 0.067 | 0.050 | 0.050 | 0.050 | 0.050 | 0.067 | 0.050 | 0.050 | 0.050 | 0.050 | 0.050 | 0.050 | 0.050 | 0.050 | 0.050 | 0.000 | 0.067 |
| E5 | 0.050 | 0.050 | 0.050 | 0.050 | 0.050 | 0.050 | 0.050 | 0.050 | 0.050 | 0.050 | 0.050 | 0.067 | 0.067 | 0.050 | 0.050 | 0.050 | 0.050 | 0.050 | 0.067 | 0.000 |
| T1 | T2 | T3 | T4 | T5 | T6 | T7 | T8 | O1 | O2 | O3 | O4 | O5 | O6 | O7 | E1 | E2 | E3 | E4 | E5 | |
|---|---|---|---|---|---|---|---|---|---|---|---|---|---|---|---|---|---|---|---|---|
| T1 | 0.224 | 0.290 | 0.235 | 0.293 | 0.306 | 0.274 | 0.248 | 0.243 | 0.291 | 0.279 | 0.266 | 0.278 | 0.262 | 0.278 | 0.287 | 0.206 | 0.220 | 0.217 | 0.211 | 0.242 |
| T2 | 0.292 | 0.233 | 0.240 | 0.299 | 0.296 | 0.279 | 0.253 | 0.248 | 0.296 | 0.284 | 0.286 | 0.299 | 0.267 | 0.283 | 0.293 | 0.196 | 0.225 | 0.221 | 0.230 | 0.247 |
| T3 | 0.269 | 0.272 | 0.201 | 0.306 | 0.288 | 0.287 | 0.261 | 0.241 | 0.272 | 0.260 | 0.278 | 0.291 | 0.258 | 0.275 | 0.284 | 0.205 | 0.218 | 0.215 | 0.193 | 0.224 |
| T4 | 0.266 | 0.269 | 0.230 | 0.239 | 0.285 | 0.268 | 0.258 | 0.254 | 0.284 | 0.273 | 0.260 | 0.287 | 0.241 | 0.272 | 0.266 | 0.202 | 0.231 | 0.213 | 0.206 | 0.222 |
| T5 | 0.263 | 0.266 | 0.242 | 0.284 | 0.233 | 0.265 | 0.254 | 0.234 | 0.280 | 0.269 | 0.271 | 0.283 | 0.237 | 0.253 | 0.277 | 0.184 | 0.212 | 0.209 | 0.203 | 0.218 |
| T6 | 0.261 | 0.265 | 0.227 | 0.282 | 0.279 | 0.216 | 0.254 | 0.249 | 0.279 | 0.253 | 0.270 | 0.282 | 0.237 | 0.252 | 0.276 | 0.199 | 0.212 | 0.209 | 0.203 | 0.218 |
| T7 | 0.237 | 0.240 | 0.234 | 0.273 | 0.270 | 0.255 | 0.198 | 0.241 | 0.270 | 0.244 | 0.246 | 0.273 | 0.228 | 0.258 | 0.251 | 0.192 | 0.205 | 0.202 | 0.195 | 0.210 |
| T8 | 0.246 | 0.249 | 0.243 | 0.283 | 0.280 | 0.249 | 0.255 | 0.202 | 0.280 | 0.269 | 0.271 | 0.283 | 0.237 | 0.253 | 0.261 | 0.199 | 0.228 | 0.210 | 0.203 | 0.233 |
| O1 | 0.291 | 0.294 | 0.253 | 0.315 | 0.312 | 0.293 | 0.282 | 0.277 | 0.264 | 0.314 | 0.302 | 0.315 | 0.280 | 0.298 | 0.323 | 0.222 | 0.252 | 0.249 | 0.226 | 0.244 |
| O2 | 0.276 | 0.279 | 0.239 | 0.298 | 0.310 | 0.263 | 0.252 | 0.247 | 0.310 | 0.236 | 0.286 | 0.298 | 0.266 | 0.283 | 0.307 | 0.210 | 0.224 | 0.221 | 0.214 | 0.230 |
| O3 | 0.258 | 0.261 | 0.238 | 0.278 | 0.275 | 0.245 | 0.235 | 0.230 | 0.260 | 0.264 | 0.219 | 0.278 | 0.233 | 0.264 | 0.272 | 0.196 | 0.208 | 0.206 | 0.199 | 0.215 |
| O4 | 0.266 | 0.269 | 0.230 | 0.287 | 0.284 | 0.268 | 0.243 | 0.238 | 0.284 | 0.273 | 0.275 | 0.240 | 0.241 | 0.272 | 0.281 | 0.218 | 0.215 | 0.213 | 0.206 | 0.221 |
| O5 | 0.251 | 0.255 | 0.247 | 0.289 | 0.285 | 0.269 | 0.244 | 0.239 | 0.285 | 0.274 | 0.277 | 0.288 | 0.209 | 0.273 | 0.282 | 0.204 | 0.216 | 0.214 | 0.222 | 0.222 |
| O6 | 0.279 | 0.282 | 0.242 | 0.301 | 0.298 | 0.281 | 0.271 | 0.266 | 0.298 | 0.286 | 0.289 | 0.302 | 0.253 | 0.238 | 0.309 | 0.228 | 0.226 | 0.223 | 0.216 | 0.233 |
| O7 | 0.305 | 0.308 | 0.281 | 0.330 | 0.311 | 0.307 | 0.295 | 0.290 | 0.341 | 0.313 | 0.331 | 0.345 | 0.293 | 0.327 | 0.275 | 0.249 | 0.263 | 0.245 | 0.237 | 0.270 |
| E1 | 0.226 | 0.229 | 0.210 | 0.246 | 0.243 | 0.229 | 0.235 | 0.231 | 0.243 | 0.233 | 0.251 | 0.261 | 0.234 | 0.232 | 0.240 | 0.152 | 0.195 | 0.209 | 0.188 | 0.201 |
| E2 | 0.267 | 0.270 | 0.261 | 0.306 | 0.302 | 0.269 | 0.274 | 0.285 | 0.302 | 0.290 | 0.293 | 0.306 | 0.272 | 0.289 | 0.298 | 0.216 | 0.197 | 0.242 | 0.219 | 0.251 |
| E3 | 0.199 | 0.201 | 0.184 | 0.216 | 0.213 | 0.201 | 0.193 | 0.189 | 0.213 | 0.204 | 0.206 | 0.215 | 0.207 | 0.204 | 0.210 | 0.147 | 0.157 | 0.138 | 0.165 | 0.177 |
| E4 | 0.293 | 0.312 | 0.285 | 0.350 | 0.331 | 0.312 | 0.300 | 0.295 | 0.346 | 0.317 | 0.320 | 0.335 | 0.298 | 0.316 | 0.327 | 0.252 | 0.268 | 0.265 | 0.209 | 0.290 |
| E5 | 0.312 | 0.316 | 0.289 | 0.339 | 0.335 | 0.316 | 0.303 | 0.298 | 0.335 | 0.321 | 0.324 | 0.354 | 0.317 | 0.320 | 0.331 | 0.255 | 0.270 | 0.267 | 0.275 | 0.231 |
| Factors | Influencing Degree | Influenced Degree | Centrality | Causality |
|---|---|---|---|---|
| T1 | 3.294 | 3.243 | 6.537 | 0.050 |
| T2 | 3.301 | 3.237 | 6.539 | 0.064 |
| T3 | 3.383 | 2.797 | 6.179 | 0.586 |
| T4 | 3.215 | 3.650 | 6.865 | −0.434 |
| T5 | 3.016 | 3.601 | 6.618 | −0.585 |
| T6 | 3.340 | 3.464 | 6.804 | −0.125 |
| T7 | 3.062 | 3.266 | 6.329 | −0.204 |
| T8 | 3.128 | 3.121 | 6.249 | 0.006 |
| O1 | 3.314 | 3.924 | 7.239 | −0.610 |
| O2 | 3.334 | 3.742 | 7.076 | −0.407 |
| O3 | 2.957 | 3.729 | 6.686 | −0.772 |
| O4 | 3.329 | 3.715 | 7.045 | −0.386 |
| O5 | 3.233 | 3.373 | 6.606 | −0.140 |
| O6 | 3.585 | 3.681 | 7.266 | −0.097 |
| O7 | 3.603 | 3.617 | 7.220 | −0.014 |
| E1 | 2.894 | 2.677 | 5.571 | 0.216 |
| E2 | 3.404 | 2.739 | 6.143 | 0.665 |
| E3 | 2.288 | 2.589 | 4.877 | −0.301 |
| E4 | 4.181 | 2.622 | 6.804 | 1.559 |
| E5 | 3.918 | 2.991 | 6.910 | 0.927 |
| T1 | T2 | T3 | T4 | T5 | T6 | T7 | T8 | O1 | O2 | O3 | O4 | O5 | O6 | O7 | E1 | E2 | E3 | E4 | E5 | |
|---|---|---|---|---|---|---|---|---|---|---|---|---|---|---|---|---|---|---|---|---|
| T1 | 1.224 | 0.290 | 0.235 | 0.293 | 0.306 | 0.274 | 0.248 | 0.243 | 0.291 | 0.279 | 0.266 | 0.278 | 0.262 | 0.278 | 0.287 | 0.206 | 0.220 | 0.217 | 0.211 | 0.242 |
| T2 | 0.292 | 1.233 | 0.240 | 0.299 | 0.296 | 0.279 | 0.253 | 0.248 | 0.296 | 0.284 | 0.286 | 0.299 | 0.267 | 0.283 | 0.293 | 0.196 | 0.225 | 0.221 | 0.230 | 0.247 |
| T3 | 0.269 | 0.272 | 1.201 | 0.306 | 0.288 | 0.287 | 0.261 | 0.241 | 0.272 | 0.260 | 0.278 | 0.291 | 0.258 | 0.275 | 0.284 | 0.205 | 0.218 | 0.215 | 0.193 | 0.224 |
| T4 | 0.266 | 0.269 | 0.230 | 1.239 | 0.285 | 0.268 | 0.258 | 0.254 | 0.284 | 0.273 | 0.260 | 0.287 | 0.241 | 0.272 | 0.266 | 0.202 | 0.231 | 0.213 | 0.206 | 0.222 |
| T5 | 0.263 | 0.266 | 0.242 | 0.284 | 1.233 | 0.265 | 0.254 | 0.234 | 0.280 | 0.269 | 0.271 | 0.283 | 0.237 | 0.253 | 0.277 | 0.184 | 0.212 | 0.209 | 0.203 | 0.218 |
| T6 | 0.261 | 0.265 | 0.227 | 0.282 | 0.279 | 1.216 | 0.254 | 0.249 | 0.279 | 0.253 | 0.270 | 0.282 | 0.237 | 0.252 | 0.276 | 0.199 | 0.212 | 0.209 | 0.203 | 0.218 |
| T7 | 0.237 | 0.240 | 0.234 | 0.273 | 0.270 | 0.255 | 1.198 | 0.241 | 0.270 | 0.244 | 0.246 | 0.273 | 0.228 | 0.258 | 0.251 | 0.192 | 0.205 | 0.202 | 0.195 | 0.210 |
| T8 | 0.246 | 0.249 | 0.243 | 0.283 | 0.280 | 0.249 | 0.255 | 1.202 | 0.280 | 0.269 | 0.271 | 0.283 | 0.237 | 0.253 | 0.261 | 0.199 | 0.228 | 0.210 | 0.203 | 0.233 |
| O1 | 0.291 | 0.294 | 0.253 | 0.315 | 0.312 | 0.293 | 0.282 | 0.277 | 1.264 | 0.314 | 0.302 | 0.315 | 0.280 | 0.298 | 0.323 | 0.222 | 0.252 | 0.249 | 0.226 | 0.244 |
| O2 | 0.276 | 0.279 | 0.239 | 0.298 | 0.310 | 0.263 | 0.252 | 0.247 | 0.310 | 1.236 | 0.286 | 0.298 | 0.266 | 0.283 | 0.307 | 0.210 | 0.224 | 0.221 | 0.214 | 0.230 |
| O3 | 0.258 | 0.261 | 0.238 | 0.278 | 0.275 | 0.245 | 0.235 | 0.230 | 0.260 | 0.264 | 1.219 | 0.278 | 0.233 | 0.264 | 0.272 | 0.196 | 0.208 | 0.206 | 0.199 | 0.215 |
| O4 | 0.266 | 0.269 | 0.230 | 0.287 | 0.284 | 0.268 | 0.243 | 0.238 | 0.284 | 0.273 | 0.275 | 1.240 | 0.241 | 0.272 | 0.281 | 0.218 | 0.215 | 0.213 | 0.206 | 0.221 |
| O5 | 0.251 | 0.255 | 0.247 | 0.289 | 0.285 | 0.269 | 0.244 | 0.239 | 0.285 | 0.274 | 0.277 | 0.288 | 1.209 | 0.273 | 0.282 | 0.204 | 0.216 | 0.214 | 0.222 | 0.222 |
| O6 | 0.279 | 0.282 | 0.242 | 0.301 | 0.298 | 0.281 | 0.271 | 0.266 | 0.298 | 0.286 | 0.289 | 0.302 | 0.253 | 1.238 | 0.309 | 0.228 | 0.226 | 0.223 | 0.216 | 0.233 |
| O7 | 0.305 | 0.308 | 0.281 | 0.330 | 0.311 | 0.307 | 0.295 | 0.290 | 0.341 | 0.313 | 0.331 | 0.345 | 0.293 | 0.327 | 1.275 | 0.249 | 0.263 | 0.245 | 0.237 | 0.270 |
| E1 | 0.226 | 0.229 | 0.210 | 0.246 | 0.243 | 0.229 | 0.235 | 0.231 | 0.243 | 0.233 | 0.251 | 0.261 | 0.234 | 0.232 | 0.240 | 1.152 | 0.195 | 0.209 | 0.188 | 0.201 |
| E2 | 0.267 | 0.270 | 0.261 | 0.306 | 0.302 | 0.269 | 0.274 | 0.285 | 0.302 | 0.290 | 0.293 | 0.306 | 0.272 | 0.289 | 0.298 | 0.216 | 1.197 | 0.242 | 0.219 | 0.251 |
| E3 | 0.199 | 0.201 | 0.184 | 0.216 | 0.213 | 0.201 | 0.193 | 0.189 | 0.213 | 0.204 | 0.206 | 0.215 | 0.207 | 0.204 | 0.210 | 0.147 | 0.157 | 1.138 | 0.165 | 0.177 |
| E4 | 0.293 | 0.312 | 0.285 | 0.350 | 0.331 | 0.312 | 0.300 | 0.295 | 0.346 | 0.317 | 0.320 | 0.335 | 0.298 | 0.316 | 0.327 | 0.252 | 0.268 | 0.265 | 1.209 | 0.290 |
| E5 | 0.312 | 0.316 | 0.289 | 0.339 | 0.335 | 0.316 | 0.303 | 0.298 | 0.335 | 0.321 | 0.324 | 0.354 | 0.317 | 0.320 | 0.331 | 0.255 | 0.270 | 0.267 | 0.275 | 1.231 |
| T1 | T2 | T3 | T4 | T5 | T6 | T7 | T8 | O1 | O2 | O3 | O4 | O5 | O6 | O7 | E1 | E2 | E3 | E4 | E5 | |
|---|---|---|---|---|---|---|---|---|---|---|---|---|---|---|---|---|---|---|---|---|
| T1 | 1 | 0 | 0 | 1 | 1 | 1 | 0 | 0 | 1 | 1 | 0 | 0 | 1 | 1 | 0 | 0 | 0 | 0 | 0 | 0 |
| T2 | 0 | 1 | 0 | 1 | 1 | 1 | 0 | 0 | 1 | 1 | 0 | 0 | 1 | 1 | 0 | 0 | 0 | 0 | 0 | 0 |
| T3 | 0 | 0 | 1 | 0 | 0 | 0 | 0 | 1 | 1 | 1 | 1 | 1 | 1 | 1 | 0 | 0 | 0 | 0 | 0 | 0 |
| T4 | 0 | 0 | 0 | 1 | 1 | 0 | 0 | 0 | 0 | 0 | 0 | 1 | 0 | 0 | 0 | 0 | 0 | 0 | 0 | 0 |
| T5 | 0 | 0 | 0 | 1 | 1 | 0 | 0 | 0 | 1 | 0 | 0 | 1 | 0 | 0 | 0 | 0 | 0 | 0 | 0 | 0 |
| T6 | 0 | 0 | 0 | 1 | 1 | 1 | 0 | 0 | 1 | 0 | 1 | 1 | 0 | 0 | 0 | 0 | 0 | 0 | 0 | 0 |
| T7 | 0 | 0 | 0 | 1 | 1 | 0 | 1 | 0 | 1 | 0 | 0 | 1 | 0 | 1 | 0 | 0 | 0 | 0 | 0 | 0 |
| T8 | 0 | 0 | 0 | 1 | 1 | 0 | 0 | 1 | 1 | 0 | 0 | 1 | 0 | 0 | 0 | 0 | 0 | 0 | 0 | 0 |
| O1 | 0 | 0 | 0 | 1 | 1 | 0 | 1 | 0 | 1 | 0 | 1 | 1 | 0 | 0 | 0 | 0 | 0 | 0 | 0 | 0 |
| O2 | 0 | 0 | 0 | 1 | 1 | 0 | 0 | 0 | 1 | 1 | 1 | 1 | 0 | 0 | 0 | 0 | 0 | 0 | 0 | 0 |
| O3 | 0 | 0 | 0 | 1 | 1 | 0 | 0 | 0 | 1 | 0 | 1 | 1 | 0 | 0 | 0 | 0 | 0 | 0 | 0 | 0 |
| O4 | 0 | 0 | 0 | 1 | 1 | 0 | 0 | 0 | 1 | 0 | 1 | 1 | 0 | 0 | 0 | 0 | 0 | 0 | 0 | 0 |
| O5 | 0 | 0 | 0 | 1 | 1 | 0 | 0 | 0 | 1 | 0 | 1 | 1 | 1 | 0 | 0 | 0 | 0 | 0 | 0 | 0 |
| O6 | 0 | 0 | 0 | 1 | 1 | 0 | 1 | 0 | 1 | 0 | 1 | 1 | 0 | 1 | 0 | 0 | 0 | 0 | 0 | 0 |
| O7 | 0 | 0 | 0 | 1 | 1 | 1 | 1 | 0 | 1 | 1 | 1 | 1 | 0 | 0 | 1 | 0 | 0 | 0 | 0 | 0 |
| E1 | 0 | 0 | 0 | 0 | 0 | 0 | 0 | 0 | 0 | 0 | 0 | 1 | 0 | 0 | 0 | 1 | 0 | 0 | 0 | 0 |
| E2 | 0 | 0 | 0 | 1 | 1 | 1 | 1 | 1 | 1 | 1 | 1 | 1 | 1 | 1 | 0 | 0 | 1 | 0 | 0 | 0 |
| E3 | 0 | 0 | 0 | 0 | 0 | 0 | 0 | 0 | 0 | 0 | 0 | 0 | 0 | 0 | 0 | 0 | 0 | 1 | 0 | 0 |
| E4 | 0 | 0 | 1 | 0 | 0 | 0 | 0 | 0 | 1 | 0 | 1 | 1 | 1 | 1 | 1 | 0 | 1 | 1 | 1 | 1 |
| E5 | 0 | 0 | 1 | 0 | 0 | 0 | 0 | 0 | 1 | 0 | 1 | 1 | 1 | 1 | 1 | 0 | 1 | 1 | 1 | 1 |
| Factors | Reachable Set R (xi) | Antecedent Set F (xi) | Common Set Q (xi) | Hierarchy |
|---|---|---|---|---|
| T1 | T1, T2, T3, T4, T5, T6, O1, O2, O3, O4, O5, O6, O7 | T1, T2, T3, T4, T5, T6, O1, O2, O3, O4, O6, O7, E2, E4, E5 | T1, T2, T3, T4, T5, T6, O1, O2, O3, O4, O6, O7 | 5 |
| T2 | T1, T2, T3, T4, T5, T6, O1, O2, O3, O4, O5, O6, O7 | T1,T2, T3, T4, T5,T6, O1, O2, O3, O4, O6,O7, E2, E4, E5 | T1, T2, T3, T4, T5, T6, O1, O2, O3, O4, O6, O7 | 5 |
| T3 | T1, T2, T3, T8, O1, O2, O3, O4, O5, O6, O7 | T3, O7, E2, E4, E5 | T3,O7 | 5 |
| T4 | T1, T2, T4, T5, T6, T7, O2, O3, O4, O6, O7 | T1, T2, T4, T5, T6, T7, T8, O1, O2, O3, O4, O5, O6, O7, E2, E4, E5 | T1, T2, T4, T5, T6, T7, O2, O3, O4, O6, O7 | 1 |
| T5 | T1, T2, T4, T5, T6, O1, O2, O3, O4, O7 | T1, T2, T4, T5, T6, T7, T8, O1, O2, O3, O4, O5, O6, O7, E2, E4, E5 | T1, T2, T4, T5, T6, O1, O2, O3, O4, O7 | 1 |
| T6 | T1, T2, T4, T5, T6, O1, O3, O4, O7 | T1, T2, T4, T5, T6, O1, O2, O3, O4, O5, O6, O7, E2, E4, E5 | T1, T2, T4, T5, T6, O1, O3, O4, O7 | 2 |
| T7 | T4, T5, T7, O1, O4, O6 | T4, T7, O1, O6, O7, E2, E4, E5 | O1, T4, O6, T7 | 2 |
| T8 | T4, T5, T8, O1, O2, O3, O4, O7 | T3, T8, O1, O6, O7, E2, E4, E5 | T8, O1, O7 | 4 |
| O1 | T1, T2, T4, T5, T6, T7, T8, O1, O2, O3, O4, O5, O6, O7 | T1, T2, T3, T4, T5, T6, T7, T8, O1, O2, O3, O4, O5, O6, O7, E2, E4, E5 | T1, T2, T4, T5, T6, T7, T8, O1, O2, O3, O4, O5, O6, O7 | 1 |
| O2 | T1, T2, T4, T5, T6, O1, O2, O3, O4, O5, O6, O7 | T1, T2, T3, T4, T5, T8, O1, O2, O3, O4, O5, O6, O7, E2, E4, E5 | T1, T2, T4, T5, O1, O2, O3, O4, O5, O6, O7 | 3 |
| O3 | T1, T2, T4, T5, T6, O1, O2, O3, O4, O6, O7 | T1, T2, T3, T4, T5, T8, O1, O2, O3, O4, O5, O6, O7, E2, E4, E5 | T1, T2, T4, T5, O1, O2, O3, O4, O6, O7 | 2 |
| O4 | T1, T2, T4, T5, T6, O1, O2, O3, O4, O6, O7 | T1, T2, T3, T4, T5, T6, T7, T8, O1, O2, O3, O4, O5, O6, O7, E1, E2, E4, E5 | T1, T2, T4, T5, T6, O1, O2, O3, O4, O6, O7 | 1 |
| O5 | T4, T5, T6, O1, O2, O3, O4, O5, O6, O7 | T1, T2, T3, O1, O2, O5, O7, E2, E4, E5 | O1, O2, O5, O7 | 4 |
| O6 | T1, T2, T4, T5, T6, T7, O1, O2, O3, O4, O6, O7 | T1, T2, T3, T4, T7, O1, O2, O3, O4, O5, O6, O7, E2, E4, E5 | T1, T2, T4, T7, O1, O2, O3, O4, O6, O7 | 3 |
| O7 | T1, T2, T3, T4, T5, T6, T7, T8, O1, O2, O3, O4, O5, O6, O7, E2, E5 | T1, T2, T3, T4, T5, T6, T8, O1, O2, O3, O4, O5, O6, O7, E2, E4, E5 | T1, T2, T3, T4, T5, T6, T8, O1, O2, O3, O4, O5, O6, O7, E2, E5 | 3 |
| E1 | O4, E1 | E1 | E1 | 2 |
| E2 | T1, T2, T3, T4, T5, T6, T7, T8, O1, O2, O3, O4, O5, O6, O7, E2 | O7, E2, E4, E5 | E2, O7 | 5 |
| E3 | E3 | E3, E4, E5 | E3 | 1 |
| E4 | T1, T2, T3, T4, T5, T6, T7, T8, O1, O2, O3, O4, O5, O6, O7, E2, E3, E4, E5 | E4, E5 | E4, E5 | 6 |
| E5 | T1, T2, T3, T4, T5, T6, T7, T8, O1, O2, O3, O4, O5, O6, O7, E2, E3, E4, E5 | O7, E4, E5 | E4, E5, O7 | 6 |
Publisher’s Note: MDPI stays neutral with regard to jurisdictional claims in published maps and institutional affiliations. |
© 2022 by the authors. Licensee MDPI, Basel, Switzerland. This article is an open access article distributed under the terms and conditions of the Creative Commons Attribution (CC BY) license (https://creativecommons.org/licenses/by/4.0/).
Share and Cite
Luan, H.; Li, L.; Jiang, P.; Zhou, J. Critical Factors Affecting the Promotion of Emerging Information Technology in Prefabricated Building Projects: A Hybrid Evaluation Model. Buildings 2022, 12, 1577. https://doi.org/10.3390/buildings12101577
Luan H, Li L, Jiang P, Zhou J. Critical Factors Affecting the Promotion of Emerging Information Technology in Prefabricated Building Projects: A Hybrid Evaluation Model. Buildings. 2022; 12(10):1577. https://doi.org/10.3390/buildings12101577
Chicago/Turabian StyleLuan, Haiying, Long Li, Peng Jiang, and Jian Zhou. 2022. "Critical Factors Affecting the Promotion of Emerging Information Technology in Prefabricated Building Projects: A Hybrid Evaluation Model" Buildings 12, no. 10: 1577. https://doi.org/10.3390/buildings12101577
APA StyleLuan, H., Li, L., Jiang, P., & Zhou, J. (2022). Critical Factors Affecting the Promotion of Emerging Information Technology in Prefabricated Building Projects: A Hybrid Evaluation Model. Buildings, 12(10), 1577. https://doi.org/10.3390/buildings12101577