
Multi-Information Fusion Based on BIM and Intuitionistic Fuzzy D-S Evidence Theory for Safety Risk Assessment of Undersea Tunnel Construction Projects


Abstract
1. Introduction
2. Literature Review
3. Preliminaries
3.1. IFS Theory
- Definition 1
- Definition 2
- (1)
- (2)
- (3)
- (4)
- Definition 3
- Definition 4
3.2. D-S Evidence Theory
- Definition 5
- Definition 6
- Definition 7
- Definition 8
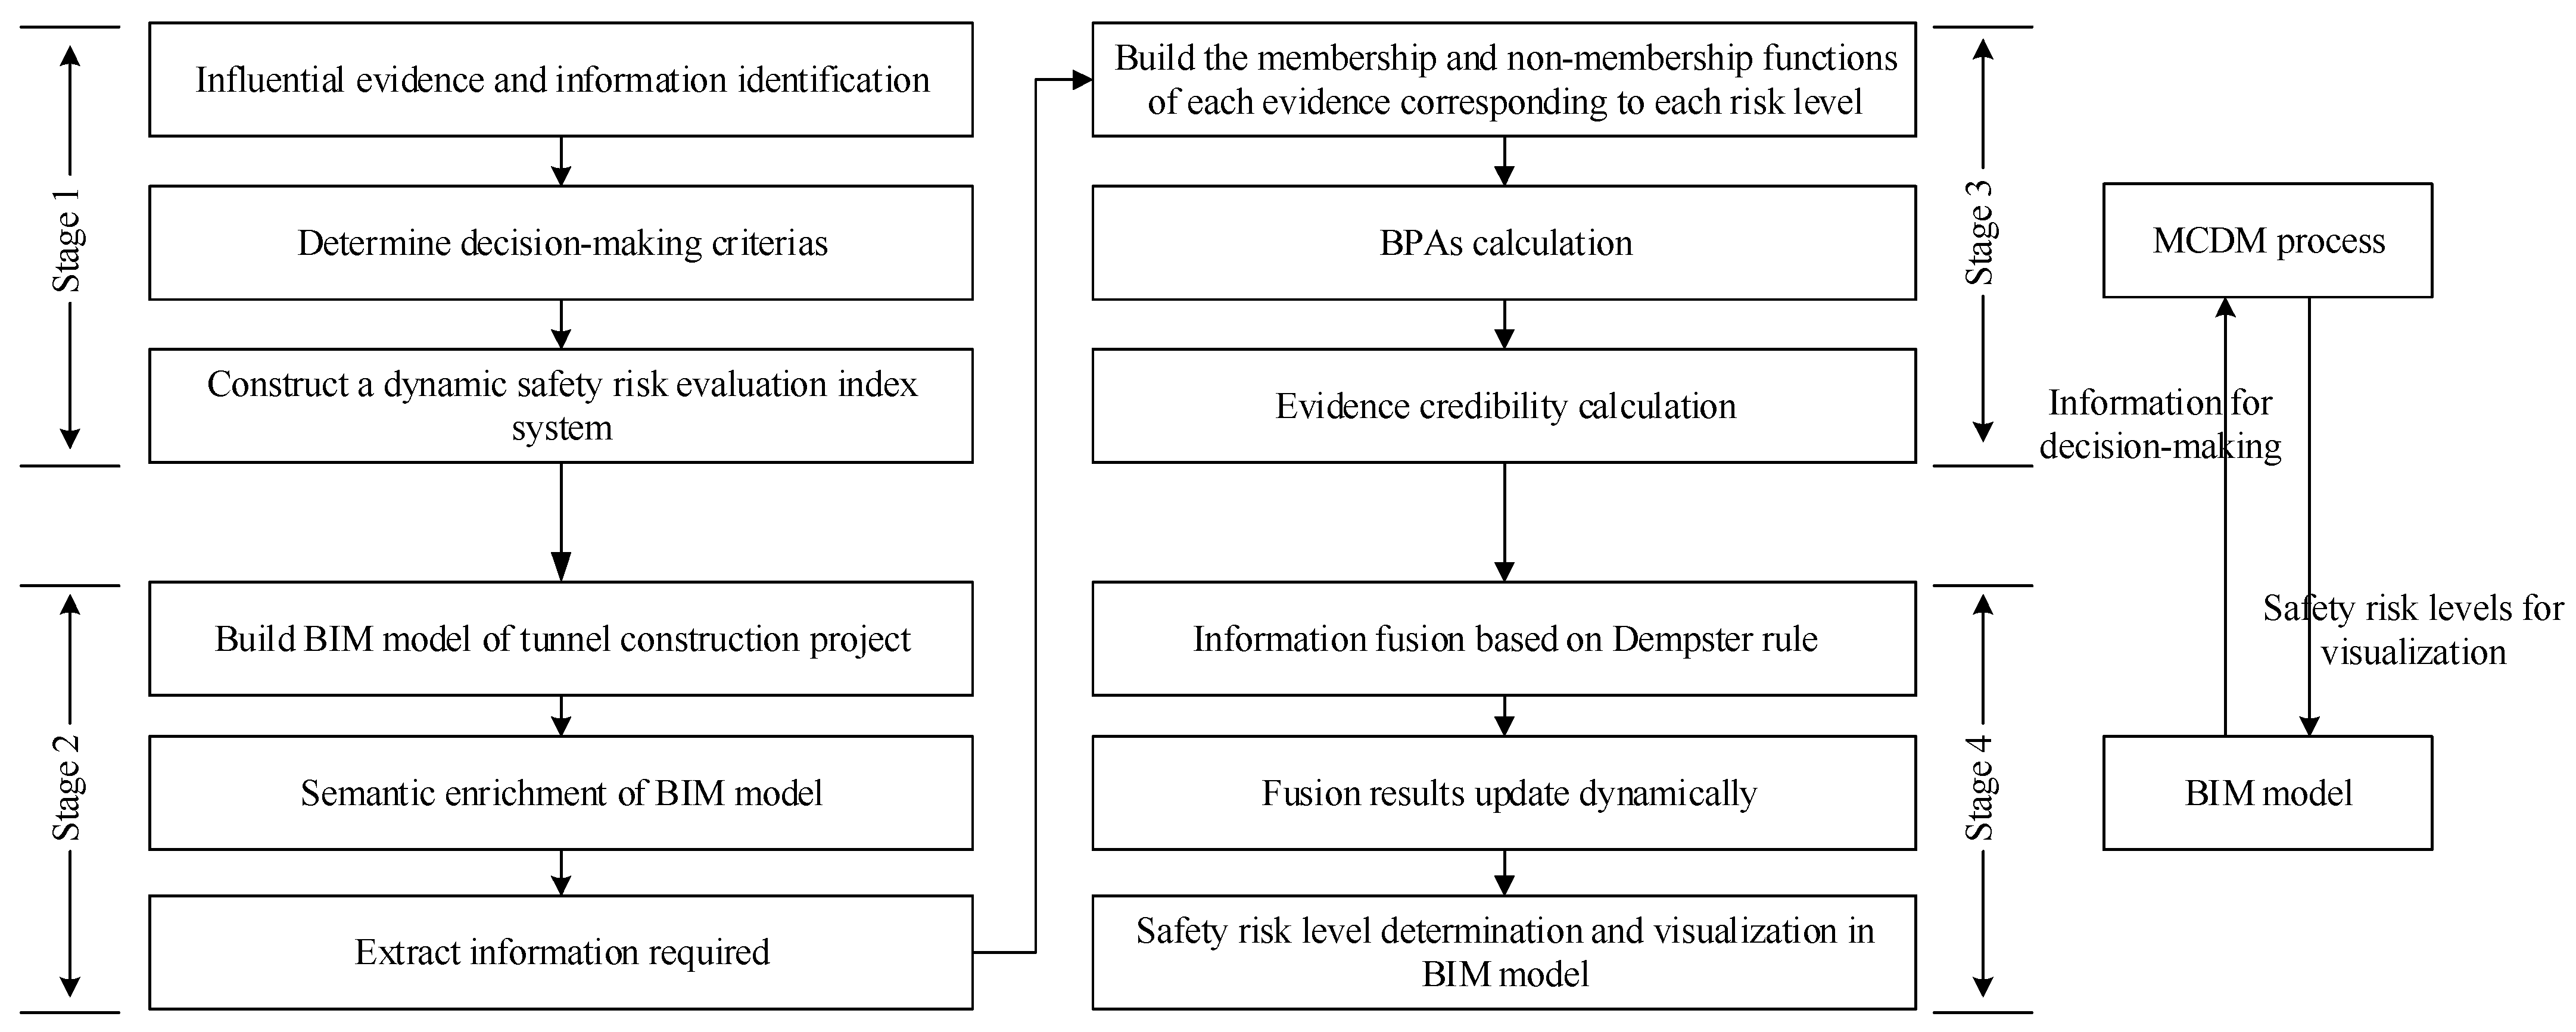
4. The Proposed Safety Risk Assessment Method
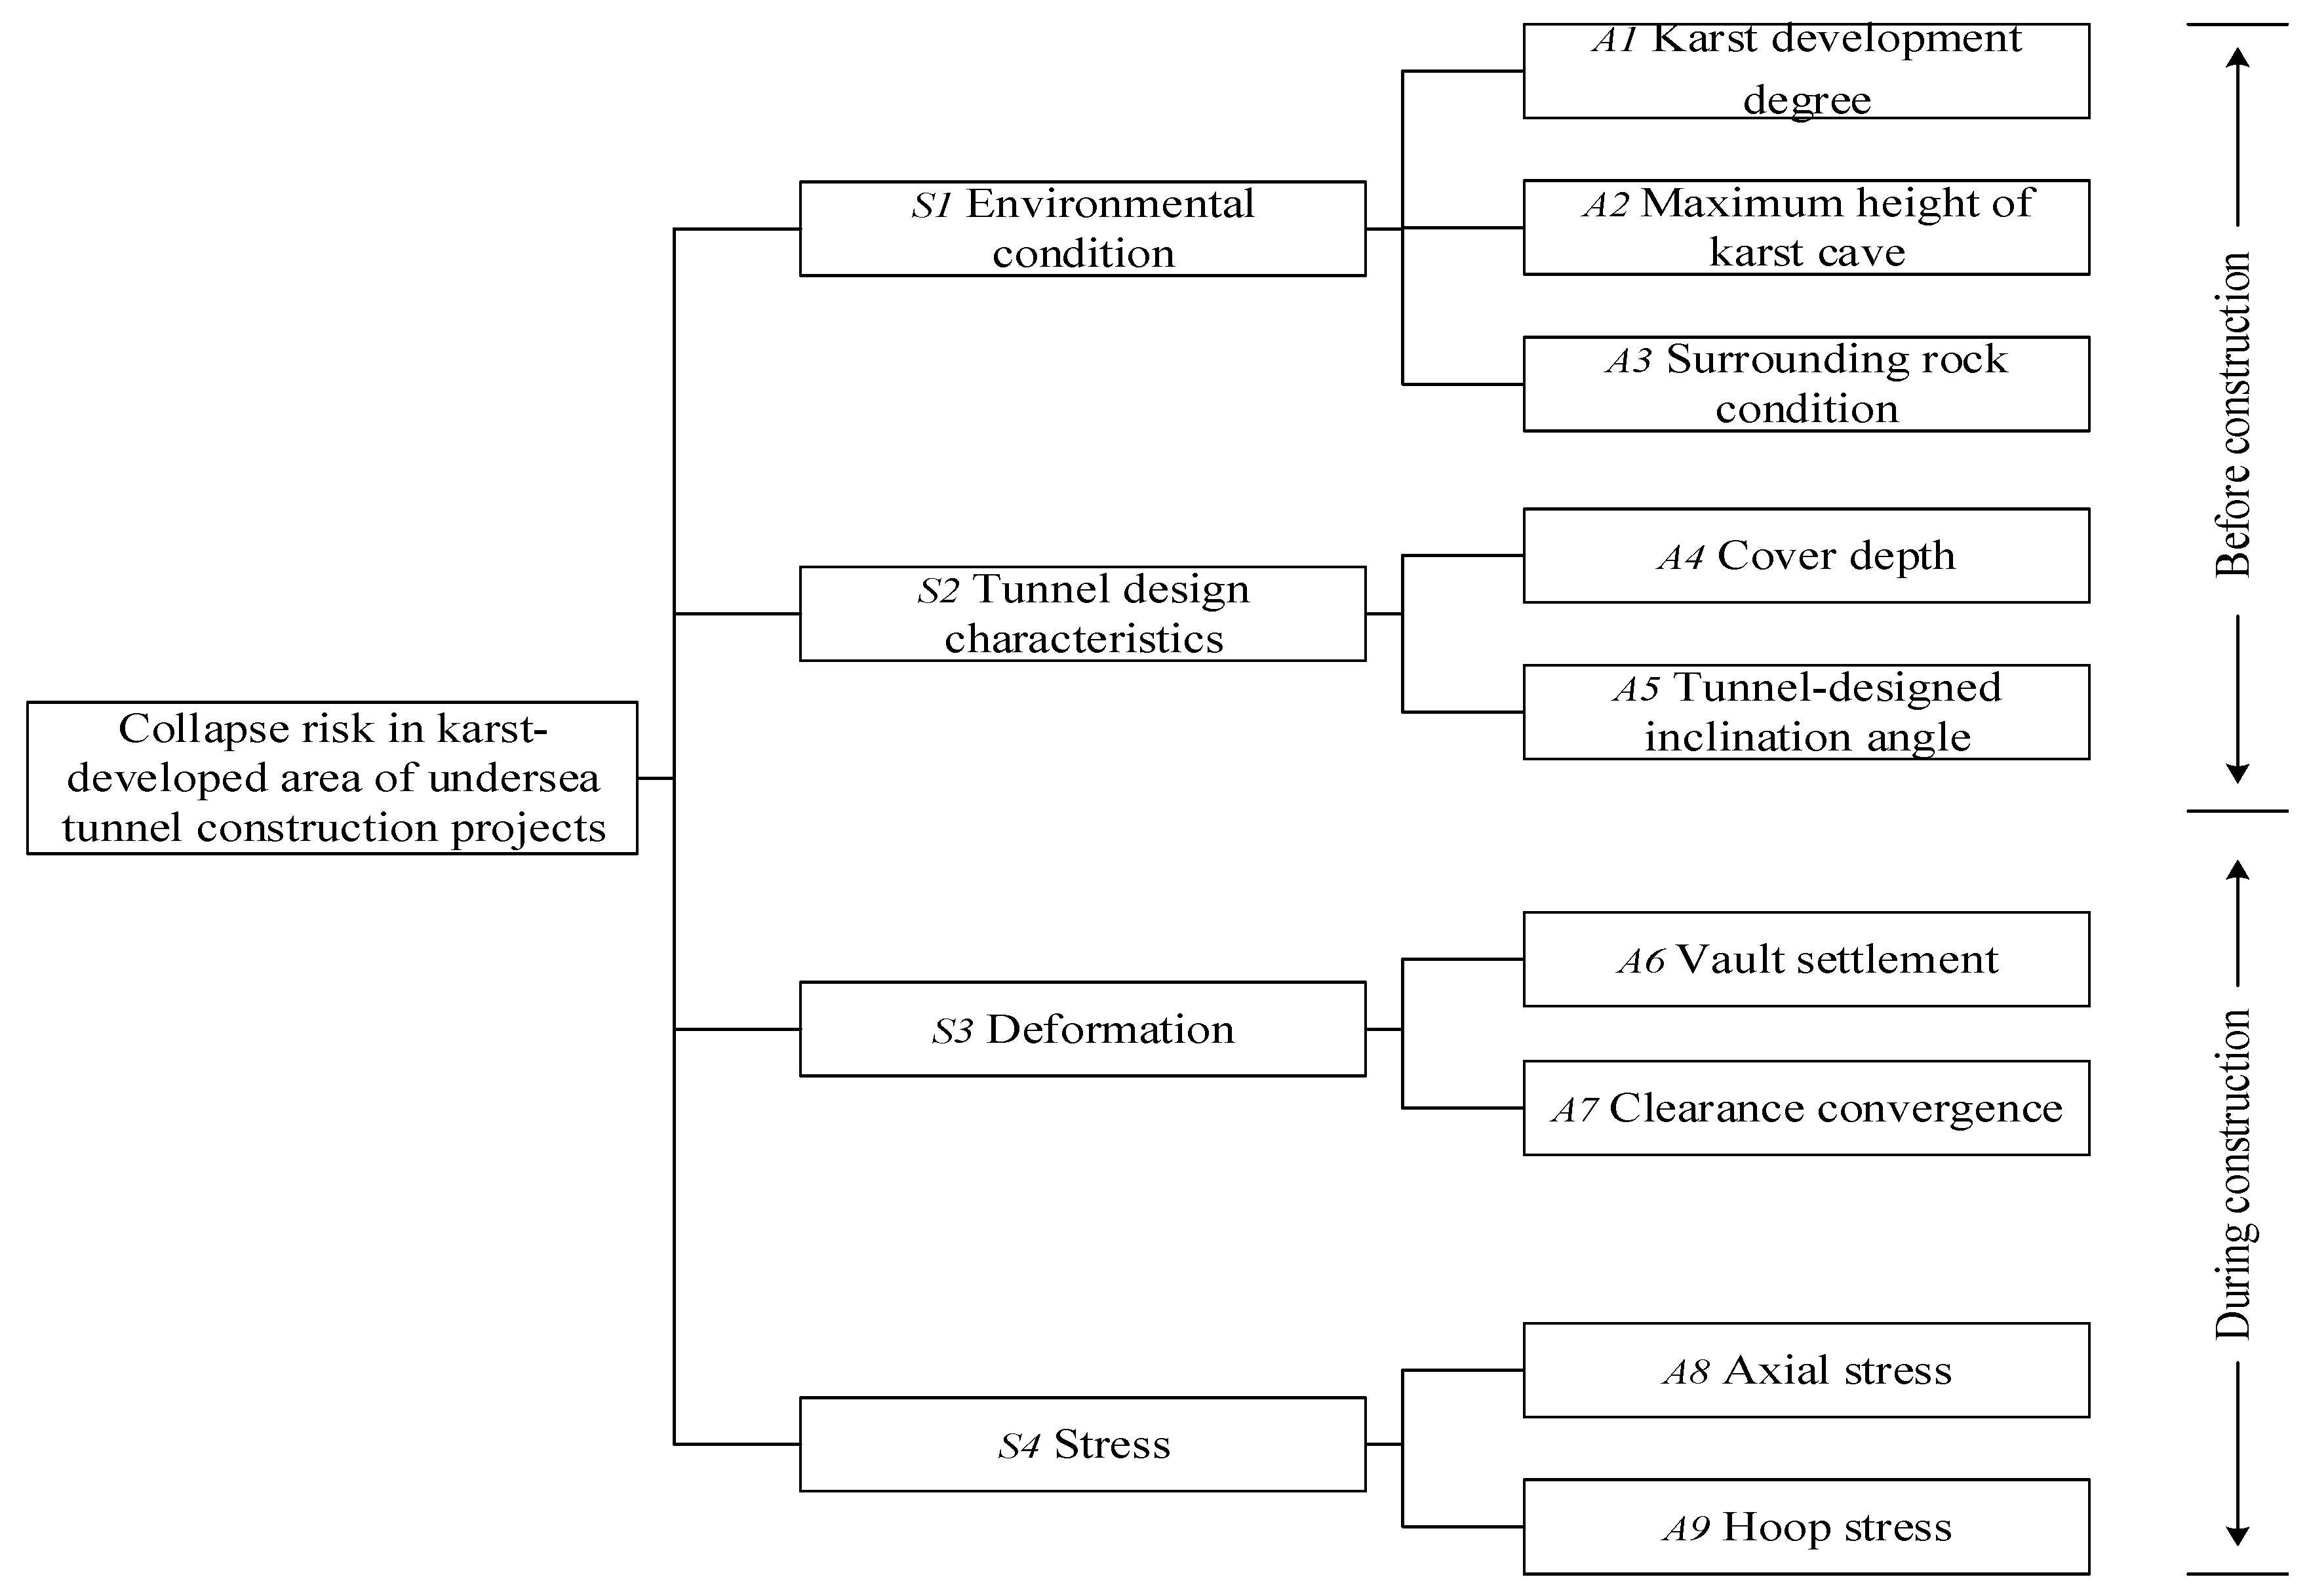
4.1. Establishment of Tunnel Collapse Risk Evaluation Index System
- (1)
- Evaluation index system of collapse risk before construction
- (2)
- Evaluation index system of collapse risk during construction
4.2. BIM-Based Information Expression and Extraction
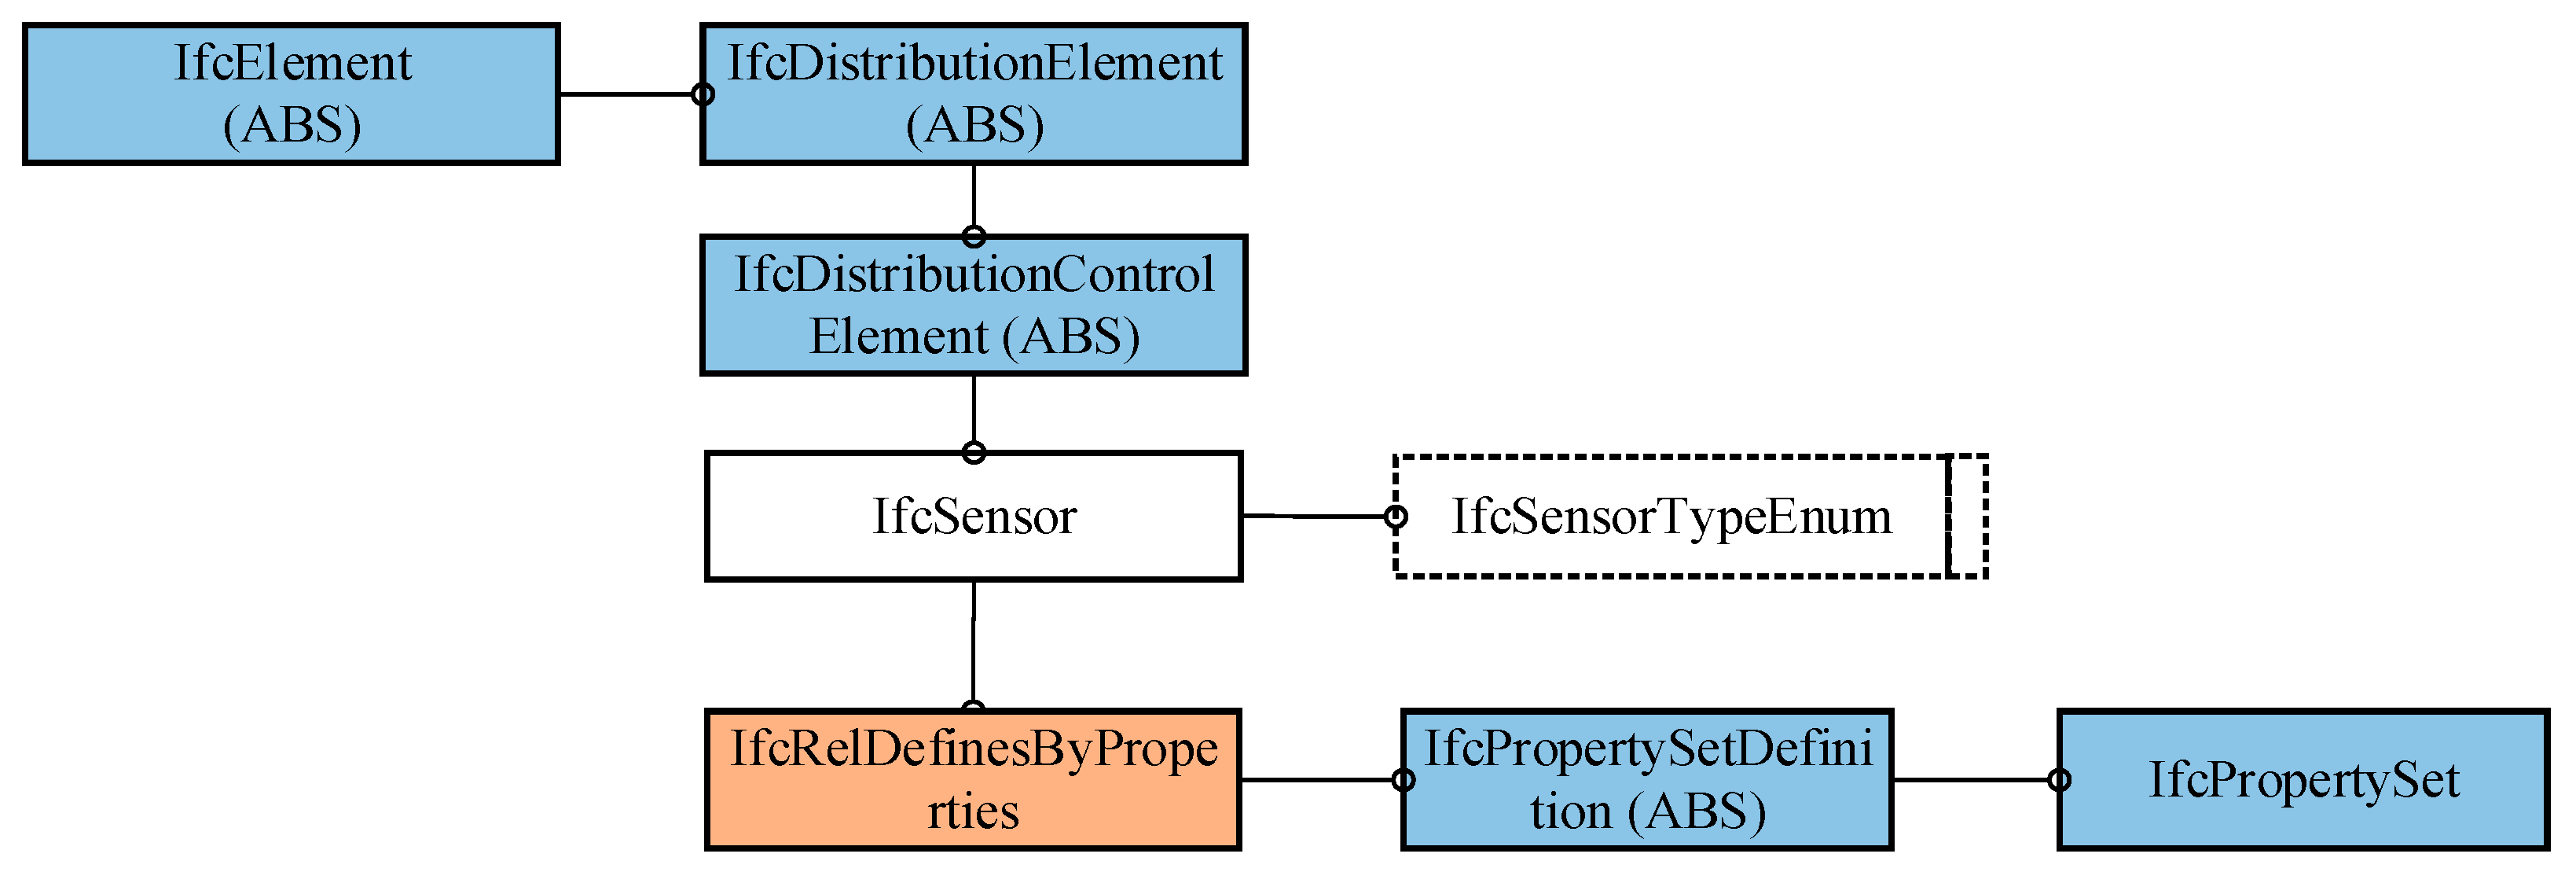
4.2.1. Semantic Enrichment of BIM Models
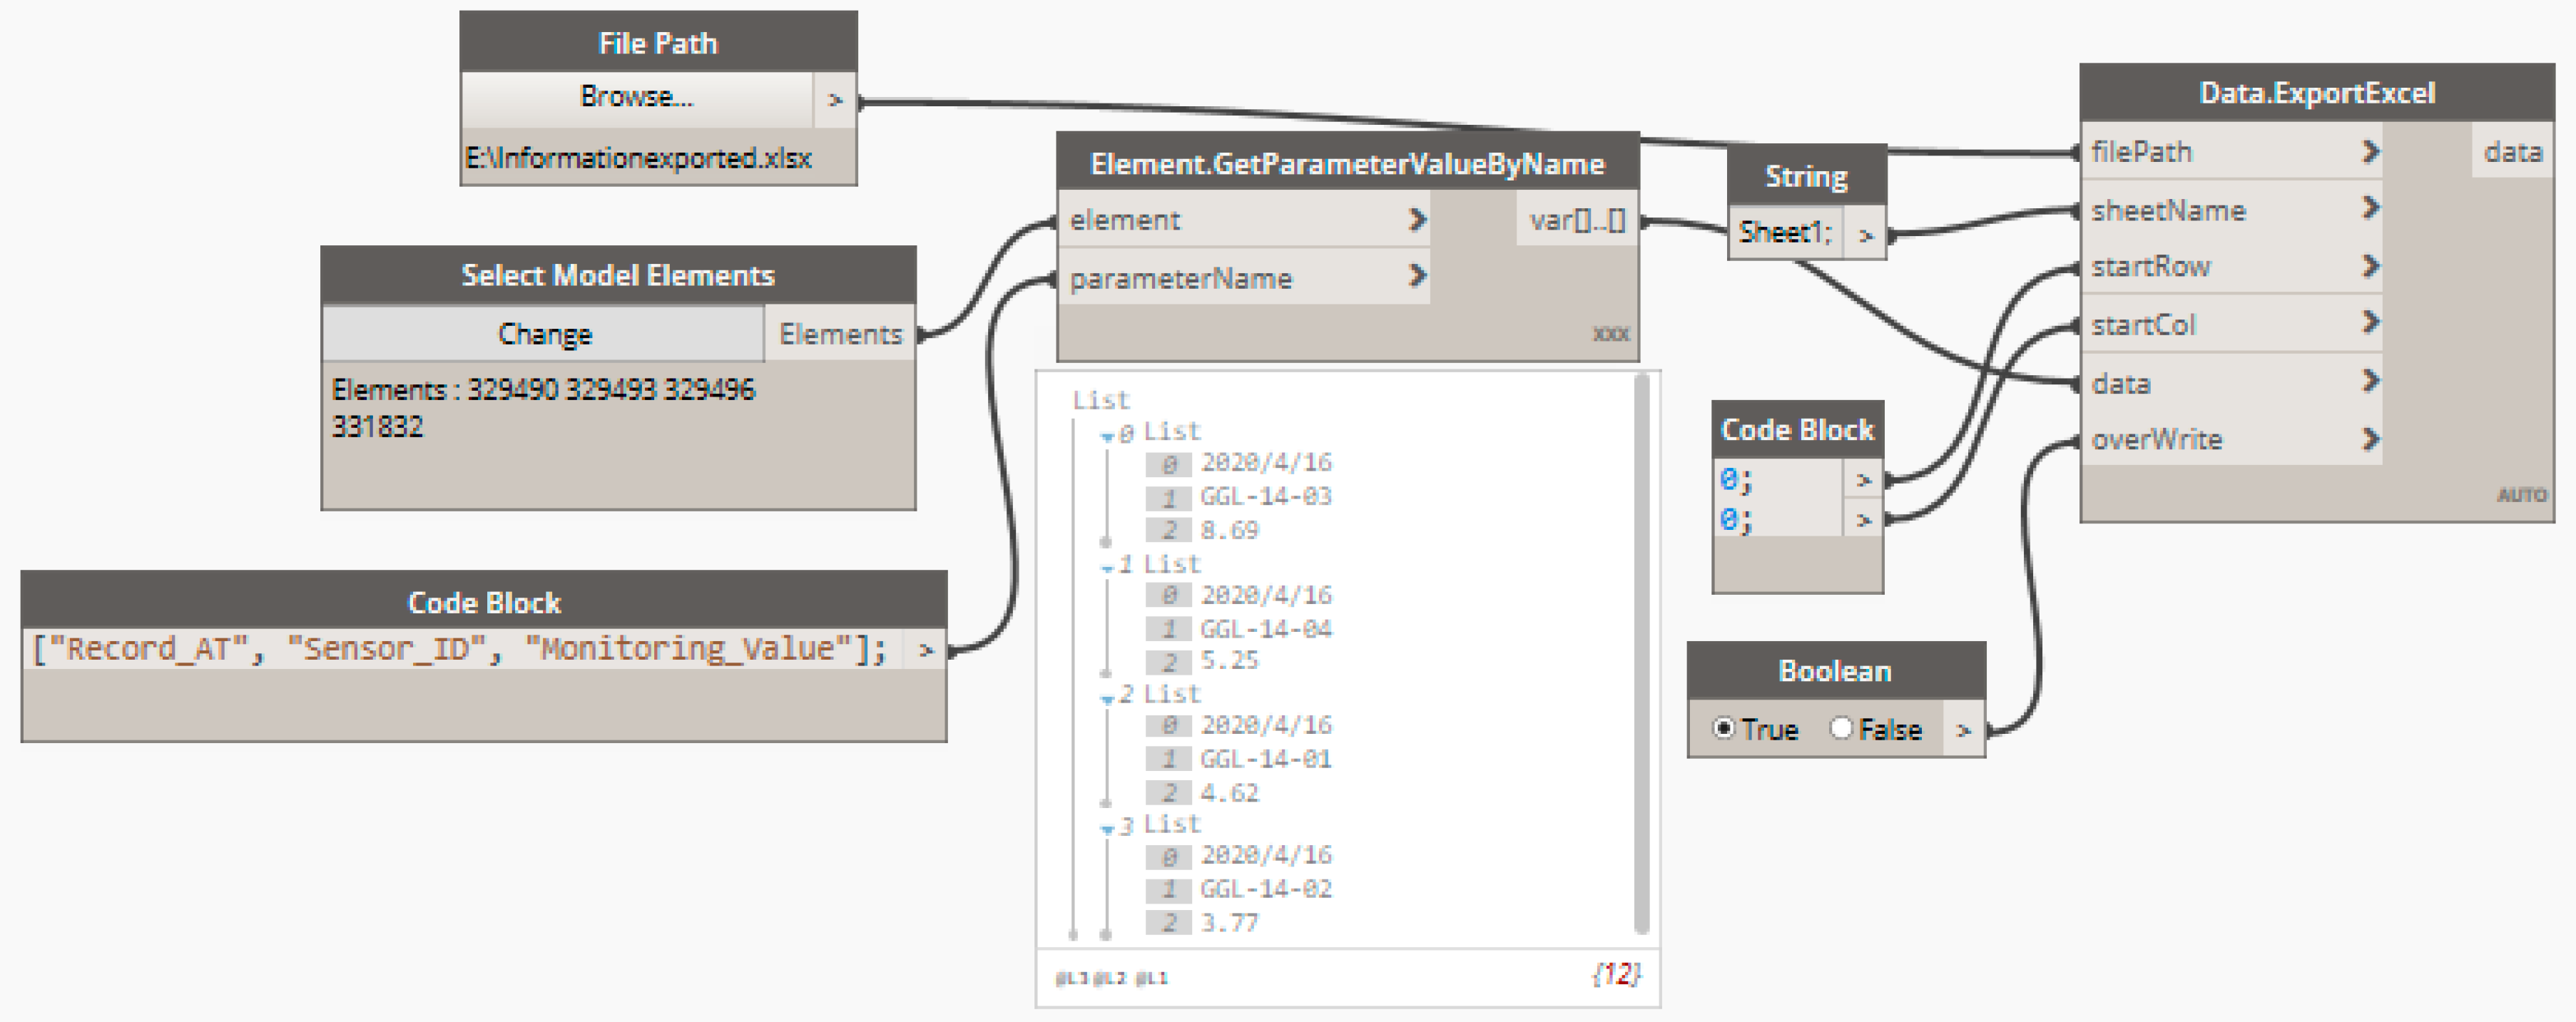
4.2.2. Information Extraction from BIM Models
4.3. Multi-Information Fusion Method
4.3.1. BPAs Calculation
4.3.2. Information Fusion under Conflict
4.3.3. Evidence Update in a Dynamic Environment
4.4. Safety Risk Perception
5. Case Study
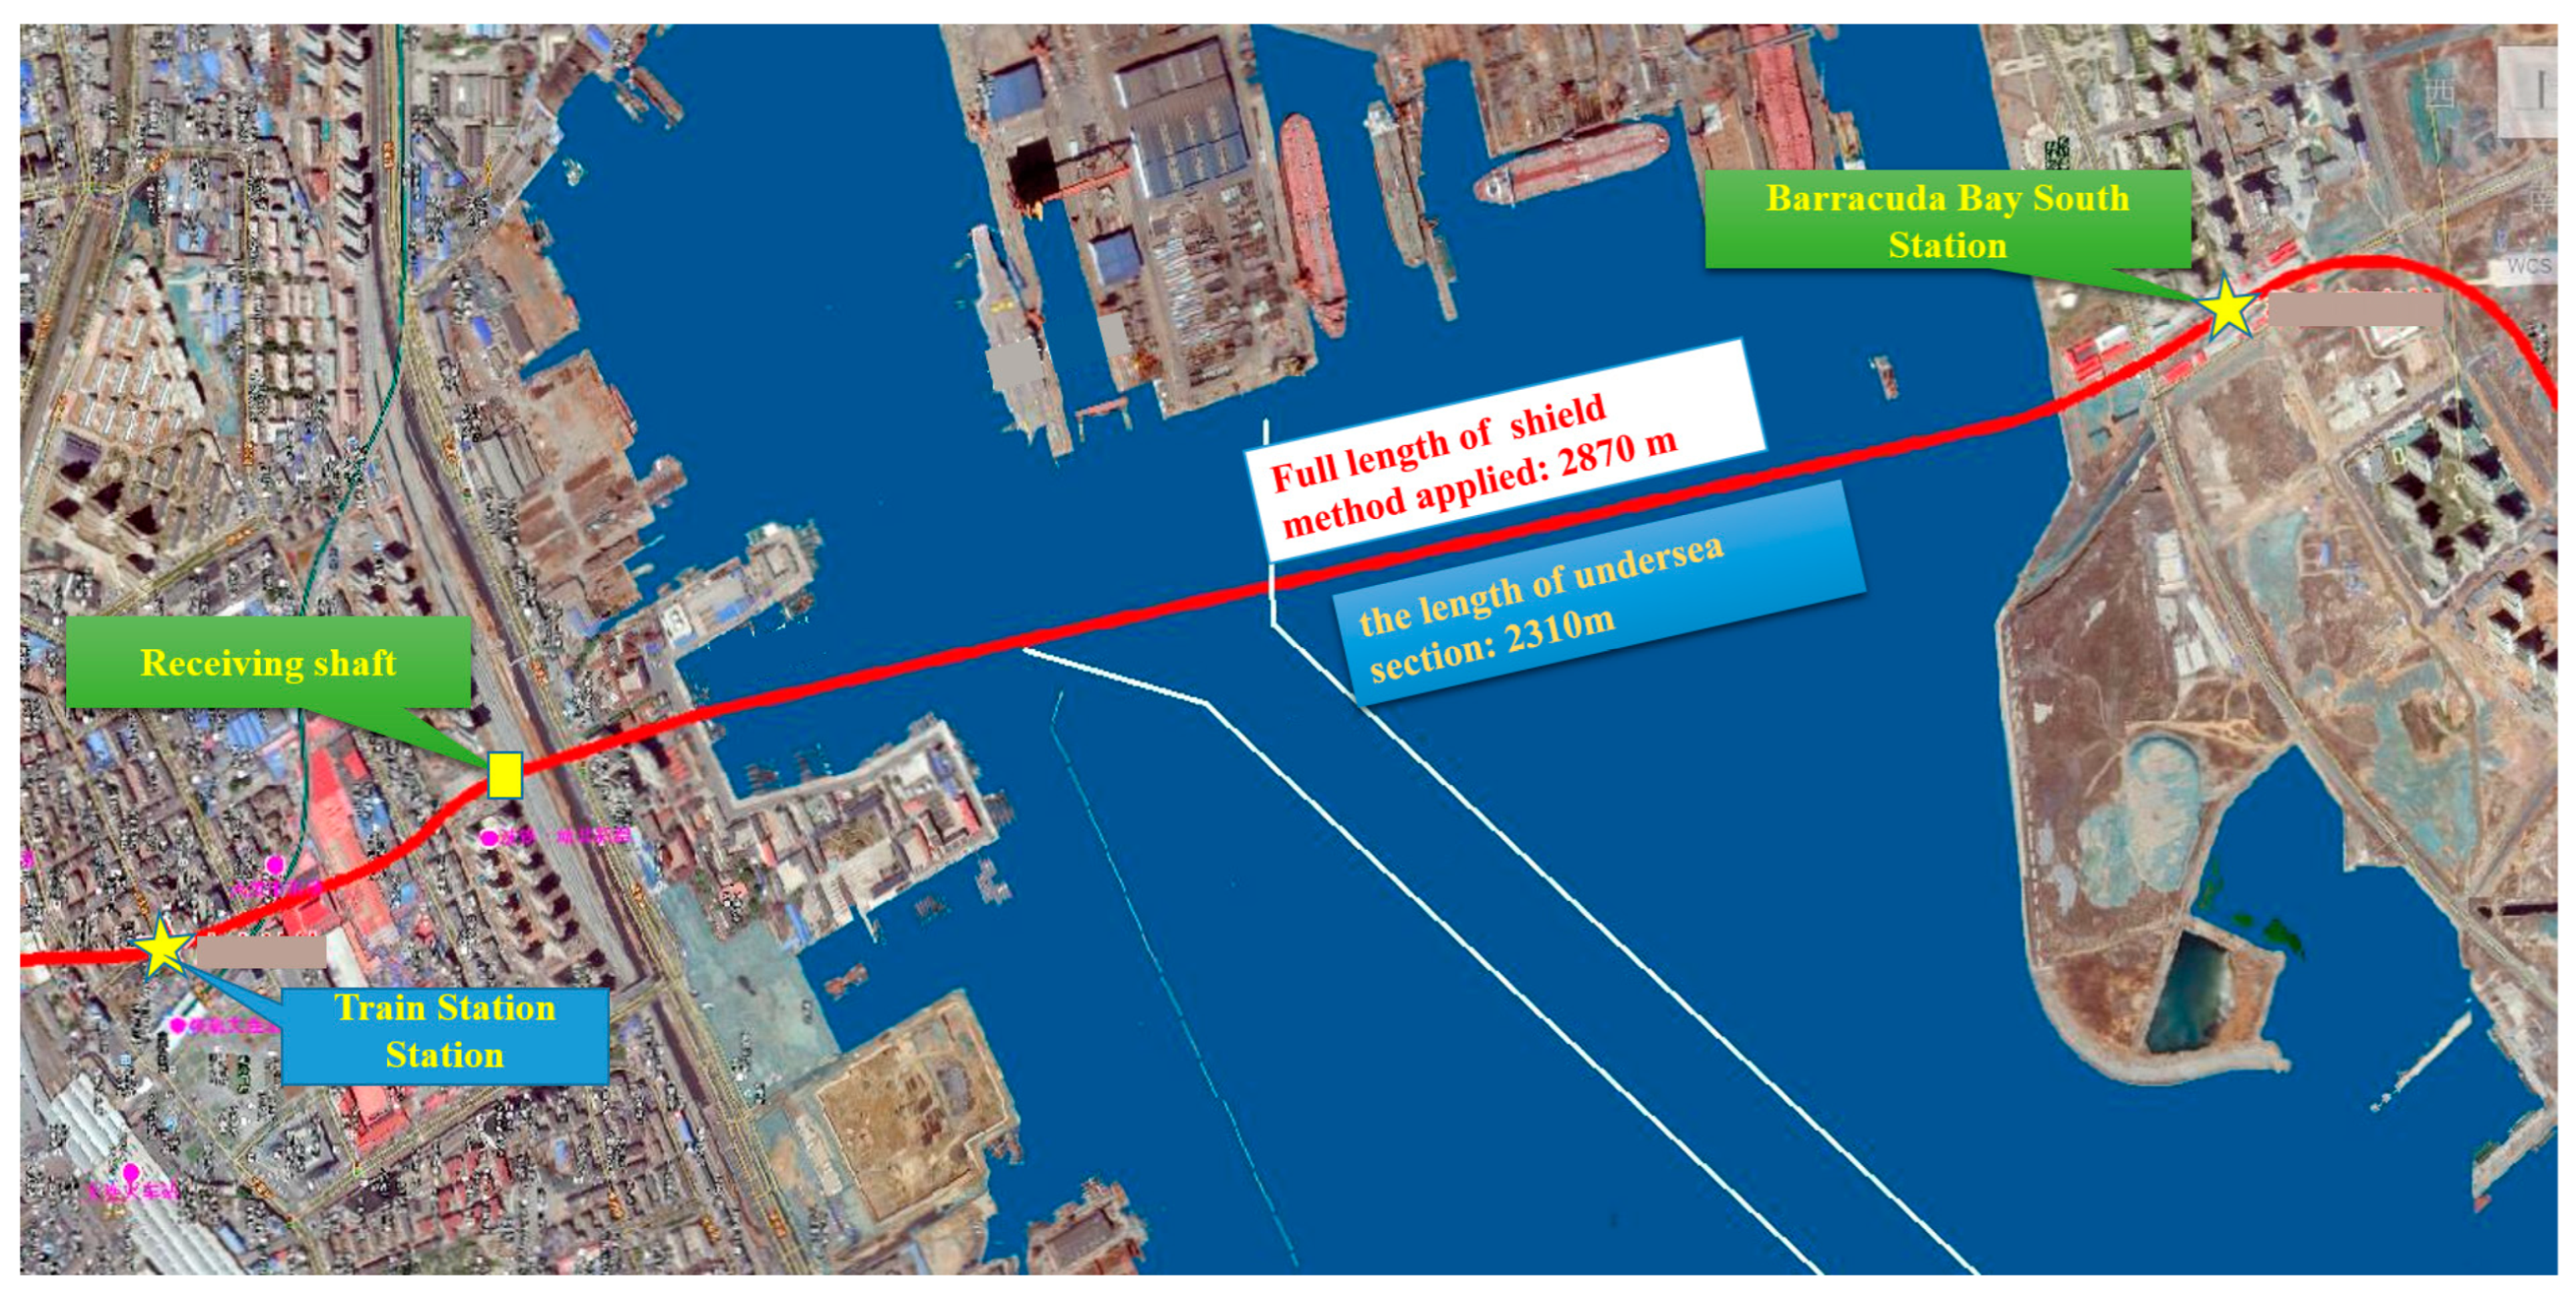
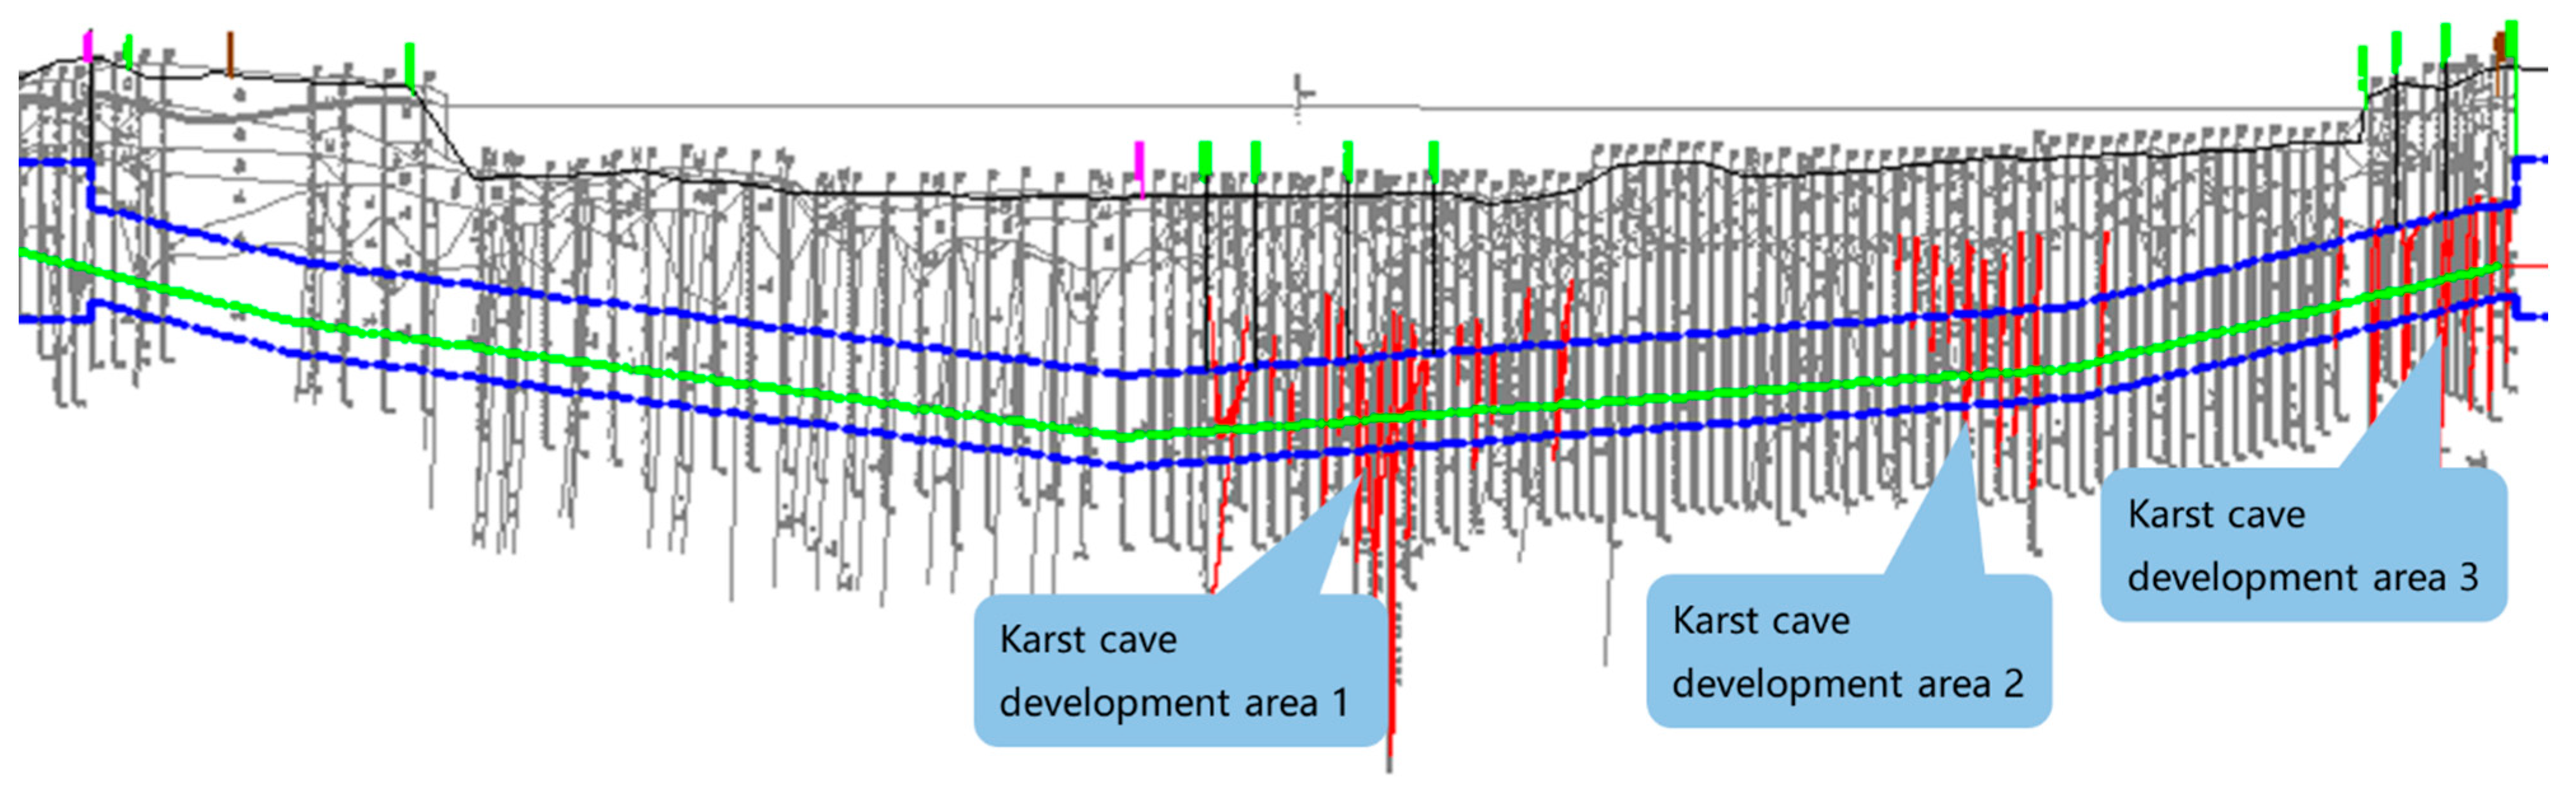
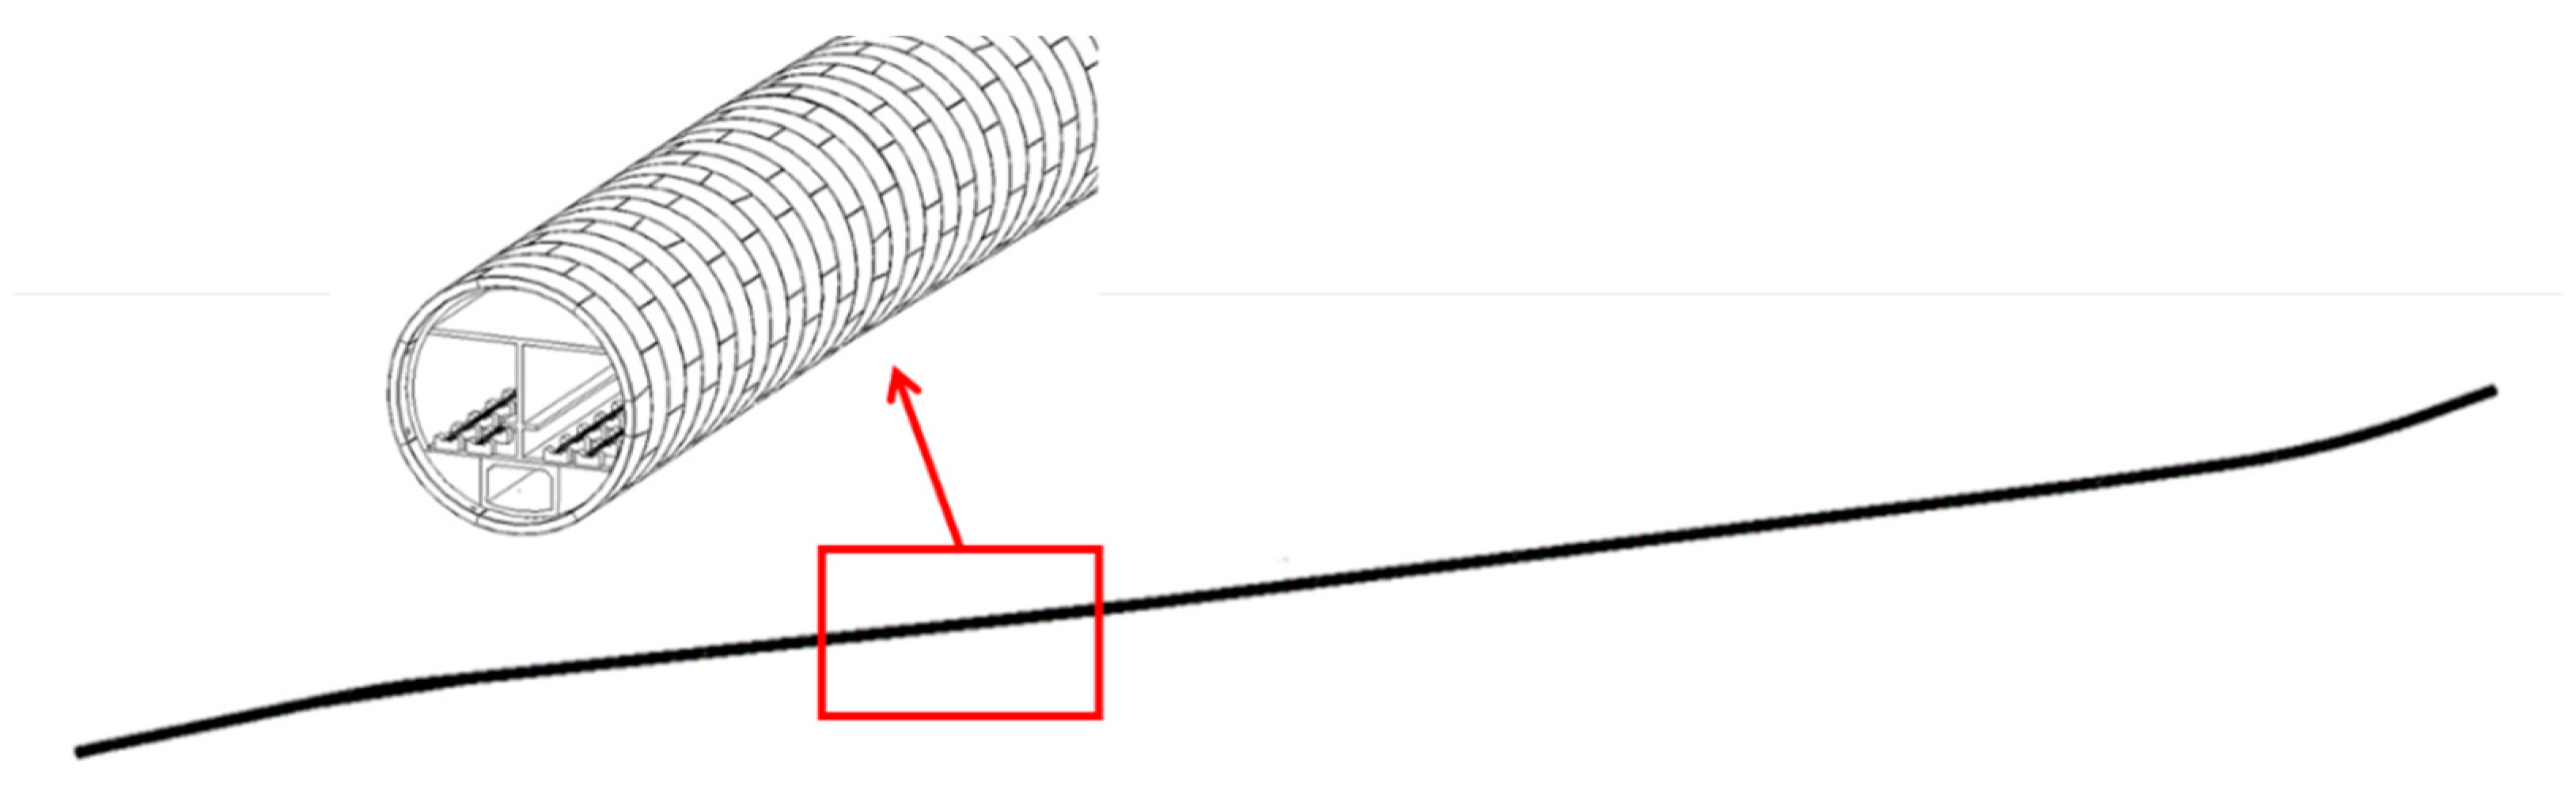
5.1. Backgrounds
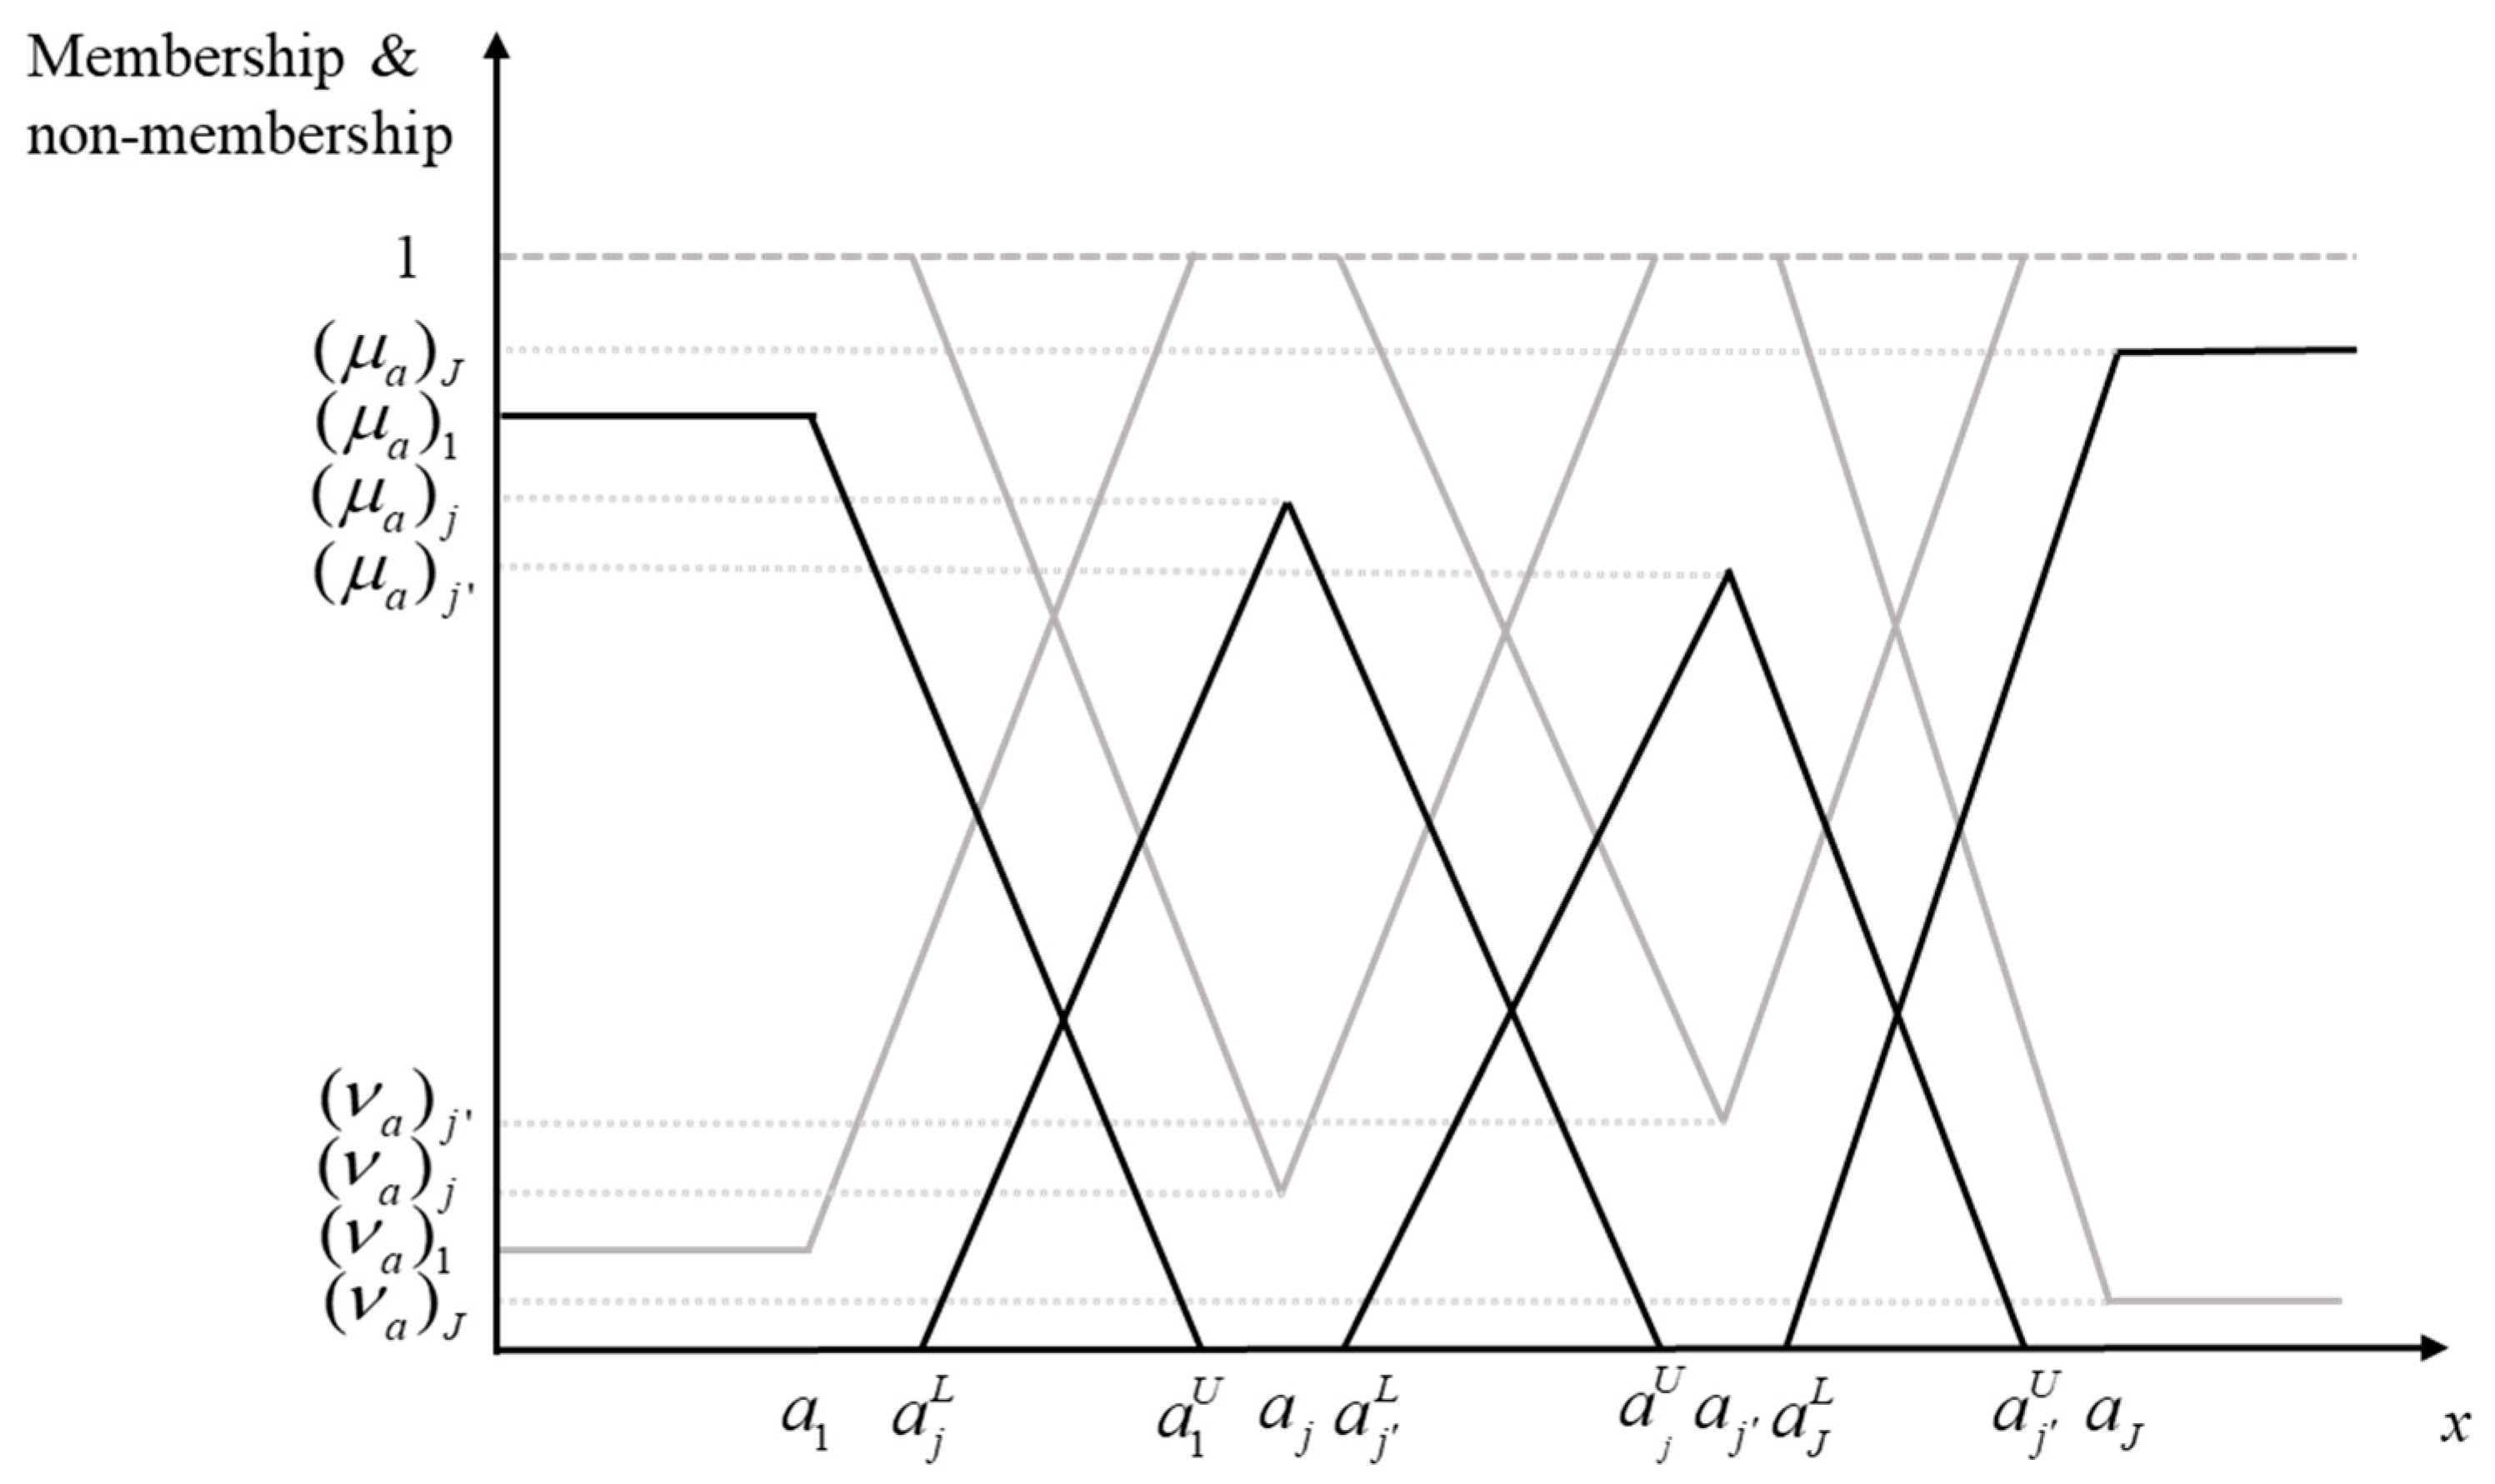
5.2. Membership and Non-Membership Function Determination
- (1)
- (2)
- For the indexes , according to the Code for monitoring measurement of urban rail transit engineering in China, the control value of the deformation monitoring of segments should include the cumulative change value and the change rate [39]. According to the specifications and field experience, for the tunnel construction project in the case study, the cumulative change control value for vault settlement and clearance convergence is 20 mm and 24 mm, and the control change rate is 2 mm/d and 3 mm/d, respectively. Since the monitoring frequency is set as 1 day, the daily control values are 2 mm and 3 mm, respectively. The control value is taken as , with , and taking 80%, 50%, and 20% of the control value, respectively.
- (3)
- For the indexes , similar to the indexes , the stress monitoring control value should include the maximum and minimum values according to the Chinese national code [39]. According to engineering experience, in the case study, the maximum and minimum segment stress control values are set as 23.1 Mpa and −1.89 Mpa, respectively. The control value is taken as , with , and taking 80%, 50%, and 20% of the control value, respectively.
5.3. Semantic Enrichment of BIM Model and Information Extraction
- (1)
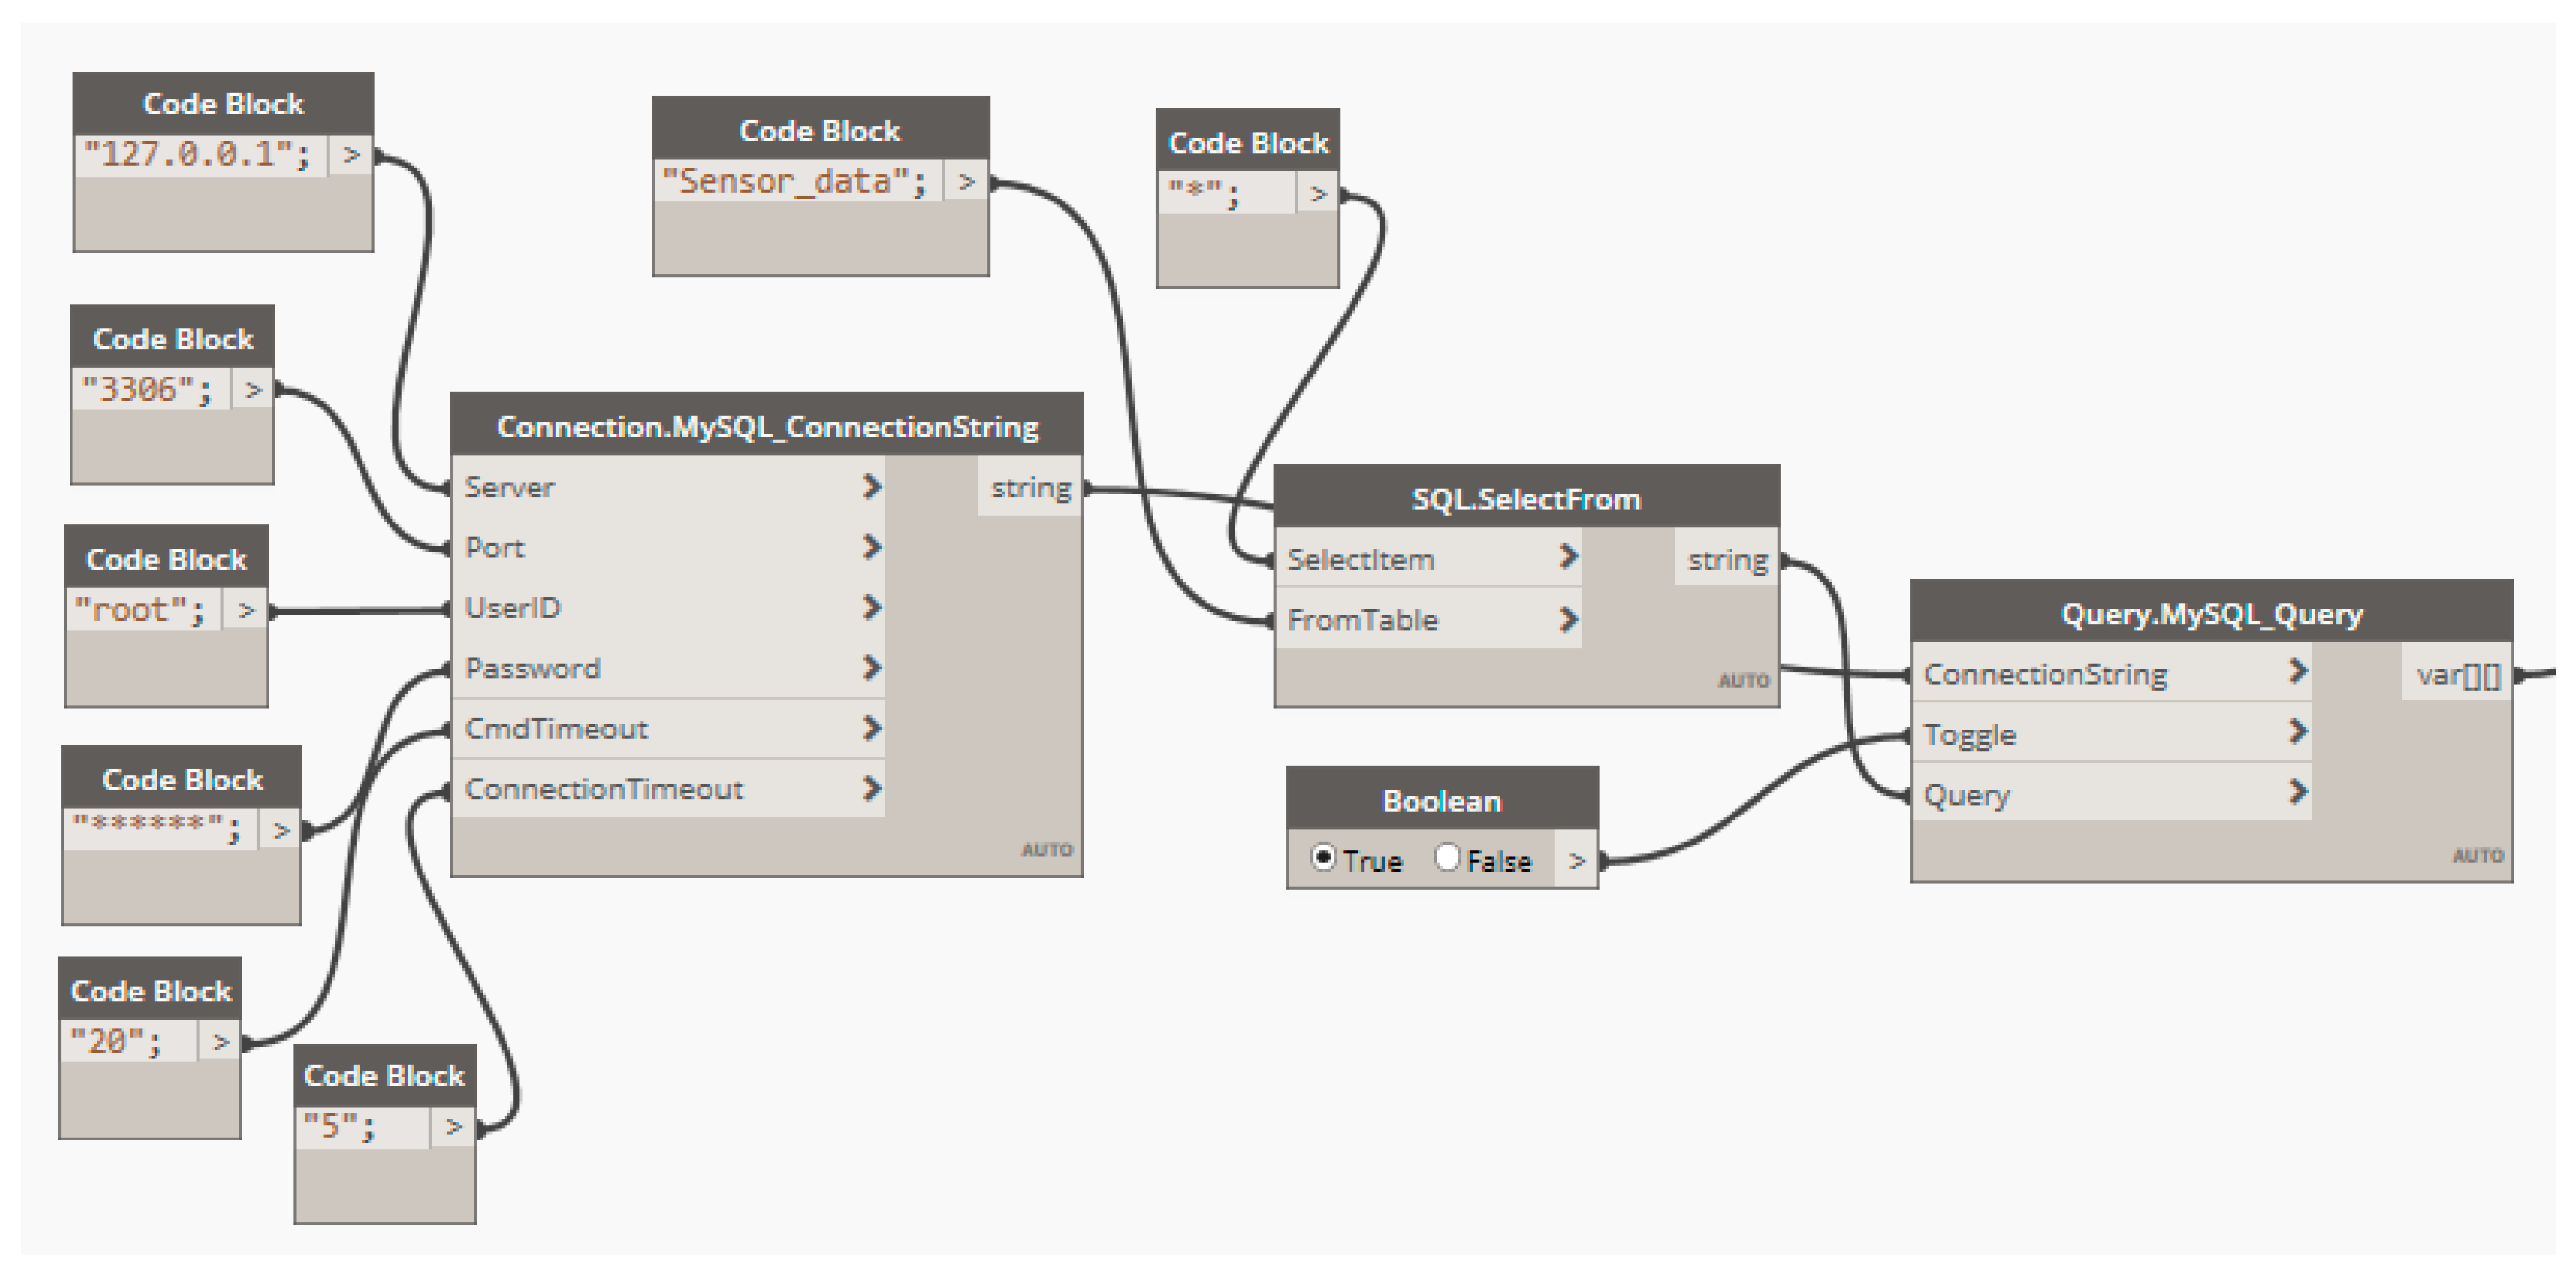
- Connect the BIM model to the MySQL relational database and acquire information.
- (2)
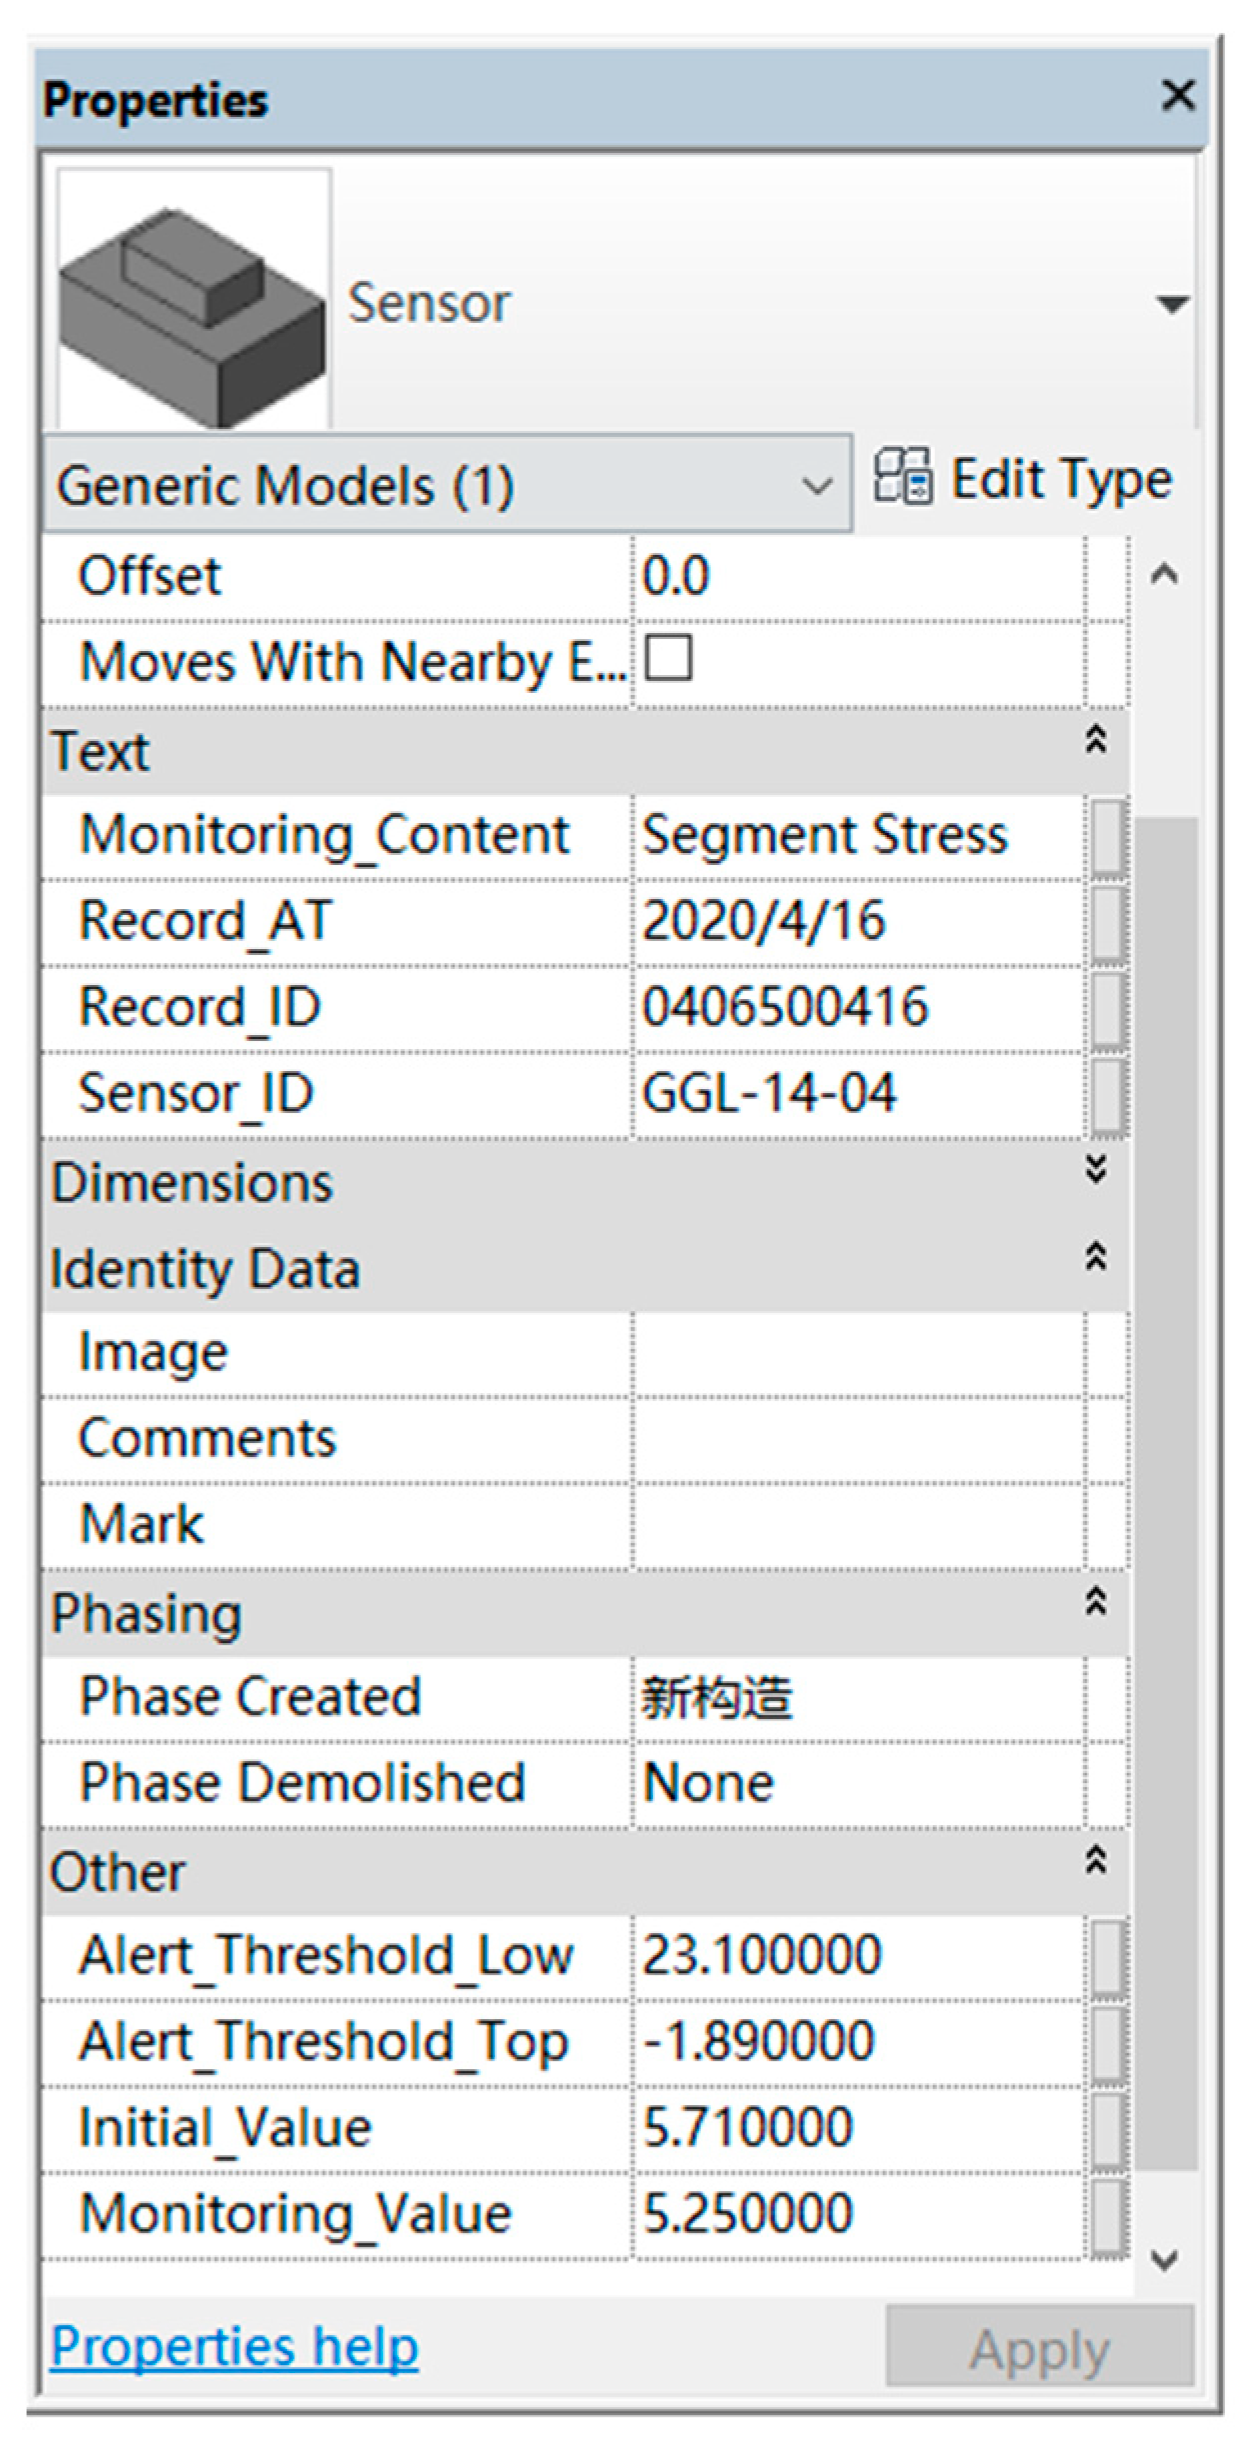
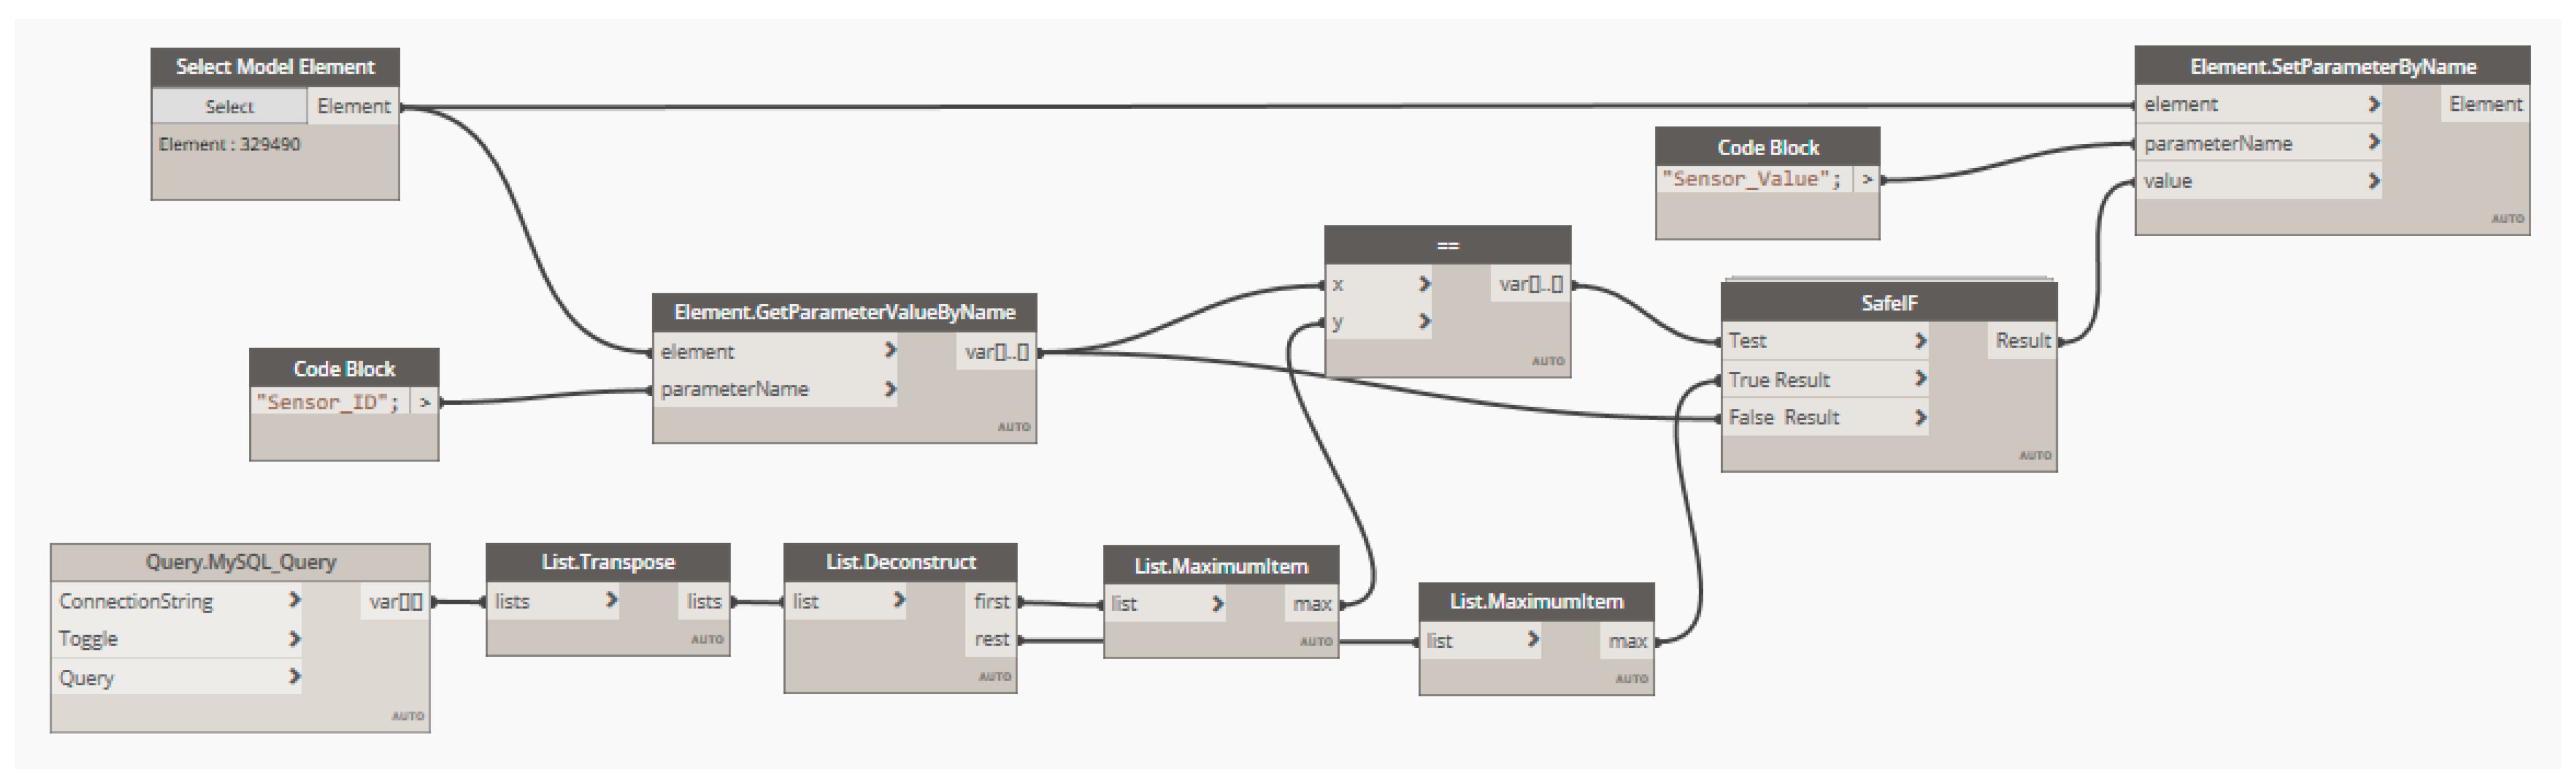
- Establish a unique relationship between monitoring ID in the BIM model and the MySQL database, and input the attribute values into the sensor model.
- (3)
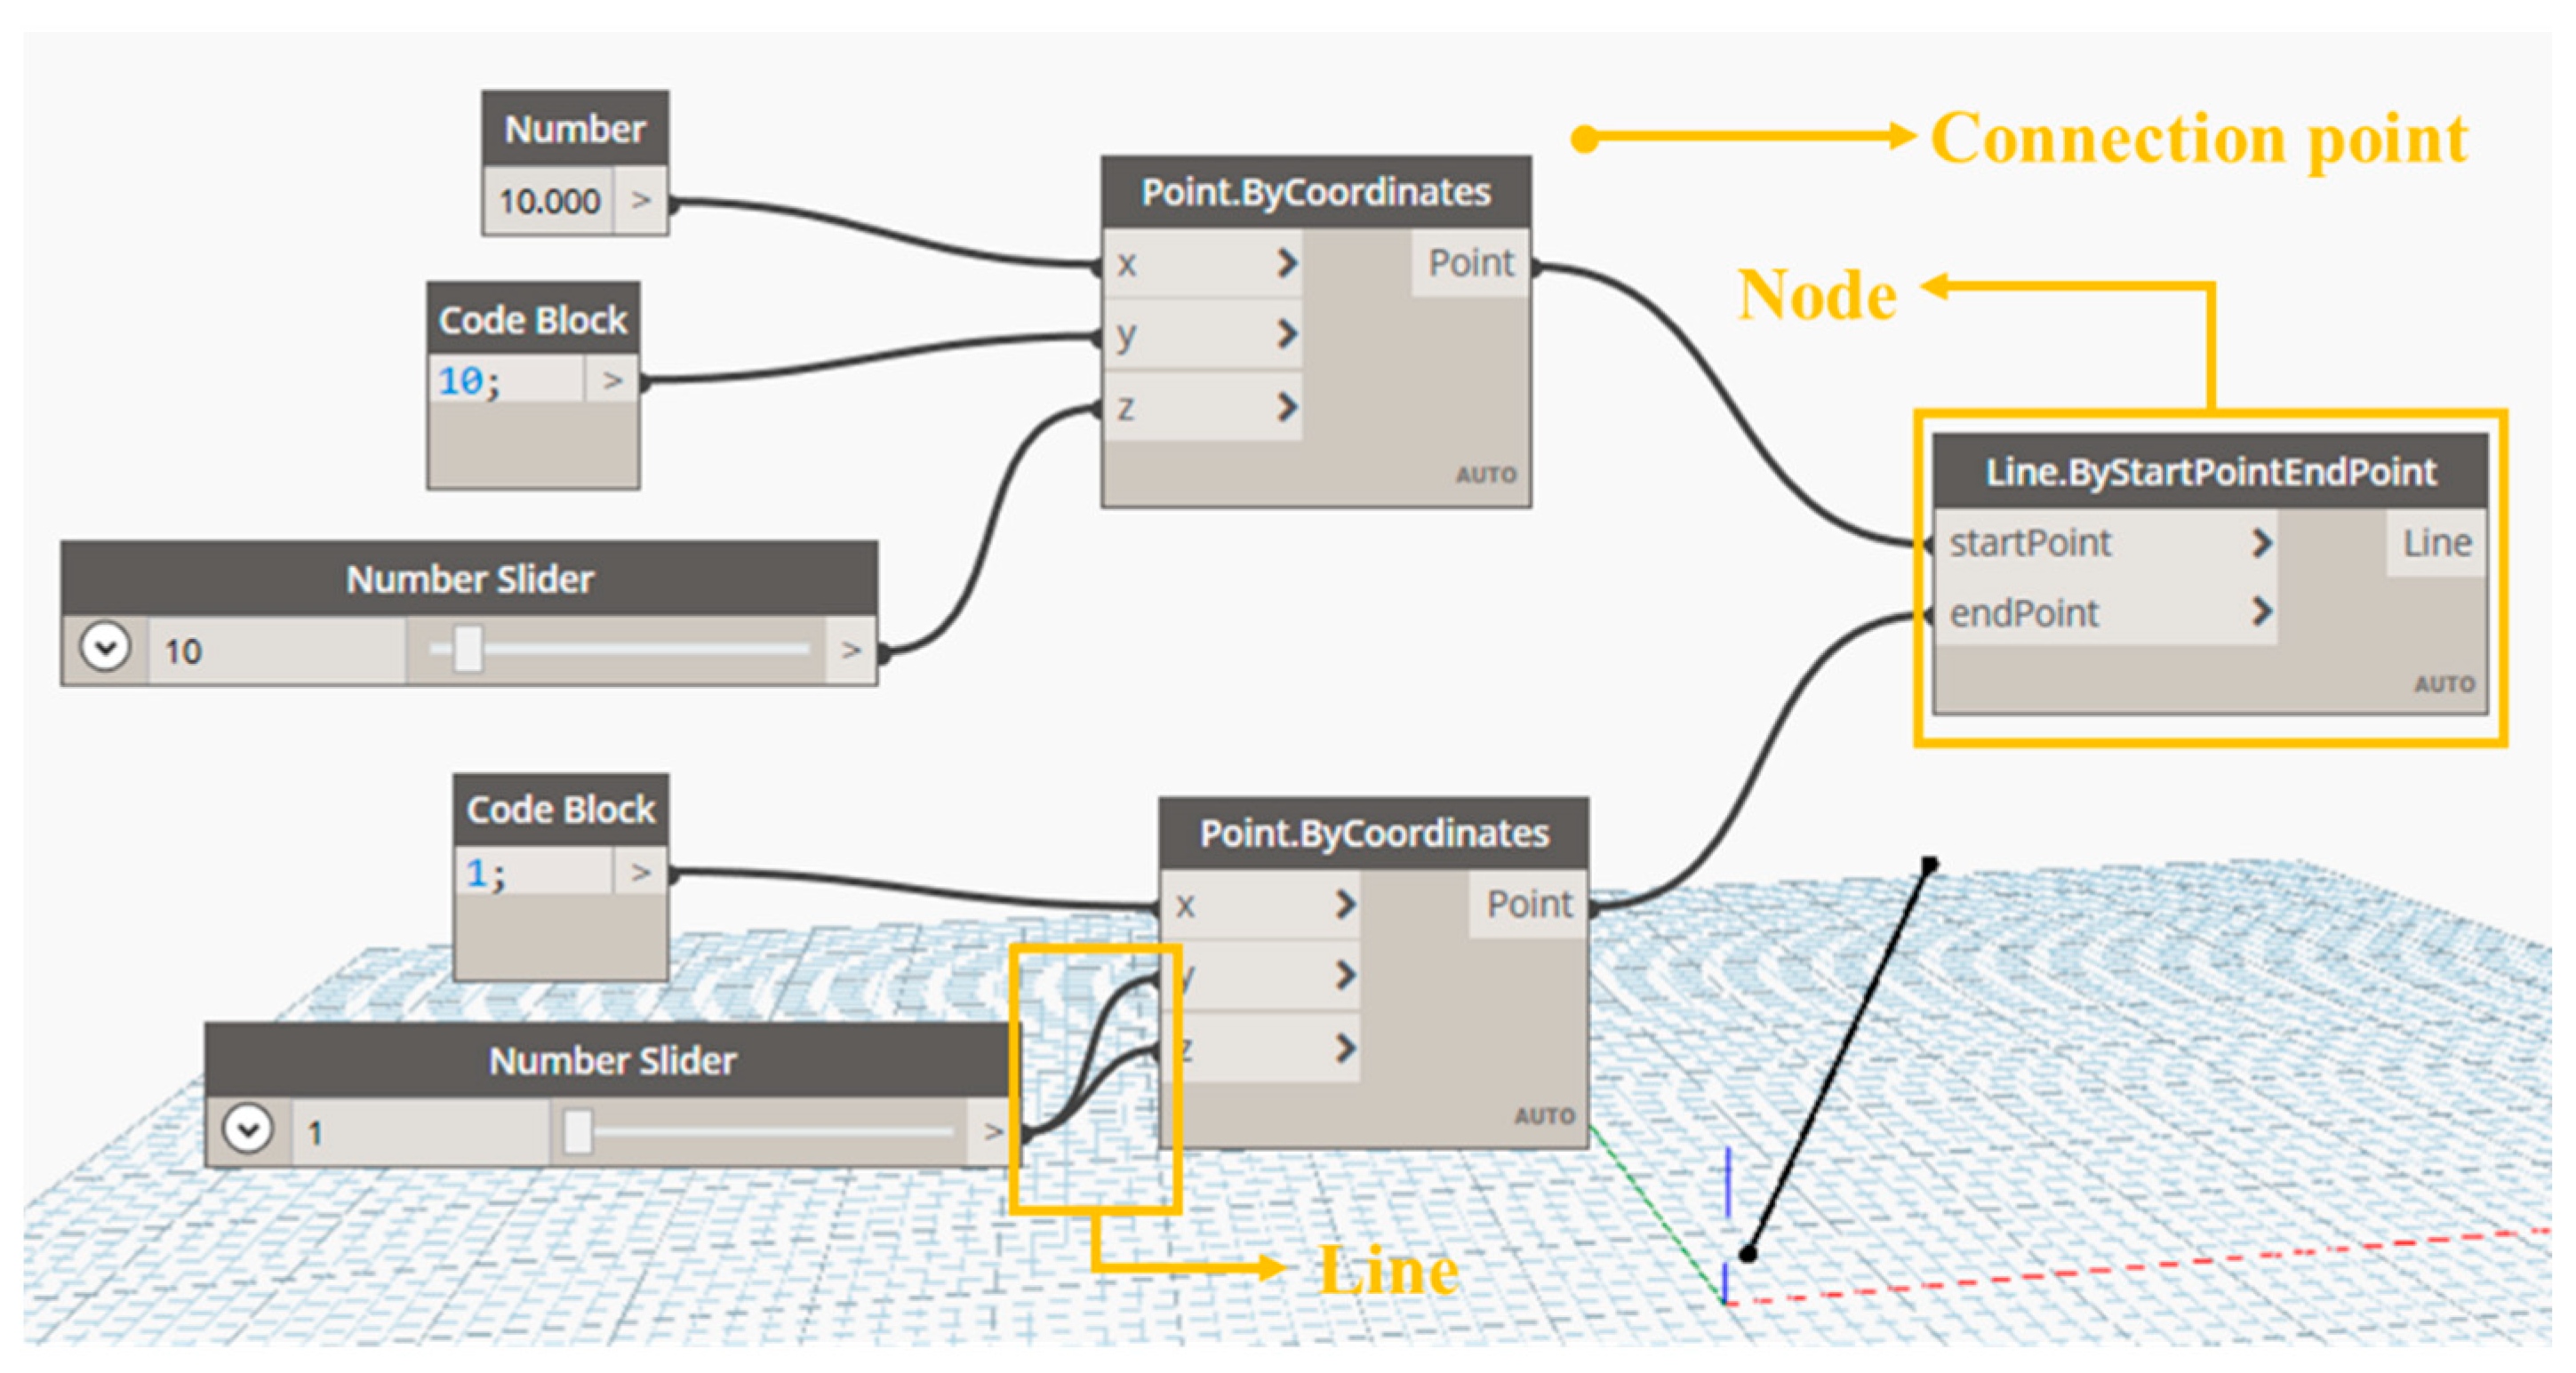
- Set the periodic running interval of Dynamo.
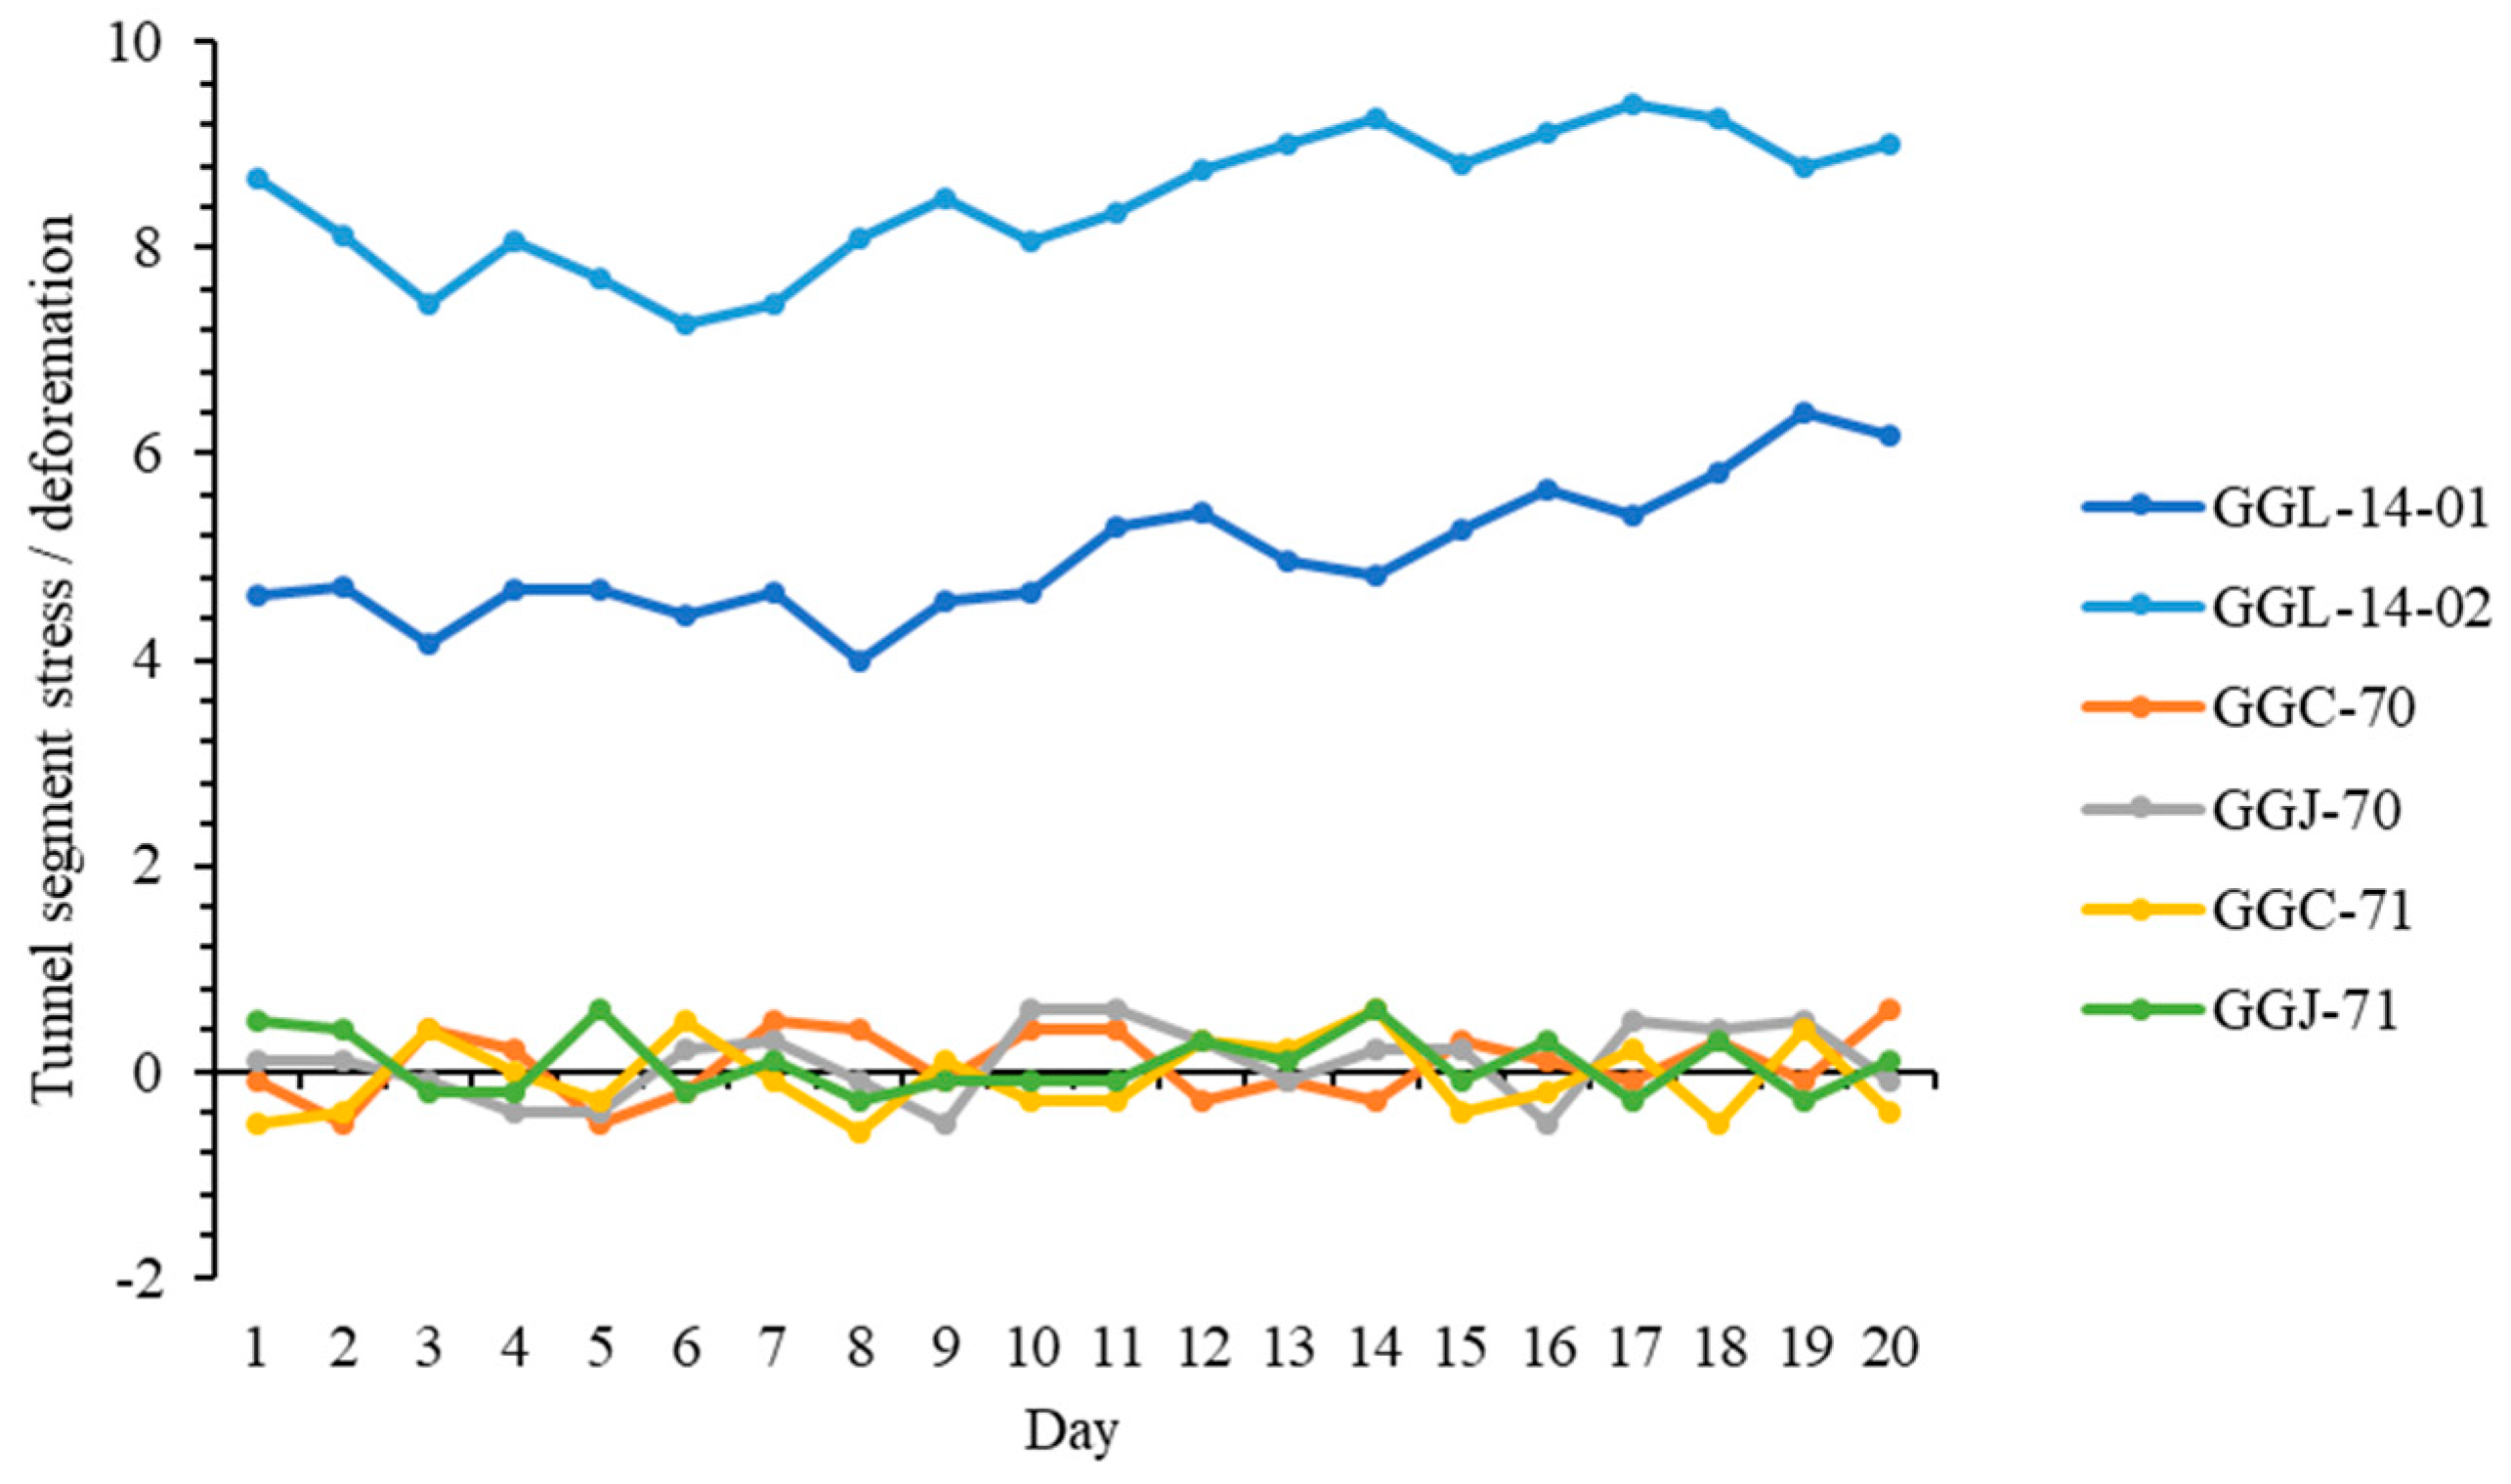
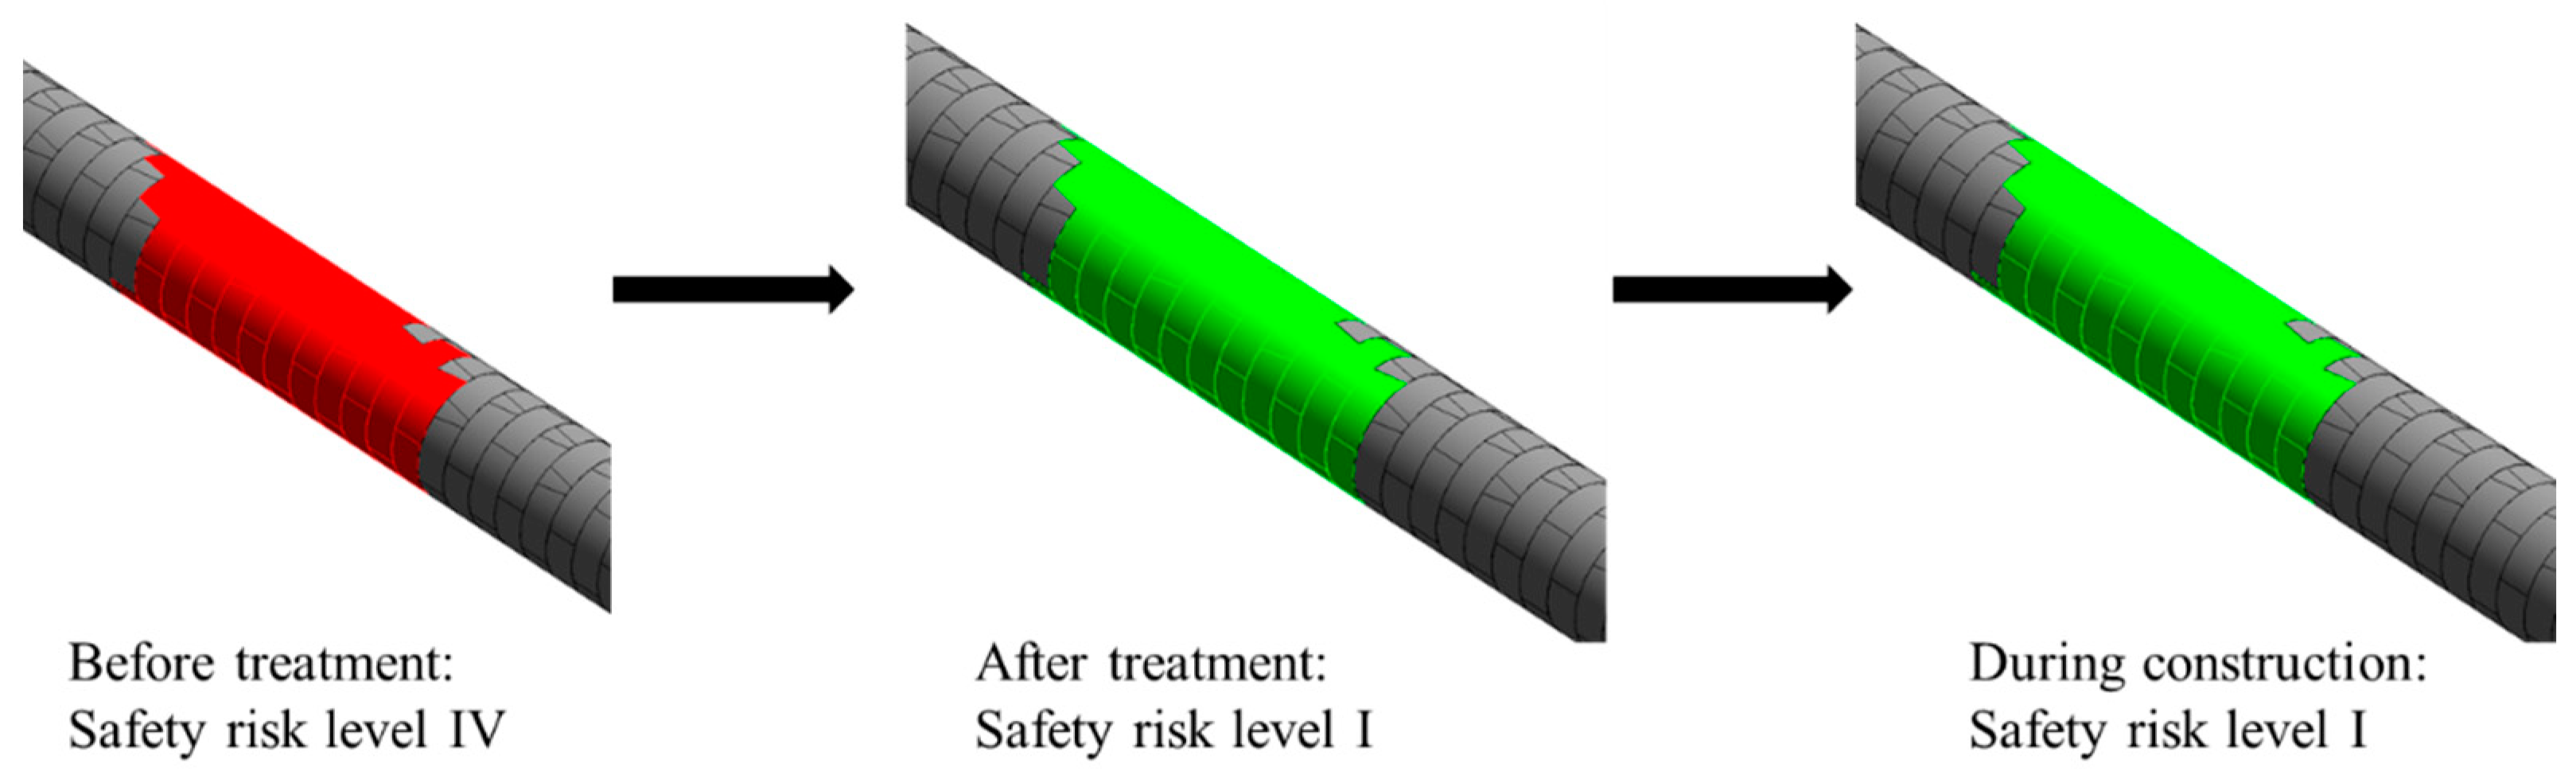
5.4. Information Fusion and Safety Risk Perception
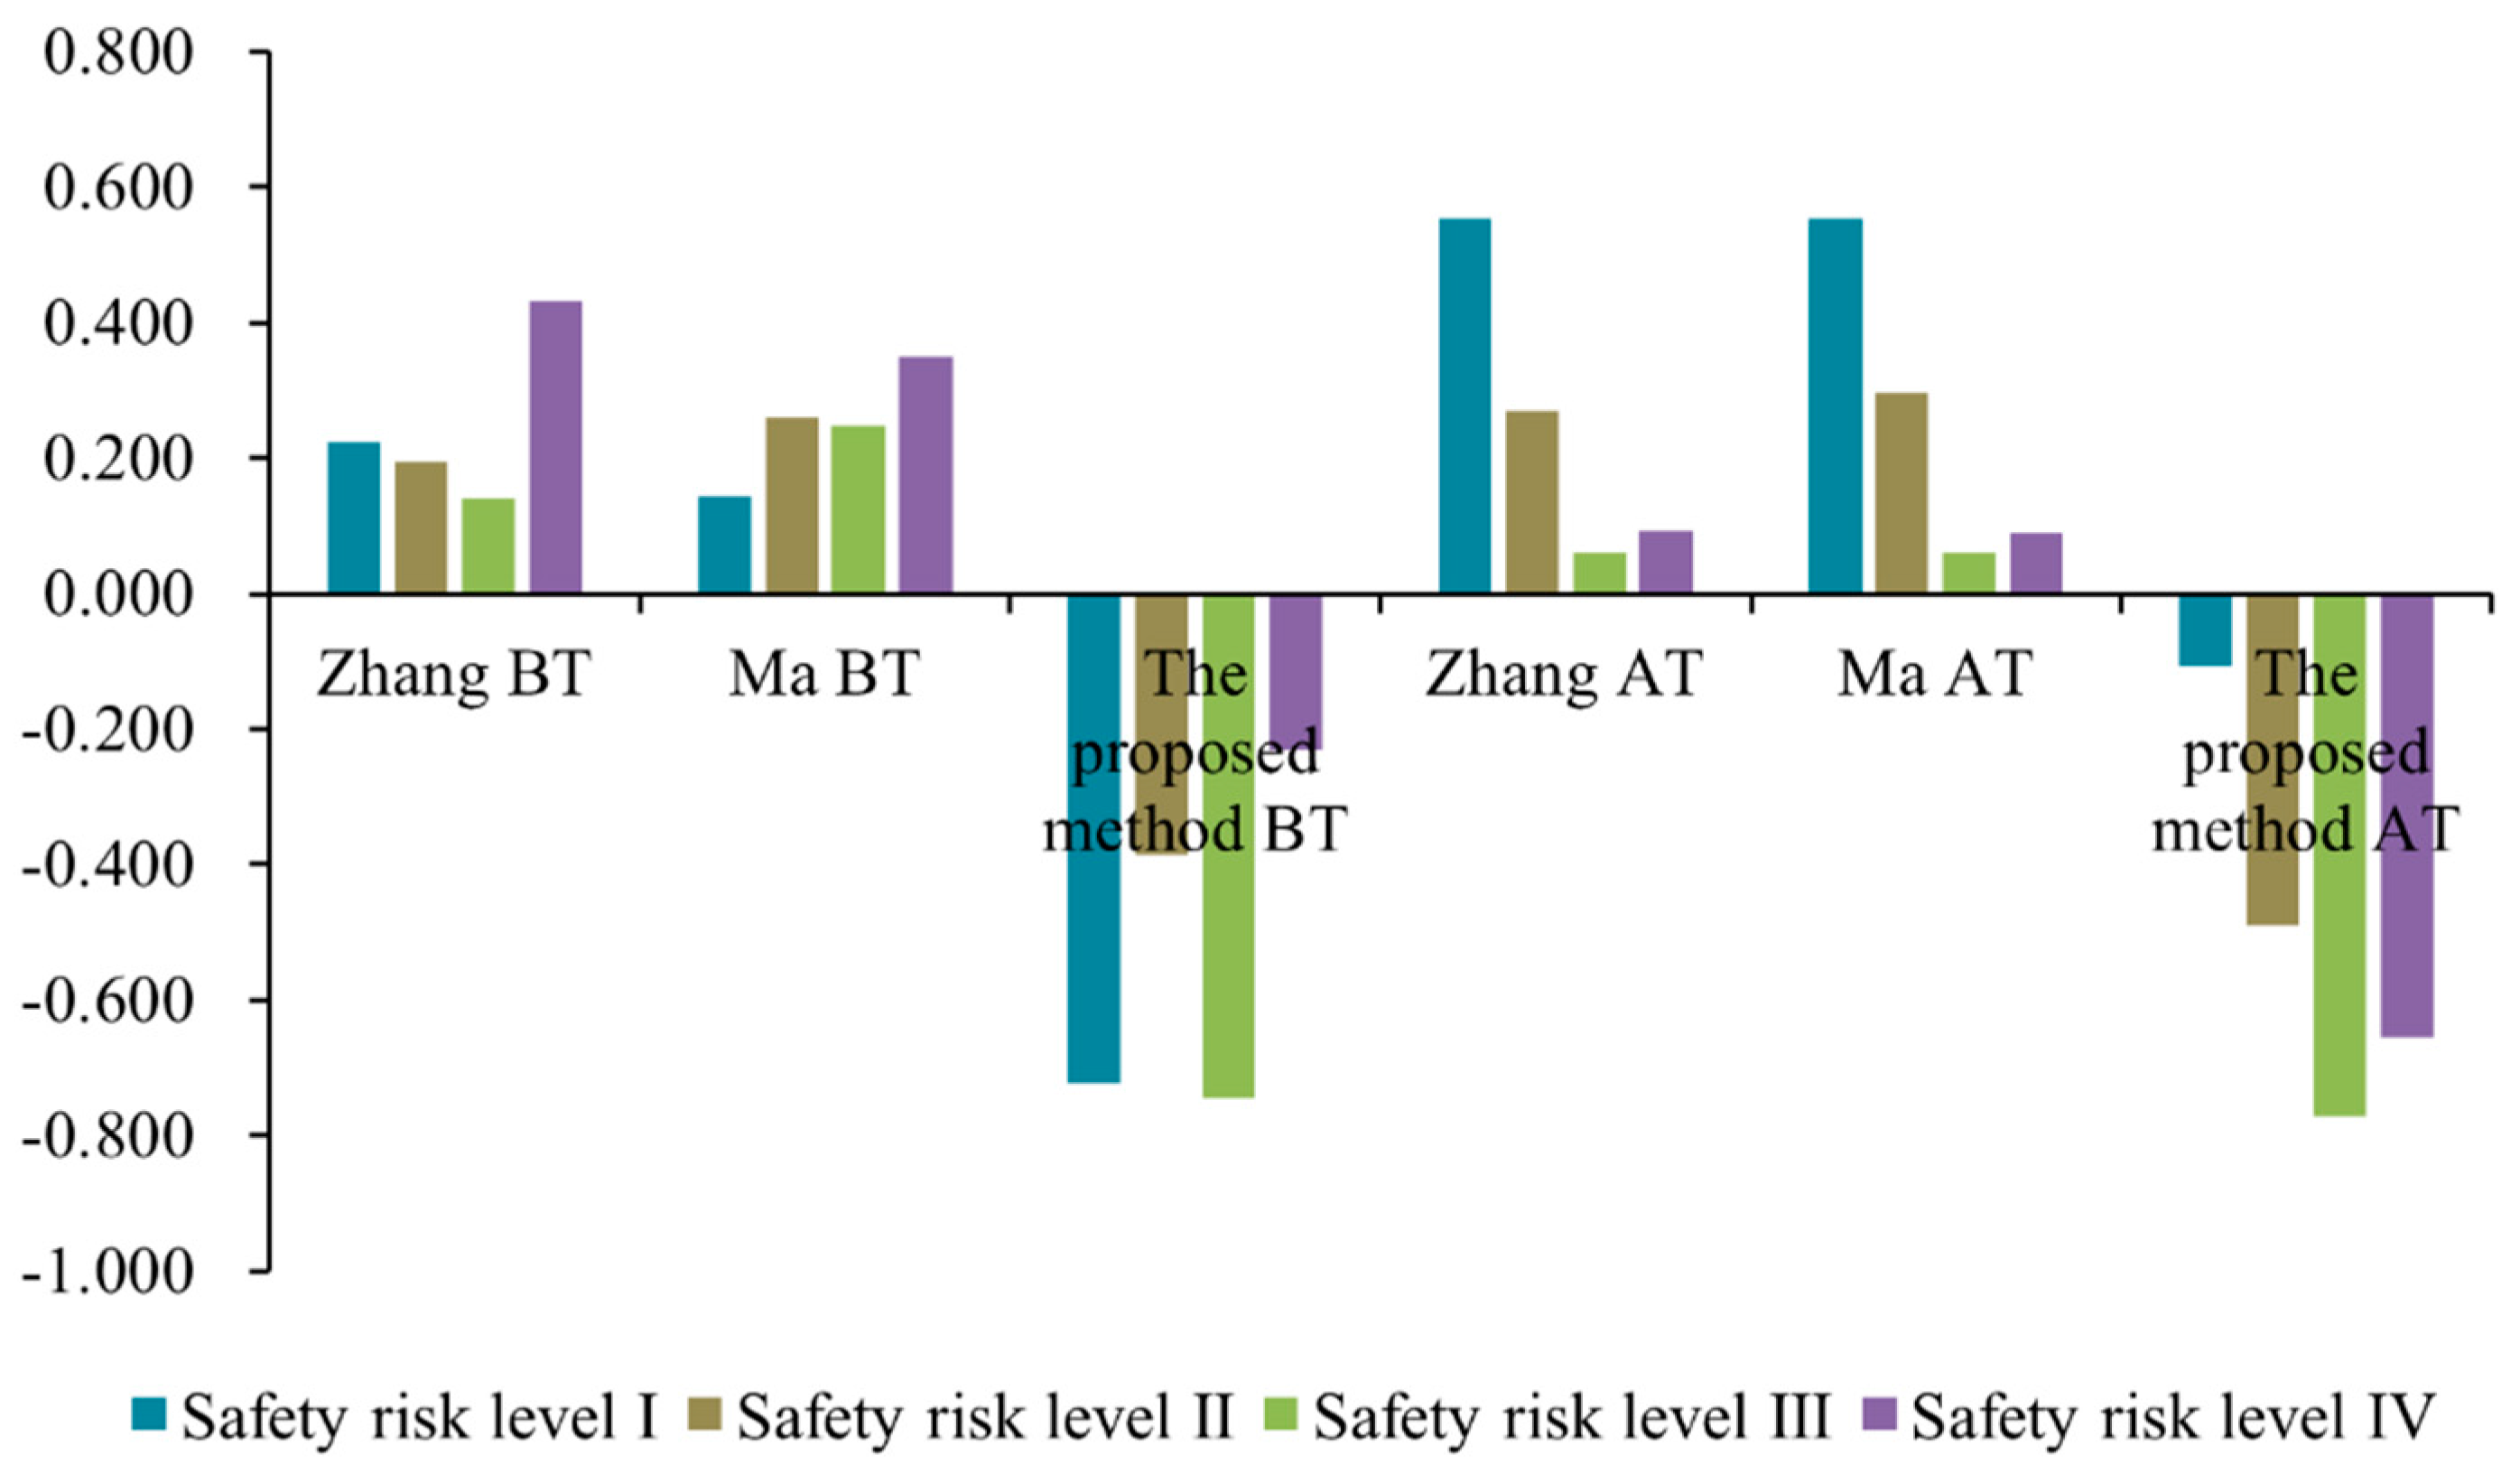
6. Discussion
- (1)
- The practical point of view
- (2)
- The theoretical point of view
7. Conclusions and Future Works
Author Contributions
Funding
Data Availability Statement
Conflicts of Interest
References
- Li, L.; Lei, T.; Li, S.; Zhang, Q.; Xu, Z.; Shi, S.; Zhou, Z. Risk assessment of water inrush in karst tunnels and software development. Arab. J. Geosci. 2015, 8, 1843–1854. [Google Scholar] [CrossRef]
- Zhou, H.; Zhao, Y.; Shen, Q.; Yang, L.; Cai, H. Risk assessment and management via multi-source information fusion for undersea tunnel construction. Autom. Constr. 2020, 111, 103050. [Google Scholar] [CrossRef]
- Cai, Q.; Hu, Q.; Ma, G. Improved Hybrid Reasoning Approach to Safety Risk Perception under Uncertainty for Mountain Tunnel Construction. J. Constr. Eng. Manag. 2021, 147, 04021105. [Google Scholar] [CrossRef]
- Ou, G.-Z.; Jiao, Y.-Y.; Zhang, G.-H.; Zou, J.-P.; Tan, F.; Zhang, W.-S. Collapse risk assessment of deep-buried tunnel during construction and its application. Tunn. Undergr. Space Technol. 2021, 115, 104019. [Google Scholar] [CrossRef]
- Koch, C.; Vonthron, A.; König, M. A tunnel information modelling framework to support management, simulations and visualisations in mechanised tunnelling projects. Autom. Constr. 2017, 83, 78–90. [Google Scholar] [CrossRef]
- Alshboul, O.; Shehadeh, A.; Hamedat, O. Governmental Investment Impacts on the Construction Sector Considering the Liquidity Trap. J. Manag. Eng. 2022, 38, 04021099. [Google Scholar] [CrossRef]
- Chen, K.; Lu, W. Bridging BIM and building (BBB) for information management in construction. Eng. Constr. Arch. Manag. 2019, 26, 1518–1532. [Google Scholar] [CrossRef]
- Zou, Y.; Kiviniemi, A.; Jones, S.W. A review of risk management through BIM and BIM-related technologies. Saf. Sci. 2017, 97, 88–98. [Google Scholar] [CrossRef]
- Tan, T.; Mills, G.; Papadonikolaki, E.; Liu, Z. Combining multi-criteria decision making (MCDM) methods with building information modelling (BIM): A review. Autom. Constr. 2021, 121, 103451. [Google Scholar] [CrossRef]
- Lee, P.-C.; Lo, T.-P.; Tian, M.-Y.; Long, D. An Efficient Design Support System based on Automatic Rule Checking and Case-based Reasoning. KSCE J. Civ. Eng. 2019, 23, 1952–1962. [Google Scholar] [CrossRef]
- Ding, Z.; Niu, J.; Liu, S.; Wu, H.; Zuo, J. An approach integrating geographic information system and building information modelling to assess the building health of commercial buildings. J. Clean. Prod. 2020, 257, 120532. [Google Scholar] [CrossRef]
- Zhang, H. Design and Implementation of BIM-based Fire Risk Assessment System. J. Physics Conf. Ser. 2020, 1584, 012064. [Google Scholar] [CrossRef]
- Figueiredo, K.; Pierott, R.; Hammad, A.W.; Haddad, A. Sustainable material choice for construction projects: A Life Cycle Sustainability Assessment framework based on BIM and Fuzzy-AHP. Build. Environ. 2021, 196, 107805. [Google Scholar] [CrossRef]
- Fazeli, A.; Jalaei, F.; Khanzadi, M.; Banihashemi, S. BIM-integrated TOPSIS-Fuzzy framework to optimize selection of sustainable building components. Int. J. Constr. Manag. 2019, 22, 1240–1259. [Google Scholar] [CrossRef]
- Caterino, N.; Nuzzo, I.; Ianniello, A.; Varchetta, G.; Cosenza, E. A BIM-based decision-making framework for optimal seismic retrofit of existing buildings. Eng. Struct. 2021, 242, 112544. [Google Scholar] [CrossRef]
- Zhang, L.; Ding, L.; Wu, X.; Skibniewski, M.J. An improved Dempster–Shafer approach to construction safety risk perception. Know. Based Syst. 2017, 132, 30–46. [Google Scholar] [CrossRef]
- Bhalla, S.; Yang, Y.W.; Zhao, J.; Soh, C.K. Structural health monitoring of underground facilities—Technological issues and challenges. Tunn. Undergr. Space Technol. 2005, 20, 487–500. [Google Scholar] [CrossRef]
- Guo, K.; Zhang, L. Multi-source information fusion for safety risk assessment in underground tunnels. Know. Based Syst. 2021, 227, 107210. [Google Scholar] [CrossRef]
- Zhao, K.; Li, L.; Chen, Z.; Sun, R.; Yuan, G.; Li, J. A survey: Optimization and applications of evidence fusion algorithm based on Dempster–Shafer theory. Appl. Soft Comput. 2022, 124, 109075. [Google Scholar] [CrossRef]
- Yang, J.-B.; Xu, D.-L. On the evidential reasoning algorithm for multiple attribute decision analysis under uncertainty. IEEE Trans. Syst. Man Cybern. Part A Syst. Hum. 2002, 32, 289–304. [Google Scholar] [CrossRef]
- Zhang, L.; Wu, X.; Zhu, H.; AbouRizk, S.M. Perceiving safety risk of buildings adjacent to tunneling excavation: An information fusion approach. Autom. Constr. 2017, 73, 88–101. [Google Scholar] [CrossRef]
- Ding, H.; Hou, R.; Ding, X. A data fusion equipment monitoring method based on fuzzy set and improved D-S evidence theory. In Proceedings of the International Conference on Natural Computation, Fuzzy Systems and Knowledge Discovery (ICNC-FSKD), Guilin, China, 25 June 2017; pp. 1070–1076. [Google Scholar] [CrossRef]
- Ma, T.; Xiao, F. An Improved Method to Transform Triangular Fuzzy Number into Basic Belief Assignment in Evidence Theory. IEEE Access 2019, 7, 25308–25322. [Google Scholar] [CrossRef]
- Xia, Y.; Xiong, Z.; Lu, H.; Wen, Z.; Ma, C. Fuzzy risk assessment of a deeply buried tunnel under incomplete information. R. Soc. Open Sci. 2018, 5, 180305. [Google Scholar] [CrossRef] [PubMed]
- Xu, Z.; Zhao, N. Information fusion for intuitionistic fuzzy decision making: An overview. Inf. Fusion 2016, 28, 10–23. [Google Scholar] [CrossRef]
- Murphy, C.K. Combining belief functions when evidence conflicts. Decis. Support Syst. 2000, 29, 1–9. [Google Scholar] [CrossRef]
- Xiao, F. Multi-sensor data fusion based on the belief divergence measure of evidences and the belief entropy. Inf. Fusion 2019, 46, 23–32. [Google Scholar] [CrossRef]
- Atanassov, K. Intuitionistic fuzzy sets. Fuzzy Sets Syst. 1986, 20, 87–96. [Google Scholar] [CrossRef]
- Zhang, X.; Xu, Z. A new method for ranking intuitionistic fuzzy values and its application in multi-attribute decision making. Fuzzy Optim. Decis. Mak. 2012, 11, 135–146. [Google Scholar] [CrossRef]
- Szmidt, E.; Kacprzyk, J. Distances between intuitionistic fuzzy sets. Fuzzy Sets Syst. 2000, 114, 505–518. [Google Scholar] [CrossRef]
- Lin, L.; Yuan, X.-H.; Xia, Z.-Q. Multicriteria fuzzy decision-making methods based on intuitionistic fuzzy sets. J. Comput. Syst. Sci. 2007, 73, 84–88. [Google Scholar] [CrossRef]
- Dempster, A.P. Upper and Lower Probabilities Induced by a Multivalued Mapping. Ann. Math. Stat. 1967, 38, 325–339. [Google Scholar] [CrossRef]
- Inglis, J. A Mathematical Theory of Evidence. Technometrics 1978, 20, 106. [Google Scholar] [CrossRef]
- Wang, X.; Li, S.; Xu, Z.; Li, X.; Lin, P.; Lin, C. An interval risk assessment method and management of water inflow and inrush in course of karst tunnel excavation. Tunn. Undergr. Space Technol. 2019, 92, 103033. [Google Scholar] [CrossRef]
- Zhang, K.; Zheng, W.; Liao, Z.; Xie, H.; Zhou, C.; Chen, S.; Zhu, J. Risk assessment of ground collapse along tunnels in karst terrain by using an improved extension evaluation method. Tunn. Undergr. Space Technol. 2022, 129, 104669. [Google Scholar] [CrossRef]
- Cui, Q.-L.; Wu, H.-N.; Shen, S.-L.; Xu, Y.-S.; Ye, G.-L. Chinese karst geology and measures to prevent geohazards during shield tunnelling in karst region with caves. Nat. Hazards 2015, 77, 129–152. [Google Scholar] [CrossRef]
- Ministry of Housing and Urban-Rural Development of the People’s Republic of China. Code for Design of Building Foundation; Ministry of Housing and Urban-Rural Development of the People’s Republic of China: Beijing, China, 2012.
- Deere, D.U.; Hendron, A.J.; Patton, F.D.; Cording, E.J. Design of Surface And Near-Surface Construction in Rock. In Proceedings of the 8th US Symposium of Rock Mechanics, Minneapolis, MN, USA, 15–17 September 1966. [Google Scholar]
- Ministry of Housing and Urban-Rural Development of the People’s Republic of China. Code for Monitoring Measurement of Urban Rail Transit Engineering; Ministry of Housing and Urban-Rural Development of the People’s Republic of China: Beijing, China, 2013.
- Ding, L.; Li, K.; Zhou, Y.; Love, P.E. An IFC-inspection process model for infrastructure projects: Enabling real-time quality monitoring and control. Autom. Constr. 2017, 84, 96–110. [Google Scholar] [CrossRef]
- Wang, Y.-G.; He, X.-J.; He, J.; Fan, C. Virtual trial assembly of steel structure based on BIM platform. Autom. Constr. 2022, 141, 104395. [Google Scholar] [CrossRef]
- Alavi, H.; Bortolini, R.; Forcada, N. BIM-based decision support for building condition assessment. Autom. Constr. 2022, 135, 104117. [Google Scholar] [CrossRef]
- Llatas, C.; Soust-Verdaguer, B.; Hollberg, A.; Palumbo, E.; Quiñones, R. BIM-based LCSA application in early design stages using IFC. Autom. Constr. 2022, 138, 104259. [Google Scholar] [CrossRef]
- Jing, L.; Yao, J.; Gao, F.; Li, J.; Peng, X.; Jiang, S. A rough set-based interval-valued intuitionistic fuzzy conceptual design decision approach with considering diverse customer preference distribution. Adv. Eng. Inform. 2021, 48, 101284. [Google Scholar] [CrossRef]
- Zadeh, L.A. On the Validity of Dempster’s Rule of Combinatio; Memo M 79/24; University of California: Berkeley, CA, USA, 1979. [Google Scholar]
- Xu, X.B.; Zhang, Z.; Li, S.B.; Wen, C.L. Fault diagnosis based on fusion and updating of diagnosis evidence. Acta Autom. Sin. 2016, 42, 107–121. [Google Scholar] [CrossRef]
- Kulasekere, E.; Premaratne, K.; Dewasurendra, D.; Shyu, M.-L.; Bauer, P. Conditioning and updating evidence. Int. J. Approx. Reason. 2004, 36, 75–108. [Google Scholar] [CrossRef]


| Property Set Name | Entity | Type | Description |
|---|---|---|---|
| Pset_SensorFeature | IfcSensor | IfcSensor/UserDefined | Feature information |
| Property Name | Property Type | Data Type | Description |
|---|---|---|---|
| Device_Type | IfcPropertySingleValue | IfcText | The type of monitoring device. |
| Sensor_ID | IfcPropertySingleValue | IfcText | The unique number of monitoring sensors. |
| Monitoring_Content | IfcPropertySingleValue | IfcText | The monitoring content. |
| Monitoring_Value | IfcPropertySingleValue | IfcReal | Collected data at a specific time. |
| Record_AT | IfcPropertySingleValue | IfcReal | Data acquisition time. |
| Alarm_Threshold | IfcPropertyBoundedValue | IfcReal | The upper and lower alarm threshold of data collected. |
| Linguistic Variables | |
|---|---|
| Very low (VL) | (0.05, 0.95) |
| Low (L) | (0.25, 0.70) |
| Medium (M) | (0.40, 0.50) |
| High (H) | (0.70, 0.25) |
| Very high (VH) | (0.95, 0.05) |
| Safety Risk Level | Color | RGB Value | Color Representation |
|---|---|---|---|
| I | Green | (0, 255, 0) |  |
| II | Yellow | (255, 255, 0) |  |
| III | Orange | (255, 128, 0) |  |
| IV | Red | (255, 0, 0) |  |
| Safety Risk Levels | Meaning | Control Measures |
|---|---|---|
| I | It is unlikely to cause collapse. | No control measures are required. |
| II | There is a low probability of causing collapse. | The monitoring frequency should be increased, and the inspection and treatment of potential risk sources should be strengthened. |
| III | There is a medium probability of causing collapse. | Control measures before construction should be taken, while a safety risk assessment should be conducted after treatment. In addition to strengthening monitoring during construction, the construction plan and excavation parameters should also be checked and improved. |
| IV | There is a high probability of causing collapse. | In addition to the above control measures, the tunnel condition should be evaluated by consulting domain experts. The construction procedures and design parameters should be checked, and the construction process should be stopped immediately if necessary. |
| Indicators | Safety Risk Levels | |||
|---|---|---|---|---|
| I | II | III | IV | |
| Karst development | (20, 40), (0.7, 0.25) | (20, 40, 60), (0.7, 0.25) | (35, 60, 85), (0.7, 0.25) | (60, 85), (0.7, 0.25) |
| Maximum height of karst cave | (3, 6), (0.7, 0.25) | (3, 6, 9), (0.7, 0.25) | (6, 9, 12), (0.7, 0.25) | (9, 12), (0.7, 0.25) |
| Surrounding rock condition | (60, 90), (0.7, 0.25) | (30, 60, 90), (0.7, 0.25) | (10, 30, 60), (0.7, 0.25) | (10, 30), (0.7, 0.25) |
| Tunnel average buried depth | (20, 28), (0.7, 0.25) | (12, 20, 28), (0.7, 0.25) | (4, 12, 20), (0.7, 0.25) | (4, 12), (0.7, 0.25) |
| Tunnel inclination angle | (0.5, 1), (0.7, 0.25) | (0.5, 1, 2), (0.7, 0.25) | (1, 2, 3), (0.7, 0.25) | (2, 3), (0.7, 0.25) |
| Vault settlement (cumulative value) | (4, 10), (0.7, 0.25); (−10, −4), (0.7, 0.25) | (4, 10, 16), (0.7, 0.25); (−16, −10, −4), (0.7, 0.25) | (10, 16, 20), (0.7, 0.25); (−20, −16, −10), (0.7, 0.25) | (16, 20), (0.95, 0.05); (−20, −16), (0.95, 0.05) |
| Vault settlement (daily changing value) | (0.6, 1.5), (0.7, 0.25); (−1.5, −0.6), (0.7, 0.25) | (0.6, 1.5, 2.4), (0.7, 0.25); (−2.4, −1.5, −0.6), (0.7, 0.25) | (1.5, 2.4, 3), (0.7, 0.25); (−3, −2.4, −1.5), (0.7, 0.25) | (2.4, 3), (0.95, 0.05); (−3, −2.4), (0.95, 0.05) |
| Clearance convergence (cumulative value) | (4.8, 12), (0.7, 0.25); (−12, −4.8), (0.7, 0.25) | (4.8, 12, 19.2), (0.7, 0.25); (−19.2, −12, −4.8), (0.7, 0.25) | (12, 19.2, 24), (0.7, 0.25); (−24, −19.2, −12), (0.7, 0.25) | (19.2, 24), (0.95, 0.05); (−24, −19.2), (0.95, 0.05) |
| Clearance convergence (daily changing value) | (0.4, 1), (0.7, 0.25); (−1, −0.4), (0.7, 0.25) | (0.4, 1, 1.6), (0.7, 0.25); (−1.6, −1, −0.4); (0.7, 0.25) | (1, 1.6, 2), (0.7, 0.25); (−2, −1.6, −1), (0.7, 0.25) | (1.6, 2), (0.95, 0.05); (−2, −1.6), (0.95, 0.05) |
| Axial stress Hoop stress | (−0.95, −0.38), (0.7, 0.25); (4.62, 11.55), (0.7, 0.25) | (−1.51, −0.95, −0.38), (0.7, 0.25); (4.62, 11.55, 18.48), (0.7, 0.25) | (−1.89, −1.51, −0.95), (0.7, 0.25); (11.55, 18.48, 23.1), (0.7, 0.25) | (−1.89, −1.51), (0.95, 0.05); (18.48, 23.1), (0.95, 0.05) |
| Indicators | Stages | Value |
|---|---|---|
| Karst development degree | Before treatment | 83% |
| After treatment | 22% | |
| Maximum height of karst cave | Before treatment | 11.1 m |
| After treatment | 1.6 m | |
| Surrounding rock condition (RQD) | - | 18% |
| Cover depth | - | 9.5 m |
| Tunnel-designed inclination angle | - | 0.8% |
| Indicators | Stages | BPAs | |||
|---|---|---|---|---|---|
| m(I) | m(II) | m(III) | m(IV) | ||
| Before treatment | (0, 1) | (0, 1) | (0.064, 0.928) | (0.644, 0.218) | |
| After treatment | (0.630, 0.235) | (0.080, 0.910) | (0, 1) | (0, 1) | |
| Before treatment | (0, 1) | (0, 1) | (0.240, 0.730) | (0.490, 0.405) | |
| After treatment | (0.7, 0.25) | (0, 1) | (0, 1) | (0, 1) | |
| - | (0, 1) | (0, 1) | (0.320, 0.660) | (0.420, 0.490) | |
| - | (0, 1) | (0, 1) | (0.550, 0.381) | (0.219, 0.734) | |
| - | (0.280, 0.660) | (0.480, 0.460) | (0, 1) | (0, 1) | |
| Fusion Results | BPAs | Safety Risk Level | |||
|---|---|---|---|---|---|
| m(I) | m(II) | m(III) | m(IV) | ||
| Before treatment | (0.124, 0.847) | (0.284, 0.670) | (0.121, 0.867) | (0.335, 0.565) | IV |
| −0.723 | −0.386 | −0.746 | −0.230 | ||
| After treatment | (0.384, 0.491) | (0.235, 0.725) | (0.110, 0.882) | (0.152, 0.806) | I |
| −0.107 | −0.490 | −0.772 | −0.654 | ||
| Monitoring Day | Monitoring Point | BPAs | |||
|---|---|---|---|---|---|
| m(I) | m(II) | m(III) | m(IV) | ||
| Day 1 | GGL-14-01 | (0.7, 0.25) | (0, 1) | (0, 1) | (0, 1) |
| GGL-14-02 | (0.289, 0.649) | (0.411, 0.471) | (0, 1) | (0, 1) | |
| GGC-70 | (0.7, 0.25) | (0, 1) | (0, 1) | (0, 1) | |
| GGJ-70 | (0.7, 0.25) | (0, 1) | (0, 1) | (0, 1) | |
| GGC-71 | (0.7, 0.25) | (0, 1) | (0, 1) | (0, 1) | |
| GGJ-71 | (0.583, 0.292) | (0.134, 0.85) | (0, 1) | (0, 1) | |
| Day | Values of the Score Function (Before Update) | Safety Risk Level | Values of the Score Function (After Update) | Safety Risk Level | ||||||
|---|---|---|---|---|---|---|---|---|---|---|
| S(I) | S(II) | S(III) | S(IV) | S(I) | S(II) | S(III) | S(IV) | |||
| 1 | 0.228 | −0.238 | −1 | −1 | I | 0.228 | −0.238 | −1 | −1 | I |
| 2 | 0.260 | −0.301 | −1 | −1 | I | 0.260 | −0.301 | −1 | −1 | I |
| 3 | 0.311 | −0.338 | −1 | −1 | I | 0.311 | −0.338 | −1 | −1 | I |
| 4 | 0.267 | −0.363 | −1 | −1 | I | 0.269 | −0.443 | −1 | −1 | I |
| 5 | 0.288 | −0.315 | −1 | −1 | I | 0.281 | −0.445 | −1 | −1 | I |
| 6 | 0.327 | −0.413 | −1 | −1 | I | 0.297 | −0.475 | −1 | −1 | I |
| 7 | 0.308 | −0.307 | −1 | −1 | I | 0.298 | −0.502 | −1 | −1 | I |
| 8 | 0.263 | −0.544 | −1 | −1 | I | 0.291 | −0.563 | −1 | −1 | I |
| 9 | 0.239 | −0.486 | −1 | −1 | I | 0.286 | −0.523 | −1 | −1 | I |
| 10 | 0.265 | −0.550 | −1 | −1 | I | 0.280 | −0.472 | −1 | −1 | I |
| 11 | 0.251 | −0.535 | −1 | −1 | I | 0.252 | −0.602 | −1 | −1 | I |
| 12 | 0.225 | −0.475 | −1 | −1 | I | 0.245 | −0.643 | −1 | −1 | I |
| 13 | 0.188 | −0.176 | −1 | −1 | I | 0.222 | −0.716 | −1 | −1 | I |
| 14 | 0.191 | −0.368 | −1 | −1 | I | 0.211 | −0.439 | −1 | −1 | I |
| 15 | 0.207 | −0.130 | −1 | −1 | I | 0.204 | −0.489 | −1 | −1 | I |
| 16 | 0.197 | −0.026 | −1 | −1 | I | 0.195 | −0.395 | −1 | −1 | I |
| 17 | 0.174 | −0.045 | −1 | −1 | I | 0.192 | −0.304 | −1 | −1 | I |
| 18 | 0.178 | −0.094 | −1 | −1 | I | 0.191 | −0.193 | −1 | −1 | I |
| 19 | 0.220 | −0.045 | −1 | −1 | I | 0.194 | −0.254 | −1 | −1 | I |
| 20 | 0.199 | −0.099 | −1 | −1 | I | 0.197 | −0.177 | −1 | −1 | I |
| Fusion Methods | Fusion Results | BPAs | Variance (|max(m)-min(m)|) | Safety Risk Level | ||||
|---|---|---|---|---|---|---|---|---|
| m(I) | m(II) | m(III) | m(IV) | |||||
| Zhang’s method | Before treatment | 0.224 | 0.195 | 0.141 | 0.432 | 0.291 | IV | |
| After treatment | 0.554 | 0.270 | 0.061 | 0.091 | 0.493 | I | ||
| Ma’s method | Before treatment | 0.224 | 0.195 | 0.141 | 0.432 | 0.207 | IV | |
| After treatment | 0.554 | 0.270 | 0.061 | 0.091 | 0.493 | I | ||
| Proposed method | Before treatment | −0.723 | −0.386 | −0.746 | −0.230 | 0.516 | IV | |
| After treatment | −0.107 | −0.490 | −0.772 | −0.654 | 0.665 | I | ||
Publisher’s Note: MDPI stays neutral with regard to jurisdictional claims in published maps and institutional affiliations. |
© 2022 by the authors. Licensee MDPI, Basel, Switzerland. This article is an open access article distributed under the terms and conditions of the Creative Commons Attribution (CC BY) license (https://creativecommons.org/licenses/by/4.0/).
Share and Cite
Xun, X.; Zhang, J.; Yuan, Y. Multi-Information Fusion Based on BIM and Intuitionistic Fuzzy D-S Evidence Theory for Safety Risk Assessment of Undersea Tunnel Construction Projects. Buildings 2022, 12, 1802. https://doi.org/10.3390/buildings12111802
Xun X, Zhang J, Yuan Y. Multi-Information Fusion Based on BIM and Intuitionistic Fuzzy D-S Evidence Theory for Safety Risk Assessment of Undersea Tunnel Construction Projects. Buildings. 2022; 12(11):1802. https://doi.org/10.3390/buildings12111802
Chicago/Turabian StyleXun, Xiaolin, Jun Zhang, and Yongbo Yuan. 2022. "Multi-Information Fusion Based on BIM and Intuitionistic Fuzzy D-S Evidence Theory for Safety Risk Assessment of Undersea Tunnel Construction Projects" Buildings 12, no. 11: 1802. https://doi.org/10.3390/buildings12111802
APA StyleXun, X., Zhang, J., & Yuan, Y. (2022). Multi-Information Fusion Based on BIM and Intuitionistic Fuzzy D-S Evidence Theory for Safety Risk Assessment of Undersea Tunnel Construction Projects. Buildings, 12(11), 1802. https://doi.org/10.3390/buildings12111802