Article

Research on the Indicators of Sustainable Campus Renewal and Reconstruction in Pursuit of Continuous Historical and Regional Context

1
School of Architecture, South China University of Technology, Guangzhou 510641, China
2
State Key Laboratory of Subtropical Building Science, South China University of Technology, Guangzhou 510641, China
3
Architectural Design & Research Institute Co., Ltd., South China University of Technology, Guangzhou 510641, China
4
Faculty of Architecture, The University of Hong Kong, Hong Kong, China
*
Author to whom correspondence should be addressed.
These authors contributed equally to this study and shared the first authorship.
Buildings 2022, 12(10), 1508; https://doi.org/10.3390/buildings12101508
Submission received: 16 August 2022 / Revised: 15 September 2022 / Accepted: 19 September 2022 / Published: 22 September 2022

Abstract

:
As cities transition from incremental development to stock development, university campuses in suburban areas are progressively becoming urban university campuses. The stability of the boundary between urban university campuses and the city, along with the fact that the campus’s overall spatial capacity is reaching its maximum, makes it impossible for urban university campuses to have future spatial expansions. This article focused on the stock development, renewal, and transformation of urban campuses. From the perspective of urban university campus block morphology hierarchy and using the Wushan Campus of South China University of Technology in Guangzhou as an example, this study utilized urban morphology theory, data mining technology, big data collection, and visualization techniques to measure campus block morphology. Then, K-means clustering was utilized to classify the block form, and historical background research was employed to study the many forms of typical block form. Finally, the campus renewal and transformation guiding principles were introduced, and the control index of block form renewal and transformation was formed, evolving into the university campus block form renewal and transformation design technique. This strategy was used to investigate the general revitalization of college campuses.

1. Introduction

1.1. Background

In the context of urban renewal, university campuses, as one of the most significant functional sectors in the city, are also confronted with the problem of renewal and transformation [1]. As a result of urban expansion, our traditional campuses are increasingly surrounded by cities, leaving little room for expansion into the surrounding area. Moreover, as the scale of education has grown, campuses have had to expand inwards horizontally. A campus is replete with stitched additions, height increases, the decrease in green space and water infrastructure, and the use of athletic space for construction. Consequently, the trend toward restricted land use, excessive building density, and a significant decrease in natural space on typical university campuses is becoming increasingly obvious. The focus of this paper is placed on urban campus space morphology and the indicators of sustainable campus renewal and reconstruction. The relationship between colleges and cities has progressed from the city’s periphery to its current state of integration [2]. The urban university campus is the symbiotic property of developing and extending in tandem with the city, which has emerged gradually through time under many cultural domains [3]. Not only is the form of an urban campus determined by the stage of growth of the university, but also by the social, economic, political, and cultural characteristics of the city in which it is located [4,5,6]. Different circumstances require the creation of various campus layouts because these factors vary. Due to the richness and fluidity of such campus spatial formations, it is frequently challenging to discern their inherent patterns. However, each campus has its own peculiar arrangement. In Alexander’s Oregon Experiment, organic order is defined as the order obtained when partial demands and overall demand are in perfect balance [7]. Do not isolate school facilities and surround them with dead inactive edges, but weave them into the city fabric, providing stimulation to students and non-students alike [8]. The specific form language of buildings, together with the urban space typology, determines whether the campus provides a healing environment or not [9]. Consequently, study and design based on the regional cultural lineage are conducive to cultural continuity and identity, avoiding the problems of broken texture, inappropriate water scale, and lack of character encountered during campus renewal and restoration.
This research examined the use of K-means cluster analysis to integrate quantitative spatial morphology with design guidelines for campus renewal and renovation, as well as the quantitative spatial morphology of the Wushan Campus of South China University of Technology (SCUT) in Guangzhou. Consequently, an objective data result was obtained. This approach to data mining permits rapid classification with the support of computer technology, followed by repeated iterative calculations to obtain an appropriate clustering result based on data content. Through the analysis of the typological results, we compared the evolutionary processes of the various stages of the campus’s historical and cultural development and established control indicators of the campus block form to develop a methodology for the renewal and renovation of urban-type universities.

1.2. Literature Review

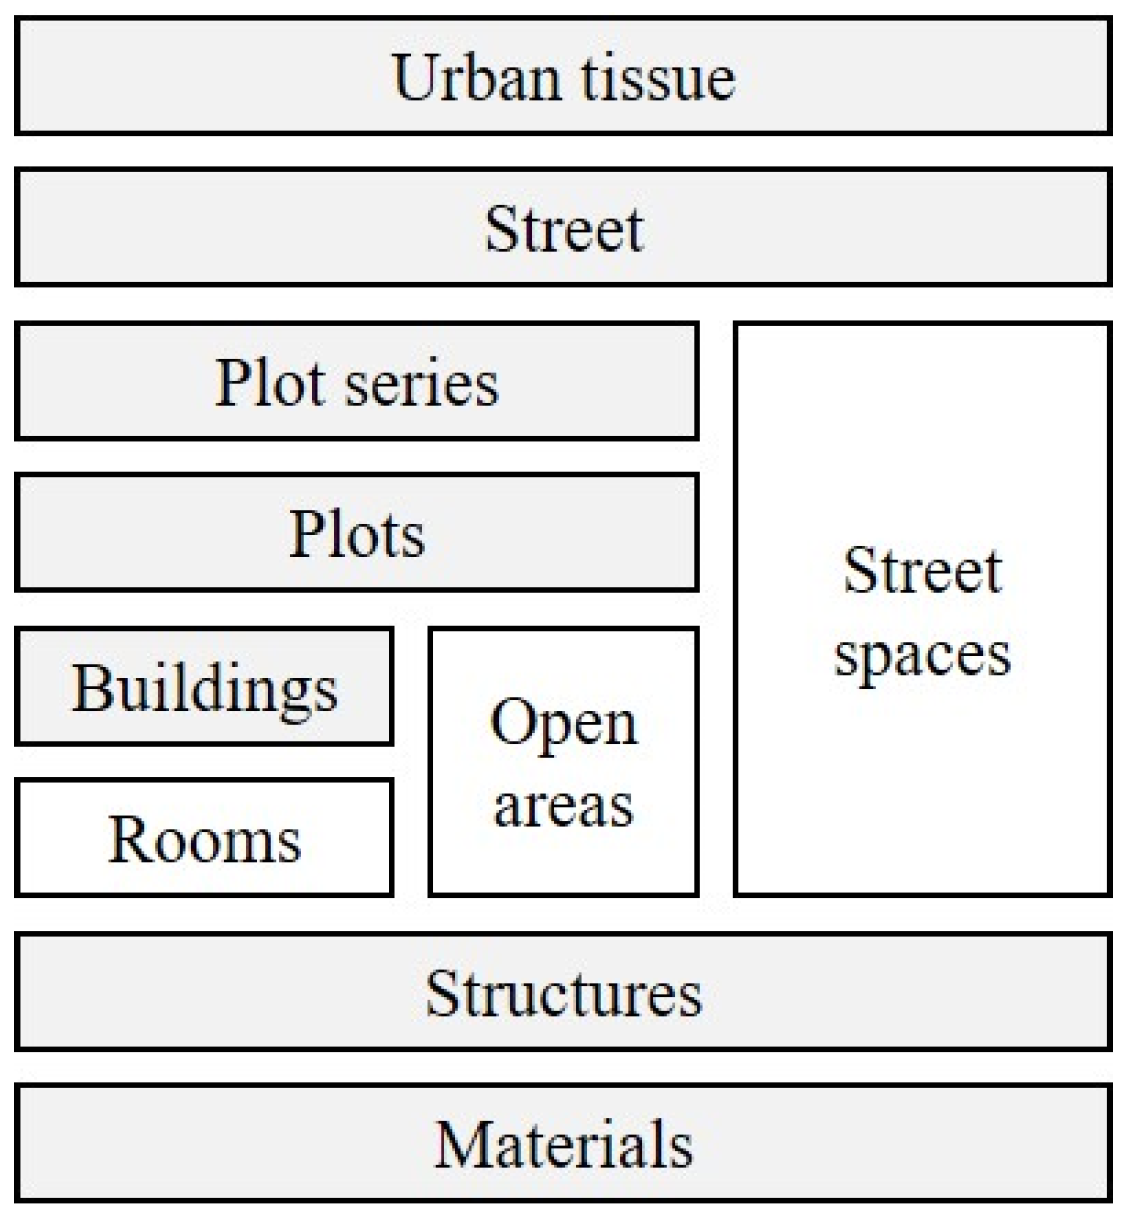
1.2.1. Urban Morphology

Urban morphology eventually became a somewhat cohesive notion in the 1990s, as evidenced by the findings of the International Seminar on Urban Form (ISUF), the Study of Urban Physical and Spatial Form and Its Evolutionary Processes, and the Association of Urban Physical and Immaterial Form [10]. Kropf contends that urban morphology may be characterized by its components and how they are composed, as well as the fact that the components themselves can be explained in a hierarchical method for understanding complex systems [11]. On the basis of his research into Conzean’s flat pattern division and Caniggia’s scale hierarchical subdivision, Kropf developed a more integrated hierarchical structure, termed generic structure. Kropf combined the two hierarchies by inserting the Caniggia hierarchy of plots and blocks between the Caniggia houses and myriads and collated nine generic types [12]. Figure 1 shows Kropf’s generic structure [13], from part to the whole: materials, structures and constructions, rooms, houses, plots, plot sequences, urban myriads, myriad aggregates, and polycentric urban areas [14]. Klopf continued by noting that the limits of certain layers are unclear and that there is a need to unify the precise extent of the distinct elemental layers. He added parts of open areas (such as gardens, parking lots, and squares) at the same level as houses and rooms, claiming that open areas in plots are separate features with distinct roles and bounds. Then, for identical reasons, he added the road space, which is not the residual portion of the land minus the building but a unique structural space. Thus, Klopf offered an urban structure system comprised mostly of eight strata. This was followed by the development of form-based zoning at Stratford-on-Avon, England, which was intended to replace traditional use-based zoning. The Stratford-on-Avon Area Control Guidelines were finalized in 1999, revealing the features and proposed tactics for each level of settlement in a methodical manner. To avoid a one-size-fits-all approach and to ensure that the design is territorially different, equitable, and sustainable, the standards were designed to emphasize village and landscape specificity and recognition. The strategy is to identify regional characteristics during fieldwork, summarize the identified morphological characteristics of the area, and define the objects of the guidelines that reflect the characteristics of the place, using the nine scales of the “generic structure” as the main framework and further subdividing them into settlement design, road design, open space, plot series design, plot design, and architectural design. The guidelines are separated into the design of residential areas, road design, open spaces, plot series design, plot design, building design, and the selection and design of details and materials, and each section is specified [12].
In general, the classical methods of urban morphology analysis and their further development in modern times have made significant contributions to the study of urban morphology and have provided a morphological perspective for relevant urban design practices, but the shortcomings of current urban morphology analysis have gradually become apparent. On the basis of qualitative judgments and manual labor, the analysis of urban form is constrained on the one hand by the subjectivity of the analyst, and on the other hand, the difficulties in grasping the complexities of urban form and its evolution. This issue makes it challenging for urban morphology studies to properly contribute to urban design practice [15,16,17,18,19,20].

1.2.2. Quantitative Methods of Analysis

Urban design consists of two typical cycles: first, the process of creating vibrant urban places through the shaping of urban spatial forms on the basis of the anticipation of citizens’ perceptions and behavioral needs [17,18]; second, the quantitative extraction of the characteristics of urban forms and the perception of the interaction between spatial forms and urban life that guides the development of design practice [19].
Classical urban morphology study is primarily reliant on manual analysis and empirical interpretation by academics, making it difficult to advance existing knowledge. Since 2013, the International Society of Urban Morphology (ISUF) has argued in a number of conference declarations that the incorporation of quantitative analysis techniques could be one of the ways in which morphology evolves [20,21]. With the advent of quantitative approaches to urban morphology studies, various ways to quantify individual features of urban morphology have evolved and been implemented in recent years. Three of the most representative methodologies, namely, Space Syntax, SPACE matrix, and Mixed-use Index (MXI), may quantify the mix of street networks, building kinds and development intensity, and plot functions, respectively. These quantitative analysis techniques liberate us from the constraints of conventional urban morphology and allow for a quantitative and thorough inquiry [21].
Methods for quantitative morphological analysis of single morphological elements have arisen over time, demonstrating the viability of an incorporating quantitative analysis into urban morphological investigations. The first is the Space Syntax, a method of spatial network analysis developed by British academic Hillier and his colleagues that quantifies the network features of buildings and urban places as well as the socioeconomic effects associated with them [22,23]. Secondly, historical districts could benefit from space syntax. It also attempts to describe and study a wide range of spatial layouts, as well as to help understand the relationship between human behaviors and spatial characteristics on ancient streets [24,25]. The City Form Lab at the Massachusetts Institute of Technology (MIT) developed the Urban Network Analysis approach in 2012, along with an ArcGIS plug-in for the overlay analysis of blocks and building elements [26]. Thirdly, the Portuguese researcher Olivier introduced the Morpho method for evaluating the physical shape of urban areas. Using Conzean’s morphological theory and spatial syntax, Oliviver developed a quantitative overlay analysis approach with seven indicators based on the GIS platform to thoroughly define the urban fabric [27]. Using GIS, the data are overlaid and processed to create an intuitive and thorough interpretation of the urban fabric to determine the many morphological kinds of the urban fabric. Fourthly, recommendations for specific city applications are produced on the basis of the outcomes of the investigation [11,28]. Since 2014, academics at the University of Hong Kong and the University of Delft in the Netherlands have created Form Syntax, an analytical and ArcGIS-based analysis plug-in that provides a quantitative study of the mixture of block-based architectural forms and functions. In addition, the merging of classical morphological principles and quantitative analysis techniques prompted this development [29,30].
The researchers José Nuno Beiro et al. proposed a data mining method for objectively classifying urban form kinds [31]. This method involves a vast quantity of urban data, which are grouped and analyzed using K-means clustering statistics, and the results are expressed quantitatively and in great detail. This method shows the morphological type of characteristics of cities and is excellent for identifying and describing urban morphology kinds that cannot be simply described empirically [32,33].
In recent years, analysis methods in related sectors have increasingly shifted from two dimensions to three dimensions in order to meet the analysis and design requirements of high-density built environments more precisely. The spatial design network analysis instrument (sDNA) was developed by Cardiff University in the United Kingdom [34]. Its 3D perspective spatial network analysis method illustrates the susceptibility of spatial networks to changes in vertical orientation, enabling urban designers to grasp the 3D properties of spatial forms more properly. For instance, the sDNA team at the University of Hong Kong ran a pedestrian flow simulation of a planning scheme for the Central waterfront in Hong Kong to anticipate whether the area’s future use will achieve urban design goals [35].

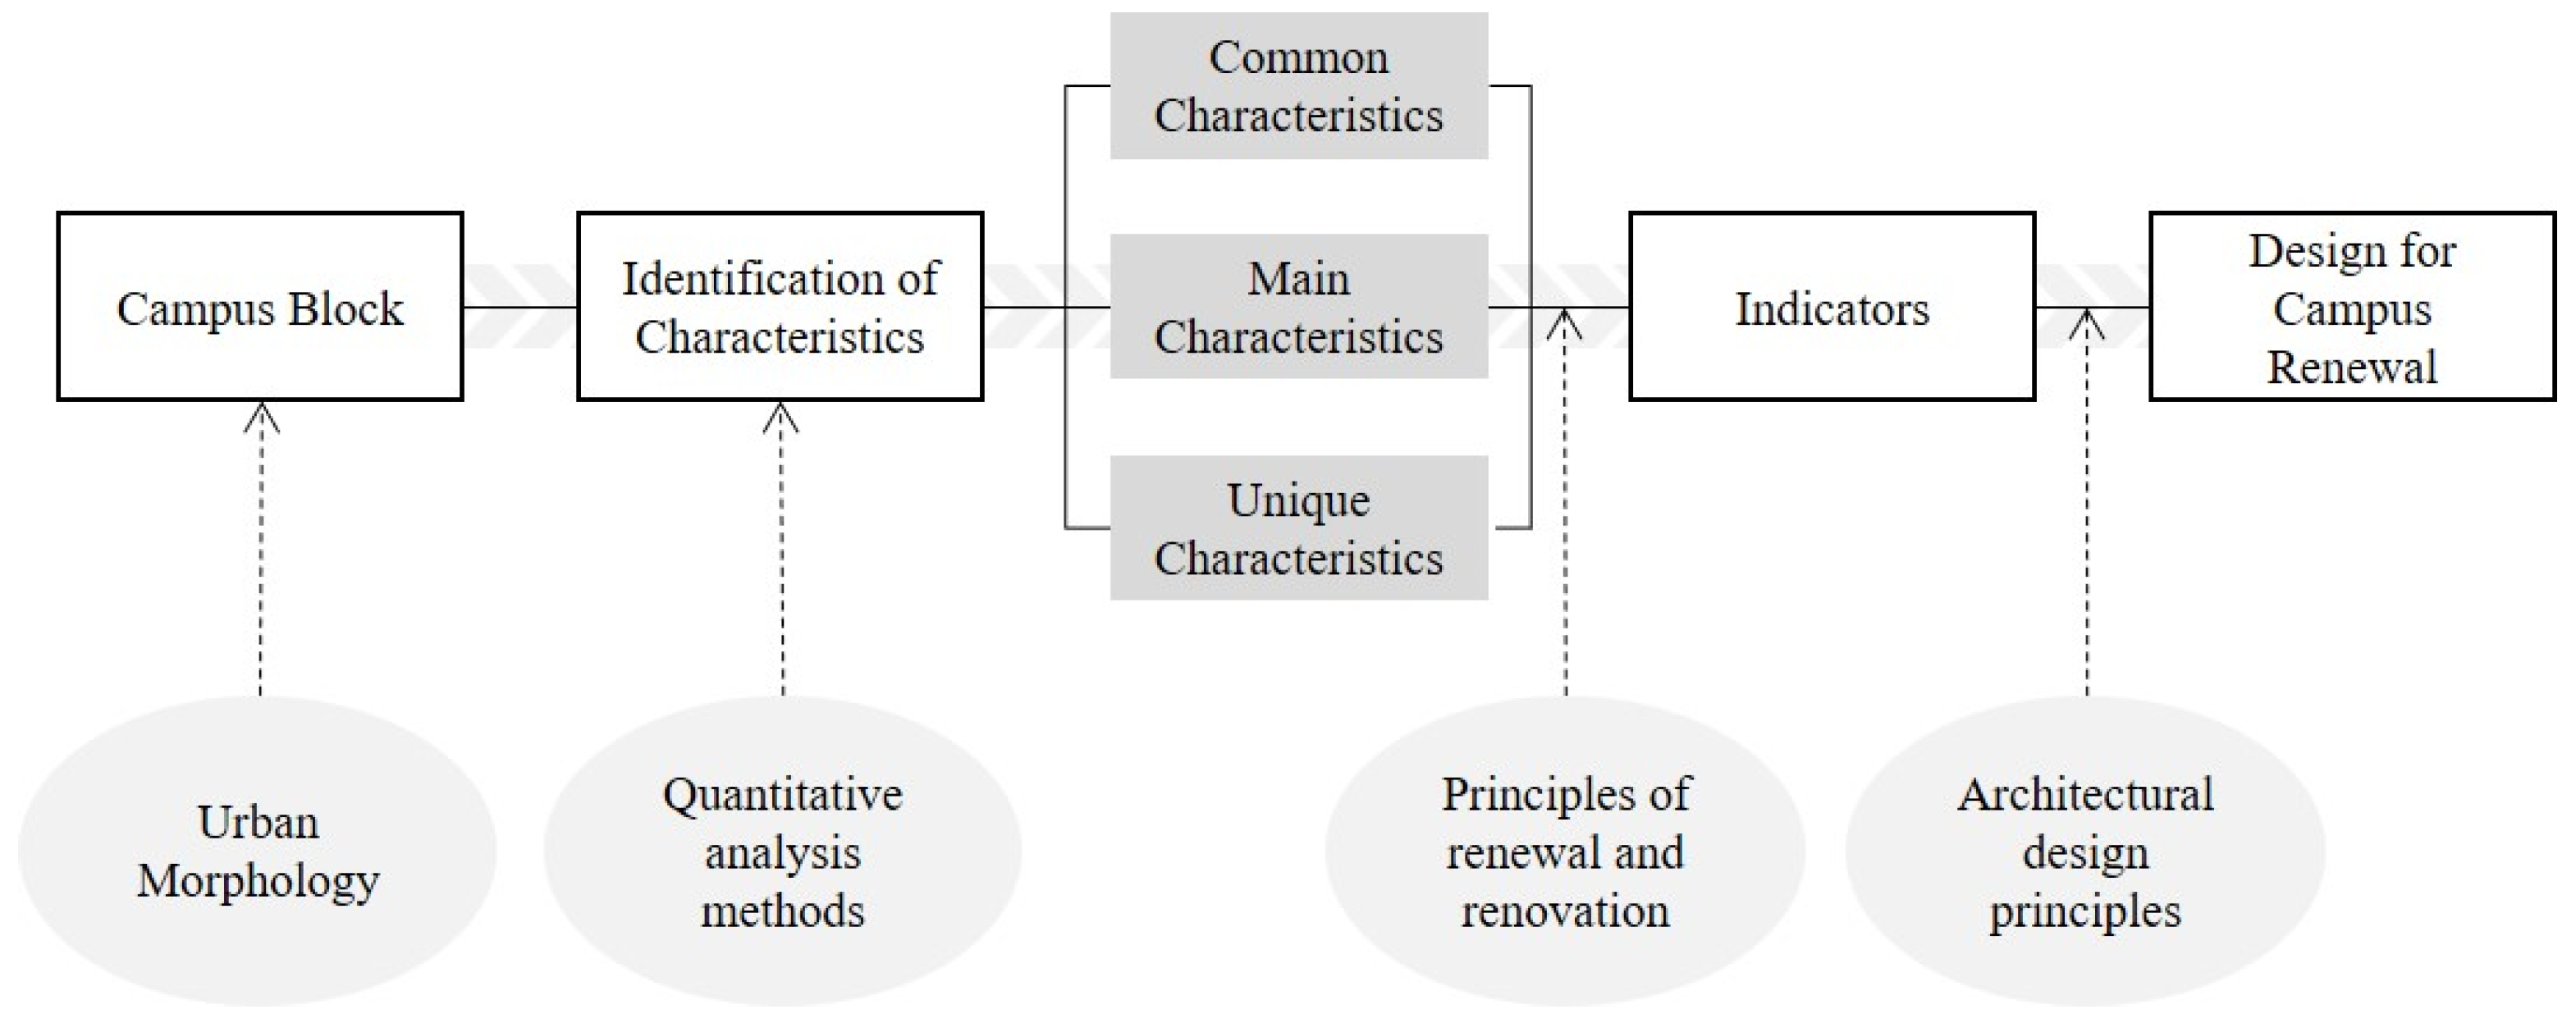
1.3. Research Framework

A literature study on urban morphology and quantitative analysis methods for urban form revealed that quantitative analysis methods are increasingly valued by urban design researchers, even when combined with methodologies from other subject areas, such as statistics, for interactive research. However, few researchers have evaluated the urban university campus as a significant function of the city on its own, and there is a dearth of quantitative research on this topic. On the scale of urban planning, the urban university campus is merely a functional area. Regarding the university campus itself, however, it not only serves the purpose of teaching and educating people, but the urban university campus also serves as a little city.
In The Oregon Experiment, C. Alexander used the University of Oregon as an experimental matrix to create a design method that can be applied to any community master plan and is encapsulated by six essential concepts. The University of Oregon currently employs an open campus design, devoid of fences and gates. The campus and city are interlaced, forming a complex of a university and the city. However, there are differences in designs between Chinese and American university campuses. For one thing, Chinese cities are much larger than the local university campus. Typically, the university campus in China is merely a functional area of the city. For another, despite the diverse methods in which campuses are governed, students and professors on urban Chinese university campuses are nonetheless managed in a uniform manner. Utilizing the model and development experience of the Oregon Experiment, this study identified directions for improving campus planning in the new historical period in order to guide and improve the Chinese university campus planning model, as well as to establish a sustainable campus cultural space system [7].
Therefore, this paper took the urban university campus as its topic of study, inherited the campus’s cultural texture, and avoided cultural fragmentation and homogenization in the course of urban regeneration and campus restoration and design. Using urban morphology as a theoretical foundation and data mining clustering analysis as a tool [36], this paper investigated a quantitative analysis method for urban university campus block morphology, which then developed into urban university campus regeneration and renovation design indicators and results for discussion and the conclusion [37]. The research structure is depicted in Figure 2.

2. Research Objects

2.1. Campus History and Culture

In the early 20th century, Guangzhou’s Tianhe district was primarily hilly and desolate, which was one of the reasons why the former National Sun Yat-sen University Wushan campus was built in Guangzhou’s Tianhe district, a mountainous learning environment away from the bustle of the metropolis. The campus development began in 1933, and the completion of construction work experienced three stages within six years spanning from 1933 to 1938. Every two years was set for a period. During the first and second period, most of the construction projects and site design were completed, while, over the third period, only a small amount of construction was completed due to the influence of the war.
During the massive consolidation of China’s higher education institutions in 1952, the former National Sun Yat-sen University’s Wushan campus was divided into two parts: the South China Agricultural College and the South China Institute of Technology. The latter was the forerunner of the South China University of Technology’s Wushan campus. During this time, the South China Institute of Technology campus mostly kept the buildings in the center of the prior campus and developed the primary layout and shape of the present-day South China University of Technology (SCUT) Wushan Campus. The period of the South China Institute of Technology, 1954–1988, was one in which the buildings and grounds of the preceding buildings played a significant role and were repurposed despite being destroyed by wartime fires. The South China Institute of Technology was officially renamed the South China University of Technology in 1988. With the development and transformation of the university and the expansion of its size, the Wushan campus of SCUT ushered in a period of peak construction, and the buildings constructed in the early years required protection, renewal, and reconstruction to varying degrees. It was necessary to conserve, renew, and renovate the early university buildings to varying degrees, including the reconstruction of the residential complex at 14–37 Songhua River Road and the extension of the SCUT library [38].
As a result, the Wushan Campus of SCUT has taken on a complicated appearance, with signs of buildings from different eras layered or rebuilt, and the campus has been in existence for between 70 and 105 years. As indicated in Figure 3, the location of the Wushan Campus of SCUT has increasingly merged with the urban growth of Guangzhou as the city has grown and developed.

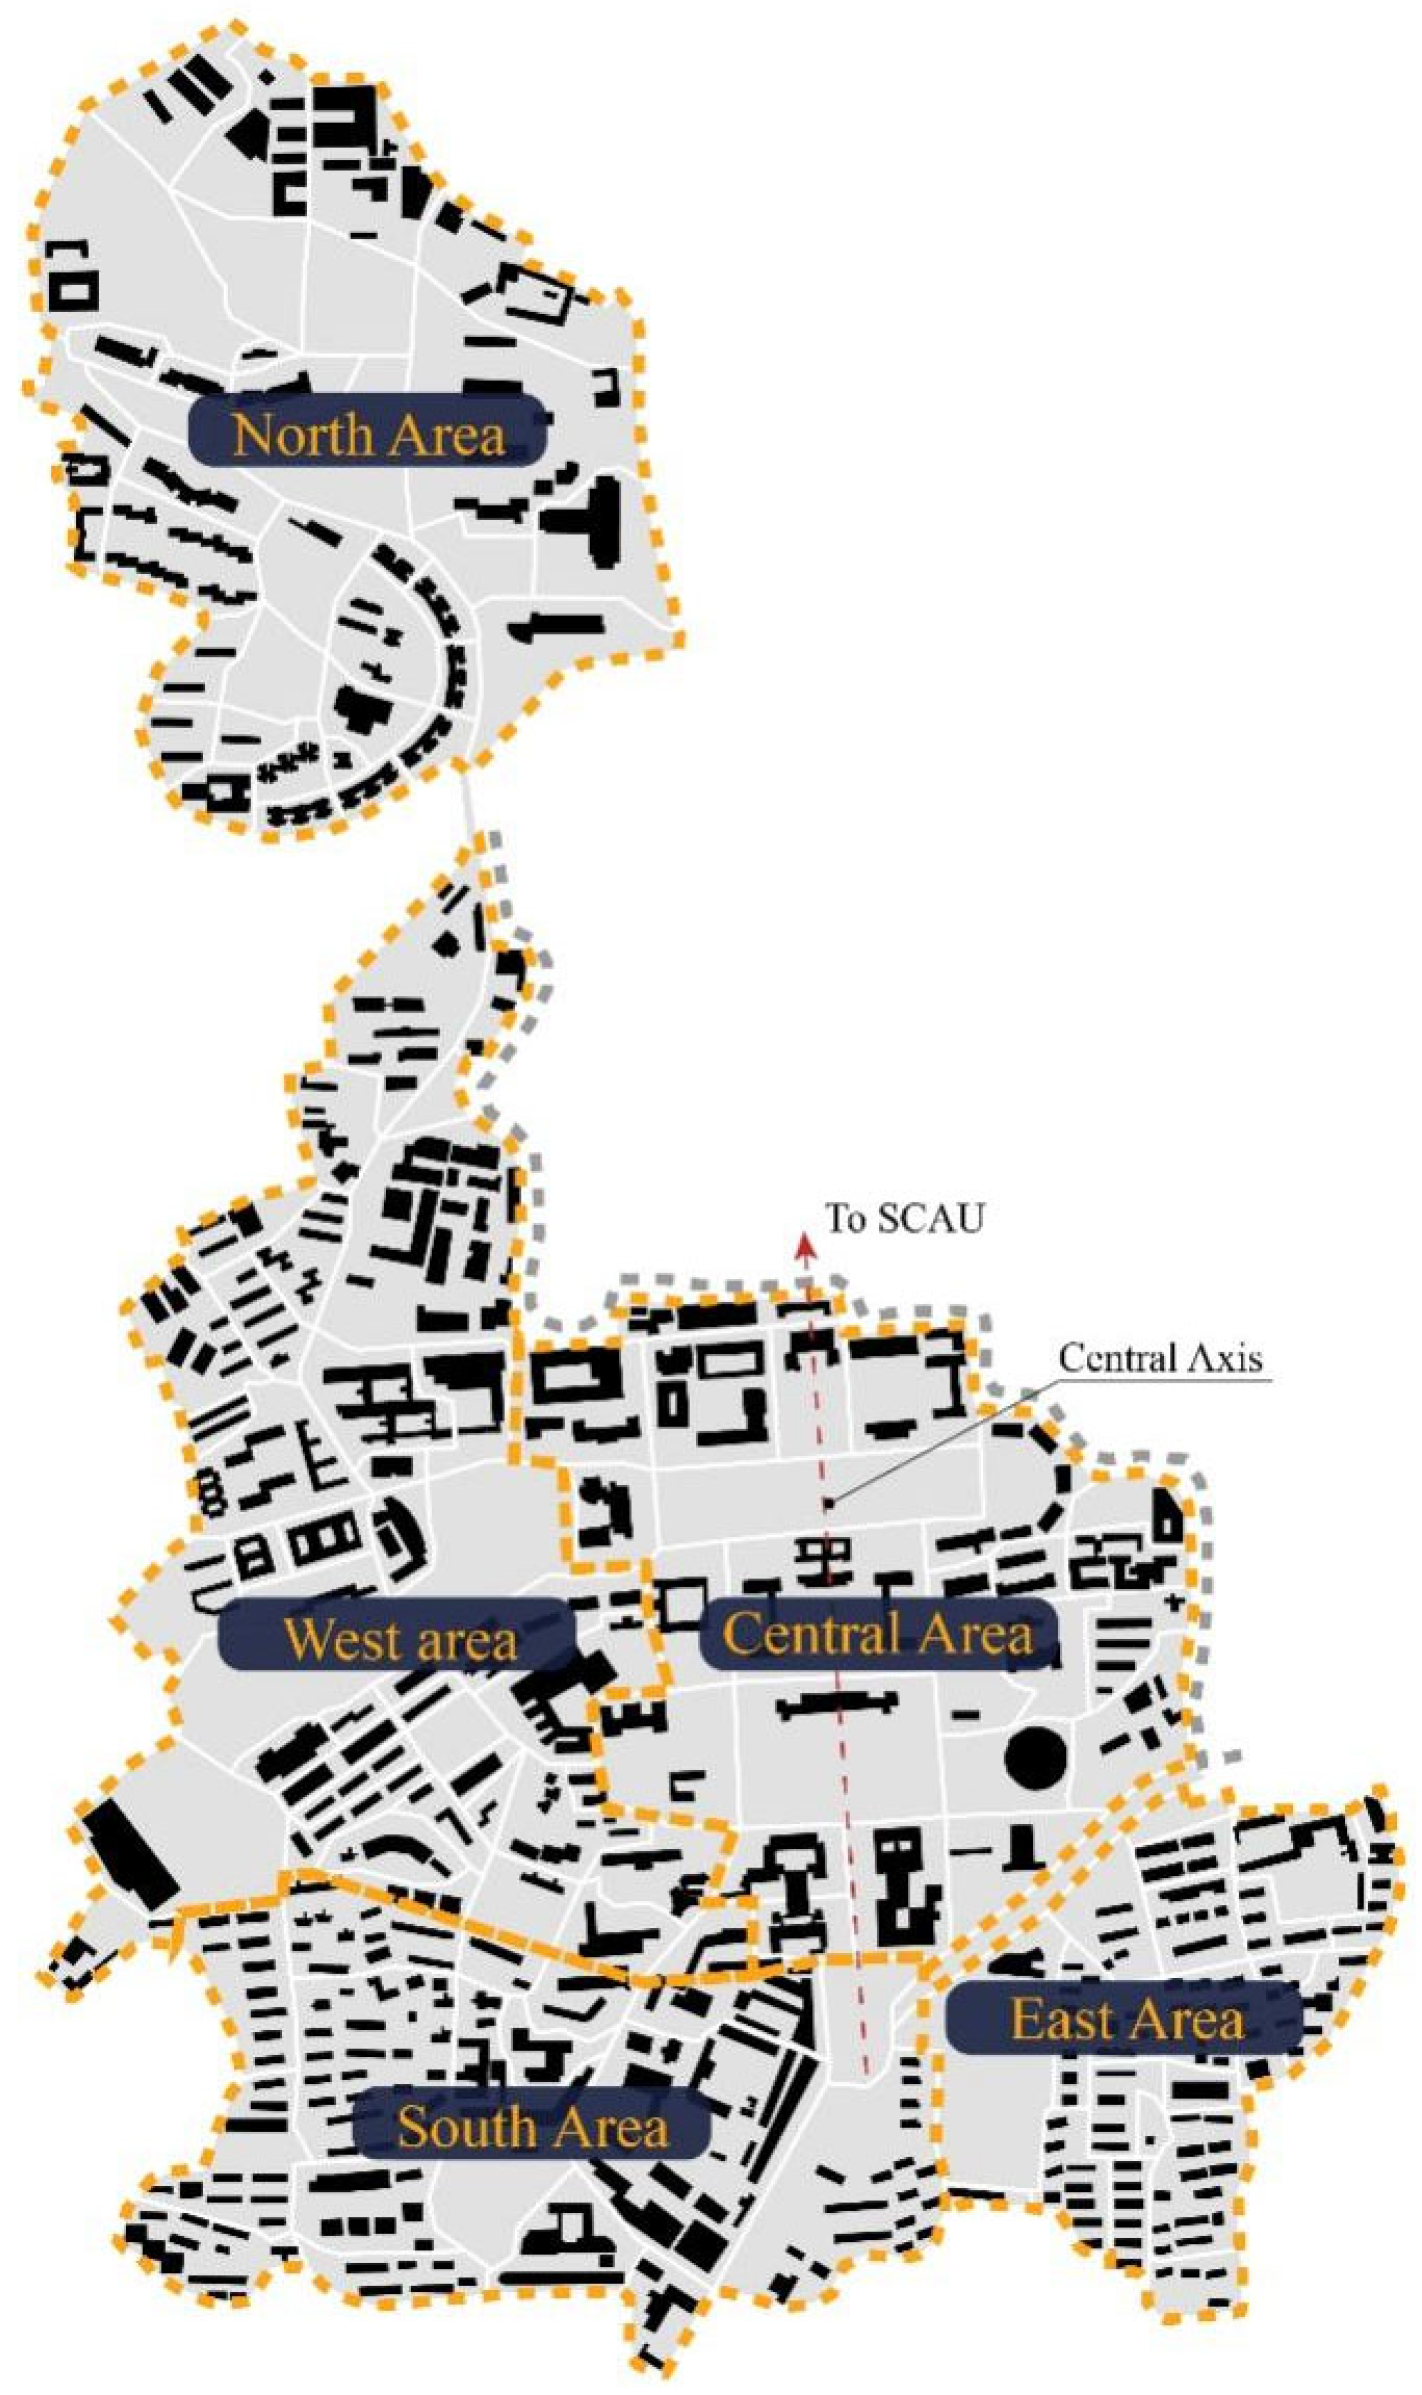
2.2. Urban Campus Spaces and Hierarchical Scale of Campus Blocks

The Wushan Campus of SCUT consists of the main campus (East Area, West Area, South Area, and Central Area) and the North Area, as shown in Figure 4. While the North Area is a very remote island to the north of the main campus and contains student residences, some young teachers’ flats, and a few teaching buildings, the main campus contains the majority of SCUT’s early buildings as well as teaching, research, and living buildings. The North Area has grown to be increasingly more connected to the main campus as a result of its expansion, and it now serves as a significant “satellite city” for those who live and work on the Wushan campus of SCUT. The central axis of the Wushan campus is located in the center of the main campus. The campus runs in a north–south direction, extending northward to the South China Agricultural University (SCAU). This is a continuation of the former National Sun Yat-sen University Wushan campus’ north–south axis, which begins with the South Campus Square and ends at the Liwu Building. While the housing and recreation areas are dispersed along the central axis to the east and west of the campus, the primary teaching and research facilities are grouped along this axis and on both sides of the campus. The Eastern District Teacher’s Residence site, the Western District Student Residence and Teacher’s Residence, the Northern District Student Residence and Teacher’s Residence, and the site combining the University Hospital and the Eastern District Student Residence are all dispersed over a sloping topography in the southern-eastern corner of the campus.
The street itself and its layout in the street system refer to the open space formed by the division of the street-lines, which sets aside space for traffic, communication, and public activity, an important carrier of the urban public space pair, providing citizens with an important means of urban social communication and an essential link for recalling memories between people, humans, and the world [27].
In this research, the spatial form of the campus chosen for analysis is the blocks element hierarchy, and the block hierarchy of the Wushan campus of the SCUT is quantified in terms of type. The campus-wide block environment presents a comprehensive and complex campus texture, including the campus environment inherited from the construction of the former National Sun Yat-sen University campus and the blocks where several early campus buildings are located. The study also includes the block patterns of the new planning and construction of the campus in various periods of the campus blocks’ environmental changes after the initial planning and construction of the campus.

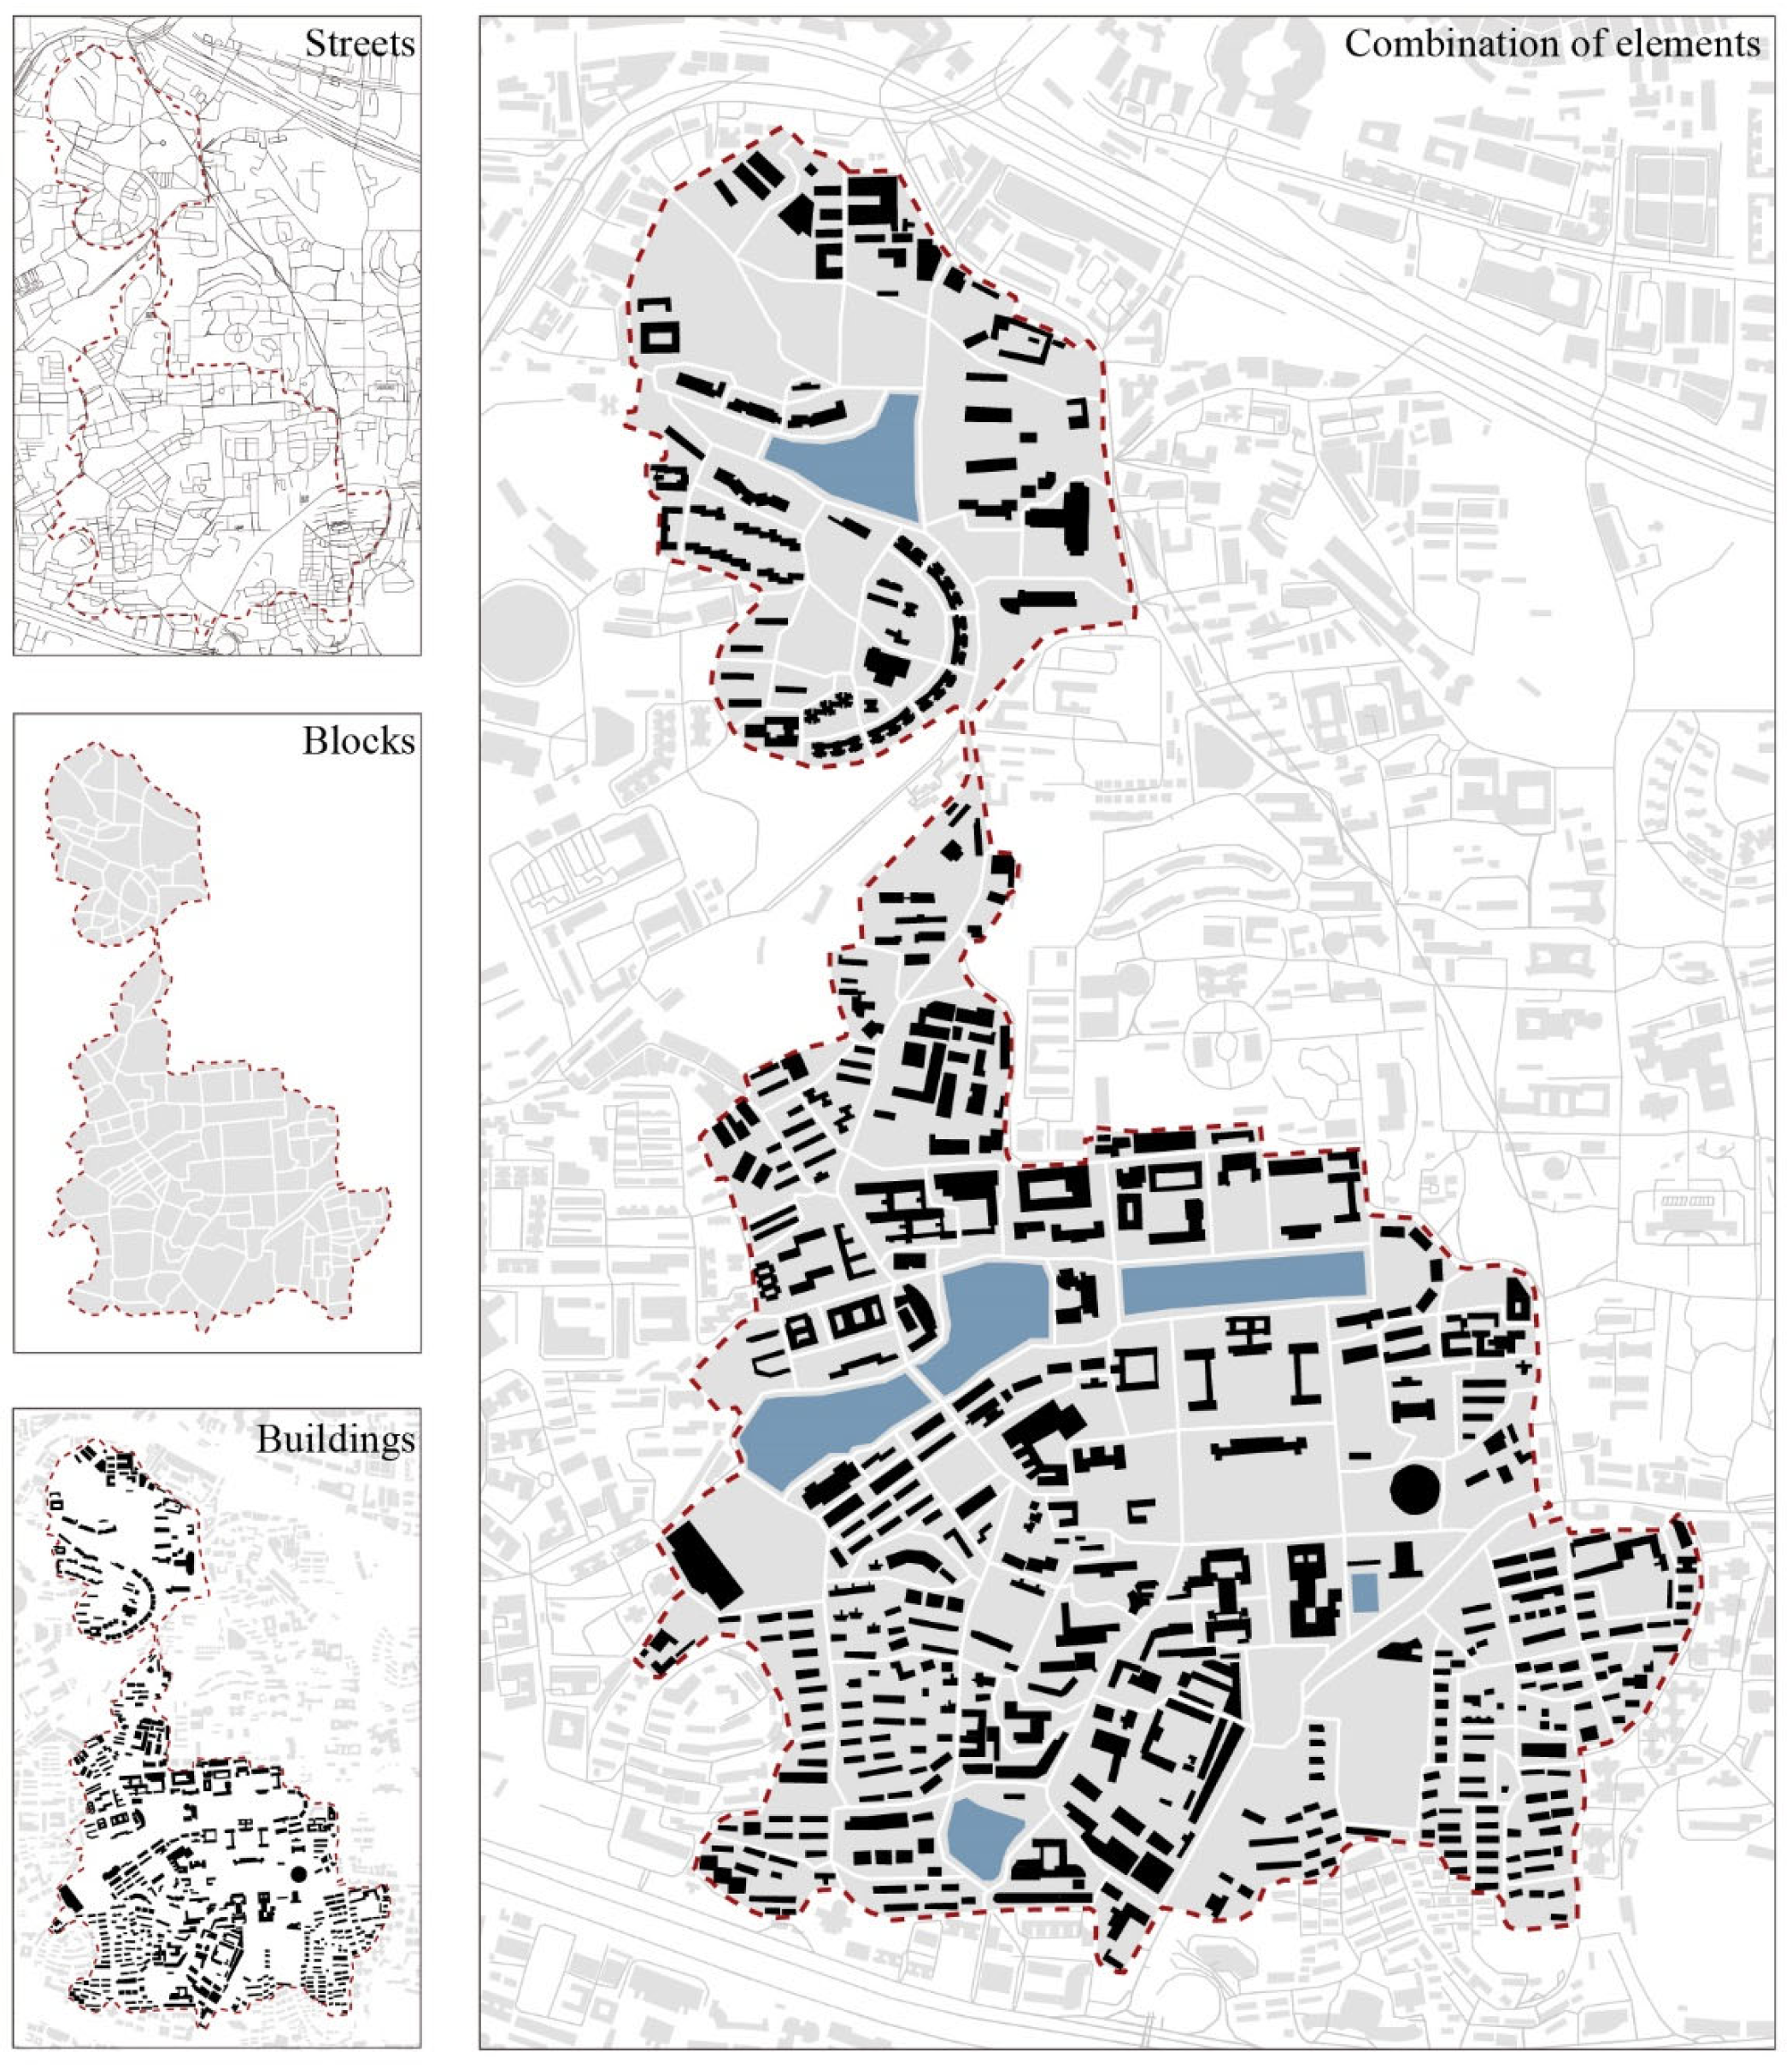
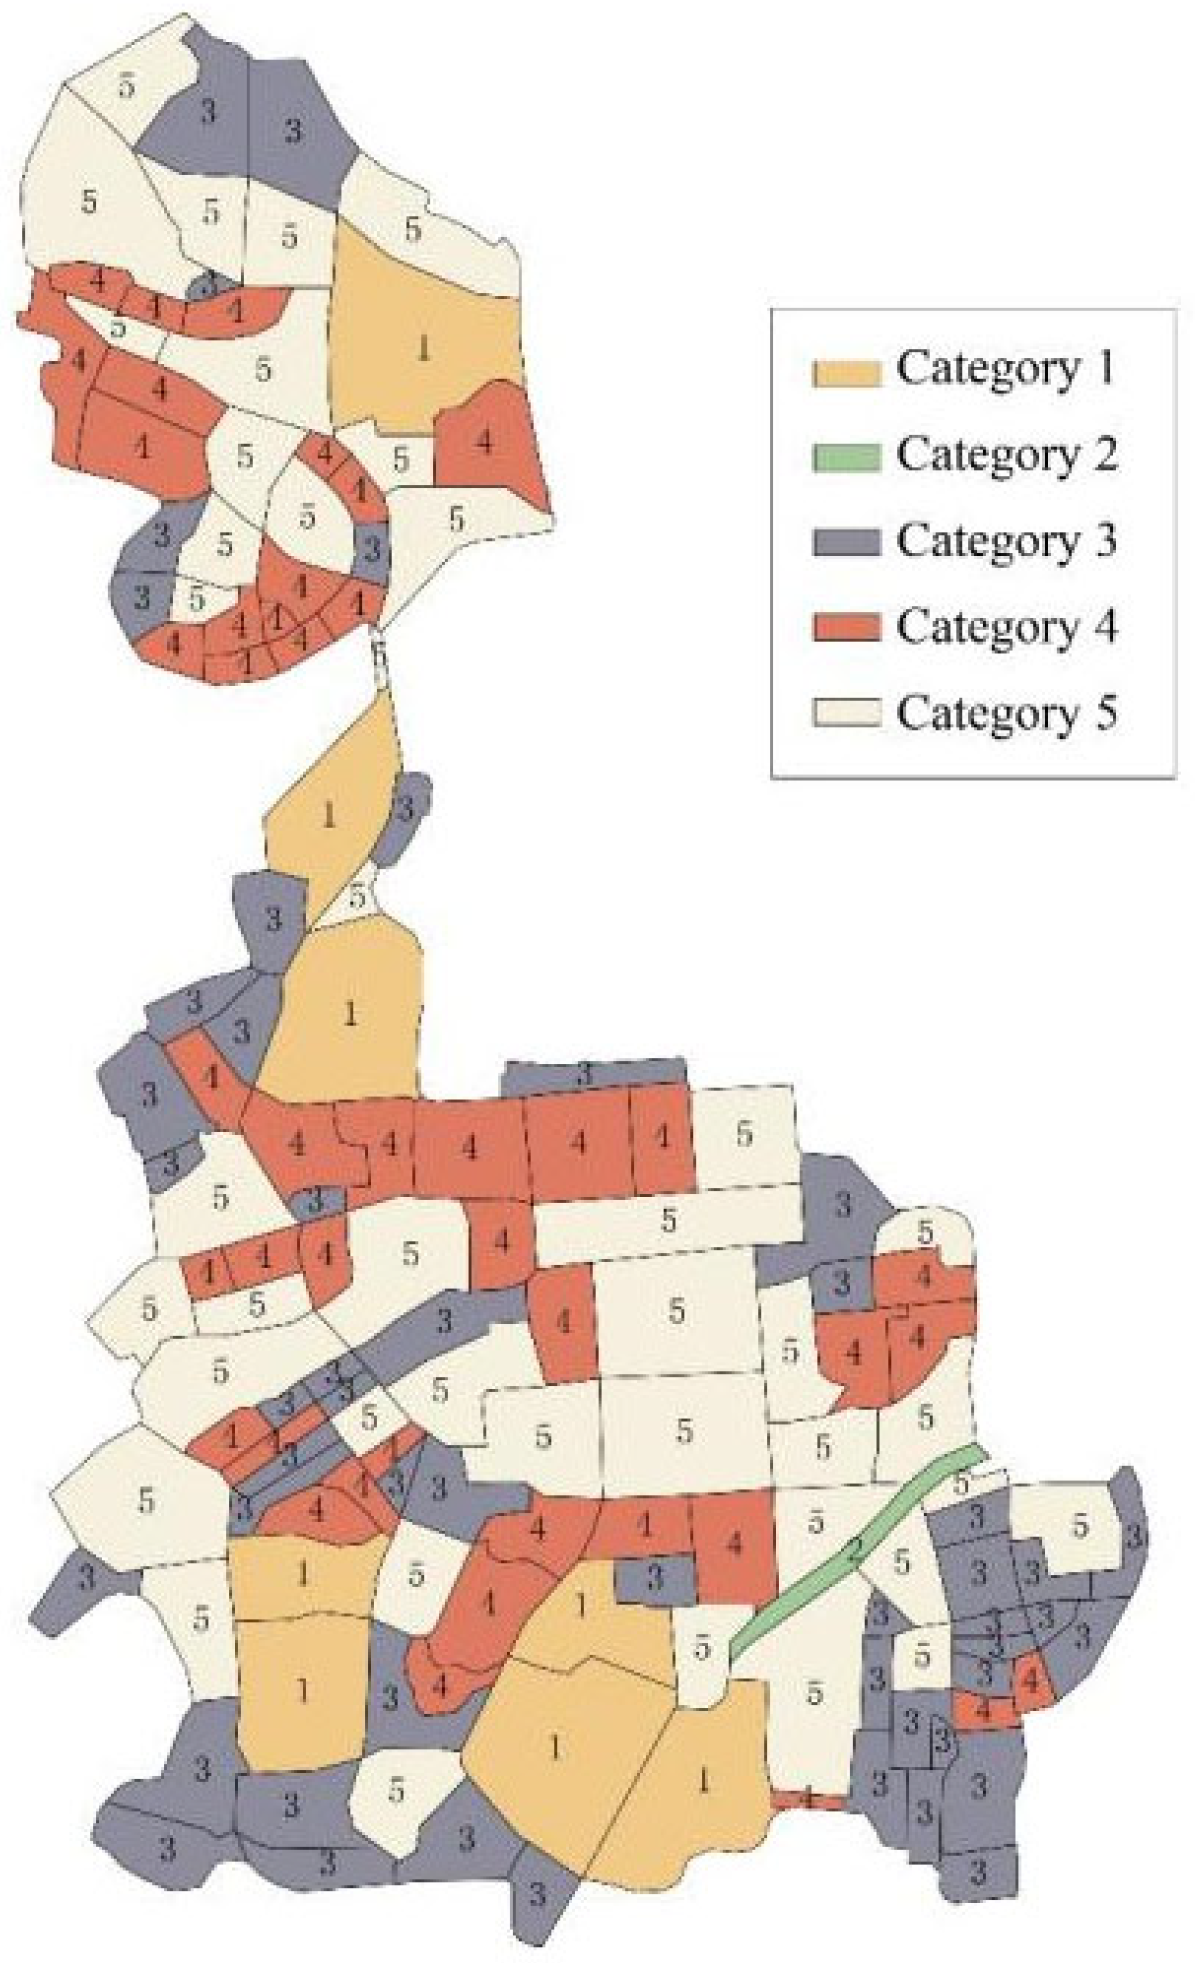
2.3. Morphological Characteristics of the Campus Blocks

The Wushan Campus of SCUT is situated in a hilly area with rather undulating terrain and has been under construction for a very long time. This is unlike the new campus in other areas, which is typically planned as a whole and has a block-like structure. Therefore, the study of the blocks form of the campus of SCUT, Wushan Campus, was simplified into the minimum boundary geometry, and the characteristics of the block elements were calculated by calculating the long side, short side, and direction of the minimum boundary geometry. The morphological elements of campus blocks are shown in Table 1.

3. Method

3.1. Elemental Data Collection

As illustrated in Figure 5, the geometric characteristics of the campus plan of South China University of Technology’s Wushan Campus are characterized by differentiating the campus roadways, campus blocks, buildings, and lakes, as well as visualizing these elements using the GIS platform [39].
On the basis of Klopf’s generic structure, as depicted in Figure 1, this research identified the campus typology at each scale level using a quantitative analysis method that continues the traditional cultural fabric. Moreover, the study of particular morphological elements should be considered in terms of the element’s relationship to the elements it contains.
The scale level chosen for study in this paper was the block level, where the blocks of Wushan Campus of SCUT were split into irregular patterns by roadways and the individual blocks were numbered as shown in Figure 4. Observing the arrangement of the block plan within this range with the naked eye is possible if only the shape and size of the blocks are distinguished. However, analyzing merely the contour of a block is plainly insufficient, and the relationship between the blocks and the structures and open spaces it contains should be evaluated holistically. When planning a building, a roadway, or other elements of an environmental system, consider them as part of a place network, or a network of places [8]. There is no consensus over which criteria should serve as the basis for establishing urban form types on the basis of the characteristics of the elements. This paper sought to identify urban morphological types from a comprehensive standpoint. To avoid the subjectivity of artificially selecting classification attributes, individual characteristics of morphological elements were selected as comprehensively as possible in relation to specific cultural areas and scale levels. As shown in Table 1, 14 characteristics attributes were selected for the block elements of the region, including not only the spatial scale and proportion of the blocks themselves, but also the relevant attributes of the buildings and open spaces within the blocks, which can comprehensively express all aspects of the blocks. As the blocks of Wushan Campus of SCUT are all of special morphology, this paper describes their morphological characteristics by calculating the minimum boundary geometry of the block’s morphology, as shown in Figure 6, where the long edge and short edge were measured by calculating the minimum rectangular boundary of the shape, the direction represents the clockwise angle between due north and the long edge direction, and the elongation is the ratio of the long edge to the short edge.
The classification findings derived from the individual qualities were neither good nor bad. Rather, they were merely categories that can be understood from multiple perspectives, which can in some ways reflect the block form of the university campus. As depicted in Figure 7, the raw data of the Wushan Campus of SCUT blocks were retrieved and analyzed, and the relevant geometric data were extracted from a GIS.

3.2. Elemental Data Processing

  • Data standardization
Before clustering the morphological elements, it is necessary to standardize the data to eliminate unit and order of magnitude differences between the various characteristics of the data, specifically by employing the Z-score standardization method, which transforms the data into a standard normalization distribution. SPSS software was used to apply Z-score standardization to the data in this article.
2.
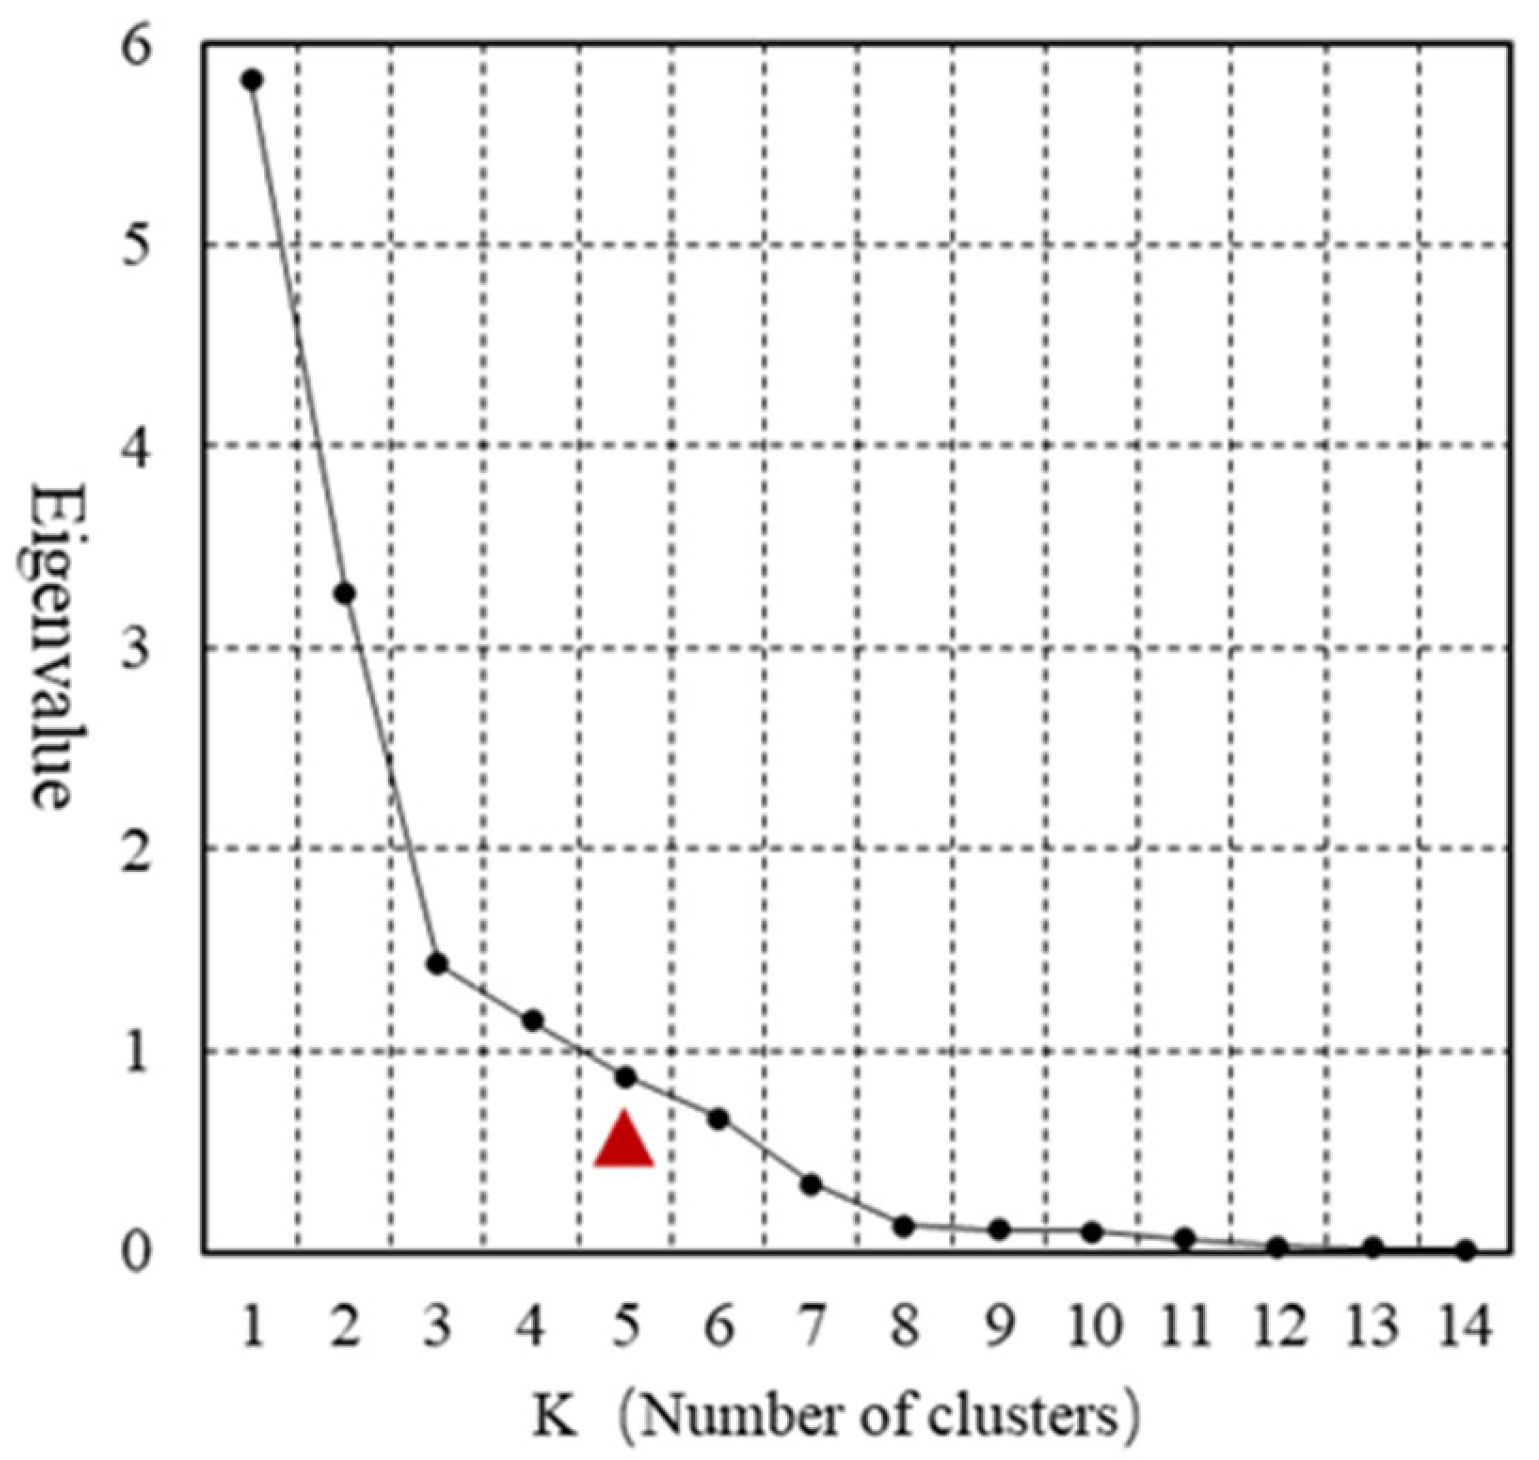
Reduced dimension factor analysis
This paper used factor analysis to reduce the dimensionality of the data by extracting a small number of uncorrelated factors that represent the original data from a large amount of data with multiple characteristics, thereby simplifying the data mining process and reducing the interference caused by data correlation.
The campus data of SCUT’s Wushan campus yielded a KMO test coefficient of 0.715 (higher than 0.7), and the variables were strongly associated with one another, meeting the requirements. In addition, the significance of Bartlett’s test value was less than 0.001, indicating that the correlation between the variables found in this study was robust and appropriate for use in the component analysis, as shown in Table 2.
On the basis of the results of the total variance interpretation table, which provided the eigenvalues and variance contributions of each component, the factor variables were then extracted. For setting whether the eigenvalues were more than 1, four factors were extracted in this study, and their total variance contribution was 83.346 percent (greater than 80 percent), indicating that the four extracted factors may represent the primary content of the original data, as shown in Table 3.
This work subsequently obtained a matrix of the four extracted elements, via which the true relevance of each factor could be evaluated. If the absolute value is greater than 0.5, shown as the colored numbers in Table 3, we can assume that factor 1 expresses information on the long edge, short edge, rectangular perimeter, number of buildings, area perimeter ratio, gross floor area, and building footprint of the campus block; that factor 2 primarily expresses information on the number of stories, gross floor area, volume ratio, and floor area ratio; that factor 3 primarily expresses information on the elongation of the campus block; and that factor 4 expresses information on the direction, number of buildings and the number of buildings ratio. Factor 4 provides information regarding the number of buildings ratio and direction of the campus block.
Finally, the score coefficients for each factor were obtained, as shown in the Table 3, and the expressions for each factor were then calculated as
F n = C 1 × Z x 1 + C 2 × Z x 2 + + C i × Z x i
In the above equation, F n denotes each factor score, C i denotes the score coefficient of each factor, and Z x i denotes the Z-score normalized feature data. The resulting data were downscaled to the four-factor scores and rotated so that the factors remained orthogonal but the variance difference of each factor was maximized, i.e., the sum of squared relative loadings was maximized in order to better explain. The results are shown in detail in the accompanying Table 4.
3.
Calculation of data analysis.
The number of K values must be determined by the researcher. Different K values will provide distinct categorization outcomes, and we may not require an unacceptable number of clusters. If the number of K values is too great, the distinction between clusters may not be clear enough. If the number of K values is too small, the objects within the same cluster may be vastly diverse and fail to match the analysis’s expectations. By calculating the error sum of squares of each data point with its cluster center at various K values and observing the resulting Scree plot, the best clustering K values were determined on the basis of the characteristics of the data, and the K-means clustering algorithm in SPSS software was used to cluster the data.
According to the Scree plot in Figure 8, when the K-value is lower than the actual number of clusters, the eigenvalues will level off as the K-value increases. The minimal K value (the turning point) before the eigenvalue flattened out was chosen as the number of clustering data, as indicated by the red triangle in Figure 8.
After Z-score normalization and dimensionality reduction, this study yielded data including four components for the specified Wushan campus of SCUT information. To acquire suitable K-values, we must calculate the clusters and eigenvalues for each K-value independently (the number of K-value clusters was chosen to be between 1 and 14) and then generate the scree plot of K-values and eigenvalues.
Thus, this study chose to divide the area’s spatial morphology into five categories because it can be seen that data began to level out at K = 5. Figure 9 depicts the clustering results for this batch of data, which were produced by applying K-means cluster analysis to the data obtained before the application of SPSS software. As a result, the block morphological features of the Wushan campus of SCUT were separated into five clusters, with each cluster representing a campus block type.

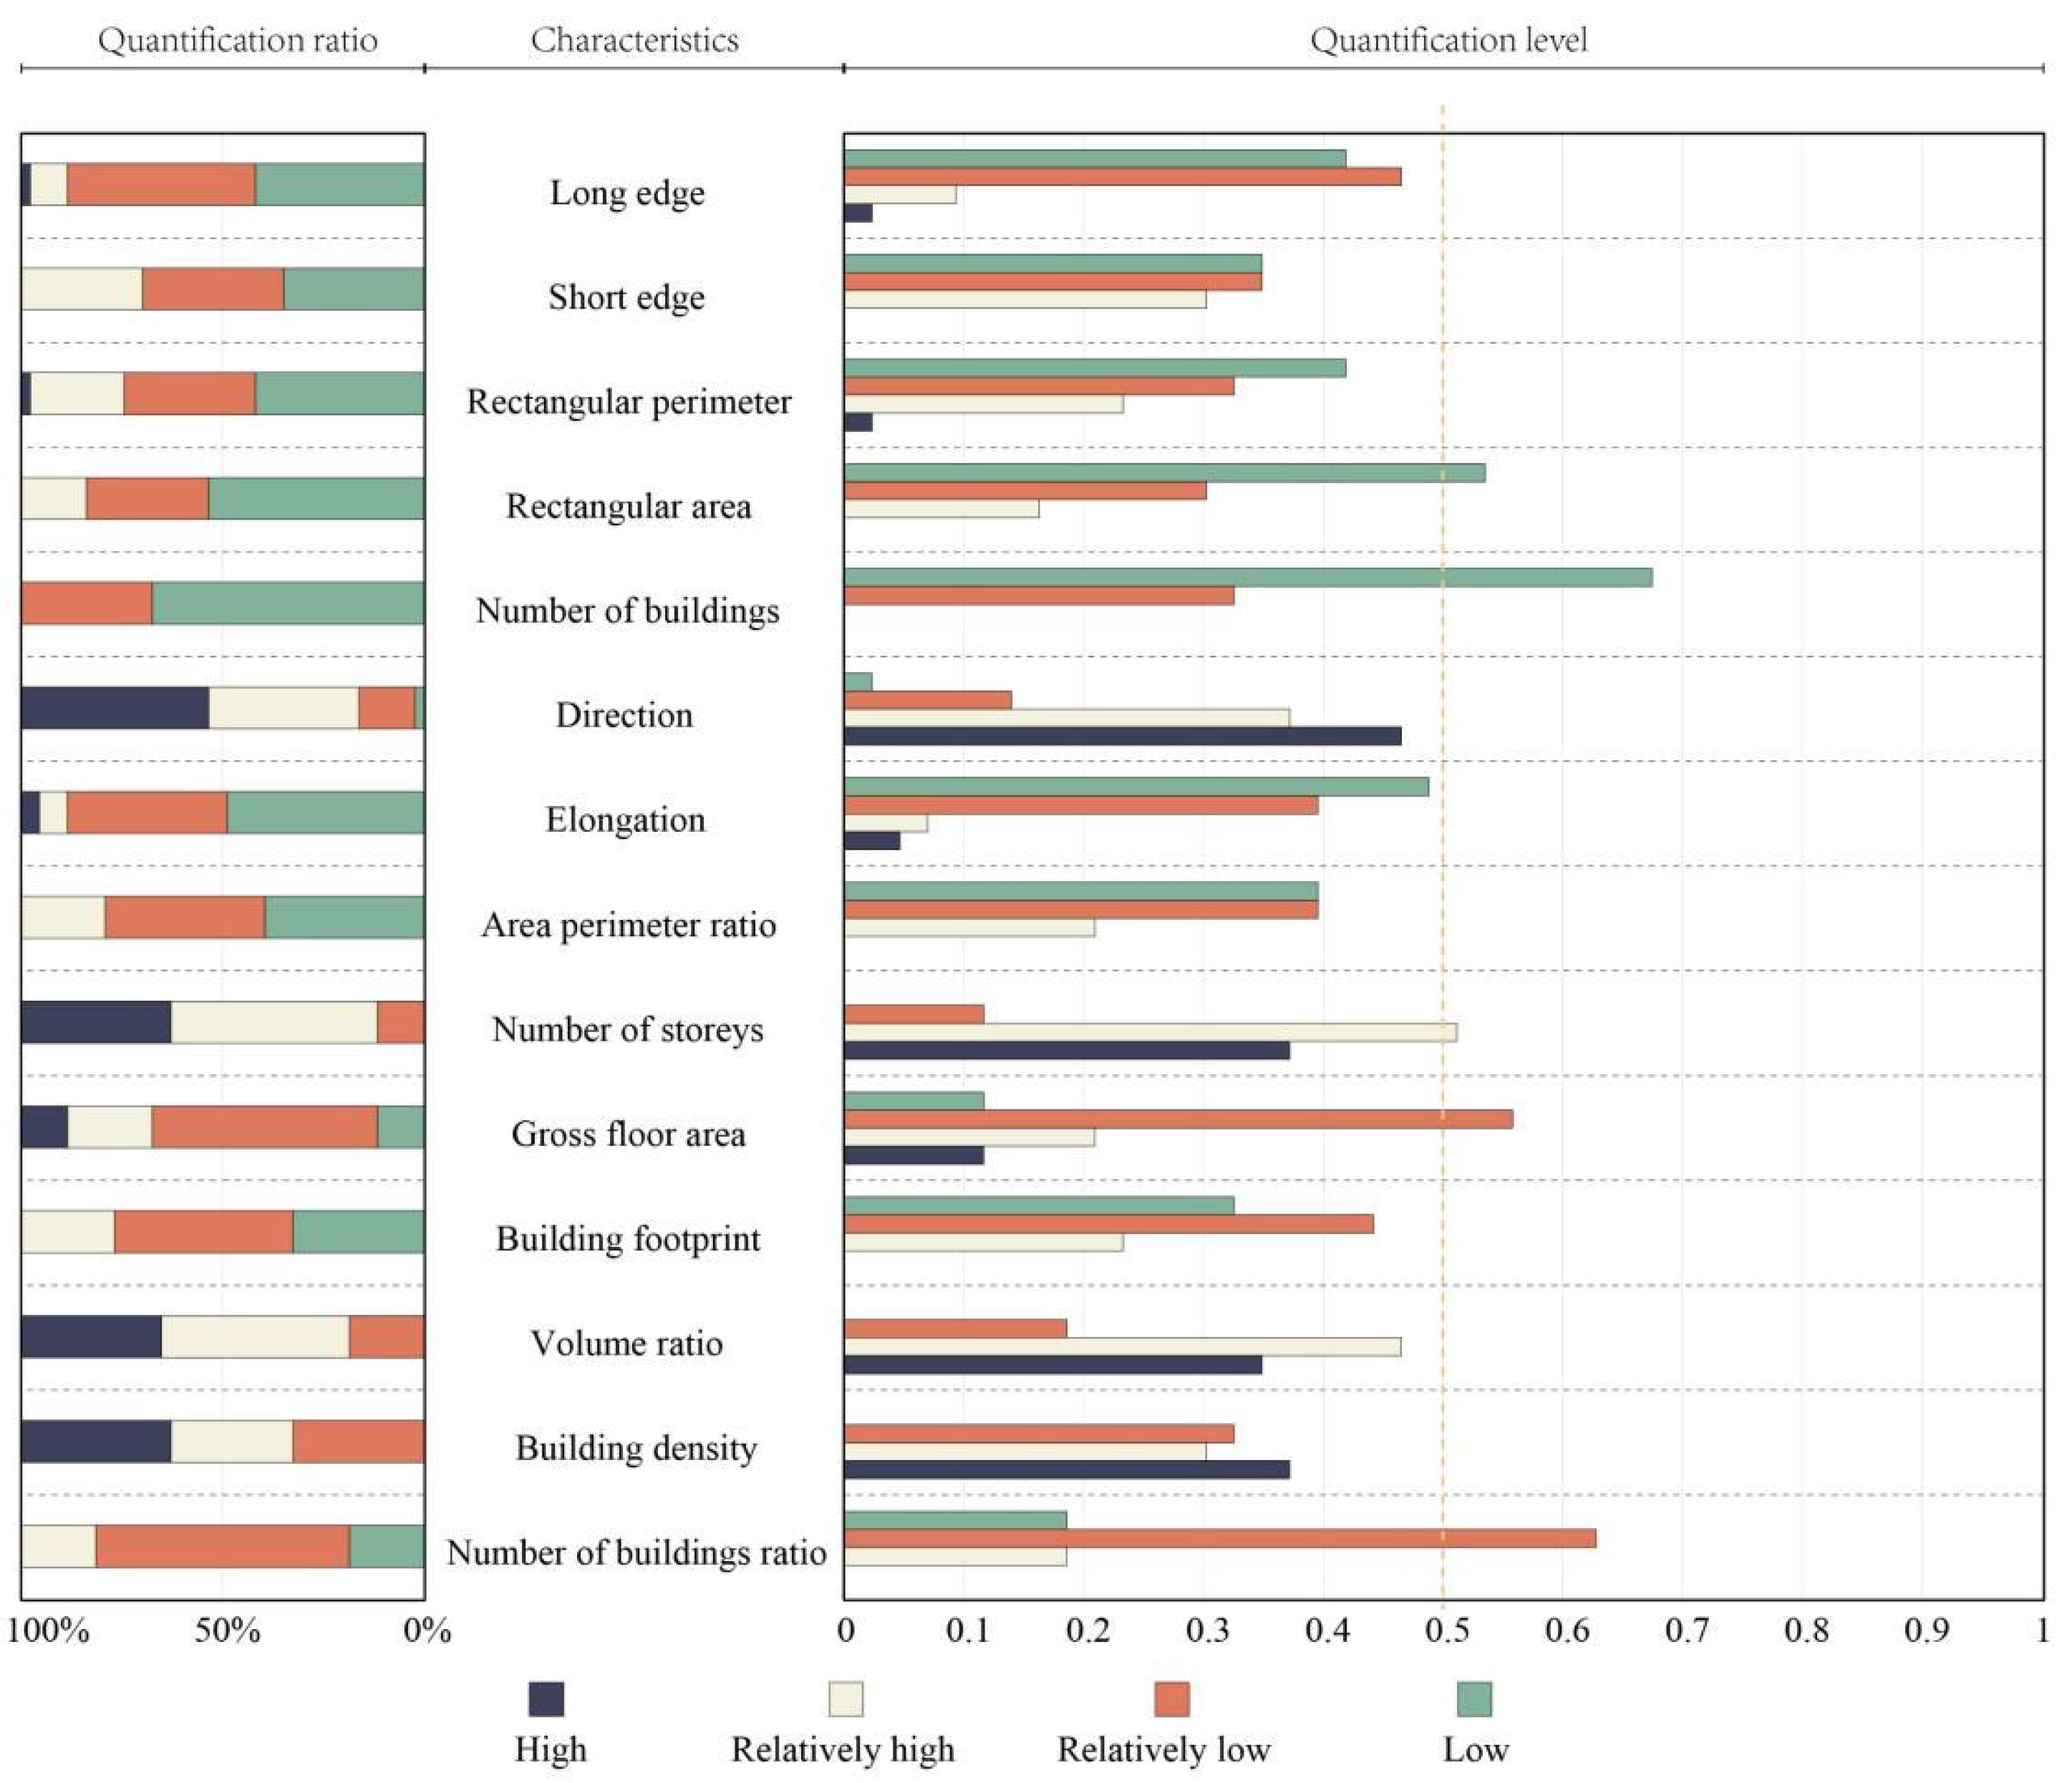
3.3. Description of the Data Analysis

The study describes the data mathematically and qualitatively, as shown in Figure 9, transforming it into categories of campus block morphological aspects that have practical significance on the basis of the cluster analysis results. The findings of the cluster analysis include the category into which each object is classified and the distance between it and the cluster center of that category, i.e., the mean. On the basis of the distance, the objects closest to and farthest from the cluster center in each cluster can be identified. In this work, the item closest to the cluster center was approximatively defined as the cluster center of the category and is referred to as an “example” of this type.
The blocks within the Wushan campus of SCUT were classified into five campus morphology kinds, and the objects closest to the cluster of each type were chosen on the basis of the clustering results, leading to the identification of four examples of block types and quantitative data for the area, as shown in Table 5. The five instances were positioned conceptually on the Wushan campus of SCUT, and the precise spatial patterns were depicted on satellite maps and bottom schematic maps of planar geometric features, as shown in Figure 10.
Example 1: Nanxin Village, a high-rise and tiny high-rise multi-story residential campus, was constructed in a huge rectangular area in 1985, containing a large number of buildings, all with nine stories or fewer, within the block.
Example 2: Wushan Road is a long block square with a pass-through urban public garden on the ground level, connecting the Wushan Cultural Square on Yuezhou Road and the South Gate Square of SCUT, with a two-way urban road on the underground level.
Example 3: The building form within the block can be separated into two segments. In the 1930s, at the residential complex at 14–37 Songhua River Road, a cluster of low-rise buildings, served as professors’ housing during the era of the former National Sun Yat-sen University. It is now listed as a municipally protected historical structure. Since 2004, the architectural research team led by the academic He Jingtang has developed and restored the space in phases. The southern residential block is the former President’s Building, which was completed in 2000 and was originally constructed to house the SCUT’s leader with no more than five stories.
Example 4: The SCUT West Lake Court Hotel, which debuted in 2001 and has been in operation for almost 20 years, is located on the same block. The building comprises a western restaurant shaped like a boat in the east and a seven-story guesthouse in the north.
Example 5: Founded in 1952, SCUT East Kindergarten was once known as Zhongshan University Correctional Institution and has a 70-year history. The kindergarten consists primarily of a three-story classroom facility and outdoor activity areas.
For the representation of the characteristics of the campus block form of Wushan campus of SCUT, the natural breaks in the GIS platform were used to categorize risk for each feature data as “high”, “relatively high “, “relatively low”, and “low”. The proportion of each category was then counted and compared to the total level of the Wushan campus of SCUT to establish the category’s primary and distinctive characteristics.
The data results for category 1 illustrate its high long side level, high short side level, high perimeter level, high area level, high number of buildings level, low elongation level, high area to perimeter ratio level, high gross floor area level, and high building footprint level. The high category one-floor rating is a unique feature compared to the overall category.
The results for category 2 indicate that it has a relatively high long edge level, a rectangular perimeter grade, an elongation level, a relatively low rectangular area level, and a low level of other levels. Due to its specific block form and functional attributes, it is very different from the overall level of the Wushan campus of SCUT and has been placed in a separate category when analyzed and calculated using the K-means clustering method.
The data for category 3 shows that its major characteristics are its low rectangular area level and its relatively high number of buildings ratio level. The unique characteristics of category 3 are the high number of buildings ratio and the relatively high number of buildings compared to the overall population.
The data for category 4 is more consistent with the overall data for the Wushan campus of SCUT, and the results indicate a low rectangular area, a low number of buildings, a relatively high number of stories, a relatively low gross floor area class, and a low building ratio. The unique features of the campus are its high-volume ratio and building density level, compared to the overall data. Figure 11 shows the quantitative identification level of major characteristics for category 4.
The results for category 5 indicate a high short edge level, low number of buildings level, low elongation level, high area perimeter ratio level, low gross floor area level, building footprint level, volume ratio level, building density level, and number of building ratio level. The high rectangular area level, high area perimeter ratio level, high elongation level, low number of story level, and low building density level are unique characteristics, compared to the overall picture.
Through this approach, this paper identified the results of quantitative descriptions of the main features and distinctive characteristics of the five-block categories of the Wushan campus of SCUT and briefly outlines the qualitative characteristics of the various categories, as shown in Figure 12.
Category 1: Examples were mainly the dormitories of Wushan campus of SCUT, which were built in 1985. Its block form mainly reflects the type of staff dormitory and student dormitory at the Wushan campus of SCUT. With a large number of students, a large number of staff, and a large number of staff dependents, as of December 2020 statistics, SCUT has three campuses, including the Wushan campus, with more than 100,000 students enrolled in various categories and more than 4000 staff members. Examples of SCUT Wushan Campus on campus are the SCUT Hongyingyuan neighborhood, the SCUT Scholars Building, and the SCUT Xixiu Village neighborhood. The blocks in this category are large in scale, with traditional residential buildings dominant in the modern Lingnan area, being the product of the post-reform and opening-up periods when the universities were at the peak of their expansion, with relatively intact housing structures, but still in need of various degrees of renewal.
Category 2: The example is a special block form and is based on its special functional attributes and morphological characteristics. There are no other block plots within the Wushan campus of SCUT that are classified in the same category as it. In terms of its function, the example is a long civic public activity block square on Wushan Road, with an upper level for pedestrians and a lower level for vehicles.
Category 3: The northern block of the example is a residential complex at 14–37 Songhua River Road, formerly used by professors of the former National Sun Yat-sen University, but which has fallen into disrepair. In particular, some of its buildings are in a state of disrepair, with six single-story sloping villas built in the 1930s in the northern row and four two-story duplexes built in the late 1970s in the southern row. It is now protected and converted into the studio of academician He Jingtang. On the southern side of the block is a residential building of no more than five stories for the residence of the heads of the university, commonly known as the Principal’s Building, which was built in 1985. Influenced by early traditional street planning and the historical landscape of Lingnan, the block within this category has a low rectangular area level but a relatively high number in terms of building ratio, mainly historic buildings with conservation value, including the SCUT East residential building and the East student dormitory.
Category 4: This example block is located in the central area of the Wushan campus of SCUT. Influenced by the location of the campus, the form of this example block is roughly the same as the form of the block in the teaching area of the campus and is classified as a category. Due to the constraints of the teaching function, the buildings within this category have a low number of buildings levels, a relatively high number of story levels, and a large building mass.
Category 5: The former National Sun Yat-sen University Correctional Institution and now the kindergarten of Campus East, the examples in this category are old and reflect the block form of the early campus planning and the regional characteristics of Lingnan. Most of the blocks in this category are student dormitories built in the early days, as well as groups of water-facing and waterfront buildings with a traditional Lingnan garden style. The number of buildings in this category, the gross floor area, the building footprint, and the volume ratio are relatively low, and the buildings are well integrated with the landscape water pavilions.

4. Results

This research, after completing a quantitative analysis of the block morphological typologies on the Wushan campus of SCUT, determined the categories to which each block belongs, the archetypes of each typology, and the primary characteristics and distinguishing aspects of the typologies. This article combined research on urban morphology and architectural typology to present an experimental method for guiding the renewal of campus blocks.

4.1. Introducing the Guiding Principles of Campus Regeneration

Campus block morphology is not always static, and its shape and kind are regularly altered as society evolves and students and staff need to shift. After analyzing the current campus block shape, it is not necessary to update and restore it according to the original block’s morphology and proportions. It is appropriate to regulate the campus block morphology’s pattern in change so that it can spontaneously create a variety of outputs on the basis of the current context and the needs of teaching and learning life. Nonetheless, these modifications are generated according to defined constraints and do not spiral out of control. On the basis of a quantitative examination of the present state of the Wushan campus of SCUT, the following regeneration and renovation principles are outlined:
  • Renew and renovate a design on the basis of the cultural heritage of the campus
A university’s development cannot be divorced from the cultural field, regional breadth, and humanistic framework in which it is located. Only when it is based on local culture and retains regional peculiarities will it be able to avoid the dilemma of tearing apart the historical fabric of campus development and the convergence beyond the regional culture [40]. Therefore, in the process of renewing campus blocks, it is vital to adapt to the environment in which they are situated and to avoid the construction of block form features that are incompatible with the campus’ cultural setting.
2.
Consider the relationship between the scale of the city and the level of the campus
Each functional area’s scale hierarchy is inextricably linked to the city’s scale hierarchy [41]. The university campus is one of the most significant functional locations in the urban space, and the absence of its scale hierarchy will lead to a loss of energy and resiliency in the neighborhoods. The university campus is an integral part of the urban system, and its components must be renovated in the process of preserving the urban form as a whole. While an innovative design is sometimes intended as a quick fix, it must also be compatible with the surrounding environment [42]. Therefore, the design of campus regeneration should avoid imbalance with other elements and should be a synergistic design of elements and elemental relationships, taking scale hierarchies and hierarchical relationships into account, in order to preserve the integrity and continuity of the city as was the campus form [43].
3.
Allow for a degree of innovative transformation
Despite the importance of preserving the integrity and continuity of the urban and campus form and avoiding severe overall transformations, some necessary alterations should not be fully prevented. Times are changing, people are evolving, and universities need to be updated. The formation of such new elemental characteristics that are not destroyed but gradually proliferate demonstrates that they have some function and vitality, and as a result, the campus and even the city will gradually grow [44]. Therefore, innovation must be accepted and affirmed, but it must also be restricted within specific boundaries [45].

4.2. Evolution of the Control of Campus Regeneration Indicators

On the basis of the aforementioned guiding principles for campus regeneration and transformation, it is necessary to build a quantitative, operable technique for guiding its block characteristics. The block morphological categories of individual campus character elements are studied using quantitative methods, and the unique characteristics and distinguishing aspects of the categories can be utilized to guide the practice of campus renewal and restoration. When planning the regeneration of a certain piece, the element’s category and category characteristics should be taken into account. The main characteristics of a block are the general tendencies of the type on that campus block and are shared by the vast majority of that type. The unique characteristics of a block describe what distinguishes a category from other categories on that campus block and are the key to the category retaining its uniqueness; the common characteristics do not describe the category’s and indicate that the type is not exceptional in this regard.
The distinctive characteristics are more important than the dominant characteristics, and in fact, the range of dominant characteristics frequently includes the distinctive characteristics. When the vast majority of the same type possess a particularly dominant characteristic, it is possible to compare distinctiveness with other categories. Therefore, we must restrict the range of characteristics of the type that can be altered, with the range of unique characteristics being considerably less flexible than that of non-dominant or non-unique characteristics. The restricted range is assessed relative to the agglomerative center of the type, which is the mean of the characteristics data for all objects belonging to the same type.
Using category 4 as an example, its unique characteristics are floor area ratio and volume ratio. Its main characteristics are rectangular area, number of buildings, number of stories, gross floor area, and number of buildings ratio, and only the long edge, short edge, rectangular perimeter, direction, elongation, and building footprint characteristics are ordinary characteristics. The standard values of category 4′s main characteristics and unique characteristics are then calculated. This paper restricts the variation range of unique characteristics to within 20% of the standard value and the variation range of primary characteristics to within 30% of the standard value, as shown in Table 6.
In this paper, we highlight an urban morphology approach to classifying campus morphology and finding campus block morphology for research. Using quantitative spatial indicators to define the morphology of campus blocks, the approach for guiding the renewal of campus blocks at the block morphological level is based on a cluster analysis that summarizes the characteristics of the spatial types of campus blocks. This technique can be used to guide the design of the regeneration and transformation of blocks on the basis of on-campus cultural heritage, particularly concerning the primary and unique control indicators of the categories, so that the campus block morphology retains its original block morphological characteristics. Simultaneously, innovation is permitted. This enables a greater adaptation to the development of disciplines and the reorganization of the campus without compromising the campus’s original fabric and preventing the convenience of forms. The evolution of the indicator is shown in Figure 13.

5. Discussion

5.1. Comparison

Using the quantitative analysis of block morphology and the evolution of renewal and renovation design guidance for the Wushan campus of the SCUT, as an illustration, the aforementioned procedure begins with the university campus block morphology perspective hierarchy, collects block morphology data through big data, and then conducts cluster analysis before evolving into the renewal and renovation design guidance procedure. The process is based on the theory of urban morphology and the K-means cluster analysis method of data mining, using GIS, SPSS, and other computer software as well as the historical and cultural evolution of the university campus to study its block morphological characteristics, determine the main characteristics and unique characteristics of the university campus block morphology, and establish its morphological standard values according to the different characteristics indices. The control scope of the block morphology is determined. On the basis of cluster analysis, the entire process of quantitative analysis and design guidance of university campus block morphology is completed, and a framework of design advice for university campus renewal and renovation is established.
As an interdisciplinary field, the theory of urban morphology has received increasing attention from scholars. In the process of urban regeneration, the hierarchical classification of cities according to urban morphology theory has been examined for many items that would inherit urban fabric in the future, and other scholars have undertaken comparable studies on the quantification of morphology [46,47]. Zhao Yuwei quantified urban morphological types from a morphogenetic approach, examining the inherent linkages between urban morphology and gene transmission [48]. Focusing on the relationship between urban geometry and neighborhood-scale open space daylighting, Chatzipoulka et al. examined 132 urban morphologies in London and Paris, two cities with similar geographical latitudes but distinct urban geometries [49]. However, there has been no consideration for the transfer of the area’s cultural fabric. Moreover, Kolokotroni et al. summarized the results of temperature measurements conducted in London in 1999 and 2000, which were used to quantify the urban heat island intensity of London [50]. In addition, Rode et al. built a sample of residential building types including Paris, London, Berlin, and Istatoer to understand the relationship between different urban forms on thermal efficiency, creating ideal models to simulate solar gain and building surface energy losses. The results demonstrate that the urban heat island intensity of London is increasing [51].
Nevertheless, a single examination of the thermal environment and urban heat island effect in cities on the basis of urban morphology theory is insufficient [52,53]. The development of cities demands ongoing iterative renewal, and while the introduction of new technologies and instruments in the renewal process is essential, consideration should also be given to the quantitative study of block shapes based on the area’s cultural fabric’s heritage [54,55,56,57].

5.2. Contributions

Therefore, this work has the following three contributions: The first is that, in the process of transforming urban development from incremental to stock development, university campuses, one of the most important functions in cities, are also exhibiting a trend toward stock development, and the space and buildings on campus are in dire need of renewal and modernization.
The second objective is to build a research workflow that clarifies how to apply cluster analysis methodologies to quantify university campus block patterns to facilitate the study of urban university campuses undergoing regeneration and renovation for various block kinds. Using the Wushan campus of the South China University of Technology as an example, this study uses characteristic data to describe the block form and control the indicators for the renewal and transformation of the block form by differentiating the unique characteristics from the main characteristics; it applies to other campus-level research and renewal and transformation projects as well.
Thirdly, this study addresses a research gap on the relationship between urban design and architectural design. Even though few scholars have concentrated on them thus far, university campuses in cities frequently play a role in the urban revitalization process. In previous research processes, architects were frequently responsible for the study of campus morphology. However, because urban university campuses are located within cities and develop in interaction with them, it is difficult to conduct a comprehensive study using only architectural design methods. This study, however, employed the methods of urban morphology to analyze and study campus block morphology, as well as to study campus block morphology from the perspective of urban development, thereby filling a gap in the academic and practical study of the interaction between urban design and architectural design.

5.3. Limitations

Future research could be improved in several ways. The first weakness of the study results from the limited length of this paper, which simply compiles and counts studies on the morphology of the campus block hierarchy. In order to achieve a guiding methodology for the regeneration and transformation of university campuses on the basis of historical and regional cultural assets, the practical application should be modeled after and applied to different levels of this research. The elements of each level are integrated, and the campus and city are interwoven to form a network of locations, so as to create a vibrant urban university environment. This will be fulfilled through future research.
The collection of information regarding the morphological parameters of campus blocks presents the second limitation of this study. Due to the temporal lag between the web data and the actual scenario, the web data have a lag in comparison to the actual block patterns. Consequently, there is a delay in the properties of the blocks. Nonetheless, the research presented in this article is a quantitative analysis of urban university campus morphology based on cluster analysis, which can be applied to the current project and renewal design process, and the source of the characteristic data of campus block morphology can be adapted to the current situation.
Thirdly, the K-means clustering algorithm requires the analyst to select the number of clusters of K values in advance during the actual classification process, and K values might have a significant impact on the clustering outcomes. This increases the difficulty of the analysis by requiring the analyst to calculate the output of multiple K values continually and repetitively and to experimentally select the best K value for the actual study.
Anomalous data can have an impact on the results of clustering, which is the fourth limitation. The center of clustering can depart from the region where a great amount of data are gathered when the data contains values that are far from the norm and particularly specific. However, anomalous data should not only be discarded in making analytical decisions. This odd data may also represent a specific campus block pattern, as demonstrated in Example 2 of this study. Therefore, caution should be exercised when analyzing anomalous information.

6. Conclusions

After the aforementioned quantitative analysis of campus block form and the design guidance process of renewal and renovation based on cluster analysis, this method and process are feasible and operable in the renewal and renovation design process of university campuses the preservation of the campus culture’s heritage. This strategy and procedure are applicable and practicable in the design of university campus rehabilitation and renewal. The urban morphology method of identifying hierarchical characteristics can effectively preserve the characteristics of university campus blocks; the cluster analysis method can classify various block forms, thereby simplifying the renewal and renovation design process and facilitating the application and promotion of the design method.
The quantitative method of cluster analysis and the evolutionary process of regeneration design described in this paper have resulted in the establishment of a guiding method for the regeneration of university campus blocks on the basis of the need for historical heritage, which can be used as a template for various university campus spatial forms or spatial forms with the need for historical heritage. In other words, on the basis of this method, architects and urban designers determine reasonable elemental characteristics according to the renewal and renovation demand hierarchy; collect corresponding characteristic data; and calculate, analyze, and develop campus-type renewal and renovation design guidelines that meet the actual demand.

Author Contributions

Conceptualization, Y.D. and X.L.; methodology, W.G. and X.L.; software, Y.D. and G.Y.; validation, X.L. and W.G.; formal analysis, X.L.; investigation, Y.D. and G.Y.; resources, Y.D.; data curation, Y.D.; writing—original draft preparation, W.G., X.L. and Y.D.; writing—review and editing, Y.D., X.L. and G.Y.; visualization, Y.D.; supervision, W.G.; funding acquisition, X.L. All authors have read and agreed to the published version of the manuscript.

Funding

This research is supported by the National Natural Science Foundation of China (grant no. 52108011); Science and Technology Program of Guangzhou, China (grant no. 202102020302); Guangzhou Philosophy and Social Science Planning 2022 Annual Project (grant no. 2022GZQN14); State Key Laboratory of Subtropical Building Science, South China University of Technology (grant no. 2021ZB16); the Fundamental Research Funds for the Central Universities (grant no. QNMS202211); Department of Education of Guangdong Province (grant no. 2021KTSCX004); Department of Housing and Urban–Rural Development of Guangdong Province (grant no. 2021-K2-305243); China Postdoctoral Science Foundation (grant no. 2021M701249).

Institutional Review Board Statement

Not applicable.

Informed Consent Statement

Not applicable.

Data Availability Statement

The data supporting the findings of this research are available within the article.

Acknowledgments

The authors thank the editors and the anonymous reviewers for their helpful recommendations for improving this article.

Conflicts of Interest

The authors declare no conflict of interest.

References

  1. Yue, L. Campus Renewal Strategy of Urban University Based on School-City Collaborative Innovation; Harbin Institute of Technology: Harbin, China, 2020. [Google Scholar]
  2. Jianfa, L. Research on Collaborative Innovation Space Design Strategy of Research University; South China University of Technology: Guangzhou, China, 2014. [Google Scholar]
  3. Zhong, C. A Study on the Design Strategy of Contemporary University Campus Space Renewal and Transformation from the Perspective of “Two Views and Three Natures”; South China University of Technology: Guangzhou, China, 2020. [Google Scholar]
  4. Slater, T.R. (Ed.) The Built form of Western Cities; University Press: Leicester, UK, 1990. [Google Scholar]
  5. Kai, G. The Theory and Method of Urban Form: Exploring a comprehensive and rational research framework. Urban Plan. Rev. 2001, 25, 36–41. [Google Scholar]
  6. Whitehand, J.W.R.; Morton, N.J. Fringe belts and the recycling of urban land: An academic concept and planning practice. Environ. Plan. B 2003, 30, 819–839. [Google Scholar] [CrossRef]
  7. Alexander, C.; Silverstein, M.; Angel, S.; Ishikawa, S.; Abrams, D. The Oregon Experiment; Intellectual Property Press: Beijing, China, 2019. [Google Scholar]
  8. Mehaffy, M.W. A New Pattern Language; Mijnbestseller Nederland: Rotterdam, The Netherlands, 2020; pp. 83–87. [Google Scholar]
  9. Salingaros, N.A. Planning, Complexity, and Welcoming Spaces: The Case of Campus Design. In Handbook on Planning and Complexity; Edward Elgar Publishing Ltd.: Cheltenham, UK, 2020. [Google Scholar]
  10. Larkham, P.J.; Jones, A.N. Glossary of the Urban Form; Geo Books: Norwich, England, 1991. [Google Scholar]
  11. Oliveira, V.; Medeiros, V. Morpho: Combining morphological measures. Environ. Plan. B Plan. Des. 2016, 43, 805–825. [Google Scholar] [CrossRef]
  12. Wenju, Q. From House Types to Urban Morphology-Reading Gianfranco Caniggia’s Ideas on Type Morphology; Southeast University: Dhaka, Bangladesh, 2017. [Google Scholar]
  13. Kropf, K. The Handbook of Urban Morphology; John Wiley & Sons: Hoboken, NJ, USA, 2017. [Google Scholar]
  14. Kropf, K. An Inquiry into the Definition of Built Form in Urban Morphology; University of Birmingham: Birmingham, UK, 1993. [Google Scholar]
  15. Samuels, I. ISUF task force on research and practice in urban morphology: Interim report. Urban Morphol. 2013, 17, 40–43. [Google Scholar]
  16. Stanilov, K.; Scheer, B.C. Suburban Form: An International Perspective; Routledge: London, UK, 2004. [Google Scholar]
  17. Bentley, I. Responsive Environments: A Manual for Designers; Routledge: Oxford, UK, 1985. [Google Scholar]
  18. Buchanan, P. What city? A plea for place in the public realm. Archit. Rev. 1988, 184, 31–41. [Google Scholar]
  19. Marshall, S.; Çalişkan, O. A joint framework for urban morphology and design. Built Environ. 2011, 37, 409–426. [Google Scholar] [CrossRef]
  20. Barke, M. Some thoughts on the first output of the ISUF Task Force on Research and Practice in Urban Morphology. Urban Morphol. 2013, 17, 134–135. [Google Scholar]
  21. Ye, Y.; Zhuang, Y. The rising of quantitative analysis tools in urban morphology. Urban Des. 2016, 04, 56–65. [Google Scholar]
  22. Hillier, B.; Hanson, J. The Social Logic of Space; Cambridge University Press: Cambridge, UK, 1984. [Google Scholar]
  23. Hillier, B. Space is the Machine: A Configurational Theory of Architecture; Cambridge University Press: Cambridge, UK, 1996. [Google Scholar]
  24. Lebendiger, Y.; Lerman, Y. Applying space syntax for surface rapid transit planning. Transp. Res. A Policy Pract. 2019, 128, 59–72. [Google Scholar] [CrossRef]
  25. Suchon, F.; Olesiak, J. Historical Analysis of the Example of Nowy Sącz in Space Syntax Perspective. Guidelines for Future Development of Urban Matrix in Medium-Sized Cities. Sustainability 2021, 13, 11071. [Google Scholar] [CrossRef]
  26. Sevtsuk, A.; Mekonnen, M. Urban network analysis toolbox. Int. J. Geomat. Spat. Anal. 2012, 22, 287–305. [Google Scholar]
  27. Salat, S. Cities and Forms; China Construction Industry Press: Beijing, China, 2012. [Google Scholar]
  28. Oliveira, V. Morpho: A methodology for assessing urban form. Urban Morphol. 2013, 17, 21–33. [Google Scholar] [CrossRef]
  29. Ye, Y.; Van Nes, A. Quantitative tools in urban morphology: Combining space syntax, space matrix, and mixed-use index in a GIS framework. Urban Morphol. 2014, 18, 9. [Google Scholar] [CrossRef]
  30. Ye, Y.; Yeh, A.; Zhuang, Y.; van Nes, A.; Liu, J. “Form Syntax” as a contribution to geodesign: A morphological tool for urbanity-making in urban design. Urban Des. Int. 2017, 22, 73–90. [Google Scholar] [CrossRef]
  31. Lin, B.Y. The measurement of urban spatial form and its evaluation. Urban Plan. Forum 1998, 3, 42–45. [Google Scholar]
  32. Gil, J.; Beirão, J.N.; Montenegro, N.; Duarte, J.P. On the discovery of urban typologies: Data mining the many dimensions of the urban form. Urban Morphol. 2012, 16, 27. [Google Scholar] [CrossRef]
  33. Qian, W.; Cheng, W.; Zhen, F.; Jin, Y. K means clustering algorithm study review. J. Electron. Des. Eng. 2012, 20, 21–24. [Google Scholar] [CrossRef]
  34. Chiaradia, A.J.; Crispin, C.; Webster, C. sDNA: A Software for Spatial Design Network Analysis [EB/OL]. 2018. Available online: https://www.cardiff.ac.uk/sdna/ (accessed on 12 September 2022).
  35. Chiaradia, A.; Zhang, L.; Khakhar, S. Future Harbourfront Masterplan West HKSAR, 3D Indoor and Outdoor Pedestrian Network, Pedestrian Flow Potential Processed with 3D Sdna; Faculty of Architecture, The University of Hong Kong: Hong Kong, China, 2019. [Google Scholar]
  36. Xue, W. Data Analysis Based on SPSS; China Renmin University Press: Beijing, China, 2014. [Google Scholar]
  37. Cullen, G. The Concise Townscape; The Architectural Press: Oxford, UK, 1961. [Google Scholar]
  38. Cai, N. Research On-Campus Environment and Architectural Design Based on the Topographic Features of the Wushan Campus of South China University of Technology; South China University of Technology: Guangzhou, China, 2016. [Google Scholar]
  39. Song, Y.; Peng, K. Application Guide of Urban Spatial Analysis GIS; China Architecture and Building Press: Beijing, China, 2015. [Google Scholar]
  40. Liu, X. Study on Holistic Design Strategy of Green University Campus in Hot and Humid Area; South China University of Technology: Guangzhou, China, 2017. [Google Scholar]
  41. Batty, M. Cities in Disequilibrium; Springer: Cham, Switzerland, 2017; pp. 81–96. [Google Scholar]
  42. Wang, X.D.; Liu, X. A new strategy for spatial restoration in universities under the concept of “urban renewal”. City Build. 2021, 18, 89–91. [Google Scholar] [CrossRef]
  43. Guo, W. Systematic Theory of Architectural Creation; South China University of Technology Press: Guangzhou, China, 2016. [Google Scholar]
  44. Li, H.; Ye, B.; Fan, N.; Wang, X.; Cui, K.; Wang, J.; Li, X.; Ju, D.; Ding, W.; Chen, W. Old city of nanjing, a small west lake district protection and regeneration practice discussion. Archit. J. 2022, 1, 60–69. [Google Scholar] [CrossRef]
  45. Liu, W. The four principles of urban design in the old city reconstruction. J. World Archit. 2001, 06, 30–33. [Google Scholar] [CrossRef]
  46. Yang, J.J.; Guo, L.X. Study on urban redevelopment planning along the canal in Hangzhou. City Plan. Rev. 2001, 25, 77–80. [Google Scholar]
  47. Li, C.B.; Zhu, Q. Research on the Width of Canal Heritage Corridor Based on Heritage Distribution-Taking Tianjin canal as an example. Urban Probl. 2007, 146, 12–15. [Google Scholar]
  48. Zhao, Y. A Quantitative Analysis of Urban Morphological Types from a Morphogenetic Perspective; Southeast University: Nanjing, China, 2019. [Google Scholar]
  49. Chatzipoulka, C.; Nikolopoulou, M. Urban geometry, svf and insolation of open spaces: London and paris. Build. Res. Inf. 2018, 46, 881–898. [Google Scholar] [CrossRef]
  50. Kolokotroni, M.; Giannitsaris, I.; Watkins, R. The effect of the London urban heat island on building summer cooling demand and night ventilation strategies. Sol. Energy 2006, 80, 383–392. [Google Scholar] [CrossRef]
  51. Rode, P.; Keim, C.; Robazza, G.; Viejo, P.; Schofield, J. Cities and Energy: Urban Morphology and Residential Heat-Energy Demand. Environ. Plan. B Plan. Des. 2014, 41, 138–162. [Google Scholar] [CrossRef]
  52. Chen, H.; Ooka, R.; Huang, H.; Tsuchiya, T. Study on Mitigation Measures for Outdoor Thermal Environment on Present Urban Blocks in Tokyo Using Coupled Simulation. Build. Environ. 2009, 44, 2290–2299. [Google Scholar]
  53. Yang, J.; Wang, Z.H.; Kaloush, K.E.; Dylla, H. Effect of Pavement Thermal Properties on Mitigating Urban Heat Islands: A Multi-scale Modeling Case Study in Phoenix. Build. Environ. 2016, 108, 110–121. [Google Scholar]
  54. Huang, Y. Study on Post-Use Evaluation and Design Elements of Campus Planning in Guangzhou; South China University of Technology: Guangzhou, China, 2014. [Google Scholar]
  55. Chen, W.; She, J. Quantitative Analysis on spatial form of Jiefang North Road Historical District in Tianjin—A case study of Jiefang North Road area in Tianjin. Archit. Eng. Technol. Des. 2016, 19, 3206. [Google Scholar] [CrossRef]
  56. Li, B.; Guo, W.; Liu, X.; Zhang, Y.; Caneparo, L. The Third Solar Decathlon China Buildings for Achieving Carbon Neutrality. Buildings 2022, 12, 1094. [Google Scholar] [CrossRef]
  57. Cheng, Y.; Liu, X.; Zeng, Z.; Liu, S.; Wang, Z.; Tang, X.; He, B.-J. Impacts of Water Bodies on Microclimates and Outdoor Thermal Comfort: Implications for Sustainable Rural Revitalization. Front. Environ. Sci. 2022, 10, 940482. [Google Scholar] [CrossRef]
Figure 1. Klopf’s generic structure (refer to The Handbook of Urban Morphology [13] for redrawing).
Buildings 12 01508 g001
Figure 2. Research framework and process.
Buildings 12 01508 g002
Figure 3. Texture changes in the Wushan Campus of SCUT and the urban spatial relationship in Guangzhou.
Buildings 12 01508 g003
Figure 4. Zoning map of Wushan Campus of SCUT.
Buildings 12 01508 g004
Figure 5. Numbered blocks.
Buildings 12 01508 g005
Figure 6. Calculation of long and short edges and minimum boundary geometry for a block area.
Buildings 12 01508 g006
Figure 7. Representation of the geometric elements of the block plan of the Wushan Campus of SCUT.
Buildings 12 01508 g007
Figure 8. Scree plot.
Buildings 12 01508 g008
Figure 9. K-means clustering results.
Buildings 12 01508 g009
Figure 10. Examples of the five campus block types.
Buildings 12 01508 g010
Figure 11. Quantitative identification class of major characteristics for category 4.
Buildings 12 01508 g011
Figure 12. Identification of features quantified (cluster) and overall level (dashes) of the five categories.
Buildings 12 01508 g012
Figure 13. The evolution of the indicators.
Buildings 12 01508 g013
Table 1. Campus block elements.
Morphological ElementsNumberMorphological Element
Characteristics
Unit
Campus block element1Long edgem
2Short edgem
3Rectangular perimeterm
4Rectangular aream2
5Number of buildingsQuantity
6Direction°
7Elongationm/m
8Area perimeter ratiom2/m
9Number of storiesQuantity
10Gross floor aream2
11Building footprintm2
12Volume ratiom2/m2
13Floor area ratiom2/m2
14Number of buildings ratioQuantity/m2
Table 2. KMO and Bartlett’s test.
KMO and Bartlett’s Test
Kaiser–Meyer–Olkin measure of sampling adequacy0.715
Bartlett’s test of sphericityApproximate chi-square2654.882
df91
Sig.0.000
Table 3. Rotated component matrix.
ParametersComponents
Factor 1Factor 2Factor 3Factor 4
Z-score (long edge)0.800−0.2620.459−0.021
Z-score (short edge)0.881−0.200−0.336−0.061
Z-score (rectangular perimeter)0.925−0.2360.171−0.048
Z-score (rectangular area)0.957−0.170−0.070−0.018
Z-score (number of buildings)0.6210.275−0.0790.580
Z-score (direction)−0.0660.267−0.077−0.632
Z-score (elongation)−0.172−0.0400.9630.045
Z-score (area perimeter ratio)0.925−0.148−0.244−0.065
Z-score (number of stories)−0.0830.773−0.142−0.051
Z-score (gross floor area)0.7390.561−0.0990.076
Z-score (building footprint)0.8040.386−0.0970.174
Z-score (volume ratio)−0.1390.9350.031−0.039
Z-score (floor area ratio)−0.0350.8320.0450.153
Z-score (number of buildings ratio)−0.2430.380−0.0150.758
Table 4. Total variance explained (extraction method: principal component analysis).
ComponentInitial EigenvaluesRotation Sums of Squared Loadings
Total% of VarianceCumulative %Total% of VarianceCumulative %
15.82541.60941.6095.82541.60941.609
23.27523.39365.0023.27523.39365.002
31.42510.18175.1841.42510.18175.184
41.1438.16383.3461.1438.16383.346
50.8726.22989.575
60.6644.74194.315
70.3362.39796.712
80.1280.91397.625
90.1080.77298.398
100.0970.69699.093
110.0630.44999.543
120.0300.21399.756
130.0220.15699.912
140.0120.088100.000
Table 5. Examples of the five categories and their characteristic data.
No.Morphological Element CharacteristicsExample 1Example 2Example 3Example 4Example 5
Block No. 101Block No. 24Block No. 3Block No. 46Block No. 26
1Long edge353 447 119 126 201
2Short edge195 44 58 70 138
3Rectangular perimeter1017 1021 360 371 631
4Rectangular area50,645 13,746 6901 8216 19,448
5Number of buildings18 0 4 2 6
6Direction29 51 75 174 180
7Elongation2 10 2 2 1
8Area perimeter ration50 13 19 22 31
9Number of stories14 0 8 9 6
10Gross floor area74,298 0 17,060 24,953 12,412
11Building footprint5184 0 2133 2807 1916
12Volume ratio1.47 0 2.47 3.04 0.64
13Floor area ratio0.10 0 0.31 0.34 0.10
14Number of buildings ratio3.55 0 5.79 2.43 3.09
Table 6. SCUT Wushan campus block form renewal control indicators.
Characteristic LevelStandard ValuesRange of Control
Unique characteristicsVolume ratio3.362.69–4.04
Floor area ratio0.240.19–0.43
Main characteristicsRectangular area10,398.847279.19–13,518.49
Number of buildings1.99 1.39–3.38
Number of stories14.209.94–18.47
Gross floor area31,853.4622,297.42–54,150.88
Number of buildings ratio2.231.56–2.91
Publisher’s Note: MDPI stays neutral with regard to jurisdictional claims in published maps and institutional affiliations.

