Abstract
Progressive collapse is the failure of the whole structure caused by local damage, which leads to significant economic and human losses. Therefore, structures should be designed to sustain local failures and resist subsequent nonproportional damage. This paper compared four procedures for a progressive collapse analysis of two RC structures subjected to a corner column loss scenario. The study is mainly based on the methods outlined in the current Russian standard (linear static (LS) pulldown, nonlinear static (ND) pulldown, and nonlinear dynamic), but also includes LS and NS pushdown procedures suggested by the American guidelines and linear dynamic procedure. We developed detailed finite element models for ANSYS Mechanical and ANSYS/LS-DYNA simulations, explicitly including concrete and reinforcement elements. We applied the Continuous Surface Cap Model (MAT_CSCM) to account for the physical nonlinearity of concrete. We also validated results obtained following these procedures against known experimental data. Simulations using linear static pulldown and linear dynamic procedures lead to 50–70% lower results than the experimental because they do not account for the nonlinear behavior of concrete and reinforcement. Displacements obtained from the NS pulldown method exceed the test data by 10–400%. It is found that correct results for both RC structures can only be found using a nonlinear dynamic procedure, and the mismatch with the test data do not exceed 7%. Compared to static pulldown methods, LS and NS pushdown methods are more accurate and differ from the experiment by 28% and 14%, respectively. This relative accuracy is provided by more correct load multipliers depending on the structure type.
1. Introduction
In recent decades, there have been a series of building collapses due to local damaging events that were not proportional to the subsequent failures. Although the number of such progressive collapses in history is relatively small, the catastrophic consequences in terms of fatalities and other losses make protecting against progressive collapse mandatory in the structural engineering environment.
The problem of progressive collapse first began to be widely discussed after a domestic gas explosion in the 23-story Ronan Point Apartment building in 1968. Due to the very limited ability of the structural system to redistribute loads, a local failure of one panel caused the progressive collapse of upper floors (19 through 23). Subsequently, the falling debris invoked the progressive collapse of lower floors down to the ground floor. The most infamous examples include the collapse of the L’Ambiance Plaza apartment building due to construction errors in 1987, the partial collapse of the Alfred Murray Building due to explosive detonation in 1995, the complete collapse of the World Trade Center towers due to aircraft impact and fuel combustion in 2001, and some others [1,2,3,4,5,6,7,8,9].
The tragedy data revealed the lack of a study of progressive collapse, which, in turn, intensified experimental research interests in this phenomenon. Current experiments generally focus on evaluating the capability of a structural system to bridge over a damaged area without a progressive collapse developing and formulating requirements for resistant structures. Due to the complexity of testing real-scale buildings, most experiments are conducted for scaled substructures or individual elements. Qian et al. [10,11] tested the scaled reinforced concrete (RC) beam–column sub-assemblages under a penultimate column removal scenario to investigate failure modes and the load redistribution capacity. Russel [12,13] conducted a series of static and dynamic tests of scaled RC flat slabs under various failure scenarios and examined the flexure and punching failure mechanisms. Peng et al. [14,15] tested the scaled RC flat slab sub-assemblages subjected to an exterior and interior column removal and analyzed the punching failure and post-punching capacity of column-slab connections. Only a few studies contain test results for complete real-scale structures. Xiao et al. [16] performed a sequential removal of four columns of a three-story RC frame to investigate the dynamic response and load transfer mechanisms. Adam et al. [17] carried out a test of a two-story RC building subjected to a corner column scenario and analyzed the dynamic performance of the structure and alternative load paths. Among other original studies, static [18,19,20,21,22,23,24] and dynamic [25,26,27] tests are also noteworthy.
Numerical simulations are also a powerful and effective way to predict the possible impact of local failures on the strength and reliability of buildings. Nonlinear dynamic analysis is often used for this purpose, considering the dynamic nature of progressive collapse events and the resulting damage of structures. In [28], Qian et al. simulated the dynamic response of RC flat slab sub-assemblages under a two-column loss scenario and examined failure modes and force redistributions. Lui et al. [29,30] performed dynamic and static analyses of a multistory reinforced concrete flat-plate building under exterior and interior column removal scenarios. It has been found that the strain rate effects and compressive membrane action can significantly increase the punching resistance of a flat plate. Along with this, the use of the nonlinear static procedure estimates well the peak dynamic displacement, although overestimates slab local rotation by more than 20%. Keyvani et al. [31] proposed the FE modeling technique to simulate punching and post-punching behavior of flat plates and validated it against test data. It has been shown that the compressive membrane forces occurring in actual flat-plate floor systems improve the slab resistance against progressive failure, and its ignoring underestimates the punching strength. Kwasniewski [32] conducted a numerical study of the progressive collapse of an existing eight-story building and analyzed the damage resulting from various failure scenarios. Pham et al. [33] studied the effect of blast pressure on structural resistance against progressive collapse under a column removal scenario induced by contact detonation and investigated the development of catenary action within an ultra-fast dynamic regime. Parisi et al. [34] defined five performance limit states associated with increasing levels of damage and the corresponding load capacity for a progressive collapse design using a nonlinear dynamic analysis. Brunesi et al. [35,36] applied a Monte Carlo simulation to generate 2D and 3D models of low-rise RC frames. The frames were analyzed with pushdown and incremental nonlinear dynamic methods. In [37,38,39], the authors compared linear and nonlinear, static and dynamic numerical procedures for a progressive collapse analysis. These procedures are outlined in the standards for determining the stress state and deformations after local failure and designing buildings resistant to progressive collapse [40,41,42]. These articles demonstrate that numerical simulations following different procedures leading to different results and, therefore, require additional examination.
Current design standards describe the analysis of reinforced concrete structures using different numerical procedures, including static and dynamic methods with and without taking into account the physical nonlinearity in numerical models. In particular, the Russian design standard [40] suggests the use of linear static, nonlinear static, and nonlinear dynamic procedures. This standard gives no restrictions on the use of any method, so it is important for civil engineers to evaluate their accuracy and predictive ability. Since the reviewed articles lack a complete comparison of numerical results following, simultaneously, for these methods and experimental data for individual elements or real-scale buildings, this paper aims to validate different numerical procedures for the analysis of RC structures. For a complete analysis, we also consider the linear dynamic procedure. Thus, the paper discusses four numerical methods common in engineering practice to simulate RC structures under local failures: linear-elastic quasistatic pulldown, nonlinear quasistatic pulldown, linear-elastic dynamic, and nonlinear dynamic procedures. The research objects are a flat RC slab and a two-story RC frame subjected to the removal of the corner support tested by Russel [13] and Adam et al. [17]. The goal of the research is to assess the accuracy and robustness of each of the procedures provided by the Russian standard based on a comparison with known test data.
A progressive collapse is characterized by great a uncertainty of the initiating event. Such actions can be both dynamic (earthquake, internal gas explosion, external blast, vehicle impact, buckling, extreme fire action, demolition [33,43,44,45,46,47]) and quasi-static (soil changes due to changes in the groundwater level, karst processes, etc. [48]). Since the initial local failure duration is almost impossible to determine reliably, it is often assumed equal to zero. In this paper, it is also assumed that local failure occurs instantaneously.
It is known that the initial geometrical imperfections mainly reduce the rigidity and strength of compressive members and can affect failure modes and alternative load paths [49,50]. However, the presence of imperfections is not described in the reference experiments, so their effects are not considered in the numerical models.
2. Materials and Methods
2.1. Description of Reference Experiments
2.1.1. Corner Support Loss Scenario for Reinforced Concrete Flat Slab
Russell conducted the first chosen reference experiment, and the results were published in [13]. A flat slab with in-plane dimensions 2.1 × 4.1 m and 80 mm thickness was supported by six steel supports with 135 × 135 × 20 mm dimensions. The slab was composed of concrete with a cube strength of 30 MPa and included two steel meshes with 6 mm bars at 200 mm spacing for both top and bottom reinforcement. Additional 6 mm bars were added over internal supports to meet requirements for the hogging moment. The slab was additionally loaded with sandbags with a total mass of approximately 0.93 tons. After removing the corner support, the time history of vertical displacements at the point above removed support was recorded (see Figure 1).
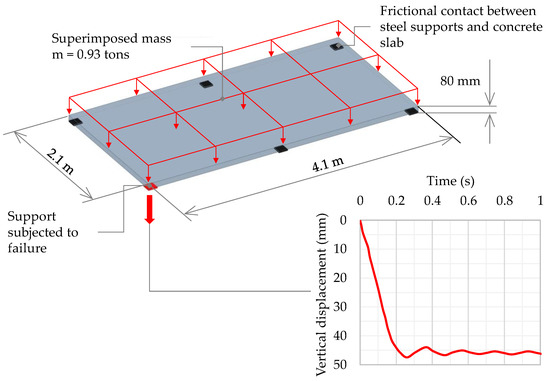
Figure 1.
Details of the reinforced concrete flat slab experiment.
As a result, a significant number of cracks were formed on both the top and bottom surfaces of the slab (see Figure 2). However, the large amount of flexural damage did not lead to the complete failure of the slab. The peak vertical displacement was 47.4 mm, and the residual vertical displacement was 46.0 mm.
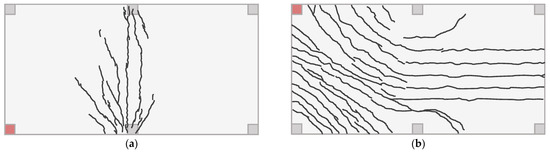
Figure 2.
Cracking patterns on the top (a) and bottom (b) surfaces of the flat slab after corner support loss.
2.1.2. Corner Column Loss Scenario for Two-Story Reinforced Concrete Flat Slab Frame
The second reference experiment was the sudden removal of a corner column of an RC two-story frame with loads, geometry, and mechanical properties reflecting design conditions [17]. The bays above the removal column were loaded with concrete blocks imitating dead and live loads and the weight of outside walls. The cylinder compressive strength of concrete was about 30 MPa, the yield strength for whole reinforcement was 500 MPa. During the experiment, the vertical displacements near the failed column P3 were recorded by four LDVT sensors named P2_11V, P23_1/3V, P23_2/3V, and P3_11V. Time history graphs of vertical displacements are in Figure 3a, and details of geometry and positions of the LDVTs are shown in Figure 3b.
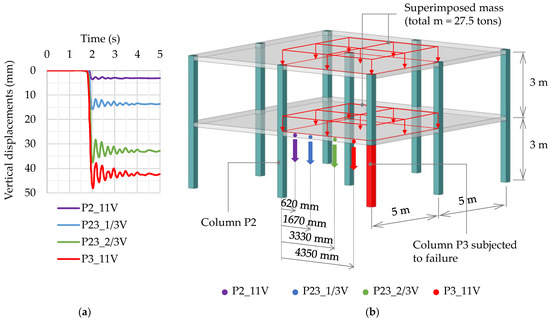
Figure 3.
Time history of vertical displacements (a) and geometry of the two-story reinforced concrete frame (b).
2.2. Methodology for Simulation of Progressive Collapse
2.2.1. Governing Equations
In this paper, we used the finite element method (FEM) to obtain the response of the RC structures after a failure of one of the load-bearing elements. In general, we solved the following system of equations by FEM:
where [M], [C], [K] are the mass matrix, dissipation matrix, and stiffness matrix, respectively;
[M]{ẍ} + [C]{ẋ} + [K]{x} = {P},
{P} is the external load;
{ẍ}, {ẋ}, {x} are the nodal accelerations, nodal velocities, and nodal displacements, respectively.
To define a static solution, we converted the system (1) to the next one:
where a gravity load is included in the vector {P}.
[K]{x} = {P},
According to Rayleigh approach, the dissipation matrix [C] is defined as a linear combination of mass and stiffness matrices:
where α and β are the constants of proportionality, which are defined as follows:
where ωi and ωn are the lower and upper limits of the damped frequency range; ζi and ζn are the damping ratios at the lower and upper damped frequencies, respectively.
[C] = α[M] + β[K],
We took the first natural frequency of the damaged structure as the lower boundary and the value of 150 Hz as the upper boundary [51]. The damping ratios ζi and ζn at the lower and upper damped frequencies were the same and were equal to 4% for concrete and 2% for steel, respectively.
2.2.2. Finite Element Mesh
It is known that modeling the softening behavior of plain concrete can be mesh-dependent. This phenomenon means that different FE models can produce different computational results, which is often associated with the greatest damage accumulation in the smallest elements. However, mesh dependence is not discussed in this article, because the applied concrete model effectively overcomes the undesirable feature through the fracture energy regulation technique [52,53]. Moreover, the influence of mesh size is much less for reinforced concrete than for plain concrete. So the FE mesh sizes were chosen in such a way, on the one hand, to describe the damage of reinforced concrete in detail and, on the other hand, to reasonably reduce the time costs.
Three-dimensional FE models consisted of 8-nodes solid elements for the concrete part and 2-node beam elements for reinforcement parts. The FE model of the flat slab included 13,830 solids, 3504 beams, and 24,631 nodes. In-plane dimensions of solid FEs were equal to 50 mm; in the thickness direction, size was equal to 20 mm; the length of the beam elements was 50 mm. The complete FE model of the two-story RC frame consisted of 47,053 solids and 77,218 beams with an average element dimension equal to 100 mm.
An embedded reinforcement approach provided a perfect bond between reinforcement elements and surrounding concrete material [54,55]. This approach was realized using the * CONSTRAINED_BEAM_IN_SOLID keyword in LS-DYNA and REINF264 elements in ANSYS MAPDL [56,57]. The bottom faces of the frame columns and slab supports were fixed from any displacements. Details of FE meshes were presented Figure 4.
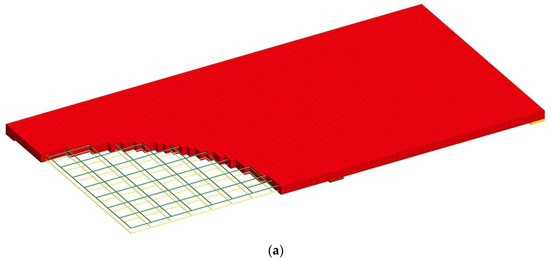
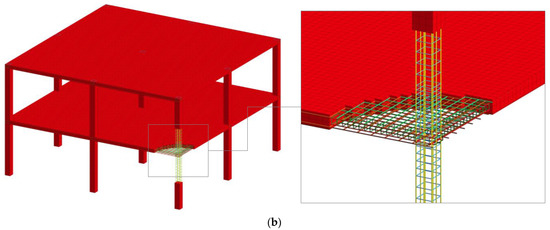
Figure 4.
Finite element mesh of flat slab (a) and two-story frame (b).
2.2.3. Material Models
In linear analyses described below, we used linear elastic material models without strain rate dependency, governed by classical Hooke’s law [58,59].
In fact, a reinforced concrete demonstrates a highly nonlinear response under extreme actions due to concrete cracking and rebar yielding. So, an appropriate nonlinear stress–strain relationship of concrete and steel is essential in considering deformations and damage [60,61,62,63].
In nonlinear simulations, the stress–strain relationship of concrete was described with the Continuous Surface Cap Model (* MAT_CSCM) developed by Murray and implemented in LS-DYNA code [52,53]. This elastoplastic damage model with strain rate dependency has been widely used to simulate the dynamic response of concrete structures [64,65,66]. Calibration of the nonlinear concrete model was conducted based on the original paper [52] and article [67].
Nonlinear behavior of steel rebars was described with the * MAT_PIECEWISE_LINEAR_PLASTICITY model, which relies on von Mises yield criterion and accounts for Cowper–Symonds strain rate dependency [56]:
where and are the dynamic and static yield stresses; is the strain rate; C = 40 s−1 and p = 5 are the strain rate parameters [68].
2.3. Numerical Procedures for Progressive Collapse Analysis
Linear static procedure (LSP) was based on the pulldown method [69]. Two static models were considered. The first model was the undamaged structure used to calculate the internal forces in the removal structural element. The second model lacked this “failed” element, and it was replaced with internal forces obtained from the first calculation and applied with the opposite signs (see Figure 5). This loading meant the application of load increased the factor equal to two and was recommended by Russian design code [40], although it was not consistent with the results of numerous studies [36,70,71,72,73,74] and other standards [41,42]. The stress–strain state was calculated according to Equation (2) using ANSYS MAPDL solver [57].
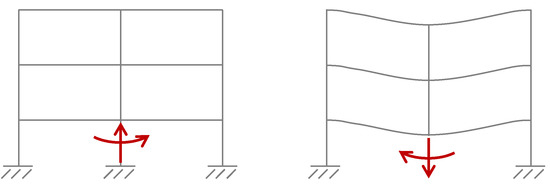
Figure 5.
Stages of pulldown method.
Nonlinear static procedure (NSP) was also based on the pulldown method, but nonlinear material models described above were used. Due to difficulties with the solution convergence, this procedure was performed with LS-DYNA explicit solver. Gravity load was applied slowly to exclude the influence of inertial forces. Strain rate dependency in material stress–strain relationships was inactive.
Linear dynamic procedure (LDP) consisted of two stages. In the first stage, the gravity load was applied to the undamaged model, and the equilibrium state was defined. In the second stage, a failed support or a column was instantaneously removed, and the dynamic response was calculated using Newmark implicit time integration algorithm implemented in ANSYS MAPDL [75,76,77].
Nonlinear dynamic procedure (NDP) was similar to the linear dynamic, except that FE models considered nonlinear stress–strain relationships and strain rate dependency. Calculations were performed with LS-DYNA code, which uses the explicit central difference time integration algorithm. This procedure was recommended in the latest American and Russian design standards as the most general-purpose [40,41,42].
3. Results
3.1. Corner Support Loss Scenario for Reinforced Concrete Flat Slab
As a result of nonlinear dynamic and nonlinear static analyses, the damage of the slab was determined. In both simulations, only flexural damage without failure due to punching shear was predicted, consistent with the test data. Figure 6 shows that the damage from the dynamic analysis corresponded better to the cracking pattern obtained from the experiment. The nonlinear static analysis revealed much more significant damage of the slab. The significant damage may be since, under static loading of the slab, the increase in tensile strength of the concrete under dynamic conditions was ignored. It may also indicate that the support force applied with the opposite sign was too conservative to consider dynamic effects.
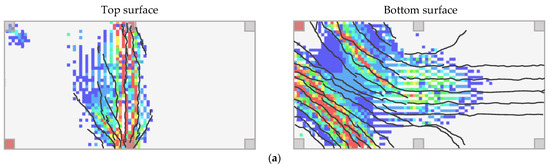
Figure 6.
Comparison of damage accumulated in the flat slab from nonlinear dynamic (a) and nonlinear static (b) analyses with the crack patterns from the experiment.
Moreover, in the nonlinear static analysis, a different mechanism of damage development was observed than in the nonlinear dynamic analysis. In the dynamics, the main crack region (yield line) on the top surface was located between the central supports, while in the static analysis, it was between the central and the corner supports.
Figure 7 shows the vertical displacements obtained from different analysis procedures and the experiment. The reduction in stiffness caused by the flexural damage led to much higher deflections. Thus, the peak and residual vertical displacements obtained from nonlinear analyses corresponded well enough to the test data, although the displacements from the nonlinear static analysis were relatively overestimated. The results from the linear calculations differed from the experiment by 70 to 80%. More details are provided in Table 1.
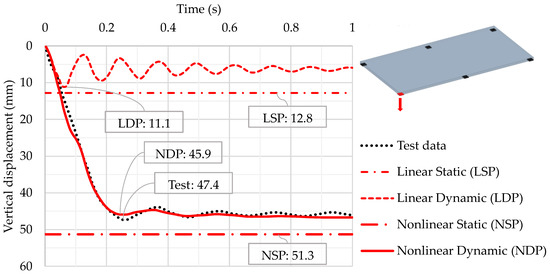
Figure 7.
Comparison of vertical displacements obtained from numerical simulations and experiment.

Table 1.
Comparison of maximum and residual vertical displacements with test data.
3.2. Corner Column Loss Scenario for a Two-Story Reinforced Concrete Frame
We first considered the results obtained using the nonlinear static procedure. By increasing the load from 0 to 0.6·Pmax, the vertical displacements at all points increased linearly (see Figure 8a). At this load, flexural damage occurred on the top faces of the floor slabs (Figure 9a).
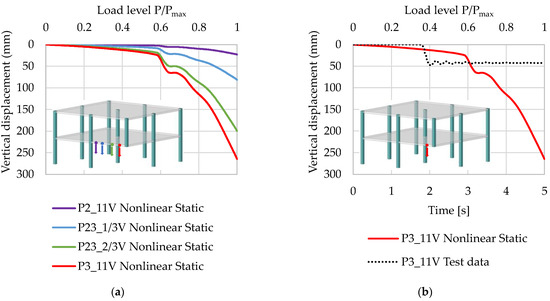
Figure 8.
Vertical displacements obtained from nonlinear static analysis (a) and its comparison with test data (b).
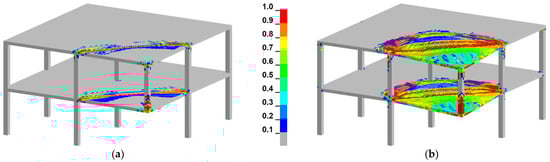
Figure 9.
Damage of the two-story RC frame from nonlinear static analysis at different load levels: (a)—0.6·Pmax; (b)—1.0·Pmax.
We observed significant flexural damage and a reduction in stiffness for slabs with a further load increase and, consequently, the dramatic growth of vertical displacements up to 264.5 mm at point P3_11V. When the frame was loaded with Pmax, the slabs on the first and second floors above the failed column were completely damaged, which was not confirmed by the test data (see Figure 9b). The comparison of calculated vertical displacements with the experiment in Figure 8b shows that the nonlinear static analysis could not reliably describe the response of the RC frame under the corner column loss scenario.
In contrast, an analysis following the nonlinear dynamic procedure would make it possible to determine the response of the RC frame more correctly. At the equilibrium state before the column removal, the damage of concrete was insignificant and concentrated in the column–slab connections (see Figure 10a). The maximum vertical displacements were equal to 3.3 mm and were located in the central area of slabs subjected to superimposed loads (see Figure 10b). Thus, the behavior of the RC structure before the collapse was almost elastic. After the instantaneous collapse of column P3, the slabs above experienced significant flexural damage, which was sufficiently concentrated and did not spread over the entire slab surface. (see Figure 11a). The vertical displacements were increased to 50 mm (see Figure 11b).
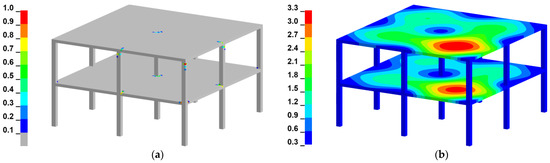
Figure 10.
The state of equilibrium before corner column removal: (a)—damage; (b)—vertical displacements, mm.
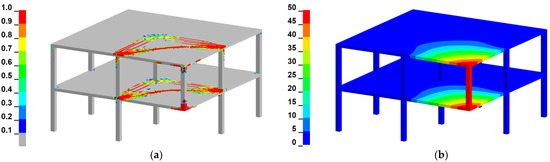
Figure 11.
The state of maximum displacements after corner column removal: (a)—damage; (b)—vertical displacements, mm.
Similar to the previous problem, calculations according to linear static and dynamic procedures could not predict the actual displacements of the structure—the mismatch for different points was in the range of 50–70%. A detailed comparison of vertical displacements for points P2_11V, P23_1/3V, P23_2/3V, and P3_11V is presented in Table 2 and Figure 12.
Table 2.
Vertical displacements obtained from numerical simulations for point P3_11V.
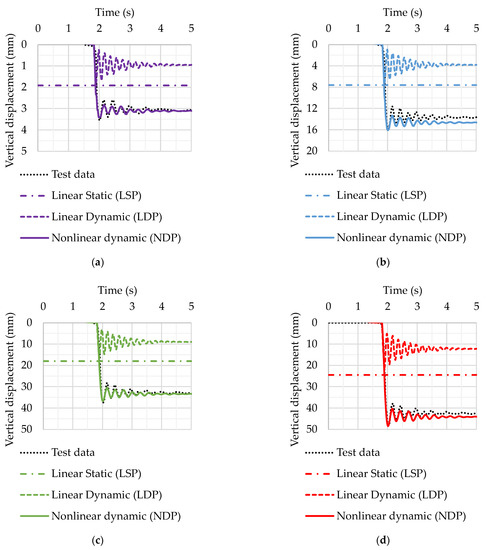
Figure 12.
Comparison of vertical displacements obtained from numerical simulations with test data for different points: (a)—P2_11V; (b)—P23_1/3V; (c)—P23_2/3V; (d)—P3_11V.
4. Discussion
This study developed three-dimensional FE models of an RC flat slab and two-story RC frame for the corner support failure scenario. We compared the vertical displacements known from experiments [12,17] and using numerical procedures recommended by the Russian design code [40] (linear static, nonlinear static, and nonlinear dynamic) and linear dynamic procedure, also quite popular in engineering practice.
A comparison of the results following the nonlinear static procedure (NSP) showed that loading by the internal force of the removed element with the opposite sign led to an overestimation of displacements. In the first problem, the displacements were higher than the experimental ones by only 10%, which resulted in engineering accuracy. Moreover, the nonlinear static analysis demonstrated that the slab was resistant to a progressive collapse, which was also consistent with the experiment. However, because the nonlinear static calculation did not consider the real inertial forces and the increase in the dynamic tensile strength for concrete, the nature of the damage on the top face of the slab was somewhat inconsistent with the experiment. In the experiment, the main crack region (yield line) was located between the central supports, while, in the nonlinear static analysis, it was between the central and the corner supports.
In contrast, the mismatch with the test data in the second problem was over 400%. The displacement values obtained from nonlinear static analysis led to a conclusion about the progressive collapse of the RC frame, which did not correspond to the test data. Thus, the proposed Russian standard nonlinear static analysis of different structures with the same dynamic increase factor equal to 2.0 was incorrect and too conservative. Using the improved dynamic increase factor for a nonlinear static analysis, depending on the structure parameters, would achieve more reliable results and an economical design.
The linear static procedure (LSP) did not consider nonlinear behavior and led to underestimated results. The mismatch with the test data was about 70% in the first problem and 50% in the second one. It was clear that in this procedure, the load increase factor must take into account both the effects of the forces of inertia and nonlinear effects.
The peak vertical displacements obtained following linear static and linear dynamic procedures were relatively close in both problems. We can conclude that the DIF = 2 used in the linear static procedure was reasonable, but only when there were no effects due to physical nonlinearity. However, considered RC structures presented strongly nonlinear behavior when one of the load-bearing elements failed. A comparison of dynamic solutions showed that consideration of physical nonlinearity was necessary.
Thus, the Russian standard suggests to apply the same load multiplier of 2.0 both for the linear static and nonlinear static analysis. This coefficient is not appropriate for cases where nonlinear response is expected. Since, for reinforced concrete structures, the response in the nonlinear range was typical due to the low tensile strength of concrete, the use of a load multiplier equal to 2.0 was very limited.
Correct results in both problems were obtained using only the nonlinear dynamic procedure. The mismatch with the test data in the first problem was in the range of 1.5–3.2%, and in the second problem did not exceed 7%. Damage fields from the nonlinear dynamic simulations also corresponded to the cracking patterns from experiments and could also be used to analyze the resistance to a progressive collapse.
Current American guidelines [41,42] allow to determine the load multipliers more accurately depending on the type of analysis and structural parameters of building. We calculated it for two-story RC frame to analyze the structure following these guidelines and compared results with the Russian standard.
The load increase factor (LIF) for the linear static procedure was calculated as follows:
where mLIF is the smallest m factor determined for each structural element directly connected or located above the removal column. For mLIF = 6, we obtained LIF = 8.
The dynamic increase factor (DIF) for nonlinear static procedure was calculated as follows:
where θpra is the plastic rotation angle and θy is the yield rotation. Given that θpra = 0.05 and θy = 0.032, we obtained DIF = 1.26. Compared to the uniform multiplier of 2.0 proposed by the Russian standard [40], the calculated LIF and DIF following the DoD guideline [41] looked more reasonable. Using these values as multipliers to the masses loaded on the slabs above the removal column, we obtained the peak displacements equal to 61.8 mm and 54.7 mm from LSP and NSP, respectively (see Figure 13).
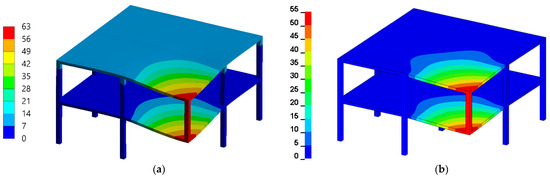
Figure 13.
The maximum displacements obtained following DoD guideline from linear static procedure (a) and nonlinear static procedure (b), mm.
As can be seen, the linear static and nonlinear static pushdown procedures with different load multipliers according to the DoD guideline fit the experimental results much better. For the LSP, the error was 28.5%; for the NSP it was about 14%. It is also important to note that in both cases the results were conservative.
Therefore, static pushdown procedures outlined in [41,42] allowed for more accuracy, although the linear static procedure still resulted in overestimated peak displacements. A perspective direction for the numerical investigation of the progressive collapse of RC buildings is to develop and clarify the linear static procedure based on the results obtained from the nonlinear dynamic method. These researches will allow us to obtain accurate stresses and deformations of structures using a linear analysis that will be much less time-consuming than nonlinear dynamic simulations.
Due to the high accuracy and consistency with experiments, the nonlinear dynamic high-fidelity models of RC structures could also be used in damage identification methods for structural health monitoring under different operational and environmental conditions [48]. It can help determine the presence of damage in a structure, identify the geometric location of damage, quantify damage severity, and even predict the remaining service life of a structure.
Author Contributions
Data curation, A.N.D.; Investigation, A.N.D.; Methodology, A.N.D. and V.V.L.; Project administration, V.V.L.; Resources, A.N.D.; Software, A.N.D.; Supervision, V.V.L.; Visualization, A.N.D.; Writing—original draft, A.N.D.; Writing—review and editing, V.V.L. All authors have read and agreed to the published version of the manuscript.
Funding
The research was partially funded by the Ministry of Science and Higher Education of the Russian Federation as part of World-class Research Center program: Advanced Digital Technologies (contract no. 075-15-2020-934 dated 17 November 2020).
Institutional Review Board Statement
Not applicable.
Informed Consent Statement
Not applicable.
Acknowledgments
The authors are grateful to Nikolai Vatin (Peter the Great St. Petersburg Polytechnic University, Russia) for advice and valuable comments while working on this article.
Conflicts of Interest
The authors declare no conflict of interest. The funders had no role in the design of the study; in the collection, analyses, or interpretation of data; in the writing of the manuscript, or in the decision to publish the results.
References
- Ellingwood, B.R.; Smilowitz, R.; Dusenberry, D.O.; Duthinh, D.; Lew, H.S.; Carino, N.J. Best Practices for Reducing the Potential for Progressive Collapse in Buildings; Gaithersburg; National Institute of Standards and Technology: Gaithersburg, MD, USA, 2007.
- Kokot, S.; Solomos, G. Progressive Collapse Risk Analysis: Literature Survey, Relevant Construction Standards and Guidelines; Joint Research Centre: Brussels, Belgium; European Commission: Luxembourg, 2012. [Google Scholar]
- Cuoco, D.A.; Peraza, D.B.; Scarangello, T.Z. Investigation of L’Ambiance Plaza Building Collapse. J. Perform. Constr. Facil. 1992, 6, 211–231. [Google Scholar] [CrossRef]
- Heger, F.J. Public-Safety Issues in Collapse of L’Ambiance Plaza. J. Perform. Constr. Facil. 1991, 5, 92–112. [Google Scholar] [CrossRef]
- Martin, R.; Delatte, N.J. Another Look at the L’Ambiance Plaza Collapse. J. Perform. Constr. Facil. 2000, 14, 160–165. [Google Scholar] [CrossRef]
- Mohamed, O.A. Progressive Collapse of Structures: Annotated Bibliography and Comparison of Codes and Standards. J. Perform. Constr. Facil. 2006, 20, 418–425. [Google Scholar] [CrossRef]
- Bazant, Z.P.; Le, J.-L.; Greening, F.R.; Benson, D.B. What Did and Did Not Cause Collapse of World Trade Center Twin Towers in New York? J. Eng. Mech. 2008, 134, 892–906. [Google Scholar] [CrossRef]
- Bažant, Z.P.; Verdure, M. Mechanics of Progressive Collapse: Learning from World Trade Center and Building Demolitions. J. Eng. Mech. 2007, 133, 308–319. [Google Scholar] [CrossRef]
- Wang, H.; Zhang, A.; Li, Y.; Yan, W. A Review on Progressive Collapse of Building Structures. Open Civ. Eng. J. 2014, 8, 183–192. [Google Scholar] [CrossRef]
- Qian, K.; Hu, H.-N.; Fu, F.; Deng, X.-F. Dynamic Behavior of Precast Concrete Beam-Column Sub-Assemblages with High Performance Connections Subjected to Sudden Column Removal Scenario. In Proceedings of the Structures Congress 2020, St. Louis, MO, USA, 5–8 April 2020; American Society of Civil Engineers: Reston, VA, USA, 2020; pp. 467–474. [Google Scholar]
- Kai, Q.; Li, B. Dynamic performance of RC beam-column substructures under the scenario of the loss of a corner column—Experimental results. Eng. Struct. 2012, 42, 154–167. [Google Scholar] [CrossRef]
- Russell, J.M. Progressive Collapse of Reinforced Concrete Flat Slab Structures. Ph.D. Thesis, University of Nottingham, Nottingham, UK, 2015. [Google Scholar]
- Russell, J.; Owen, J.; Hajirasouliha, I. Experimental investigation on the dynamic response of RC flat slabs after a sudden column loss. Eng. Struct. 2015, 99, 28–41. [Google Scholar] [CrossRef]
- Peng, Z.; Orton, S.L.; Liu, J.; Tian, Y. Experimental Study of Dynamic Progressive Collapse in Flat-Plate Buildings Subjected to Exterior Column Removal. J. Struct. Eng. 2017, 143, 04017125. [Google Scholar] [CrossRef]
- Peng, Z.; Orton, S.L.; Liu, J.; Tian, Y. Experimental Study of Dynamic Progressive Collapse in Flat-Plate Buildings Subjected to an Interior Column Removal. J. Struct. Eng. 2018, 144, 04018094. [Google Scholar] [CrossRef]
- Xiao, Y.; Zhao, Y.B.; Li, F.W.; Kunnath, S.; Lew, H.S. Collapse Test of a 3-Story Half-Scale RC Frame Structure. In Proceedings of the Structures Congress 2013, Pittsburgh, PA, USA, 2–4 May 2013; American Society of Civil Engineers: Reston, VA, USA, 2013; pp. 11–19. [Google Scholar]
- Adam, J.M.; Buitrago, M.; Bertolesi, E.; Sagaseta, J.; Moragues, J.J. Dynamic performance of a real-scale reinforced concrete building test under a corner-column failure scenario. Eng. Struct. 2020, 210, 110414. [Google Scholar] [CrossRef]
- Wang, T.; Zhang, L.; Zhao, H.; Chen, Q. Progressive collapse resistance of reinforced-concrete frames with specially shaped columns under loss of a corner column. Mag. Concr. Res. 2016, 68, 1–15. [Google Scholar] [CrossRef]
- Zhang, L.; Zhao, H.; Wang, T.; Chen, Q. Parametric Analysis on Collapse-resistance Performance of Reinforced-concrete Frame with Specially Shaped Columns Under Loss of a Corner Column. Open Constr. Build. Technol. J. 2016, 10, 466–480. [Google Scholar] [CrossRef]
- Ren, P.; Li, Y.; Zhou, Y.; Lu, X.; Guan, H. Experimental Study on the Progressive Collapse Resistance of RC Slabs. In Proceedings of the Structures Congress 2014, Boston, MA, USA, 3–5 May 2014; American Society of Civil Engineers: Boston, MA, USA, 2014; pp. 1–12. [Google Scholar]
- Lu, X.; Lin, K.; Li, Y.; Guan, H.; Ren, P.; Zhou, Y. Experimental investigation of RC beam-slab substructures against progressive collapse subject to an edge-column-removal scenario. Eng. Struct. 2017, 149, 91–103. [Google Scholar] [CrossRef]
- Darweesh, K.I.A. Experimental and Theoretical Evaluation of Progressive Collapse Capacity of Reinforced Concrete Framed Structures. Ph.D. Thesis, University of Salford, Salford, UK, 2017. [Google Scholar]
- Elsanadedy, H.M.; Al-Salloum, Y.A.; Almusallam, T.H.; Ngo, T.; Abbas, H. Assessment of progressive collapse potential of special moment resisting RC frames—Experimental and FE study. Eng. Fail. Anal. 2019, 105, 896–918. [Google Scholar] [CrossRef]
- Lim, N.S.; Tan, K.; Lee, C. Experimental studies of 3D RC substructures under exterior and corner column removal scenarios. Eng. Struct. 2017, 150, 409–427. [Google Scholar] [CrossRef]
- Yu, J.; Rinder, T.; Stolz, A.; Tan, K.-H.; Riedel, W. Dynamic Progressive Collapse of an RC Assemblage Induced by Contact Detonation. J. Struct. Eng. 2014, 140, 04014014. [Google Scholar] [CrossRef]
- Qian, K.; Li, B. Dynamic and residual behavior of reinforced concrete floors following instantaneous removal of a column. Eng. Struct. 2017, 148, 175–184. [Google Scholar] [CrossRef]
- Bermejo, M.; Santos, A.P.; Goicolea, J.M. Development of Practical Finite Element Models for Collapse of Reinforced Concrete Structures and Experimental Validation. Shock. Vib. 2017, 2017, 1–9. [Google Scholar] [CrossRef]
- Qian, K.; Weng, Y.-H.; Li, B. Impact of two columns missing on dynamic response of RC flat slab structures. Eng. Struct. 2018, 177, 598–615. [Google Scholar] [CrossRef]
- Liu, J.; Tian, Y.; Orton, S.L.; Said, A.M. Resistance of Flat-Plate Buildings against Progressive Collapse. I: Modeling of Slab-Column Connections. J. Struct. Eng. 2015, 141, 04015053. [Google Scholar] [CrossRef]
- Liu, J.; Tian, Y.; Orton, S.L. Resistance of Flat-Plate Buildings against Progressive Collapse. II: System Response. J. Struct. Eng. 2015, 141, 04015054. [Google Scholar] [CrossRef]
- Keyvani, L.; Sasani, M.; Mirzaei, Y. Compressive membrane action in progressive collapse resistance of RC flat plates. Eng. Struct. 2014, 59, 554–564. [Google Scholar] [CrossRef]
- Kwasniewski, L. Nonlinear dynamic simulations of progressive collapse for a multistory building. Eng. Struct. 2010, 32, 1223–1235. [Google Scholar] [CrossRef]
- Pham, A.T.; Tan, K.H.; Yu, J. Numerical investigations on static and dynamic responses of reinforced concrete sub-assemblages under progressive collapse. Eng. Struct. 2017, 149, 2–20. [Google Scholar] [CrossRef]
- Parisi, F.; Scalvenzi, M.; Brunesi, E. Performance limit states for progressive collapse analysis of reinforced concrete framed buildings. Struct. Concr. 2018, 20, 68–84. [Google Scholar] [CrossRef]
- Brunesi, E.; Nascimbene, R.; Parisi, F. Progressive Collapse Fragility Models of RC Framed Buildings Based on Pushdown Analysis. In Proceedings of the VII European Congress on Computational Methods in Applied Sciences and Engineering (ECCOMAS Congress 2016), Crete, Greece, 5–10 June 2016; Institute of Structural Analysis and Antiseismic Research School of Civil Engineering National Technical University of Athens (NTUA): Athens, Greece, 2016; Volume 3, pp. 4900–4919. [Google Scholar]
- Brunesi, E.; Parisi, F. Progressive collapse fragility models of European reinforced concrete framed buildings based on pushdown analysis. Eng. Struct. 2017, 152, 579–596. [Google Scholar] [CrossRef]
- Goudarzi, H.R.V. Nonlinear Dynamic Analysis of Reinforced Concrete Frames under Extreme Loadings. Ph.D. Thesis, The University of New South Wales, Sydney, Australia, 2009. [Google Scholar]
- Marjanishvili, S.; Agnew, E. Comparison of Various Procedures for Progressive Collapse Analysis. J. Perform. Constr. Facil. 2006, 20, 365–374. [Google Scholar] [CrossRef]
- Fialko, S.Y.; Kabantsev, O.V.; Perelmuter, A.V. Elasto-Plastic Progressive Collapse Analysis Based on the Integration of the Equations of Motion. Mag. Civ. Eng. 2021, 102, 1–10. [Google Scholar] [CrossRef]
- Ministry of Construction Industry, Housing and Utilities Sector. SP 385.1325800.2018 Protection of Buildings and Structures against Progressive Collapse. Design Code. Basic Statements; Standartinform: Moscow, Russia, 2019.
- Department of Defense. Unified Facilities Criteria: Design of Buildings to Resist Progressive Collapse UFC 4-023-03; Department of Defense: Washington, DC, USA, 2016.
- United States General Services Administration. Alternate Path Analysis and Design Guidelines for Progressive Collapse Resistance; General Services Administration: Washington, DC, USA, 2013.
- Jiang, B.; Li, G.-Q.; Li, L.; Izzuddin, B.A. Experimental Studies on Progressive Collapse Resistance of Steel Moment Frames under Localized Furnace Loading. J. Struct. Eng. 2018, 144, 04017190. [Google Scholar] [CrossRef]
- Kang, H.; Kim, J. Progressive Collapse of Steel Moment Frames Subjected to Vehicle Impact. J. Perform. Constr. Facil. 2015, 29, 04014172. [Google Scholar] [CrossRef]
- Adam, J.M.; Parisi, F.; Sagaseta, J.; Lu, X. Research and practice on progressive collapse and robustness of building structures in the 21st century. Eng. Struct. 2018, 173, 122–149. [Google Scholar] [CrossRef]
- Guchinsky, R. The Onset of a Progressive Collapse During the Deconstruction of the Sports Building. Constr. Unique Build. Struct. 2021, 96, 1–15. [Google Scholar] [CrossRef]
- Formisano, A.; Iazzetta, G.; Marino, G.; Fabbrocino, F.; Landolfo, R. Seismic Residual Capacity Assessment of Framed Structures Damaged by Exceptional Actions. In Proceedings of the VII European Congress on Computational Methods in Applied Sciences and Engineering (ECCOMAS Congress 2016), Crete, Greece, 5–10 June 2016; Institute of Structural Analysis and Antiseismic Research School of Civil Engineering National Technical University of Athens (NTUA): Athens, Greece, 2016; Volume 3, pp. 4942–4958. [Google Scholar]
- Ratnika, L.; Gaile, L.; Vatin, N. Impact of Groundwater Level Change on Natural Frequencies of RC Buildings. Buildings 2021, 11, 265. [Google Scholar] [CrossRef]
- Szyniszewski, S. Effects of Random Imperfections on Progressive Collapse Propagation. In Proceedings of the Structures Congress 2010, Orlando, FL, USA, 12–15 May 2010; American Society of Civil Engineers: Reston, VA, USA, 2010; pp. 3572–3577. [Google Scholar]
- Ferraioli, M.; Lavino, A.; Mandara, A.; Donciglio, M.; Formisano, A. Seismic and Robustness Design of Steel Frame Buildings. Key Eng. Mater. 2018, 763, 116–123. [Google Scholar] [CrossRef]
- Birbraer, A.N.; Roleder, A.J. Extreme Actions on Structures; Publishing House of the Polytechnical University: St. Petersburg, Russia, 2009; ISBN 978-5-7422-2370-2. [Google Scholar]
- Murray, Y.; Abu-Odeh, A.; Bligh, R. Evaluation of LS-DYNA Concrete Material Model 159; United States, Federal Highway Administration, Office of Research, Development, and Technology: McLean, VA, USA, 2007. [Google Scholar]
- Murray, Y. Users Manual for LS-DYNA Concrete Material Model 159; United States, Federal Highway Administration, Office of Research, Development, and Technology: McLean, VA, USA, 2007. [Google Scholar]
- Markou, G. Computational Performance of an Embedded Reinforcement Mesh Generation Method for Large-Scale RC Simulations. Int. J. Comput. Methods 2015, 12, 1550019. [Google Scholar] [CrossRef]
- Barzegar, F.; Maddipudi, S. Generating Reinforcement in FE Modeling of Concrete Structures. J. Struct. Eng. 1994, 120, 1656–1662. [Google Scholar] [CrossRef]
- Hallquist, J. LS-DYNA Theory Manual; Livermore Software Technology Corporation: Livermore, CA, USA, 2007; ISBN 9254492507. [Google Scholar]
- ANSYS. Mechanical APDL Theory Reference; ANSYS Inc.: Canonsburg, PA, USA, 2016. [Google Scholar]
- Lalin, V.V.; Dmitriev, A.N.; Diakov, S.F. Nonlinear deformation and stability of geometrically exact elastic arches. Mag. Civ. Eng. 2019, 89, 39–51. [Google Scholar] [CrossRef]
- Fung, Y.C.; Tong, P.; Chen, X. Classical and Computational Solid Mechanics: Advanced Series in Engineering Science; World Scientific Publishing Company: Singapore, 2017; ISBN 978-981-4713-64-1. [Google Scholar]
- Dmitriev, A.; Novozhilov, Y.; Mikhalyuk, D.; Lalin, V. Calibration and Validation of the Menetrey-Willam Constitutive Model for Concrete. Stroitel’stvo Unikal’nyh Zdanij i Sooruzenij 2020, 8, 8804. [Google Scholar] [CrossRef]
- Dmitriev, A.; Lalin, V.; Novozhilov, Y.; Mikhalyuk, D. Simulation of Concrete Plate Perforation by Coupled Finite Element and Smooth Particle Hydrodynamics Methods. Constr. Unique Build. Struct. 2020, 92, 9207. [Google Scholar] [CrossRef]
- Novozhilov, Y.V.; Dmitriev, A.N.; Mikhaluk, D.S.; Chernukha, N.A.; Feoktistova, L.Y.; Volkodav, I.A. Aircraft NPP Impact Simulation Methodology. In Proceedings of the 16th International LS-DYNA® Users Conference, Barcelona, Spain, 10 June 2020; pp. 1–14. [Google Scholar]
- Dmitriev, A.; Lalin, V.; Melnikov, A. Validation of Computational Procedures for the Progressive Collapse Analysis of Reinforced Concrete Structures. In Proceedings of the EECE 2020, St. Petersburg, Russia, 19–20 November 2020; Springer: Berlin/Heidelberg, Germany, 2021; pp. 215–224. [Google Scholar] [CrossRef]
- Wei, J.; Li, J.; Wu, C. An experimental and numerical study of reinforced conventional concrete and ultra-high performance concrete columns under lateral impact loads. Eng. Struct. 2019, 201, 109822. [Google Scholar] [CrossRef]
- Weng, Y.-H.; Qian, K.; Fu, F.; Fang, Q. Numerical investigation on load redistribution capacity of flat slab substructures to resist progressive collapse. J. Build. Eng. 2019, 29, 101109. [Google Scholar] [CrossRef]
- Levi-Hevroni, D.; Kochavi, E.; Kofman, B.; Gruntman, S.; Sadot, O. Experimental and numerical investigation on the dynamic increase factor of tensile strength in concrete. Int. J. Impact Eng. 2018, 114, 93–104. [Google Scholar] [CrossRef]
- Jiang, H.; Zhao, J. Calibration of the continuous surface cap model for concrete. Finite Elements Anal. Des. 2015, 97, 1–19. [Google Scholar] [CrossRef]
- International Atomic Energy Agency. Safety Aspects of Nuclear Power Plants in Human Induced External Events: Assessment of Structures; International Atomic Energy Agency: Vienna, Austria, 2018. [Google Scholar]
- Liu, M. Pulldown Analysis for Progressive Collapse Assessment. J. Perform. Constr. Facil. 2015, 29, 04014027. [Google Scholar] [CrossRef]
- Formisano, A.; Landolfo, R.; Mazzolani, F. Robustness assessment approaches for steel framed structures under catastrophic events. Comput. Struct. 2015, 147, 216–228. [Google Scholar] [CrossRef]
- Kokot, S.; Anthoine, A.; Negro, P.; Solomos, G. Static and dynamic analysis of a reinforced concrete flat slab frame building for progressive collapse. Eng. Struct. 2012, 40, 205–217. [Google Scholar] [CrossRef]
- Tsai, M.-H. An analytical methodology for the dynamic amplification factor in progressive collapse evaluation of building structures. Mech. Res. Commun. 2010, 37, 61–66. [Google Scholar] [CrossRef]
- McKay, A.; Marchand, K.; Diaz, M. Alternate Path Method in Progressive Collapse Analysis: Variation of Dynamic and Nonlinear Load Increase Factors. Pr. Period. Struct. Des. Constr. 2012, 17, 152–160. [Google Scholar] [CrossRef]
- Marchand, K.; McKay, A.; Stevens, D.J. Development and Application of Linear and Non-Linear Static Approaches in UFC 4-023-03. In Proceedings of the Structures Congress 2009: Don’t Mess with Structural Engineers: Expanding Our Role, Austin, TX, USA, 30 April–2 May 2009; pp. 1–10. [Google Scholar] [CrossRef]
- Bathe, K.-J. Finite Element Procedures; Prentice Hall: Hoboken, NJ, USA, 1996. [Google Scholar]
- Bathe, K.-J.; Noh, G. Insight into an implicit time integration scheme for structural dynamics. Comput. Struct. 2012, 98–99, 1–6. [Google Scholar] [CrossRef]
- Belytschko, T.; Liu, W.K.; Moran, B.; Elkhodary, K. Nonlinear finite elements for continua and structures. Choice Rev. Online 2001, 38, 38–3926. [Google Scholar] [CrossRef]


Publisher’s Note: MDPI stays neutral with regard to jurisdictional claims in published maps and institutional affiliations. |
© 2021 by the authors. Licensee MDPI, Basel, Switzerland. This article is an open access article distributed under the terms and conditions of the Creative Commons Attribution (CC BY) license (https://creativecommons.org/licenses/by/4.0/).