Article

Integration of Modelling Approaches for the Seismic Assessment of Complex URM Buildings: The Podestà Palace in Mantua, Italy

Department of Civil, Chemical and Environmental Engineering, University of Genoa, 16145 Genoa, Italy
*
Author to whom correspondence should be addressed.
Buildings 2021, 11(7), 269; https://doi.org/10.3390/buildings11070269
Submission received: 31 March 2021 / Revised: 17 June 2021 / Accepted: 21 June 2021 / Published: 24 June 2021
(This article belongs to the Special Issue Seismic Performance Assessment of Buildings)

Abstract

:
This study investigated seismic assessments of the Podestà Palace in Mantua (Italy). This masonry palace has a complex geometrical configuration that resulted from the addition of various units stratified over centuries. This feature makes seismic assessment challenging from a modelling perspective due to the interaction among units. Here, an integrated use of three modelling strategies characterised by a different computational effort and degree of accuracy was employed: (i) the Structural Element Model, according to the Equivalent Frame Approach, to study the global response of the whole structure and to estimate the mutual dynamic interactions among units; (ii) the Macro-Block Model, to assess the out-of-plane response of facades prone to the activation of local mechanisms; and (iii) the Finite Element Model, to deepen the seismic response of some critical parts, highlighted by a global analysis but also roughly described by the Equivalent Frame Model. This integrated approach consists in the use of results achieved from one modelling approach as input for another. For example, the floor spectra estimated by (i) were used to define the seismic input in (ii); for assessing the most critical portions, more accurate models were addressed (as in case (iii)). The comprehensive interpretation of the seismic behaviour obtained by these models also allowed us to address more rationally possible strengthening solutions, such as the in-plane stiffening of vaults (particularly spread in the building), aimed to guarantee a better redistribution of seismic actions in such a complex building.

1. Introduction

The seismic protection of historical unreinforced masonry (URM) buildings represents a challenging issue because of their vulnerability and complex seismic behaviour. Their size and their complex configurations may combine the activation of both in-plane and out-of-plane (OOP) mechanisms, as testified by past earthquakes [1,2,3,4,5,6]. The spontaneous transformations, often stratified during their lifetime, may determine a significant in-plan and in-elevation geometric complexity. In many cases, the sequence of these additions led to structural units jointed together by means of connecting bodies (often built with timber floors and set up on arches or vaults), whose features govern the interactions among the different parts. As a consequence, the seismic assessment of such complex structures poses several critical issues.
The first one deals with the definition of the best modelling choice, which has to balance a reasonable computational effort with the need to guarantee a reliable assessment that is also able to catch the aforementioned interaction effects. Different modelling strategies can be adopted for masonry structures [1,7,8,9,10]. In particular, according to the classification proposed by [10], models can be distinguished in four classes, depending on the modelling scale (masonry material or structural elements) and the type of discretization (continuous or discrete):
  • CCLM (Continuous Constitutive Law Models): finite element (FE) modelling with phenomenological or micromechanical homogenised constitutive laws;
  • SEM (Structural Elements Models): equivalent frame modelling, based on the discretization in terms of piers and spandrels (where the nonlinear response is a priori concentrated) and other linear and nonlinear elements (e.g., aimed to simulate the presence of RC/steel/timber beams or tie rods);
  • DIM (Discrete Interface Models): discrete modelling of blocks and interfaces;
  • MBM (Macro-Blocks Models): modelling of rigid bodies, whose geometry represents the main input. As better described below, MBM typically implements limit analysis-based solutions that can be based on either static or kinematic theorems [11].
The choice of the best modelling strategy to be employed depending on the class of architectural assets under examination can be addressed by considering the recurring expected damage and seismic behaviour, as discussed in [12] (Figure 1). Moreover, an appropriate knowledge phase constitutes the preliminary but essential requisite to address this choice, which, on such complex assets, presupposes the integration of various tools, such as historical analysis, in-depth visual structural in-situ surveys, and experimental tests, whose invasiveness needs to be properly calibrated. Emblematic examples of this are illustrated in [13,14].
The second issue deals with the choice of analysis approach. Whatever modelling strategy has been adopted, it has to be able to accurately reproduce the nonlinear response of masonry. Indeed, masonry is characterised by a very low tensile strength that causes the onset of cracking phenomena for low stress levels. In general, two kinds of nonlinear analysis procedures may be used [9]:
  • Incremental analysis procedures, which investigate, step by step, the evolution of the equilibrium conditions of a structure subjected to certain actions. This class includes both nonlinear static analyses and nonlinear dynamic (time-history) analyses.
  • Limit-analysis-based solutions, which can be employed under the static or kinematic theorems and which are based on the assumptions of Heyman [11], who firstly applied the limit theorems of plasticity to masonry structures.
Finally, the last issue deals with the appropriate procedure to perform the seismic assessment and the verification of such complex URM structures. While standards (i.e., [15,16,17]) essentially focus on ordinary buildings, the assessment of cultural heritage assets is treated in some guideline documents ([18,19,20]), which are not specifically addressed to seismic vulnerability but consider all possible causes of damage and deterioration, with the aim of making a diagnosis and designing a strengthening intervention. In these documents, the use of qualitative approaches is usually favoured. Conversely, the Italian Guidelines for the seismic assessment of cultural heritage ([21]) clearly stated the additional need for a quantitative approach outlining general principles and proposing simplified approaches for a preliminary estimate. Despite this, specific recommendations on models or procedures for a detailed assessment are missing in this document. At present, various possibilities were explored in literature, although a standardised and unanimously recognised approach is not yet available. Casolo and Sanjust (2009) [22] applied a multi-step strategy that combines traditional CCLM models with a new rigid body spring model (RBSM) to assess the seismic vulnerability of a castle in Syracuse (Italy). Garofano and Lestuzzi (2016) [23] used a 3D applied element method (AEM) model [24] to assess the response of a historical URM building in Switzerland; the authors then identified other possible local failure mechanisms that were studied by means of kinematic limit analysis. Rossi et al. (2015) [25] applied the integrated use of three different modelling strategies (CCLM, MBM, and SEM) to analyse the Great Mosque of Algiers through nonlinear (static and kinematic) analyses, discussing also how the use of such models may change the current state of the building to a strengthened state. Degli Abbati et al. (2019) [26] proposed a numerical five-step procedure based on the use of nonlinear static analyses with load patterns calibrated from the results of a modal analysis; the procedure was firstly applied to a medieval fortress made by various towers interacting with the main body of the structure. Malcata et al. [27] compared and verified the combined use of the CCLM and SEM models on the Bonet building in Sintra.
Within this multifaceted context, the paper focuses on the seismic assessment of the Podestà Palace in Mantua (Italy), struck by the 2012 Emilia earthquake [2,28,29,30,31].
The palace was built and transformed over decades leading to its present configuration, characterised by the addition of units interconnected through deformable bodies (Section 2).
In order to interpret its seismic behaviour, we applied a strategy based on the use of three different modelling approaches, employed in an integrated way in order to limit the computational effort in performing nonlinear static and kinematic analyses. In particular, the approach adopted includes:
  • Nonlinear kinematic analyses and an MBM modelling strategy, to study the response of facades most vulnerable to the activation of local out-of-plane mechanisms (Section 3). In particular, the north-east façade overlooking the Broletto square was analysed.
  • Modal analysis and nonlinear static analyses executed on a 3D SEM model of the whole palace, to interpret the seismic response of this complex building. This model allowed us to explicitly account for the interactions between units and quantify the seismic safety index (Section 4). The global model clearly highlighted some vulnerable units that were then studied with more refined approaches. Moreover, the results of this 3D model were useful to refine the estimate of the seismic input (i.e., floor spectra) employed to verify the out-of-plane mechanisms.
  • Nonlinear static analyses performed on the units identified by the SEM model and modelled with the CCLM approach (Section 5 and Section 6).
Examining the seismic behaviour of the palace in the present state also allowed us to outline some possible strengthening solutions, parametrically investigated and specifically conceived to balance the aims of safety and preservation (Section 6).

2. Case-Study Description: The Podestà Palace in Mantua (Italy)

The examined case study is one of the most important buildings in the city of Mantua. It was built from the end of the twelfth century to the mid-fifteenth century to host the municipal government, and it has since transformed many times during its lifetime. At present, the palace is an aggregation of three main buildings (Figure 2), namely, the Podestà Palace, the Masseria, and the Ragione Palace. The latter two are connected by two smaller bodies, the Arengario and the so-called Podestà’s vaults. The Podestà Palace itself is composed of different units that date back to various periods and is located around a narrow courtyard. This fragmentation favoured the presence of many occlusion bodies, such as the thirteenth-century unit placed between the Torre delle Ore and the Palatium Novum, where the northeast façade overlooking the Broletto square is placed (Figure 2).
When the Emilia earthquake occurred in May 2012, the palace was undergoing an extended restoration program, mainly addressed to reusing its spaces as a museum and as offices. Within this program, detailed in-situ surveys and in-situ non-destructive and minor-destructive tests were carried out (e.g., single and double flat jacks, Darmstadt tests, and endoscopic tests; Figure 3); they were then made available for the research aims herein presented. These data, integrated by the historical analysis, allowed us to define the structural features and the mechanical properties of materials: all essential aspects for the definition of a reliable numerical model. Moreover, flues, recesses, infill openings, and non-continuous walls were identified, useful for addressing specific solutions in the equivalent frame idealisation of walls. These irregularities are widespread in the buildings due to the structural and functional changes that often occurred over the centuries.
The building is composed of a solid brick and lime mortar masonry. The wall thickness ranges from 0.30 to 0.60 m, while it is higher in the Torre delle Ore (about 2 m thick). The diaphragms are flexible, with alternating timber floors or brick vaults (Figure 4a). Barrel vaults are prevailing at the lower levels, except for two cross vaults in the fifteenth-century unit. Roofs are realised with timber elements whose thrust is not always effectively absorbed.
Although the epicentre of the Emilia earthquake 2012 was rather far from Mantua, the palace exhibited some non-negligible damage. It mainly consisted of shear cracks in some walls of the Masseria, cracks in the vaults of the fifteenth-century unit, and cracks in the Arengario arches. Moreover, the earthquake determined a clear detachment of the façade overlooking the Broletto square. Such detachment was also detected by a laser scanner survey performed after the seismic event. The worsening in the detachment due to the earthquake was proven by comparing these data with those of another laser scanner survey dating back to 2007 (Figure 4b). In particular, the right part of the façade (coloured in red in Figure 4b) was subjected to a more significant deformation, indicating its possible incipient overturning. This diagnosis is also consistent with other evidence: cracks at the pavement level and detachments of barrel vaults from the main façade at the ground floor were not present, but they gradually increased as the upper floors were examined [32].

3. Out-of-Plane Seismic Assessment of the Façade Overlooking the Broletto Square

3.1. Adopted Criteria for the Out-of-Plane Modelling by the Macro-Block Model Approach

Non-linear kinematic analyses on a macro-block model (MBM) of macroelements identified as those prone to the out-of-plane response were performed with the software MB-Perpetuate [33], which was originally developed in the framework of the Perpetuate Project [10]. Among the various methods based on the limit analysis available in the literature and codes, in which the state of the-art is exhaustively described [34,35,36], in this paper, the OOP seismic assessment was carried out according to the criteria proposed by [37,38]. The aim of the assessment is to compute the maximum peak ground acceleration compatible with the fulfilment of given Limit States (ag,OOP,LS). In the following, more details are provided for the evaluation of the capacity curve (i), the definition of the assumed limit states (ii), and the criteria adopted for the comparison with the seismic input (iii).
Regarding the first aspect (i), Figure 5a shows a capacity curve where four Damage Levels (DLs) are identified. The latter are then associated with corresponding LSs for the aim of the seismic verification according to codes. As can be seen, a bi-linear curve is assumed that differs from the ideal rigid block behaviour in order to account for the actual response of URM walls testified by experimental campaigns [38] and numerical investigations [39]. The curve is defined by the first elastic branch defined by two periods, namely, Te (initial elastic period) and Ts (secant period obtained by the incremental kinematic analyses).
The seismic assessment was then performed by establishing the following correspondence between DL and LS (ii):
  • DL2, which corresponds to the activation of the mechanism: it was assimilated to the Damage Limit State (SLD).
  • DL3, which corresponds to a fraction of the displacement d0, d0 being the displacement associated with the value of the load multiplier α equal to zero. Although different proposals are available in the literature and codes (e.g., [17,36,40]), where DL3 was assumed equal to 0.25d0, according to [37]. DL3 was then assimilated to the Life Safety Limit State (SLV).
The notation of LSs (SLD and SLV) is consistent with the Italian Technical Code [16,17].
Finally, passing to the third issue (iii), for local mechanisms that involve upper parts of the building (as in the examined case), the seismic demand is usually expressed in terms of floor spectra, which aim to account for the filtering effect provided by the main structure and the consequent amplification phenomena (Figure 5b). Among the available expressions proposed in the literature (e.g., [41,42]), the analytical formulation proposed by [43] was used. This expression gives the floor spectrum as a function of the acceleration response spectrum of the ground motion, the dynamic properties of the main structure (i.e., the periods TLSi and the corresponding modal shapes), the equivalent damping of the main structure (ξLSi), and that of the portion involved in the local mechanism. This also allows us to consider the effect of higher modes that have to be properly combined. The suffix “LS” in the properties of the main structure recalls that they need to account for their evolution with the progress of the structure in a nonlinear range. The reliability of this analytical approach was recently proven in [44], thanks to the recordings acquired on some permanently monitored URM buildings.
The results of the global 3D model, discussed in Section 4.1, have been revealed to be particularly useful in defining the dynamic properties of the building and their evolution in the nonlinear range. In the examined case, the floor spectrum accounts only for the contribution of the first mode, while the structural period TLSi and the corresponding damping ratio ξLSi were defined from the nonlinear analyses performed on the global model (Section 4). The floor spectrum was computed for each LS by adopting an equivalent secant period of the structure (TLSi), derived from the pushover curves obtained by pushing the building in the X direction (the one that activates the out-of-plane response of the façade) and considering a pseudo-triangular load pattern (Figure 5d). The associated equivalent damping (ξLSi) was instead computed by applying some common expressions proposed in the literature [45]. Figure 5c shows the global pushover curve converted into an equivalent bi-linear one, defined according to [17]. The reference LSs are identified on this bilinear curve, together with the values of TLSi and ξLSi considered for the floor spectrum definition. The corresponding values of the peak ground acceleration compatible with the fulfilment of the same LSs at the global scale (ag,LS) are also specified (see Section 4 for more details). The values of ag,OOP,LS and ag,LS must be consistent with each other, and in general an iterative procedure is required [32], since the properties of the main structure corresponding to ag,LS constitute the input data for the computation of the floor spectrum necessary to evaluate ag,OOP,LS.

3.2. Macroelements and Mechanisms Examined

Two macroelements were considered (Figure 6a): Macroelement 1 involves the entire façade overlooking the Broletto square (Figure 6a); Macroelement 2 involves a smaller part of this façade, as identified in Figure 6a2. The latter portion was defined starting from the observed seismic damage and the results of the laser-scanner analyses (Figure 4b). In both cases, a complete lack of connection among the façade, the orthogonal internal masonry walls, and the horizontal diaphragms was assumed. This assumption is coherent with the evidence from the in-situ survey. Furthermore, for each macroelement, two different mechanisms were evaluated (Figure 6c), by alternatively considering the retaining action guaranteed by the timber trusses of the roof (Figure 6b), as “not completely” effective (Type 1) or “fully” effective (Type 2). This aspect was included in the assessment as an epistemic uncertainty, since it was not possible to exhaustively verify it from the in-situ inspections.
More specifically, the considered mechanisms are summarised as follows:
  • Mechanisms of Type 1: These involve the overturning of a single block, with a single hinge that was parametrically considered at different heights of the façade (indicated by the suffixes “_a”, “_b”, etc.). The retaining effect of the trusses was modelled as an external stabilizing action, applied in their application point (about 20 cm). The interaction with the trusses presupposes two components: a vertical one (PC) equal to the loads of the entire roof and an external horizontal action equal to HC = μPC (where μ is the friction coefficient assumed equal to 0.2). In particular, in the analyses, the latter was considered effective until the truss extraction.
  • Mechanisms of Type 2: In this case, the roof was modelled as a constraint able to prevent the overturning of the top of the façade. In this way, the development of mechanisms involving two blocks is likely to occur, with one hinge at the base and the other placed in an intermediate point between the base and the level of the roof. Again, parametric analyses were performed investigating the sensitivity of results to various hinge positions (indicated by the suffix “_e”, “_g”, etc.).
These two types of mechanisms were considered for both the identified macroelements. Figure 6c shows by way of example the mechanisms analysed for Macroelement 2 (associated with the hinge position “_d”, “_e”, and “g”). A more complete set of mechanisms is presented in [32]. It should be specified that, in all the analyses, the effect of the limited compressive strength of masonry was considered by properly moving back the plastic hinge across the section; the entity of that distance was calibrated as a function of the actual compressive stress acting on the various levels.

3.3. Results of Out-of-Plane Seismic Assessment

For the aim of seismic verification, the maximum peak ground acceleration compatible with the fulfilment of a given LS (ag,OOP,LS) was compared with the one associated with the design spectrum (ag,site,LS). Table 1 illustrates the results obtained for Macroelement 2, which was the most vulnerable one and the one actually activated, as also highlighted by the laser-scanner survey. In the table, for the most representative mechanisms, the results are illustrated in terms of the peak ground acceleration corresponding to the fulfilment of SLD (ag,OOP,SLD) and SLV (ag,OOP,SLV), the corresponding design peak ground acceleration of Mantua (ag,site,SLD = 0.5 m/s2; ag,site,SLV = 1.109 m/s2), and the resulting safety factors (αSLD = ag,OOP,SLD/ag,site,SLD and αSLV = ag,OOP,SLV/ag,site,SLV). Values lower than 1 correspond to a not-satisfied verification. It should be noticed that, when the acceleration corresponding to the fulfilment of a given DL at the scale of the local mechanism was higher than the corresponding one at the scale of the whole building, the most precautionary condition was considered as a reference. Indeed, in the case of the SLV, the most punitive condition was always that at a global scale: this implies that the whole building reaches the SLV before the same condition occurs for the façade subjected to the out-of-plane response.
Furthermore, the OOP response of the selected mechanisms were also compared with the value of the acceleration estimated for the seismic event which hit Mantua in 2012 (equal to 0.29 m/s2, as deduced from the shaking map—αMantua,2012 in the table). In this latter case, the values of the coefficients αMantua,2012 (computed by assuming as reference the ag,OOP,SLD values) are generally lower than 1. This agrees with the actual activation of the mechanism and confirms the reliability of the model employed.
These results highlighted the vulnerability of the façade to the OOP response and the necessity to design a proper strengthening intervention to prevent the mechanism activation. The simplest but at the same time effective proposal consists in improving the connection of the façade with the roof and with the transversal walls by means of steel tie rods. The optimization of this strengthening intervention was evaluated by varying the number and location of the tie rods, as exhaustively discussed in [32].

4. Seismic Assessment of the Global Response in the Current State of the Palace

4.1. Adopted Criteria for the Global Modelling by the SEM Approach

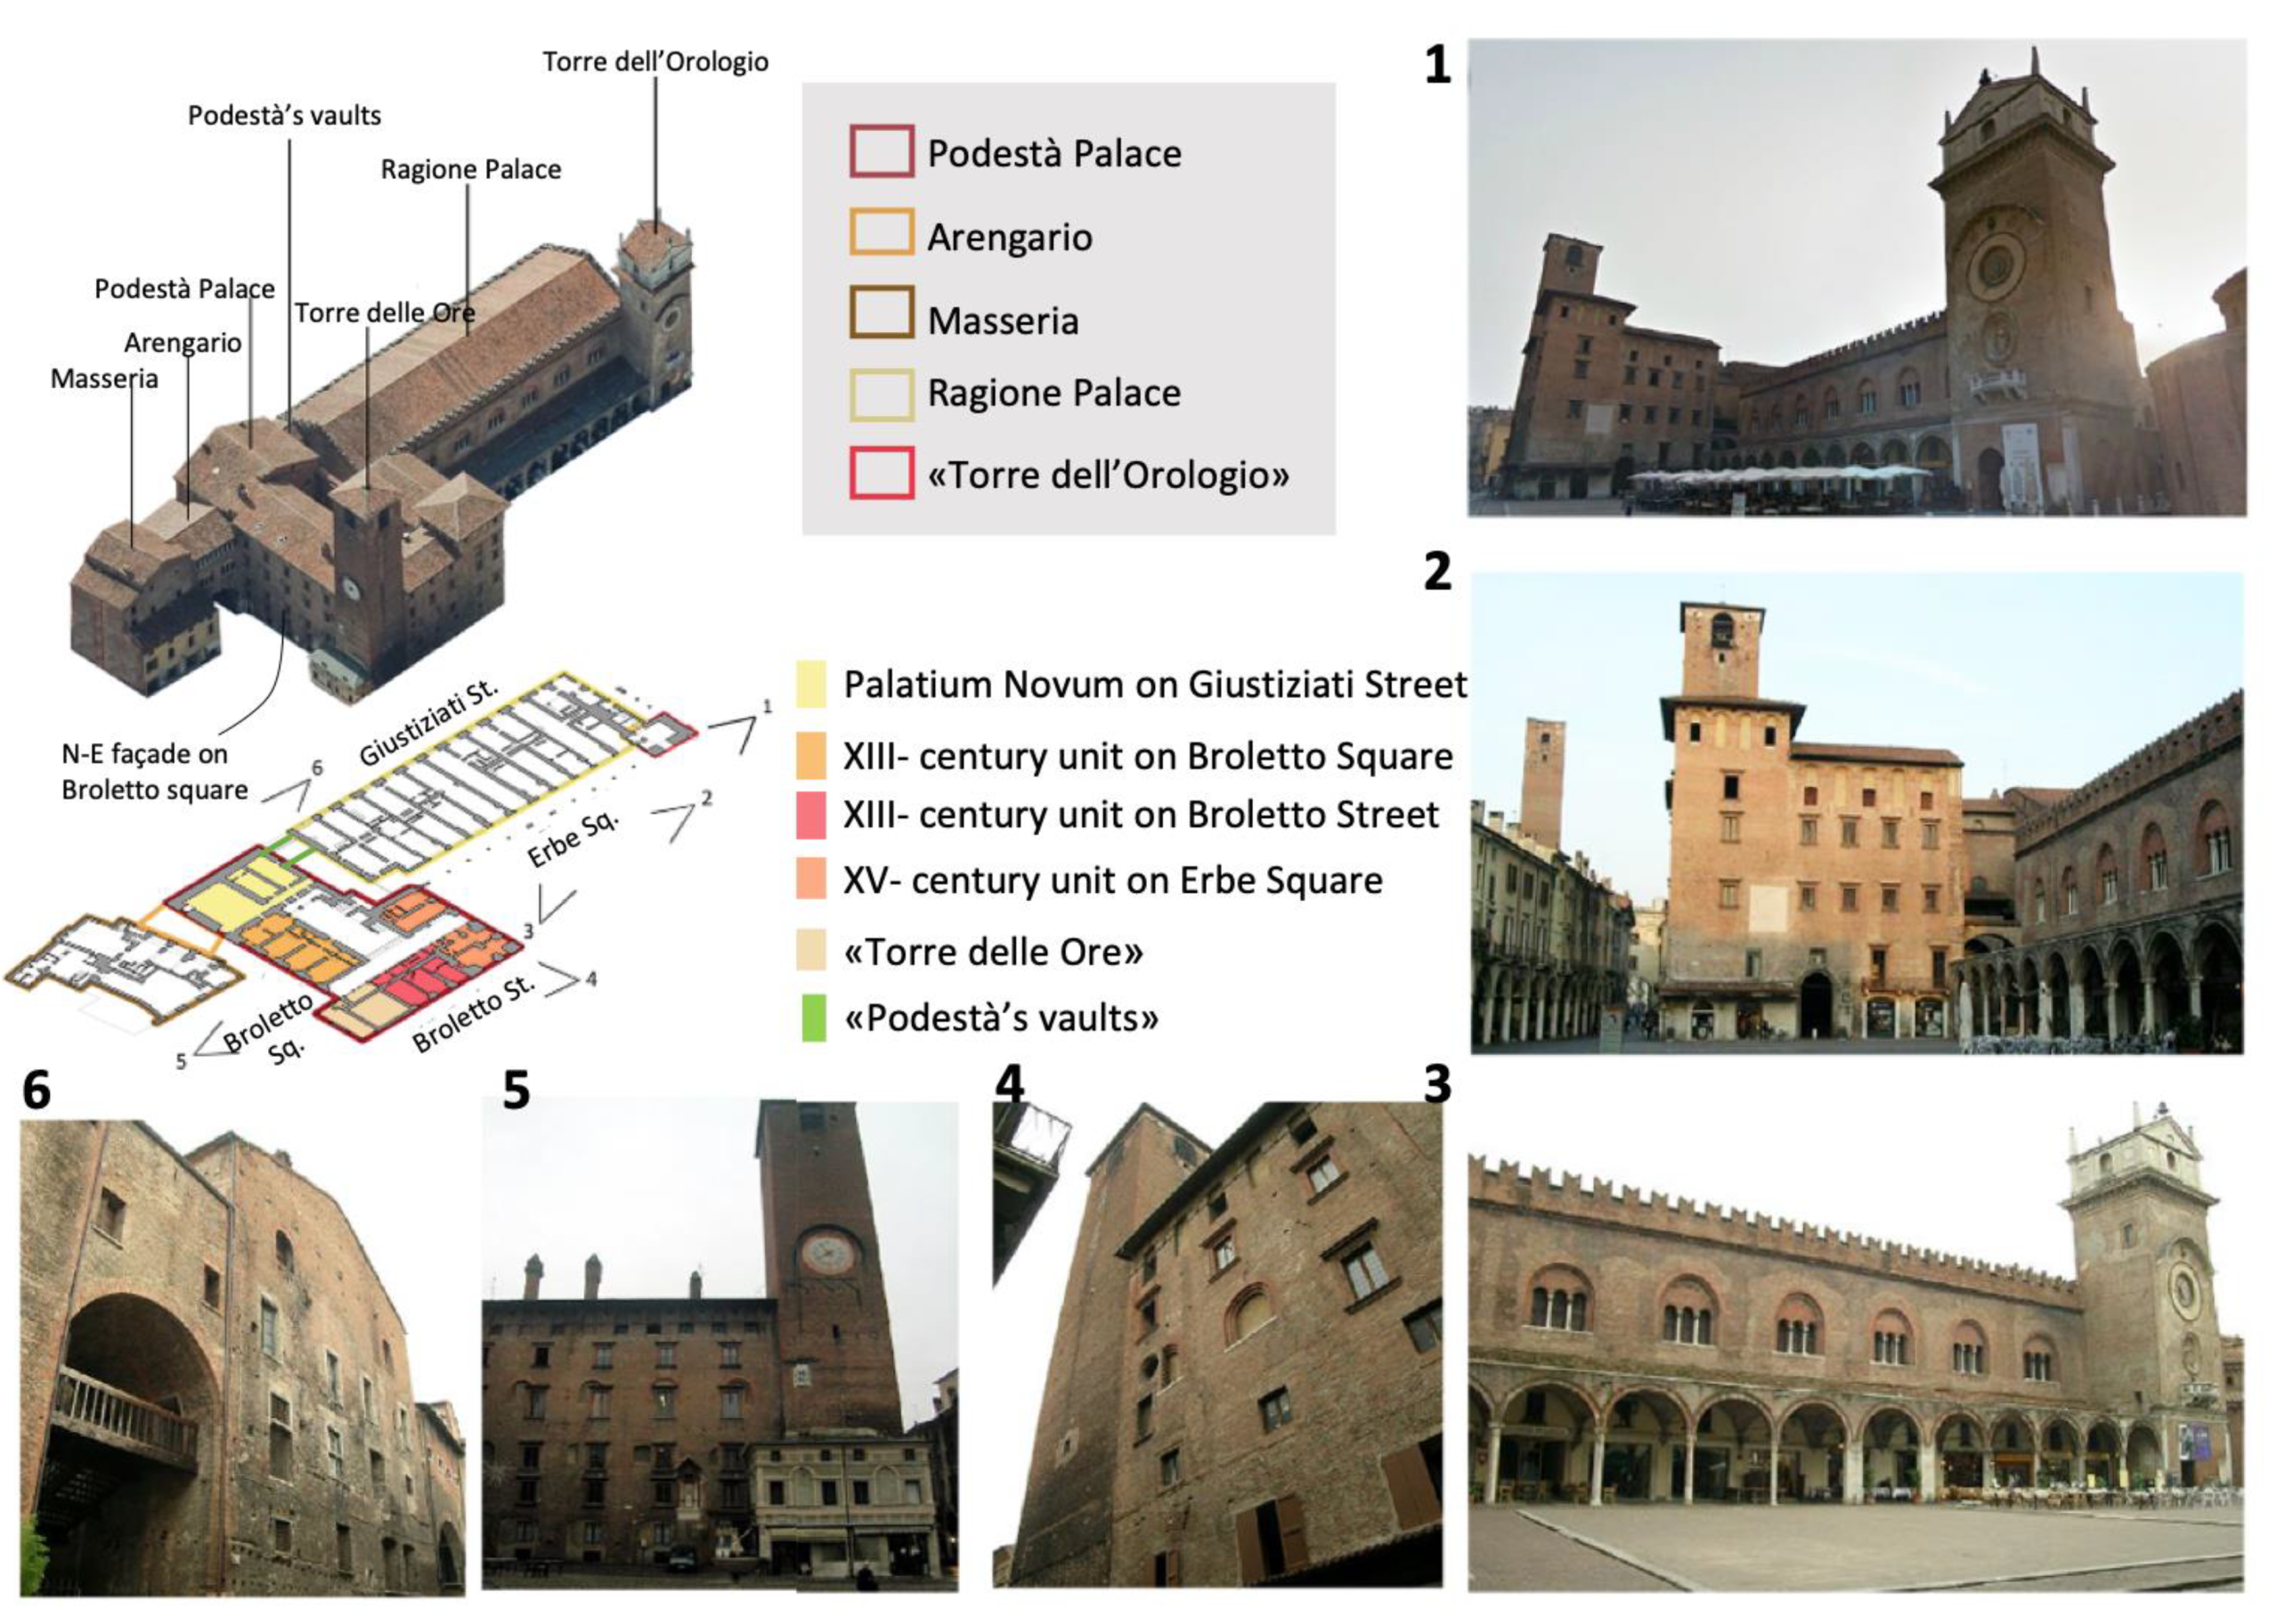
In order to explicitly consider the interactions between the different units of the palace, a SEM model of the whole complex building was set up. The model includes the main bodies object of the seismic assessment (i.e., the Podestà Palace and the Masseria), the adjacent ones (i.e., the urban aggregate close to the Masseria and the Ragione Palace), and the connection bodies (the Arengario and the Podestà’s vaults). The 3D model was realised using the 3Muri software [46], based on the solver developed by [
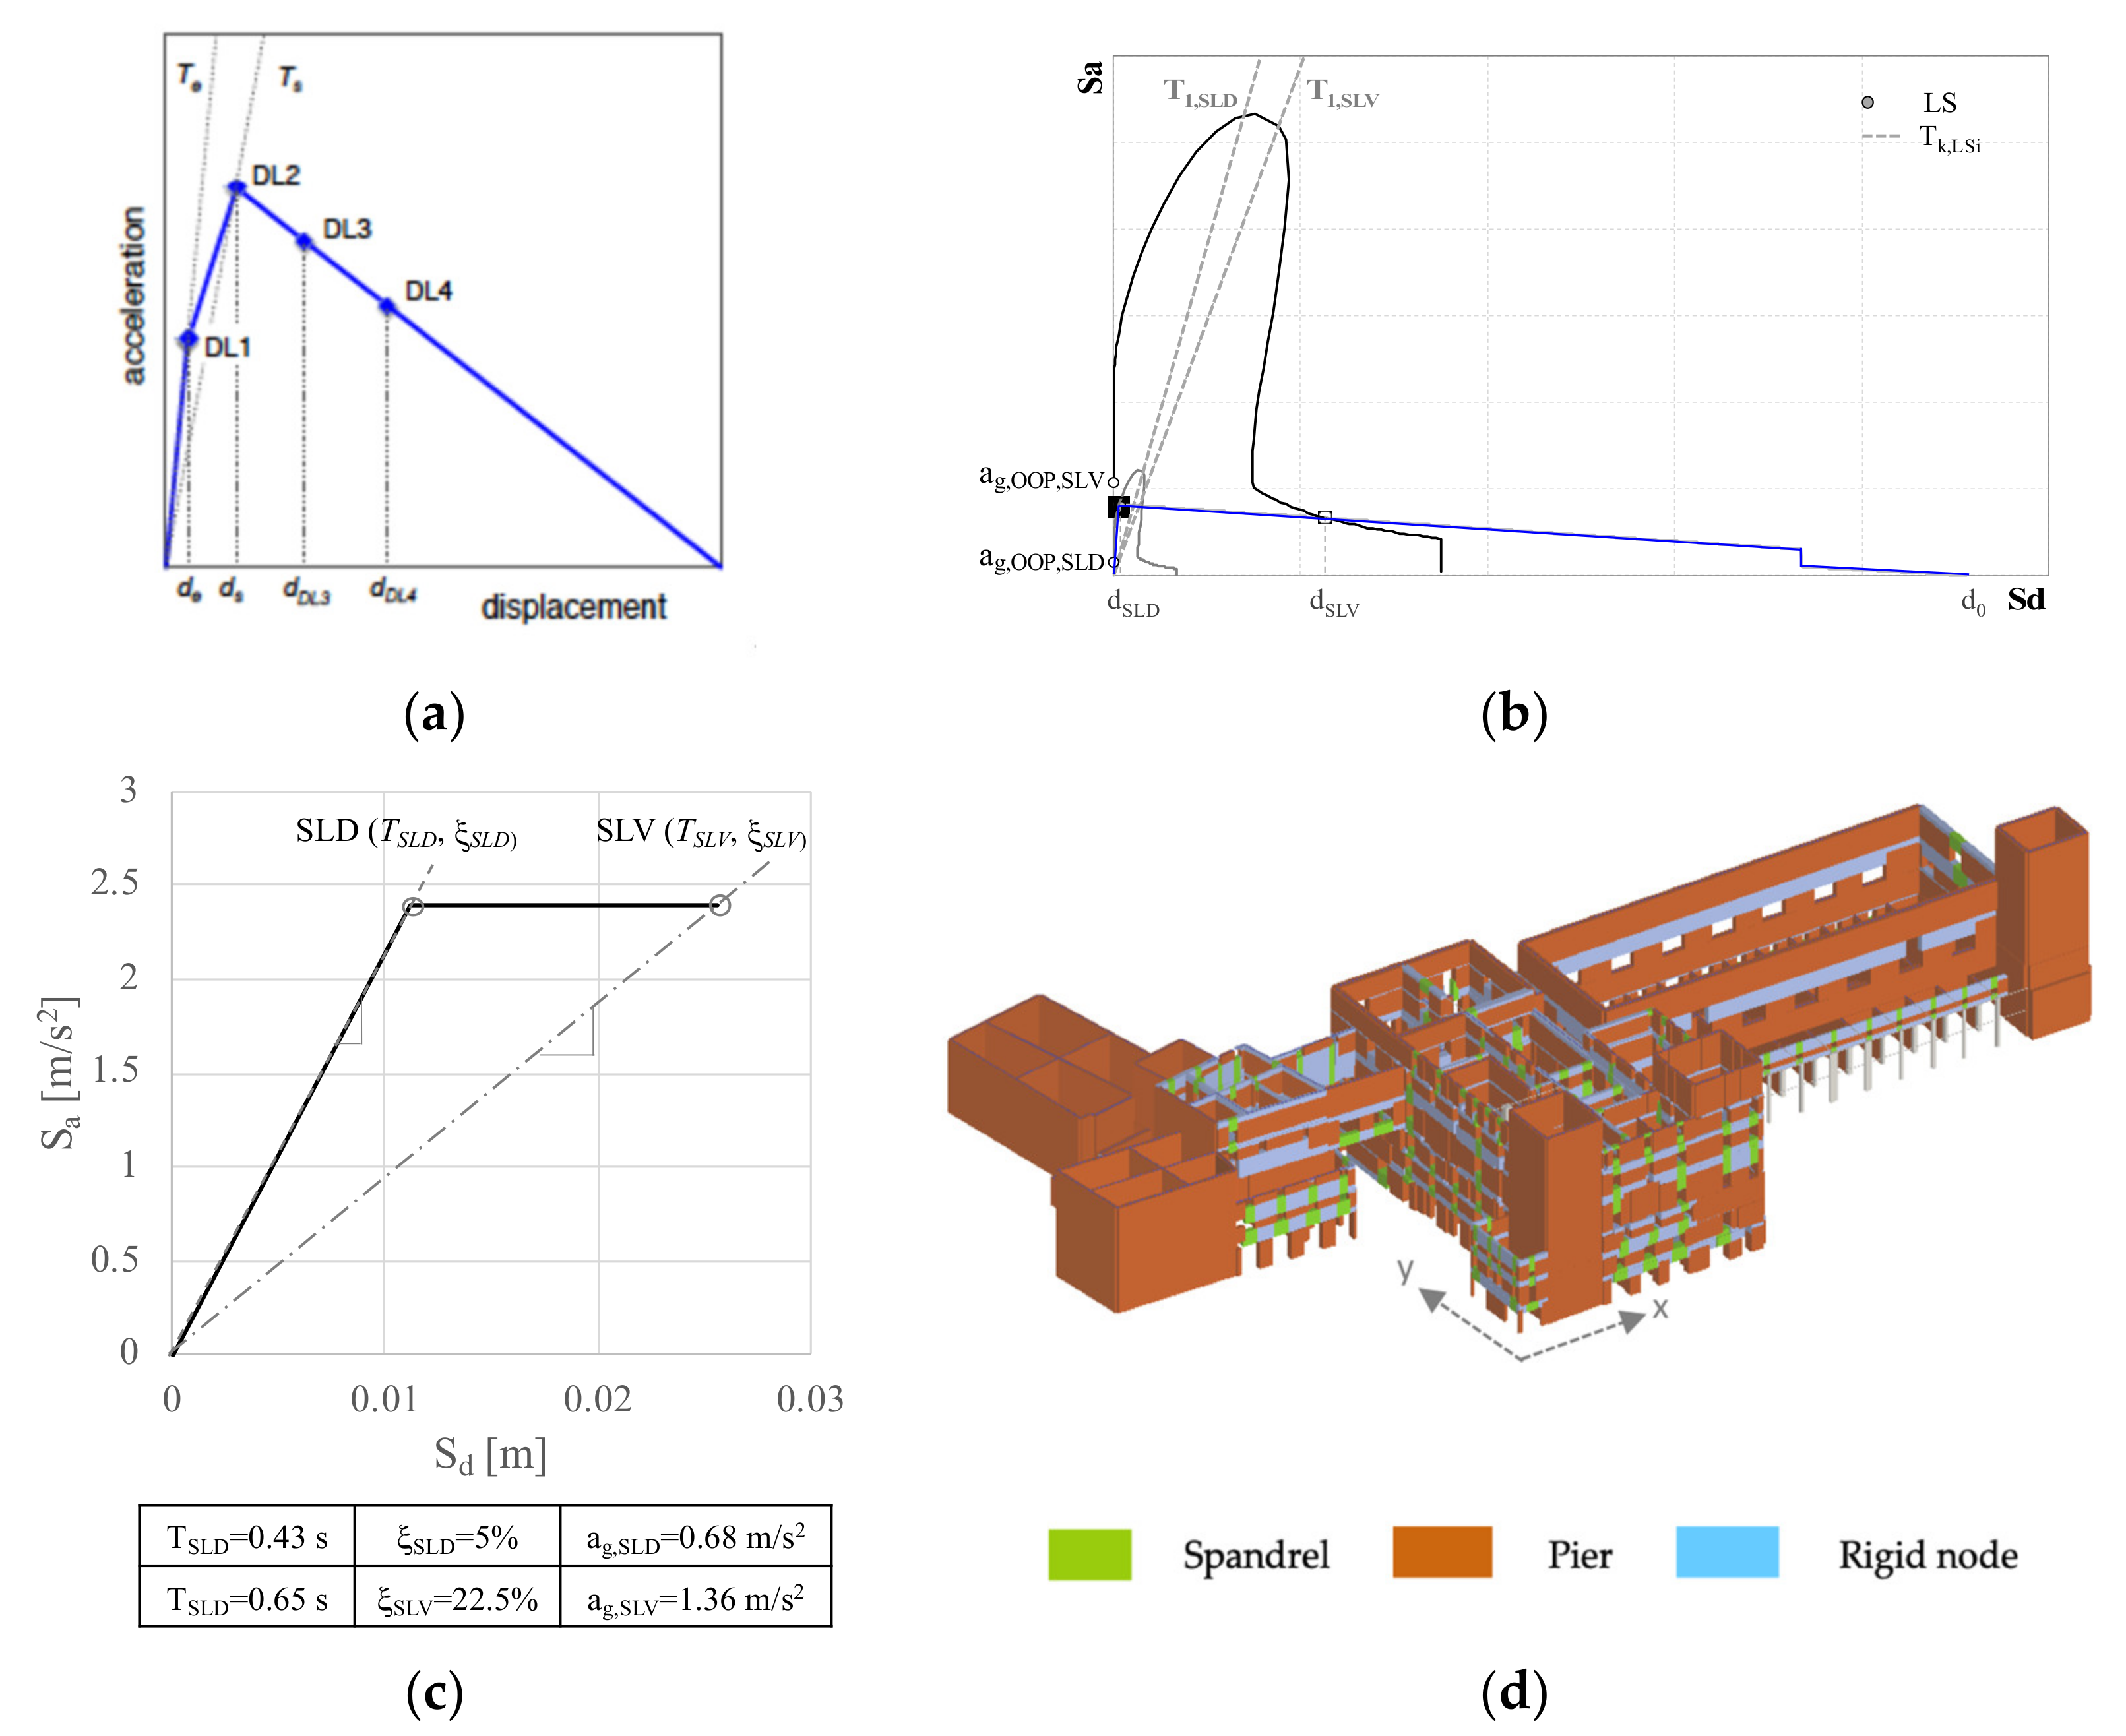
47]; the research version of this software was then adopted to perform the nonlinear analyses. As already mentioned, the software package works according to the equivalent frame (EF) model approach (Figure 7a).
According to the EF approach, only the in-plane response of the URM walls is considered, and each wall is discretised by a set of masonry panels (piers and spandrels), where the non-linear response is concentrated, connected by a rigid area (nodes). The wall idealisation into an equivalent frame is a tricky step. It affects both the elastic field, since it alters the actual deformability of the wall due to the simplification of introducing rigid nodes, and the nonlinear phase of the response, since the regions where the cracks and nonlinearity are likely to develop are assumed a priori. Despite these simplifications, this approach is one of the most spread both in engineering practice and at the research level thanks to its computational efficiency in performing nonlinear analyses (e.g., in [48]) and its reasonable accuracy, as proven by various numerical simulations in the literature (e.g., in [49,50]). In the examined case, performing a complete model of the whole aggregate with other approaches, such as FEM, would have been almost unfeasible. Of course, when applied to monumental buildings, particular attention has to be paid to its correct use starting from the aforementioned EF idealisations of walls that may present various sources of irregularities (in the opening layout, in the heterogeneity of materials, in the discontinuities, etc.). An overview on the issue, including the repercussions of irregularities in the performance-based assessment, is presented in [51]. Regarding the rules for EF idealisation specifically, although different criteria were proposed in the literature (e.g., [1,52,53,54]), no agreed rules have been unanimously yet recognised. Moreover, it was shown that, in general, the dispersion of the results increases with a pronounced irregularity in the opening patterns (e.g., [55,56]). Recent research ([55,57]), based on both numerical investigations and the analysis of the in-plane severe damage of real buildings, has highlighted that the criteria proposed in [1] give quite reliable results: thus, they were here assumed as a reference. Moreover, in general, it was verified that, in the model, the rigid nodes were not too big to limit the alterations induced to the wall stiffness. By way of example, 
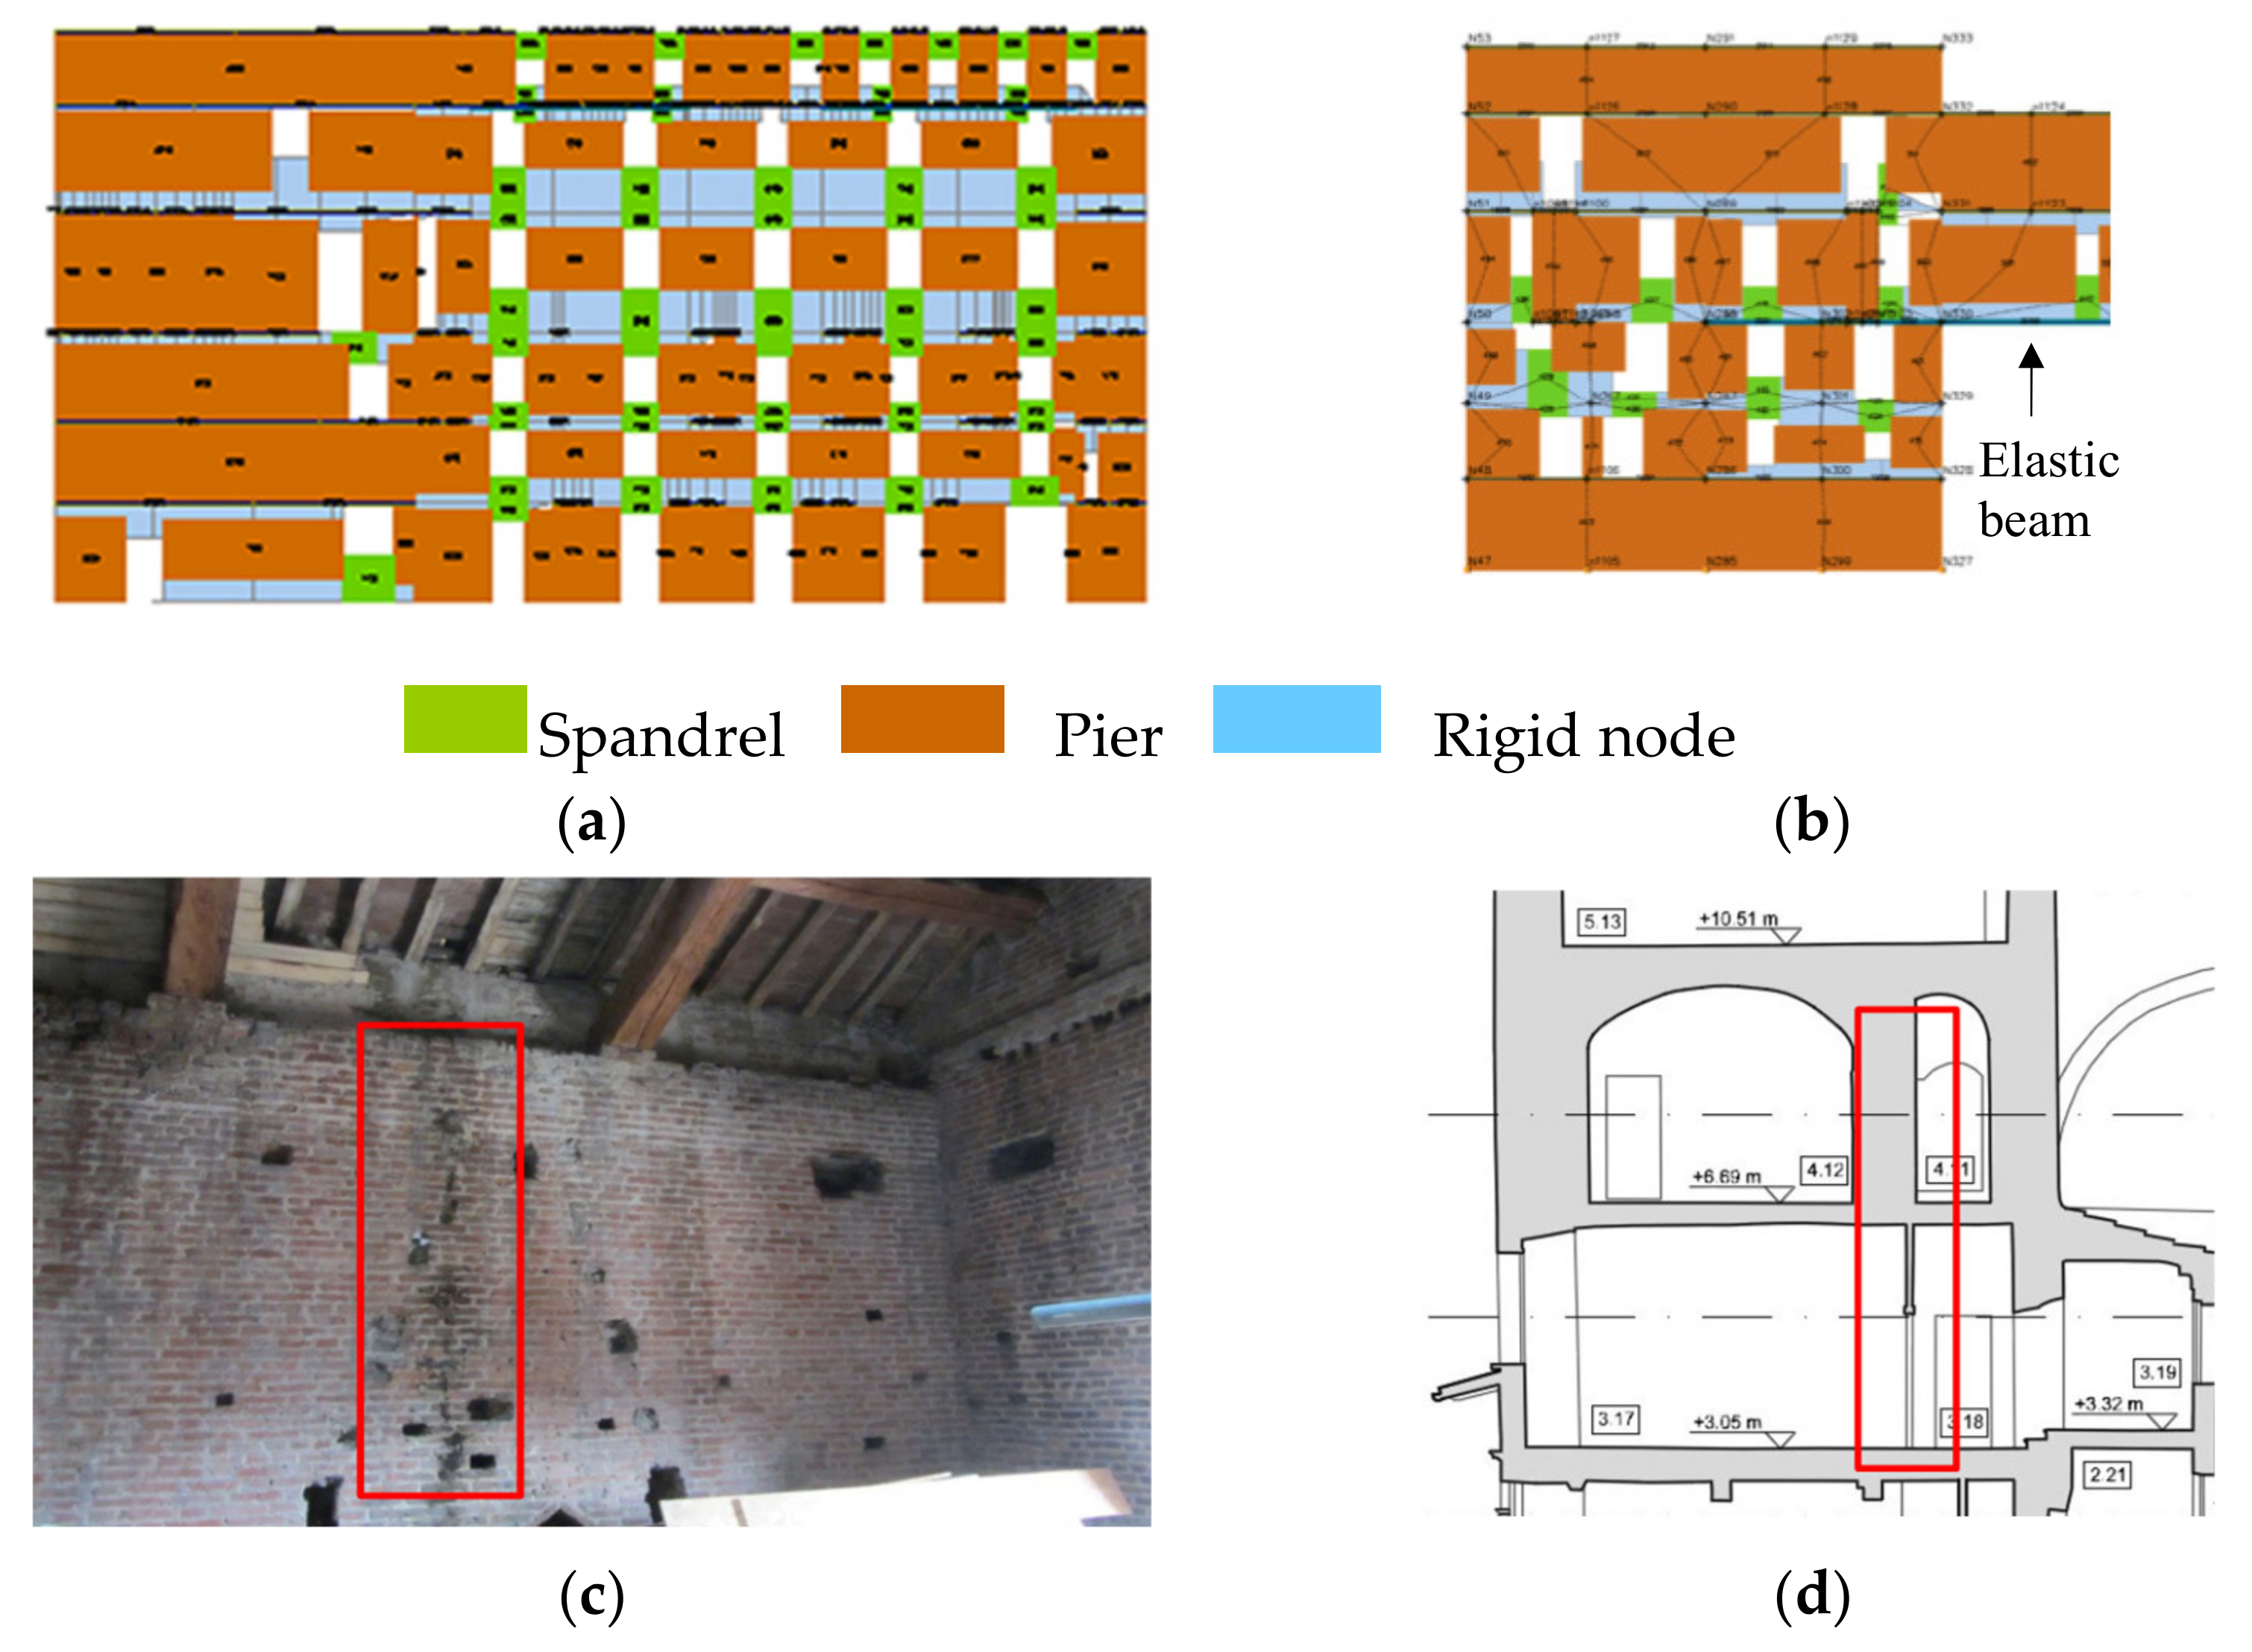
Figure 7a shows the EF idealization of the façade overlooking the Broletto square.
Apart from that, the setup of the EF model requires great care and accuracy in transferring as much information acquired during the knowledge phase as possible into the model (as discussed for example also in [27,50]). Some critical situations (Figure 7c,d) that may potentially reduce the strength and stiffness of structural elements (such as the presence of flues, recesses, infill openings, and non-continuous walls) were taken into account with specific expedients:
  • The flues and internal cavities were modelled as equivalent openings.
  • The recesses were modelled alternatively: directly as openings (with a height equal to the one detected during the in-situ inspections), if their thickness was higher than half thickness of the wall, or as URM panels with a thickness and height equal to those measured in loco.
  • All the buffered openings were modelled as URM panels with half the thickness of the original wall.
  • Elastic beams were introduced under all the non-continuous walls in order to allow a proper transferring of the actions at ground level through the adjacent elements (Figure 7b).
Starting from the 2D modelling of walls, the complete 3D model was obtained by also introducing diaphragm elements, modelled as orthotropic membrane finite elements. The equivalent elastic moduli were calibrated according to [40,58,59] for vaults and timber floors, respectively. The ability of the software to model flexible and stiff diaphragms as well is crucial for the building under examination, for which the adoption of rigid floors would be inadequate. A view of the global 3D model is presented in Figure 5d.
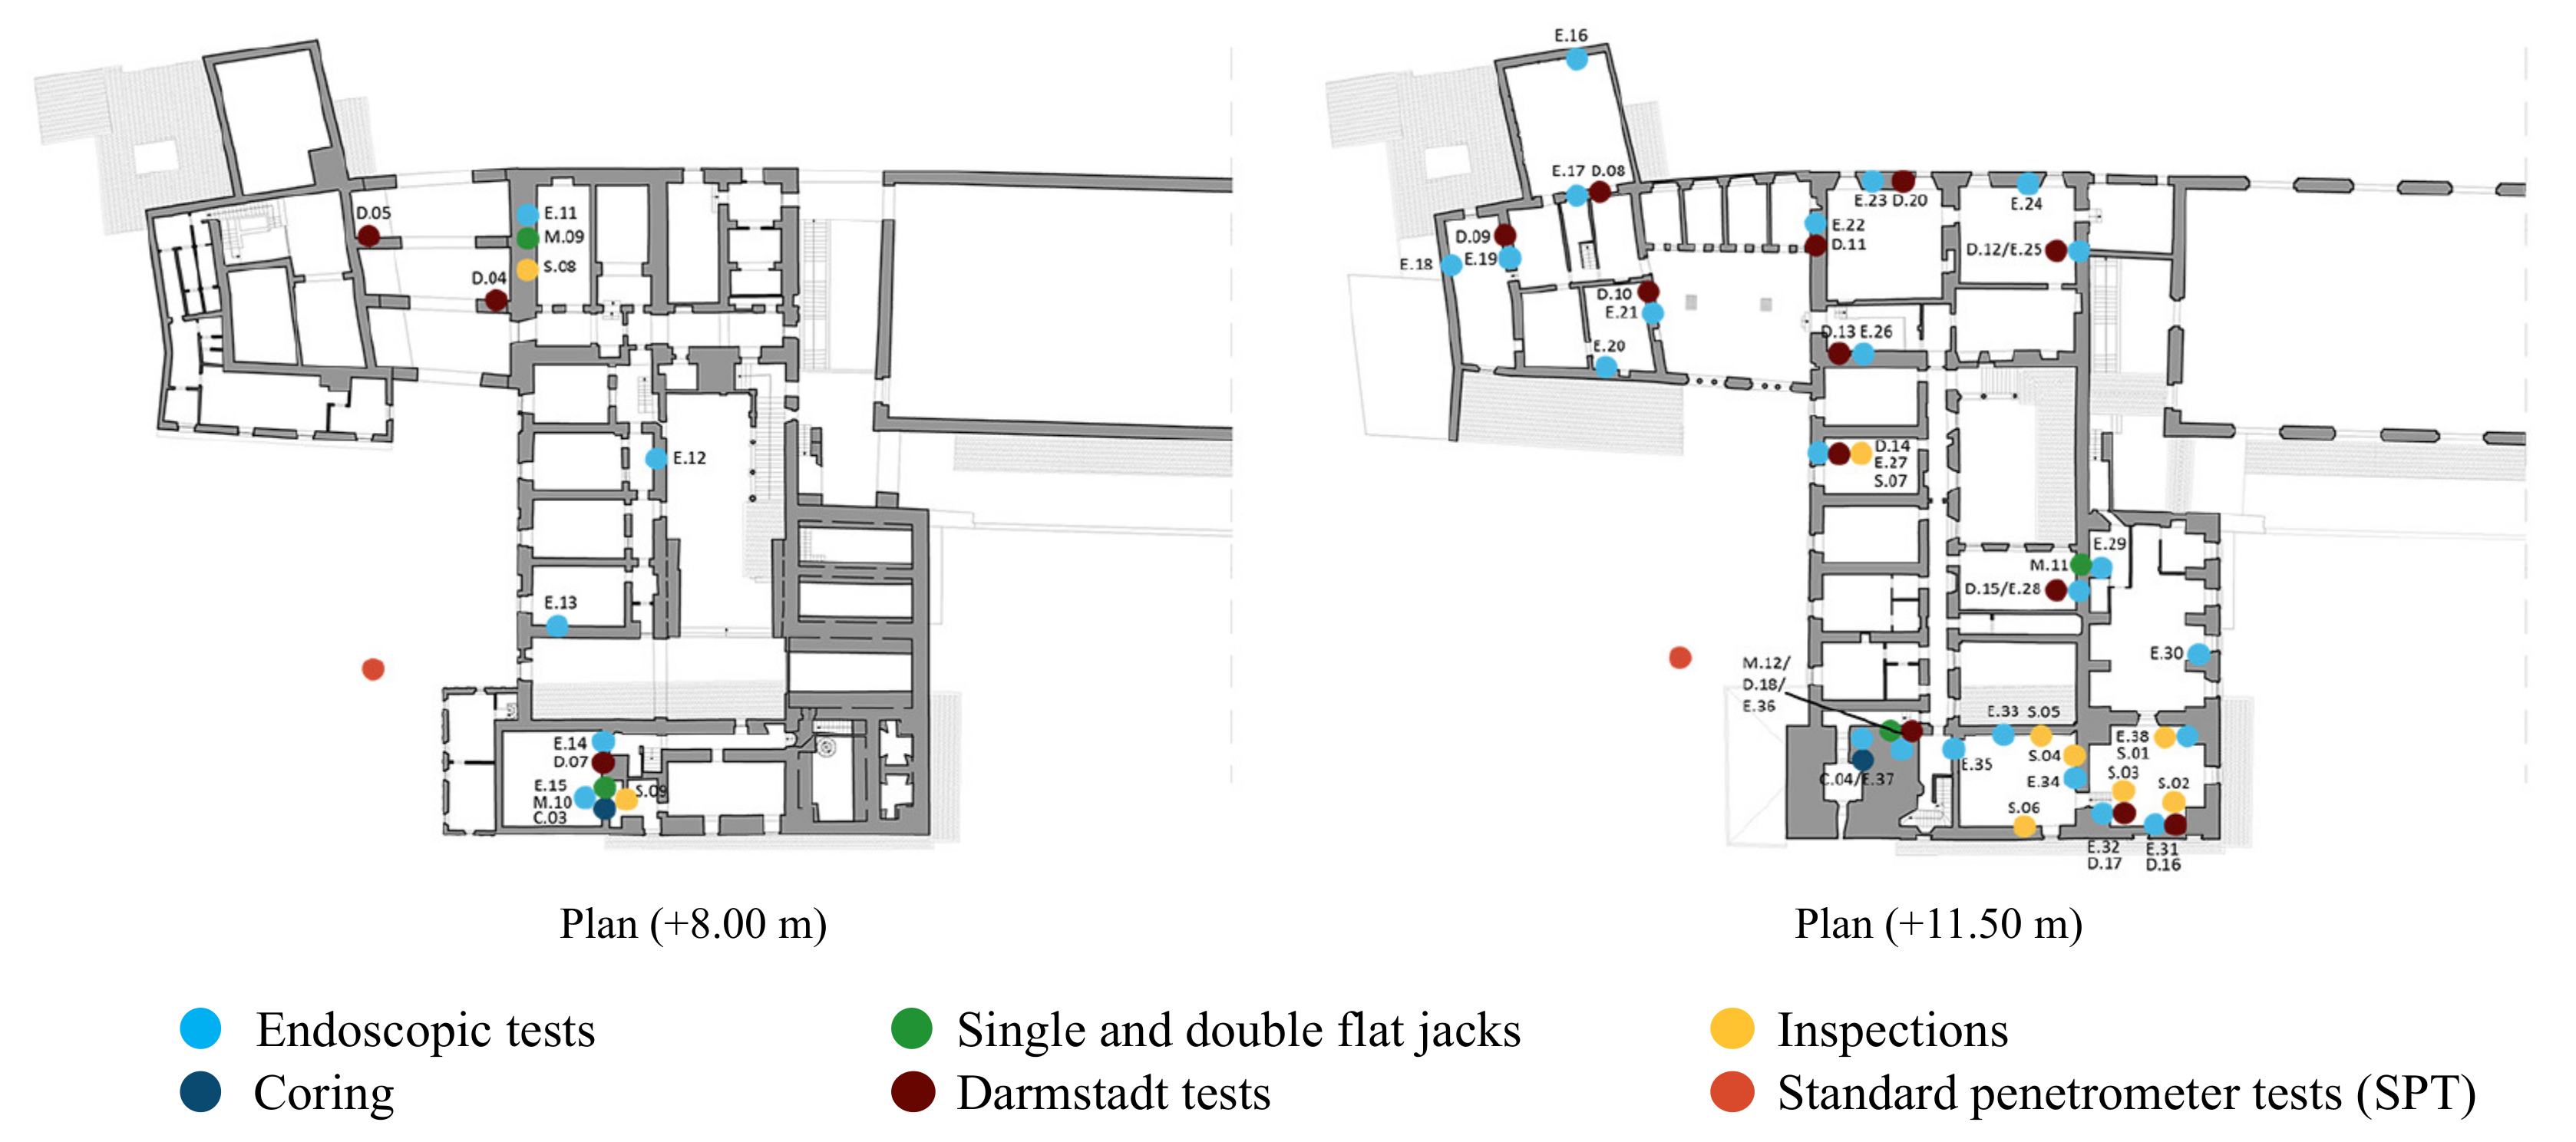
Table 2 presents the mechanical parameters assumed to describe the response of URM panels; the latter correspond to the mean values of the range proposed in the Italian Technical Code [17] for a masonry built with solid bricks and lime mortar. The adoption of these values was supported by the results of the available diagnostic techniques performed on the building (Figure 3). Moreover, they are also consistent with the results of in-plane cyclic tests on masonry panels available in the literature (e.g., [60,61]).
The strength values were reduced by applying a confidence factor (CF) equal to 1.2. This value corresponds to that proposed in Codes [15,16] assuming the attainment of a level of knowledge KL2 and, as known, aims to conventionally account for the residual uncertainties in the final assessment. In fact, despite the quite accurate knowledge acquired on structural details, the KL2 derives from the limited in-situ investigations on the materials, reduced in number to limit the invasiveness.
Both a linear modal and a nonlinear static analysis were performed on the model.
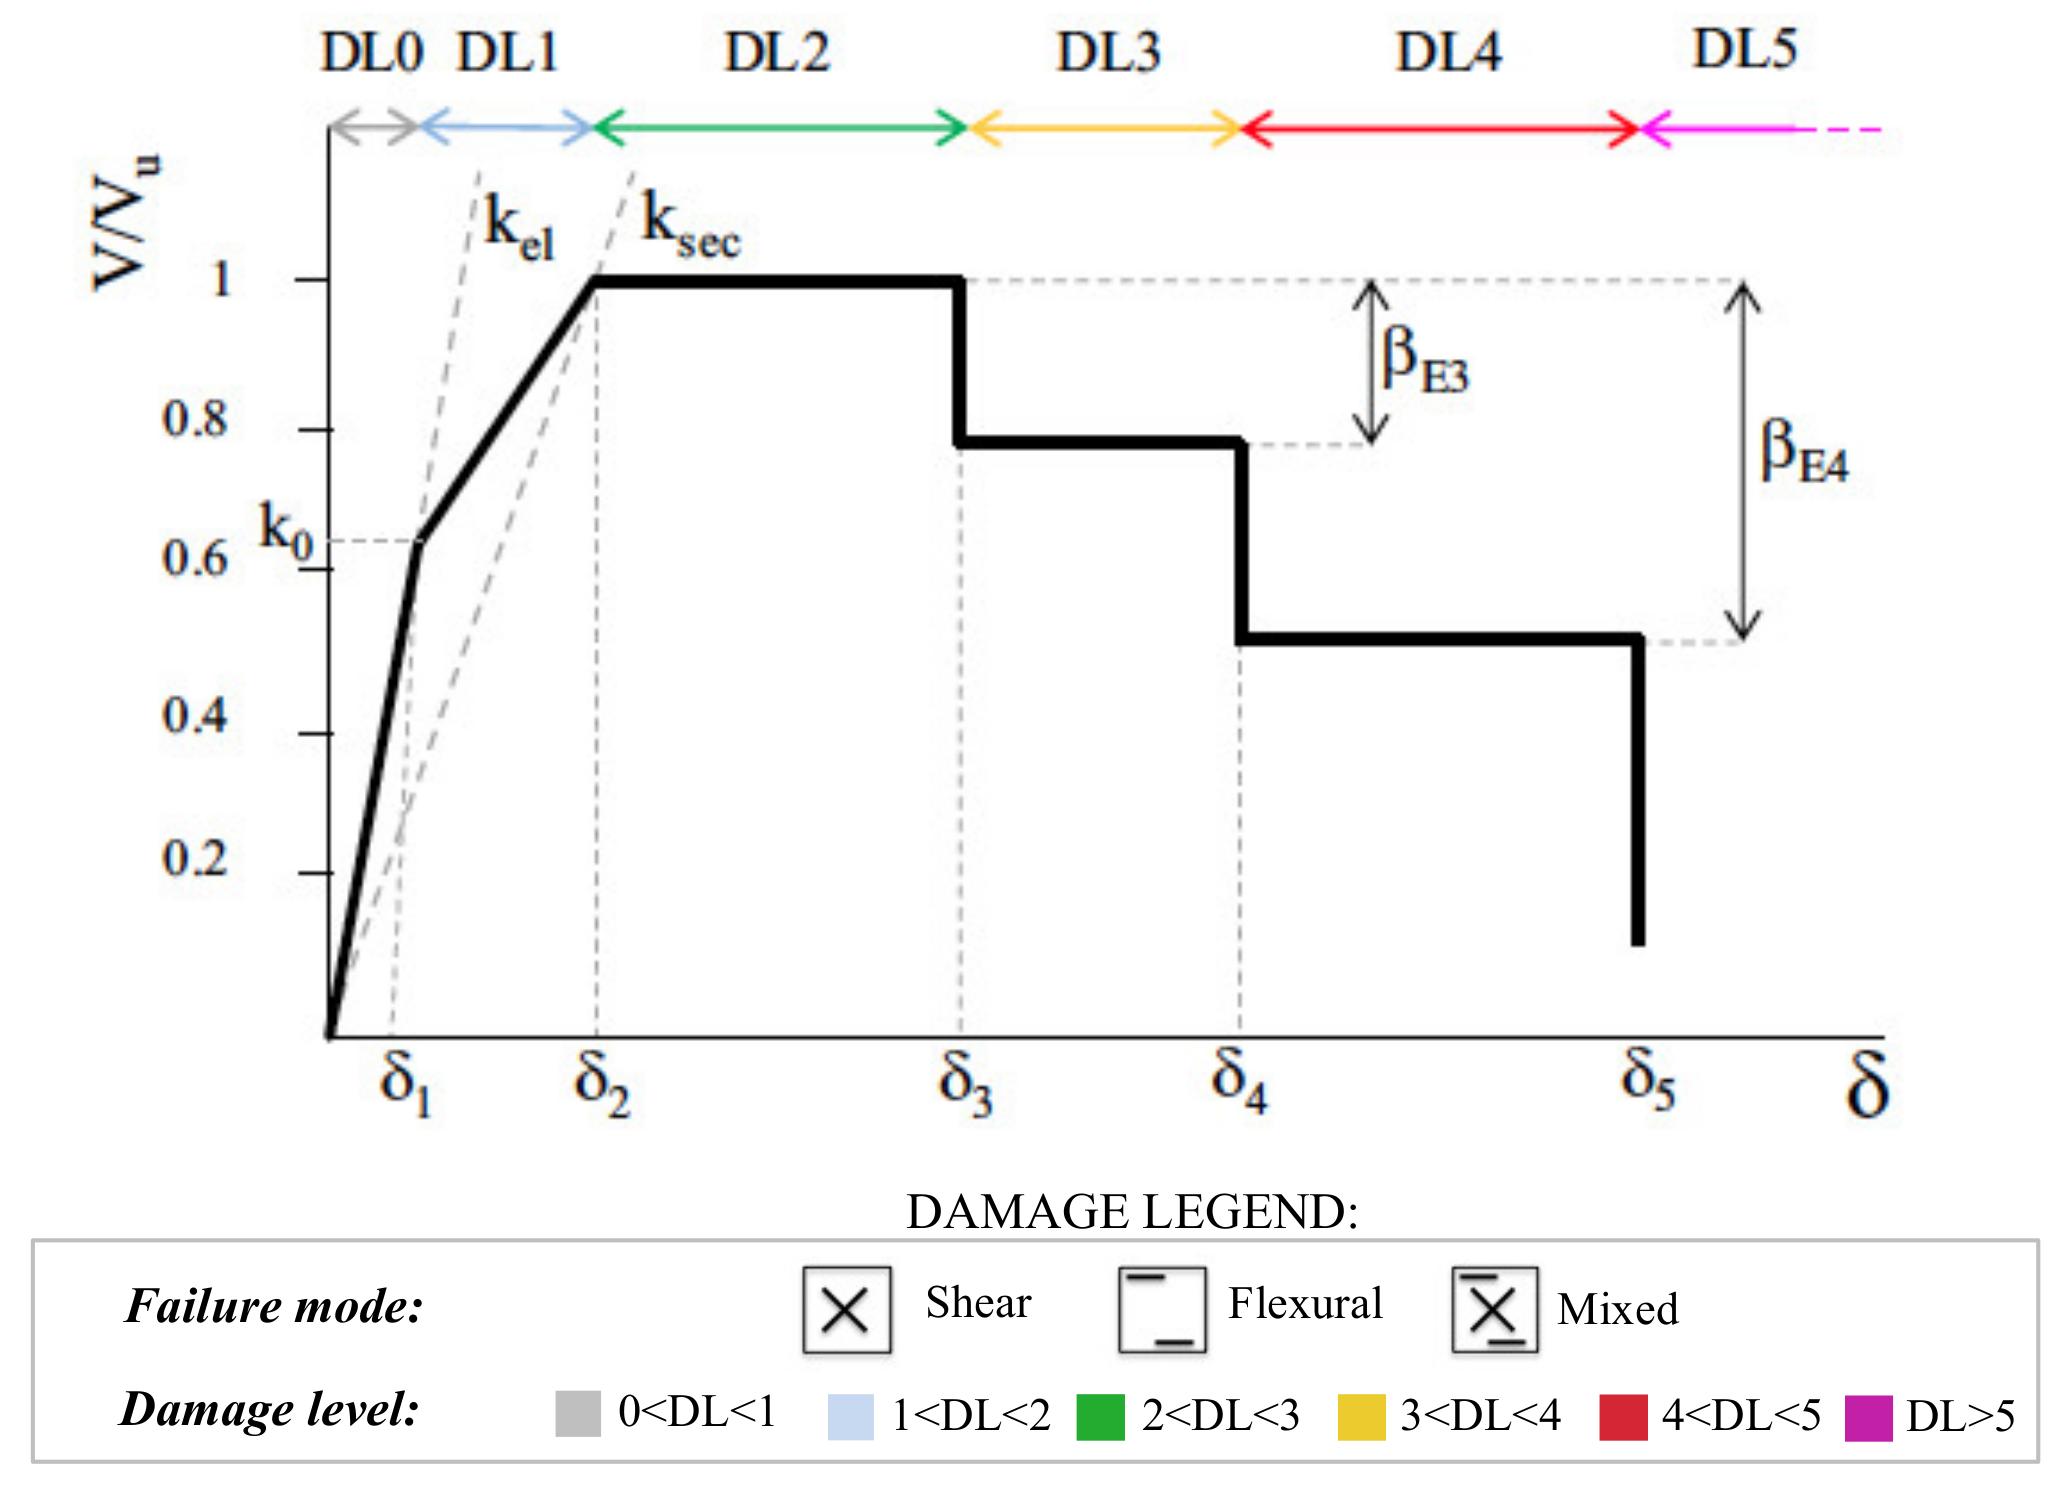
In the nonlinear field, the piecewise-linear constitutive laws proposed by [1,48] and implemented in Tremuri software were adopted to describe the response of masonry panels. This constitutive law (Figure 8) simulates the nonlinear response until very severe damage levels (from 1 to 5) are reached through progressive strength degradation (defined in terms of residual strength βEi) in correspondence with the assigned values of drift δEi; the latter are differentiated as a function of the different possible failure modes (e.g., rocking, diagonal cracking, bed joint sliding, or mixed modes) and of the element type (if spandrel or pier). The ultimate strength of URM panels is computed according to the strength criteria commonly proposed in the literature (e.g., discussed in [62,63]) and codes (e.g., in [15,16,40]) for regular masonry, as that under examination. Table 3 summarises the main parameters assumed in the nonlinear analyses for piers and spandrels. Drift thresholds are compatible with those indicated by recent databases that have collected the results of several experimental results [60]. In the case of spandrels, the assumed residual strength is justified by the presence of an effective architrave; the value is compatible with those proposed in [40].

4.2. Evidence from the Modal Analysis on the Interaction among Units

First of all, the modal analysis was performed to interpret the dynamic response of the whole palace. The results of the building in the original configuration (hereafter referred to as “flexible floors”) were compared with a stiffer one (hereafter referred to as “stiffer floors”), in order to evaluate the effects of a stiffening of the membranes on the global response. This stiffening aims to simulate the possible replacement of the original filler of the vaults (made by heavy incoherent materials and debris) with a new one, lighter but with non-negligible mechanical properties (see also Section 6). Thus, the simulation of this intervention also produces a decrease in the overall mass of the model.
Table 4 shows the main results of the modal analysis in terms of period (T), frequency (n), and percentage of participation mass (%Mx, %My, and %Mz). The results were illustrated by selecting the first 10 modes; the most significant ones in terms of participation mass are marked in grey. Although Mode 3 had >15% mass in the Y direction, it mostly activated the dynamic response of the Ragione Palace, which was not the main focus of the analyses; for this reason, Mode 3 is not highlighted in the table.
In general, it is possible to observe that the different units mutually interact in a very different way, considering the X or the Y directions. For example, in the Y direction, the Podestà Palace almost behaves as two distinguished bodies, i.e., the thirteenth-century unit overlooking the Broletto square and the fifteenth-century unit overlooking Erbe square. They are connected through highly flexible elements. Furthermore, the building overlooking the Giustiziati street strongly interacts with the Arengario and the Ragione Palace. Finally, the area overlooking the Broletto street is mostly affected by the interaction with the tower.
Figure 9 compares the most significant modal shapes in the X and Y directions, focusing on the area of the Podestà Palace and considering the two aforementioned hypotheses.
The areas subjected to the most significant distortions are the unit facing the Broletto square, due to the deformability of the vaults (see Mode 4), and the connection bodies (namely, 1 and 2 in Figure 9), due to the very different stiffnesses that characterised the linked units (Mode 6). Moreover, it is worth observing that these distortions are reduced in the case of a slight stiffening of the diaphragms. In fact, this produces more regular behaviour, guaranteeing a better redistribution of the actions.

4.3. Results of Nonlinear Static Analyses

This section presents the results of the global nonlinear analyses performed on the palace in the present state (namely, flexible floors). In particular, the following steps were executed:
  • Nonlinear static analyses were performed on the global EF model.
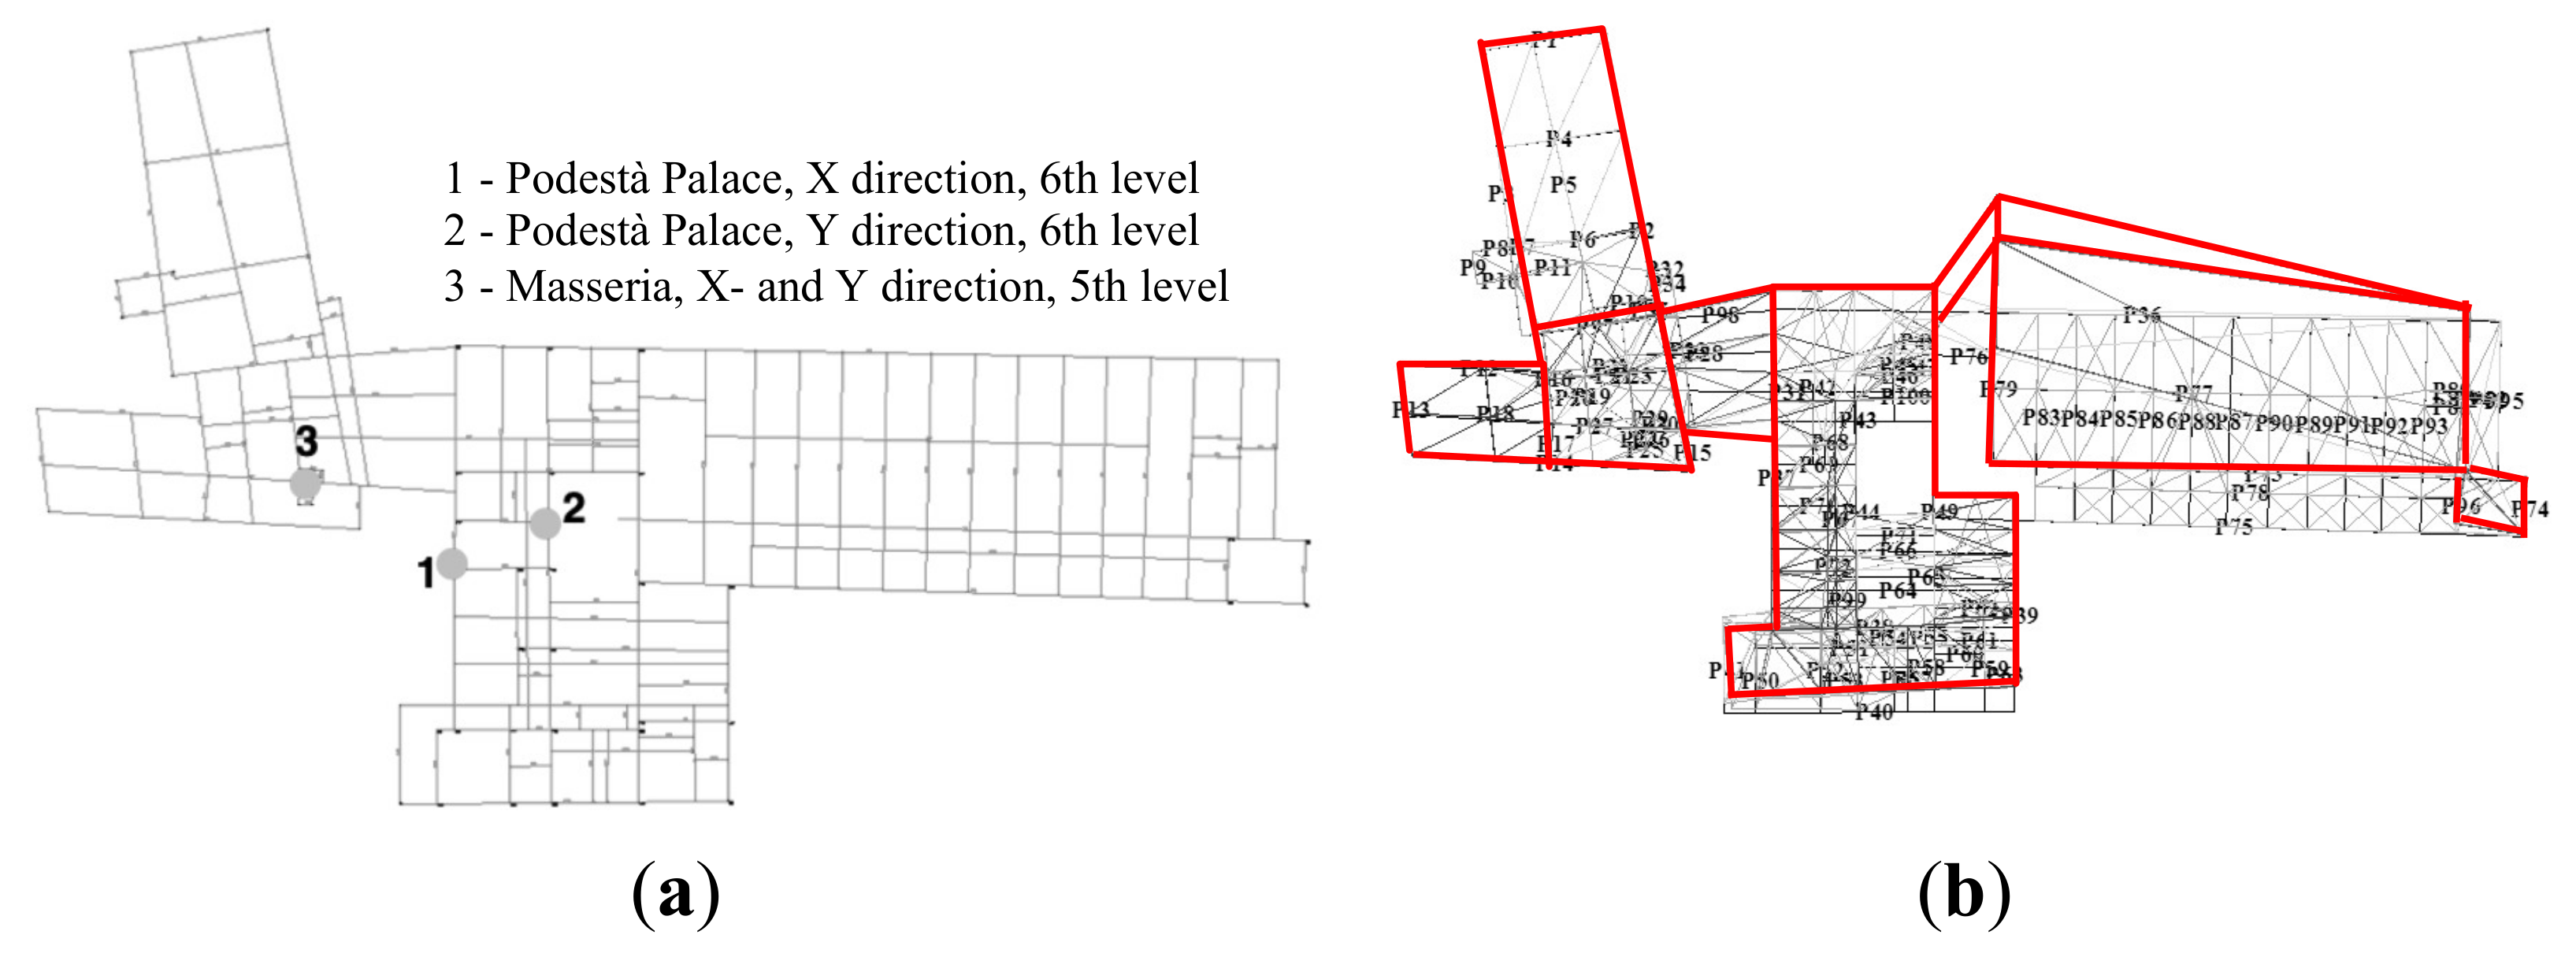
  • Pushover curves of each single unit were extracted by plotting the shear at the base of each body (V) as a function of the mean displacement of the nodes placed at the last floor in the same area (d). Different control nodes were defined for each unit in order to accurately describe its evolution of the nonlinear response (Figure 10a). In particular, Nodes 1 and 2 were chosen for the pushover analyses performed on the Podestà Palace in the X and Y directions, respectively, while Node 3 was defined for the Masseria.
  • The corresponding capacity curves (V* − d*) of the equivalent Single Degree of Freedom (SDOF) system were defined, by following the general principles of [64], based on the evaluation of the participation coefficient Γ and the mass M* of each unit (having extracted from the 3D model the data related to each of them). Thus, each capacity curve was obtained by dividing the displacement d by Γ (d* = d/Γ) and the base shear by the product ΓM* (V* = V/(ΓM*)), where Γ and M* were related to the unit under investigation.
  • Finally, for the seismic verification, the capacity curve of each unit was compared with the seismic demand.
The choice of the load pattern in such a complex case represents a tricky point, since the modal analysis highlighted several modes characterised by a moderate participant mass.
The use of a single load pattern kept invariant during the analysis may appear questionable, but other possibilities, such as the multimodal ([65,66]) or adaptive [67] pushover analyses, are, compared to that under investigation, equally poorly validated in the context of complex URM monumental buildings. Of course, nonlinear dynamic analyses (NLDA) would have represented a valuable alternative to more accurately investigate the effect of higher modes and describe the inertial forces activated. However, the execution of NLDA, besides requiring a significant increase in the computational effort, was beyond the scope of this research, mainly addressed at this stage more at integrating the use of different modelling approaches than at deepening the reliability of traditional nonlinear static analyses of URM complex aggregates. Thus, following an engineering-practice approach, the analyses were herein performed by adopting, for each examined direction (+X, −X, +Y, and −Y), two different load patterns (LPs): proportional to masses (hereafter referred to as “uniform”) and proportional to the product mass per height (hereafter referred to as “pseudo-triangular”). Afterward, in order to ensure that the effects associated with higher modes were not underestimated, a flat rate increase of the participant mass was introduced, directly acting on the conversion of the SDOF. In particular, in those cases in which the activated mass of the equivalent SDOF system (e*) resulted in lower than 75%, the values of ag,LS were increased by a corrective factor equal to e*/0.75. Future development of the research will be addressed to apply the procedure proposed in [26], which involves the application of a set of LPs calibrated on the basis of results of the modal analysis and aimed to activate the inertial forces in different portions of the buildings.
Figure 10b shows the deformed shape of the whole monument obtained in the +Y direction by applying the uniform LP distribution (which was the most punitive in terms of verification for the Podestà Palace). The results refer to the analysis step corresponding to a 20% decay of the base shear, assumed as representative of the Life Safety limit state (SLV). In particular, the deformed shape highlights a seismic behaviour that is ruled by the presence of the connecting bodies (Arengario and Podestà’s vaults).
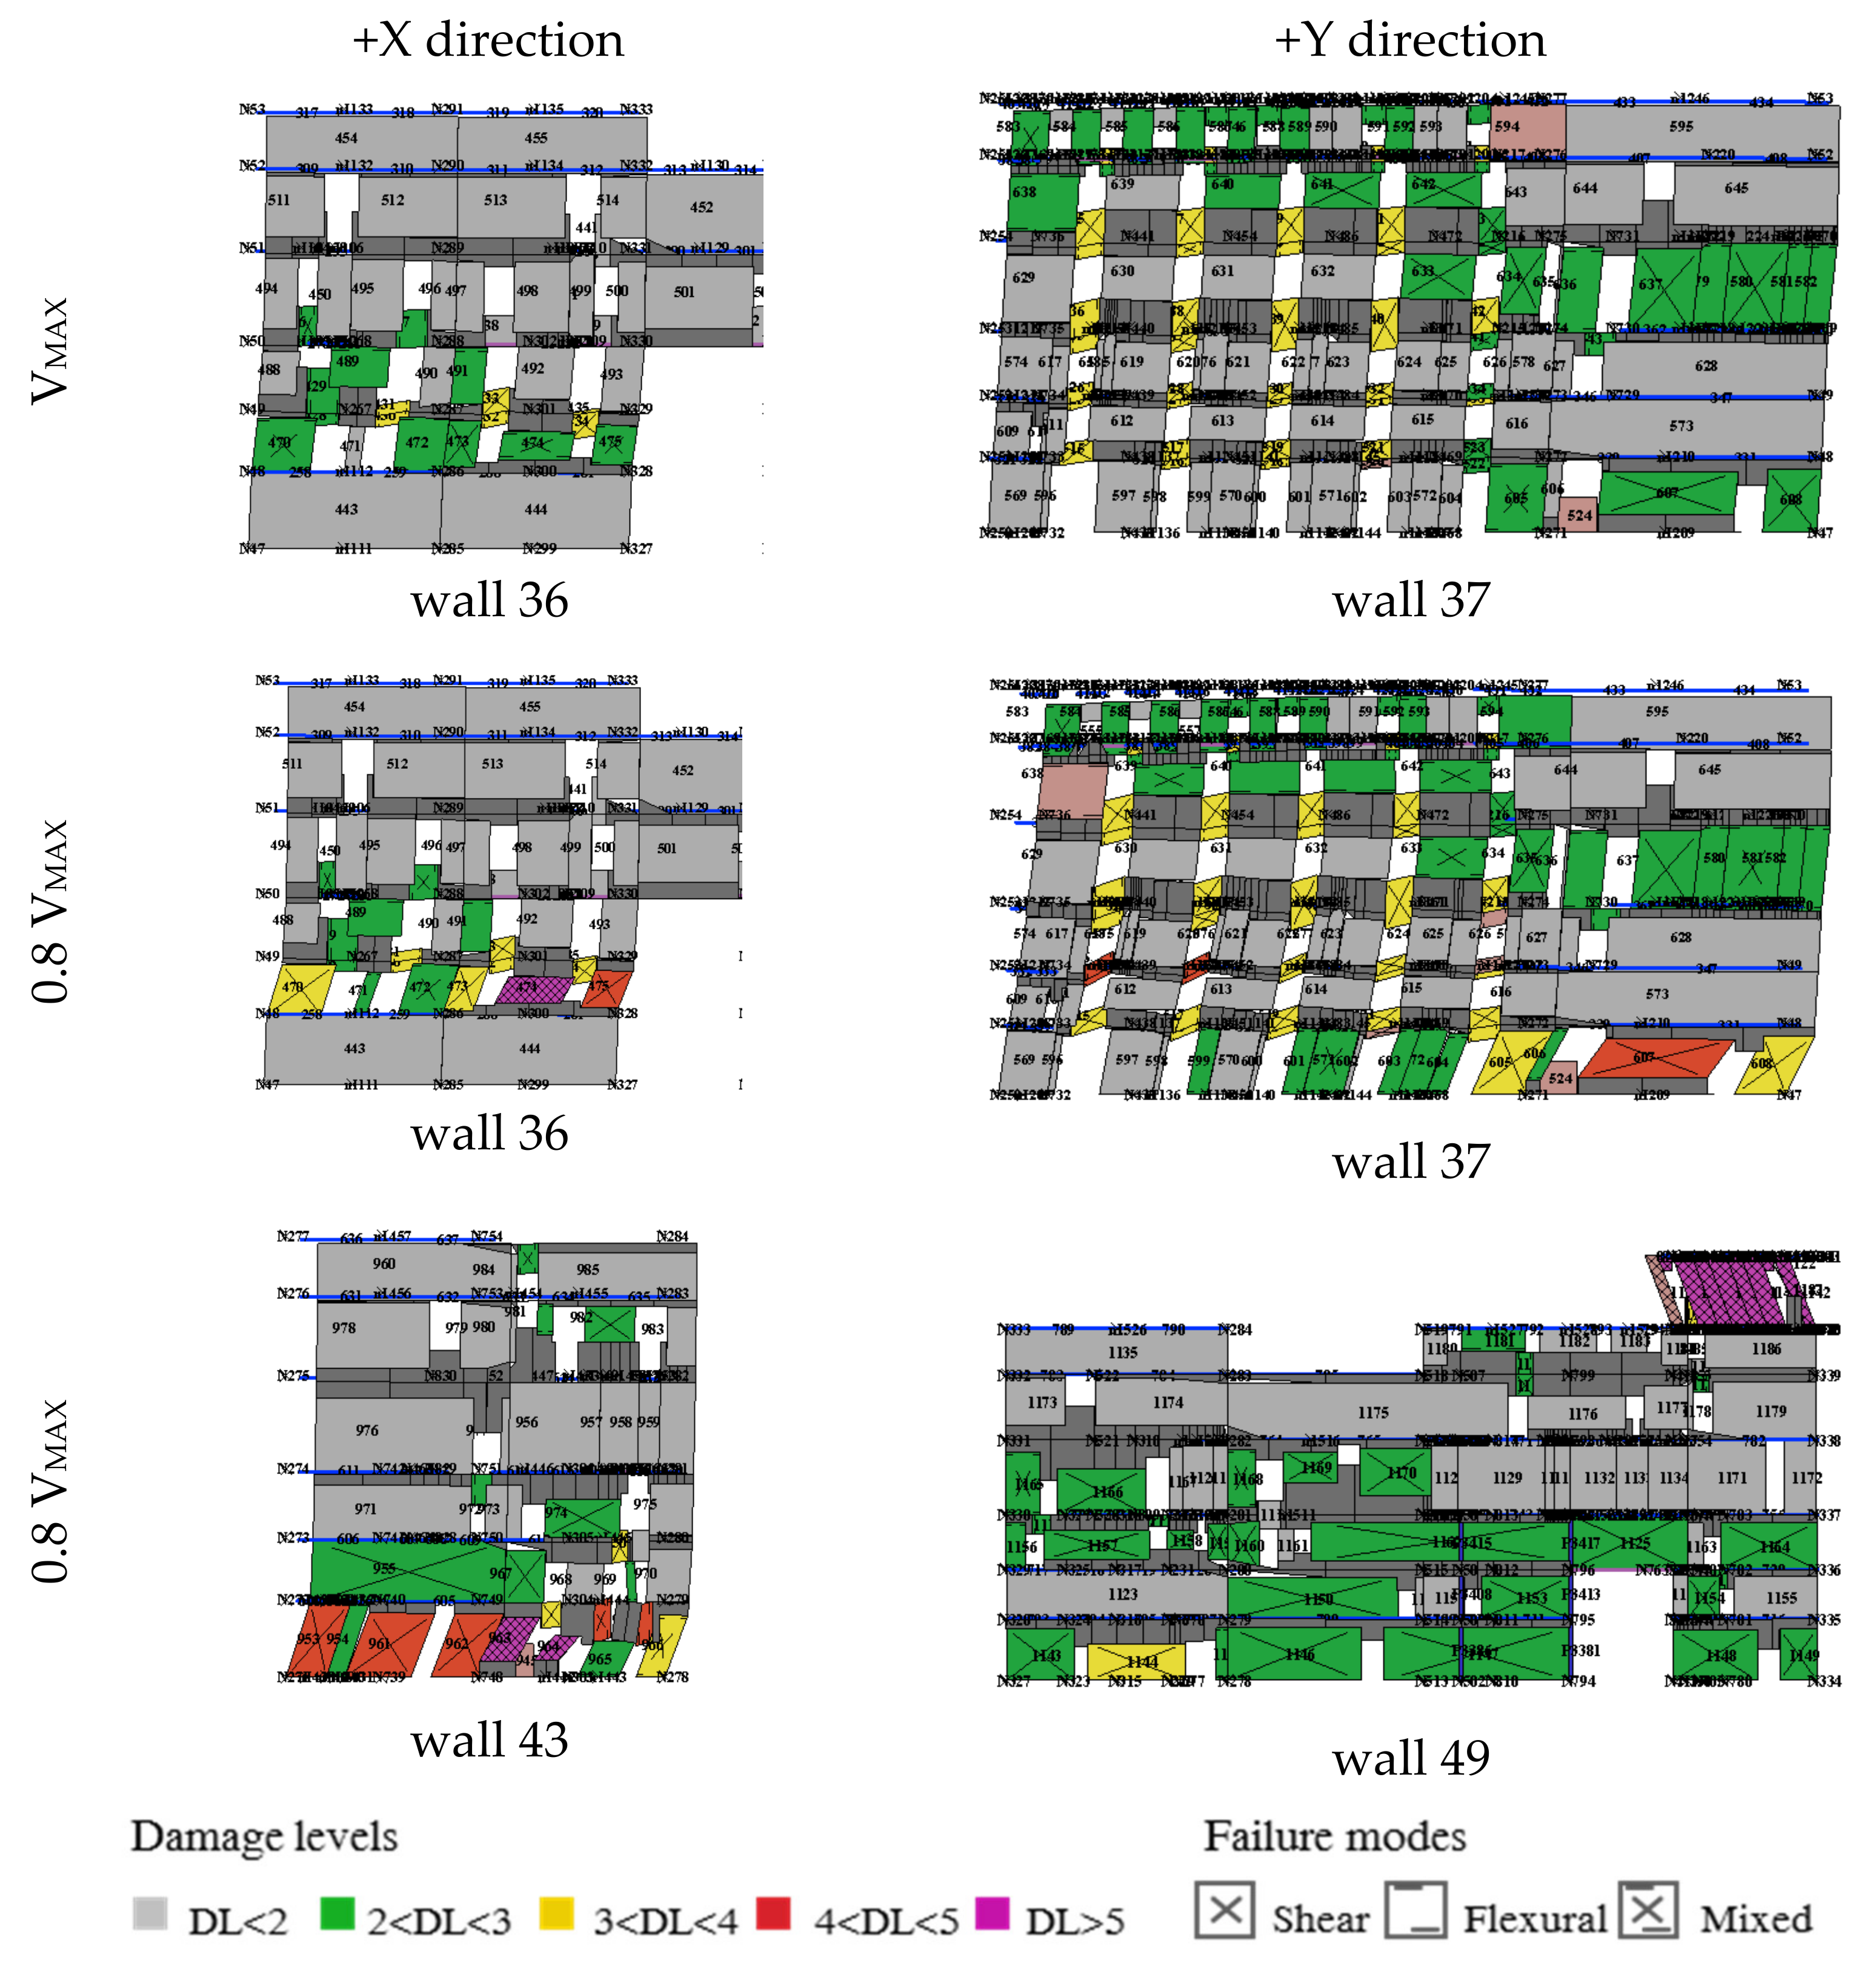
Figure 11 illustrates instead the damage pattern of some walls of the Podestà Palace (enumerated as in Figure 9a) in the +X and +Y directions in correspondence with the maximum shear Vmax or of 0.8 Vmax.
As is possible to see, for both directions, the recurring damage mechanism is soft story behaviour, placed in particular at Levels 2 and 3. Furthermore, the damage pattern highlights the vulnerability of the standing-out part of the fifteenth-century unit overlooking the Erbe square and the Broletto street. In the Masseria, instead, the damage is more pronounced in the X direction (mainly in the piers), but more spread out at the different levels. The most severe damage level is concentrated at the top levels, which are less confined by the adjacent bodies.
Finally, Table 5 illustrates the main parameters assumed in the seismic verification: participant mass PM; the corrective coefficient e*/0.75 applied to ag,LS; Γ and M* computed according to [15,64]; the safety index (αSLV), calculated as ag,SLV/ag,Site,SLV. The seismic demand refers to the response spectrum for the site of Mantua, evaluated assuming soil C, a nominal life VN of 50 years, and a class of use IV (important and strategic structures). The value of ag,SLV was computed by applying the N2 method [64] through the expressions proposed in the Italian Technical Code [16], by imposing the equivalence between the maximum displacement demand of the anelastic system d*max and the maximum displacement capacity du*.
The results of Table 5 are illustrated only for the most punitive analyses, which are performed by applying a uniform (U) load pattern for the Podestà Palace and a pseudo-triangular (PT) load pattern for the Masseria. In particular, it is interesting to observe that, for Masseria, the most punitive directions are +X and −Y, for which this unit is less influenced by the presence of the restraint provided by the adjacent buildings. As can be seen, the ratio αSLV is higher than 1, except for in the analysis in the +Y direction for the Podestà Palace (although close to 1).

5. Analysis of the Arengario Connecting Body

This section presents the results of the analyses performed on the Arengario, the unit that links Masseria with the main building of the Podestà Palace. This connecting body is founded on four large arches set up on pillars with their own foundations. The arches support the two facades and an internal wall inside and decrease the span of the floor of the highest room (Figure 12a,b). The spans between one arch and the other have different dimensions: the first one (on the Broletto square) is about 4.5 m, the intermediate one is 3.5 m, and the last one (overlooking the Giustiziati street) is a bit higher. Furthermore, the arch spans are slightly different, and the entire three spans have a trapezoidal shape. The four large brick arches (Figure 12c) support a timber floor (Figure 12d) and two floors above, covered by another timber floor and the timber roof, respectively.
The analysis of the global response and the results of the modal analysis (Section 4.2) clearly showed that the Arengario was one of the most vulnerable unit of the palace and possibly subjected to significant distortions. The damage occurred after the Emilia earthquake in 2012 and showed a significant damage pattern, made of non-negligible cracks and deformations; although they probably partially already existed before the seismic event, these cracks were worse (Figure 12d). Moreover, the analysis of the constructive details highlighted that the thrusts of the four arches were not adequately counterbalanced, due to the lack of internal walls in the Masseria and in the Podestà Palace (Figure 12a).
The following sections present the results of the nonlinear analyses performed in ANSYS [68] on an FEM model representative of this unit. In particular, the central arch (referred to as “arch A” and marked in red in Figure 12a) was considered as representative of the entire arch system of the Arengario. This arch was selected as the most vulnerable, since it is characterised by the complete lack of a contrast element in both the two adjacent bodies.

5.1. Geometrical and Numerical Model

The 3D geometrical model was developed in AutoCad 3D and includes the arch, its filler, the supporting pillars, and the supported wall (with doors and windows), up to the roof level. In order to address the mesh more efficiently, the model was discretised in volumes individuated on the basis of the presence of openings, different thicknesses, arch division in blocks, etc. Figure 13 presents the 3D geometrical (a,b) and structural (c) models. The structural model was realised using an eight-node 3D solid element (solid65 in the ANSYS library), defined by orthotropic material properties and able to simulate both the linear and nonlinear behaviour of materials. Consistently with what is already illustrated in Section 4.1, the mechanical properties of masonry were derived from the reference values of the Italian Technical Code [16,17] for a masonry made of solid brick and mortar joints. The following values were assumed: Young Modulus Ex = 1600 N/mm2; Poisson Coefficient PRxy = 0.2; density ρ = 1800 kg/m3.
Concerning the loads, they were modelled as volumes with proper values of density. Table 6 summarises the computed values and the corresponding mass associated with the volume added on the arch in the FEM model. Following the same logic, an additional load was then introduced on the biggest arch pillars, corresponding to the timber floor at the first level of the Masseria (equal to 120.18 kg). Finally, the Mery’s method was applied to compute the thrust transmitted to the Arengario by the barrel vault placed just close to it (n. 201 in Figure 12a).

5.2. Results of Nonlinear Static Analyses

Nonlinear static analyses were performed in ANSYS by applying, firstly, the gravity load and, afterwards, a horizontal acceleration equal to 0.15 g (in six progressive sub-steps, see Table 7) in the longitudinal direction. The latter aims to simulate the seismic demand computed from the design response spectrum at the SLV evaluated in correspondence with a period of 0.47 s; this reference value corresponds to that derived from the modal analysis performed on the Podestà palace (selecting the mode pertinent for the response of the Arengario).
Such an analysis was carried out more to interpret the seismic behaviour of this unit than to execute a rigorous seismic verification. The following stress states were analysed: the circumferential stress (Sy) along the arch, evaluated with respect to a cylindrical local coordinate system (Figure 14), and the vertical stress (Sz) and the main tensile stress (S1), evaluated with respect to the global coordinates system (Figure 15).
From the analysis of the deformed shape and stress state of the arch (Figure 14), it is possible to observe how the arch tends to open itself as a result of the progressive separation of the pillars.
Figure 15 shows that, even when starting from the application of the gravity load, the areas close to the pillars and to the arch keystone are subjected to the most significant stress state. In fact, while the pillars are characterised by a significant compression stress, the area near the arch keystone is subjected to tensile stress. When analysing Sz (Figure 15), it appears that the worse situation corresponds to the applied horizontal force equal to 0.15 g. In many areas close to the pillars and in the piers between the openings on the arch (in grey in the figure), the maximum detected stress is higher than the reference admissible one (assumed equal to 200 MPa for the masonry under examination). Finally, by considering the stress S1, it is interesting to observe that this stress has a diagonal trend, starting from the pillars until the arch keystone. The pillar on the right is the most critical one, as it is characterised by the highest values of stress and displacements: this is probably due to the lack of contrast to the arch thrust in the adjacent Masseria unit.

6. Directions for the Retrofitting Strategies

The analyses illustrated in the previous sections mainly highlighted the following:
  • The usefulness of increasing the stiffness of some diaphragms, as pointed out by the global analysis through the SEM model (Section 6.1);
  • The need to improve the arch system of the Arengario connecting body, from both static and dynamic points of view (Section 6.2).

6.1. Possible Stiffening Strengthening Interventions of the Vaults

Regarding the first point (1), while different well-known strengthening intervention techniques can be adopted for timber floors to ensure a certain in-plane stiffening (as discussed, for example, in [59,69,70,71]), in the case of vaults, the issue is more complex. Though their contribution is often neglected, they may exhibit a non-negligible stiffness in the horizontal plane even from their original state, which, without specific interventions, can significantly decrease with the onset of cracking due to the seismic event, even for low levels of angular deformations ([58,72]). Especially for barrel vaults (which are quite common in the examined building), there is another problem: they transfer the loads only to the internal walls, while the arches are not connected to the external walls in the façade. This was also evident from the analysis of the damage pattern, which highlighted cracks spread in the vaults located at the interface with the orthogonal walls (Figure 16a,b).
In order to better understand the contribution provided by the vaulted system in the horizontal action repartition among walls, the prototype barrel vault identified in Figure 16c was analysed through an FEM model [68]. In particular, nonlinear static analyses were parametrically executed in order to investigate the sensitivity to different strengthening techniques aimed to gradually increase the stiffness of the membranes and the wall-to-wall connection.
The examined vault is placed at the fifth level of the thirteenth-century unit overlooking the Piazza Broletto (Figure 16c). It was selected as representative of many vaulted rooms in the Podestà Palace, analogous for its typology and dimensions. The brick vault covers a 4.16 × 6.82 m room (1.4 m height) and is characterised by a structural thickness of 30 cm. Figure 17 shows the 3D geometrical model realised in AutoCad 3D (a) and the FEM model developed in ANSYS (b). Besides the barrel vault itself, the model includes the two walls that support the vault, the filler, and the transversal walls parallel to the directrix of the arch.
Each configuration considered was aimed to simulate the effect of a different strengthening intervention:
  • Model 1a is representative of the present state, characterised by a heavy and incoherent material as filler and by no wall-to-wall connection with the transversal walls, as the post-earthquake damage highlighted.
  • Models 2a and 3a indicate the effects connected to an in-plane stiffening of the vault obtained, replacing the incoherent filler of Model 1a with a light, non-stiffening one (Model 2) or with a light, stiffening one (Model 3).
  • Configurations b and c—tested in Models 1 and 3—indicate the possible benefits achieved by improving the wall-to-wall connection. In particular, two possible interventions were considered: a cuci-scuci intervention (b), realised only locally at the intersection of two orthogonal walls in order to improve the interlocking by a proper arrangement of blocks, and a more effective and continuous connection obtained through the realization of a reinforced masonry curb (c) (e.g., with two steel plates—one for each side of the wall—transversally pinned and properly anchored in the façade).
  • Configuration d—tested in Model 3—indicates the further increase of stiffening produced by the insertion of X cables (eventually equipped with dampers or fuses as described in [73]).
Table 8 summarises all examined configurations, for each model.
The FEM model was realised by using an eight-node 3D solid element (solid65 in the ANSYS library) for the walls, the vaults, and the filler (in the present state) and the RC slab or the masonry curb (in the design state) and a link element (link180 in the ANSYS library) to model the X cables in the design state. The assumed orthotropic material properties are listed in Table 9.
In order to conventionally simulate the state of the vault inserted into the actual building, concentrated masses were imposed in correspondence with the base of the two adjacent vaults not explicitly modelled (of an entity equal to half mass plus the filler); moreover, horizontal forces, equivalent to the thrust transmitted by the vaults and the filler of the adjacent cells, were applied.
After the application of the gravity loads, nonlinear pushover analyses were performed (Table 10) by applying incremental horizontal forces proportional to the masses separately in both longitudinal and transversal directions. In particular, the seismic analyses in the longitudinal direction aimed to evaluate the shear action activated in the vault due to the different deformability of the two longitudinal walls (in fact, one was a side wall, while the other was characterised by two openings as depicted in Figure 17). Instead, the seismic analyses in the transversal direction aimed to evaluate, for each design solution, the capacity of the vault to transfer the inertial actions to the transversal walls.
In the case of Models 2 and 3d, to simulate the actual stress and deformed states already present in the URM system before the realization of the intervention, analysis was performed by using specific tools available in ANSYS that allow one to activate some elements only in certain steps of the analysis. Thus, the slab and cables were activated only after the application of the gravity loads.
In the nonlinear field, a “smeared cracking” constitutive law was used. In particular, the following properties were assumed: a tensile strength (ft) equal to 0.2 MPa, for Models 1 and 2, and to 0.1 MPa, for Model 3, and a compression strength (fm) equal to 4 MPa, for Models 1 and 2, and to 6 MPa, for Model 3.

6.1.1. Response to the Gravity Loads

Figure 18 shows, for Models 1a, 2, and 3c, the vertical stresses SZ in the walls. The figure shows that the highest values of compressive stresses are in the present state, due to the higher weight of the filler, especially in the wall with openings. The comparison between Model 2 (with the RC slab) and Model 3c (with the light and stiffening filler and the reinforced masonry curb) shows that, in the first case, the stresses are higher due to the major thrusts that occur. Furthermore, tensile stresses can be observed in correspondence with the link between the slab and the wall.

6.1.2. Seismic Response in the Transversal Direction

Depending on the level of wall-to-wall connection, the results of the three models (1, 2, and 3) differ in terms of the transfer of the inertial actions from the longitudinal to the transversal walls.
In Model 1a (present state), no redistribution is possible; in this case, the analysis shows the maximum horizontal acceleration capacity by relying only on the longitudinal walls that are out-of-plane-loaded. Conversely, in the other cases, different percentages of actions are transferred to the transversal walls for the different values of the horizontal seismic accelerations. The last column of Table 8 summarises, for each model, the percentage (%) of seismic actions transferred to transversal walls. In that way, it is possible to quantify the effects of the replacement of the original filler with a light or stiffening one (passing from Model 3c to 1c). Any substantial increase may be recognised. It is useful to specify that, in a precautionary way, the FEM model does not consider the contact between the transversal walls and the filler, which, in reality, may determine a confinement action with respect to wall deformation.
Figure 19 shows the deformed shape of the vault springer line in the different models:
  • In the case of Model 1b, the vault has a significant deformability, with horizontal displacements in the centre of the springer line (2.7 mm), which is significantly higher than that of the edges (2 mm), where the wall is connected to the transversal walls.
  • The insertion of a curb (Model 1c) slightly increases the transfer of the actions to the transversal walls and, as a consequence, the displacements (1.7 mm instead of 2 mm), but it does not affect the in-plane stiffness of the membrane.
  • The use of the light and stiffening filler (Models 3b and 3c), instead, significantly decreases the vault deformation, whose springer line almost remains horizontal. The more significant transfer of the actions to the transversal walls determines a decrease in displacements, which at the edges of the wall are slightly higher than 1 mm. Analogous results are obtained through the insertion of the RC slab (Model 2).
  • Finally, with the strengthening intervention with X cables and no wall-to-wall connections, the displacements are higher (3 mm), but the cables are able to limit vault deformation in the central part. The use of such cables, together with the improvement of the wall-to-wall connection, may thus represent an alternative solution when the light and stiffening filler cannot be realised (to limit the invasiveness at the extrados) or if it is characterised by an insufficient thickness.
Finally, Figure 20 shows the vertical stresses in the walls. It is clear that the stresses in the longitudinal walls are significantly higher in Models 1a and 1c than in the others. Obviously, in Model 1, the inertial action on the barrel vault has to be absorbed only by the walls that are out-of-plane-loaded, but the presence of the curb only is not sufficient to limit the stresses.

6.2. Benefits from the Improvement of the Static and Dynamic Response of Arengario

Finally, to improve the arch system from both a static and dynamic point of view (Point 2 of Section 6), the intervention discussed in the following consists in the addition of an intrados tie rod system. Two different solutions were studied:
  • Sol (i): a tie rod placed upon the arch springing level. This leaves a clear path for traffic flow.
  • Sol (ii): a tie rod placed in the springer area, where the main thrusts of the arch are concentrated and where the major displacements were detected.
The tie rod was modelled in the FEM with a link element (link10 in the ANSYS library [68]), characterised by a steel material where E = 210,000 N/mm2, PRxy = 0.3, ρ = 7860 kg/m3. Table 11 summarises the steps of analyses performed. Similarly to what was already described in the case of Models 2 and 3d, in order to more realistically simulate the insertion of the tie rods in a deformed configuration, the tie rod effect was activated only after the application of the gravity load of the URM elements.
Figure 21 shows the stress state at the end of Set 3.6 in the two different hypotheses of the intervention. It is clear that tie rods placed at the lowest height determine a stress reduction. The effectiveness of Sol (ii) is also evident from Figure 22, which shows a comparison in terms V (shear at the base of the pillars) vs. Δl (relative displacements between the pillars).
Until V = 300 N (corresponding to Set 3.4), the trend is almost equal in the two solutions, but for increasing values of V, the relative displacement is higher in Sol. (i); this result demonstrates that here the tie rod is less effective.

7. Concluding Remarks

This paper investigates seismic assessments of the Podestà Palace in Mantua (Italy), an important palace formed by an aggregation of units stratified over centuries. Different numerical models were integrated to interpret its seismic response, strongly affected by the dynamic interaction among units.
In particular, nonlinear kinematic analyses were performed by referring to an MBM approach in order to assess the seismic response associated with the activation of local mechanisms. In particular, the OOP response of the façade overlooking the Broletto square was investigated. The damage that occurred after the 2012 Emilian earthquake highlighted the vulnerability of this macroelement, mainly due to the lack of connection with orthogonal walls or tie rods. This vulnerability was also confirmed by computations that allowed us to assess the reliability of the approach. An interesting aspect in the assessment of the OOP response was the use of data achieved from the in-plane global 3D model to refine the estimate of floor spectra, by accounting for the filtering effect provided by the main structure.
Then, modal and nonlinear static analyses were performed on the global EF approach of the palace that also included the aggregate and adjacent units. These analyses allowed us to explicitly consider the mutual dynamic interactions among units and to quantify the seismic safety index of the entire building. Results—with safety indexes higher than or close to 1—highlighted that the most significant criticalities of the palace consist in the response of specific critical portions, such as the connection body known as Arengario and the diaphragm system. Both are subjected to significant distortions, as also shown by the results of the modal analysis. For this reason, the latter were further studied with more refined models based on the FEM modelling strategy.
The paper outlines how main seismic behaviour involving a global or local response can be identified in a complex historical building and how a feasible but correct assessment procedure can be selected. Indeed, global modelling of the entire building, considering the interaction between in-plane and out-of-plane behaviour, would not be feasible and even insignificant, because of the limited slenderness of each single masonry pier.
On the basis of the structural deficiencies indicated, possible strengthening solutions were investigated with the aim of minimizing the impact on the construction. As far as the stiffening of barrel vaults is concerned, various strategies were explored that alternatively imply an intervention at the intrados or the extrados. In the case of the Arengario arch system, the best location of tie rods was proven by the nonlinear analyses carried out.

Author Contributions

S.D.A.: modelling and analysis, result post-processing, figure editing, and writing—original draft preparation; D.O.: modelling and analysis, result post-processing, figure editing, and writing—original draft preparation; S.C. and S.L.: conceptualization, supervision, software, result interpretation, and writing—review. All authors have read and agreed to the published version of the manuscript.

Funding

This research received no external funding.

Institutional Review Board Statement

Not applicable.

Informed Consent Statement

Not applicable.

Data Availability Statement

The data presented in this study are available on request from the corresponding author.

Acknowledgments

The authors would like to thank the building enterprise CMSA (Cooperativa di Muratori, Sterratori ed Affini) for the material made available to the building as well as Eng. Camilla Ciaravolo, Eng. Margherita Cecchinelli, and Eng. Ilaria Marassi for the help in setting up the models and performing the analyses.

Conflicts of Interest

The authors declare no conflict of interest.

References

  1. Binda, L.; Modena, C.; Casarin, F.; Lorenzoni, F.; Cantini, L.; Munda, S. Emergency actions and investigations on cultural heritage after the L’Aquila earthquake: The case of the Spanish Fortress. Bull. Earthq. Eng. 2011, 9, 105–138. [Google Scholar] [CrossRef]
  2. Cattari, S.; Degli Abbati, S.; Ferretti, D.; Lagomarsino, S.; Ottonelli, D.; Tralli, A. Damage assessment of fortresses after the 2012 Emilia earthquake (Italy). Bull. Earthq. Eng. 2014, 12, 2333–2365. [Google Scholar] [CrossRef]
  3. Parisi, F.; Augenti, N. Earthquake damages to cultural heritage constructions and simplified assessment of artworks. Eng. Fail. Anal. 2013, 34, 735–760. [Google Scholar] [CrossRef]
  4. Penna, A.; Calderini, C.; Sorrentino, L.; Carocci, C.F.; Cescatti, E.; Sisti, R.; Borri, A.; Modena, C.; Prota, A. Damage to churches in the 2016 central Italy earthquakes. Bull. Earthq. Eng. 2019, 17, 5763–5790. [Google Scholar] [CrossRef]
  5. Sorrentino, L.; Cattari, S.; da Porto, F.; Magenes, G.; Penna, A. Seismic behaviour of ordinary masonry buildings during the 2015 central Italy earthquakes. Bull. Earthq. Eng. 2019, 17, 5583–5607. [Google Scholar] [CrossRef] [Green Version]
  6. Vlachakis, G.; Vlachaki, E.; Lourenço, P.B. Learning from failure: Damage and failure of masonry structures, after the 2017 Lesvos earthquake (Greece). Eng. Fail. Anal. 2020, 117, 104803. [Google Scholar] [CrossRef]
  7. Lourenço, P.B. Computations on historic masonry structures. Prog. Struct. Eng. Mater. 2002, 4, 301–319. [Google Scholar] [CrossRef]
  8. Roca, P.; Cervera, M.; Gariup, G.; Pelà, L. Structural Analysis of Masonry Historical Constructions. Classical and Advanced Approaches. Arch Comput. Methods Eng 2010, 17, 299–325. [Google Scholar] [CrossRef] [Green Version]
  9. D’Altri, A.M.; Sarhosis, V.; Milani, G.; Rots, J.; Cattari, S.; Lagomarsino, S.; Sacco, E.; Tralli, A.; Castellazzi, G.; de Miranda, S. Modeling strategies for the computational analysis of unreinforced masonry structures: Review and classification. Arch. Comput. Methods Eng. 2020, 27, 1153–1185. [Google Scholar] [CrossRef]
  10. Lagomarsino, S.; Cattari, S. PERPETUATE guidelines for seismic performance-based assessment of cultural heritage masonry structures. Bull. Earthq. Eng. 2015, 13, 13–47. [Google Scholar] [CrossRef]
  11. Heyman, J. The stone skeleton. Int. J. Solids Struct. 1966, 2, 249–279. [Google Scholar] [CrossRef]
  12. Lagomarsino, S.; Abbas, N.; Calderini, C.; Cattari, S.; Rossi, M.; Ginanni Corradini, R.; Marghella, G.; Mattolin, F.; Piovanello, V. Classification of cultural heritage assets and seismic damage variables for the identification of performance levels. In Proceedings of the 12th International Conference on Structural Studies, Repairs and Maintenance of Heritage Architecture (STREMAH), Chianciano Terme, Italy, 5–7 September 2011; Volume 118, pp. 697–708. [Google Scholar]
  13. Ponte, M.; Bento, R.; Vaz, S.D. A Multi-Disciplinary Approach to the Seismic Assessment of the National Palace of Sintra. Int. J. Archit. Herit. 2021, 15, 757–778. [Google Scholar] [CrossRef]
  14. Cámara, M.; Romero, M.; Pachón, P.; Compán, V.; Lourenço, P.B. Integration of disciplines in the structural analysis of historical constructions. The Monastery of San Jerónimo de Buenavista (Seville-Spain). Eng. Struct. 2021, 230, 111663. [Google Scholar] [CrossRef]
  15. EN 1998-3. Eurocode 8: Design of Structures for Earthquake Resistance—Part 3: Assessment and Retrofitting of Buildings; CEN (European Committee for Standardization): Brussels, Belgium, 2005. [Google Scholar]
  16. NTC 2018. Italian Technical Code, Decreto Ministeriale 17/1/2018. Aggiornamento delle Norme Tecniche per le Costruzioni. Ministry of Infrastructures and Transportation, G.U. n.42 of 20/2/2018. (In Italian). Available online: https://www.studiopetrillo.com/ntc2018.html (accessed on 31 March 2021).
  17. Ministry of Infrastructures and Transportation, C.S.Ll.PP. n.7 del 21/01/2019. Istruzioni per L’applicazione Dell’aggiornamento delle Norme Tecniche per le Costruzioni di cui al D.M. 17/01/2018 G.U. S.O. n.35 of 11/2/2019. (In Italian). Available online: https://www.gazzettaufficiale.it/eli/id/2019/02/11/19A00855/sg (accessed on 31 March 2021).
  18. ICOMOS. Recommendations for the Analysis, Conservation and Structural Restoration of Architectural Heritage; International Scientific Committee for Analysis and Restoration of Structures and Architectural Heritage (ISCARSAH): Barcelona, Spain, 2005. [Google Scholar]
  19. ISO 13822. Bases for Design of Structures—Assessment of Existing Structures, 2nd ed.; ISO International Standard: Geneva, Switzerland, 2010. [Google Scholar]
  20. CIB 335. Guide for the Structural Rehabilitation of Heritage Buildings; CIB Commission W023—Wall Structures: Rotterdam, The Netherlands, 2010; ISBN 978-90-6363-066-9. [Google Scholar]
  21. DPCM 9/2/2011, 2008. Linee Guida per la Valutazione e la Riduzione del Rischio Sismico del Patrimonio Culturale con Riferimento alle Norme Tecniche delle Costruzioni di cui al Decreto del Ministero delle Infrastrutture e dei Trasporti del 14 Gennaio 2008. (In Italian). Available online: http://www2.ing.unipi.it/~a005843/Consolidamento%202016-17/Normativa/LineeGuida_BBCC_2010_11_26_1.pdf (accessed on 31 March 2021).
  22. Casolo, S.; Sanjust, C.A. Seismic analysis and strengthening design of a masonry monument by a rigid body spring model: The “Maniace Castle” of Syracuse. Eng. Struct. 2009, 31, 1447–1459. [Google Scholar] [CrossRef]
  23. Garofano, A.; Lestuzzi, P. Seismic Assessment of a Historical Masonry Building in Switzerland: The “Ancien Hôpital De Sion”. Int. J. Archit. Herit. 2016, 10, 975–992. [Google Scholar] [CrossRef]
  24. Meguro, K.; Tagel-Din, H. Applied element method for structural analysis: Theory and application for linear materials. JSCE Struct. Eng. Earthq. Eng. 2000, 17, 21–35. [Google Scholar]
  25. Rossi, M.; Cattari, S.; Lagomarsino, S. Performance-Based assessment of the Great Mosque of Algiers. Bull. Earthq. Eng. 2015, 13, 369–388. [Google Scholar] [CrossRef]
  26. Degli Abbati, S.; D’Altri, A.M.; Ottonelli, D.; Castellazzi, G.; Cattari, S.; de Miranda, S.; Lagomarsino, S. Seismic assessment of interacting structural units in complex historic masonry constructions by nonlinear static analyses. Comput. Struct. 2019, 213, 51–71. [Google Scholar] [CrossRef]
  27. Malcata, M.; Ponte, M.; Tiberti, S.; Bento, R.; Milani, G. Failure analysis of a Portuguese cultural heritage masterpiece: Bonet building in Sintra. Eng. Fail. Anal. 2020, 115, 104636. [Google Scholar] [CrossRef]
  28. Cattari, S.; Degli Abbati, S.; Ferretti, D.; Lagomarsino, S.; Ottonelli, D.; Rossi, M.; Tralli, A. The seismic behaviour of ancient masonry buildings after the earthquake in Emilia (Italy) on May 20th and 29th, 2012. Ing. Sismica 2012, 29, 87–111. [Google Scholar]
  29. Penna, A.; Morandi, P.; Rota, M.; Manzini, C.F.; da Porto, F.; Magenes, G. Performance of masonry buildings during the Emilia 2012 earthquake. Bull. Earthq. Eng. 2014, 12, 2255–2273. [Google Scholar] [CrossRef]
  30. Bracchi, S.; da Porto, F.; Galasco, A.; Graziotti, F.; Liberatore, D.; Liberatore, L.; Magenes, G.; Mandirola, M.; Manzini, C.F.; Masiani, R.; et al. Comportamento degli edifici in muratura nella sequenza sismica del 2012 in Emilia. Progett. Sismica 2012, 3, 141–161. [Google Scholar]
  31. Andreini, M.; de Falco, A.; Giresini, L.; Sassu, M. Structural damages in the cities of Reggiolo and Carpi after the earthquake on May 2012 in Emilia Romagna. Bull. Earthq. Eng. 2014, 12, 2445–2480. [Google Scholar] [CrossRef]
  32. Degli Abbati, S.; Cattari, S.; Marassi, I.; Lagomarsino, S. Seismic out-of-plane assessment of Podestà Palace in Mantua. In Proceedings of the 4th MuRiCo, Ravenna, Italy, 9–11 September 2014. [Google Scholar]
  33. Lagomarsino, S.; Ottonelli, D. A Macro-Block Program for the Seismic Assessment (MB-PERPETUATE). PERPETUATE (EC-FP7 Project), Deliverable D29. Available online: http://www.perpetuate.eu (accessed on 1 January 2012).
  34. Abrams, D.P.; AlShawa, O.; Lourenço, P.B.; Sorrentino, L. Out-of-plane seismic response of unreinforced masonry walls: Conceptual discussion, research needs and modelling issues. Int. J. Archit. Herit. 2017, 11, 22–30. [Google Scholar]
  35. Sorrentino, L.; D’Ayala, D.; de Felice, G.; Griffith, M.; Lagomarsino, S.; Magenes, G. Review of out-of-plane seismic assessment techniques applied to existing masonry buildings. Int. J. Archit. Herit. 2017, 11, 2–21. [Google Scholar] [CrossRef]
  36. Degli Abbati, S.; Cattari, S.; Lagomarsino, S. Validation of displacement-based procedures for rocking assessment of cantilever masonry elements. Structures 2021. [Google Scholar] [CrossRef]
  37. Lagomarsino, S. Seismic assessment of rocking masonry structures. Bull. Earthq. Eng. 2015, 13, 97–128. [Google Scholar] [CrossRef]
  38. Degli Abbati, S.; Lagomarsino, S. Out-of-plane static and dynamic response of masonry panels. Eng. Struct. 2017, 150, 803–820. [Google Scholar] [CrossRef]
  39. De Felice, G. Out-of-plane seismic capacity of masonry depending on wall section morphology. Int. J. Archit. Herit. 2011, 5, 466–482. [Google Scholar] [CrossRef]
  40. New Zealand Society for Earthquake Engineering; Structural Engineering Society New Zealand Inc. (SESOC); New Zealand Geotechnical Society Inc.; Ministry of Business, Innovation and Employment; Earthquake Commission. The Seismic Assessment of Existing Buildings (Technical Guidelines for Engineering Assessments), Part C—Detailed Seismic Assessment. Auckland, New Zealand. 2017. Available online: https://www.building.govt.nz/building-code-compliance/b-stability/b1-structure/seismic-assessment-existing-buildings/ (accessed on 31 March 2021).
  41. Calvi, P.M.; Sullivan, T.J. Estimating floor spectra in multiple degree of freedom systems. Earthq. Struct. 2014, 7, 17–38. [Google Scholar] [CrossRef]
  42. Vukobratovic, V.; Fajfar, P. Code-Oriented floor acceleration spectra for building structures. Bull. Earthq. Eng. 2017, 15, 3013–3026. [Google Scholar] [CrossRef]
  43. Degli Abbati, S.; Cattari, S.; Lagomarsino, S. Theoretically-based and practice-oriented formulations for the floor spectra evaluation. Earthq. Struct. 2018, 15, 565–581. [Google Scholar] [CrossRef]
  44. Cattari, S.; Degli Abbati, S.; Lagomarsino, S. Floor spectra validation through actual data from the 2016/2017 earthquake in Central Italy. In Proceedings of the 17th WCEE, Sendai, Japan, 27 September–2 October 2021. [Google Scholar]
  45. Blandon, C.; Priestley, M. Equivalent viscous damping equations for direct displacement based design. J. Earthq. Eng. 2005, 9, 257–278. [Google Scholar] [CrossRef]
  46. S.T.A. DATA 2012, 3Muri Program, Release 5.0.4. Available online: http://www.stadata.com (accessed on 31 March 2021).
  47. Lagomarsino, S.; Penna, A.; Galasco, A.; Cattari, S. TREMURI program: An equivalent frame model for the nonlinear seismic analysis of masonry buildings. Eng. Struct. 2013, 56, 1787–1799. [Google Scholar] [CrossRef]
  48. Cattari, S.; Camilletti, D.; Lagomarsino, S.; Bracchi, S.; Rota, M.; Penna, A. Masonry Italian Code-Conforming Buildings. Part 2: Nonlinear Modelling and Time-History Analysis. J. Earthq. Eng. 2018, 22, 2010–2040. [Google Scholar] [CrossRef] [Green Version]
  49. Marino, S.; Cattari, S.; Lagomarsino, S.; Dizhur, D.; Ingham, J.M. Post-Earthquake Damage Simulation of Two Colonial Unreinforced Clay Brick Masonry Buildings Using the Equivalent Frame Approach. Structures 2019, 19, 212–226. [Google Scholar] [CrossRef] [Green Version]
  50. Cattari, S.; Degli Abbati, S.; Alfano, S.; Brunelli, A.; Lorenzoni, F.; da Porto, F. Dynamic calibration and seismic validation of numerical models of URM buildings through permanent monitoring data. Earth Eng. Struct. Dyn. 2021. [Google Scholar] [CrossRef]
  51. Asıkoglu, A.; Vasconcelos, G.; Lourenço, P.B. Overview on the Nonlinear Static Procedures and Performance-Based Approach on Modern Unreinforced Masonry Buildings with Structural Irregularity. Buildings 2021, 11, 147. [Google Scholar] [CrossRef]
  52. Augenti, N. Seismic behaviour of irregular masonry walls. In Proceedings of the 1st European Conference on Earthquake Engineering and Seismology, Geneva, Switzerland, 3–8 September 2006. [Google Scholar]
  53. Dolce, M. Schematizzazione e modellazione degli edifici in muratura soggetti ad azioni simiche. Ind. Costr. 1991, 25, 44–57. (In Italian) [Google Scholar]
  54. Moon, F.L.; Yi, T.; Leon, R.T.; Kahn, L.F. Recommendations for Seismic Evaluation and Retrofit of Low-Rise URM Structures. J. Struct. Eng. 2006, 132, 663–672. [Google Scholar] [CrossRef]
  55. Cattari, S.; Camilletti, D.; D’Altri, A.M.; Lagomarsino, S. On the use of continuum Finite Element and Equivalent Frame models for the seismic assessment of masonry walls. J. Build. Eng. 2021, 43, 102519. [Google Scholar] [CrossRef]
  56. Berti, M.; Salvatori, L.; Orlando, M.; Spinelli, P. Unreinforced masonry walls with irregular opening layouts: Reliability of equivalent-frame modelling for seismic vulnerability assessment. Bull. Earth. Eng. 2017, 5, 1213–1239. [Google Scholar] [CrossRef]
  57. Ottonelli, D.; Manzini, C.F.; Marano, C.; Cordasco, E.A.; Cattari, S. A comparative study on a complex URM building. Part I: Sensitivity of the seismic response of different modelling options in the equivalent frame models. Bull. Earth. Eng. 2021. [Google Scholar] [CrossRef]
  58. Cattari, S.; Resemini, S.; Lagomarsino, S. Modelling of vaults as equivalent diaphragms in 3D seismic analysis of masonry buildings. In Proceedings of the 6th International Conference on Structural Analysis of Historical Constructions, Bath, UK, 2–4 July 2008. [Google Scholar]
  59. Brignola, A.; Pampanin, S.; Podestà, S. Experimental evaluation of the in-plane stiffness of timber diaphragms. Earthq. Spectra 2012, 28, 1687–1909. [Google Scholar] [CrossRef] [Green Version]
  60. Morandi, P.; Albanesi, L.; Graziotti, F.; Li Piani, T.; Penna, A.; Magenes, G. Development of a dataset on the in-plane experimental response of URM piers with bricks and blocks. Constr. Build. Mater. 2018, 190, 593–611. [Google Scholar] [CrossRef]
  61. Krzan, M.; Gostic, S.; Cattari, S.; Bosiljkov, V. Acquiring reference parameters of masonry for the structural performance analysis of historical building. Bull. Earth. Eng. 2017, 13, 203–236. [Google Scholar] [CrossRef]
  62. Magenes, G.; Calvi, G.M. In plane seismic response of brick masonry walls. Earth Eng. Struct. Dyn. 1997, 26, 1091–1112. [Google Scholar] [CrossRef]
  63. Calderini, C.; Cattari, S.; Lagomarsino, S. In-Plane strength of unreinforced masonry piers. Earth Eng. Struct. Dyn. 2009, 38, 243–267. [Google Scholar] [CrossRef]
  64. Fajfar, P. Capacity spectrum method based on inelastic demand spectra. Earth Eng. Struct. Dyn. 1999, 28, 979–993. [Google Scholar] [CrossRef]
  65. Azizi-Bondarabadi, H.; Mendes, N.; Lourenco, P.B. Higher mode effects in pushover analysis of irregular masonry buildings. J. Earthq. Eng. 2019, 25, 1459–1493. [Google Scholar] [CrossRef]
  66. Reyes, J.C.; Chopra, A.K. Three-Dimensional Modal Pushover Analysis of Unsymmetric-Plan Buildings Subjected to Two Components of Ground Motion. Geotech. Geol. Earthq. Eng. 2013, 24, 203–217. [Google Scholar]
  67. Pinho, R.; Antoniou, S.; Casarotti, C.; López, M. Displacement-Based adaptive pushover for assessment of buildings and bridges. In Advances in Earthquake Engineering for Urban Risk Reduction. Nato Science Series: IV: Earth and Environmental Sciences; Wasti, S.T., Ozcebe, G., Eds.; Springer: Dordrecht, The Netherlands, 2006; Volume 66, pp. 79–94. [Google Scholar] [CrossRef]
  68. ANSYS, Engineering Simulation Software, Release 13. 2013. Available online: http://www.ansys.com (accessed on 31 March 2021).
  69. Parisi, M.A.; Piazza, M. Seismic strengthening and seismic improvement of timber structures. Constr. Build. Mater. 2015, 97, 55–66. [Google Scholar] [CrossRef] [Green Version]
  70. Gubana, A. State-of-the-Art Report on high reversible timber to timber strengthening interventions on wooden floors. Constr. Build. Mater. 2015, 97, 25–33. [Google Scholar] [CrossRef]
  71. Giongo, I.; Wilson, A.; Dizhur, D.; Derakhshan, H.; Tomasi, R.; Griffith, M.; Quenneville, P.; Ingham, J. Detailed seismic assessment and improvement procedure for vintage flexible timber diaphragms. Bull. N. Zealand Soc. Earthq. Eng. 2014, 47, 97–118. [Google Scholar] [CrossRef] [Green Version]
  72. Rossi, M.; Calderini, C.; Lagomarsino, S. Experimental testing of the seismic in-plane displacement capacity of masonry cross vaults through a scale model. Bull. Earthq. Eng. 2016, 14, 261–281. [Google Scholar] [CrossRef]
  73. Farzampour, A.; Eatherton, M.R. Parametric computational study on butterfly-shaped hysteretic dampers. Front. Struct. Civ. Eng. 2019, 13, 1214–1226. [Google Scholar] [CrossRef]
Figure 1. Classification of architectural assets and related possible modelling strategies (from [10]).
Buildings 11 00269 g001
Figure 2. Overview of the different units of the palace.
Buildings 11 00269 g002
Figure 3. Location in plan of some available in-situ tests carried out at the 3rd and 4th levels.
Buildings 11 00269 g003
Figure 4. (a) Floors types (timber diaphragms and vaults); (b) out-of-plane deformations on the façade overlooking the Broletto square from laser scanner measurements made before and after the seismic event.
Buildings 11 00269 g004
Figure 5. (a) Capacity curve of the local mechanism and LS definition; (b) floor spectra evaluation and seismic assessment—figures adapted from [32]; (c) value of TLSi and ξLSi considered for the floor spectra definition as defined on the bi-linear curve of the global model; (d) 3D view of the global SEM model (see Section 4 for more details).
Buildings 11 00269 g005
Figure 6. (a) Macroelements considered in the analyses; (b) different assumptions and corresponding modelling strategies for the roof action; (c) corresponding considered mechanisms (for Macroelement 2). Please refer to [32] for the abacus of all the considered mechanisms.
Buildings 11 00269 g006
Figure 7. (a) Equivalent frame idealization of the façade overlooking the Broletto square; (b) example of modelling strategies assumed to guarantee a proper actions’ repartition to the structural elements under the non-continuous walls; (c,d) examples of vulnerability-driving factors: a flue and a non-continuous wall, respectively.
Buildings 11 00269 g007
Figure 8. Piecewise-linear constitutive law and hysteretic response of the model.
Buildings 11 00269 g008
Figure 9. (a) Identification of mainly interacting units; comparison of modal shapes for Modes 4 (b) and 6 (c) in the configurations with flexible or stiffer floors.
Buildings 11 00269 g009
Figure 10. (a) Control nodes’ definition; (b) deformed shape in plan of the whole complex in the +Y-direction (scale factor equal to 60).
Buildings 11 00269 g010
Figure 11. Damage pattern of some walls in the Podestà Palace (uniform LP distribution).
Buildings 11 00269 g011
Figure 12. (a) Plan of the Arengario; (b) historical picture, taken from the Broletto square in the 1900s; (c) present picture of the arch system; (d) cracks in the arches and detail of the timber floor above.
Buildings 11 00269 g012
Figure 13. (a,b) 3D geometrical model of the Arengario; (c) FEM structural model.
Buildings 11 00269 g013
Figure 14. Stress state Sy in [N/mm2] at the end of Set 2.6 (0.15 g).
Buildings 11 00269 g014
Figure 15. Stress state in [N/mm2] at the end of different set of analysis.
Buildings 11 00269 g015
Figure 16. (a,b) Post-earthquake damage pattern; (c) identification of the examined vault.
Buildings 11 00269 g016
Figure 17. (a) Views and dimensions of the geometrical model; (b) FEM structural model.
Buildings 11 00269 g017
Figure 18. Vertical stresses in [N/mm2] in the walls (Set 1.1 of Table 9).
Buildings 11 00269 g018
Figure 19. Deformed shape of the vault springer line in different models (ax = 0.135 g).
Buildings 11 00269 g019
Figure 20. Vertical stresses in [N/mm2] in the walls (Set 2.3 of Table 9).
Buildings 11 00269 g020
Figure 21. Stress states in [N/mm2] in the two hypotheses of intervention for the Arengario.
Buildings 11 00269 g021
Figure 22. Relative displacement between pillars (Δl) vs. shear (V) obtained with the two hypotheses of interventions: (a) Sol (i); (b) Sol (ii).
Buildings 11 00269 g022
Table 1. Results for Macroelement 2.
ag,OOP,SLD
[m/s2]
ag,OOP,SLV
[m/s2]
αSLDαSLVαMantua,2012
Mech1_d0.551.36 *1.0991.2271.869
Mech2_e0.141.36 *0.2801.2270.476
Mech2_g0.151.36 *0.3001.2270.510
* In these cases, the verification at a global scale was more punitive. Thus, the value refers to this condition.
Table 2. Mechanical parameters assumed in the SEM model.
E (1) [MPa]G (1) [MPa]w [kN/m2]fm [N/cm2]τ0 [N/cm2]
Solid brick and lime mortar1500500183207.6
(1) Un-cracked values; w: average specific weight; fm: compressive strength; τ0: shear strength. The strength values have to be divided by the CF, assumed equal to 1.2.
Table 3. Thresholds used for piers and spandrels. For piers, the first and second values were assumed for a prevailing flexural behaviour and shear behaviour, respectively.
δE3 [−]δE4 [−]δE5 [−]βE3 [%]βE4 [%]
Piers0.006–0.0030.01–0.0050.015–0.0070–3015–60
Spandrels0.0020.0060.025050
Table 4. Results of the modal analysis configurations with flexible and stiffer floors.
Flexible Floors (MTOT = 30,996,265 kg)
Mode12345678910
T [s]0.610.520.510.510.510.480.470.430.410.41
n [Hz]1.631.921.961.961.982.082.132.342.422.46
%Mx0.227.890.5616.114.2411.7511.1113.931.145.02
%My00.1915.399.101.7824.372.170.037.960
%Mz0000000000
Stiffer Floors (MTOT = 28,951,395 kg)
Mode12345678910
T [s]0.610.520.510.490.470.460.420.410.400.39
n [Hz]1.631.921.962.052.152.182.392.422.472.58
%Mx0.174.440.6525.4712.070.018.261.020.7414.25
%My00.198.184.6012.1424.244.280.2002.08
%Mz0000000000
Table 5. Summary of the seismic verification results.
Dir. & AnalysisPM [%]e*/0.75ΓM* [kg]ag,SLV [m/s2]αSLV
Podestà Palace+X (U)0.66160.882171.00010,844,165.81.3041.177
+Y (U)0.66300.884020.8921,135,266.41.0680.963
Masseria+X (PT)0.46600.621291.2491,197,424.31.4261.286
−Y (PT)0.45000.599971.0741,351,024.41.3321.202
Table 6. Load analyses.
ElementLoad [kN/m]Equivalent Mass [kg]
First timber slab + internal walls16.0218,852.01
False timber ceiling1.211422.26
Second timber slab2.082456.58
Gable roof1.942649.94
Pent roof1.942284.09
Table 7. Acceleration values associated with the different analysis sets.
Gravity LoadSeismic Analysis
Set1.12.12.22.32.42.52.6
a-0.025 g0.05 g0.075 g0.1 g0.125 g0.15 g
Table 8. Examined configurations and percentage of seismic actions transferred to the transversal walls (last column).
CfgModelStrengthening Intervention Acting on%
Vault StiffeningWall-to-Wall Connection
Present State1a--0
Design State1bIncoherent material as fillerLocal wall-to-wall connection by cuci-scuci at the intersecting walls42
1cIncoherent material as fillerContinuous reinforced masonry curb44
2Light, non-stiffening material as filler with RC slab fixed on the four sides-44
3aLight, stiffening material-46
3bLight, stiffening materialLocal wall-to-wall connection by cuci-scuci at the intersecting walls57
3cLight, stiffening materialContinuous reinforced masonry curb47
3dLight, stiffening material as filler and the use of X cables-19
Table 9. Materials properties used in the FEM model.
ElementMaterialYoung Modulus Ex [N/mm2]Poisson Coefficient PRxyDensity ρ [kg/m3]
Walls and vaultBrick masonry16000.21800
Filler, present stateIncoherent materialnegligible0.21600
Filler, design state—Sol ii)Light, non-stiffening materialnegligible0.2500
Filler, design state—Sol iii)Light, stiffening material1400.2700
RC Slabs/architravesRC30,0000.252500
CablesSteel210,0000.37860
Table 10. Acceleration values associated with the different analysis sets.
Gravity LoadSeismic Analysis
Set1.12.12.22.32.42.52.62.72.8
ax-ay-0.05 g0.1 g0.15 g0.2 g0.25 g0.3 g0.35 g0.4 g
Table 11. Acceleration values associated with the different analysis sets.
Gravity LoadSeismic Analysis
No Tie RodWith Tie Rod
Set1.12.13.13.23.33.43.53.6
a--0.025 g0.05 g0.075 g0.1 g0.125 g0.15 g
Publisher’s Note: MDPI stays neutral with regard to jurisdictional claims in published maps and institutional affiliations.

