Article

Displacement-Based Seismic Assessment of the Likelihood of Failure of Reinforced Concrete Wall Buildings

by
Amirhossein Orumiyehei
and
Timothy J. Sullivan
*
Civil and Natural Resources Engineering, University of Canterbury, Christchurch 8041, New Zealand
*
Author to whom correspondence should be addressed.
Buildings 2021, 11(7), 295; https://doi.org/10.3390/buildings11070295
Submission received: 23 April 2021 / Revised: 30 June 2021 / Accepted: 1 July 2021 / Published: 6 July 2021
(This article belongs to the Special Issue Seismic Performance Assessment of Buildings)

Abstract

:
To strengthen the resilience of our built environment, a good understanding of seismic risk is required. Probabilistic performance-based assessment is able to rigorously compute seismic risk and the advent of numerical computer-based analyses has helped with this. However, it is still a challenging process and as such, this study presents a simplified probabilistic displacement-based assessment approach for reinforced concrete wall buildings. The proposed approach is trialed by applying the methodology to 4-, 8-, and 12-story case study buildings, and results are compared with those obtained via multi-stripe analyses, with allowance for uncertainty in demand and capacity, including some allowance for modeling uncertainty. The results indicate that the proposed approach enables practitioners to practically estimate the median intensity associated with exceeding a given mechanism and the annual probability of exceeding assessment limit states. Further research to extend the simplified approach to other structural systems is recommended. Moreover, the research highlights the need for more information on the uncertainty in our strength and deformation estimates, to improve the accuracy of risk assessment procedures.

1. Introduction

Guidelines for the effective quantification and mitigation of seismic risk are essential for the resilience of our built environment and communities in general. A number of valuable guidelines already exist for the seismic assessment of buildings, including the Eurocode 8 part 3 [1] in Europe, FEMA 273/274 [2] in the US, and the MBIE NZSEE Seismic Assessment guidelines [3] in New Zealand. Such guidelines, however, tend to focus on quantifying whether an existing building can or cannot withstand a particular intensity of shaking, without quantifying the seismic risk rigorously, considering the uncertainty in demand and capacity to identify the likelihood of different damage levels (e.g., collapse) occurring. Building owners and communities that are provided with better information on seismic risk are likely able to implement more effective measures to reduce the seismic risk and improve resilience.
A number of proposals have been made in the literature to permit seismic risk assessment in a simplified manner, including the works of [4,5,6,7,8,9,10]. Such simplified methods are desirable since they are more likely to be widely implemented in practice. However, those methods that rely on linear elastic analysis are unable to accurately account for the effect of non-linearity in the system. Methods that utilize non-linear static (pushover) analyses resolve this issue, but do rely on the engineer having access to suitable software and having the skills required to develop an accurate non-linear model and execute the analysis properly. Furthermore, traditional non-linear static analysis does not account for the effects of higher modes and, hence, additional measures are required for the engineer to capture these effects. As an alternative to software-driven pushover analyses, Priestley et al. [11] advocates a displacement-based assessment procedure that has been implemented within the New Zealand national seismic assessment guidelines [3]. The approach can be used to establish, in a simplified fashion, the force-displacement (pushover) curve for a structure, and there are a number of simplified expressions that can be used to assess the impact of higher mode effects on the system. Nevertheless, as pointed out by Orumiyehei and Sullivan [12], the traditional DBA procedure of Priestley et al. [11] does not include the effect of uncertainties in quantifying the annual probability of exceeding assessment limit states. To address this, Orumiyehei and Sullivan [12] proposed a modified displacement-based assessment procedure. In this paper, the probabilistic DBA approach of Orumiyehei and Sullivan [12] will be extended to the case of RC wall buildings. By virtue of this study, the traditional displacement-based assessment approach for multi-story wall buildings is simplified by reducing the steps required to compute damping and spectrum reduction factor, and converted into a probabilistic approach by accounting for the pertinent variabilities. As part of the research, new relationships between intensity and ductility demands will also be proposed. The performance of the proposed methodology will be gauged by comparing the assessed likelihood of exceeding key limit states with values obtained from rigorous probabilistic assessment methods.

1.1. Probabilistic Displacement Based Assessment

An overview of the procedure that is proposed to undertake probabilistic displacement-based seismic assessment is provided in Figure 1, from Orumiyehei and Sullivan [12]. This procedure has been developed to provide engineers with a simplified means of quantifying the annual probability of exceeding a limit state of interest. The first step in the seismic assessment of a building will typically require a review of drawings (if available) and a visit to the site to identify the lateral load resisting system (and its condition), including the floor diaphragms, likely material properties, and the characteristics of potentially vulnerable non-structural elements. The first calculation step will then seek to identify the likely plastic mechanism, as shown in Figure 1a. This is used, together with structural and non-structural deformation and strength limits, to define the expected displaced shape of the building at attainment of the limit state, illustrated in Figure 1b. With the displaced shape and lateral resistance of the expected mechanism established, the characteristics of an equivalent single-degree-of-freedom (SDOF) system, such as that shown in Figure 1c, can be computed and a force-displacement capacity curve defined, as illustrated in Figure 1d. These four steps of the procedure are in line with the procedure of Priestley et al. [11] and have been verified quite extensively in the realm of both design and assessment (see, for example, Priestley et al. [11], Sullivan and Calvi [13], Cardone et al. [14], Pampanin et al. [15]). However, the next step uses the limit state displacement capacity, Δcap, together with new empirical relationships between intensity and displacement (ductility) demands, to compute the median spectral acceleration capacity, Sa,cap, as per Figure 1e.
The initial period of vibration of the structure, Ti, is then estimated. This can be done using the equivalent SDOF mass, me, yield displacement, Δy, and yield strength, Vy, as per Equation (1):
T i = 2 π m e y V y ,
The building’s initial period and spectral acceleration capacity can then be used, together with information on the intensity of different return periods (i.e., the seismic hazard), to establish the median return period intensity, TR, for a limit state, as per Figure 1f. Finally, the annual probability of exceeding the limit state, PLS, can be computed via Equation (2), proposed by Vamvatsikos [16].
P L S = p k 0 1 p 1 / T R p exp k 1 2 4 k 2 1 p ,
where k 0 , k 1 , and k 2 are coefficients used to describe the hazard as the mean annual frequency (MAF) at which different levels of shaking intensity, Sa, are exceeded at a site, assuming the second-order expression proposed by Vamvatsikos [16] and shown as Equation (3), and p is given by Equation (4).
MAF = k 0 exp ( k 2 ln 2 S a k 1 ln S a ) ,
p = 1 1 + 2 k 2 β T o t 2 ,
where β T o t is the total uncertainty, which Bakalis and Vamvatsikos [17] recommend be computed considering the dispersion in demand, βD, and capacity, βc, as per Equation (5).
β T o t = β D 2 + β c b 2 ,
where b is a coefficient that is a function of the hysteretic characteristics of the building and is used in the empirical relationship between seismic intensity and displacement (ductility) demand, as will be explained in detail in Section 1.2.
The information required for the last part of this assessment procedure (Equations (2)–(5) above) is likely to create some difficulty for practitioners. To overcome this, ideally, the coefficients of the hazard curve (k0, k1, and k2) could be provided as part of national seismic hazard information. Furthermore, assessment guidelines could provide information on typical values of dispersion in demand and capacity, or directly provide the value of βTot (which will typically be between 0.4 and 0.6).
In this paper, the approach described above is extended and tested for multi-story RC wall systems. Furthermore, improved relationships between seismic intensity (referred to as an intensity measure, IM) and displacement ductility demand (an engineering demand parameter, EDP) is developed as explained in the next sub-section.

1.2. Empirical Relationships between Seismic Intensity and Displacement Ductility Demand

The proposed displacement-based assessment method relies on the use of relationships between displacement demand and seismic intensity (as shown in Figure 1e and through the b-value indicated in Equation (7)). To this extent, there exists a variety of ways to relate seismic intensity with displacement (ductility) demand. For example, the equal-displacement rule [18] suggests that ductility demands increase in proportion to the seismic intensity. Generally speaking, methods to relate intensity with engineering demand parameters (such as displacement ductility) could be divided into two main groups. Firstly, comprehensive methods that employ numerical solutions, such as incremental dynamic analysis (IDA) [19] and multi stipe analysis (MSA) [20]. Secondly, approaches that aim to simplify the process of engineering demand estimation; among the second group one could include the capacity spectrum approach [21], the SAC/FEMA approach [9], the N2 method [22], and the displacement based design/assessment approach [11].
In the well-known SAC/FEMA framework [9,23,24], Equation (6) is recommended as a simplistic and practical IM-EDP relationship.
= a S a b ,
where is the displacement demand, Sa is the spectral acceleration intensity and a and b are scaling coefficients.
The FEMA350 [23] guidelines recommend that the coefficient b is set according to the equal-displacement rule [18], with b = 1.0. However, there have been many studies showing that the equal-displacement rule is inaccurate for certain period ranges and hysteretic models [8,25]. To this extent, Jalayer [26] do propose that the coefficients in Equation (6) be set by conducting regression analysis of nonlinear time history analysis results. Orumiyehei and Sullivan [12] conducted such regression analysis and arrived at a new set of b values for a range of periods and hysteresis models. However, it is noted here that for any value of b that is not unity, the units of Equation (6) are unrealistic.
In light of the above, the following model is proposed to relate seismic intensity, Sa, and displacement ductility demand, µ.
S a S a y = 1 + μ 1 1 / b ,
where S a y is the spectral acceleration at yield and b is an empirical regression coefficient that is unitless (overcoming the issue with the coefficient b indicated in Equation (6)). The coefficient b can then be seen as an indicator of the rate at which inelastic displacement demands increase as spectral acceleration demands increase, as illustrated in Figure 1e. Note that the seismic intensity is expressed in spectral acceleration. While the spectral velocity or spectral displacement demand could be used via conversion to spectral acceleration demands, the use of other intensity measures, such as peak ground acceleration or arias intensity, would require new relationships between intensity and displacement (ductility) demands to be developed.
The regression process described in [12] has been repeated herein with the new model function given by Equation (7), using results of non-linear time-history analyses described in Stafford et al. [27]. This lead to the b-values, together with the associated dispersion, reported in Table 1. Observe that for the bilinear model at medium periods the b values are close to 1.0, which would correspond to the equal-displacement rule. However, for other hysteretic models and periods it can be seen that much larger values of b are obtained. Note that a generalized value of b at short and medium range periods are presented in Table 2.

2. Assessing the Likely Failure Mechanism for a RC Wall Building

As part of the displacement-based seismic assessment process described in Section 1, the likely failure mechanism should be identified. This could be done through pushover analysis, provided that all types of mechanisms and effects can be adequately modeled. Alternatively, Priestley and Calvi [28] and Priestley et al. [11] provide a hand-calculation procedure in which the relative strengths of different elements and actions are compared to identify the most likely yielding sequence. For a RC wall building, this process is easiest done by first assuming that a flexural plastic hinge will be able to form at the base of the RC walls. Subsequently, the internal shear forces associated with this mechanism can then be computed and checks made to establish whether other mechanisms are more likely. The following section will illustrate how the likelihood of two other possible mechanisms can be checked, wall shear-mechanisms, and foundation overturning mechanisms. Whilst out of scope for this paper, one should also check that floor diaphragms are sufficiently strong to transfer inertia forces between the floors and the walls.

2.1. Flexural Plastic Hinging or a Wall Shear-Mechanism

To establish whether a wall is more likely to develop a flexural mechanism with plastic hinging at the wall base or a shear failure, the expected flexural strength of the base wall section, Mn, is first calculated. To do this, one should use traditional RC section analysis approaches, but with expected (as opposed to characteristic) yield strength values for the reinforcing steel and concrete. Priestley et al. [11] suggest that in-lieu of more accurate data on the materials, one could take the expected strength of reinforcing steel and concrete as being 1.1 and 1.3 times the characteristic values, respectively.
As shown in Equation (8), the wall base flexural strength can be divided by the effective height ( H e ) of an equivalent SDOF representation of the building to obtain the equivalent base shear force ( V b ) required to cause flexural yielding.
V b = M n / H e ,
where the effective height is computed as:
H e = m i i h i m i i ,
where mi is the mass of level i, hi is the height above the base hinge to level i and Δi is the lateral displacement of level i of the wall system at the limit state of interest. The summations are done considering all levels in the building.
With the objective of identifying which mechanism is likely to form, the displacement profile to be used in Equation (9) can be taken as the lateral displacement profile at the point of wall-yield, Δy,i, as [11]:
Δ y , i = ϕ y h i 2 2 1 h i 3 H ,
where hi is the height of level i above ground, H is the total height of the wall, and ϕ y is the nominal yield curvature ( ϕ y ) of the wall base, which can be found either from moment-curvature section analyses or via Equation (11) (from [11]):
ϕ y = e ε y D ,
where D is the section depth, corresponding to the wall length, Lw, in the case of RC walls, εy is the yield strain of the longitudinal reinforcement and e is an empirical constant that varies according to the section shape. The value for e is 2.0 for rectangular sections [11] and 1.4 for U-shaped and I-shaped sections bending parallel to the web (see [29]).
With the base shear obtained, a set of equivalent lateral forces, Fi, can then be found via Equation (12):
F i = m i i m i i V b ,
where all the symbols have been defined above and where again, for the purposes of identifying the lateral mechanism, ∆i can be taken as the yield displacement profile for the wall system (via Equation (10)).
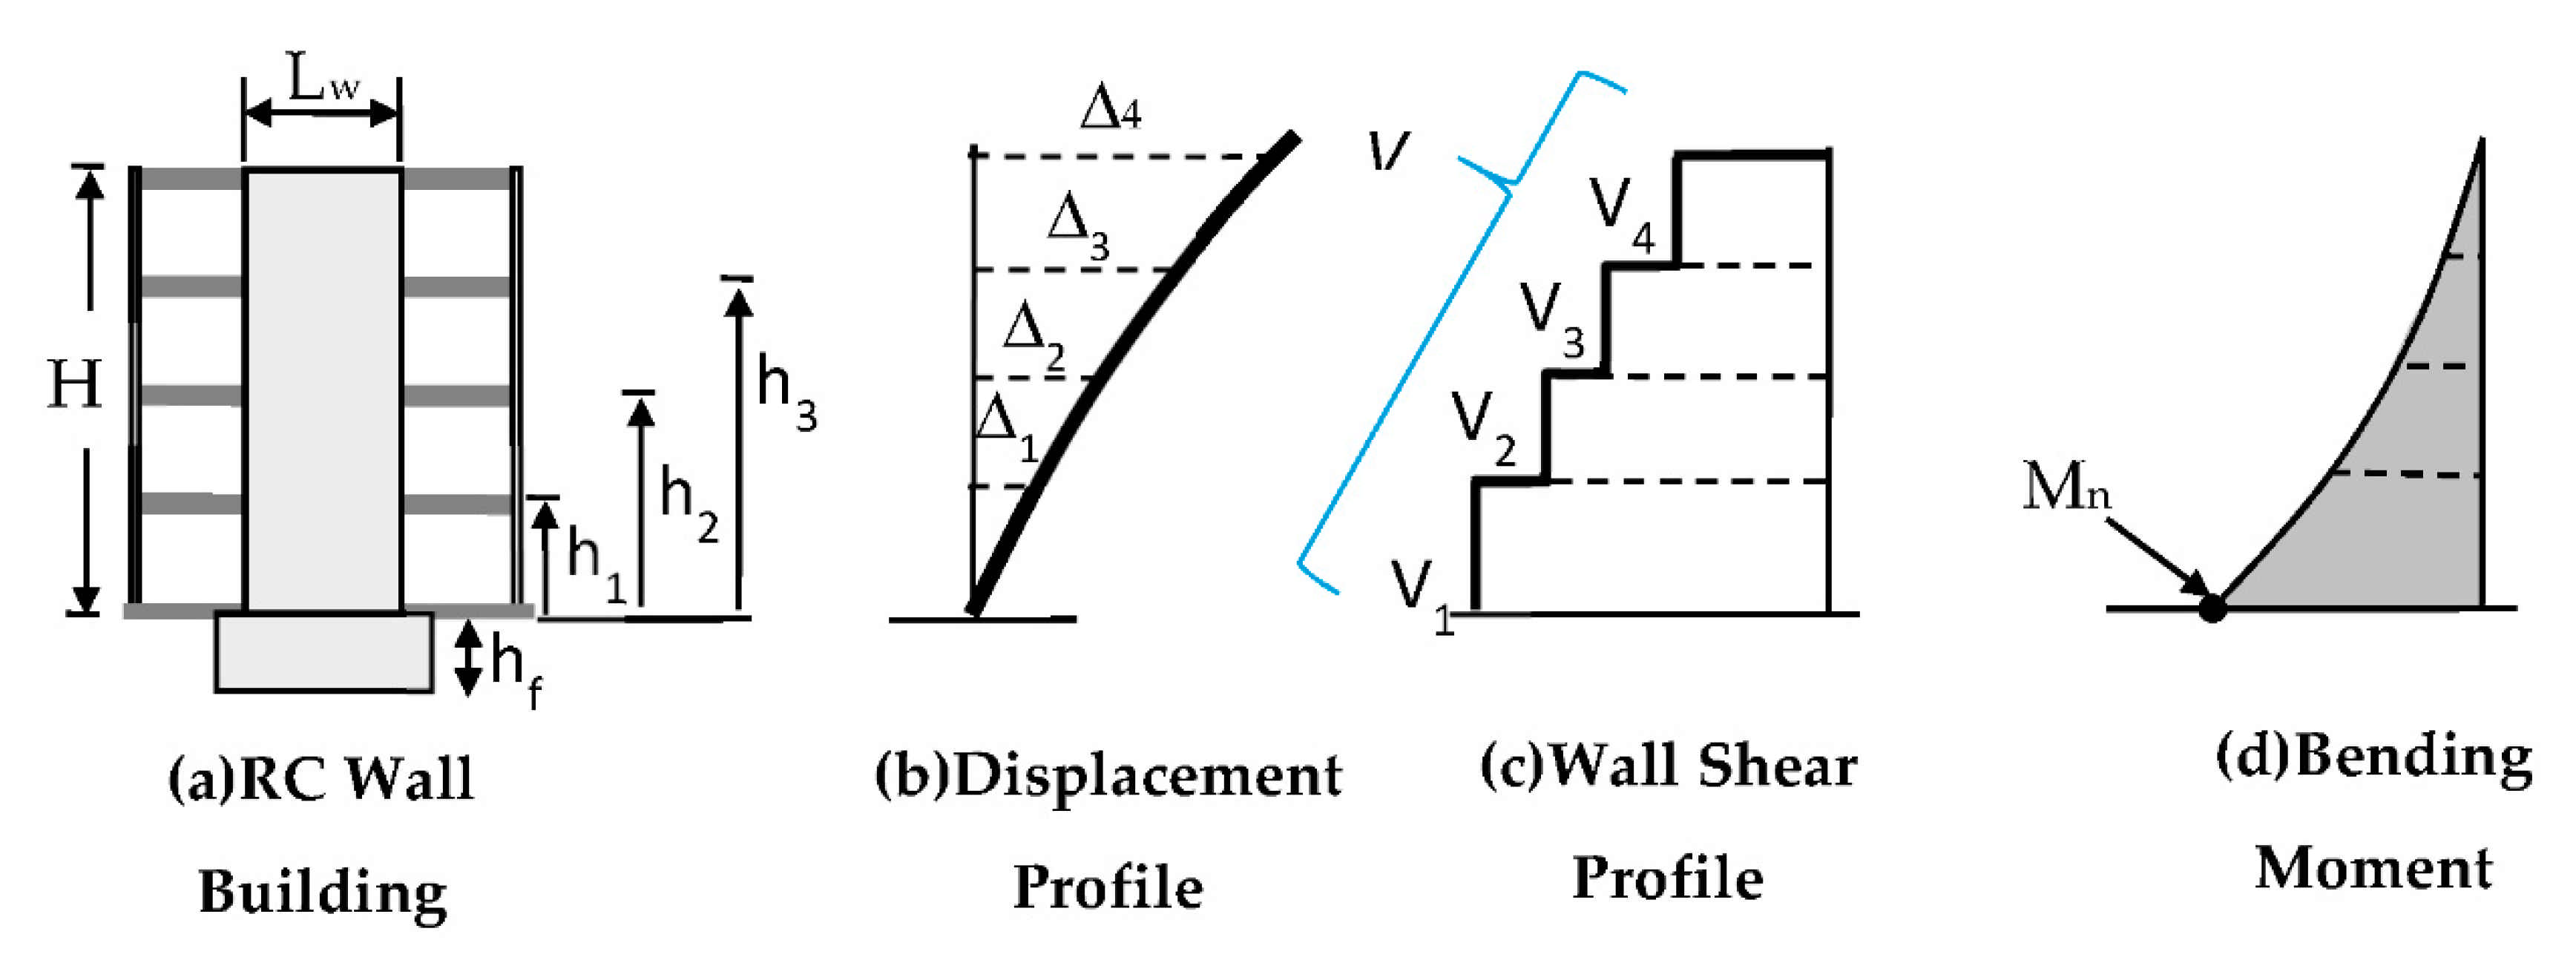
By summing the equivalent lateral forces down from roof level, one obtains the story shear demands, which in turn can be used to obtain the shear and bending moment demands on individual walls. Thus, at this stage one is able to identify the effective first mode displacement, shear force and bending moment profiles for the walls, as illustrated in Figure 2.
The peak shear forces expected in the walls will need to consider all relevant modes of vibration in the building. To this extent, the equivalent first mode shears identified following the procedure described above can be amplified to account for higher-mode effects. There are various proposals in the literature to account for higher mode effects on wall shear demands. For example, Pennucci et al. [30] and Fox et al. [31] show that the amplification will depend on the intensity of shaking and the level of ductility demand in the walls. Standards, such as Eurocode 8 [1] and the NZ standard [32], include more simplified expressions for maximum expected wall shear demands ( V i , m a x ). For example, NZS 3101 [32] provides the following expression for maximum expected shear demands
V i , m a x = φ o ω v V i , E ,
where Vi,E is the wall shear expected for level i considering the base flexural strength (i.e., the shear profile shown in Figure 2) multiplied by the plastic hinge overstrength, φo, and ω v is a dynamic magnification factor (to account for higher modes) given by:
ω v = 1.3 + n 30 < 1.8 ,
where n is the number of floors.
After amplifying the first mode shear force profile to account for higher mode effects, the maximum shear force demands in the walls can then be compared to the wall shear force capacity. If the shear capacity is less than the shear force demands, it is concluded that a shear mechanism is more likely than a flexural mechanism, and vice versa.

2.2. Flexural Plastic Hinging or Foundation Overturning?

Another possible mechanism that should be checked is foundation overturning or rocking. The overturning demand, MOT, associated with flexural hinging at the base of the wall can be found as:
M O T = M w a l l , O v + V b h f ,
where Vb is the peak base shear force, Mwall,Ov is the overstrength flexural resistance of the base plastic hinge and hf is the foundation height (see Figure 2). Note that when computing the peak overturning demand allowance for higher mode effects on shear demands can be made as per the previous section, but this should have limited effect on the overturning demands.
The overturning demand obtained from Equation (15) can be compared with the overturning capacity of the foundation, assessed considering the expected axial load and shear demand on the wall, and the ground conditions. Sullivan et al. [33] and Millen et al. [34] provide guidance on displacement-based assessment considering soil-foundation-structure-interaction. However, in principle any accepted approach for the computation of foundation overturning capacity could be adopted. If the assessed overturning capacity of the foundation is less than the demand given by Equation (15), then a foundation mechanism is expected rather than wall base flexural hinging, and vice versa.

2.3. Influence of Uncertainties on the Expected Mechanism?

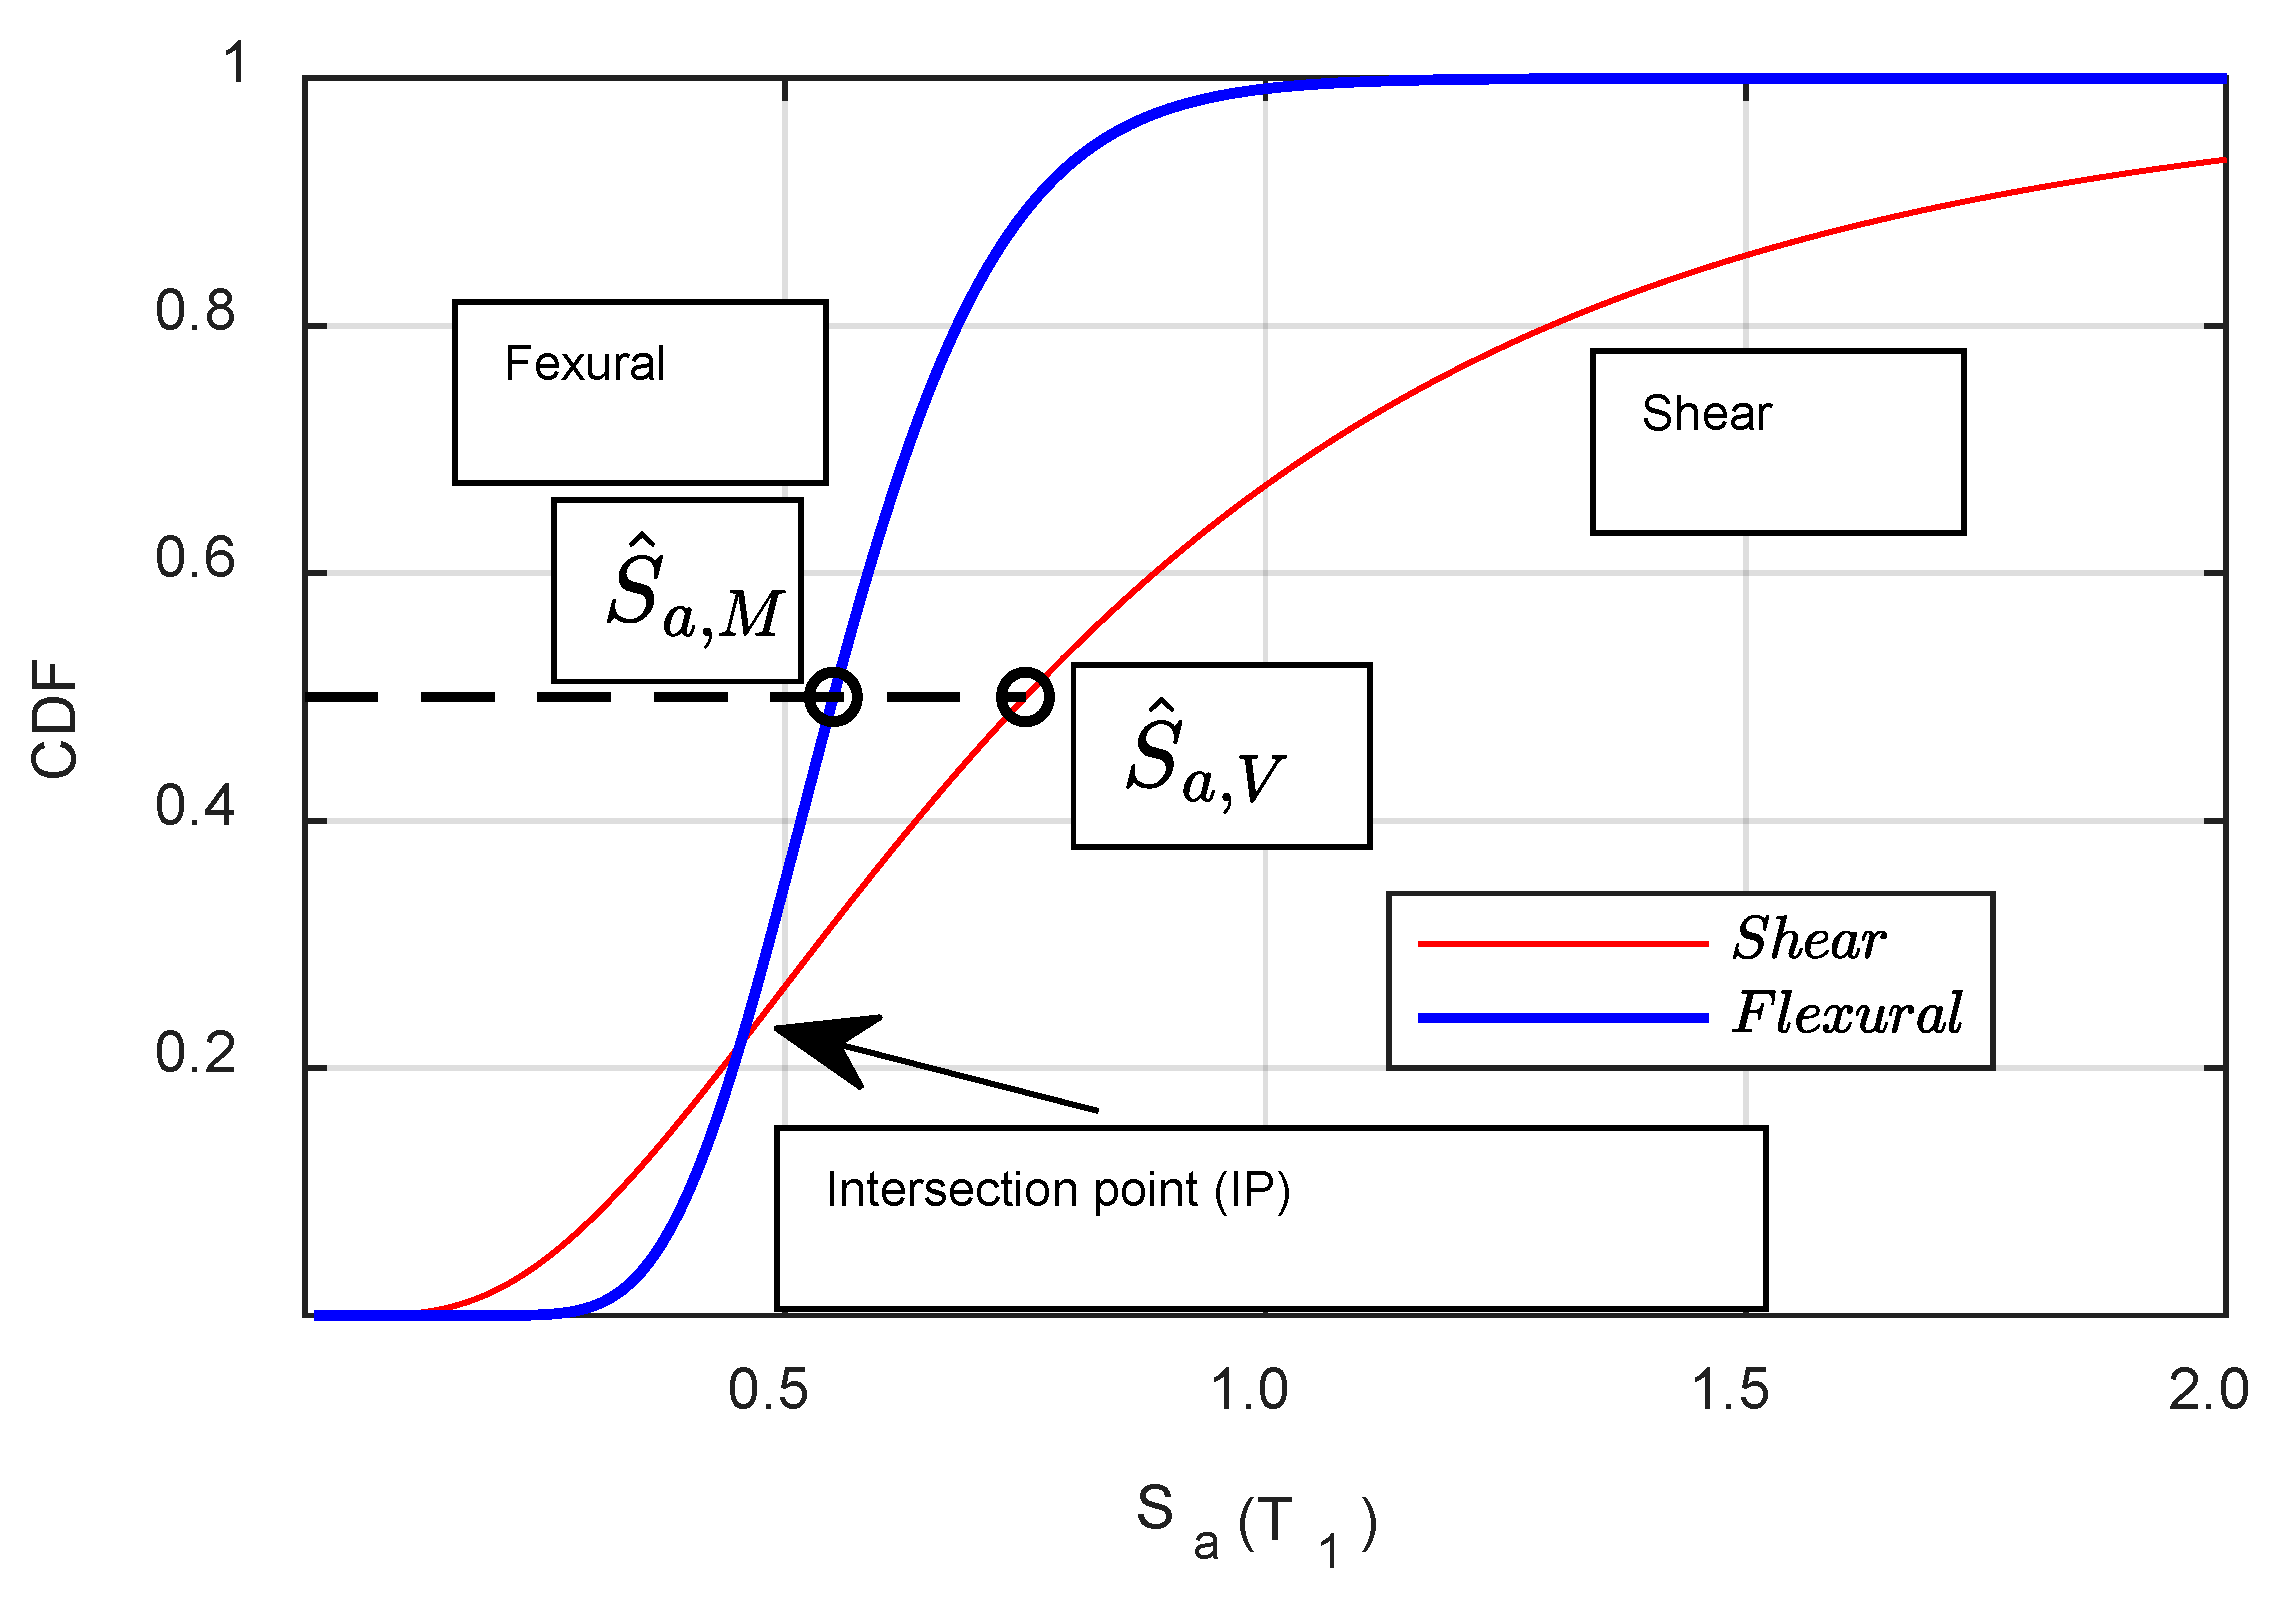
The previous sections have presented a series of equations and a procedure for identifying the likely mechanism. However, the actual resistance a structure offers against formation of a certain type of mechanism is uncertain. Furthermore, the uncertainty in the resistance against some types of mechanisms may be higher than others. Consider, for example, the scenario depicted in Figure 3 where the uncertainty in the shear resistance of a wall is deemed greater than the uncertainty in the flexural resistance. The figure shows that even though a seismic assessment undertaken considering median values of resistance may indicate that a flexural mechanism is more likely, at low intensity levels (below the intersection point, IP) the likelihood of reaching the failure limit state may be dictated by the shear resistance. Consequently, the annual probability of exceeding the failure limit state in this case should be computed considering both mechanisms. Hence, for cases where there is doubt about which mechanism may form, the engineer should undertake the seismic assessment for each mechanism conditioned on the other mechanism not forming, and then later evaluate the overall probability of failure.
In order to compute the probability of exceeding the limit state for a given mechanism, however, one must first identify the median intensity capacity of each given mechanism. This in turn requires assessment of the expected displacement capacity of each mechanism for different limit-state triggers (e.g., excessive story drift demand or excessive wall curvature demand). Guidance on this will be provided in the next section.

3. Identification of Limit State Deformation Capacity

The equivalent SDOF displacement capacity of a structure, shown as ∆cap (also referred to as ∆sys) in Figure 1, will be a function of the deformation capacity of the structural and non-structural elements as well as the displaced shape of the structure. The displaced shape will in turn depend on the expected mechanism. The following sub-sections illustrate how the displaced shape can be computed considering different failure mechanisms.

3.1. Displacement Capacity for the Case of Flexural Hinging at Wall Base

For the case of flexural hinging at the wall base, the limit state displacement profile, l s , i , can be found as (Priestley et al. [11], Sullivan et al. [35]):
l s , i = y , i + p , i ,
where y , i is the displacement profile at yield of the walls, given by Equation (10), and p , i is the allowable plastic displacement component for the limit state, computed as:
p , i = h i θ p , m i n ,
where θp,min is the minimum allowable plastic hinge rotation at the base of the wall, considering structural and non-structural deformation limits. This can be found by taking the minimum of θp,NS and θp,S from below:
θ p , N S = θ c ϕ y H 2
θ p , S = ϕ l s ϕ y L p ,
where θ c is the nonstructural drift limit capacity, ϕ l s is the limit state curvature capacity, ϕ y is the wall section yield curvature and L p is the wall plastic hinge length. The plastic hinge length proposed by Priestley et al. [11] is given by:
L p = k H e + 0.1 L w + L s p ,
k = 0.2 f u f y 1 0.08 ,    
L s p = 0.022 × f y e × d b ,
where L s p is strain penetration length, f y e is the effective yield stress in MPa, and the other parameters have been defined, previously. However, if a different expression for the plastic hinge length were deemed more appropriate, it could be substituted into Equation (20).

3.2. Displacement Capacity for the Case of a Wall Shear Mechanism

For the case that a wall shear mechanism is expected to precede flexural hinging, the limit state displacement profile, ∆i,ls, can be approximated as:
l s , i = V b ω v . φ o V y y , i ,
where Vb is the base shear capacity associated with the shear mechanism, y , i is the displacement profile of the wall that would be expected if flexural yielding were to occur and the terms in the denominator represent the base shear force at flexural yielding amplified to account for higher mode effects and overstrength. This expression should only be applied for cases where flexural cracking of the wall is expected prior to shear failure. If flexural cracking is not expected, the displacements will be considerably lower and could be computed using elastic analysis with gross (uncracked) wall section properties.
Another type of shear mechanism occurs when initially, flexural yielding begins to occur but subsequently, due to a loss in wall shear resistance at increasing ductility demands, a shear failure is triggered. For this case, the displacement capacity can be estimated by finding the curvature ductility demand that causes the shear strength to first drop to the shear demand level. The displacement profile is then computed for this value of curvature demand using Equations (16)–(19). This will be clarified further as part of a case study example later in this paper.

3.3. Substitute Structure Characteristics

Once the displacement profile at the limit state is identified, the equivalent SDOF displacement capacity, effective mass, and effective height can be found as per the equations below (refer to Priestley et al. [11]).
c a p = m i i 2 m i i ,
m e = m i i 2 m i i 2 ,
H e = m i i h i m i i ,
where Δ i represents the yield displacement at story i for the first case, and the ultimate limit state displacement at story i for the second case. The substitute structure effective mass, m e , can be computed by adopting Equation (25), but adopting different displacement profiles associated with different limit states may change the mass found for the substitute structure. Furthermore, the effective height can be achieved by adopting Equation (26) employing the displaced shape, Δ i , story mass, m i , and height, h i .
By applying Equation (24) using the displacement profile at yield and also the limit state displacement profile, the substitute structure’s yield displacement, Δ y , and limit state displacement capacity, c a p , are obtained, respectively. As such, the displacement ductility ratio, μ Δ , is achieved by dividing the limit state displacement by the yield displacement, as illustrated Equation (27).
μ Δ = Δ c a p Δ y ,
where all parameters have been defined, previously.

4. Quantification of the Limit State Median Intensity Capacity and Annual Probability of Failure

With the base shear resistance, the equivalent SDOF displacement capacity, and the ductility computed, the limit state seismic intensity capacity can be found. This is done by firstly estimating the spectral acceleration required to cause yield; this is done by dividing the yield base shear by the equivalent SDOF seismic mass. The period of vibration of the building is then computed using Equation (1) and considering the Takeda Thin hysteretic model for RC walls, an appropriate b factor is read from Table 1 (with interpolation if required). Consequently, the b factor, yield spectral acceleration, Say, and ductility factor ( μ ) are implemented into Equation (28) to estimate the median spectral acceleration capacity expected:
S a = 1 + μ 1 1 b S a y = 1 + c a p y 1 1 b S a y
where all parameters have been defined previously.
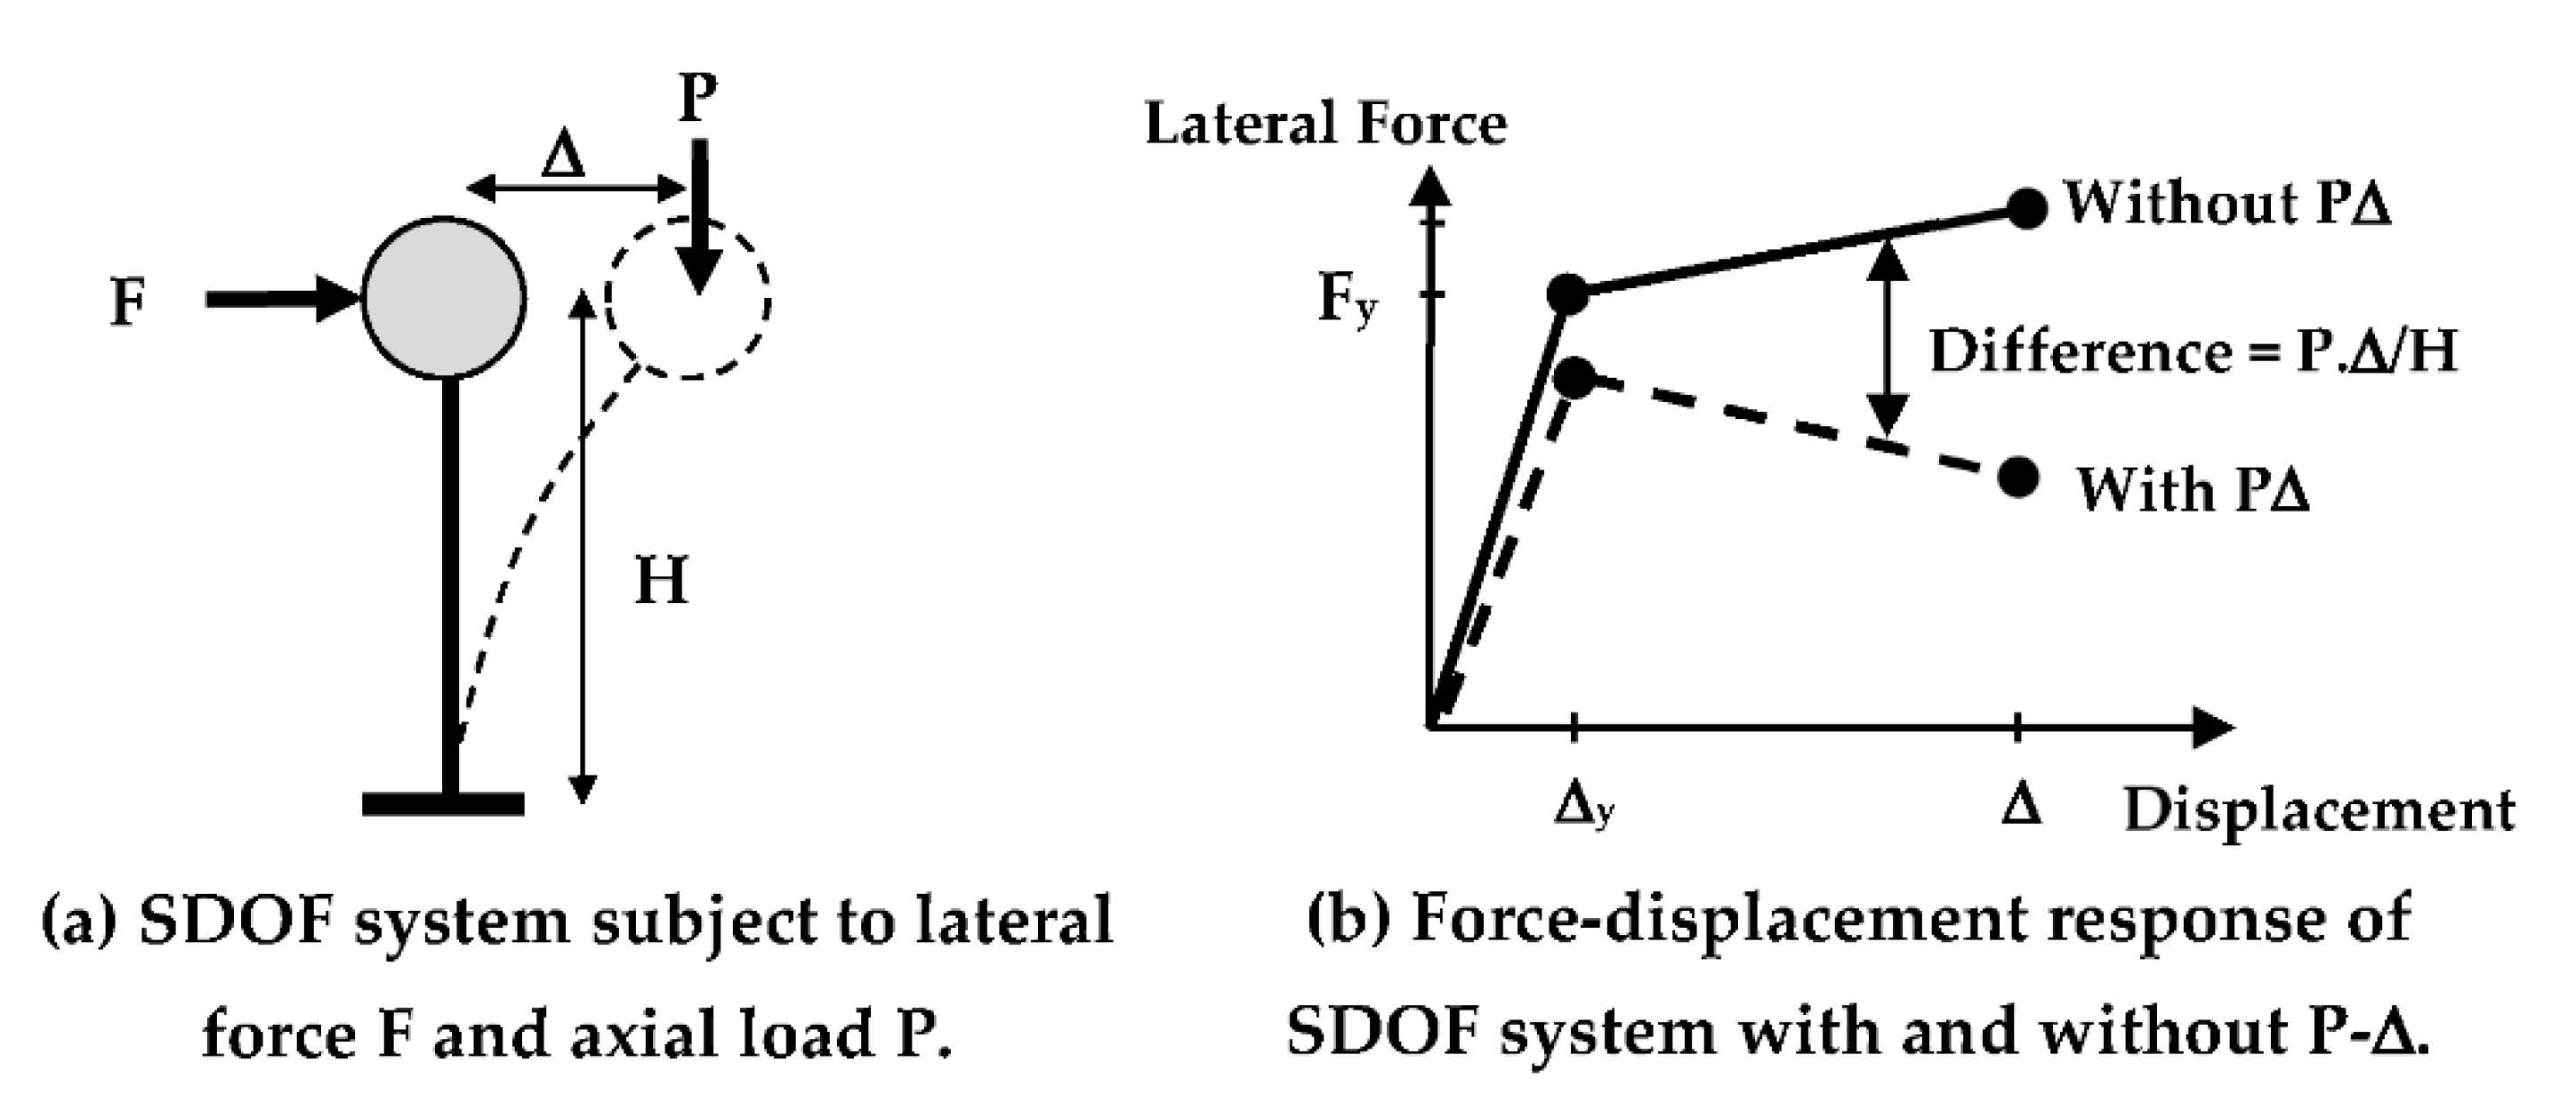
Note that the base shear resistance identified during the mechanism assessment process described in Section 2 is the first-order resistance and second-order P-delta effects may also need to be accounted for. P-delta effects reduce the equivalent lateral force resistance because of the additional overturning moment demands induced by geometric nonlinearity. As is illustrated in Figure 4, the lateral forces represented as F deform the structure by the amount of Δ. This lateral movement, however, causes the gravity loads to induce some extra bending moment demand and hence the equivalent lateral force resistance reduces as illustrated in Figure 4 and Equation (29) (refer Priestley et al. [11] and Sullivan et al. [13]).
V b P Δ = V b P Δ H e = V b m e g . Δ c a p H e ,
θ P Δ = P Δ V b H e ,
where V b P Δ is the base shear capacity reduced to account for P-delta effects, P represents the effective gravity loads, Δ is the substitute structure lateral displacement, H e is the effective height.
As part of an assessment of the vulnerability of a structure to second-order P-delta effects, the stability coefficient ( θ P Δ ) should be computed as shown in Equation (30). This coefficient measures the ratio between the P-delta induced overturning moments and the overturning resistance. Note that the stability factor ( θ P Δ ) should be less than 0.3 in order to limit the likelihood of collapse due to dynamic instability, or the value of cap reduced such that the limit is satisfied.
Once the median intensity required to exceed the limit state has been identified, the annual probability of exceeding the limit state can be computed, as will be explained in the next section.

5. Quantifying the Annual Probability of Exceeding the Assessment Limit State

To compute the annual probability of exceeding a limit state, the procedure described in Section 1.1 can be followed. This requires information on the mean annual frequency of exceeding different ground shaking intensity levels, and the corresponding hazard fit curve coefficients, as illustrated in Equation (3). Furthermore, estimates of ground motion variability and capacity uncertainty are necessary as illustrated in Equation (5). Consequently, the annual probability of limit state exceedance is computed by adopting Equation (2) together with the estimated dispersion and hazard.
The risk of performance failure for systems with multiple failure mechanisms should be computed by considering all relevant mechanisms. For cases in which the failure mechanisms are independent and in series, Lupoi et al. [36] provide Equation (31) to compute the likelihood of failure considering more than one possible mechanism. Specifically, the equation considers the likelihood that element i may fail in each considered failure mechanism m. Hence, one could consider multiple walls (and other structural and non-structural elements) as well as multiple possible mechanisms.
P f , k = Pr i = 1 m C i D i k = 1 i = 1 m 1 P f , i k
where C i is the ith element’s capacity and D i k is the ith element’s demand because of kth accelerograms at mth mechanism; Pf,ik is the probability of ith element failure because of kth accelerograms at mth mechanism. The first term of Equation (31) illustrates the probability of system failure by virtue of activation of m failure mechanisms in general, which has been simplified into the second term as per the assumptions above.

6. Gauging the Accuracy of Probabilistic Displacement-Based Assessment

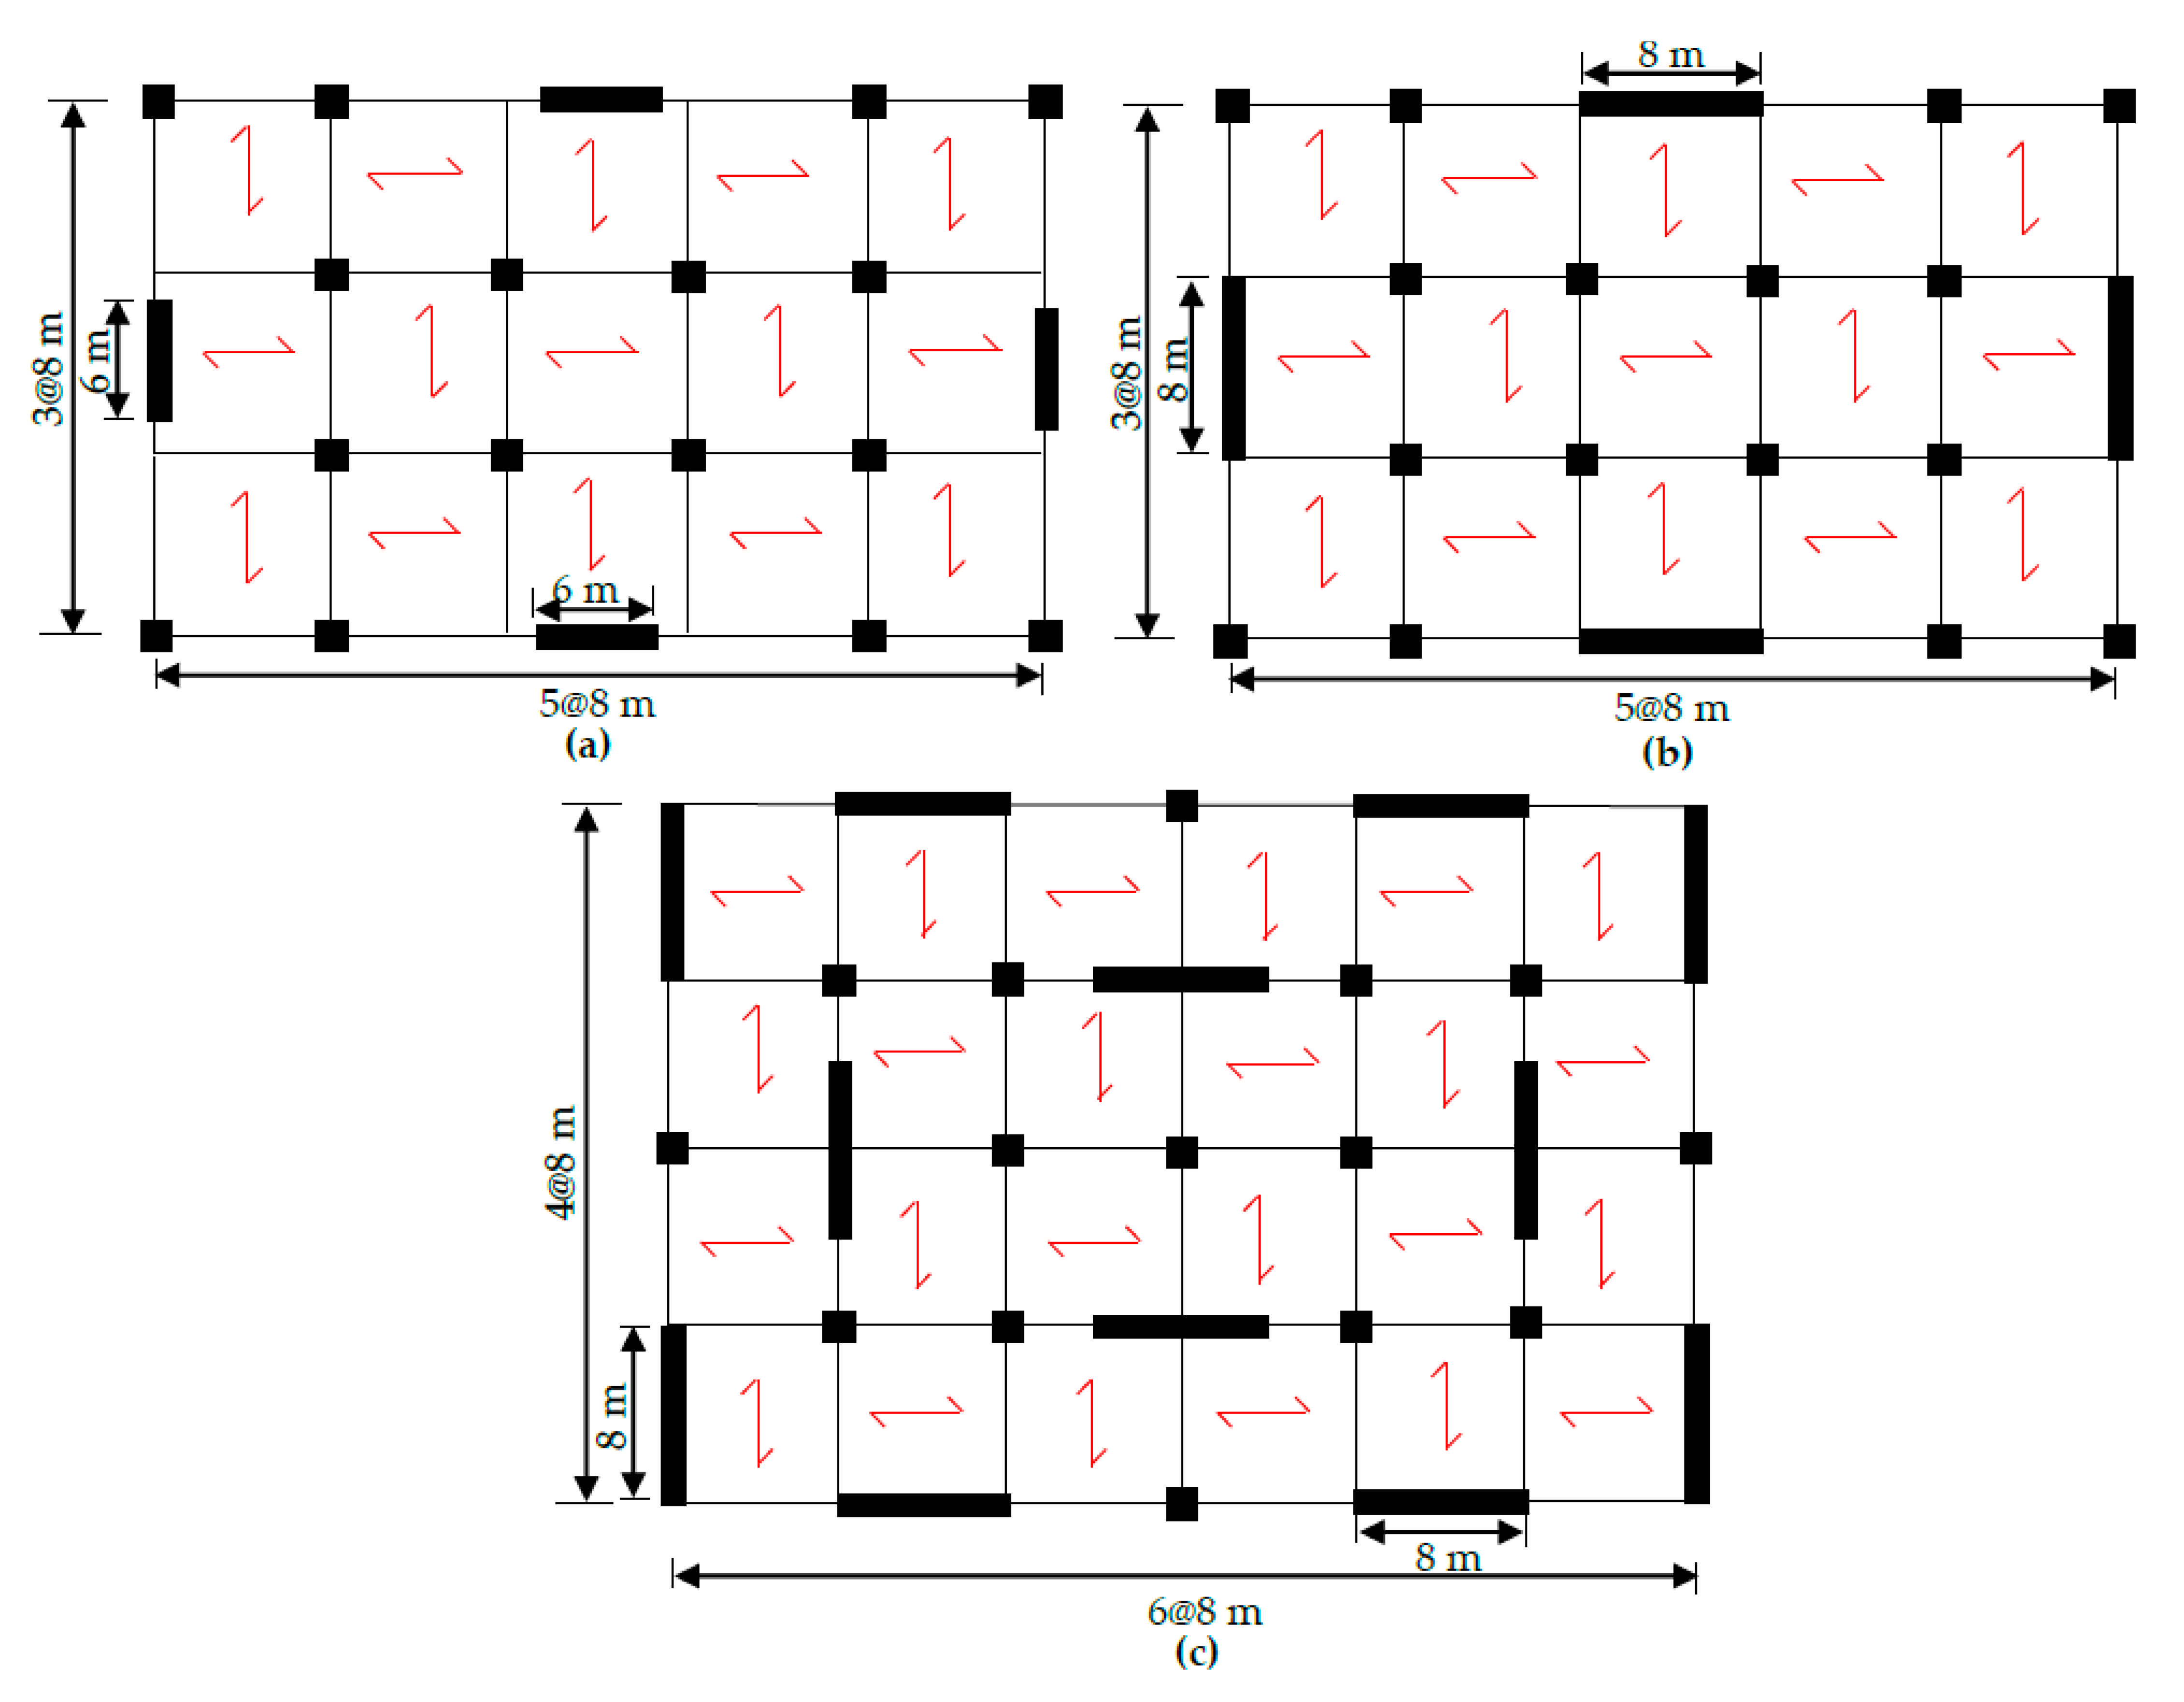
To gauge the accuracy and limitations of the proposed approach, a series of case-study buildings of 4-, 8-, and 12-storys, are assessed in this section. The layout of the three case study buildings is illustrated in Figure 5.
The buildings have not been designed and are instead idealized layouts of buildings, not representative of any particular buildings but with dimensions and reinforcement quantities that are deemed realistic for regular New Zealand RC wall buildings. The 4-story case study building possesses two 6 m walls in each direction, and two 8 m walls are located in each direction of the 8-story, with six 8 m walls located in each principle direction of the 12-story case study building. The thickness of the walls is 0.3 m for all case studies, and the story height is 3.6 m except for the first story, which is 4.5 m.
The wall axial load ratio (N/f’cAg) is 2.3%, 3.5%, 5.3%, and the longitudinal reinforcement ratio is 0.85%, 1.1%, and 1.6% for the 4-, 8-, and 12-story walls, respectively. However, in order to investigate possible mixed shear-flexure mechanisms, the transversal reinforcements spacing is taken as 170 mm for the 4-story, and 200 mm for the 8- and 12-story buildings; and the transversal rebar diameter is 10 mm for all case study buildings. Furthermore, the characteristic concrete strength is 30 MPa, and the reinforcement’s effective yield and ultimate strength is taken to be 500 MPa and 650 MPa, respectively. The median seismic mass is taken as 602 t for the 4- and 8-story, and 722 t for the 12-story building at each level (noting that variations in mass are considered as part of the probabilistic seismic assessment). The median base shear at yield of the reinforced concrete walls is 3438 kN, 3664 kN, and 13,834 kN for the 4-, 8-, and 12-story buildings, respectively. These base shear resistances correspond to design strength coefficients (lateral yield strength divided by weight) that are again typical of existing buildings in New Zealand, ranging from 0.10 to 0.19.

6.1. Rigorous Probabilistic Assessment of the Multi Story RC Wall Buildings

Multi-stripe analyses were conducted using lumped plasticity models developed in Ruaumoko [37]. The RC walls were modeled using their cracked section properties of Ieff = 0.84 m4, A = 1.8 m2, Av = 0.38 m2 for the 4-story, Ieff = 2.24 m4, A = 2.4 m2, Av = 0.42 m2 for the 8-story, and Ieff = 4.12 m4, A = 2.4 m2, Av = 0.64 m2, for the12-story walls. The wall flexural nonlinear behavior was modeled by employing Giberson beam elements with the Takeda hysteresis rule indicating alpha and beta equal to 0.5 and 0.0 [11], respectively. The foundations were assumed rigid for all case study buildings. The tangent-stiffness proportional Rayleigh damping model was used with 5% damping specified at the fundamental mode and the other one with more than 90% mass contribution. The fundamental mode was found to be 1.0 s for the 4-story building and 2.0 s for the 8- and 12-story case study buildings (adopting cracked section properties). The ground motions employed for MSA were selected to be hazard consistent by [38] for a conditioning period of 1.0 s for the 4-story case study and 2.0 s for the 8- and 12-story case studies for nine different intensity levels (stripes) at a soil-type C site in Wellington [38], following the generalized conditional intensity measure procedure detailed in [39].
The variability caused by epistemic uncertainty was introduced to the finite element models by assuming the capacity parameters are log-normally distributed as illustrated in Figure 6, with the median and dispersion values listed in Table 3. It can be seen that the random variables include the wall yield strength, My, the wall effective (i.e., cracked) section second moment of inertia, Ieff, the wall yield curvature, ϕ y , and the ultimate curvature capacity of the walls, ϕ u l t , as well as the seismic mass (with dispersion of 0.1) and the modeling damping coefficient (with dispersion of 0.6). These variables were selected noting that O’Reilly et al. [40] and Gokkaya et al. [41] had noted they tended to have the most significant impact on the seismic assessment results of existing RC buildings. The sampling procedure followed by [40] was used herein. As such, the available random function in MATLAB (2017b) [42] was utilized to generate 250 samples from each structural parameter distribution, as illustrated in Figure 6. Hence, the randomly generated sample structures were modeled in Ruaumoko [37] and exposed to 40 ground motions selected at each stripe leading to 10,000 nonlinear analyses.
The displacement ductility demand found for each structure and ground motion were utilized to compute the median shear capacity ( V p r o b ) following the algorithm developed by Orumiyehei and Sullivan [43] and NZSEE [3]. Shear failures were detected by comparing the randomly generated shear capacities and shear demand obtained for each ground motion. The probability of failing in shear at an intensity level (stripe) was achieved after dividing the number of failures by the number of randomly generated shear capacities exposed to the selected ground motions. A fragility curve was fit using the maximum likelihood technique described by Baker [44].
The other failure mechanism that was deemed possible for these case study buildings is longitudinal reinforcement buckling as per NZSEE [3] guidelines. Considering the transversal reinforcement spacing and the longitudinal rebar diameter, the curvature ductility capacities associated with rebar buckling was found to be 4.2 for the three case study buildings. Using this curvature as the median curvature ductility capacity and a dispersion of 0.3, 1000 capacity simulations were randomly generated. Consequently, the curvature demand obtained for each ground motion at each stripe was compared with the curvature capacity samples. The number of failures found at each stripe provided information on the curvature failure probability; accordingly, a fragility curve was fit adopting the maximum likelihood technique.
Seismic loss is highly correlated with displacement demands due to the large number of nonstructural and structural elements that experience damage by increasing deformation demands. As such, two drift limits of 1% and 2% were selected as hypothetical median displacement capacity limits for nonstructural and structural elements. Furthermore, a dispersion value of 0.3 is assumed as the variability associated with the displacement capacity of the aforementioned limit states. Similar to previous mechanisms, the aforementioned median and dispersion values are employed to generate drift capacities randomly, which are compared with drift demands imposed by each ground motion. Consequently, the median intensity and dispersion associated with failure of each limit state were obtained following the same procedure explained before.
The results of the multi-stripe analysis for the 4-story case study building are presented in Figure 7. The distribution of peak story drift demand at each stripe is illustrated on the left side of Figure 7, and the chances that a given mechanism may fail at a given intensity in addition to the best fit curves corresponding to the 4-story failure mechanisms are presented on the right side of Figure 7. The fragility curves for the 8- and 12-story case study buildings are presented in Figure 8 and Figure 9, respectively. The median spectral acceleration and dispersion observed for each mechanism and building are reported in Table 4.
The annual probability of limit state exceedance can be achieved by combining the corresponding fragility and hazard curves. The fragility curve indicates how likely the performance failure is at a given intensity measure. However, the hazard carve provides information on the annual frequency with which a given intensity measure is exceeded. As such, combining these two curves yields the annual probability of exceeding a specific limit state. This procedure has been followed for each of the mechanisms for which the structures was deemed vulnerable; the annual probability of performance failure was then computed conditioning on each failure limit state that may develop, so that the likelihood of failure for different limit states could be obtained, as presented in Table 5.

6.2. Simplified Probabilistic Assessment of the Multi Story RC Wall Buildings

The accuracy of the newly proposed assessment approach is gauged here by firstly comparing the median intensities assessed to cause the structure to violate a given limit state’s displacement capacity. Secondly, the annual probability of exceeding a given limit state capacity obtained from the simplified method is compared with that found from rigorous analysis.
To estimate the median spectral accelerations associated with exceeding the first two limit states ( I D R ^ 1 = 0.01   a n d   I D R ^ 2 = 0.02 ), the steps described in Section 2, Section 3 and Section 4 are followed. For that purpose, the yield curvature is first approximated by applying Equation (11) using the reinforcement yield strain and wall length. Consequently, this curvature can be implemented in Equation (10) to estimate the yield displacement profile. However, because Equation (10) accounts for tension shift effects and a non-uniform distribution of cracking, which does not match the assumptions made in the modeling described in Section 6.1, the yield displacement profile for these case study buildings was found using the approach of Pennucci et al. [45], reported in Appendix A. Following the displacement based assessment approach [11] the equivalent single degree of freedom yield displacement is then obtained. Furthermore, the displacement demand over the height of the building at a given limit state is found as illustrated in Appendix A. This displacement profile can be employed to reach the equivalent SDOF displacement capacity for the target limit state. Subsequently, the ductility ratio is computed by dividing the equivalent SDOF system’s displacement capacity at the target limit state by the yield displacement. Using the ductility ratio, Equation (28) estimates the median spectral acceleration capacity associated with the limit state. The median spectral accelerations that were assessed to cause the first two limit states to be exceeded are reported in Table 4.
The median spectral acceleration associated with exceeding the shear capacity can be estimated by comparing the flexural capacity curve with the shear capacity found using the modified UCSD model [3]. Shear capacity, however, was calculated as a function of displacement ductility, as illustrated in Appendix A [46]. Furthermore, the curvature capacity was found by, firstly, assessing the strain associated with buckling of vertical reinforcement, as illustrated by Equation (32) [3], and subsequently, the curvature capacity can be computed by implementing the achieved strain in Equation (33) [3]. The median spectral acceleration associated with exceeding the curvature capacity for the three case study buildings are compared with those obtained from MSA and presented in Table 6. The results shown in Table 6 provide evidence that the displacement-based assessment method can effectively assess the intensity at which key limit states are exceeded. The details regarding the above calculation are presented in Appendix A.
ε p   = 11 5 4 s / d b 100
ϕ c a p = ε p Υ l w
where s is the transversal reinforcement spacing, d b is the longitudinal reinforcement diameter, ε p   is the strain that triggers the vertical reinforcement buckling,   ϕ c a p is the curvature capacity, Υ l w is the length of wall after ignoring cover thickness.
The annual probability of exceeding each limit state was also computed through the simplified approach by adopting the closed-form solution [16], as illustrated in Equations (2)–(5). Note that the annual probability of performance failure has been calculated through the simplified approach by adopting assumed dispersion (β = 0.45 for 1% and 2% drift capacity limit state, β = 0.5 for flexural, and β = 0.75 for shear failure) and compared against those achieved through rigorous analysis as presented in Table 7. Furthermore, to highlight the effect of uncertainty estimation in simplified approach, the likelihood of limit state failure has been also computed using the numerically found dispersion as illustrated in Table 8. It can be seen that the simplified approach is able to provide good estimates of the annual probability of exceeding key limit states but that the accuracy is quite dependent on the assumed dispersion.

7. Discussion

The process followed in this work has been seen to enable estimates of seismic risk (the annual probability of exceeding key limit states) to be computed in a somewhat simplified fashion. A question that could be asked, however, is “Would such information on seismic risk change decisions?” To reflect on this question, consider the results for an 8-story building reaching the limit state because of a 2% drift limit as opposed to the results for the 12-story building reaching the flexural–shear failure limit. These case study buildings have the same period (2s) and, hence, looking at the median intensity capacity results (from Table 6 we see a capacity of Sa = 0.40 g for the 8-story building and a capacity of Sa = 0.45 g for the 12 story building), one would anticipate that the seismic risk for the 8-story building is higher than that of the 12-story building. However, from Table 8, we see that the 12-story building actually has a higher annual probability of exceeding the shear limit state than the 8-story building has of exceeding the 2% drift limit (the annual probability of exceeding the limit state is 0.00130 for the 8-story building and is 0.00177 for the 12-story building) and, thus, should be more of a priority for seismic retrofit. This highlights the fact that computing the seismic risk could indeed impact decision making in practice.
The results presented in Table 8 also provide evidence of clear differences between 4-story and 12-story performances. It is seen that the 12-story case study building has less chance of experiencing shear failure despite similar transversal reinforcement detailing. Furthermore, assuming identical curvature ductility capacity for both the 4-story and 12-story case studies, the chances for vertical reinforcement buckling for the 4-story walls is almost three times larger than that found for the 12-story walls. However, comparing the chances of curvature failure with that of the exceeding 2% drift capacity, it seems that the ratio of these chances is about two for the 4-story building. This is almost two times the ratio achieved, comparing the failure likelihoods for the same limit states chances for the 12-story case study building. These odds reflect the tendency for walls with high-aspect ratio (height divided by wall length) to be more sensitive to drift demands than curvature demands.
The results for the 8-story case study building found from rigorous analysis align with the transition in behavior expected from short 4-story structures towards the taller 12-story structures. The simplified method has successfully predicted the failure chances for different limit states with acceptable accuracy. As such, the approach is deemed capable of differentiating between failure mechanisms and structural behavior.
The total annual probability of performance failure could be achieved by accounting for multiple failure mechanisms. As reported earlier, Lupoi et al. [36] proposed Equation (29) which can be adopted for systems with multiple failure mechanisms. Furthermore, the change in the annual probability of limit state exceedance caused by retrofit decisions that suppress different failure mechanisms could be investigated. In line with this, Table 9 reports the annual probability of limit state exceedance for each failure mechanism separately as well as for all four simultaneously. For instance, the annual probability of exceeding a drift capacity of 1% and 2% for the 4-story case study is 4.10 × 10⁻³, 1.50 × 10⁻³, respectively. However, it changes to 2.95 × 10⁻³, 3.35 × 10⁻³ for curvature and shear failure, respectively. As such, the system performance failure assuming all failure mechanisms are independent and may occur simultaneously can be computed as follows.
P f , k = 1 i = 1 m 1 P f , i k
P 4 f , k = 1 1 4.10 × 10 3 1 1.50 × 10 3 1 2.95 × 10 3 1 3.35 × 10 3 = 11.8 × 10 3
Assuming a (hypothetical) retrofitting process that suppresses first failure mechanism, then the system annual probability of failure would change according to the calculation is following.
P 3 f , k = 1 1 1.50 × 10 3 1 2.95 × 10 3 1 3.35 × 10 3 = 7.78 × 10 3
Furthermore, the system annual probability of performance failure caused by additional retrofitting to the second and third failure mechanisms would be as follows.
P 2 f , k = 1 1 2.95 × 10 3 1 3.35 × 10 3 = 6.29 × 10 3
P 1 f , k = 1 1 3.35 × 10 3 = 3.35 × 10 3
This calculation has been iterated for the other two case study buildings and the results are presented in Table 9. Note that this brief exercise in relation to retrofit has been presented solely with the purpose of highlighting the potential means of considering different failure mechanisms as part of a simplified probabilistic seismic assessment and retrofit procedure. In reality, the engineer would need to check whether any retrofit measures could impact the structural response (which might in turn affect the likelihood of other mechanisms forming and limit states being reached), and should also check that the retrofit measures are able to effectively reduce the probability of failure of the “strengthened” failure mechanism to zero or continue to account for this within the probabilistic assessment.

8. Conclusions

The probabilistic displacement-based assessment approach put forward for single degree of freedom systems by Orumiyehei and Sullivan [12] has been extended to reinforced concrete wall buildings in this work. The resultant simplified assessment approach can be used in combination with a set of equations [16] to assess the building’s seismic risk, in terms of the annual probability of exceeding key limit states. The newly proposed approach is trialed via application to 4-, 8-, and 12-story RC wall buildings.
Different possible failure criteria are considered for the RC wall buildings, considering two possible drift limits (that could trigger non-structural or secondary structural damage), and shear and curvature failure are presumed as two commonly observed failure mechanisms in RC wall buildings. The case study buildings are assessed by conducting multi-stripe analysis and Monte Carlo simulations to generate results as a benchmark to gauge the accuracy of simplified method. The results show that the proposed approach can practically estimate the median intensity that can trigger damage to a given group of elements, as well as the annual probability of exceeding key limit states. Furthermore, this information could aid with retrofit decision making.
As the skills and tools available to the engineering profession increase, one could argue that practitioners would more accurately quantify the likelihood of exceeding limit states via multi-stripe analyses with consideration of appropriate random variables. However, considering the current assessment guidelines in New Zealand [3] that utilize displacement-based assessment, it would appear that the extension to the DBA method proposed in this work represents a valuable contribution to the state-of-the-art for practice-oriented methods. One of the main limitations with the simplified method is that it requires good estimates of the dispersion in the capacity. Future research should seek to provide more information on the dispersion for different systems and limit state failure types. Furthermore, the method has not been developed or validated for asymmetric buildings and this would be another area for future research.

Author Contributions

Conceptualization, T.J.S. and A.O.; methodology, T.J.S. and A.O; software, T.J.S. and A.O.; validation T.J.S. and A.O.; formal analysis, T.J.S. and A.O.; investigation, T.J.S. and A.O.; resources, T.J.S.; data curation, T.J.S. and A.O.; writing—original draft preparation, T.J.S. and A.O.; writing—review and editing, T.J.S. and A.O; visualization, T.J.S. and A.O.; supervision, T.J.S.; project administration, T.J.S.; funding acquisition, T.J.S. All authors have read and agreed to the published version of the manuscript.

Funding

This project was partially supported by QuakeCoRE, a New Zealand Tertiary Education Commission-funded Centre. This is QuakeCoRE publication number 0689.

Conflicts of Interest

The authors declare no conflict of interest.

Appendix A

This appendix provides detailed information on the steps taken to assess the structural behavior of the case study buildings. Hence, the procedure that has been followed to find the median spectral acceleration associated with exceeding 1% and 2% as the maximum drift ratio capacities, in addition to that of exceeding the shear capacity and curvature ductility capacity are demonstrated for the 4-story case study building, illustrated in Figure 5 of Section 6.
The first limit state intensity can be estimated by applying Equation (28) illustrated in Section 4. For that purpose, the displacement ductility should be estimated as shown in Equation (27). Hence, the yield curvature is calculated using Equation (11) explained in Section 2.1, and repeated below for illustration.
ϕ y = e ε y D ,
D = L w = 6.0   m ,       e = 2 ,       ε y = 500 200,000 = 0.0025 ,
ϕ y = 2 × 0.0025 6 = 8.3 × 10 4 1 m
After finding the yield curvature, it is implemented in Equation (A1) [45] and the yield displacement at different story heights is estimated, as follows.
Δ y , x x = 3 ϕ y H 3 x 5 120 H 2 12 x 3 + H 3 6 x 2
ϕ y = 8.3 × 10 4 1 m ,   H = 15.3 m ,   a n d   x = 4.5 ,   8.1 ,   11.7 ,   15.3 m
Δ y , i = 7.20 × 10 3 m ,       20.3 × 10 3 m ,       36.5 × 10 3 m ,       53.6 × 10 3 m
The resulting yield displacement profile and seismic mass are inserted into Equation (24) explained in Section 3.3, and the SDOF equivalent yield displacement is found to be 0.04 m. Furthermore, the associated limit state displacement demand at different levels can be estimated using Equation (A2), and consequently, adopted in Equation (24). Following this approach, the SDOF equivalent limit state displacement is found to be 8.1 10 2 and displacement ductility of 2.0, as illustrated below.
m 1 , 2 , 3 , 4 = 301   t o n ;       δ S D O F , y = m i Δ y , i 2 m i Δ y , i = 4 × 10 2 m
δ L S , h i = Δ y , i + θ L S ϕ y H 2 h i
Δ I D R = 0.01 , i = 2.35 × 10 2 m ; 4.97 × 10 2 m ;   7.89 × 10 2 m ;   10.91 × 10 2 m , δ S D O F , I D R = 0.01 = 8.1 × 10 2 m μ Δ = δ L S δ y = 8.1 × 10 2 4.0 × 10 2 = 2.0
At this stage, knowing the yield spectral acceleration to be equal 0.195 g, the median intensity associated with exceeding 1.0% is found to be 0.39 g (as presented in Table 6) adopting Equation (28) (from Section 4) and employing a displacement ductility and b factor listed in Table 1, as illustrated below.
S a S a y = 1 + μ 1 1 b = 1 + 2 1 1 1.23 = 2 S a = 2 × S a y = 2 × 0.195 = 0.39   g
Following a similar approach, the displacement ductility associated with the 2% drift ratio as the second limit state is found to be 4.94. Furthermore, the median intensity is found to be 0.78, as presented in Table 6 and shown below.
S a S a y = 1 + μ 1 1 b = 1 + 4.94 1 1 1.23 = 4 S a = 4 × S a y = 4 × 0.195 = 0.78   g
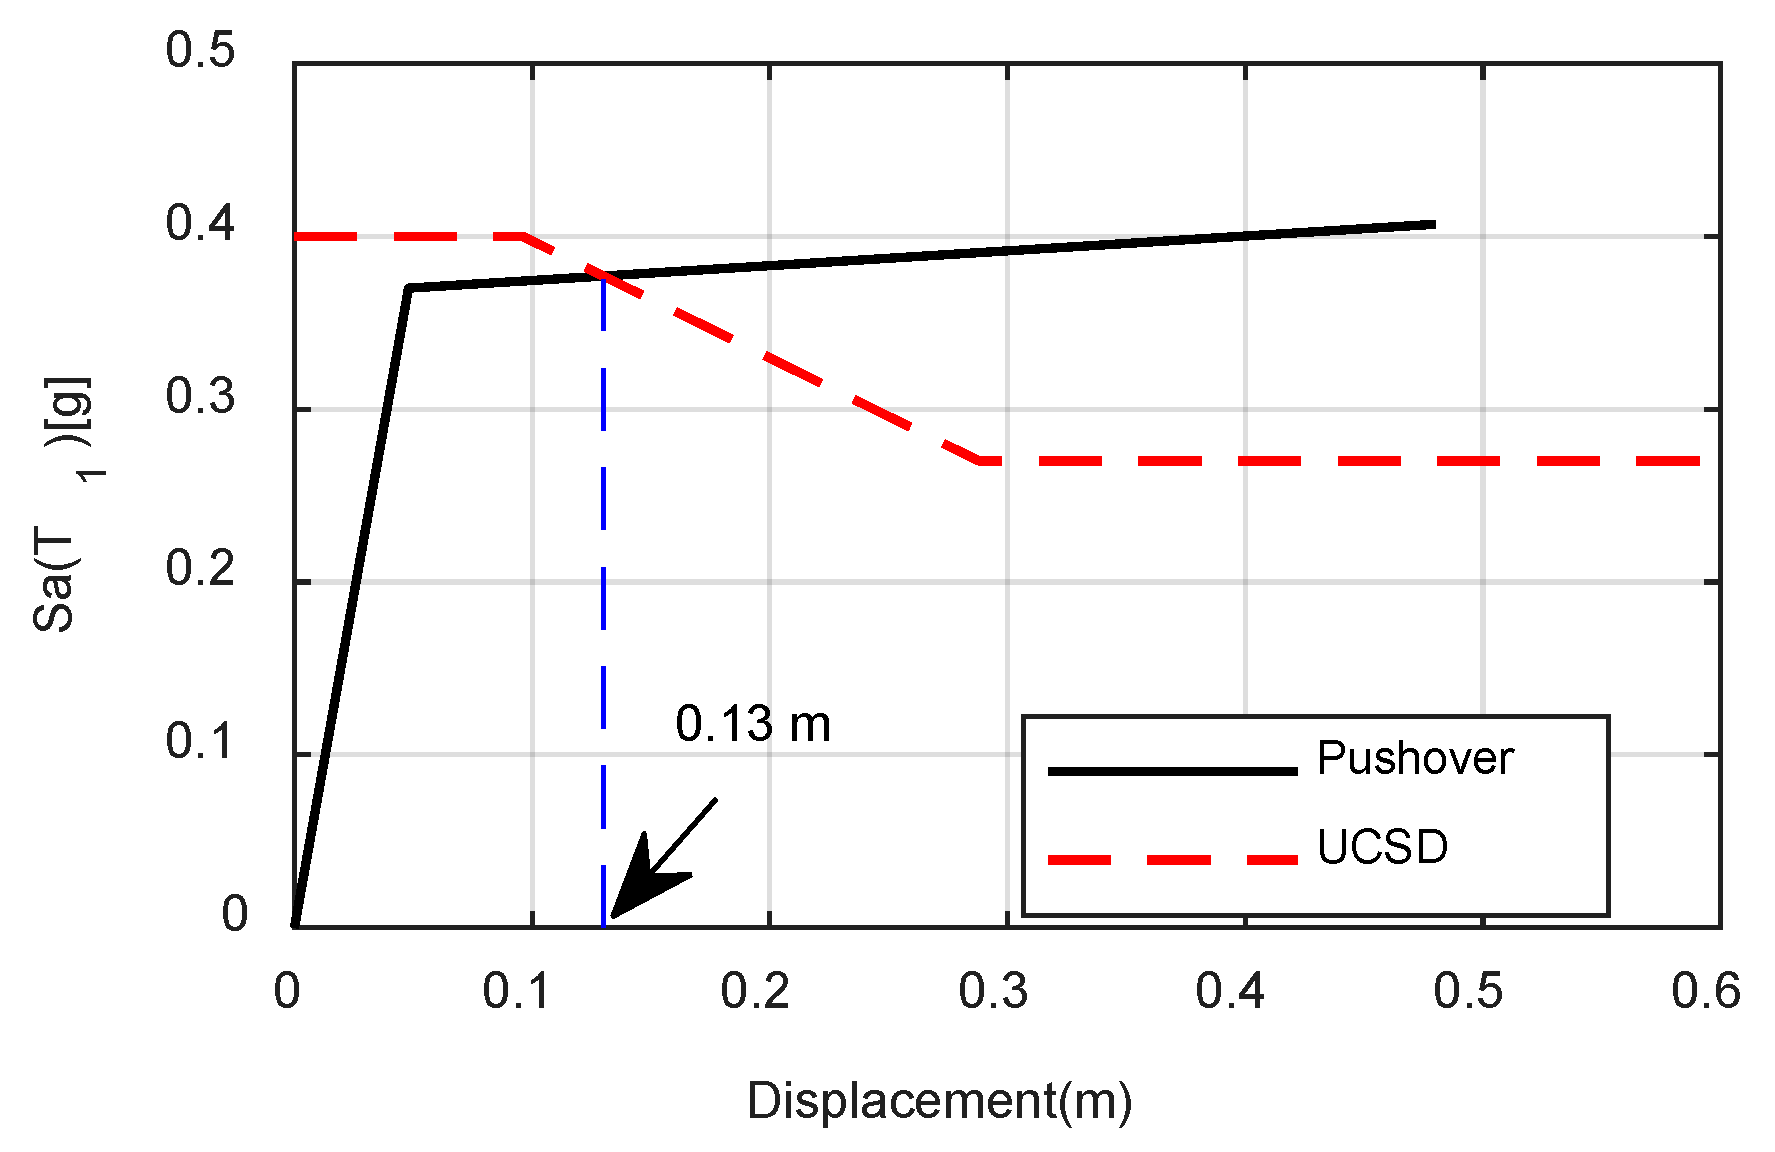
Shear failure is the third mechanism that has been investigated; to assess the displacement capacity of the shear mechanism it is assumed that wall has been provided with enough curvature ductility capacity. As such, the shear capacity is calculated using the modified UCSD shear model adopted for RC wall structures [3]. After calculating shear capacity as a function of displacement ductility, the flexural capacity curve (also referred to as a pushover curve) is estimated. Furthermore, the achieved shear demand is multiplied by higher modes effect factor. The shear capacity and demand are presented in terms of acceleration in Figure A1. The displacement at which shear failure occurs is found as the intersection point of two aforementioned curves, as illustrated in Figure A1. Finally, the displacement associated with the shear failure is divided by SDOF equivalent yield displacement, and the displacement ductility found to be 3.2, which implemented in Equation (28) and, consequently, the associated spectral acceleration is achieved equal to 0.58 g (as presented in Table 6), as demonstrated below.
S a S a y = 1 + μ 1 1 b = 1 + 3.2 1 1 1.23 = 2.9
S a = 0.58   g
Figure A1. The modified UCSD shear capacity calculated for 4-story case study building.
Buildings 11 00295 g0a1
Lack of sufficient restraint provided by transversal reinforcement ( s / d b > 6 ), cyclic loading, and strains larger than yield are among the parameters that limit the curvature capacity. The curvature capacity can be computed as illustrated in Equation (33) [3]. Indeed, the curvature capacity is a function of the maximum strain experienced by vertical rebar that is calculated as illustrated in Equation (32). In the case of the 4-story RC wall, transversal reinforcement spacing (s) and longitudinal rebar diameter (db) are assumed equal to (approximately) 170 and 24 mm, respectively. Hence, the curvature capacity is computed as follows.
ϕ c a p = ε p Υ l w ,
ε p = 11 5 4 s / d b 100 ,
ε p = 11 5 4 170 / 24 100 = 2.1 × 10 2 ,
ϕ c a p = 2.1 × 10 2 5.9 = 3.5 × 10 3   1 m
Furthermore, the curvature ductility found to be about 4.2 assuming the yield curvature equal to 8.3 × 10 4 . As such, the median intensity associated with the rebar buckling mechanism can be computed following the displacement based design approach [11], as demonstrated below.
ϕ t o t a l ϕ y = 3.5 × 10 3 8.3 × 10 4 = 2.67 × 10 3   1 m
Furthermore, the plastic hinge length, strain penetration length, and SDOF equivalent yield displacement are found to be equal 1.51 m, 0.26 m, and 0.04 m, respectively. Consequently, the plastic hinge rotation, SDOF equivalent plastic displacement, and total displacement are calculated as follows.
θ p = L p × ϕ p = 1.51 × 2.67 × 10 3 = 4.03 × 10 3   r a d Δ p = θ p × H e f f = 4.03 × 10 3 × 0.75 × 15.3 = 4.60 × 10 2   m Δ t o t a l = Δ y + Δ p = 8.60 × 10 2   m
Applying the above information, the corresponding displacement ductility is achieved equal to 2.15. Consequently, the median intensity is calculated as follows.
S a S a y = 1 + μ 1 1 b = 1 + 2.15 1 1 1.23 = 2.12 S a = 0.43   g
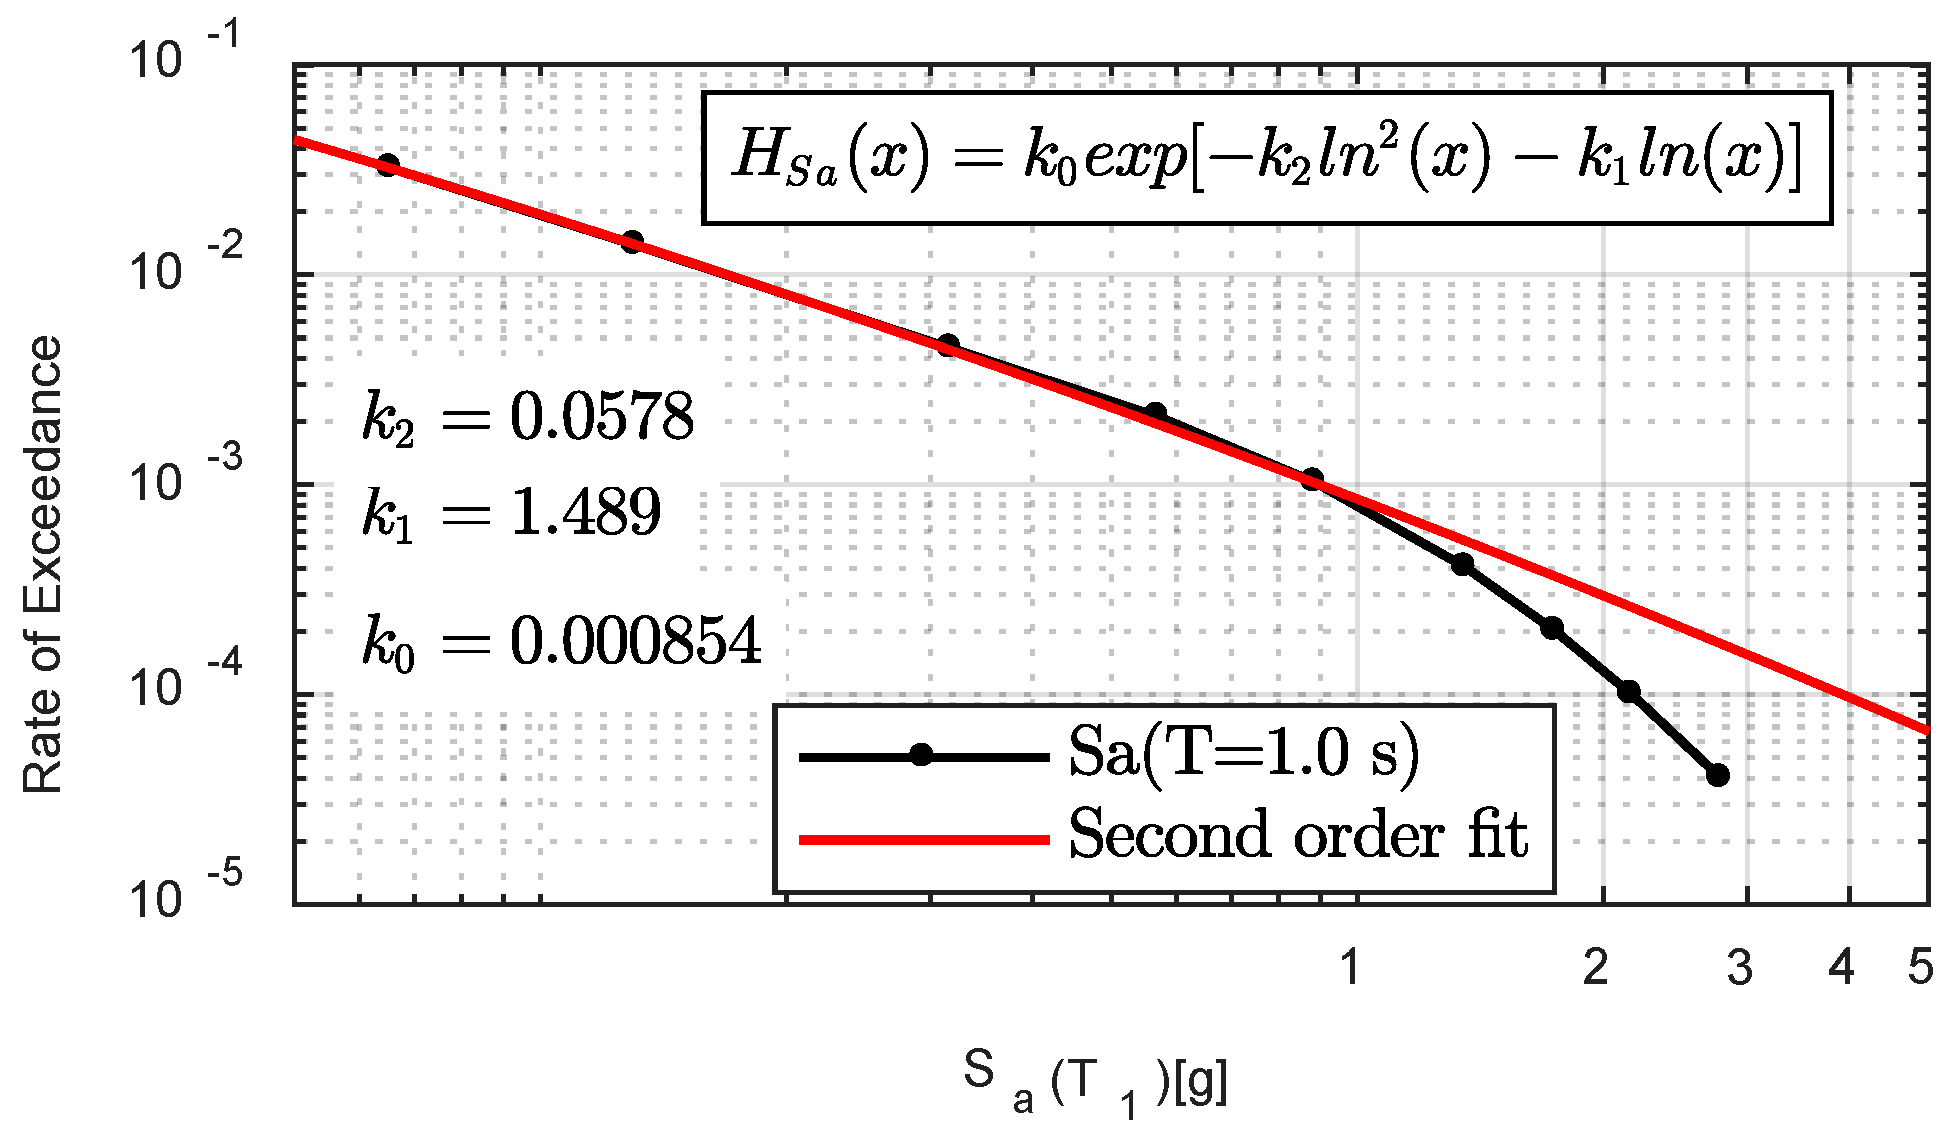
In the process of assessment, the next step is approximation of the annual probability of curvature capacity exceedance. For that purpose, the b value is found from Table 1 after estimating period as illustrated in Equation (1); the hazard second order fit coefficients have been found to be k0 = 8.54 × 10⁻⁴, k1 = 148.95 × 10⁻², and k2 = 5.78 × 10⁻², as illustrated in Figure A2. These parameters are implemented in Equations (2)–(5) to compute the annual probability of exceeding the limit state (as presented in Table 8) associated with the given mechanism. The required hand calculation is presented below for illustration.
Figure A2. Wellington 1.0 s spectral acceleration hazard curve and fit curve as per recommendation by Vamvatsikos [16].
Buildings 11 00295 g0a2
H S a = k 0 k 2 l n 2 S a k 1 l n   S a ; S a = 0.43   g 8.54 × 10 4 5.78 × 10 2 l n 2 0.43 148.95 × 10 2 l n   0.43 = 29 × 10 4 p = 1 1 + 2 k 2 β T o t 2 = 1 1 + 2 × 5.78 × 10 2 0.50 2 = 97.2 × 10 2 P L S = p k 0 1 p H S a p exp k 1 2 4 k 2 1 p 0.972 × 8.54 1 0.972 29 × 10 4 0.972 e x p 148.95 × 10 2 2 4 × 5.78 × 10 2 1 0.972 = 0.0036
Following the above calculation, the annual probability of exceeding the curvature mechanism limit state is found to be 0.0036, which is also reported in Table 7.

References

  1. CEN. Eurocode 8: Design of Structures for Earthquake Resistance-Part 1: General Rules, Seismic Actions and Rules for Buildings; CEN: Brussels, Belgium, 2005. [Google Scholar]
  2. FEMA. NEHRP Guidelines for the Seismic Rehabilitation of Buildings and Commentary; FEMA: Washington, DC, USA, 1997; pp. 273–274. [Google Scholar]
  3. NZSEE. The Seismic Assessment of Existing Buildings: Technical Guidelines for Engineering Assessments; Part C-Detailed Seismic Assessment; NZSEE: Wellington, New Zealand, 2017. [Google Scholar]
  4. Sullivan, T.J. Use of limit state loss versus intensity models for simplified estimation of expected annual loss. J. Earthq. Eng. 2016, 20, 954–974. [Google Scholar] [CrossRef]
  5. Sullivan, T.J.; Welch, D.P.; Calvi, G.M. Simplified seismic performance assessment and implications for seismic design. Earthq. Eng. Eng. Vib. 2014, 13, 95–122. [Google Scholar] [CrossRef]
  6. Welch, D.P.; Sullivan, T.J.; Calvik, G.M. Developing direct displacement-based procedures for simplified loss assessment in performance-based earthquake engineering. J. Earthq. Eng. 2014, 18, 290–322. [Google Scholar] [CrossRef]
  7. Vamvatsikos, D.; Aschheim, M.A. Performance-based seismic design via yield frequency spectra. J. Earthq. Eng. Struct. Dyn. 2016, 45, 1759–1778. [Google Scholar] [CrossRef]
  8. Priestley, M.; Calvi, G.M.; Kowalsky, M. Direct displacement-based seismic design of structures. In Proceedings of the NZSEE conference, Convention Centre, Palmerston North, New Zealand, 30 March 2007. [Google Scholar]
  9. Cornell, C.A.; Jalayer, F.; Hamburger, R.O.; Foutch, D.A. Probabilistic basis for 2000 SAC federal emergency management agency steel moment frame guidelines. J. Struct. Eng. 2002, 128, 526–533. [Google Scholar] [CrossRef] [Green Version]
  10. Fajfar, P.; Dolšek, M. A practice-oriented estimation of the failure probability of building structures. J. Earthq. Eng. Struct. Dyn. 2012, 41, 531–547. [Google Scholar] [CrossRef]
  11. Priestley, M.N.; Calvi, G.M.; Kowalsky, M.J. Displacement-Based Seismic Design of Structures; IUSS Press: Pavia, Italy, 2007. [Google Scholar]
  12. Orumiyehei, A.; Sullivan, T.J. Quantifying the Likelihood of Exceeding a Limit State via the Displacement-based Assessment Approach. J. Earthq. Eng. 2021, 1–19. [Google Scholar] [CrossRef]
  13. Sullivan, T.J.; Calvi, G.M. Developments in the Field of Displacement-Based Seismic Assessment, Research Report ROSE 2013/01; IUSS Press: Pavia, Italy, January 2013; pp. 1–531. ISBN 978-88-6198-090-7. [Google Scholar]
  14. Cardone, D.; Flora, A. Multiple inelastic mechanisms analysis (MIMA): A simplified method for the estimation of the seismic response of RC frame buildings. J. Eng. Struct. 2017, 145, 368–380. [Google Scholar] [CrossRef]
  15. Pampanin, S.; Bolognini, D.; Pavese, A. Performance-based seismic retrofit strategy for existing reinforced concrete frame systems using fiber-reinforced polymer composites. J. Compos. Struct. 2007, 11, 211–226. [Google Scholar] [CrossRef]
  16. Vamvatsikos, D. Derivation of new SAC/FEMA performance evaluation solutions with second-order hazard approximation. J. Earthq. Eng. Struct. Dyn. 2013, 42, 1171–1188. [Google Scholar] [CrossRef]
  17. Bakalis, K.; Vamvatsikos, D. Seismic Fragility Functions via Nonlinear Response History Analysis. J. Struct. Eng. 2018, 144, 04018181. [Google Scholar] [CrossRef]
  18. Veletsos, A.S.; Newmark, N.M. Effect of inelastic behavior on the response of simple systems to earthquake motions. In Proceedings of the 2nd World Conference Earthquake Engineering, Tokyo, Japan, 11–18 July 1960; pp. 895–912. [Google Scholar]
  19. Vamvatsikos, D.; Cornell, C.A. Incremental dynamic analysis. Earthq. Eng. Struct. Dyn. 2002, 31, 491–514. [Google Scholar] [CrossRef]
  20. Jalayer, F.; Cornell, C. Alternative non-linear demand estimation methods for probability-based seismic assessments. J. Earthq. Eng. Struct. Dyn. 2009, 38, 951–972. [Google Scholar] [CrossRef]
  21. Freeman, S. (Ed.) Evaluations of existing buildings for seismic risk-A case study of Puget Sound Naval Shipyard. In Proceedings of the 1st U.S. National Conference on Earthquake Engineering, Bremerton, WA, USA, 18–20 June 1975. [Google Scholar]
  22. Fajfar, P.; Gašperšič, P.; Drobnič, D. Seismic Design Methodologies for the Next Generation of Codes. In A Simplified Nonlinear Method for Seismic Damage Analysis of Structures; Routledge: Rotterdam, The Netherland, 1997. [Google Scholar]
  23. Federal Emergency Management Agency—FEMA. Recommended Seismic Design Criteria for New Steel Moment-Frame Buildings; Rep. No. FEMA-350; SAC Joint Venture: Washington, DC, USA, 2000. [Google Scholar]
  24. Jalayer, F.; Cornell, C.A. A Technical Framework for Probability-Based Demand and Capacity Factor (DCFD) Seismic Formats; Report No. RMS-RMS Program; PEER: Stanford, CA, USA, 2003. [Google Scholar]
  25. Miranda, E. Evaluation of site-dependent inelastic seismic design spectra. J. Struct. Eng. 1993, 119, 1319–1338. [Google Scholar] [CrossRef]
  26. Jalayer, F. Direct Probabilistic Seismic Anaysis: Implementing Non-Linear Dynamic Assessments. Ph.D. Thesis, Stanford University, Stanford, CA, USA, 2003. [Google Scholar]
  27. Stafford, P.J.; Sullivan, T.J.; Pennucci, D. Empirical correlation between inelastic and elastic spectral displacement demands. Earthq. Spectra 2016, 32, 1419–1448. [Google Scholar] [CrossRef] [Green Version]
  28. Priestley, M.N.; Calvi, G.M. Towards a capacity-design assessment procedure for reinforced concrete frames. Earthq. Spectra 1991, 7, 413–437. [Google Scholar] [CrossRef]
  29. Beyer, K.; Dazio, A.; Priestley, M.N. Seismic Design of Torsionally Eccentric Buildings with U-Shaped RC Walls; IUSS Press: Pavia, Italy, 2008. [Google Scholar]
  30. Pennucci, D.; Sullivan, T.J.; Calvi, G.M. Inelastic higher-mode response in reinforced concrete wall structures. Earthq. Spectra 2015, 31, 1493–1514. [Google Scholar] [CrossRef]
  31. Fox, M.J.; Sullivan, T.J.; Beyer, K. Evaluation of seismic assessment procedures for determining deformation demands in RC wall buildings. J. Earthq. Struct. 2015, 9, 911–936. [Google Scholar] [CrossRef] [Green Version]
  32. SANZ. Concrete Structures Standard; NZS 3101; Standards Association: Wellington, NZ, USA, 2006. [Google Scholar]
  33. Sullivan, T.J.; Salawdeh, S.; Pecker, A.; Corigliano, M.; Calvi, G.M. Soil-foundation-structure interaction considerations for performance-based design of RC wall structures on shallow foundations. In Soil-Foundation-Structure Interaction; CRC Press: Leiden, The Netherlands, 2010; pp. 193–200. [Google Scholar]
  34. Millen, M.D.; Pampanin, S.; Cubrinovski, M. An integrated performance-based design framework for building-foundation systems. J. Earthq. Eng. Struct. Dyn. 2021, 50, 718–735. [Google Scholar] [CrossRef]
  35. Sullivan, T.J.; Priestley, M.N.; Calvi, G.M. A Model Code for the Displacement-Based Seismic Design of Structures DBD12; IUSS Press: Pavia, Italy, 2012. [Google Scholar]
  36. Lupoi, G.; Franchin, P.; Lupoi, A.; Pinto, P.E. Seismic fragility analysis of structural systems. J. Eng. Mech. 2006, 132, 385–395. [Google Scholar] [CrossRef]
  37. Carr, A. RUAUMOKO, Software for Inelastic Dynamic Analysis; Department of Civil Engineering, University of Canterbury: Christchurch, New Zealand, 2021. [Google Scholar]
  38. Yeow, T.; Orumiyehei, A.; Sullivan, T.J.; MacRae, G.; Clifton, G.; Elwood, K. Seismic performance of steel friction connections considering direct-repair costs. Bull. Earthq. Eng. 2018, 16, 5963–5993. [Google Scholar] [CrossRef]
  39. Bradley, B.A. A generalized conditional intensity measure approach and holistic ground-motion selection. J. Earthq. Eng. Struct. Dyn. 2010, 39, 1321–1342. [Google Scholar] [CrossRef] [Green Version]
  40. O’Reilly, G.J.; Sullivan, T.J. Quantification of modelling uncertainty in existing Italian RC frames. J. Earthq. Eng. Struct. Dyn. 2017, 47, 1054–1074. [Google Scholar] [CrossRef]
  41. Gokkaya, B.U.; Baker, J.W.; Deierlein, G.G. Quantifying the impacts of modeling uncertainties on the seismic drift demands and collapse risk of buildings with implications on seismic design checks. J. Earthq. Eng. Struct. Dyn. 2016, 45, 1661–1683. [Google Scholar] [CrossRef]
  42. MathWorks, I. MATLAB: The Language of Technical Computing; Desktop Tools and Development Environment. Version 7. MathWorks: 2005. Available online: https://de.mathworks.com/company/aboutus/policies_statements/patents.html (accessed on 6 July 2021).
  43. Orumiyehei, A.; Sullivan, T.J. Assessment of the annual probability of failure for systems susceptible to two correlated failure mechanisms. In Proceedings of the 17th World Conference on Earthquake Engineering, Sendai, Japan, 27 September–2 October 2021. [Google Scholar]
  44. Baker, J.W. Efficient analytical fragility function fitting using dynamic structural analysis. Earthq. Spectra 2015, 31, 579–599. [Google Scholar] [CrossRef]
  45. Pennucci, D.; Sullivan, T.J.; Calvi, G.M. Performance-Based Seismic Design of Tall RC Wall Buildings; Iuss Press: Pavia, Italy, 2011. [Google Scholar]
  46. Priestley, M.N.; Seible, F.; Calvi, G.M. Seismic Design and Retrofit of Bridges; John Wiley & Sons: Ho boken, NJ, USA, 1996. [Google Scholar]
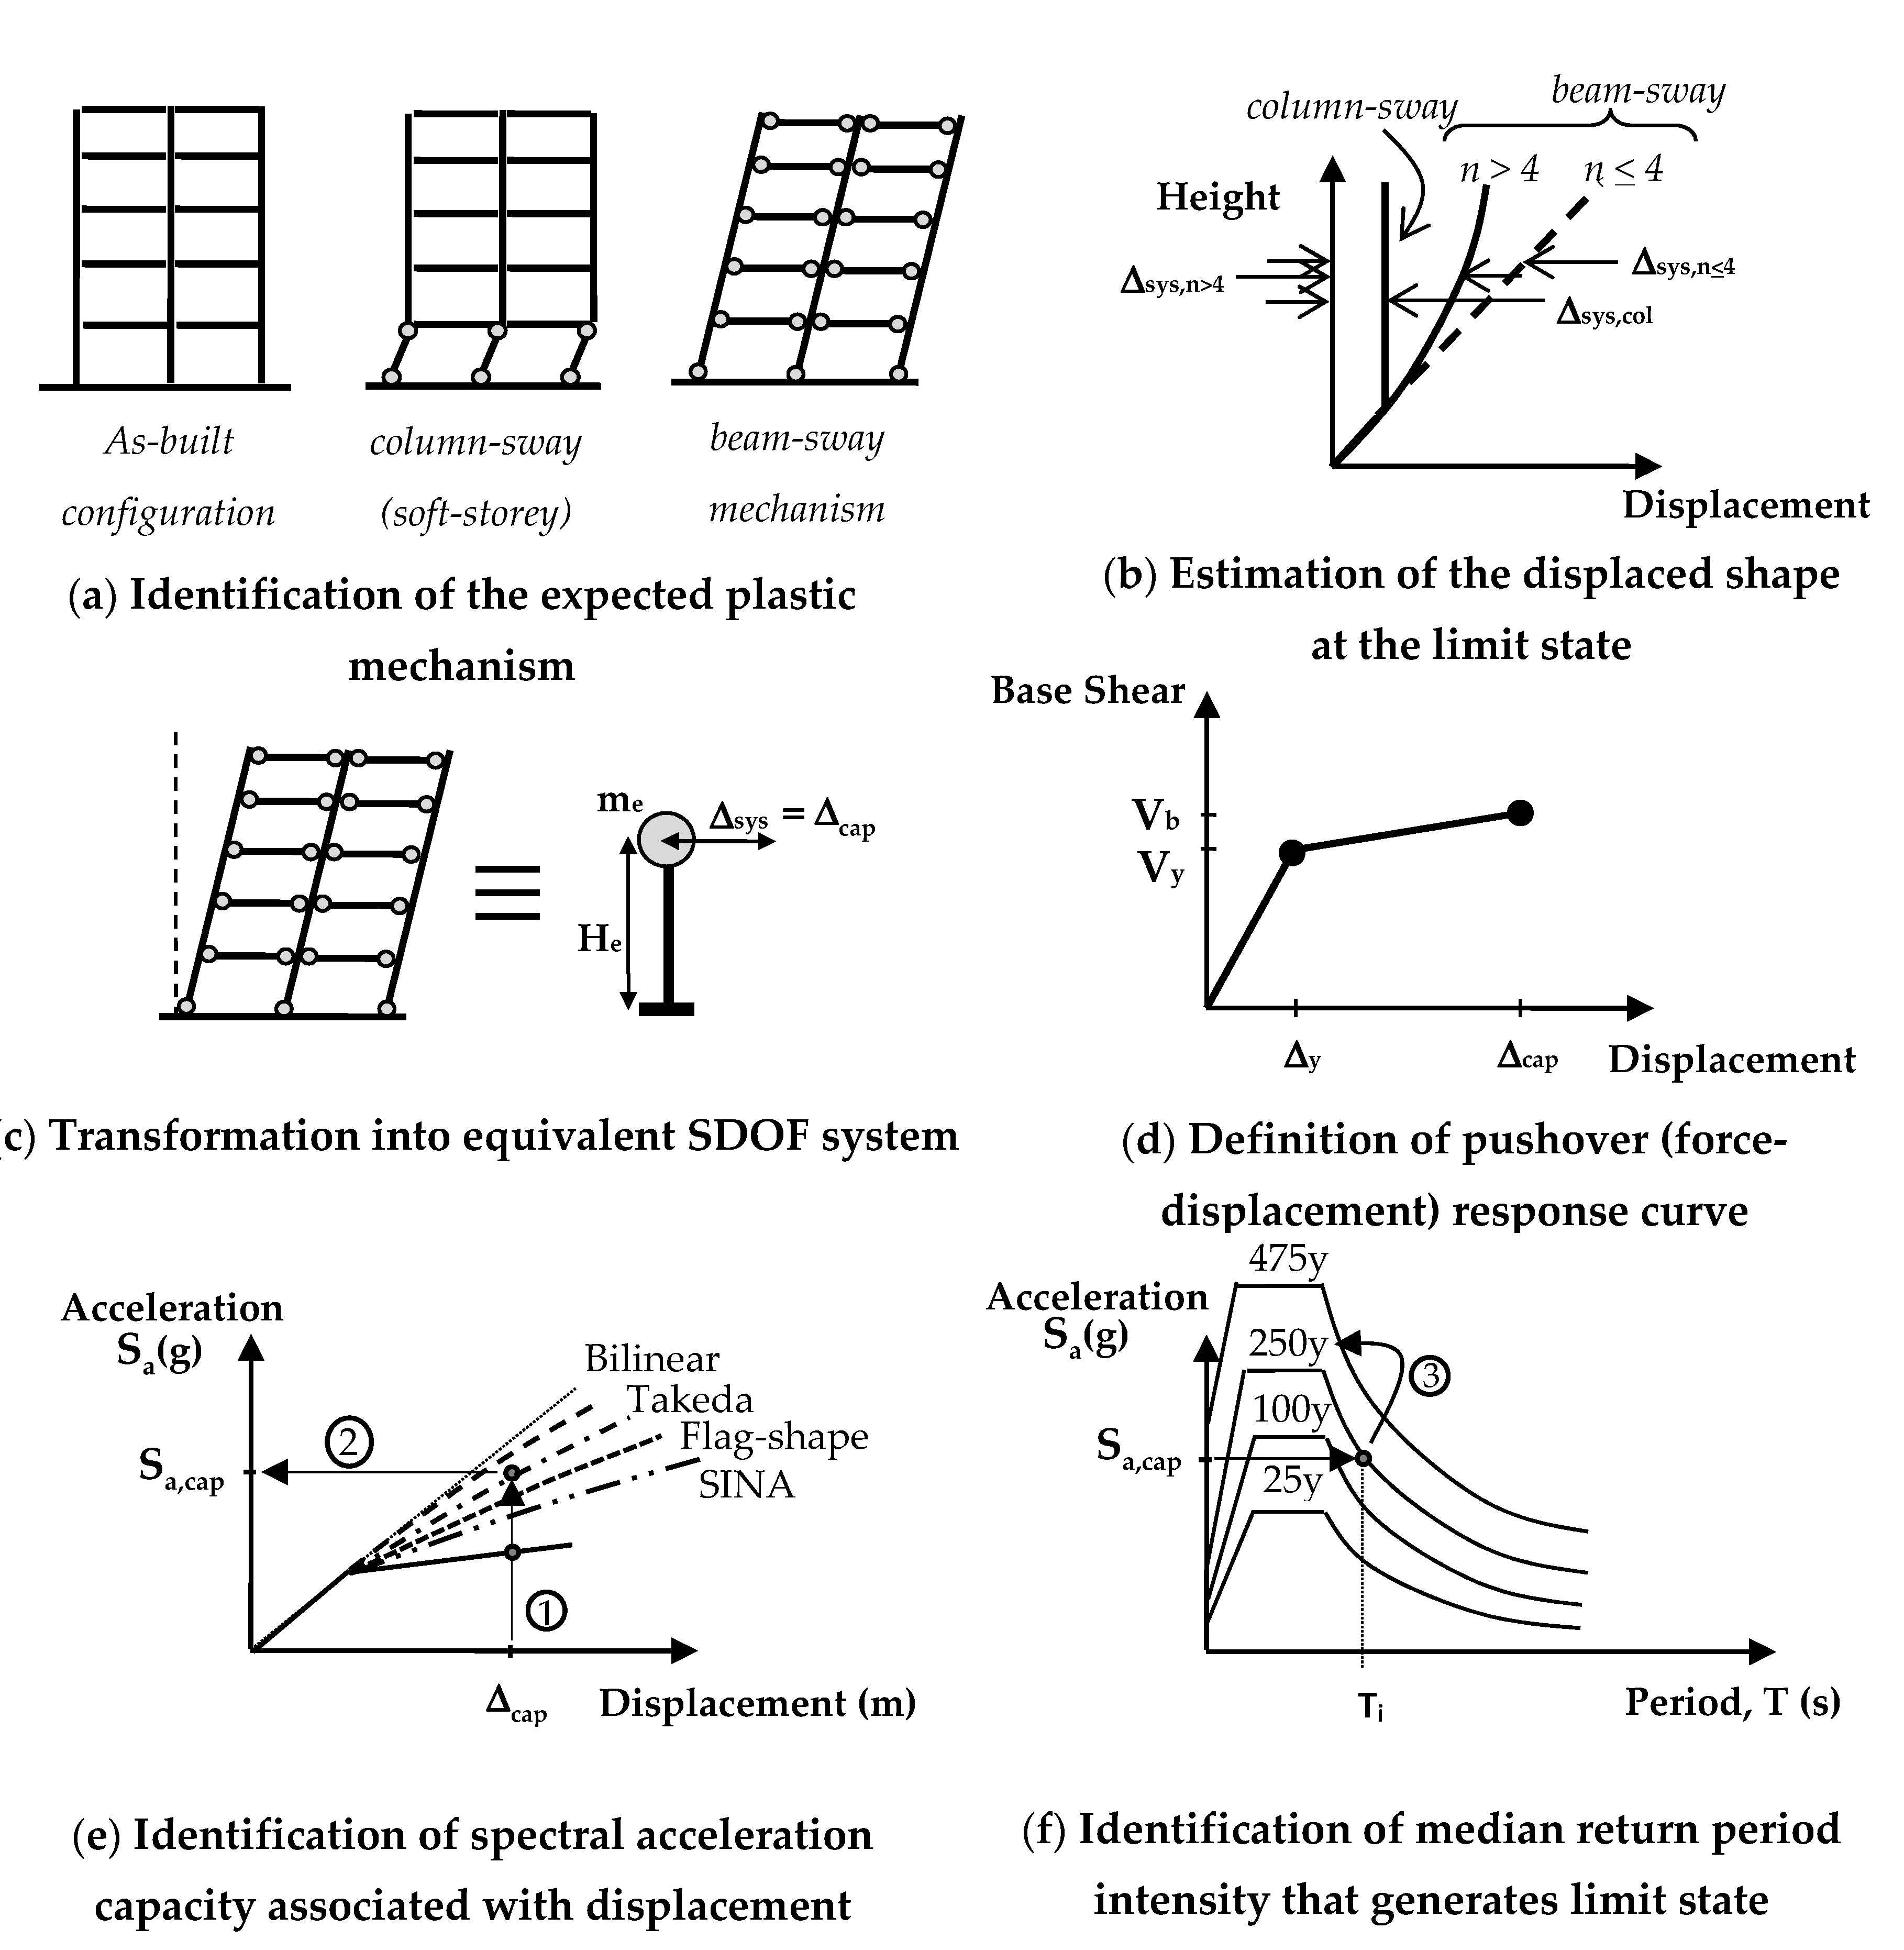
Figure 1. Overview of probabilistic displacement-based assessment approach, Adapted with permission from [12]. Copyright 2021 Journal of Earthquake Engineering.
Buildings 11 00295 g001
Figure 2. Equivalent first mode lateral displacement, shear, and moment diagrams for a cantilever RC wall building.
Buildings 11 00295 g002
Figure 3. Shear and flexural failure mechanism probability distribution.
Buildings 11 00295 g003
Figure 4. Influence of second-order P-delta effect on the lateral force-displacement response of a SDOF system (Adopted with permission from [13]. Copyright 2013 IUSS press; F is the total lateral force equivalent to base shear before considering geometric nonlinearity).
Buildings 11 00295 g004
Figure 5. Case study buildings: (a) 4-story; (b) 8-story; (c) 12-story reinforced concrete wall buildings’ layout.
Buildings 11 00295 g005
Figure 6. Probabilistic modeling approach (a) overview of variables included in the moment-curvature capacity curve and (b) sampling process for each capacity parameter.
Buildings 11 00295 g006
Figure 7. Multi-stripe analysis results for the 4-story case study building; (a) inter-story drift ratio demands obtained at each intensity level; (b) probability of limit state exceedance and associated fragility curve.
Buildings 11 00295 g007
Figure 8. Multi-stripe analysis results for the 8-story case study building; (a) inter-story drift ratio demands obtained at each intensity level; (b) probability of limit state exceedance and associated fragility curve.
Buildings 11 00295 g008
Figure 9. Multi-stripe analysis results for the 12-story case study building; (a) inter-story drift ratio demands obtained at each in-tensity level; (b) probability of limit state exceedance and associated fragility curve.
Buildings 11 00295 g009
Table 1. Median b values obtained from regression, as a function of period and hysteretic model, for use in Equation (7).
PeriodBilinearTakedaFlag (λ = 5.67)SINA
T(s) b ^ β b ^ β b ^ β b ^ β
0. 3.100.085.550.275.650.215.890.22
0.2 1.540.022.160.082.870.044.050.21
0.3 1.300.041.720.122.050.202.450.24
0.4 1.240.051.490.081.860.182.630.26
0.5 1.180.051.440.091.730.152.040.24
0.6 1.140.071.360.091.620.111.790.16
0.8 1.090.051.290.071.580.071.710.16
1.0 1.100.081.230.061.510.071.570.12
1.5 1.120.101.200.121.370.061.310.10
2.0 1.100.071.230.071.470.101.300.07
2.5 1.170.101.240.071.450.091.260.09
3.0 1.240.141.280.111.480.141.330.12
b ^ indicates the median of the b-values assuming a lognormal distribution; β represents the associated dispersion, λ is used to characterize the flag-shape hysteretic model; refer to [12].
Table 2. Generalization of the proposed ‘b’ value to short and medium period ranges.
PeriodBilinearTakedaFlag (λ = 5.67)SINA
T(s)bβbβbβbβ
0.2 ≤ T < 0.6 1.280.121.570.241.860.342.500.42
0.6 ≤ T ≤ 3.51.120.101.260.121.490.121.380.17
Table 3. Uncertain modeling parameters considered for three case study buildings.
Case Study *My (kN·m)βIeff (m4)β ϕ y ( m 1 ) β ϕ u l t ( m 1 ) β
4-story 20,8200.30.840.38.33 × 10−40.33.5 × 10−30.3
8-story 41,6770.32.240.36.25 × 10−50.32.62 × 10−30.3
12-story 76,5580.34.120.36.25 × 10−50.32.62 × 10−30.3
* Note that in addition to the parameters listed above, dispersions of 0.6 and 0.1 were considered for damping coefficient and seismic mass, respectively [40].
Table 4. Median intensity and dispersion for different failure limit states obtained via rigorous MSA and Mont Carlo simulations.
Limit State4-Story8-Story12-Story
S ^ a [ g ] β S ^ a [ g ] β S ^ a [ g ] β
IDR = 0.010.390.500.180.400.220.60
IDR = 0.020.800.450.400.500.580.70
Shear failure0.520.700.280.700.450.95
Curvature failure0.490.550.330.580.500.45
Table 5. Annual probability of limit state exceedance obtained for the three case study buildings through rigorous analysis.
MechanismAPOE * 4-StoryAPOE 8-StoryAPOE 12-Story
IDR1 = 0.0138 × 10−435 × 10−431 × 10−4
IDR2 = 0.0215 × 10−413 × 10−48 × 10−4
Shear32 × 10−425 × 10−418 × 10−4
Curvature31 × 10−418 × 10−49 × 10−4
* APOE: annual probability of exceedance.
Table 6. Median intensity associated with different failure mechanisms found through the simplified approach and multi-stripe analysis (MSA).
Limit States4-Story, Sa(T1) [g]8-Story, Sa(T1) [g]12-Story, Sa(T1) [g]
SimplifiedMSASimplifiedMSASimplifiedMSA
IDR = 0.010.390.390.200.180.300.22
IDR = 0.020.780.800.390.400.570.58
Shear0.580.520.340.280.500.45
Curvature0.430.490.340.330.460.50
Table 7. Annual probability of exceeding different limit states for the case study buildings obtained through rigorous assessment and via the simplified approach with assumed values of total dispersion.
Limit StatesAPOE * 4-StoryAPOE 8-StoryAPOE 12-Story
SimplifiedRigorousSimplifiedRigorousSimplifiedRigorous
βAssumedβRigorousβAssumedβRigorousβAssumedβRigorous
IDR13.94 × 10−33.80 × 10−33.23 × 10−33.50 × 10−32.00 × 10−33.10 × 10⁻³
IDR21.50 × 10−31.50 × 10−31.34 × 10−31.30 × 10−37.90 × 10−48.40 × 10⁻⁴
Shear3.13 × 10−33.20 × 10−32.74 × 10−32.50 × 10−31.29 × 10−31.77 × 10⁻³
Curvature3.60 × 10−33.10 × 10−31.75 × 10−31.80 × 10−31.11 × 10−39.00 × 10⁻⁴
* APOE: annual probability of exceedance.
Table 8. Annual probability of exceeding limit states for the case study buildings obtained through rigorous multi-stripe analyses and via the simplified approach using rigorous (numerically found) values of total dispersion.
Limit StatesAPOE * 4-StoryAPOE 8-StoryAPOE 12-Story
SimplifiedRigorousSimplifiedRigorousSimplifiedRigorous
βRigorousβRigorousβRigorousβRigorousβRigorousβRigorous
IDR14.10 × 10−33.80 × 10−33.13 × 10−33.50 × 10−32.16 × 10−33.10 × 10⁻³
IDR21.50 × 10−31.50 × 10−31.39 × 10−31.30 × 10−31.02 × 10−38.40 × 10⁻⁴
Shear2.95 × 10−33.20 × 10−32.60 × 10−32.50 × 10−31.68 × 10−31.77 × 10⁻³
Curvature3.80 × 10−33.10 × 10−31.87 × 10−31.80 × 10−31.06 × 10−39.00 × 10⁻⁴
* APOE: annual probability of exceedance.
Table 9. Annual probability of exceedance limit state accounting for three failure mechanisms before and after the retrofitting process.
BuildingLS1LS2LS3LS4Simultaneous Failures and Retrofit
Retrofit NoneRetrofit LS[1]Retrofit LS(1,2)Retrofit LS(1,2,3)
4-story4.10 × 10−31.5 × 10−32.95 × 10−33.35 × 10−311.8 × 10−37.78 × 10−36.29 × 10−33.35 × 10−3
8-story3.13 × 10−31.39 × 10−32.60 × 10−31.87 × 10−38.97 × 10−35.85 × 10−34.47 × 10−31.87 × 10⁻³
12-story2.16 × 10−31.02 × 10−31.68 × 10−31.06 × 10−35.91 × 10−33.76 × 10−32.75 × 10−31.06 × 10⁻³
Publisher’s Note: MDPI stays neutral with regard to jurisdictional claims in published maps and institutional affiliations.