
A Study on Evaluation of Influencing Factors for Sustainable Development of Smart Construction Enterprises: Case Study from China


Abstract
1. Introduction
1.1. Background
1.2. Literature Review
1.3. Aim and Question
2. Research Design
2.1. Study Area and Enterprise
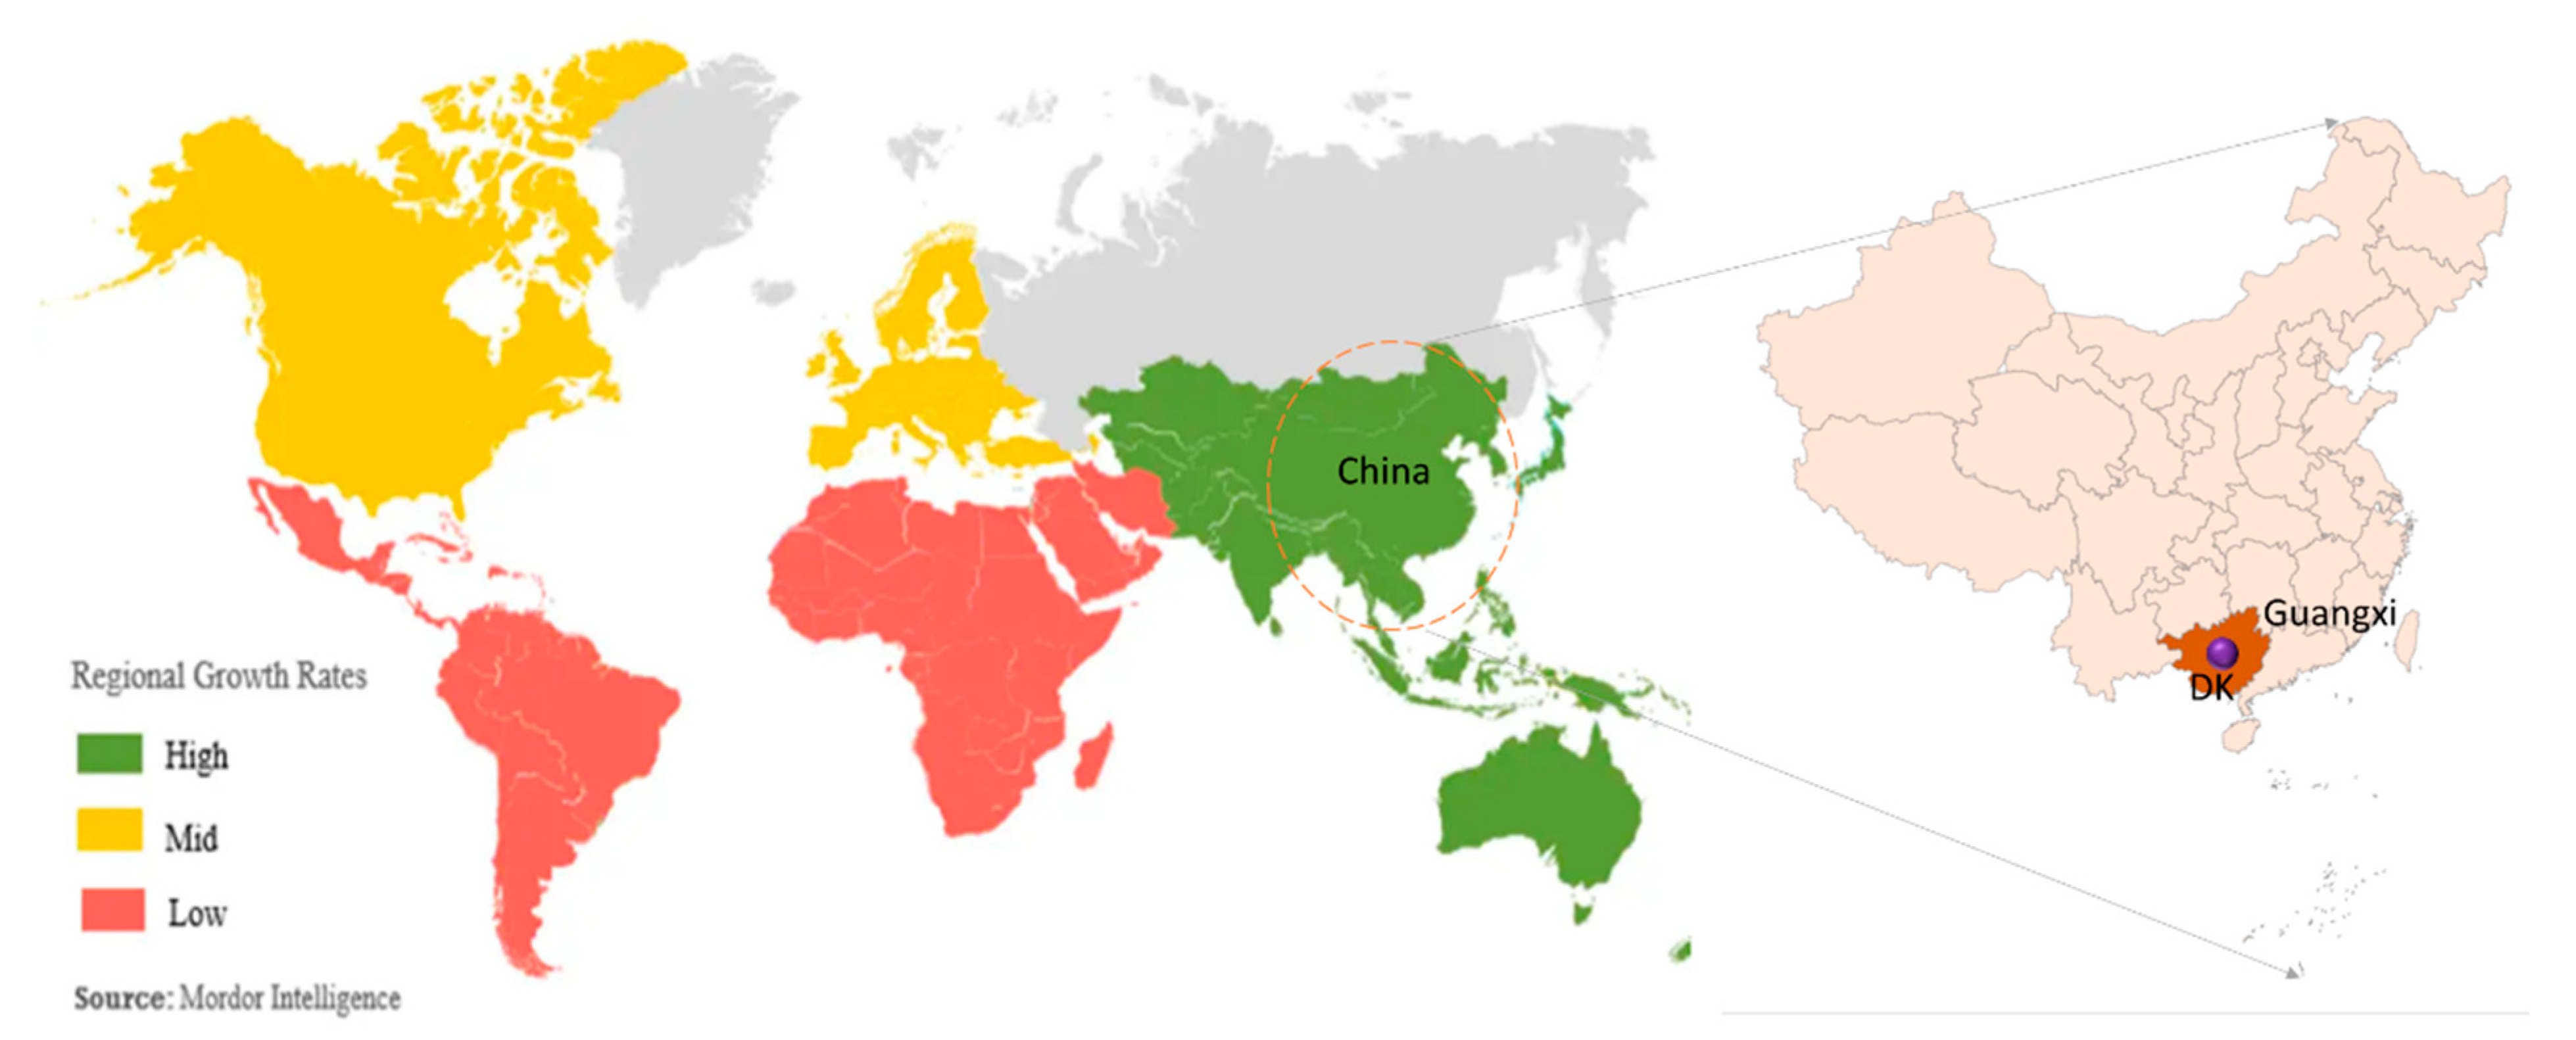
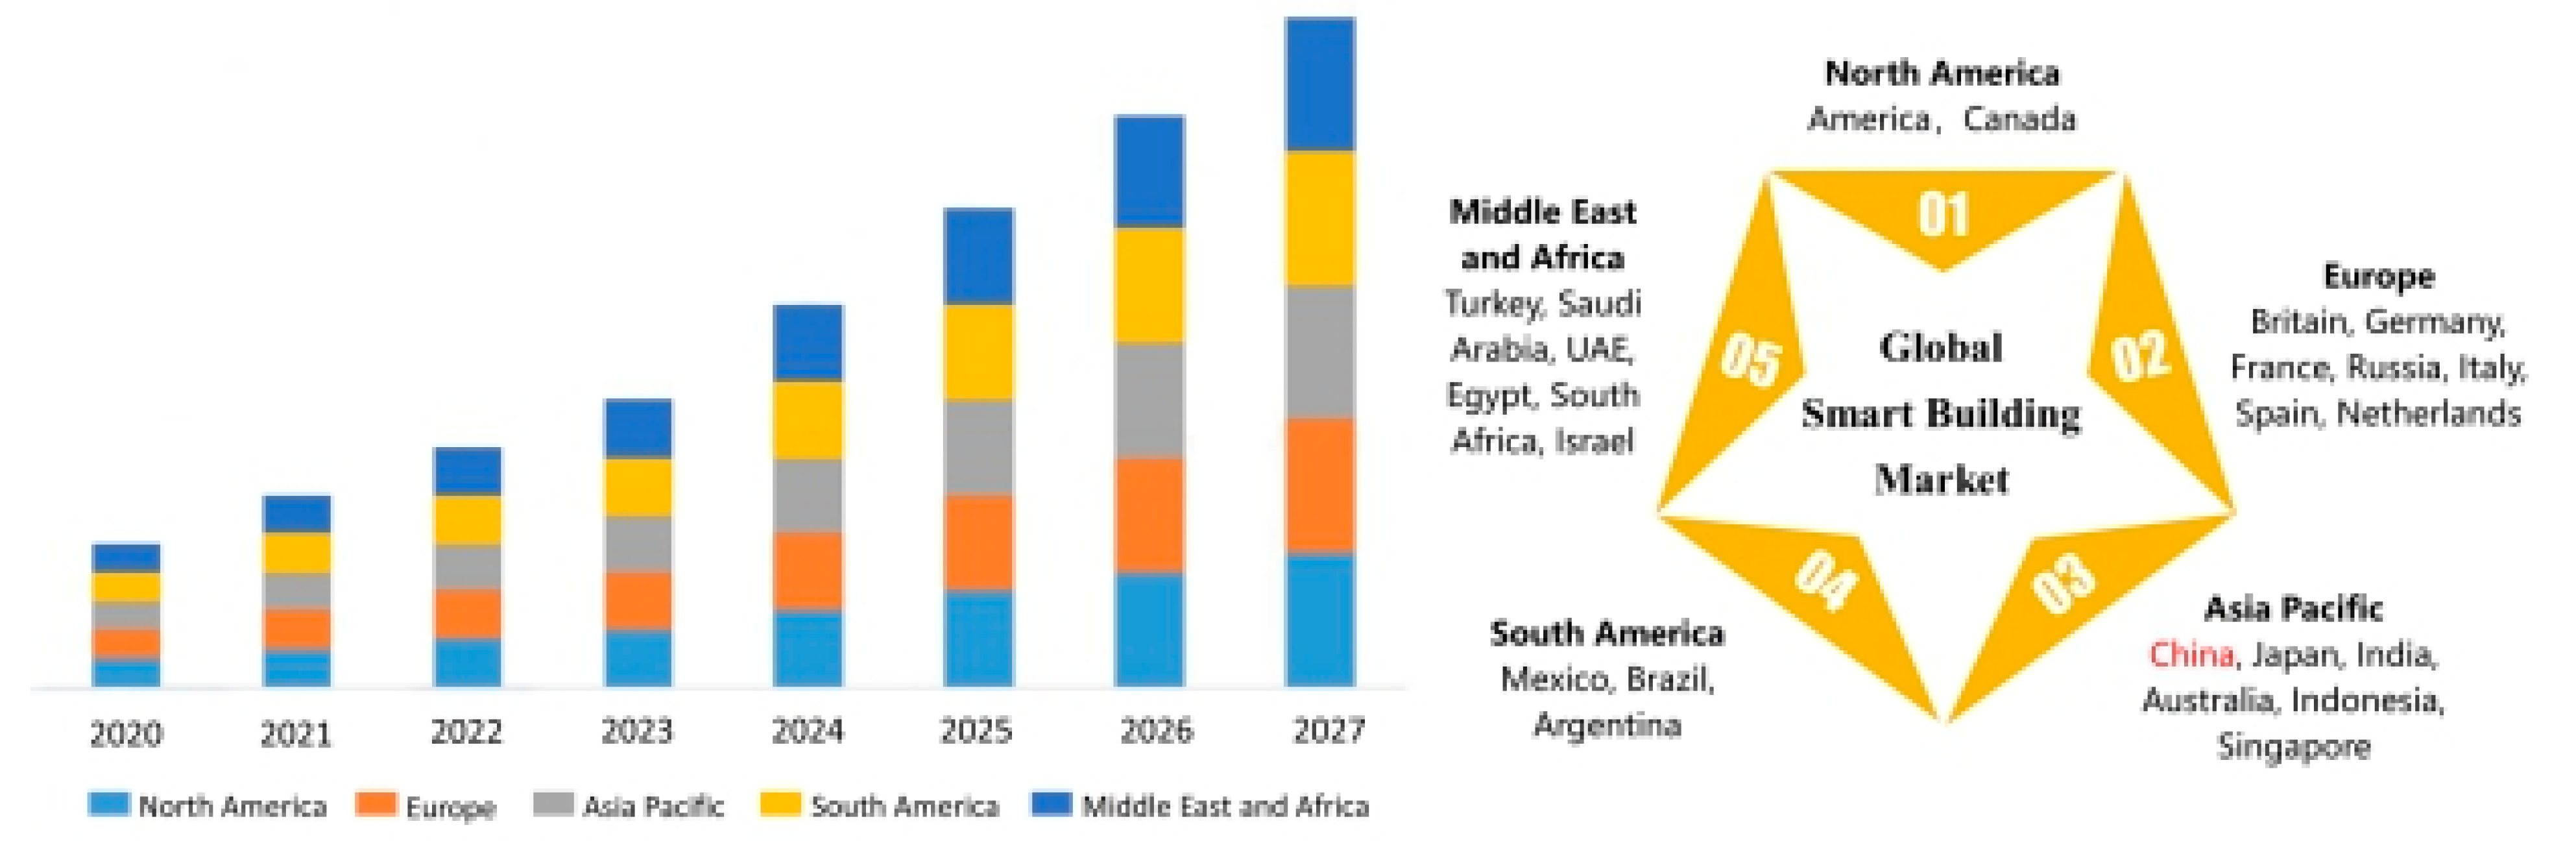
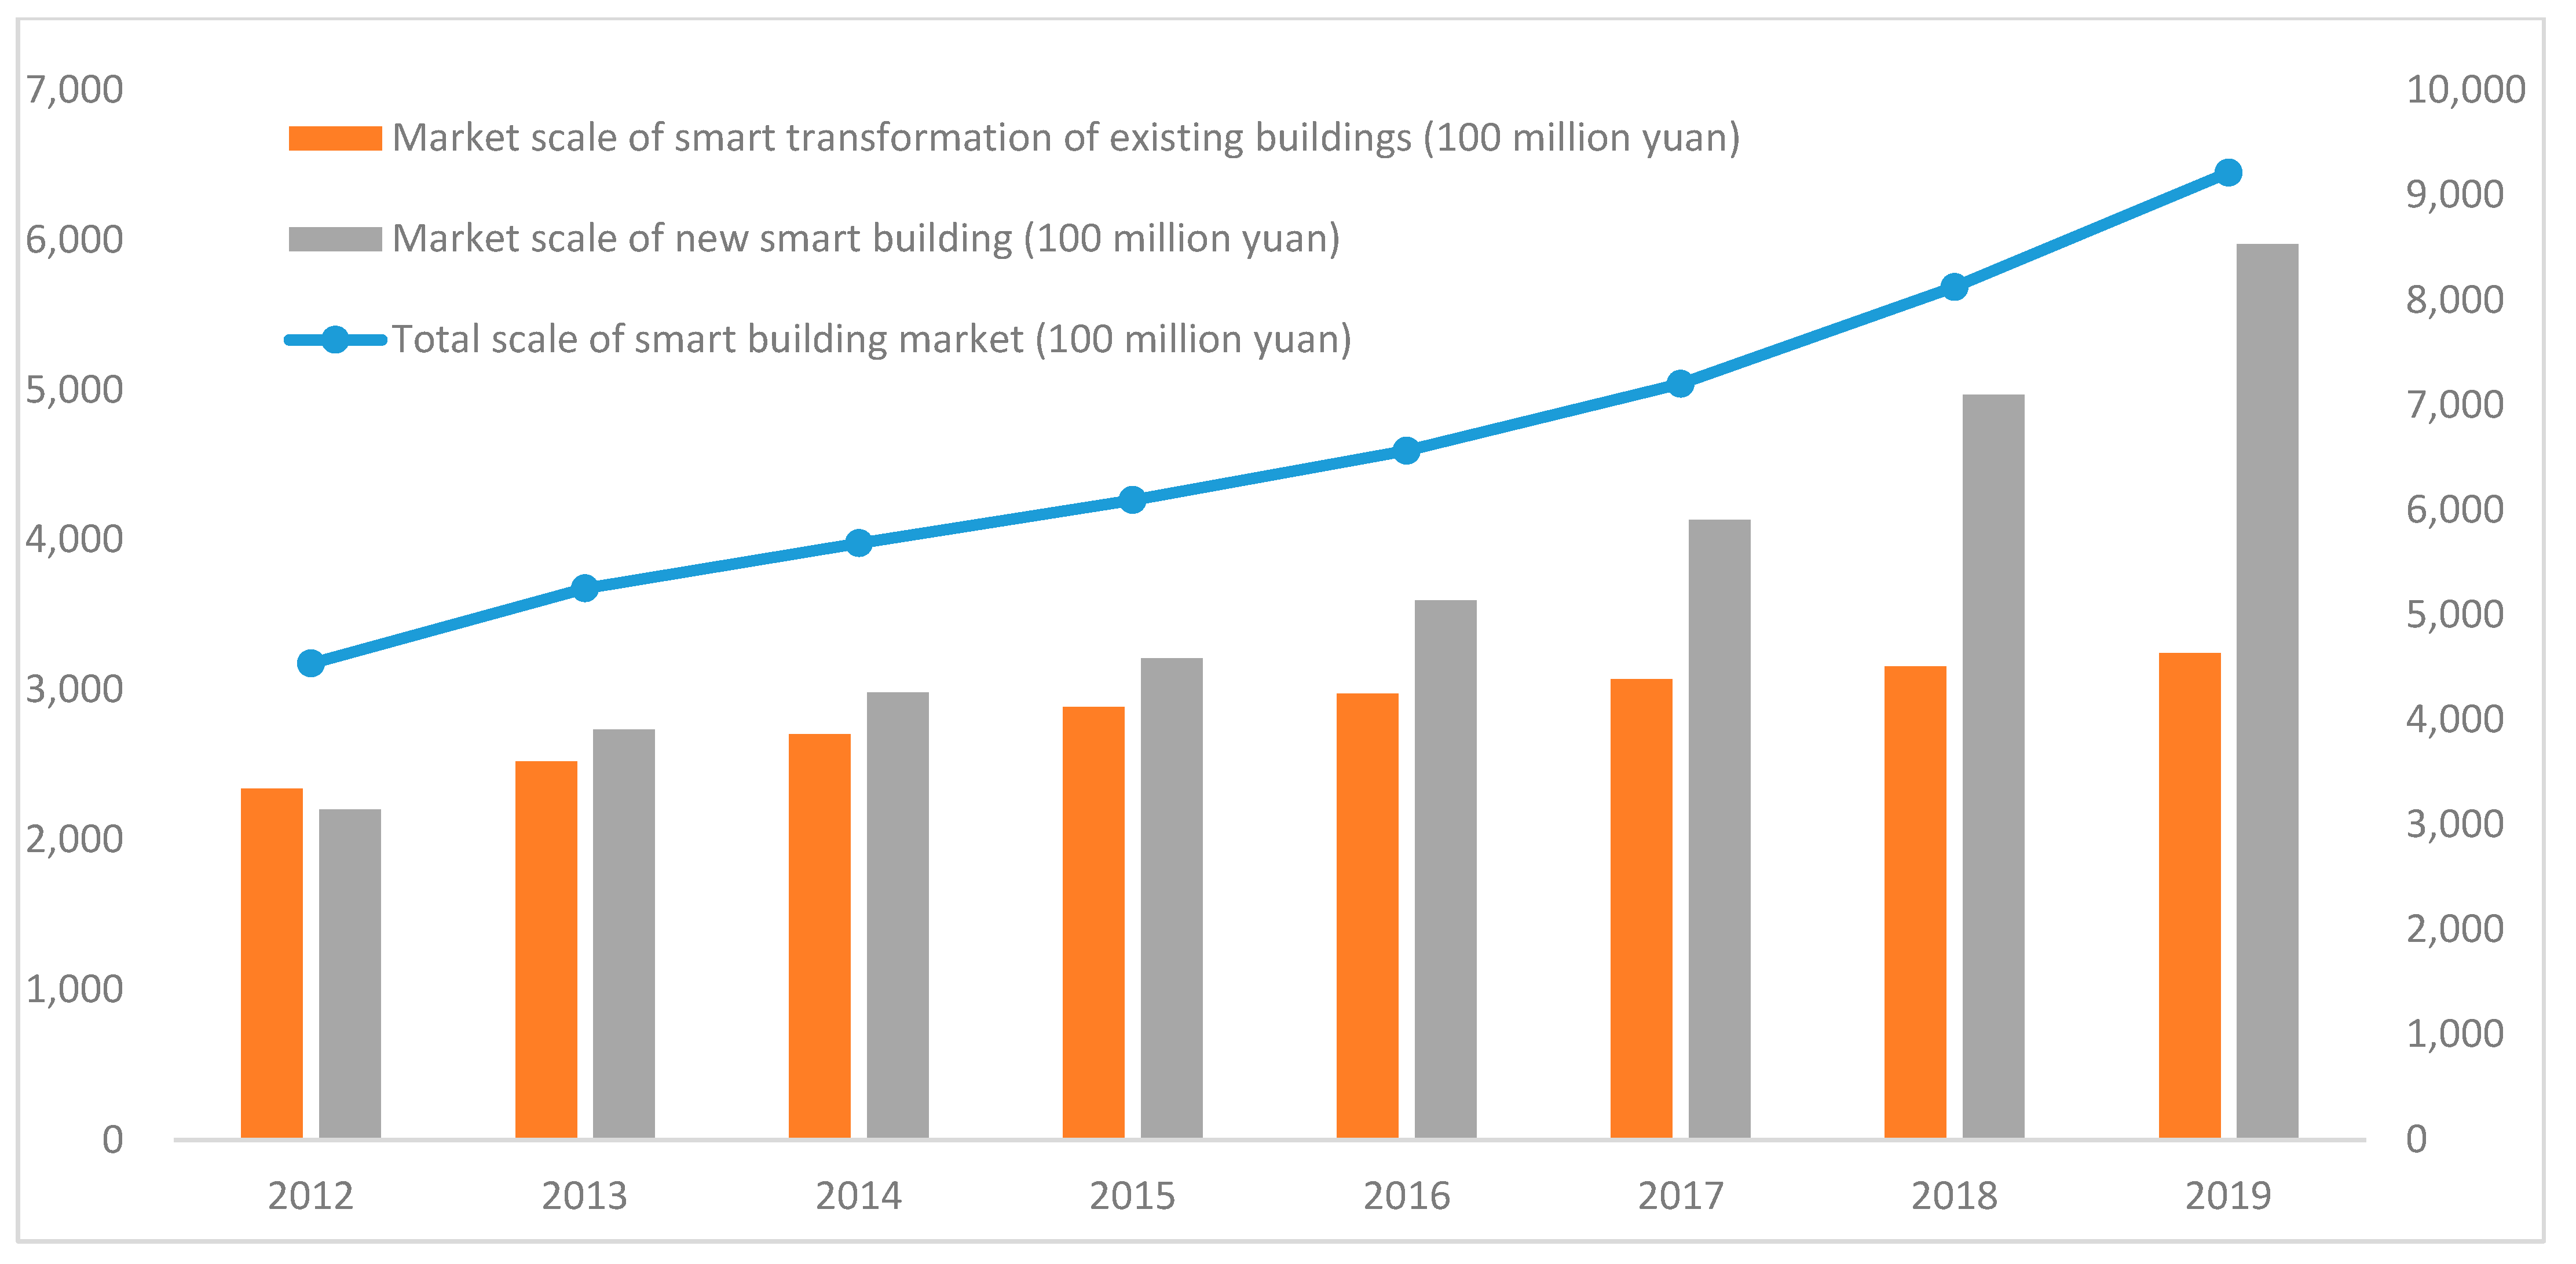
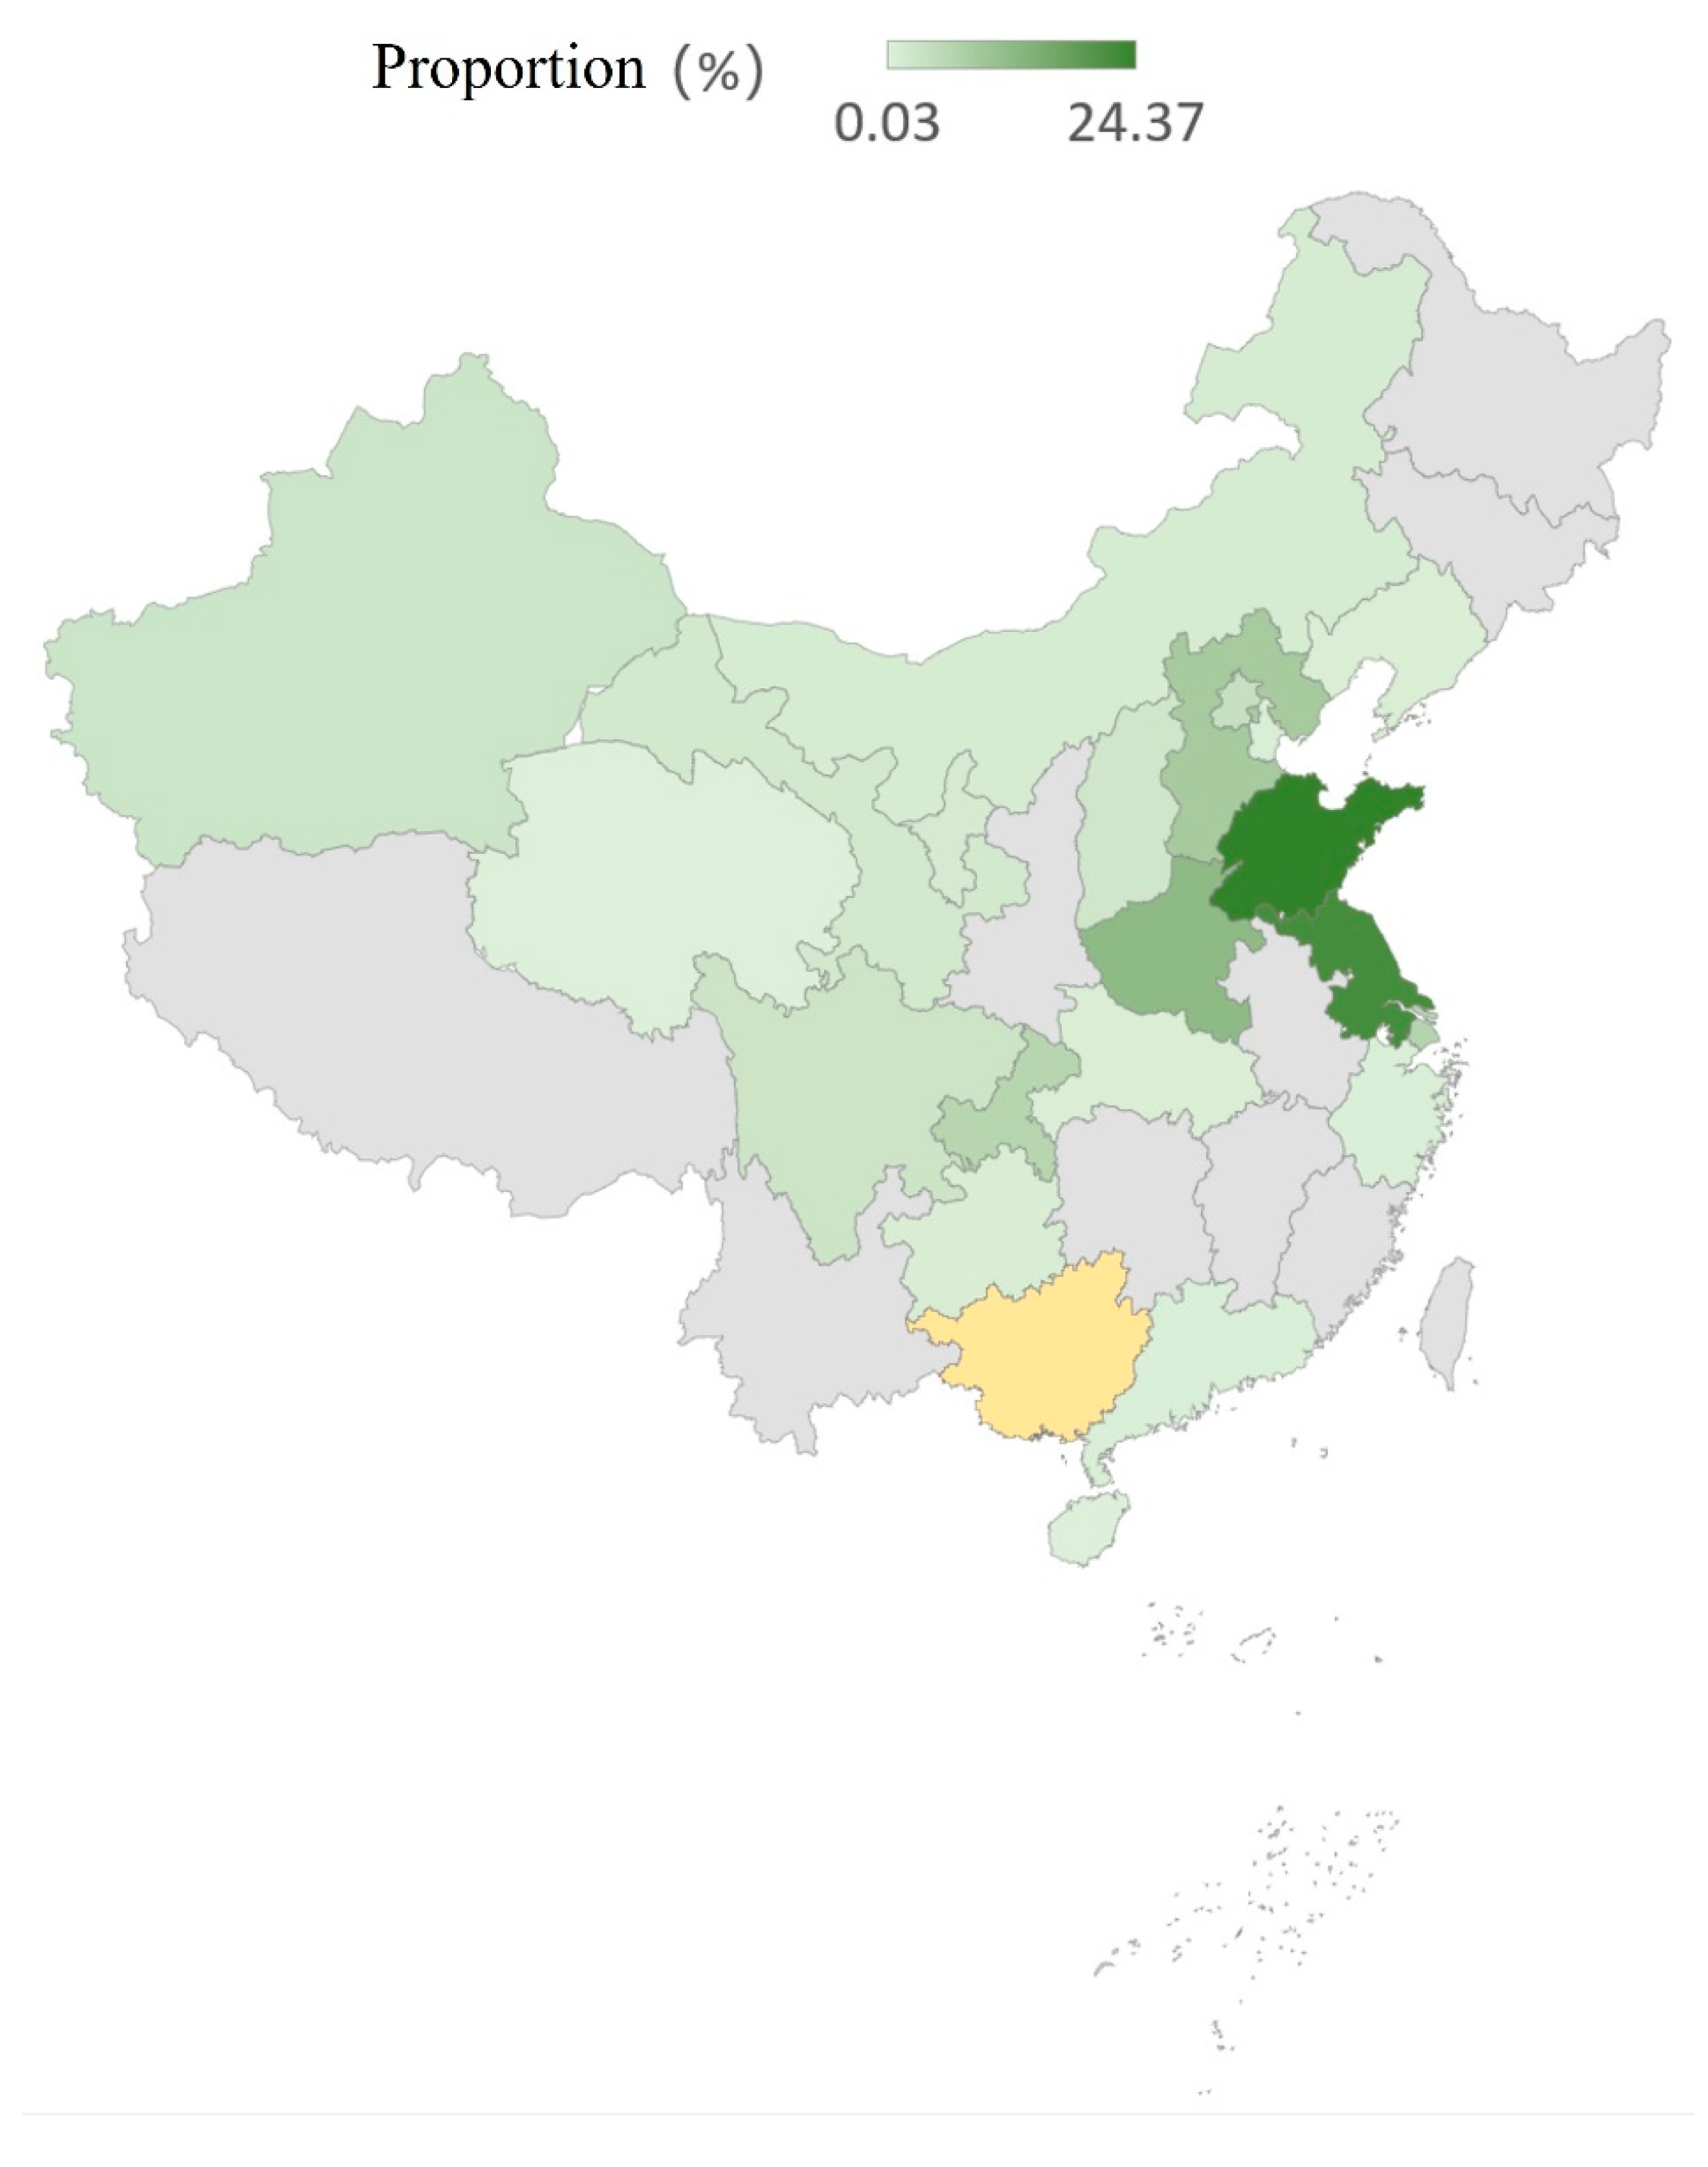
2.1.1. China
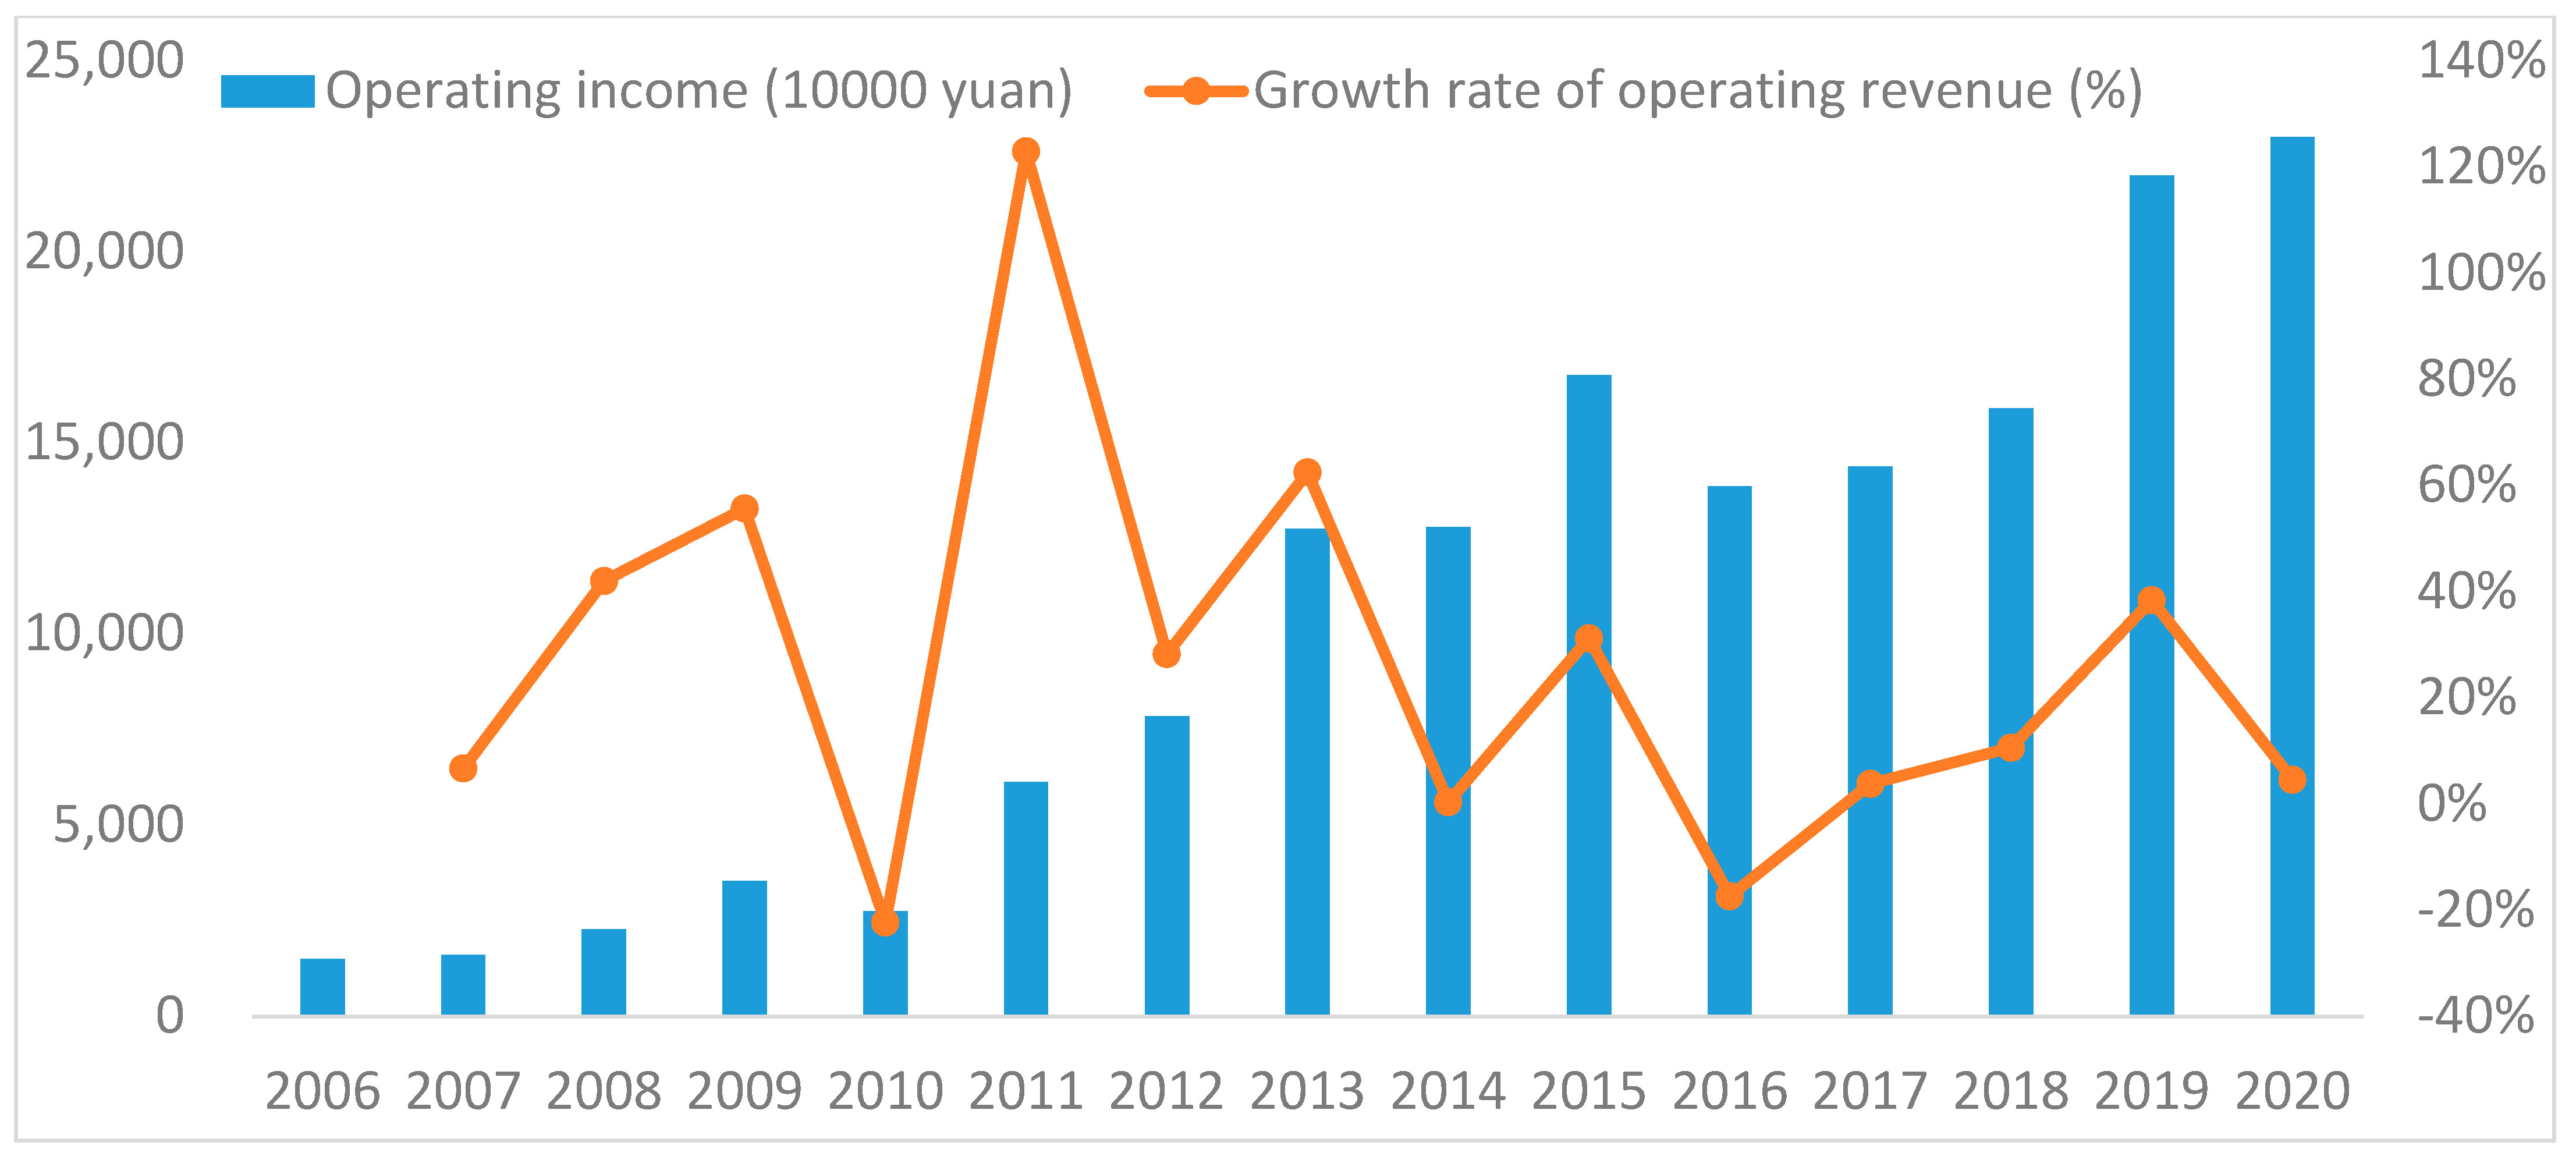
2.1.2. DK Company
2.2. Research Methods
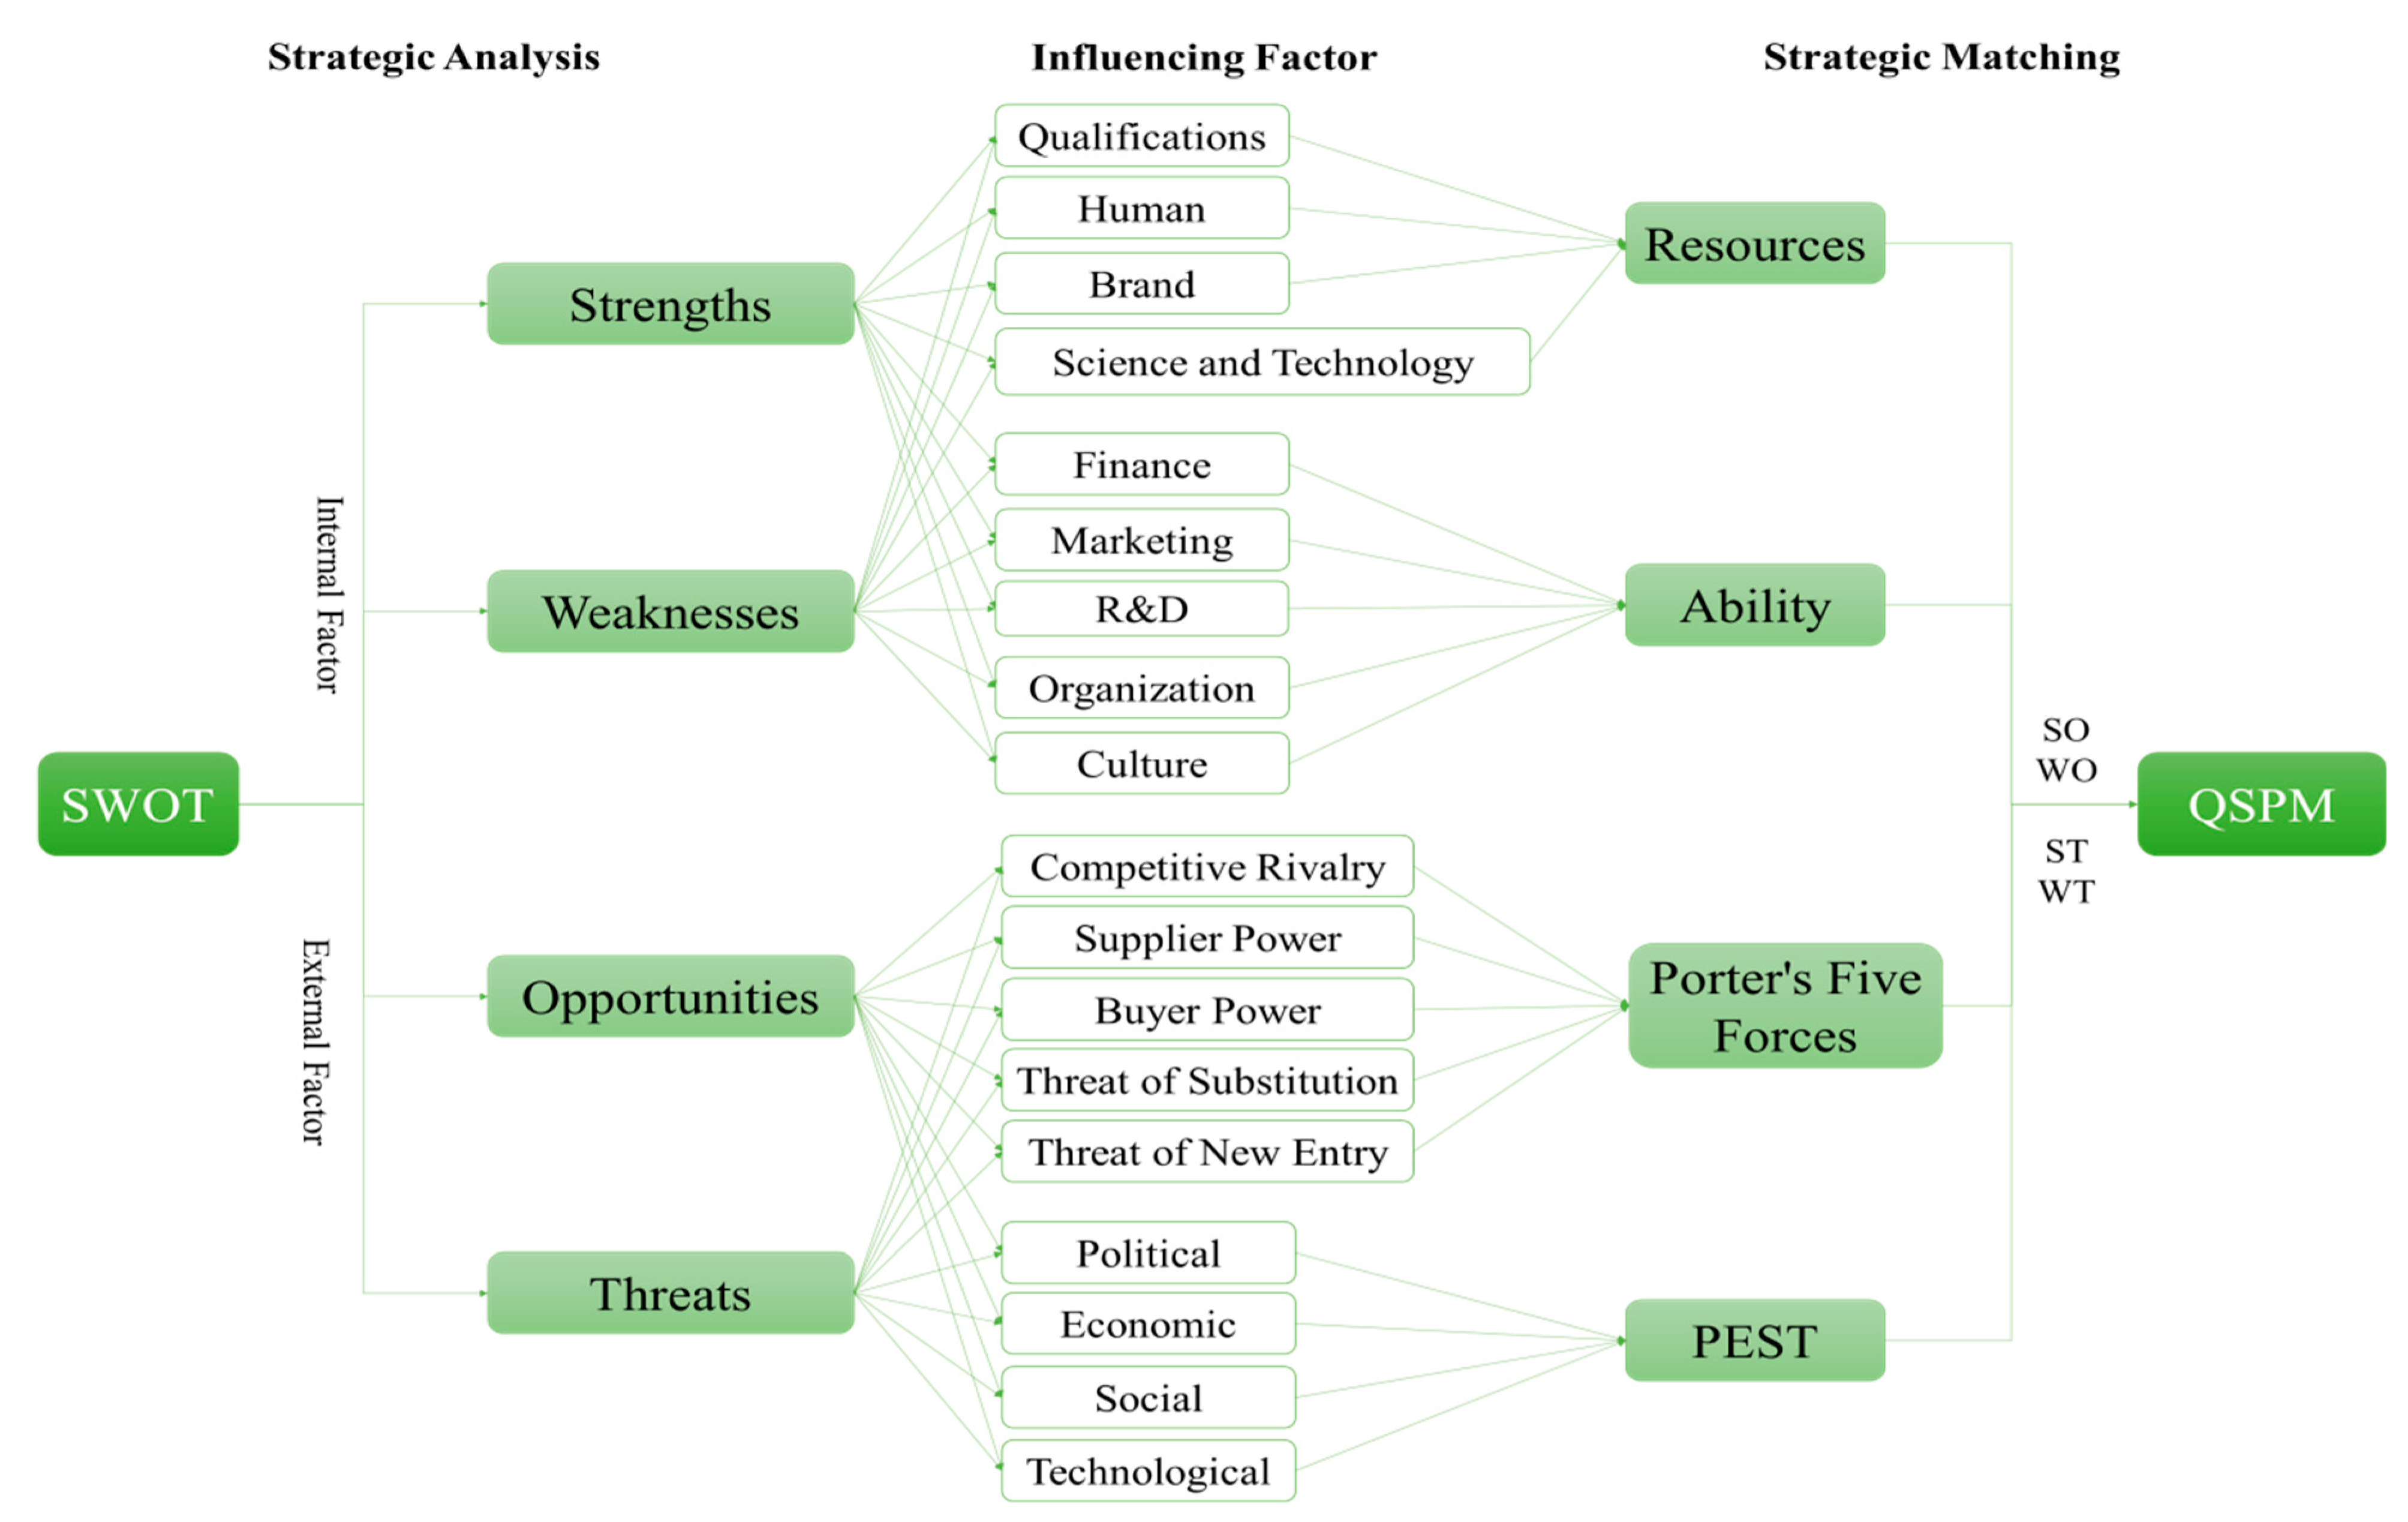
2.2.1. Method Evaluation and Selection
2.2.2. Cross Application and Quantification of Multiple Methods
- (1)
- Qualitative analysis
- (2)
- Quantitative analysis
- S and —Strengths and the score of each respondent’s evaluation.
- W and —Weaknesses and the score of each respondent’s evaluation.
- O and —Opportunities and the score of each respondent’s evaluation.
- T and —Threats and the score of each respondent’s evaluation.
- —The weight of each question item in the questionnaire.
- —The center of gravity coordinates of the strategic quadrilateral.
- i and j—The number of question item and respondent.
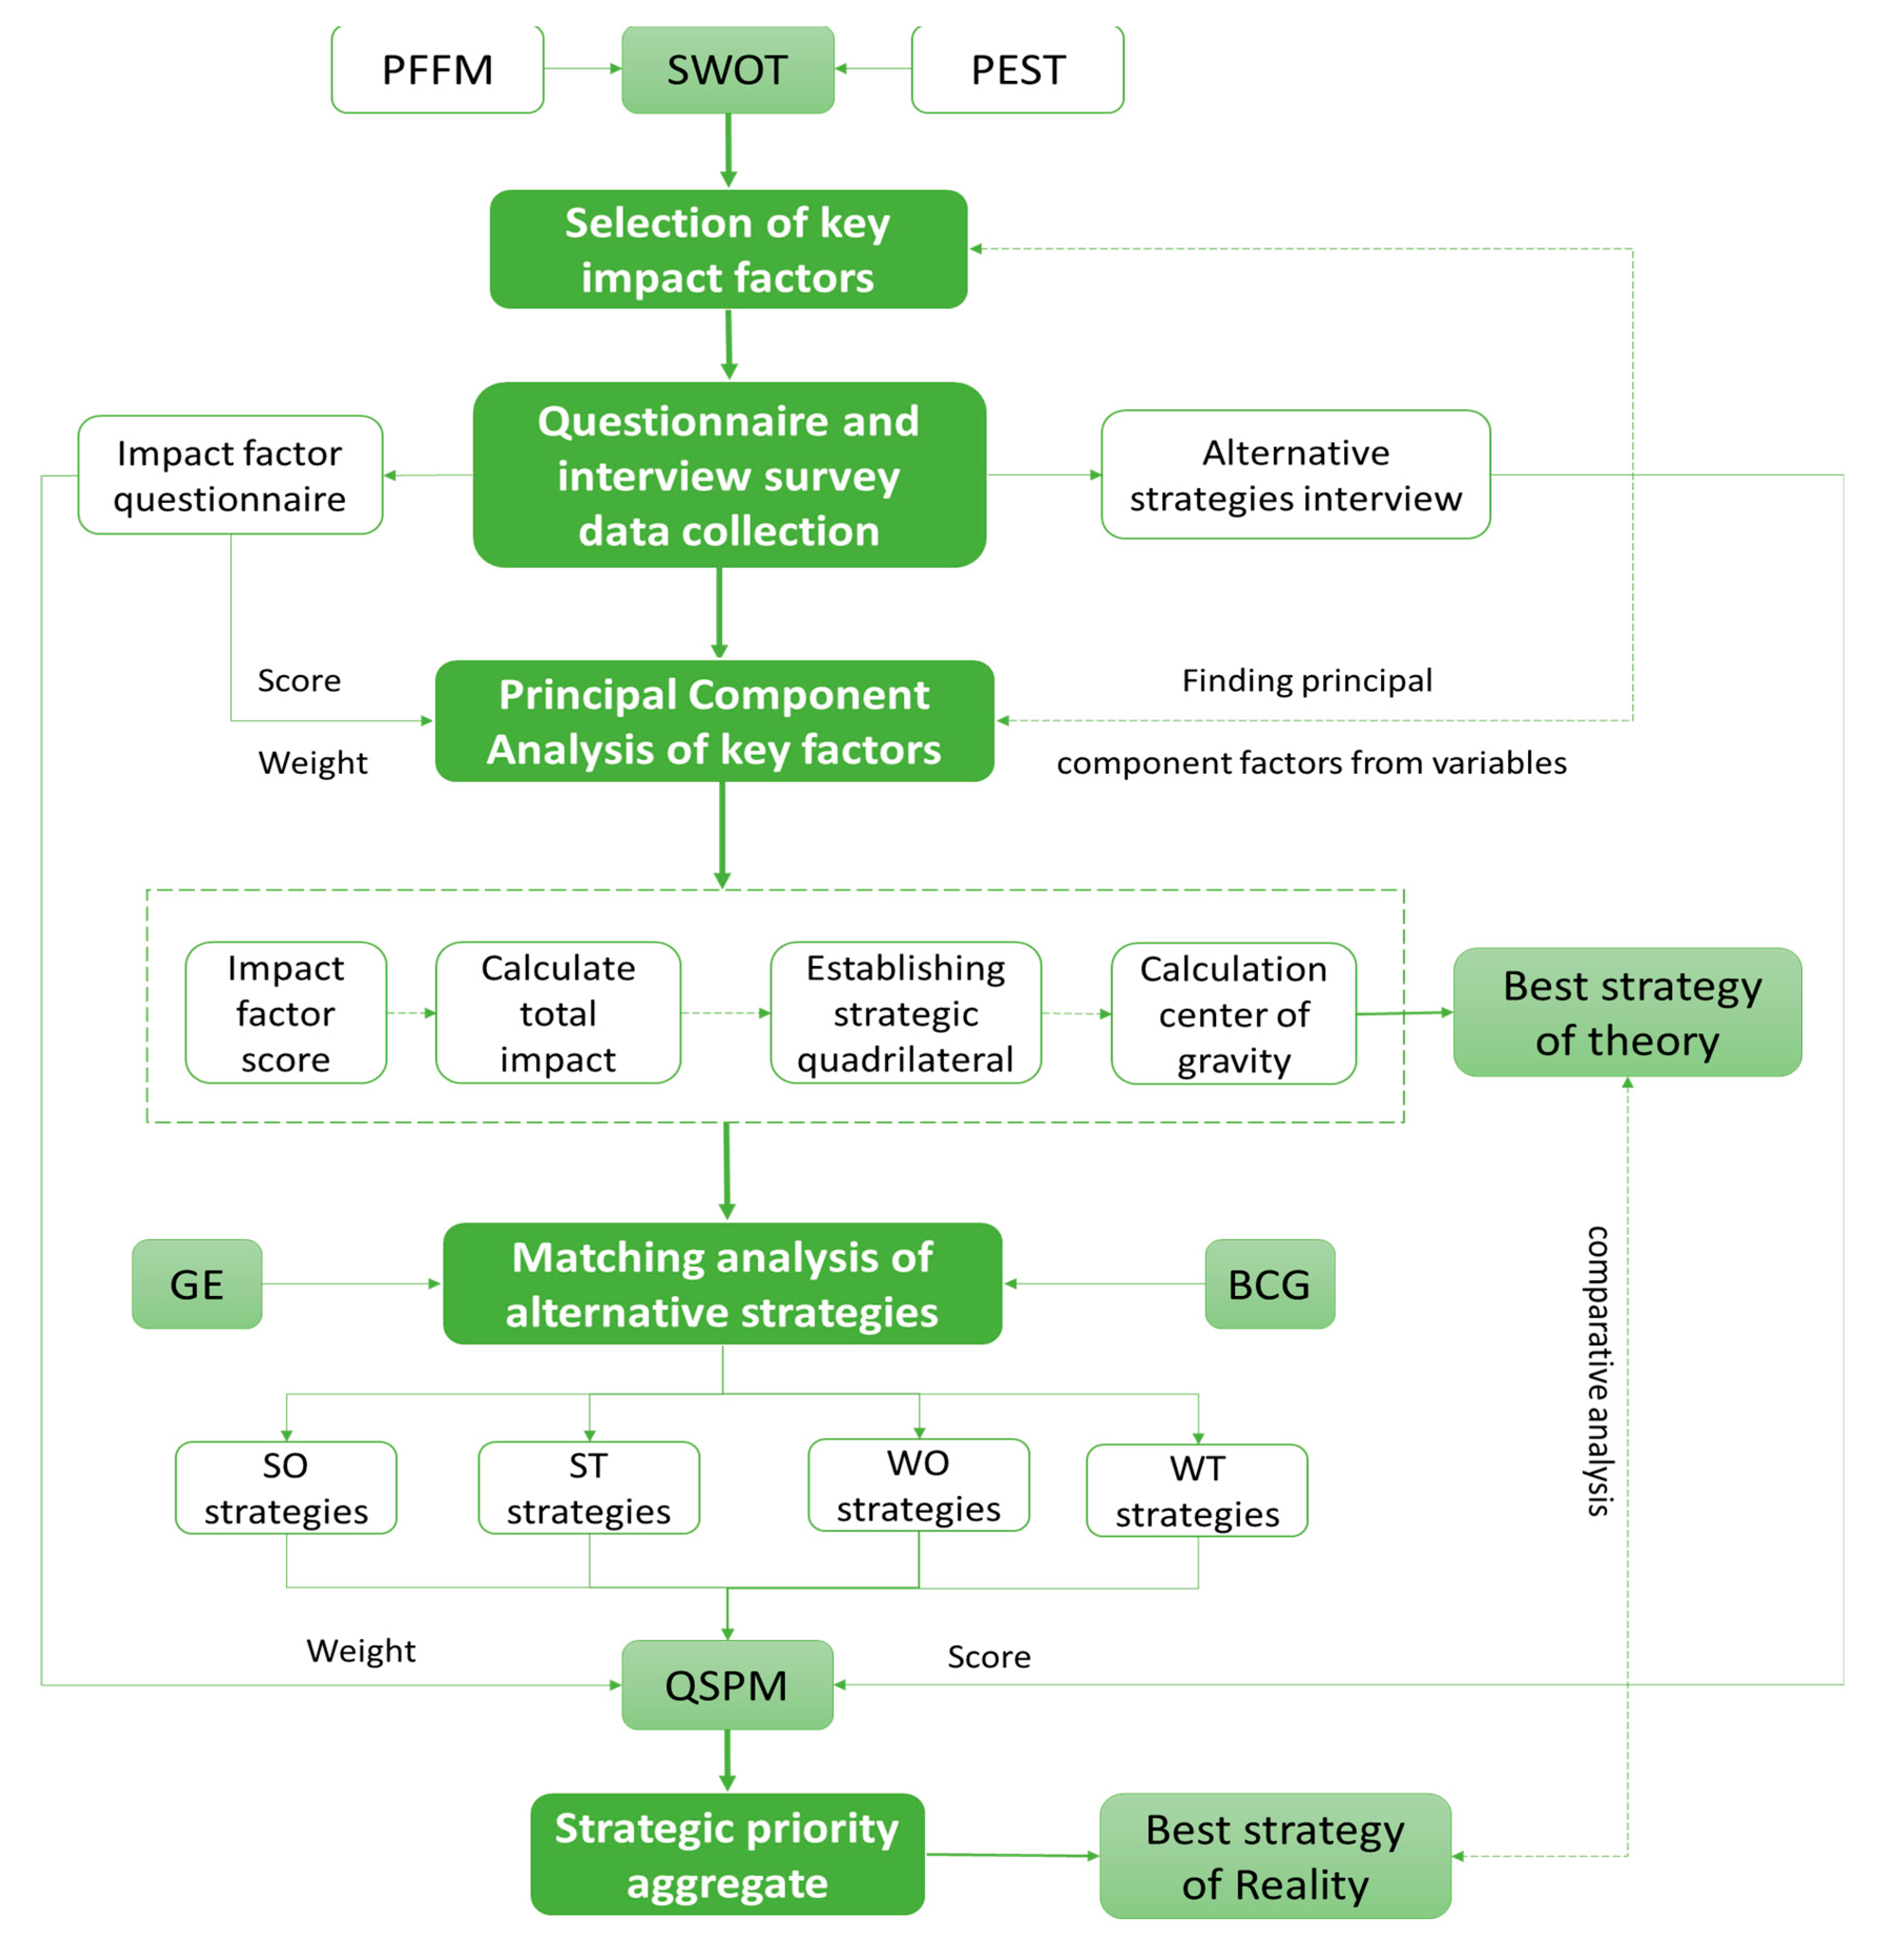
2.3. Research Steps
2.4. Data Sources and Processing
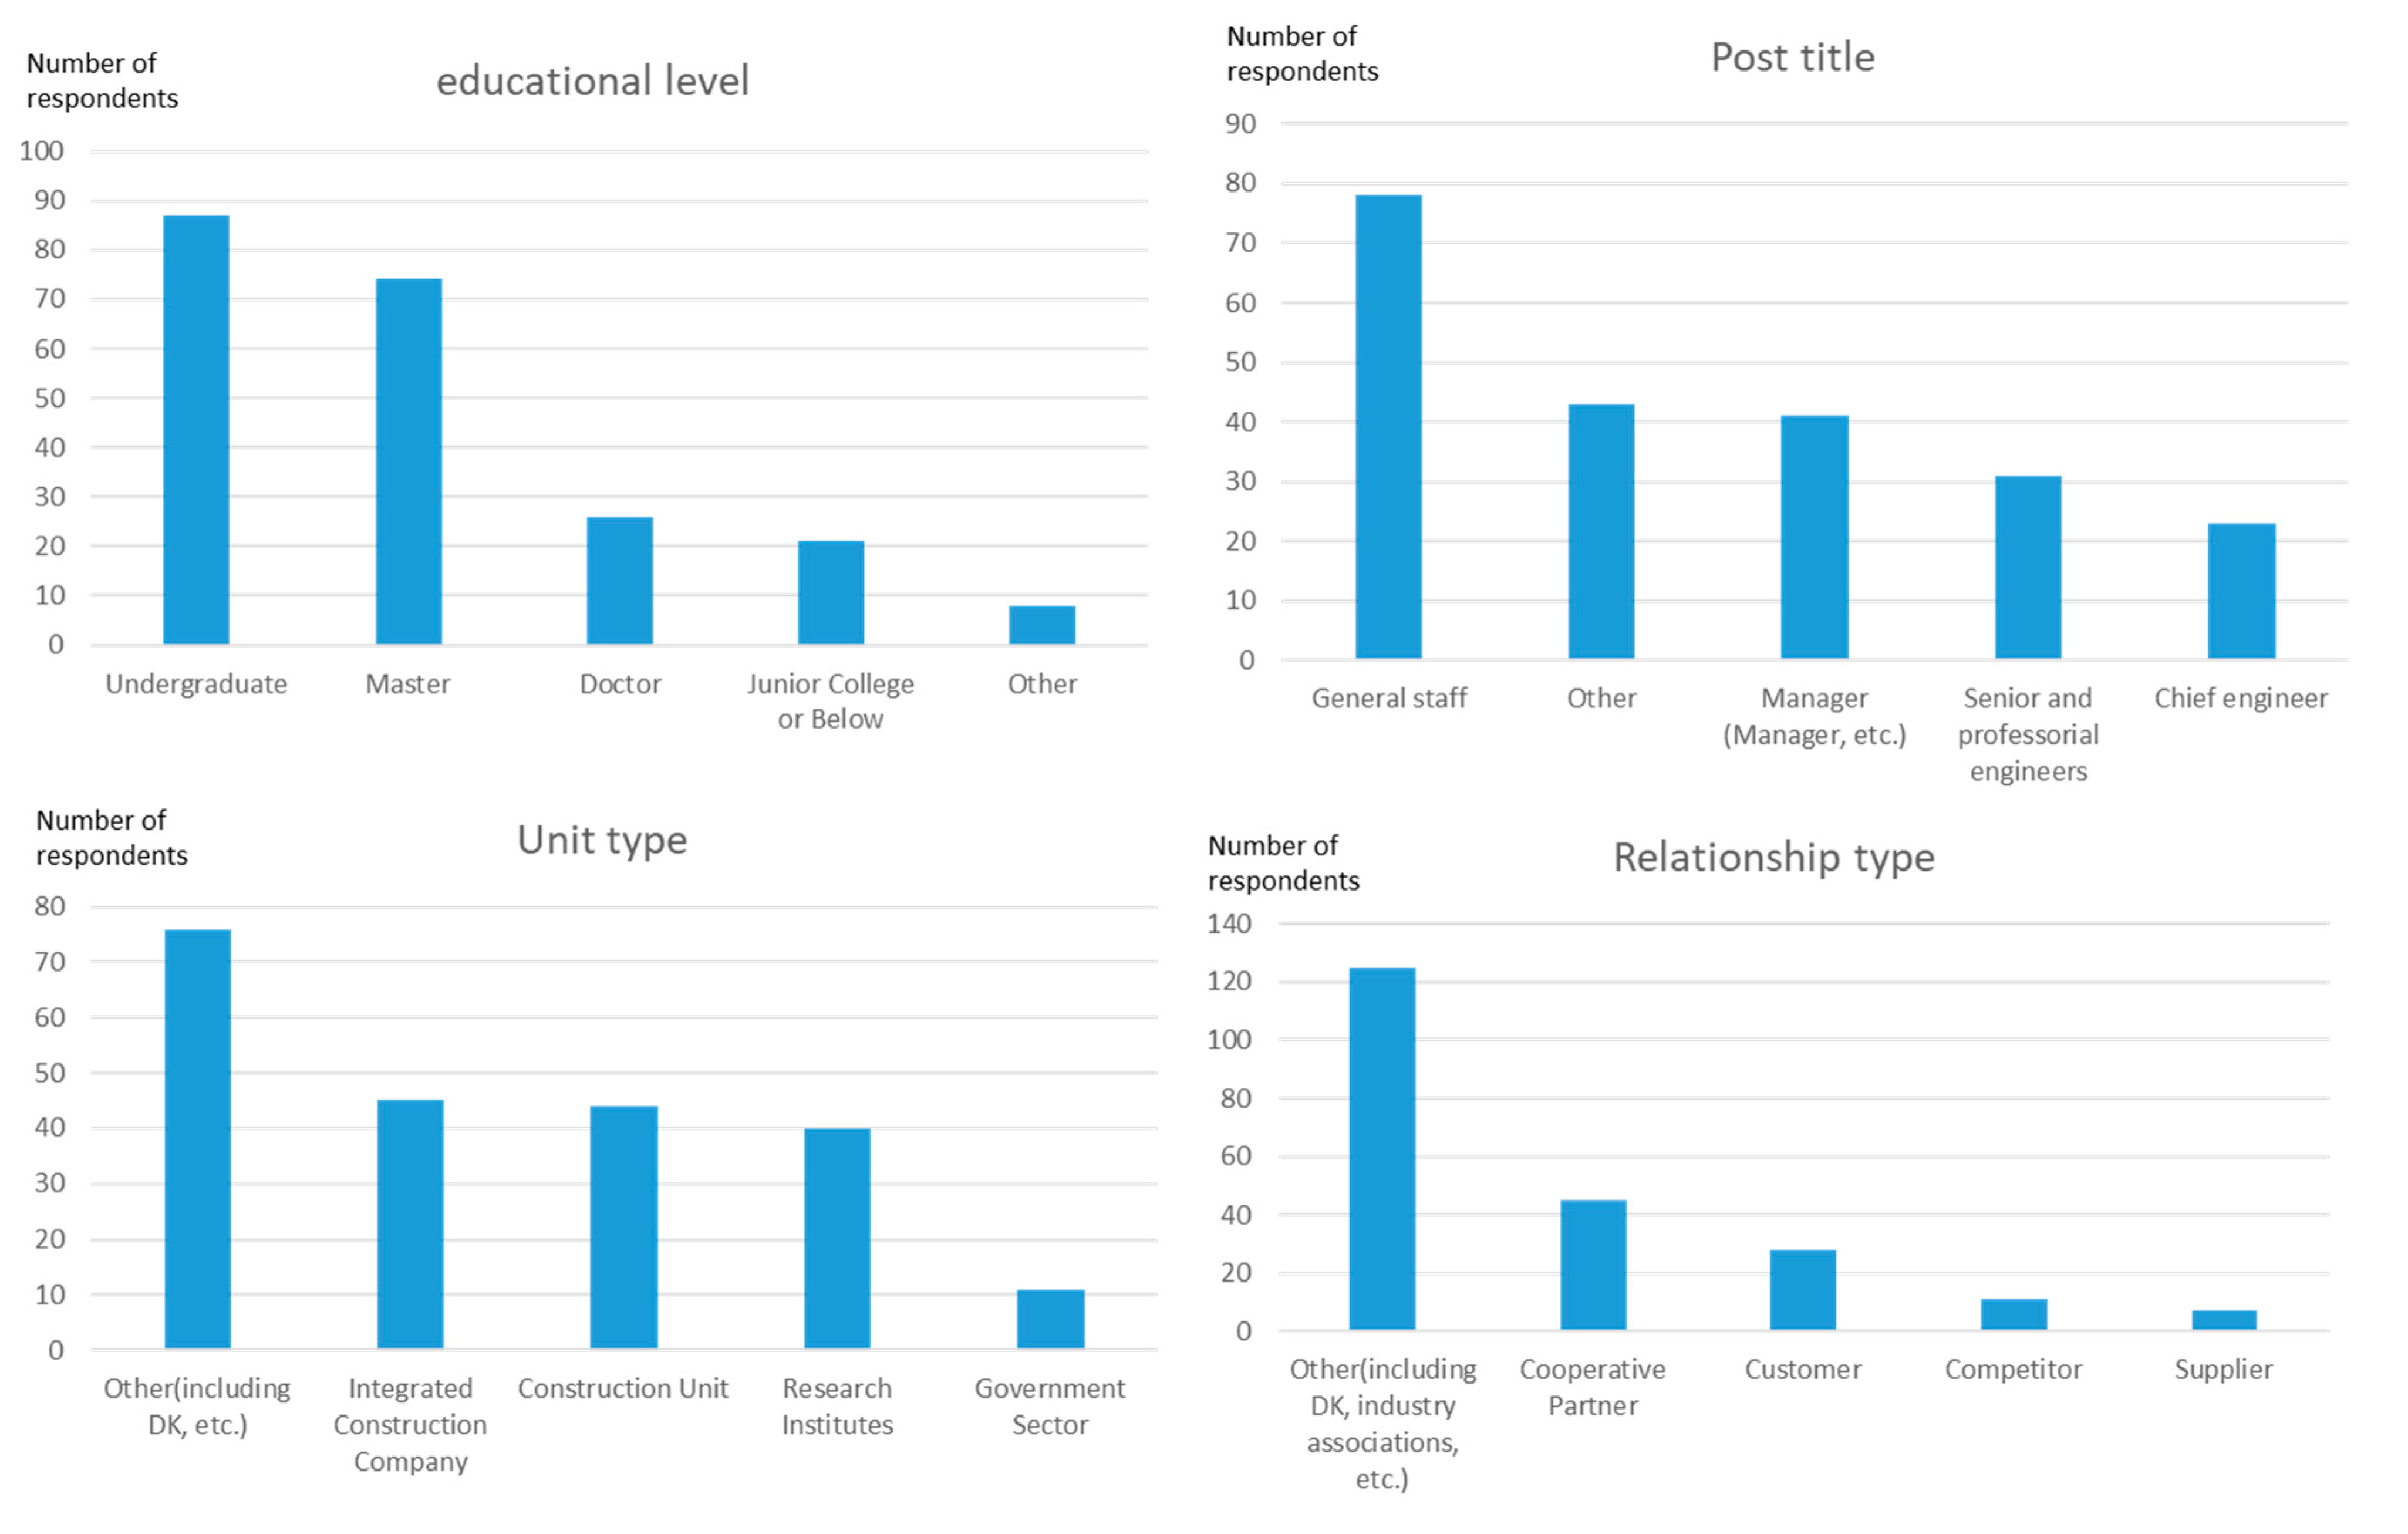
2.4.1. Data Sources
2.4.2. Questionnaire Design
2.4.3. Questionnaire Analysis
3. Results
3.1. Principal Component Analysis of Key Factors
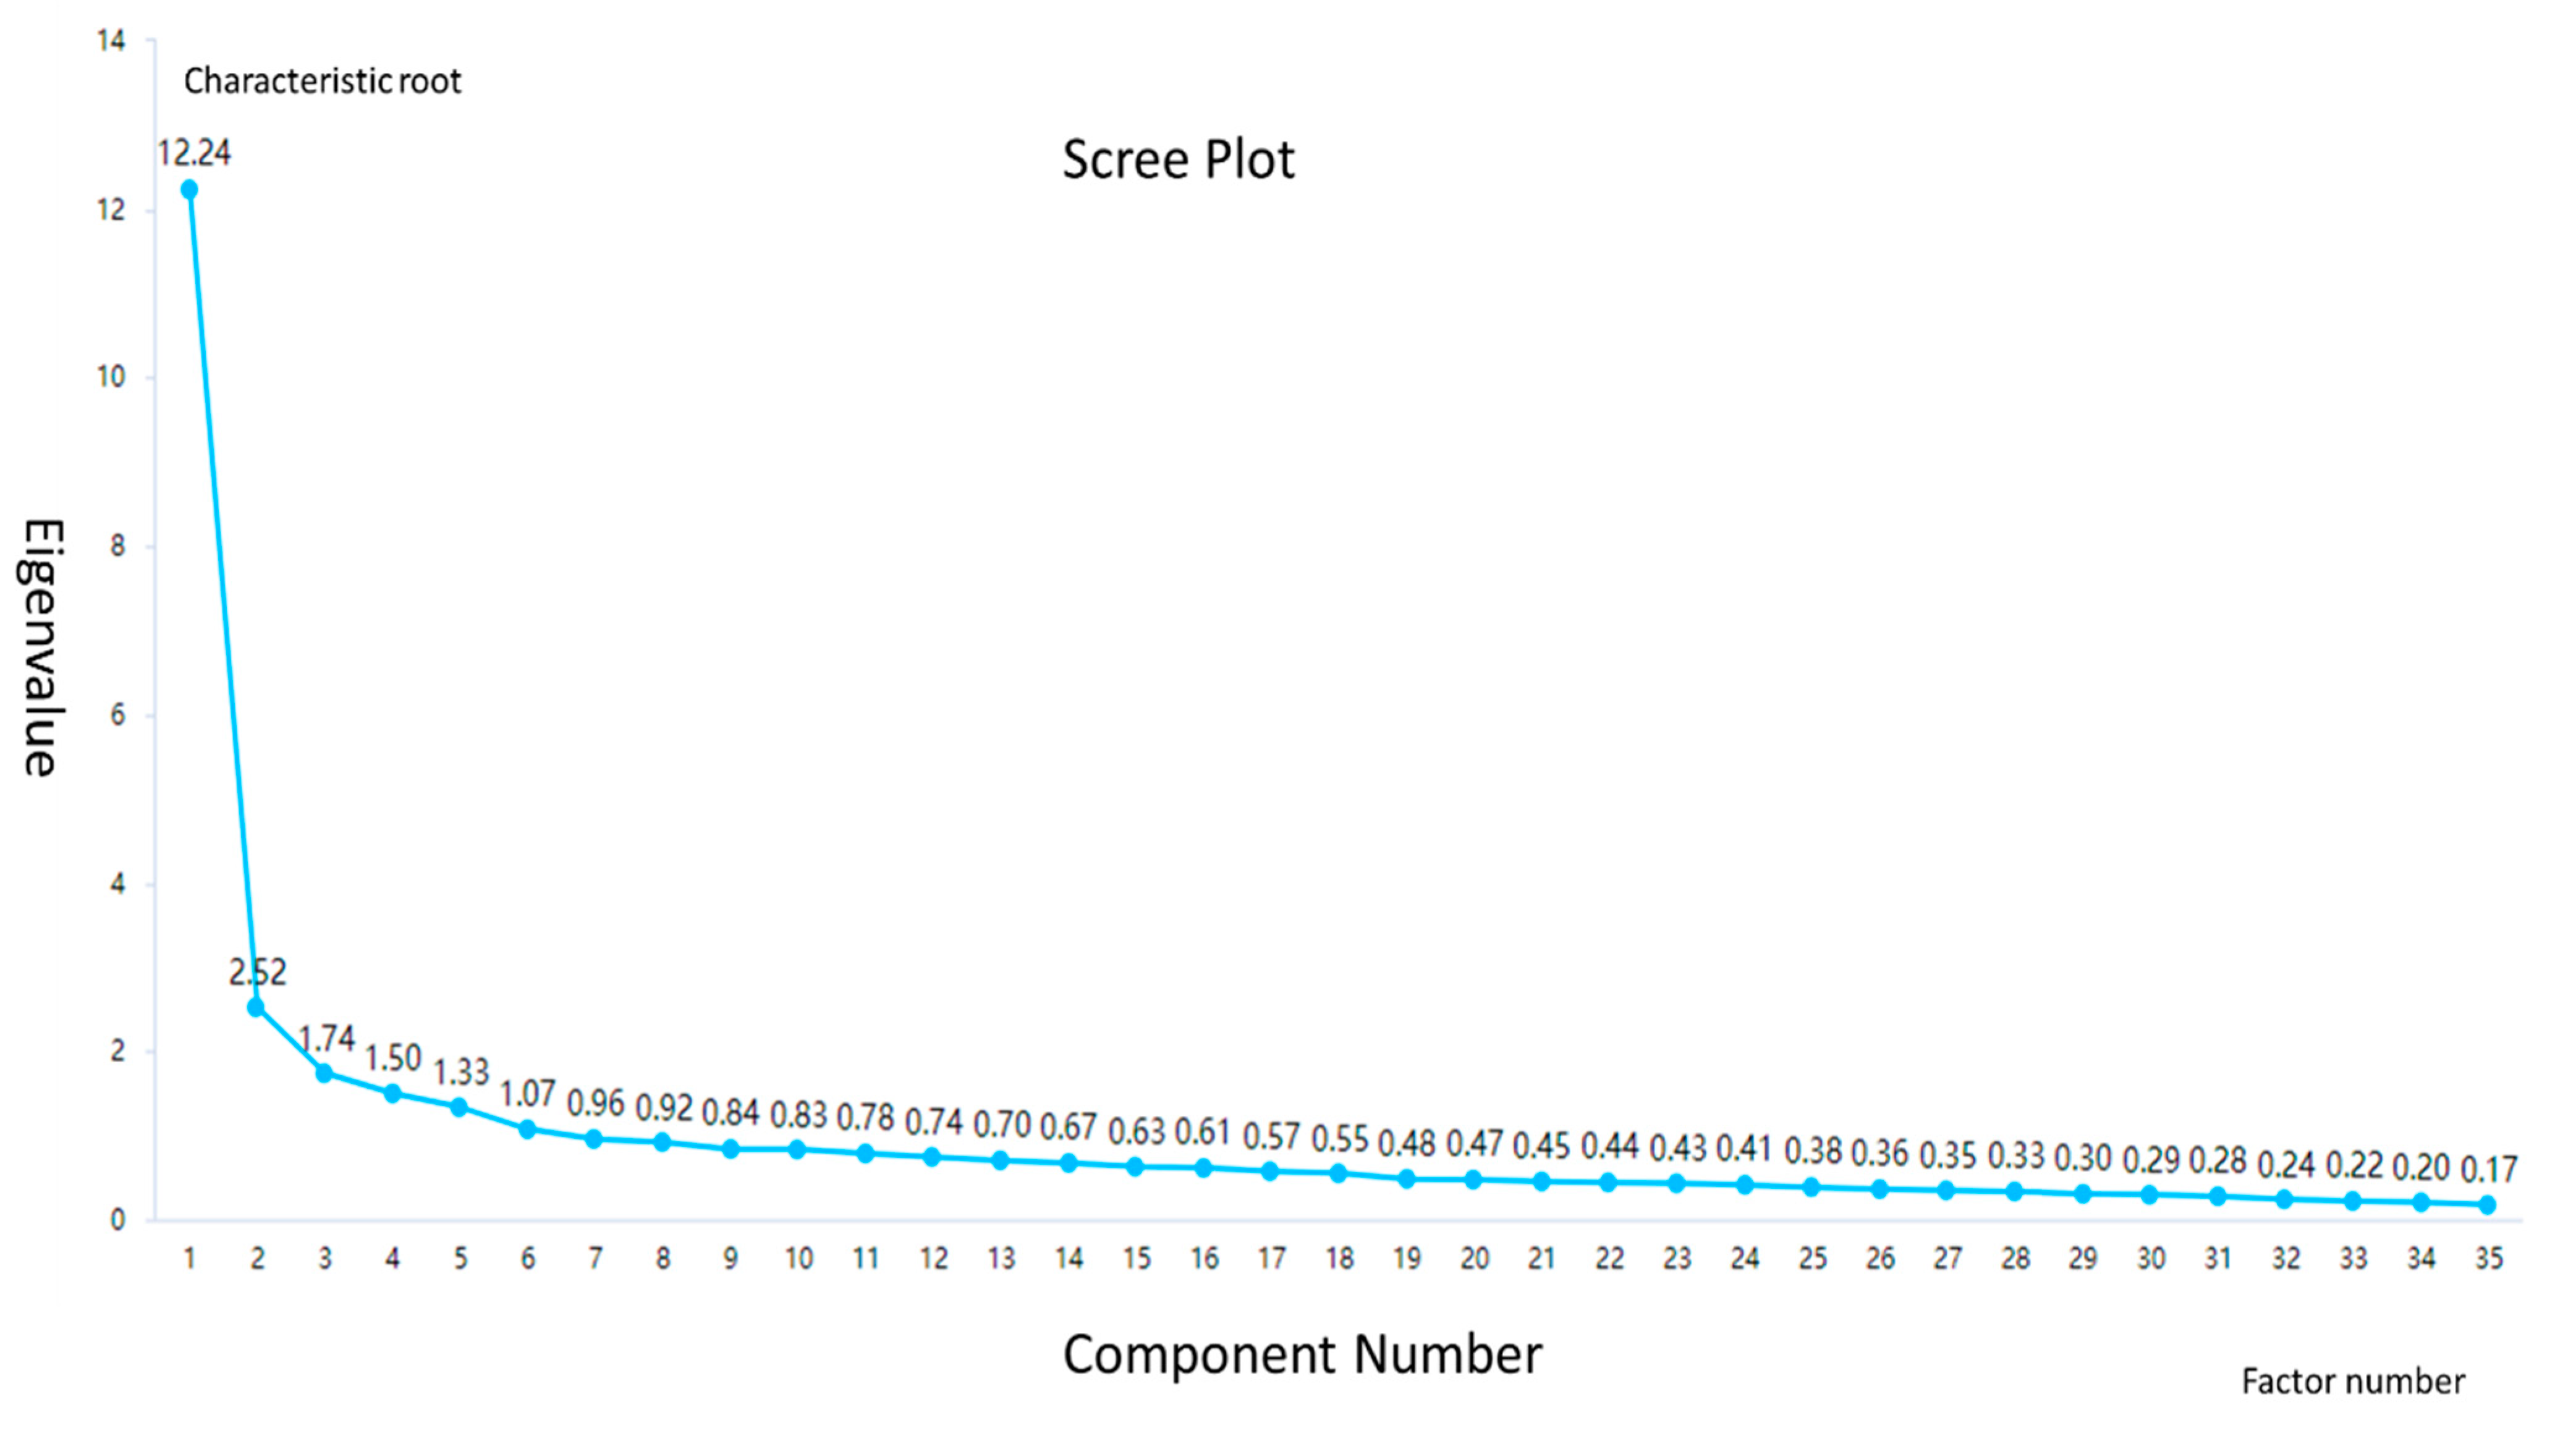
3.1.1. Factor Number Analysis
3.1.2. Factor Composition Analysis
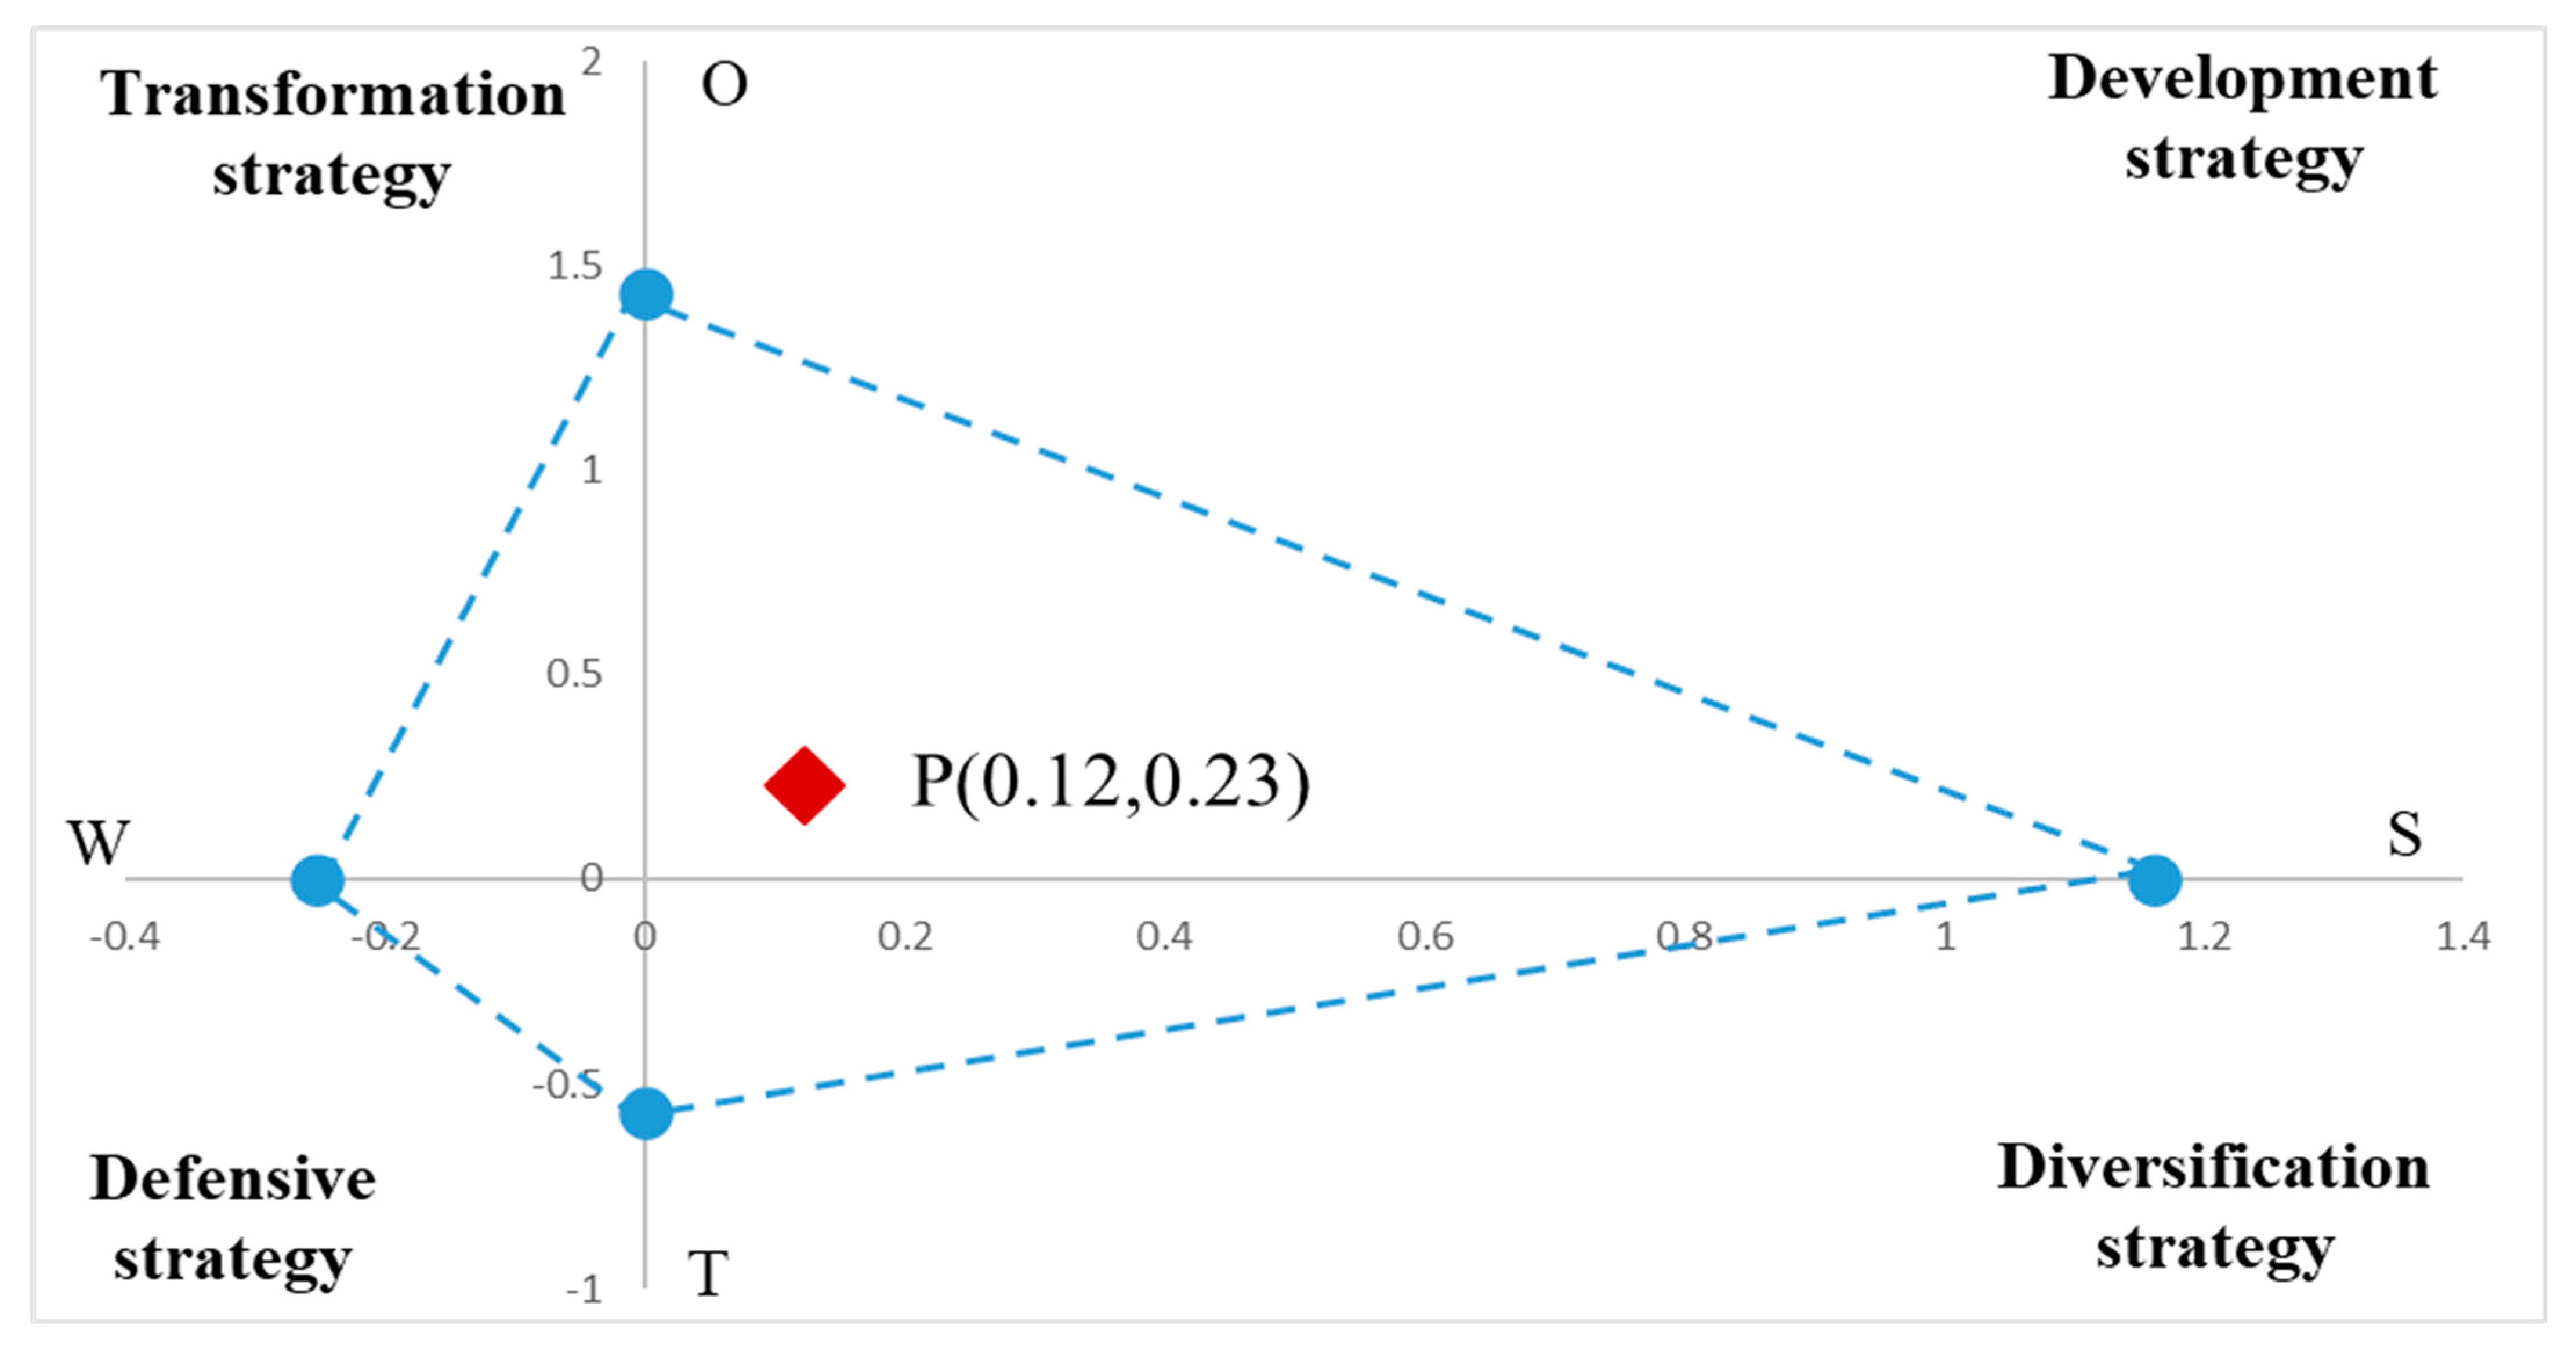
3.2. Best Strategy Analysis
3.2.1. Alternative Strategy Options Analysis
- (1)
- Market penetration strategy: expand customer network and market space. Efforts should be made to expand market share in the current market space and to achieve a further increase in the company’s market share relying on the existing business, that is, in order to expand the existing customer network and the market space. From the perspective of business, DK should give priority to the expansion of smart city construction and maintain or moderately expand the smart building market size. From the perspective of customer network, DK should focus on expanding the top 10 customers, especially making good use of the business relationship network of shareholder companies. From the perspective of the geographical market, DK should give priority to expanding the market size in prefecture-level cities such as Liuzhou, Nanning and Yulin and provinces such as Jiangsu, Shandong, Chongqing, Hebei, Beijing, Shanxi and Xinjiang.
- (2)
- Market development strategy: cultivate new customers and new regional market. Measures should be taken to put the original products and solutions into new markets to achieve a sustainable increase in the company’s business income. DK should increase capital investment in new customer expansion and new market exploitation, and prioritize the cultivation of new customers by taking advantage of the relationship networks of shareholder companies and major customers, with a focus on developing blank markets in prefecture-level cities such as Hezhou, Hechi, Chongzuo and Fangchenggang, and provinces such as Yunnan, Jiangxi, Anhui and Fujian.
- (3)
- Cooperation strategy: joint venture and horizontal integration. For business areas and market geographies with greater development opportunities and disadvantages, new markets and businesses should be cultivated with the help of cooperation and horizontal integration models. DK should give priority to the establishment of strategic partnerships, consortia, alliances or joint ventures to promote the development of smart neighborhoods, smart firefighting and other child businesses, and develop new growth points by cooperating with local companies in Fujian, Anhui and other geographical markets.
- (4)
- Business expansion strategy: vertical integration. Measures such as external mergers, acquisitions, joint ventures and new internal business units should be taken to promote the extension of the company’s main business into the upstream and downstream of the supply chain and the industrial chain. DK should, relying on its predominant businesses such as smart buildings and smart communities, extend to the upstream businesses such as equipment supply, system design and technology development of smart buildings, and expand to the downstream businesses such as construction, operation and maintenance, and property management of smart buildings.
- (5)
- Harvest strategy: control investment. The harvest strategy requires controlling business investment scale and cutting all expenses to improve the company’s total cash flow. This strategy is appropriate for the smart building business of DK.
- (6)
- Abandonment strategy: divestiture and liquidation. For businesses or markets where the harvest strategy is not working, the unprofitable part should be abandoned to cut loss in time. DK’s Dog businesses, such as smart parking and smart water utilities, should be phased out and recovered at the right time, and no additional investment should be made in Ningxia, Qinghai, Sichuan, Liaoning, Inner Mongolia and other Dog markets.
3.2.2. Best Strategy of Theory
3.2.3. Best Strategy of Reality
4. Discussion
4.1. Impact Factors
4.2. Coping Strategies
5. Conclusions
Author Contributions
Funding
Data Availability Statement
Conflicts of Interest
Appendix A

| Strength (S) | Weakness (W) | ||
|---|---|---|---|
| Resource | Qualification | 10. How detrimental DK’s qualifications is to the construction of its competitive advantage | |
| Human resources | 15. How detrimental DK’s insufficient talent pool is to the construction of its competitive advantage | ||
| Brand | 5. How beneficial DK’s social and business relationships are to the construction of its competitive advantage | 13. How detrimental DK’s industry position is to the construction of its competitive advantage 14. How detrimental DK’s brand reputation is to the construction of its competitive advantage | |
| Technology | 9. How beneficial DK’s core technologies are the construction of its competitive advantage | 16. How detrimental DK’s weak reserves of patents and software copyrights are to the construction of its competitive advantage | |
| Capabilities | Finance | 12. How detrimental DK’s capital scale is detrimental to the construction of its competitive advantage | |
| Marketing | 4. How beneficial DK’s business diversification is to the construction of its competitive advantage 6. How beneficial the customer service quality of DK is to the construction of its competitive advantage | ||
| Research and development | 8. How beneficial DK’s technological and product innovation capabilities are to the construction of its competitive advantage | ||
| Organization | 3. How beneficial DK’s relationship with its parent company is to the construction of its competitive advantage | 11. How detrimental DK’s imperfect management system is to the construction of its competitive advantage | |
| Culture | 7. How detrimental DK’s weak cultural attractiveness is to the construction of its competitive advantage |
| Opportunity (O) | Threat (T) | ||
|---|---|---|---|
| PEST | Politics (P) | 1. How beneficial the preferential policies for enterprise residences are to the construction of DK’s competitive advantage 18. What development opportunities offered to DK by the “new infrastructure” policies 19. What development opportunities offered to DK by the “smart city” and “smart building” policies 20. What development opportunities offered to DK by national and local smart building development plans | 27. How detrimental macro policy volatility and universality are to the construction of DK’s competitive advantage |
| Economy (E) | 21. How beneficial the prospect of smart building development is to the construction of DK’s competitive advantage 22. How beneficial the rate of market demand growth is to the construction of DK’s competitive advantage | 29. How detrimental the macro-economic situation is to the construction of DK’s competitive advantage 30. How detrimental the low level of economic development of the enterprise premises is to the construction of DK’s competitive advantage | |
| Society (S) | 24. How beneficial social recognition of smart buildings is to the construction of DK’s competitive advantage | 32. How detrimental the outbreak of COVID-19 is to the construction of DK’s competitive advantage | |
| Technology (T) | 25. How beneficial the development level of smart building technology is to the construction of DK’s competitive advantage 26. How beneficial the level of smart construction processes is to the construction of DK’s competitive advantage | 35. How detrimental the low level of product standardization is to the construction of DK’s competitive advantage | |
| PFFM | Potential entrant | 28. How detrimental the weakened entry barriers for potential entrants are to the construction of DK’s competitive advantage | |
| Supplier | 23. How detrimental the supplier dependence is to the construction of DK’s competitive advantage | ||
| Customer | 2. How beneficial government purchases are to the construction of DK’s competitive advantage | 33. How detrimental difficulties in expanding new customers are to the construction of DK’s competitive advantage 34. How detrimental the increased bargaining power of major customers is to the construction of DK’s competitive advantage | |
| Competitor | 31. How detrimental the competition intensity of enterprises in the industry is to the construction of DK’s competitive advantage | ||
| Substitute | 17. How detrimental the substitutes are to the construction of DK’s competitive advantage |
| Grade | 1 | 2 | 3 | 4 | 5 | Score | Weight | |
|---|---|---|---|---|---|---|---|---|
| Items | ||||||||
| 1 | 23 | 39 | 63 | 53 | 38 | 3.20 | 0.0171 | |
| 2 | 18 | 36 | 60 | 63 | 39 | 3.32 | 0.0335 | |
| 3 | 12 | 44 | 40 | 67 | 53 | 3.49 | 0.0433 | |
| 4 | 17 | 28 | 63 | 53 | 55 | 3.47 | 0.0400 | |
| 5 | 17 | 21 | 49 | 76 | 53 | 3.59 | 0.0547 | |
| 6 | 17 | 25 | 47 | 59 | 68 | 3.63 | 0.0563 | |
| 7 | 19 | 49 | 56 | 52 | 40 | 3.21 | 0.0196 | |
| 8 | 18 | 31 | 51 | 51 | 65 | 3.53 | 0.0482 | |
| 9 | 19 | 34 | 42 | 53 | 68 | 3.54 | 0.0498 | |
| 10 | 24 | 53 | 63 | 50 | 26 | 3.00 | 0.0008 | |
| 11 | 22 | 33 | 59 | 71 | 31 | 3.26 | 0.0229 | |
| 12 | 22 | 47 | 56 | 60 | 31 | 3.14 | 0.0106 | |
| 13 | 27 | 28 | 75 | 56 | 30 | 3.16 | 0.0122 | |
| 14 | 25 | 45 | 65 | 57 | 24 | 3.05 | 0.0041 | |
| 15 | 22 | 35 | 50 | 51 | 58 | 3.41 | 0.0367 | |
| 16 | 21 | 49 | 59 | 55 | 32 | 3.13 | 0.0090 | |
| 17 | 21 | 53 | 57 | 60 | 25 | 3.07 | 0.0057 | |
| 18 | 17 | 29 | 54 | 65 | 51 | 3.48 | 0.0416 | |
| 19 | 16 | 33 | 47 | 53 | 67 | 3.56 | 0.0531 | |
| 20 | 14 | 33 | 46 | 66 | 57 | 3.55 | 0.0514 | |
| 21 | 12 | 35 | 58 | 54 | 57 | 3.50 | 0.0449 | |
| 22 | 13 | 31 | 48 | 78 | 46 | 3.52 | 0.0465 | |
| 23 | 15 | 38 | 64 | 66 | 33 | 3.30 | 0.0302 | |
| 24 | 13 | 36 | 56 | 64 | 47 | 3.44 | 0.0384 | |
| 25 | 17 | 35 | 62 | 65 | 37 | 3.32 | 0.0351 | |
| 26 | 18 | 36 | 61 | 73 | 28 | 3.26 | 0.0253 | |
| 27 | 20 | 33 | 74 | 65 | 24 | 3.19 | 0.0155 | |
| 28 | 17 | 29 | 74 | 69 | 27 | 3.28 | 0.0278 | |
| 29 | 17 | 33 | 70 | 69 | 27 | 3.26 | 0.0229 | |
| 30 | 19 | 47 | 68 | 54 | 28 | 3.12 | 0.0074 | |
| 31 | 16 | 40 | 62 | 64 | 34 | 3.28 | 0.0278 | |
| 32 | 28 | 45 | 64 | 53 | 26 | 3.02 | 0.0025 | |
| 33 | 22 | 32 | 59 | 65 | 38 | 3.30 | 0.0318 | |
| 34 | 17 | 39 | 67 | 74 | 19 | 3.18 | 0.0139 | |
| 35 | 14 | 45 | 63 | 70 | 24 | 3.21 | 0.0196 | |
References
- Stefanic, M.; Stankovski, V. A review of technologies and applications for smart construction. Proc. Inst. Civ. Eng. Civ. Eng. 2019, 172, 83–87. [Google Scholar] [CrossRef]
- Nugur, A.; Pipattanasomporn, M.; Kuzlu, M.; Rahman, S. Design and Development of an IoT Gateway for Smart Building Applications. IEEE Internet Things J. 2019, 6, 9020–9029. [Google Scholar] [CrossRef]
- Verma, A.; Prakash, S.; Srivastava, V.; Kumar, A.; Mukhopadhyay, S.C. Sensing, Controlling, and IoT Infrastructure in Smart Building: A Review. IEEE Sens. J. 2019, 19, 9036–9046. [Google Scholar] [CrossRef]
- Le, D.N.; Le Tuan, L.; Tuan, M.N.D. Smart-building management system: An Internet-of-Things (IoT) application business model in Vietnam. Technol. Forecast. Soc. Chang. 2019, 141, 22–35. [Google Scholar] [CrossRef]
- Bashir, M.R.; Gill, A.Q.; Beydoun, G.; McCusker, B. Big Data Management and Analytics Metamodel for IoT-Enabled Smart Buildings. IEEE Access 2020, 8, 169740–169758. [Google Scholar] [CrossRef]
- Madani, F.; Daim, T.; Weng, C. ‘Smart building’ technology network analysis: Applying core–periphery structure analysis. Int. J. Manag. Sci. Eng. Manag. 2015, 12, 1–11. [Google Scholar] [CrossRef]
- Ghansah, F.A.; Owusu-Manu, D.-G.; Ayarkwa, J.; Edwards, D.J.; Hosseini, M.R. Assessing the level of awareness of smart building technologies (SBTs) in the developing countries. J. Eng. Des. Technol. 2021. [Google Scholar] [CrossRef]
- Chew, M.; Teo, E.; Shah, K.; Kumar, V.; Hussein, G. Evaluating the Roadmap of 5G Technology Implementation for Smart Building and Facilities Management in Singapore. Sustainability 2020, 12, 10259. [Google Scholar] [CrossRef]
- Xu, Y.; Ahokangas, P.; Turunen, M.; Mäntymäki, M.; Heikkilä, J. Xu Platform-Based Business Models: Insights from an Emerging Ai-Enabled Smart Building Ecosystem. Electronics 2019, 8, 1150. [Google Scholar] [CrossRef]
- Sun, Y.; Wang, R.S.; Li, X.M. A Distributed Rule System for Smart Building. Ad Hoc Sens. Wirel. Netw. 2015, 29, 1–29. [Google Scholar]
- Vijayan, D.S.; Rose, A.L.; Arvindan, S.; Revathy, J.; Amuthadevi, C. Automation systems in smart buildings: A review. J. Ambient. Intell. Humaniz. Comput. 2020, 1–13. [Google Scholar] [CrossRef]
- Froufe, M.; Chinelli, C.; Guedes, A.; Haddad, A.; Hammad, A.; Soares, C. Smart Buildings: Systems and Drivers. Buildings 2020, 10, 153. [Google Scholar] [CrossRef]
- Li, W.; Koo, C.; Cha, S.H.; Lai, J.H.; Lee, J. A conceptual framework for the real-time monitoring and diagnostic system for the optimal operation of smart building: A case study in Hotel ICON of Hong Kong. Energy Procedia 2019, 158, 3107–3112. [Google Scholar] [CrossRef]
- Xu, W.; Zhang, J.; Kim, J.Y.; Huang, W.; Kanhere, S.S.; Jha, S.K.; Hu, W. The Design, Implementation, and Deployment of a Smart Lighting System for Smart Buildings. IEEE Internet Things J. 2019, 6, 7266–7281. [Google Scholar] [CrossRef]
- Sun, Y.; Wu, T.-Y.; Li, X.; Guizani, M. A Rule Verification System for Smart Buildings. IEEE Trans. Emerg. Top. Comput. 2016, 5, 367–379. [Google Scholar] [CrossRef]
- Al Dakheel, J.; Del Pero, C.; Aste, N.; Leonforte, F. Smart buildings features and key performance indicators: A review. Sustain. Cities Soc. 2020, 61, 102328. [Google Scholar] [CrossRef]
- Amin, U.; Hossain, M.; Lu, J.; Fernandez, E. Performance analysis of an experimental smart building: Expectations and outcomes. Energy 2017, 135, 740–753. [Google Scholar] [CrossRef]
- Cheng, M.-Y.; Chiu, K.-C.; Lien, L.-C.; Wu, Y.-W.; Lin, J.-J. Economic and energy consumption analysis of smart building – MEGA house. Build. Environ. 2016, 100, 215–226. [Google Scholar] [CrossRef]
- Behzadi, A.; Arabkoohsar, A.; Yang, Y. Optimization and dynamic techno-economic analysis of a novel PVT-based smart building energy system. Appl. Therm. Eng. 2020, 181, 115926. [Google Scholar] [CrossRef]
- Janhunen, E.; Leskinen, N.; Junnila, S. The Economic Viability of a Progressive Smart Building System with Power Storage. Sustainability 2020, 12, 5998. [Google Scholar] [CrossRef]
- Lazarova-Molnar, S.; Mohamed, N. Collaborative data analytics for smart buildings: Opportunities and models. Clust. Comput. 2017, 22, 1065–1077. [Google Scholar] [CrossRef]
- Bolchini, C.; Geronazzo, A.; Quintarelli, E. Smart buildings: A monitoring and data analysis methodological framework. Build. Environ. 2017, 121, 93–105. [Google Scholar] [CrossRef]
- Yang, Z.; Wang, Y.; Sun, C. Emerging Information Technology Acceptance Model for The Development of Smart Construction System. J. Civ. Eng. Manag. 2018, 24, 457–468. [Google Scholar] [CrossRef]
- Cauchi, N.; Hoque, K.A.; Stoelinga, M.; Abate, A. Maintenance of Smart Buildings using Fault Trees. ACM Trans. Sens. Netw. 2018, 14, 1–25. [Google Scholar] [CrossRef]
- Sepasgozar, S.M.E.; Loosemore, M.; Davis, S.R. Conceptualising information and equipment technology adoption in construction. Eng. Constr. Arch. Manag. 2016, 23, 158–176. [Google Scholar] [CrossRef]
- Qi, B.; Razkenari, M.; Li, J.; Costin, A.; Kibert, C.; Qian, S. Investigating U.S. Industry Practitioners’ Perspectives towards the Adoption of Emerging Technologies in Industrialized Construction. Buildings 2020, 10, 85. [Google Scholar] [CrossRef]
- Sepasgozar, S.M. Digital technology utilisation decisions for facilitating the implementation of Industry 4.0 technologies. Constr. Innov. 2020. [Google Scholar] [CrossRef]
- Sepasgozar, S.M.E.; Davis, S. Digital Construction Technology and Job-site Equipment Demonstration: Modelling Relationship Strategies for Technology Adoption. Buildings 2019, 9, 158. [Google Scholar] [CrossRef]
- Sepasgozar, S.M.E.; Davis, S. Construction Technology Adoption Cube: An Investigation on Process, Factors, Barriers, Drivers and Decision Makers Using NVivo and AHP Analysis. Buildings 2018, 8, 74. [Google Scholar] [CrossRef]
- Sepasgozar, S.M.; Davis, S.; Loosemore, M.; Bernold, L. An investigation of modern building equipment technology adoption in the Australian construction industry. Eng. Constr. Arch. Manag. 2018, 25, 1075–1091. [Google Scholar] [CrossRef]
- Fauzi, C.; Sulistyo, S. Widyawan A survey of group activity recognition in smart building. In Proceedings of the 2018 International Conference on Signals and Systems (ICSigSys), Bali, Indonesia, 1–3 May 2018; Volume 2018, pp. 13–19. [Google Scholar]
- Santana, J.R.; Sanchez, L.; Sotres, P.; Lanza, J.; Llorente, T.; Munoz, L. A Privacy-Aware Crowd Management System for Smart Cities and Smart Buildings. IEEE Access 2020, 8, 135394–135405. [Google Scholar] [CrossRef]
- Apanaviciene, R.; Urbonas, R.; Fokaides, P. Smart Building Integration into a Smart City: Comparative Study of Real Estate Development. Sustainability 2020, 12, 9376. [Google Scholar] [CrossRef]
- Sepasgozar, S.M.; Hawken, S.; Sargolzaei, S.; Foroozanfa, M. Implementing citizen centric technology in developing smart cities: A model for predicting the acceptance of urban technologies. Technol. Forecast. Soc. Chang. 2019, 142, 105–116. [Google Scholar] [CrossRef]
- Lopez, L.R.; Castro, A.G. Sustainability and Resilience in Smart City Planning: A Review. Sustainability 2020, 13, 181. [Google Scholar] [CrossRef]
- Apanaviciene, R.; Vanagas, A.; Fokaides, P.A. Smart Building Integration into a Smart City (SBISC): Development of a New Evaluation Framework. Energies 2020, 13, 2190. [Google Scholar] [CrossRef]
- Yoon, C.Y. Measurement of Enterprise Smart Business Performance on a Smart Business Management. IEICE Trans. Inf. Syst. 2021, 104, 56–62. [Google Scholar] [CrossRef]
- Sepasgozar, S.; Karimi, R.; Farahzadi, L.; Moezzi, F.; Shirowzhan, S.; Ebrahimzadeh, S.M.; Hui, F.; Aye, L. A Systematic Content Review of Artificial Intelligence and the Internet of Things Applications in Smart Home. Appl. Sci. 2020, 10, 3074. [Google Scholar] [CrossRef]
- Slupik, S.; Lorek, P. Sustainable Enterprise by Sustainable Product? A Case of Smart Home Systems. Ekonomia I Srodowisko-Econ. Environ. 2019, 2, 146–159. [Google Scholar] [CrossRef]
- Ullah, F.; Sepasgozar, S.M.E.; Wang, C. A Systematic Review of Smart Real Estate Technology: Drivers of, and Barriers to, the Use of Digital Disruptive Technologies and Online Platforms. Sustainability 2018, 10, 3142. [Google Scholar] [CrossRef]
- Kitouni, I.; Benmerzoug, D.; Lezzar, F. Smart Agricultural Enterprise System Based on Integration of Internet of Things and Agent Technology. J. Organ. End User Comput. 2018, 30, 64–82. [Google Scholar] [CrossRef]
- Pourzolfaghar, Z.; Bastidas, V.; Helfert, M. Standardisation of enterprise architecture development for smart cities. J. Knowl. Econ. 2020, 11, 1336–1357. [Google Scholar] [CrossRef]
- Impedovo, D.; Pirlo, G. Artificial Intelligence Applications to Smart City and Smart Enterprise. Appl. Sci. 2020, 10, 2944. [Google Scholar] [CrossRef]
- Maida, J. Global Smart Buildings Market 2020–2024 Report, Technavio Research. 2020. Available online: https://analysis.technavio.com/smart-building-market-forecast-research (accessed on 21 January 2021).
- Mordor Intelligence. Smart Building Market-Growth, Trends, Covid-19 Impact, and Forecasts (2021–2026), Mordor Intelligence. Available online: https://www.mordorintelligence.com/industry-reports/smart-building-market (accessed on 21 April 2021).
- Data Bridge Market Research. Global Smart Building Market-Industry Trends and Forecast to 2027, Data Bridge Market Research. Available online: https://www.databridgemarketresearch.com/reports/global-smart-building-market# (accessed on 21 April 2021).
- Adeli, A.; Zadsafar, S.; Alishahi, A.R.; Chafi, H.G. A SWOT analysis on Iranian fishmeal industry. Iran. J. Fish. Sci. 2020, 19, 2909–2924. [Google Scholar] [CrossRef]
- Lagoudakis, A.; Mckendree, M.G.; Malone, T.; Caputo, V. Incorporating producer opinions into a SWOT analysis of the U.S. tart cherry industry. Int. Food Agribus. Manag. Rev. 2020, 23, 547–561. [Google Scholar] [CrossRef]
- Brunnhofer, M.; Gabriella, N.; Schöggl, J.-P.; Stern, T.; Posch, A. The biorefinery transition in the European pulp and paper industry – A three-phase Delphi study including a SWOT-AHP analysis. For. Policy Econ. 2020, 110, 101882. [Google Scholar] [CrossRef]
- Jiskani, I.M.; Shah, S.A.A.; Qingxiang, C.; Zhou, W.; Lu, X. A multi-criteria based SWOT analysis of sustainable planning for mining and mineral industry in Pakistan. Arab. J. Geosci. 2020, 13, 1–16. [Google Scholar] [CrossRef]
- Khaba, S.; Bhar, C. Quantifying SWOT analysis for the Indian coal mining industry using Fuzzy DEMATEL. Benchmark. Int. J. 2017, 24, 882–902. [Google Scholar] [CrossRef]
- Zhü, K.; Zhao, S.-Y.; Yang, S.; Liang, C.; Gu, D. Where is the way for rare earth industry of China: An analysis via ANP-SWOT approach. Resour. Policy 2016, 49, 349–357. [Google Scholar] [CrossRef]
- Kim, Y.-J.; Park, J. A Sustainable Development Strategy for the Uzbekistan Textile Industry: The Results of a SWOT-AHP Analysis. Sustainability 2019, 11, 4613. [Google Scholar] [CrossRef]
- Kanat, S.; Abbasi, S.A.; Peerzada, M.H.; Atilgan, T. SWOT analysis of Pakistan’s textile and clothing industry. Ind. Text. 2018, 69, 502–510. [Google Scholar]
- Xu, D.; Dong, L. Strategic diagnosis of China’s modern coal-to-chemical industry using an integrated SWOT-MCDM framework. Clean Technol. Environ. Policy 2018, 21, 517–532. [Google Scholar] [CrossRef]
- Karimi, M.; Niknamfar, A.H.; Niaki, S.T.A. An application of fuzzy-logic and grey-relational ANP-based SWOT in the ceramic and tile industry. Knowl. Based Syst. 2019, 163, 581–594. [Google Scholar] [CrossRef]
- Khan, M.I. Evaluating the strategies of compressed natural gas industry using an integrated SWOT and MCDM approach. J. Clean. Prod. 2018, 172, 1035–1052. [Google Scholar] [CrossRef]
- Szum, K.; Nazarko, J. Exploring the Determinants of Industry 4.0 Development Using an Extended SWOT Analysis: A Regional Study. Energies 2020, 13, 5972. [Google Scholar] [CrossRef]
- Zhao, J.; Liu, H.; Xue, W. PEST Embedded SWOT Analysis on China’s E-Commerce Industry Development Strategy. J. Electron. Commer. Organ. 2019, 17, 55–68. [Google Scholar] [CrossRef]
- Zhang, Y.; Yuan, L.; Ye, T. Management Innovation of Marine Cultural Industry Based on SWOT and AHP. J. Coast. Res. 2020, 112, 199–202. [Google Scholar] [CrossRef]
- Fan, T.; Xue, D.Q. Sustainable Development of Cultural Industry in Shaanxi Province of Northwest China: A SWOT and AHP Analysis. Sustainability 2018, 10, 2830. [Google Scholar] [CrossRef]
- Irfan, M.; Hao, Y.; Panjwani, M.K.; Khan, D.; Chandio, A.A.; Li, H. Competitive assessment of South Asia’s wind power industry: SWOT analysis and value chain combined model. Energy Strat. Rev. 2020, 32, 100540. [Google Scholar] [CrossRef]
- Wang, X.; Li, C.; Shang, J.; Yang, C.; Zhang, B.; Ke, X. Strategic Choices of China’s New Energy Vehicle Industry: An Analysis Based on ANP and SWOT. Energies 2017, 10, 537. [Google Scholar] [CrossRef]
- Shinno, H.; Yoshioka, H.; Marpaung, S.; Hachiga, S. Quantitative SWOT analysis on global competitiveness of machine tool industry. J. Eng. Des. 2006, 17, 251–258. [Google Scholar] [CrossRef]
- Khalid, H.; Zhang, H.; Liu, C.; Li, W.; Abuzar, M.K.; Amin, F.R.; Liu, G.; Chen, C. PEST (political, environmental, social & technical) analysis of the development of the waste-to-energy anaerobic digestion industry in China as a representative for developing countries. Sustain. Energy Fuels 2020, 4, 1048–1062. [Google Scholar] [CrossRef]
- Zhu, L.; Hiltunen, E.; Antila, E.; Huang, F.; Song, L. Investigation of China’s bio-energy industry development modes based on a SWOT–PEST model. Int. J. Sustain. Energy 2014, 34, 552–559. [Google Scholar] [CrossRef]
- Moreno-Izquierdo, L.; Ramón-Rodríguez, A.; Perles-Ribes, J. Pricing Strategies of the European Low-Cost Carriers Explained Using Porter’s Five Forces Model. Tour. Econ. 2016, 22, 293–310. [Google Scholar] [CrossRef]
- Yunna, W.; Yisheng, Y. The competition situation analysis of shale gas industry in China: Applying Porter’s five forces and scenario model. Renew. Sustain. Energy Rev. 2014, 40, 798–805. [Google Scholar] [CrossRef]
- Hopkins, H. Applying Michael Porter’s extended rivalry model to the robotics industry. Ind. Robot. Int. J. 2008, 35, 397–399. [Google Scholar] [CrossRef]
- Mutandwa, E.; Kanuma, N.T.; Rusatira, E.; Kwiringirimana, T.; Mugenzi, P.; Govere, I.; Foti, R. Analysis of coffee export marketing in Rwanda: Application of the Boston consulting group matrix. Afr. J. Bus. Manag. 2009, 3, 210–219. [Google Scholar]
- Myllylä, Y.; Kaivo-Oja, J. Integrating Delphi methodology to some classical concepts of the Boston consulting group framework: Arctic maritime technology BCG Delphi foresight—A pilot study from Finland. Eur. J. Future Res. 2015, 3. [Google Scholar] [CrossRef]
- Sepasgozar, S.; Hui, F.; Shirowzhan, S.; Foroozanfar, M.; Yang, L.; Aye, L. Lean Practices Using Building Information Modeling (BIM) and Digital Twinning for Sustainable Construction. Sustainability 2020, 13, 161. [Google Scholar] [CrossRef]
- Shirowzhan, S.; Sepasgozar, S.M.; Edwards, D.J.; Li, H.; Wang, C. BIM compatibility and its differentiation with interoperability challenges as an innovation factor. Autom. Constr. 2020, 112, 103086. [Google Scholar] [CrossRef]
- Zima, K.; Plebankiewicz, E.; Wieczorek, D. A SWOT Analysis of the Use of BIM Technology in the Polish Construction Industry. Buildings 2020, 10, 16. [Google Scholar] [CrossRef]
- Koseoglu, O.; Keskin, B.; Ozorhon, B. Challenges and Enablers in BIM-Enabled Digital Transformation in Mega Projects: The Istanbul New Airport Project Case Study. Buildings 2019, 9, 115. [Google Scholar] [CrossRef]
- Oke, A.; Kineber, A.; Albukhari, I.; Othman, I.; Kingsley, C. Assessment of Cloud Computing Success Factors for Sustainable Construction Industry: The Case of Nigeria. Buildings 2021, 11, 36. [Google Scholar] [CrossRef]
- Afolabi, A.; Ibem, E.; Aduwo, E.; Tunji-Olayeni, P.; Oluwunmi, O. Critical Success Factors (CSFs) for e-Procurement Adoption in the Nigerian Construction Industry. Buildings 2019, 9, 47. [Google Scholar] [CrossRef]
- Silverio-Fernandez, M.A.; Renukappa, S.; Suresh, S. Evaluating critical success factors for implementing smart devices in the construction industry. Eng. Constr. Arch. Manag. 2019, 26, 1625–1640. [Google Scholar] [CrossRef]
- Ullah, F.; Thaheem, M.J.; Sepasgozar, S.M.E.; Forcada, N. System Dynamics Model to Determine Concession Period of PPP Infrastructure Projects: Overarching Effects of Critical Success Factors. J. Leg. Aff. Disput. Resolut. Eng. Constr. 2018, 10, 04518022. [Google Scholar] [CrossRef]
- Liu, G.; Zheng, S.; Xu, P.; Zhuang, T. An ANP-SWOT approach for ESCOs industry strategies in Chinese building sectors. Renew. Sustain. Energy Rev. 2018, 93, 90–99. [Google Scholar] [CrossRef]
- Lu, W. Improved SWOT Approach for Conducting Strategic Planning in the Construction Industry. J. Constr. Eng. Manag. 2010, 136, 1317–1328. [Google Scholar] [CrossRef]
- Khojaste-Sarakhsi, M.; Ghodsypour, S.H.; Ghomi, S.F.; Dashtaki-Hesari, H. Energy efficiency of Iran buildings: A SWOT-ANP approach. Int. J. Energy Sect. Manag. 2019, 13, 726–746. [Google Scholar] [CrossRef]
- Zhang, L.; Guo, S.; Wu, Z.; Alsaedi, A.; Hayat, T. SWOT Analysis for the Promotion of Energy Efficiency in Rural Buildings: A Case Study of China. Energies 2018, 11, 851. [Google Scholar] [CrossRef]
- Nguyen, P.T. Application of Swot for Construction Company Quality Management Using Building Information Modelling. J. Mech. Contin. Math. Sci. 2018, 13, 25–33. [Google Scholar] [CrossRef]
- David, F.R. Computer-assisted strategic planning in small businesses. J. Syst. Manag. 1985, 7, 24–34. [Google Scholar]
- Sepasgozar, S.M.; Shirowzhan, S.; Loosemore, M. Information asymmetries between vendors and customers in the advanced construction technology diffusion process. Constr. Innov. 2021. [Google Scholar] [CrossRef]
- The SPSSAU Project. SPSSAU (Version 20.0), Online Application Software. 2020. Available online: https://www.spssau.com (accessed on 21 April 2021).
- Eisinga, R.; Grotenhuis, M.T.; Pelzer, B. The reliability of a two-item scale: Pearson, Cronbach, or Spearman-Brown? Int. J. Public Health 2013, 58, 637–642. [Google Scholar] [CrossRef] [PubMed]
- Li, H.; Qiang, M.; Yumei, L.; Min, J. Analysis and Study on AHP -Fuzzy Comprehensive Evaluation. China Saf. Sci. J. 2004, 14, 86–89. [Google Scholar]
- Ghorbani, A.; Raufirad, V.; Rafiaani, P.; Azadi, H. Ecotourism sustainable development strategies using SWOT and QSPM model: A case study of Kaji Namakzar Wetland, South Khorasan Province, Iran. Tour. Manag. Perspect. 2015, 16, 290–297. [Google Scholar] [CrossRef]
- Nasab, H.H.; Milani, A.S. An improvement of quantitative strategic planning matrix using multiple criteria decision making and fuzzy numbers. Appl. Soft Comput. 2012, 12, 2246–2253. [Google Scholar] [CrossRef]
- Nabi, B.G.R.; Hoveidi, H.; Jafari, H.R.; Karbassi, A.R.; Nasrabadi, T. Application of ozonation in drinking water disinfection based on an environmental management strategy approach using SWOT method. Iran. J. Environ. Health Sci. Eng. 2006, 1, 23–30. [Google Scholar]
- Guan, X.Y.; Wang, S.L.; Gao, Z.Y.; Lv, Y.; Fu, X.J. Spatio-temporal variability of soil salinity and its relationship with the depth to groundwater in salinization irrigation district. Acta Ecol. Sin. 2012, 32, 198–206. [Google Scholar]
- Smith, A.; Guo, D.L.; Wang, Y.A. An Inquiry into the Nature and Causes of the Wealth of Nations; Commercial Press: Beijing, China, 2003. [Google Scholar]
- Porter, M.E. Competitive Strategy; New York Free Press: New York, NY, USA, 1980. [Google Scholar]
- Hannan, M.T.; Freeman, J.H. The Population Ecology of Organizations. Am. J. Sociol. 1977, 82, 929–964. [Google Scholar] [CrossRef]
- Wu, A.Q.; Jia, S.H. The research framework of foreign enterprise growth theory. Foreign Econ. Manag. 2002, 2, 2–5. [Google Scholar]
- Penrose, E.T. The Theory of the Growth of the Firm; Oxford University Press: Oxford, UK, 1959. [Google Scholar]
- Nelson, R.; Winter, S. An Evolutionary Theory of Economic Change; Harvard University Press: Cambridge, MA, USA, 1982. [Google Scholar]
- Prahalad, C.K.; Hamel, G. The Core Competence of the Corporation. Harv. Bus. Rev. 1990, 66, 79–91. [Google Scholar]
- Barak, S.; Javanmard, S. Outsourcing modelling using a novel interval-valued fuzzy quantitative strategic planning matrix (QSPM) and multiple criteria decision-making (MCDMs). Int. J. Prod. Econ. 2020, 222, 107494. [Google Scholar] [CrossRef]
- Moazeni, K. Empowerment of the institutional-managerial structure by urban sustainable development approach and fuzzy QSPM. Teh. Vjesn. Tech. Gaz. 2016, 23, 17559. [Google Scholar] [CrossRef]
- Shiehbeiki, S.; Abbaspour, M.; Monavari, S.M.; Arjmandi, R.; Lahijanian, A. Public Participation Role in Sustainable Urban Management by Quantitative Strategic Planning Matrix (QSPM). Int. J. Environ. Res. 2014, 8, 1309–1314. [Google Scholar]
- Esmaeili, A.; Kahnali, R.A.; Rostamzadeh, R.; Zavadskas, E.K.; Sepahvand, A. The Formulation of Organizational Strategies Through Integration of Freeman Model, Swot, And Fuzzy Mcdm Methods: A Case Study of Oil Industry. Transform. Bus. Econ. 2014, 13, 602–627. [Google Scholar]
- Tsai, P.H.; Chen, C.-J.; Yang, H.-C. Using Porter’s Diamond Model to Assess the Competitiveness of Taiwan’s Solar Photovoltaic Industry. SAGE Open 2021, 11. [Google Scholar] [CrossRef]
- Knott, P.J. Does VRIO help managers evaluate a firm’s resources? Manag. Decis. 2015, 53, 1806–1822. [Google Scholar] [CrossRef]
- Lin, C.; Tsai, H.-L.; Wu, Y.; Kiang, M. A fuzzy quantitative VRIO-based framework for evaluating organizational activities. Manag. Decis. 2012, 50, 1396–1411. [Google Scholar] [CrossRef]
- Sebestova, J.; Szkandera, I.; Bernatik, W. Analysis of stage of SMEs in Moravian-Silesian region by VRIO method application. E M Ekon. Manag. 2008, 11, 51–61. [Google Scholar]


| Factors | Extraction Sums of Squared Loadings | Rotation Sums of Squared Loadings | ||||
|---|---|---|---|---|---|---|
| Total | % of Variance | Cumulative % | Total | % of Variance | Cumulative % | |
| 1 | 12.237 | 34.964 | 34.964 | 12.237 | 34.964 | 34.964 |
| 2 | 2.52 | 7.2 | 42.163 | 2.52 | 7.2 | 42.163 |
| 3 | 1.737 | 4.962 | 47.125 | 1.737 | 4.962 | 47.125 |
| 4 | 1.497 | 4.277 | 51.403 | 1.497 | 4.277 | 51.403 |
| 5 | 1.332 | 3.807 | 55.209 | 1.332 | 3.807 | 55.209 |
| 6 | 1.071 | 3.06 | 58.269 | 1.071 | 3.06 | 58.269 |
| Factors | Principal Component | Common Degree | |||||
|---|---|---|---|---|---|---|---|
| Factor 1 | Factor 2 | Factor 3 | Factor 4 | Factor 5 | Factor 6 | ||
| 1 | 0.537 | 0.34 | 0.191 | 0.138 | 0.138 | 0.058 | 0.483 |
| 2 | 0.458 | 0.473 | 0.22 | −0.055 | 0.132 | −0.097 | 0.512 |
| 3 | 0.624 | 0.196 | 0.254 | 0.302 | −0.033 | −0.052 | 0.587 |
| 4 | 0.621 | 0.248 | 0.165 | 0.147 | 0.184 | −0.078 | 0.536 |
| 5 | 0.578 | 0.248 | 0.181 | 0.369 | 0.042 | 0.027 | 0.567 |
| 6 | 0.611 | 0.174 | 0.068 | 0.439 | 0.221 | −0.035 | 0.65 |
| 7 | 0.557 | 0.04 | 0.143 | −0.023 | 0.343 | 0.134 | 0.469 |
| 8 | 0.68 | 0.274 | −0.086 | 0.187 | 0.074 | 0.364 | 0.718 |
| 9 | 0.736 | 0.212 | −0.049 | 0.023 | 0.023 | 0.391 | 0.742 |
| 10 | 0.362 | 0.14 | 0.333 | 0 | 0.187 | 0.336 | 0.409 |
| 11 | 0.407 | −0.02 | 0.126 | 0.211 | 0.457 | 0.32 | 0.537 |
| 12 | 0.214 | 0.084 | 0.194 | 0.08 | 0.716 | 0.088 | 0.618 |
| 13 | 0.04 | 0.314 | 0.154 | 0.184 | 0.667 | 0.137 | 0.621 |
| 14 | 0.128 | 0.164 | 0.199 | 0.074 | 0.706 | 0.171 | 0.615 |
| 15 | 0.316 | 0.012 | 0.171 | 0.507 | 0.281 | 0.422 | 0.644 |
| 16 | 0.138 | 0.214 | 0.18 | 0.285 | 0.333 | 0.56 | 0.603 |
| 17 | 0.058 | 0.182 | 0.115 | 0.014 | 0.158 | 0.712 | 0.582 |
| 18 | 0.347 | 0.195 | 0.125 | 0.526 | 0.045 | 0.269 | 0.525 |
| 19 | 0.255 | 0.415 | 0.128 | 0.609 | 0.175 | 0.034 | 0.656 |
| 20 | 0.241 | 0.534 | 0.179 | 0.538 | 0.127 | 0.011 | 0.681 |
| 21 | 0.323 | 0.526 | 0.125 | 0.462 | 0.129 | 0.123 | 0.642 |
| 22 | 0.236 | 0.515 | 0.248 | 0.431 | 0.06 | 0.106 | 0.583 |
| 23 | 0.171 | 0.628 | 0.138 | 0.045 | 0.096 | 0.185 | 0.488 |
| 24 | 0.185 | 0.616 | 0.101 | 0.366 | 0.045 | 0.199 | 0.6 |
| 25 | 0.151 | 0.734 | 0.032 | 0.078 | 0.107 | 0.232 | 0.634 |
| 26 | 0.207 | 0.736 | 0.082 | 0.117 | 0.148 | −0.005 | 0.626 |
| 27 | 0.191 | 0.407 | 0.51 | 0.061 | 0.228 | 0.177 | 0.55 |
| 28 | 0.285 | 0.037 | 0.499 | 0.091 | 0.023 | 0.228 | 0.392 |
| 29 | 0.144 | 0.061 | 0.734 | 0.176 | 0.134 | 0.005 | 0.612 |
| 30 | 0.146 | 0.088 | 0.684 | 0.188 | 0.143 | −0.004 | 0.552 |
| 31 | 0.137 | 0.038 | 0.578 | 0.486 | 0.159 | 0.157 | 0.64 |
| 32 | −0.031 | 0.273 | 0.69 | −0.149 | 0.139 | 0.137 | 0.612 |
| 33 | −0.002 | 0.048 | 0.519 | 0.455 | 0.317 | 0.111 | 0.592 |
| 34 | −0.105 | 0.196 | 0.427 | 0.411 | 0.044 | 0.444 | 0.599 |
| 35 | 0.17 | 0.133 | 0.377 | 0.303 | 0.229 | 0.428 | 0.516 |
| Total | 5.713 | 4.228 | 3.695 | 2.539 | 2.089 | 2.122 | —— |
| Strengths: 1.16 | Weaknesses: −0.25 | ||||||||||
| Code | Factor | Variable | Weighted Score | Code | Factor | Variable | Weighted Score | ||||
| S1 | Relationship with shareholders | 3 | 3.4861 | W1 | corporate culture | 7 | −0.0629 | ||||
| S2 | Business diversification | 4 | 3.4676 | W2 | qualifications | 10 | −0.0025 | ||||
| S3 | Business and social relations | 5 | 3.5880 | W3 | management system | 11 | −0.0745 | ||||
| S4 | Customer service quality | 6 | 3.6296 | W4 | capital | 12 | −0.0334 | ||||
| S5 | Technology and product innovation capability | 8 | 3.5278 | W5 | Industry status | 13 | −0.0386 | ||||
| S6 | Core technology competitiveness | 9 | 3.5417 | W6 | Brand reputation | 14 | −0.0124 | ||||
| S7 | Talent reserve | 15 | 3.4074 | W7 | Patent and software copyright reserve | 16 | −0.0281 | ||||
| Opportunities: 1.44 | SO:Development strategy | WO: Transformation strategy | |||||||||
| Code | Factor | Variable | Weighted Score | 1. Market penetration strategy: expand customer network and market space 2. Market development strategy: cultivate new customers and new regional market | 3. Cooperation strategy: joint venture and horizontal integration | ||||||
| O1 | Preferential policies for headquarters cities | 1 | 0.0549 | ||||||||
| O2 | Government purchase | 2 | 0.1111 | ||||||||
| O3 | New infrastructure policy | 18 | 0.1449 | ||||||||
| O4 | Smart city and construction policy | 19 | 0.1891 | ||||||||
| O5 | Smart building planning | 20 | 0.1826 | ||||||||
| O6 | Development prospect of intelligent building | 21 | 0.1574 | ||||||||
| O7 | Market demand growth | 22 | 0.1639 | ||||||||
| O8 | Supplier dependency | 23 | 0.0995 | ||||||||
| O9 | Social recognition of smart building | 24 | 0.1322 | ||||||||
| O10 | Technical level of smart building | 25 | 0.1167 | ||||||||
| O11 | Intelligent construction technology level | 26 | 0.0826 | ||||||||
| Threats: 0.57 | ST: Diversification strategy | WT: Defensive strategy | |||||||||
| Code | Factor | Variable | Weighted Score | 4. Business expansion strategy: vertical integration 5. Harvest strategy: control investment | 6. Abandonment strategy: divestiture and liquidation | ||||||
| T1 | Threat of substitutes | 17 | −0.0175 | ||||||||
| T2 | Macro policy volatility and inclusive | 27 | −0.0494 | ||||||||
| T3 | Potential entrants | 28 | −0.0910 | ||||||||
| T4 | Macroeconomic situation | 29 | −0.0745 | ||||||||
| T5 | Development level of headquarters city | 30 | −0.0229 | ||||||||
| T6 | competition among enterprises | 31 | −0.0910 | ||||||||
| T7 | COVID-19 influence | 32 | −0.0074 | ||||||||
| T8 | Difficulty of new customer development | 33 | −0.1051 | ||||||||
| T9 | Bargaining power of major customers | 34 | −0.0441 | ||||||||
| T10 | Product standardization level | 35 | −0.0629 | ||||||||
| SWOT | Factor | Code | Variable | Weighted SCORE | Score | Weighted Score | Market Penetration | Market Development | Cooperation Strategy | Business Expansion | Harvest Strategy | Abandonment Strategy | ||||||
|---|---|---|---|---|---|---|---|---|---|---|---|---|---|---|---|---|---|---|
| AS | TAS | AS | TAS | AS | TAS | AS | TAS | AS | TAS | AS | TAS | |||||||
| Strengths | Relationship with shareholders | S1 | 3 | 0.0433 | 3.49 | 0.1508 | 5 | 0.7542 | 4 | 0.6034 | 4 | 0.6034 | 4 | 0.6034 | 5 | 0.7542 | 2 | 0.3017 |
| Business diversification | S2 | 4 | 0.0400 | 3.47 | 0.1387 | 4 | 0.5548 | 5 | 0.6935 | 2 | 0.2774 | 5 | 0.6935 | 5 | 0.6935 | 2 | 0.2774 | |
| Business and social relations | S3 | 5 | 0.0547 | 3.59 | 0.1962 | 5 | 0.9811 | 2 | 0.3925 | 3 | 0.5887 | 3 | 0.5887 | 5 | 0.9811 | 1 | 0.1962 | |
| Customer service quality | S4 | 6 | 0.0563 | 3.63 | 0.2045 | 4 | 0.8178 | 5 | 1.0223 | 3 | 0.6134 | 4 | 0.8178 | 4 | 0.8178 | 3 | 0.6134 | |
| Technology and product innovation capability | S5 | 8 | 0.0482 | 3.53 | 0.1699 | 3 | 0.5097 | 5 | 0.8495 | 1 | 0.1699 | 5 | 0.8495 | 2 | 0.3398 | 2 | 0.3398 | |
| Core technology competitiveness | S6 | 9 | 0.0498 | 3.54 | 0.1764 | 4 | 0.7055 | 4 | 0.7055 | 1 | 0.1764 | 4 | 0.7055 | 1 | 0.1764 | 2 | 0.3528 | |
| Talent reserve | S7 | 15 | 0.0367 | 3.41 | 0.1252 | 2 | 0.2503 | 3 | 0.3755 | 2 | 0.2503 | 3 | 0.3755 | 3 | 0.3755 | 3 | 0.3755 | |
| Weaknesses | corporate culture | W1 | 7 | 0.0196 | 3.21 | −0.0629 | 1 | −0.2514 | 3 | −0.1257 | 3 | −0.1257 | 2 | −0.1886 | 3 | −0.1257 | 4 | −0.0629 |
| qualifications | W2 | 10 | 0.0008 | 3.00 | −0.0025 | 4 | −0.0025 | 5 | 0.0000 | 3 | −0.0049 | 2 | −0.0074 | 4 | −0.0025 | 3 | −0.0049 | |
| management system | W3 | 11 | 0.0229 | 3.26 | −0.0745 | 4 | −0.0745 | 3 | −0.1490 | 4 | −0.0745 | 2 | −0.2235 | 4 | −0.0745 | 4 | −0.0745 | |
| capital | W4 | 12 | 0.0106 | 3.14 | −0.0334 | 3 | −0.0667 | 3 | −0.0667 | 5 | 0.0000 | 4 | −0.0334 | 4 | −0.0334 | 1 | −0.1334 | |
| Industry status | W5 | 13 | 0.0122 | 3.16 | −0.0386 | 2 | −0.1159 | 4 | −0.0386 | 3 | −0.0773 | 2 | −0.1159 | 4 | −0.0386 | 3 | −0.0773 | |
| Brand reputation | W6 | 14 | 0.0041 | 3.05 | −0.0124 | 4 | −0.0124 | 4 | −0.0124 | 2 | −0.0373 | 3 | −0.0249 | 4 | −0.0124 | 3 | −0.0249 | |
| Patent and software copyright reserve | W7 | 16 | 0.0090 | 3.13 | −0.0281 | 2 | −0.0843 | 2 | −0.0843 | 2 | −0.0843 | 2 | −0.0843 | 3 | −0.0562 | 4 | −0.0281 | |
| Opportunities | Preferential policies for headquarters cities | O1 | 1 | 0.0171 | 3.20 | 0.0549 | 2 | 0.1098 | 5 | 0.2746 | 4 | 0.2196 | 4 | 0.2196 | 4 | 0.2196 | 3 | 0.1647 |
| Government purchase | O2 | 2 | 0.0335 | 3.32 | 0.1111 | 2 | 0.2222 | 5 | 0.5555 | 4 | 0.4444 | 4 | 0.4444 | 3 | 0.3333 | 2 | 0.2222 | |
| New infrastructure policy | O3 | 18 | 0.0416 | 3.48 | 0.1449 | 4 | 0.5797 | 5 | 0.7247 | 5 | 0.7247 | 5 | 0.7247 | 4 | 0.5797 | 4 | 0.5797 | |
| Smart city and construction policy | O4 | 19 | 0.0531 | 3.56 | 0.1891 | 5 | 0.9457 | 5 | 0.9457 | 4 | 0.7566 | 4 | 0.7566 | 4 | 0.7566 | 3 | 0.5674 | |
| Smart building planning | O5 | 20 | 0.0514 | 3.55 | 0.1826 | 3 | 0.5479 | 5 | 0.9131 | 4 | 0.7305 | 4 | 0.7305 | 3 | 0.5479 | 2 | 0.3652 | |
| Development prospect of intelligent building | O6 | 21 | 0.0449 | 3.50 | 0.1574 | 4 | 0.6294 | 4 | 0.6294 | 4 | 0.6294 | 5 | 0.7868 | 4 | 0.6294 | 3 | 0.4721 | |
| Market demand growth | O7 | 22 | 0.0465 | 3.52 | 0.1639 | 5 | 0.8197 | 5 | 0.8197 | 4 | 0.6557 | 5 | 0.8197 | 4 | 0.6557 | 3 | 0.4918 | |
| Supplier dependency | O8 | 23 | 0.0302 | 3.30 | 0.0995 | 3 | 0.2986 | 3 | 0.2986 | 1 | 0.0995 | 3 | 0.2986 | 2 | 0.1991 | 1 | 0.0995 | |
| Social recognition of smart building | O9 | 24 | 0.0384 | 3.44 | 0.1322 | 3 | 0.3965 | 4 | 0.5287 | 3 | 0.3965 | 4 | 0.5287 | 3 | 0.3965 | 3 | 0.3965 | |
| Technical level of smart building | O10 | 25 | 0.0351 | 3.32 | 0.1167 | 1 | 0.1167 | 3 | 0.3500 | 1 | 0.1167 | 2 | 0.2334 | 2 | 0.2334 | 2 | 0.2334 | |
| Intelligent construction technology level | O11 | 26 | 0.0253 | 3.26 | 0.0826 | 1 | 0.0826 | 2 | 0.1652 | 3 | 0.2478 | 2 | 0.1652 | 2 | 0.1652 | 2 | 0.1652 | |
| Threats | Threat of substitutes | T1 | 17 | 0.0057 | 3.07 | 0.0175 | 3 | 0.0351 | 4 | 0.0175 | 3 | 0.0351 | 3 | 0.0351 | 1 | 0.0701 | 4 | 0.0175 |
| Macro policy volatility and inclusive | T2 | 27 | 0.0155 | 3.19 | 0.0494 | 2 | 0.1482 | 4 | 0.0494 | 3 | 0.0988 | 4 | 0.0494 | 2 | 0.1482 | 3 | 0.0988 | |
| Potential entrants | T3 | 28 | 0.0278 | 3.28 | 0.0910 | 4 | 0.0910 | 3 | 0.1820 | 4 | 0.0910 | 4 | 0.0910 | 2 | 0.2730 | 4 | 0.0910 | |
| Macroeconomic situation | T4 | 29 | 0.0229 | 3.26 | 0.0745 | 3 | 0.1490 | 5 | 0.0000 | 3 | 0.1490 | 4 | 0.0745 | 5 | 0.0000 | 2 | 0.2235 | |
| Development level of headquarters city | T5 | 30 | 0.0074 | 3.12 | 0.0229 | 3 | 0.0458 | 2 | 0.0687 | 4 | 0.0229 | 4 | 0.0229 | 4 | 0.0229 | 2 | 0.0687 | |
| competition among enterprises | T6 | 31 | 0.0278 | 3.28 | 0.0910 | 4 | 0.0910 | 4 | 0.0910 | 3 | 0.1820 | 4 | 0.0910 | 3 | 0.1820 | 4 | 0.0910 | |
| COVID-19 influence | T7 | 32 | 0.0025 | 3.02 | 0.0074 | 2 | 0.0222 | 4 | 0.0074 | 5 | 0.0000 | 3 | 0.0148 | 4 | 0.0074 | 3 | 0.0148 | |
| Difficulty of new customer development | T8 | 33 | 0.0318 | 3.30 | 0.1051 | 2 | 0.3153 | 4 | 0.1051 | 4 | 0.1051 | 4 | 0.1051 | 1 | 0.4204 | 2 | 0.3153 | |
| Bargaining power of major customers | T9 | 34 | 0.0139 | 3.18 | 0.0441 | 3 | 0.0883 | 4 | 0.0441 | 2 | 0.1324 | 4 | 0.0441 | 3 | 0.0883 | 3 | 0.0883 | |
| Product standardization level | T10 | 35 | 0.0196 | 3.21 | 0.0629 | 1 | 0.2514 | 3 | 0.1257 | 5 | 0.0000 | 4 | 0.0629 | 2 | 0.1886 | 2 | 0.1886 | |
| Total | 1 | 9.9519 | 11.0615 | 8.1132 | 10.2548 | 9.9123 | 7.0061 | |||||||||||
| Coping Strategies | Business Type | Market Space |
|---|---|---|
| Market development strategy | Smart City Construction and Smart Building | Cities: Hezhou, Hechi, Chongzuo Provinces: Yunnan, Jiangxi, |
| Business expansion strategy | Smart Building and Smart Community | |
| Harvest strategy | Smart Building | Cities: Wu zhou, Guigang Provinces: Henan, Shanghai, Sichuan |
| Market penetration strategy | Smart City Construction | Cities: Liu zhou, Nan ning, Yu lin Provinces: Jiang su, Shan dong, Chong qing, He bei, Bei jing |
| Cooperation strategy | Smart Community and Smart Fire Fighting | Cities: Qinzhou, Bai se, Chong zuo Provinces: Anhui, Fujian |
| Abandonment strategy | Smart Parking and Smart Water | Cities: Beihai, Guilin, Fangchenggang Provinces: Ningxia, Qinghai, Sichuan, Liaoning, Inner Mongolia |
Publisher’s Note: MDPI stays neutral with regard to jurisdictional claims in published maps and institutional affiliations. |
© 2021 by the authors. Licensee MDPI, Basel, Switzerland. This article is an open access article distributed under the terms and conditions of the Creative Commons Attribution (CC BY) license (https://creativecommons.org/licenses/by/4.0/).
Share and Cite
Zhao, S.; Zhang, P.; Li, W. A Study on Evaluation of Influencing Factors for Sustainable Development of Smart Construction Enterprises: Case Study from China. Buildings 2021, 11, 221. https://doi.org/10.3390/buildings11060221
Zhao S, Zhang P, Li W. A Study on Evaluation of Influencing Factors for Sustainable Development of Smart Construction Enterprises: Case Study from China. Buildings. 2021; 11(6):221. https://doi.org/10.3390/buildings11060221
Chicago/Turabian StyleZhao, Sidong, Ping Zhang, and Weiwei Li. 2021. "A Study on Evaluation of Influencing Factors for Sustainable Development of Smart Construction Enterprises: Case Study from China" Buildings 11, no. 6: 221. https://doi.org/10.3390/buildings11060221
APA StyleZhao, S., Zhang, P., & Li, W. (2021). A Study on Evaluation of Influencing Factors for Sustainable Development of Smart Construction Enterprises: Case Study from China. Buildings, 11(6), 221. https://doi.org/10.3390/buildings11060221