
Corrosion Activity of Carbon Steel B450C and Low Chromium Ferritic Stainless Steel 430 in Cement Extract Solution

 ,
,  ,
,  ,
,  and
and 
Abstract
1. Introduction
2. Materials and Methods
2.1. Samples and Solution Preparation
2.2. Immersion Test and Surface Characterization
2.3. Electrochemical Measurements
3. Results and Discussion
3.1. Steel Surface Characterization
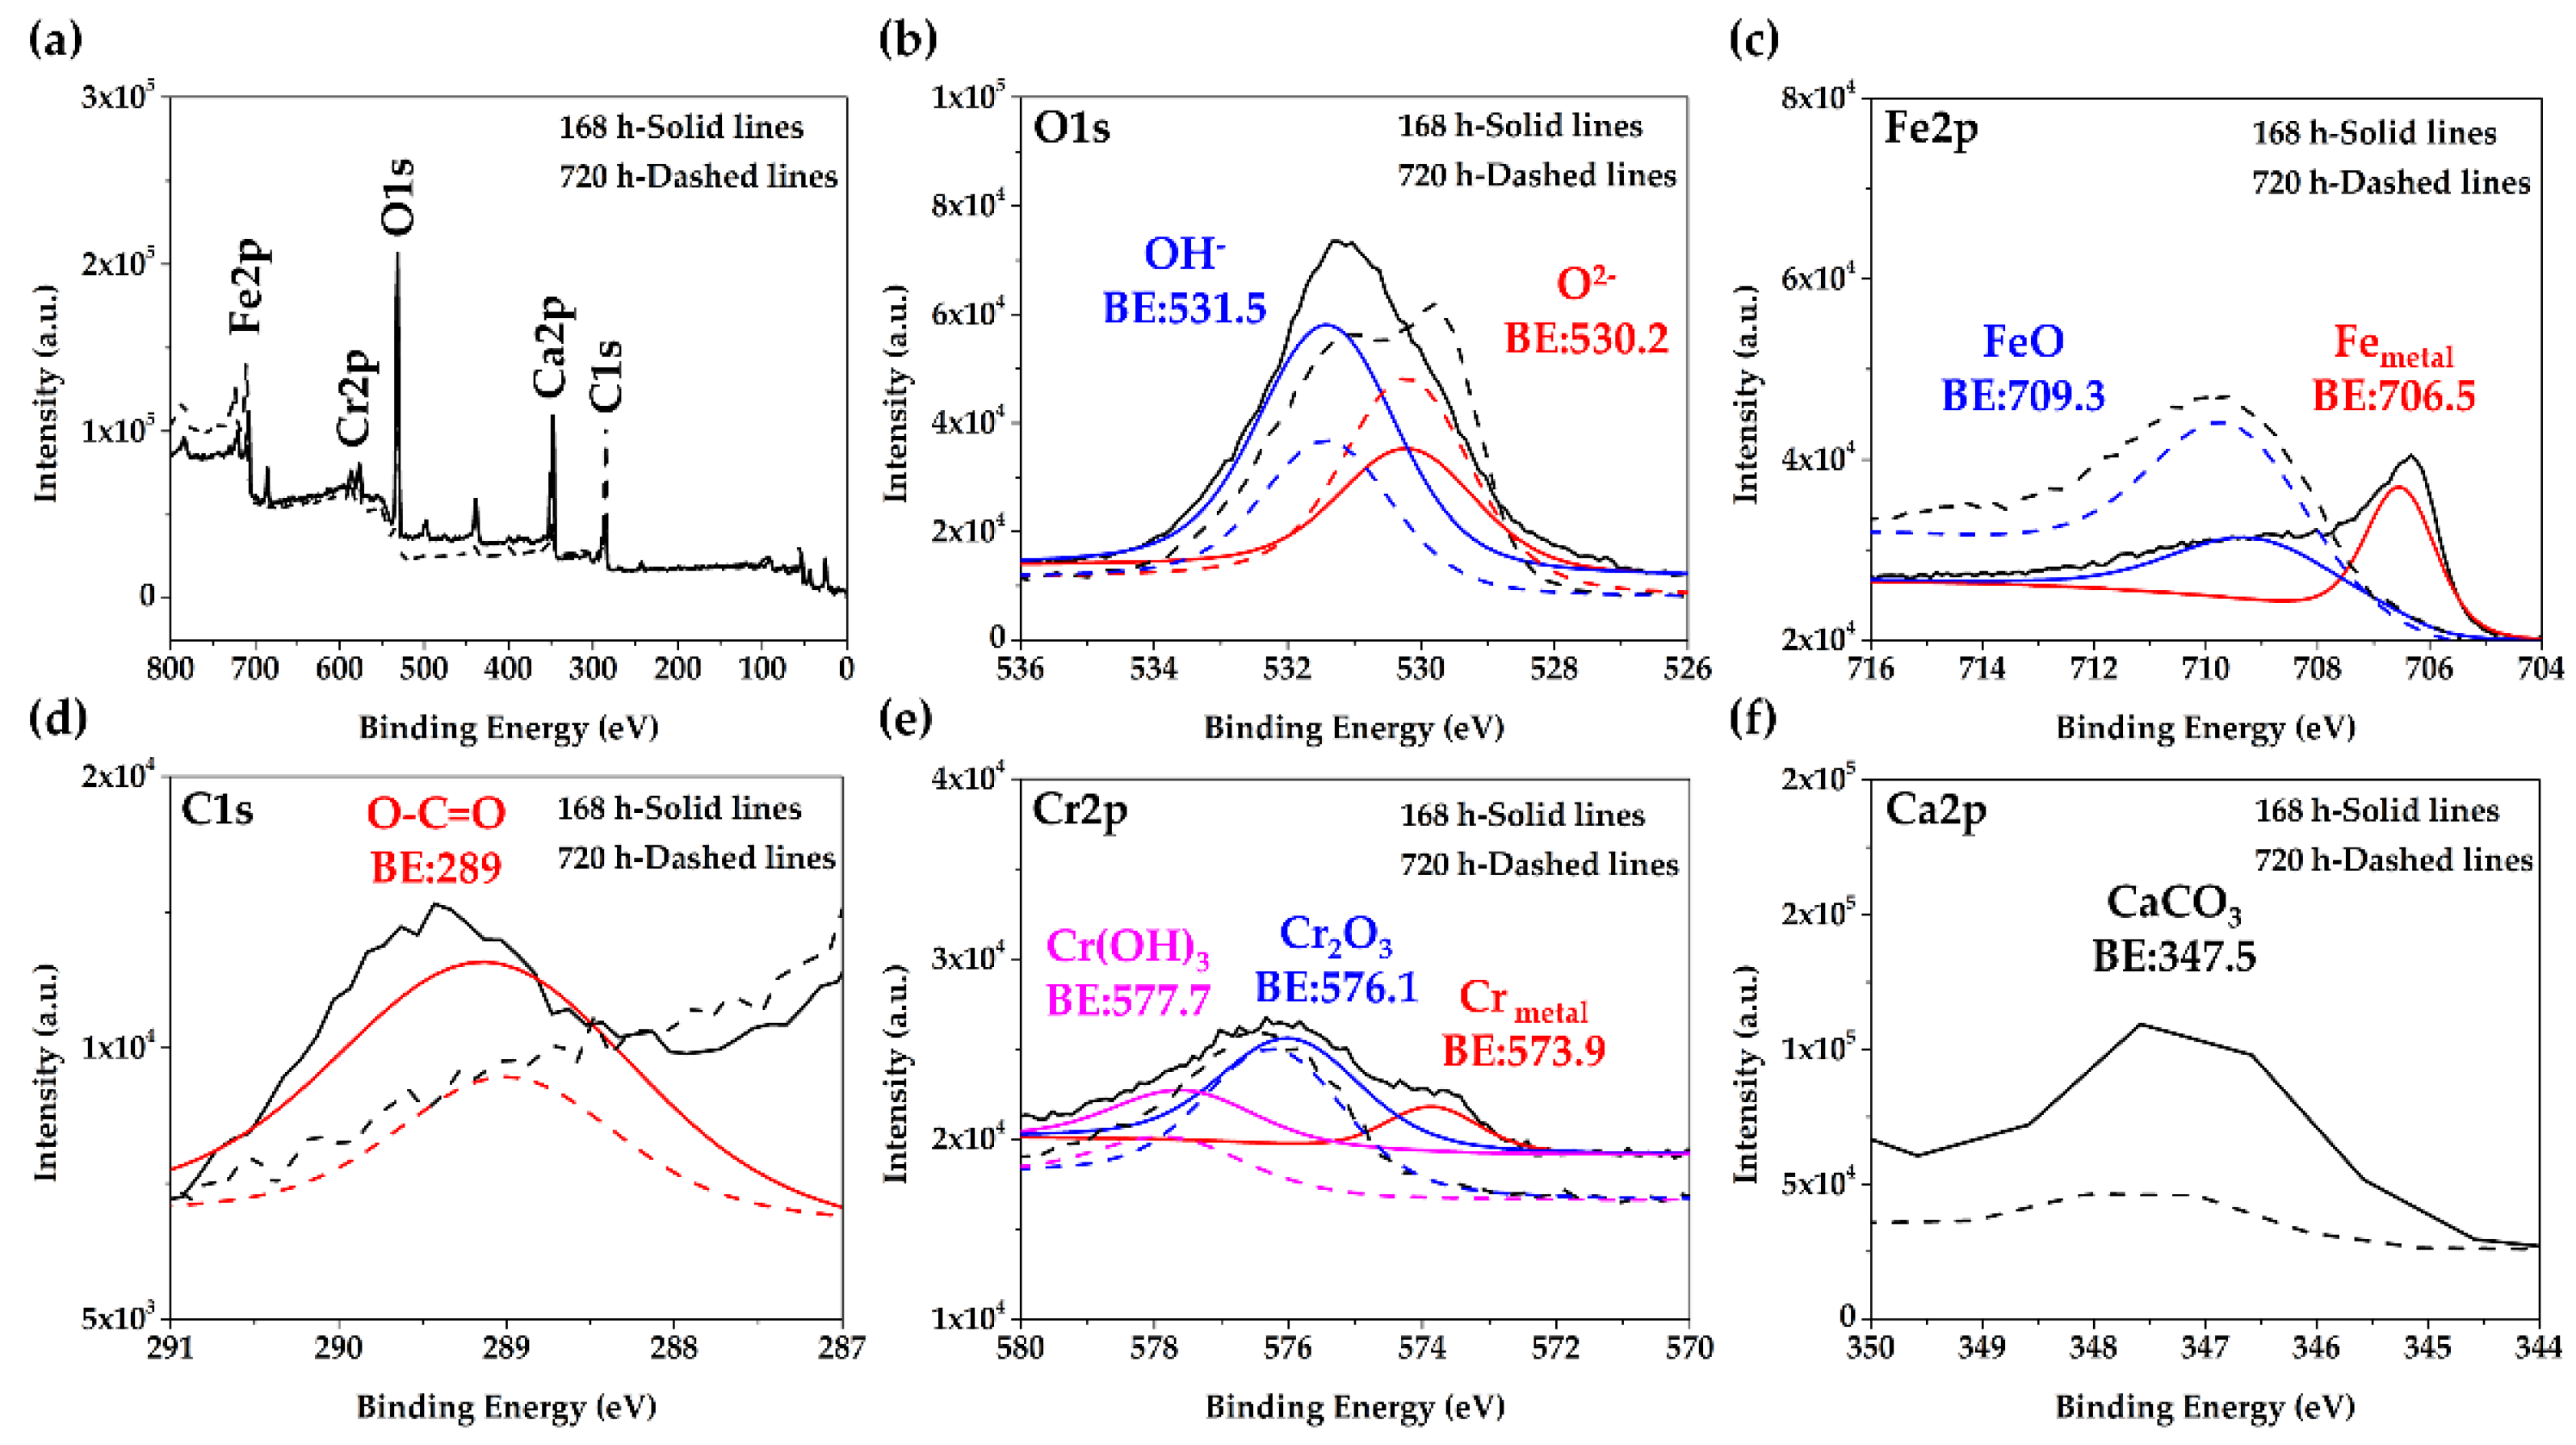
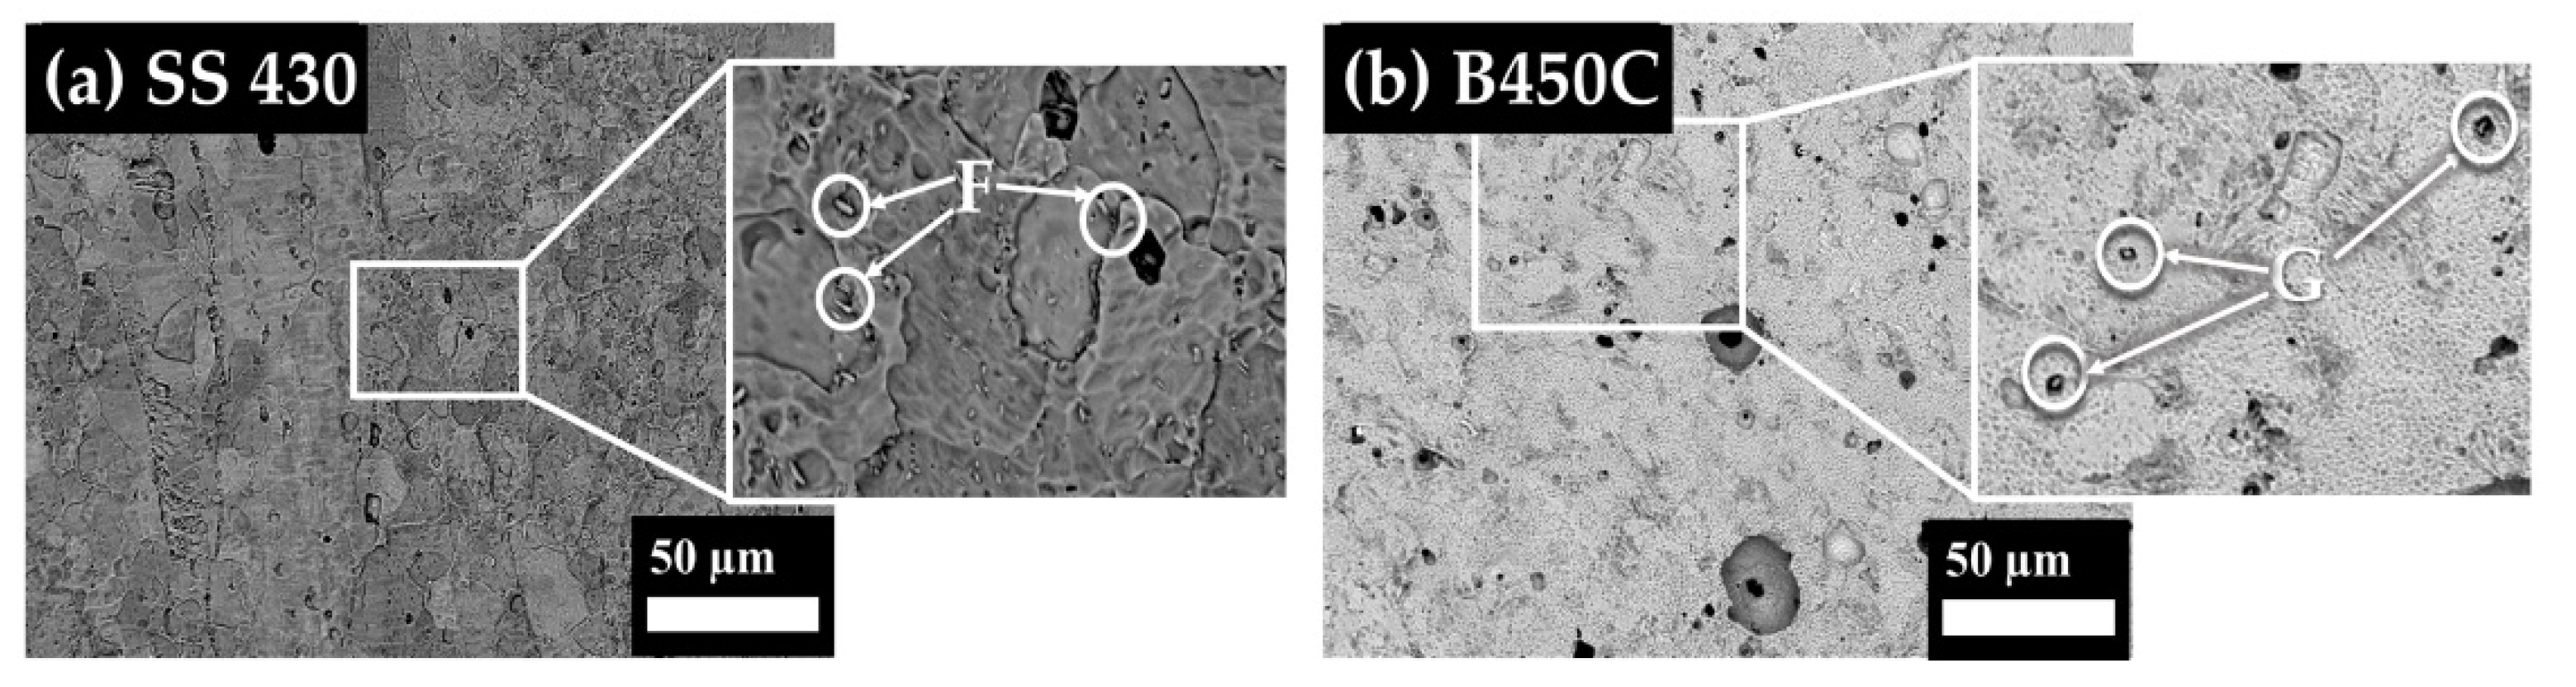
3.2. Steel Surface Characterization after Exposure to Cement Extract Solution
3.3. Change in Time of pH of Cement Extract Solution during Exposure of Steel Samples
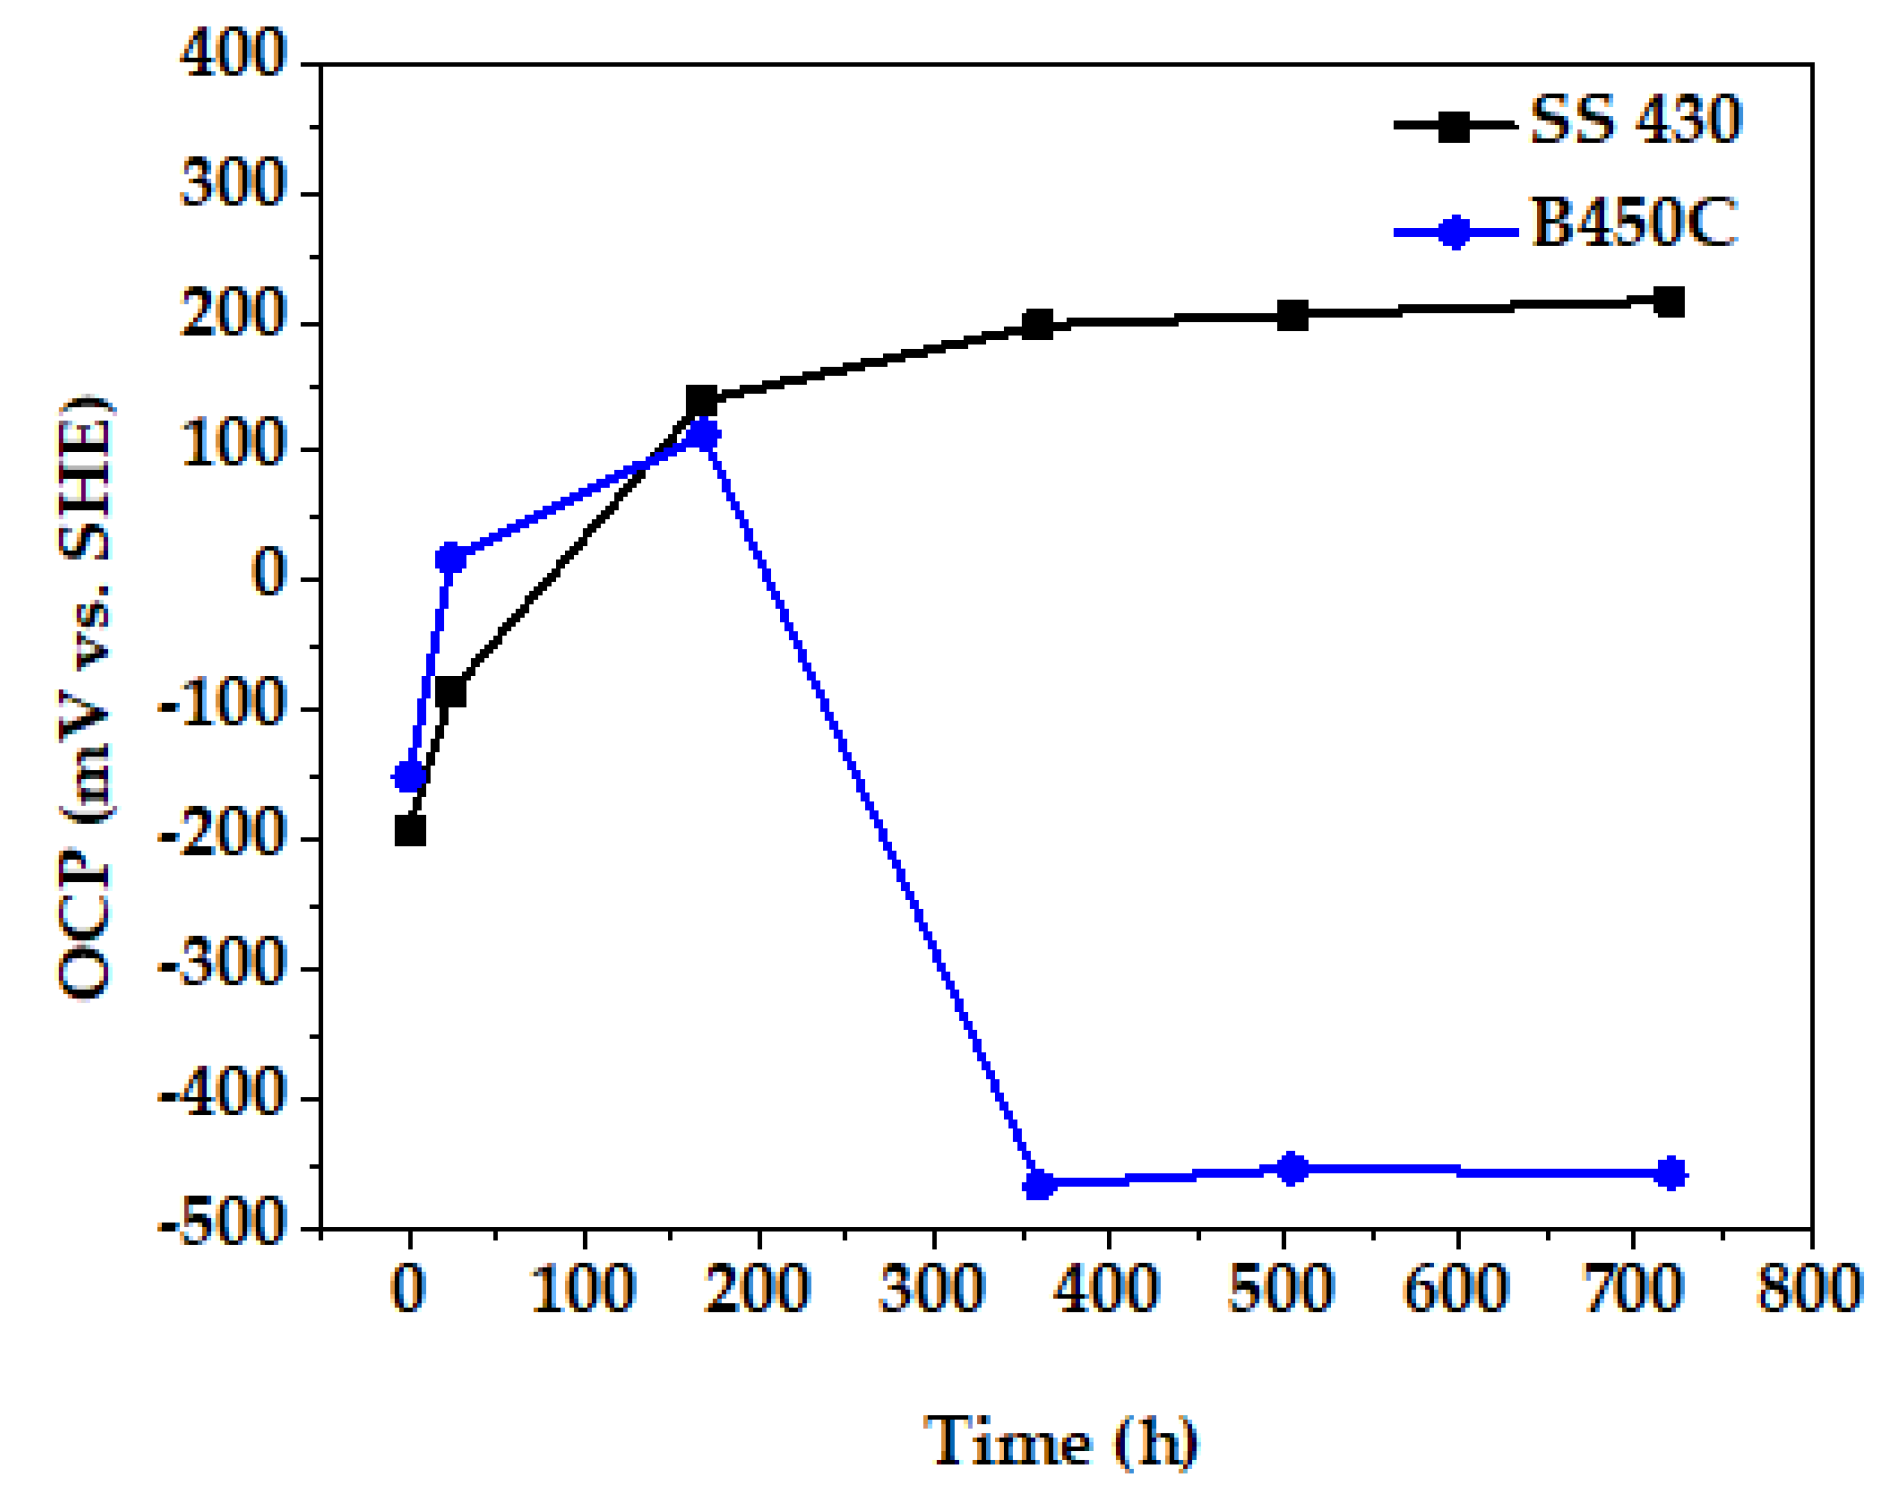
3.4. Change in Time of Corrosion Potential (OCP) of SS 430 and Carbon Steel (B450C) during Exposure in Cement Extract Solution
3.5. Electrochemical Measurements
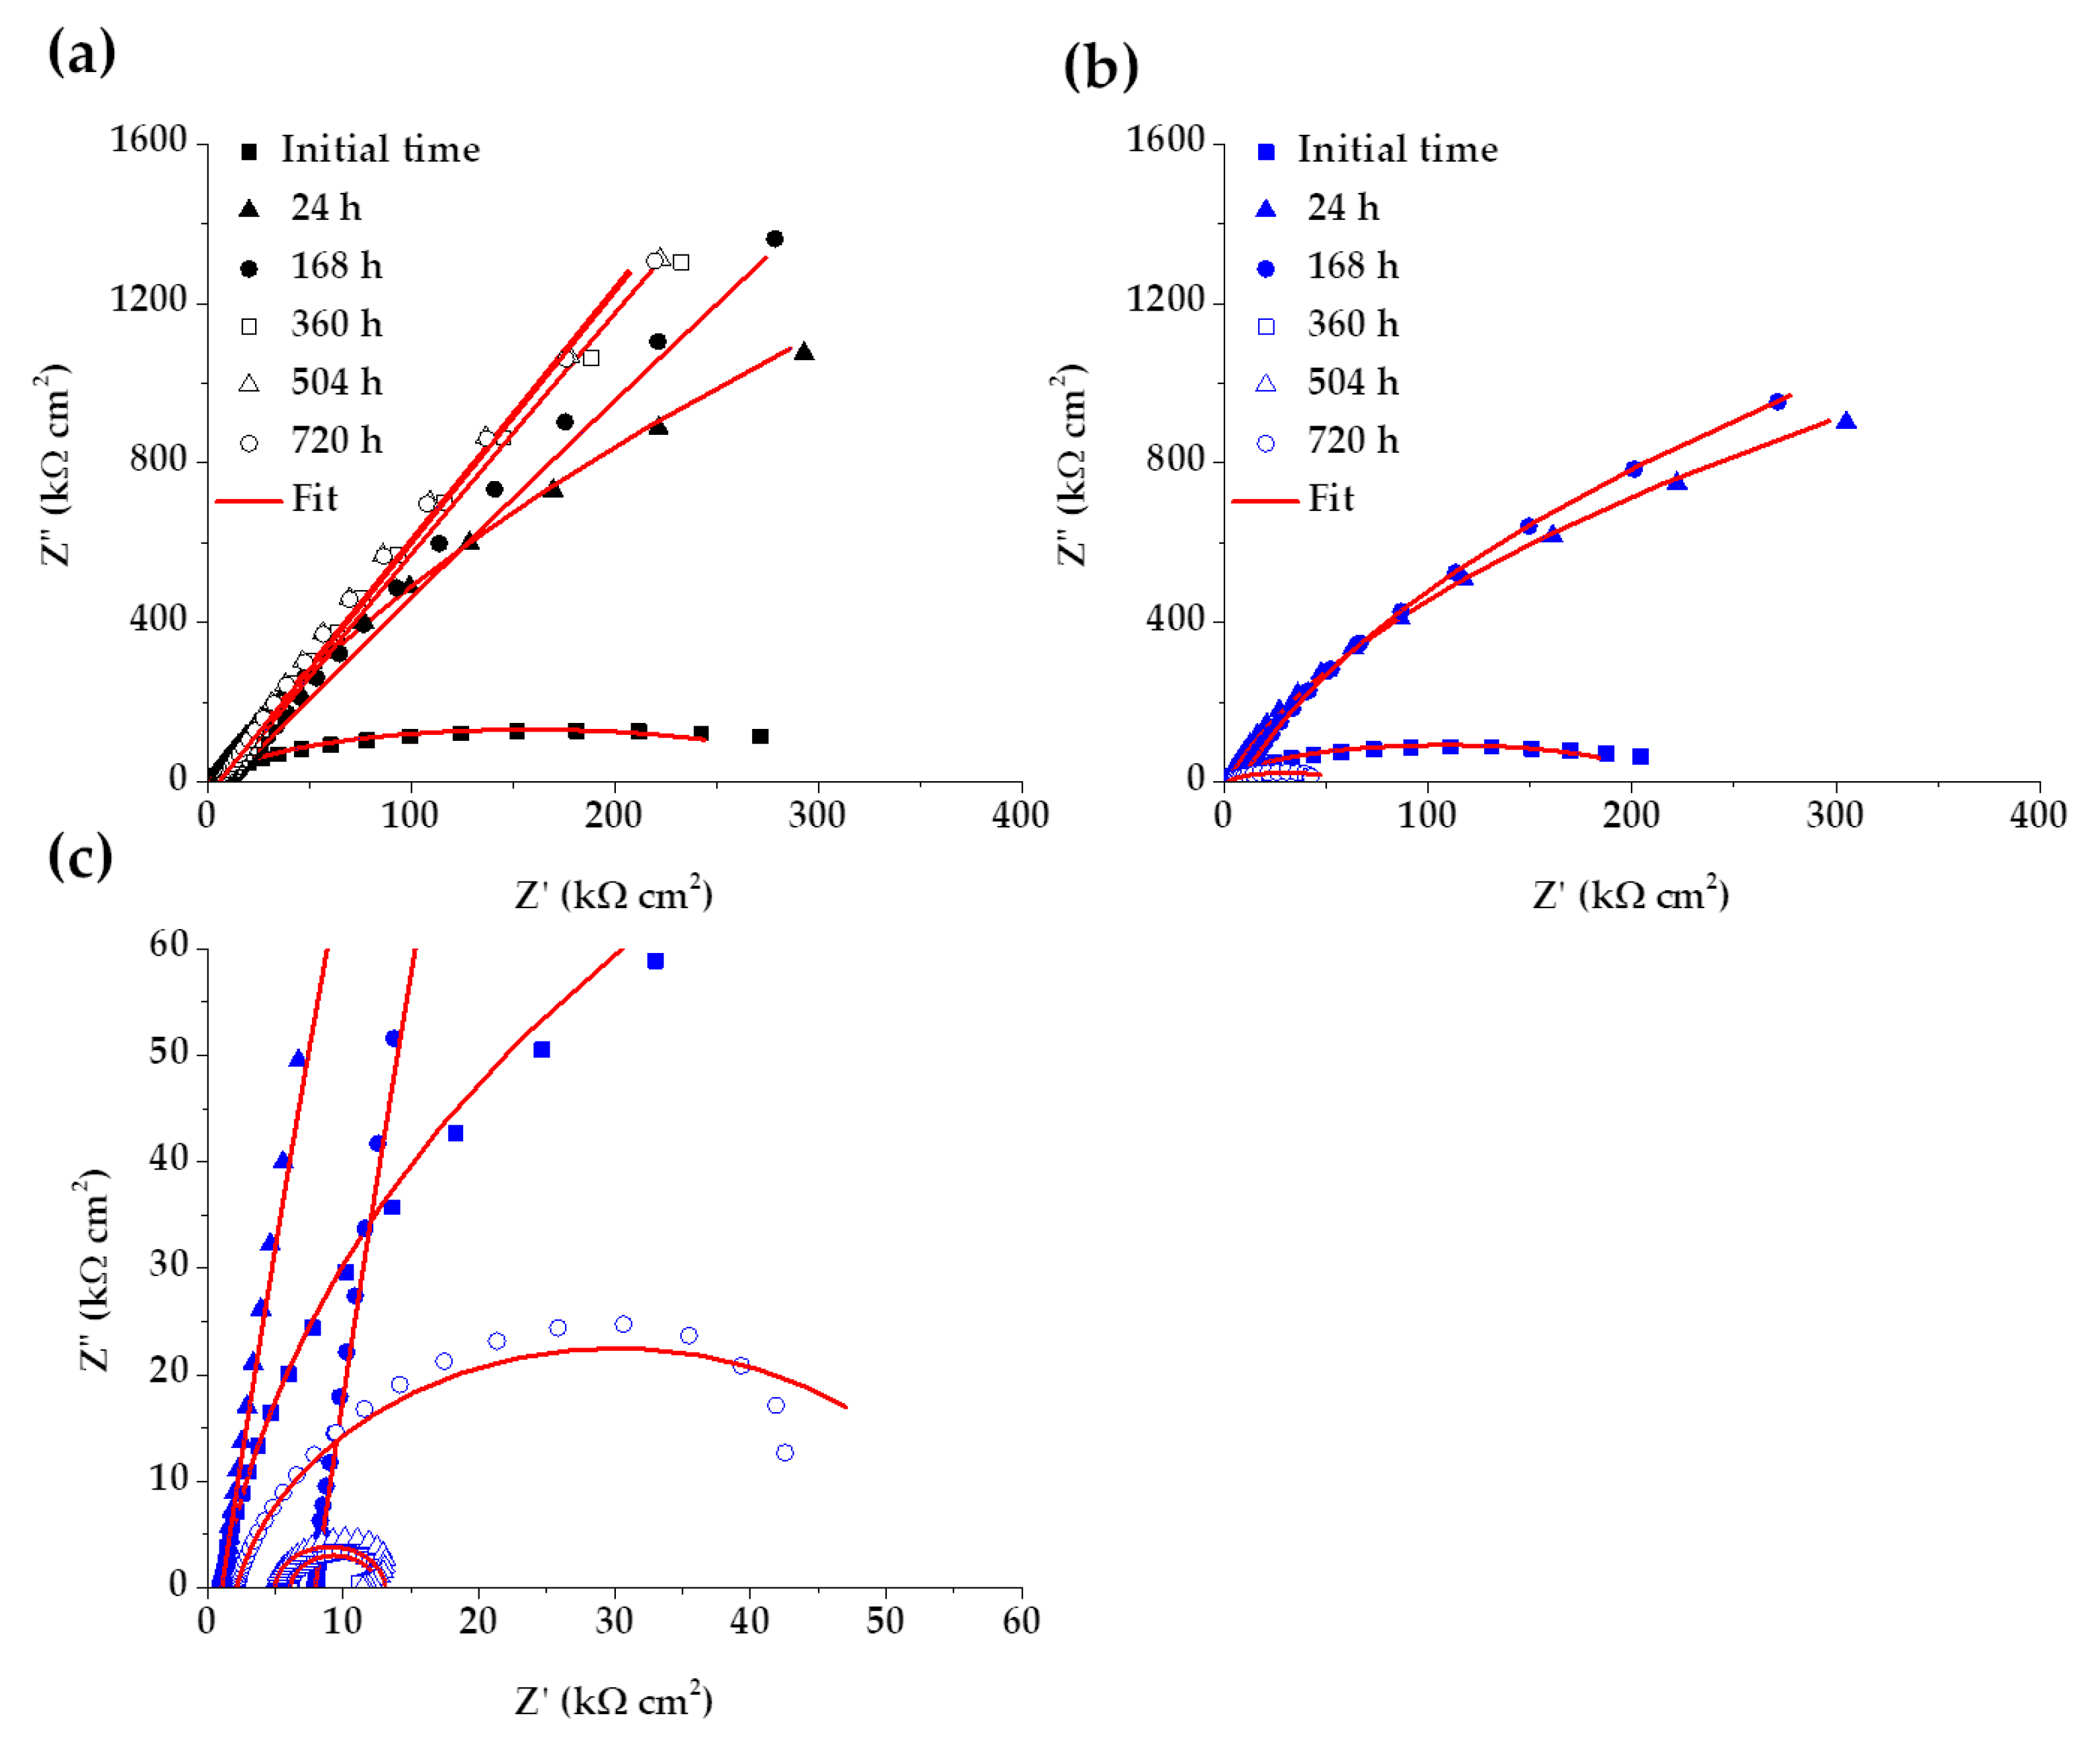
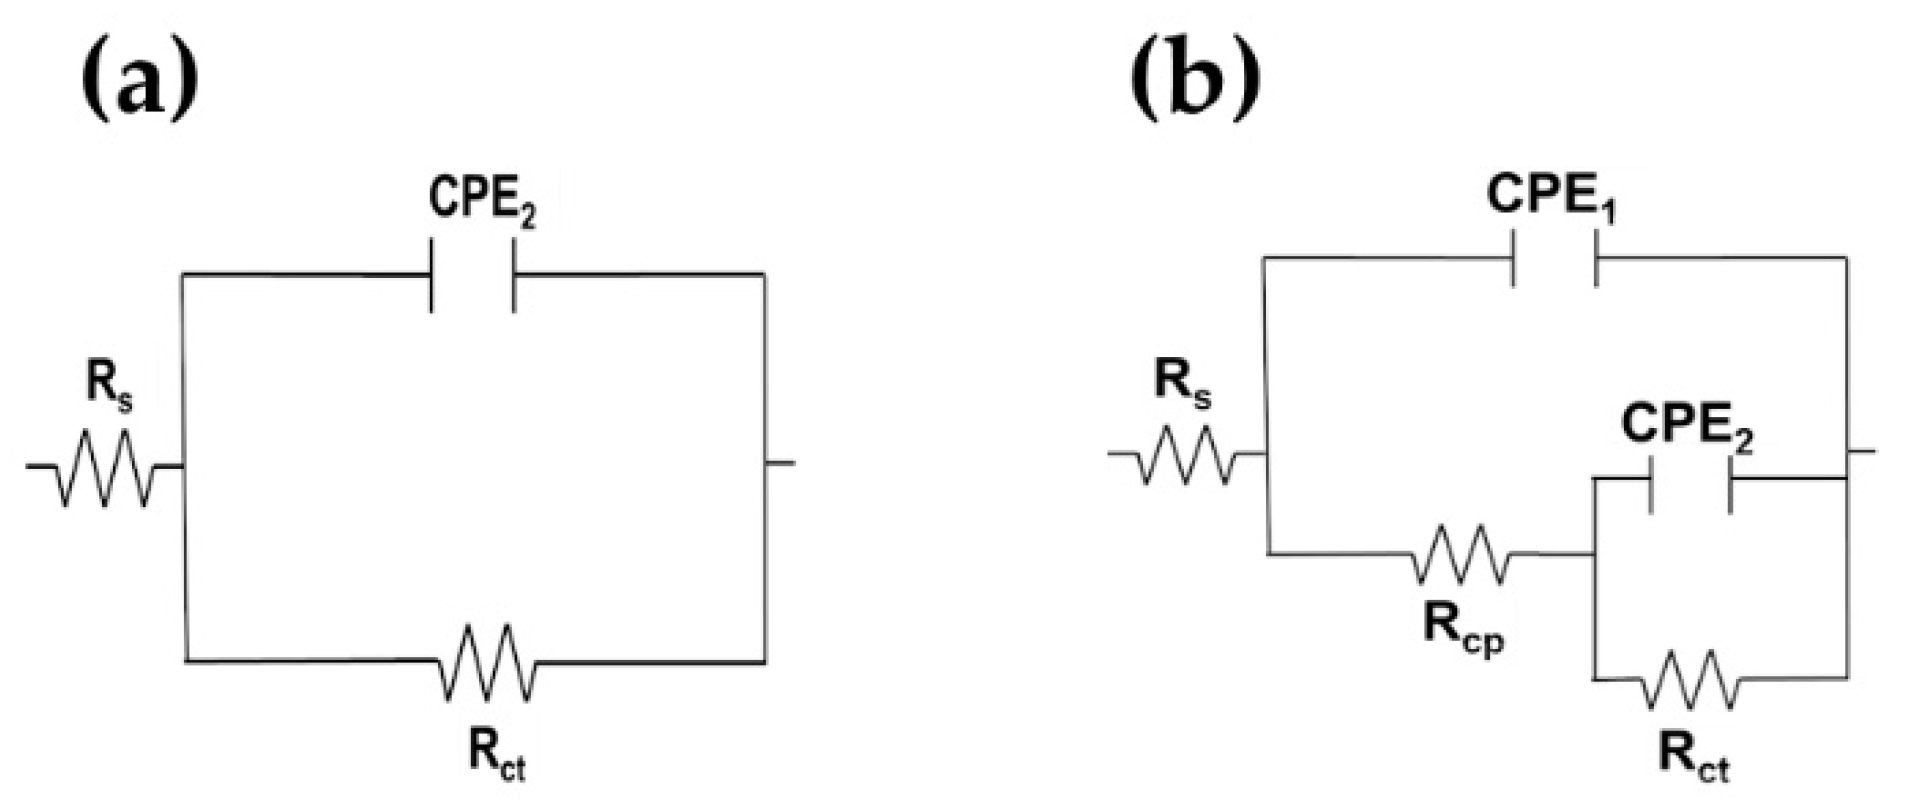
Electrochemical Impedance Spectroscopy (EIS)
4. Conclusions
Author Contributions
Funding
Data Availability Statement
Acknowledgments
Conflicts of Interest
References
- Shi, X.; Xie, N.; Fortune, K.; Gong, J. Durability of steel reinforced concrete in chloride environments: An overview. Constr. Build. Mater. 2012, 30, 125–138. [Google Scholar] [CrossRef]
- Aguirre, A.M.; Mejía de Gutiérrez, R. Durability of reinforced concrete exposed to aggressive conditions. Mater. Construcc. 2013, 63, 7–38. [Google Scholar] [CrossRef]
- Lollini, F.; Carsana, M.; Gastaldi, M.; Redaelli, E. Corrosion behaviour of stainless steel reinforcement in concrete. Corros. Rev. 2019, 37, 3–19. [Google Scholar] [CrossRef]
- Nóvoa, X.R. Electrochemical aspects of the steel-concrete system. A review. J. Solid State Electrochem. 2016, 20, 2113–2125. Available online: https://link.springer.com/article/10.1007/s10008-016-3238-z (accessed on 21 February 2021). [CrossRef]
- Liu, G.; Zhang, Y.; Wu, M.; Huang, R. Study of depassivation of carbon steel in simulated concrete pore solution using different equivalent circuits. Constr. Build. Mater. 2017, 157, 357–362. [Google Scholar] [CrossRef]
- Wang, Z.; Di-Franco, F.; Seyeux, A.; Zanna, S.; Maurice, V.; Marcus, P. Passivation-induced physicochemical alterations of the native surface oxide film on 316L austenitic stainless steel. J. Electrochem. Soc. 2019, 166, C3376–C3388. [Google Scholar] [CrossRef]
- Wang, L.; Seyeux, A.; Marcus, P. Ion transport mechanisms in the oxide film formed on 316L stainless steel surfaces studied by ToF-SIMS with 18O2 isotopic tracer. J. Electrochem. Soc. 2020, 167, 101511. [Google Scholar] [CrossRef]
- Sedriks, A.J. Corrosion of stainless steels. In Encyclopedia of Materials: Science and Technology, 2nd ed.; Jürgen, B., Flemings, M., Kramer, E., Veyssière, P., Cahn, R., Ilschner, B., Mahajna, S., Eds.; Elsevier: Amsterdam, The Netherlands, 2001; pp. 1707–1708. [Google Scholar] [CrossRef]
- Ma, L.; Wiame, F.; Maurice, V.; Marcus, P. New insight on early oxidation stages of austenitic stainless steel from in situ XPS analysis on single-crystalline Fe–18Cr–13Ni. Corros. Sci. 2018, 140, 205–216. [Google Scholar] [CrossRef]
- Gardin, E.; Zanna, S.; Seyeux, A.; Allion-Maurer, A.; Marcus, P. XPS and ToF-SIMS characterization of the surface oxides on lean duplex stainless steel–Global and local approaches. Corros. Sci. 2019, 155, 121–133. [Google Scholar] [CrossRef]
- Gardin, E.; Zanna, S.; Seyeux, A.; Allion-Maurer, A.; Marcus, P. Comparative study of the surface oxide films on lean duplex and corresponding single phase stainless steels by XPS and ToF-SIMS. Corros. Sci. 2018, 143, 403–413. [Google Scholar] [CrossRef]
- Maurice, V.; Peng, H.; Klein, L.H.; Seyeux, A.; Zanna, S.; Marcus, P. Effects of molybdenum on the composition and nanoscale morphology of passivated austenitic stainless steel surfaces. Faraday Discuss. 2015, 180, 151–170. [Google Scholar] [CrossRef] [PubMed]
- Papavinasam, S. Chapter 6-Modeling–internal corrosion. In Corrosion Control in the Oil and Gas Industry, 1st ed.; Papavinasam, S., Ed.; Gulf Professional Publishing: Houston, TX, USA, 2014; pp. 301–360. [Google Scholar] [CrossRef]
- Olsson, C.O.A. Wet corrosion of stainless steels and other chromium-bearing alloys. In Encyclopedia of Interfacial Chemistry; Wandelt, K., Ed.; Elsevier: Amsterdam, The Netherlands, 2018; pp. 535–542. [Google Scholar] [CrossRef]
- Lippold, J.C.; Kotecki, D.J. Welding Metallurgy and Weldability of Stainless Steels, 1st ed.; John Wiley & Sons, Inc.: Hoboken, NJ, USA, 2005; pp. 19–55. [Google Scholar]
- Bertolini, L.; Elsener, B.; Pedeferri, P.; Redaelli, E.; Polder, R. Corrosion of Steel in Concrete: Prevention, Diagnosis, Repair, 2nd ed.; Wiley-VCH Verlag GmbH & Co. KGaA: Weinheim, Germany, 2013; pp. 263–283. [Google Scholar]
- Pourbaix, M. Atlas of Electrochemical Equilibria in Aqueous Solutions, 2nd ed.; NACE: Houston, TX, USA, 1974; pp. 307–321. [Google Scholar]
- Taylor, H.F.W. Cement Chemistry, 2nd ed.; Thomas Telford: London, UK, 1997; pp. 351–384. [Google Scholar]
- Li, K. Durability Design of Concrete Structures: Phenomena, Modeling, and Practice, 1st ed.; John Wiley & Sons Singapore Pte. Ltd.: Solaris South Tower, Singapore, 2016; pp. 1–255. [Google Scholar]
- Vago, E.R.; Calvo, E.J.; Stratmann, M. Electrocatalysis of oxygen reduction at well-defined iron oxide electrodes. Electrochemin. Acta 1994, 39, 1655–1659. [Google Scholar] [CrossRef]
- Hem, J.D.; Cropper, W.H. Chemistry of Iron in Natural Water. Geological Survey Water-Supply Paper 1459-A; United States Department of the Interior Stewart L. Udall, Secretary: Washington, DC, USA, 1962; pp. 1–31. [Google Scholar]
- Benitez, A.; Manzelli, A.; Macci, C.; Charreau, G.; Fernandez, L.; Husni, R.; Guitelman, N. Actions and mechanisms of deterioration of structures. In Concrete Structures: Rehabilitation and Maintenance; Paulo Helene & Fernanda Pereira: São Paulo, Brazil, 2007; pp. 1–89. [Google Scholar]
- Wang, L.; Zhan, S.; Tang, X.; Xiu, Q.; Qian, K. Pore solution chemistry of calcium sulfoaluminate cement and its effects on steel passivation. Appl. Sci. 2019, 9, 1092. [Google Scholar] [CrossRef]
- Duffó, G.S.; Farina, S.B. Electrochemical behaviour of steel in mortar and in simulated pore solutions: Analogies and differences. Cem. Concr. Res. 2016, 88, 211–216. [Google Scholar] [CrossRef]
- Poursaee, A.; Hansson, C.M. Potential pitfalls in assessing chloride-induced corrosion of steel in concrete. Cem. Concr. Res. 2009, 39, 391–400. [Google Scholar] [CrossRef]
- Chakri, S.; Frateur, I.; Orazem, M.E.; Sutter, E.M.M.; Tran, T.T.M.; Tribollet, B.; Vivier, V. Improved EIS analysis of the electrochemical behaviour of carbon steel in alkaline solution. Electrochim. Acta 2017, 246, 924–930. [Google Scholar] [CrossRef]
- Ghods, P.; Isgor, O.B.; McRae, G.A.; Gu, G.P. Electrochemical investigation of chloride-induced depassivation of black steel rebar under simulated service conditions. Corros. Sci. 2010, 52, 1649–1659. [Google Scholar] [CrossRef]
- Gunay, H.B.; Isgor, O.B.; Ghods, P. Kinetics of passivation and chloride-induced depassivation of iron in simulated concrete pore solutions using electrochemical quartz crystal nanobalance. Corrosion 2015, 71, 615–627. [Google Scholar] [CrossRef]
- Hussain, R.R.; Alhozaimy, A.; Al-Negheimish, A.; Singh, D.D.N. Time-dependent variation of the electrochemical impedance for thermo-mechanically treated versus plain low alloy steel rebars in contact with simulated concrete pore solution. Constr. Build. Mater. 2014, 73, 283–288. [Google Scholar] [CrossRef]
- Li, L.; Sagüés, A.A. Chloride corrosion threshold of reinforcing steel in alkaline solutions—Open-circuit immersion tests. Corrosion 2001, 57, 19–28. [Google Scholar] [CrossRef]
- Poursaee, A. Corrosion of steel bars in saturated Ca(OH)2 and concrete pore solution. Concr. Res. Lett. 2010, 1, 90–97. [Google Scholar]
- Williamson, J.; Isgor, O.B. The effect of simulated concrete pore solution composition and chlorides on the electronic properties of passive films on carbon steel rebar. Corros. Sci. 2016, 106, 82–95. [Google Scholar] [CrossRef]
- Veleva, L.; Alpuche-Aviles, M.A.; Graves-Brook, M.K.; Wipf, D.O. Comparative cyclic voltammetry and surface analysis of passive films grown on stainless steel 316 in concrete pore model solutions. J. Electroanal. Chem. 2002, 537, 85–93. [Google Scholar] [CrossRef]
- Veleva, L.; Alpuche-Aviles, M.A.; Graves-Brook, M.K.; Wipf, D.O. Voltammetry and surface analysis of AISI 316 stainless steel in chloride-containing simulated concrete pore environment. J. Electroanal. Chem. 2005, 578, 45–53. [Google Scholar] [CrossRef]
- Montemor, M.F.; Simoes, A.M.; Ferreira, M.G. Analytical characterization of the passive film formed on steel in solutions simulating the concrete interstitial electrolyte. Corrosion 1998, 54, 347–353. [Google Scholar] [CrossRef]
- Montemor, M.F.; Simoes, A.M. Analytical characterization of the passive film formed on steel in cement past intersticial solutions. Port. Electrochim. Acta 1995, 13, 453–456. [Google Scholar]
- Bacelis, A.; Veleva, L.; Alpuche-Avilés, M.A. Copper corrosion behavior in simulated concrete-pore solutions. Metals 2020, 10, 474. [Google Scholar] [CrossRef]
- Ming, J.; Wu, M.; Shi, J. Corrosion resistance of a Cr-bearing low-alloy reinforcing steel: Effect of surface condition, alkaline solution, and chloride content. J. Mater. Civ. Eng. 2020, 32, 04020034. [Google Scholar] [CrossRef]
- Outokumpu Stainless, A.B. Handbook of Stainless Steel; Avesta Resarch Centre: Avesta, Sweden, 2013; pp. 8–81. [Google Scholar]
- ASTM G31-12a. Standard Guide for Laboratory Immersion Corrosion Testing of Metals; ASTM International: West Conshohocken, PA, USA, 2012. [Google Scholar]
- ASTM, G-1-03. Standard Practice for Preparing, Cleaning, and Evaluating Corrosion Test Specimens; ASTM International: West Conshohocken, PA, USA, 2017. [Google Scholar]
- Yamashita, T.; Hayes, P. Analysis of XPS spectra of Fe2+ and Fe3+ ions in oxide materials. Appl. Surf. Sci. 2008, 254, 2441–2449. [Google Scholar] [CrossRef]
- Jia, T.; Ni, R.; Wang, H.; Shen, J.; Wang, Z. Investigation on the formation of Cr-rich precipitates at the interphase boundary in type 430 stainless steel based on austenite–ferrite transformation kinetics. Metals 2019, 9, 1045. [Google Scholar] [CrossRef]
- Heo, S.Y.; Shin, J.H.; Kim, D.-I.; Oh, J.Y.; Zhang, S.H.; Kim, K.H. Microstructure and mechanical properties of Cr–V–C–N films. Surf. Eng. 2015, 31, 513–518. [Google Scholar] [CrossRef]
- Apostolopoulos, C.; Drakakaki, A.; Apostolopoulos, A.; Koulouris, K. Comparison of the mechanical response of B400c and B450c dual phase steel bar categories, in long terms. Frat. Integrità Strutt. 2019, 50, 548–559. [Google Scholar] [CrossRef]
- Apostolopoulos, C.; Drakakaki, A.; Apostolopoulos, A.; Matikas, T.; Rudskoi, A.I.; Kodzhaspirov, G. Characteristic defects-corrosion damage and mechanical behavior of dual phase rebar. Mater. Phys. Mech. 2017, 30, 1–19. [Google Scholar]
- Moulder, J.F.; Stickle, W.F.; Sobol, P.E.; Bomben, K.D. Handbook of X-ray Photoelectron Spectroscopy: A Reference Book of Standard Spectra for Identification and Interpretation of XPS Data; Physical Electronics: Chanhassen, MN, USA, 1995. [Google Scholar]
- Luo, H.; Su, H.; Dong, C.; Xiao, K.; Li, X. Electrochemical and passivation behavior investigation of ferritic stainless steel in alkaline environment. Constr. Build. Mater. 2015, 96, 502–507. [Google Scholar] [CrossRef]
- Song, Y.Y.; Bhadeshia, H.K.D.H.; Suh, D.-W. Stability of stainless-steel nanoparticle and water mixtures. Powder Technol. 2015, 272, 34–44. [Google Scholar] [CrossRef]
- Sekkal, W.; Zaoui, A. Nanoscale analysis of the morphology and surface stability of calcium carbonate polymorphs. Sci. Rep. 2013, 3, 1587. [Google Scholar] [CrossRef] [PubMed]
- Umoru, L.E.; Afonja, A.A.; Ademodi, B. Corrosion study of AISI 304, AISI 321 and AISI 430 stainless steels in a tar sand digester. J. Miner. Mater. Charact. Eng. 2008, 7, 291–299. [Google Scholar] [CrossRef]
- Avci, R.; Davis, B.H.; Wolfenden, M.L.; Beech, I.B.; Lucas, K.; Paul, D. Mechanism of MnS-mediated pit initiation and propagation in carbon steel in an anaerobic sulfidogenic media. Corros. Sci. 2013, 76, 267–274. [Google Scholar] [CrossRef]
- Shoesmith, D.W.; Taylor, P.; Bailey, M.G.; Ikeda, B. Electrochemical behaviour of iron in alkaline sulphide solutions. Electrochim. Acta. 1978, 23, 903–916. [Google Scholar] [CrossRef]
- Sarango de Souza, J.; De Oliveira, L.A.; Sayeg, I.J.; Antunes, R.A. Electrochemical study of the AISI 409 ferritic stainless steel: Passive film stability and pitting nucleation and growth. Mater. Res. 2017, 20, 1669–1680. [Google Scholar] [CrossRef]
- Zhang, X.; Fan, L.; Xu, Y.; Li, J.; Xiao, X.; Jiang, L. Effect of aluminum on microstructure, mechanical properties and pitting corrosion resistance of ultra-pure 429 ferritic stainless steels. Mater. Des. 2015, 65, 682–689. [Google Scholar] [CrossRef]
- Freire, L.; Carmezim, M.J.; Ferreira, M.G.S.; Montemor, M.F. The electrochemical behaviour of stainless steel AISI 304 in alkaline solutions with different pH in the presence of chlorides. Electrochim. Acta. 2011, 56, 5280–5289. [Google Scholar] [CrossRef]
- Luo, H.; Su, H.; Dong, C.; Li, X. Passivation and electrochemical behavior of 316L stainless steel in chlorinated simulated concrete pore solution. Appl. Surf. Sci. 2017, 400, 38–48. [Google Scholar] [CrossRef]
- Shi, J.; Ming, J.; Sun, W. Electrochemical performance of reinforcing steel in alkali-activated slag extract in the presence of chlorides. Corros. Sci. 2018, 133, 288–299. [Google Scholar] [CrossRef]
- Shi, J.; Sun, W.; Jiang, J.; Zhang, Y. Influence of chloride concentration and pre-passivation on the pitting corrosion resistance of low-alloy reinforcing steel in simulated concrete pore solution. Constr. Build. Mater. 2016, 111, 805–813. [Google Scholar] [CrossRef]
- Pujar, M.G.; Parvathavarthini, N.; Dayal, R.K. Some aspects of corrosion and film formation of austenitic stainless steel type 316LN using electrochemical impedance spectroscopy (EIS). J. Mater. Sci. 2007, 42, 4535–4544. [Google Scholar] [CrossRef]
- Orazem, M.; Frateur, I.; Tribollet, B.; Vivier, V.; Marcelin, S.; Pebere, N.; Bunge, A.L.; White, E.A.; Riemer, D.P.; Musiani, M. Dielectric properties of materials showing constant-phase-element (CPE) impedance response. J. Electrochem. Soc. 2013, 160, C215–C225. [Google Scholar] [CrossRef]
- Carmezim, M.J.; Simões, A.M.; Montemor, M.F.; Da Cunha Belo, M. Capacitance behaviour of passive films on ferritic and austenitic stainless steel. Corros. Sci. 2005, 47, 581–591. [Google Scholar] [CrossRef]
- BenSalah, M.; Sabot, R.; Triki, E.; Dhouibi, L.; Refait, P.; Jeannin, M. Passivity of Sanicro28 (UNS N-08028) stainless steel in polluted phosphoric acid at different temperatures studied by electrochemical impedance spectroscopy and Mott–Schottky analysis. Corros. Sci. 2014, 86, 61–70. [Google Scholar] [CrossRef]
- Niu, W.; Lillard, R.S.; Li, Z.; Ernst, F. Properties of the passive film formed on interstitially hardened AISI 316L stainless steel. Electrochim. Acta 2015, 176, 410–419. [Google Scholar] [CrossRef]
- Heuer, A.H.; Kahn, H.; Ernst, F.; Michal, G.M.; Hovis, D.B.; Rayne, R.J.; Martin, F.J.; Natishan, P.M. Enhanced corrosion resistance of interstitially hardened stainless steel: Implications of a critical passive layer thickness for breakdown. Acta Mater. 2012, 60, 716–725. [Google Scholar] [CrossRef]
- Olsson, C.O.A.; Landolt, D. Passive films on stainless steels—Chemistry, structure and growth. Electrochim. Acta 2003, 48, 1093–1104. [Google Scholar] [CrossRef]


| Element (wt.%) | C | Cr | N | Cu | P | S | Fe | PRE 1 |
|---|---|---|---|---|---|---|---|---|
| SS 430 | 0.05 | 16.2 | - | - | - | - | Balance | 16 |
| B450C | 0.22 | - | 0.12 | 0.8 | 0.5 | 0.5 | Balance | - |
| Portland Cement | Cement Extract 3 | ||||
|---|---|---|---|---|---|
| Compound | Weight % 2 | Weight % 3 | Ion | mmol L−1 | |
| CaO | 66.84 (as Ca2+) | 58.42 | Ca2+ | 6.4 | |
| SiO2 | 21.35 | 22.30 | K+ | 35.1 | |
| Al2O3 | 4.87 (as Al3+) | 4.62 | SO42− | - | |
| Fe2O3 | 2.89 (as Fe3+) | 2.44 | Na+ | 18.3 | |
| SO3 | 2.42 | 2.20 | OH− | 56.4 | |
| MgO | 1.16 (as Mg2+) | 1.92 | - | - | |
| K2O | 0.39 | 0.35 | - | - | |
| Na2O | 0.08 | 0.28 | - | - | |
| Element | C | Cr | Mn | Si | O | V | Cu | N | S | Fe | |
|---|---|---|---|---|---|---|---|---|---|---|---|
| SS 430 | General | 1.83 | 16.32 | 0.65 | 0.6 | 0.34 | 0.28 | - | - | - | 79.97 |
| A | 3.04 | 24.03 | - | 0.25 | 0.62 | 0.7 | - | 3.27 | - | 68.09 | |
| B | 17.19 | 9.21 | - | 28.86 | 1.35 | - | - | - | - | 43.39 | |
| B450C | General | 2.36 | - | 0.81 | - | 0.47 | - | - | - | - | 96.36 |
| C | 5.02 | - | 1.31 | 0.41 | 1.44 | - | 0.83 | - | 0.38 | 90.36 | |
| D | 8.49 | - | 0.73 | 6.46 | 0.46 | - | - | - | - | 83.85 |
| Element | C | Cr | Mn | Si | O | Ca | Cu | Fe | ||
|---|---|---|---|---|---|---|---|---|---|---|
| SS 430 | 168 h | A | 2.87 | 16.84 | - | - | 1.69 | 0.8 | - | 77.8 |
| B | 13.75 | - | - | - | 53.8 | 30.22 | - | 2.49 | ||
| 720 h | A | 1.81 | 16.43 | - | 0.44 | 1.06 | - | - | 80.01 | |
| B | 13.75 | 4.62 | - | 0.37 | 32.87 | 21.3 | - | 20.92 | ||
| B450C | 168 h | B | 9.1 | - | 0.73 | - | 47.88 | 27.76 | - | 15.27 |
| C | 6.43 | - | 0.67 | - | 7.57 | 0.85 | - | 84.48 | ||
| D | 4.54 | - | 1.43 | 0.27 | 47.51 | 3.73 | - | 42.51 | ||
| 720 h | C | 4.06 | - | 0.73 | 0.26 | 8.65 | - | 0.97 | 85.33 | |
| D | 3.29 | - | 0.36 | - | 44.1 | - | - | 52.26 | ||
| E | 3.09 | 0.24 | 0.27 | 0.41 | 41.98 | - | 0.84 | 53.15 |
| Element | C | Cr | Mn | O | V | Cu | N | S | Fe | |
|---|---|---|---|---|---|---|---|---|---|---|
| SS 430 | F | 8.22 | 43.1 | - | - | 1.65 | - | 13.54 | - | 33.5 |
| B450C | G | 3.98 | - | 30.54 | 1 | - | 4.64 | - | 10.42 | 49.44 |
| Time | Rsol | Rcp | CPE1 | n1 | Rct | CPE2 | n2 | Rp | c2 | |
|---|---|---|---|---|---|---|---|---|---|---|
| h | kΩ cm2 | kΩ cm2 | µS sn cm−2 | kΩ cm2 | µS sn cm−2 | kΩ cm2 | 10−4 | |||
| SS 430 | 0.5 | 0.99 | 0.04 | 74.24 | 0.88 | 312.88 | 27.99 | 0.89 | 312.91 | 6.11 |
| 24 | 1.15 | 1.99 | 285.75 | 1.00 | 10,766 | 16.54 | 0.90 | 10,768 | 3.23 | |
| 168 | 9.39 | 2.50 | 111.65 | 1.00 | 172,630 | 13.23 | 0.88 | 172,630 | 10.1 | |
| 360 | 7.65 | 2238.8 | 0.20 | 1.00 | 375,630 | 14.41 | 0.90 | 377,860 | 4.42 | |
| 504 | 4.45 | 0.94 | 314.38 | 1.00 | 1,570,000 | 14.58 | 0.90 | 1,570,000 | 6.63 | |
| 720 | 5.54 | 4,741,300 | 0.04 | 1.00 | 8,997.5 | 14.59 | 0.90 | 4,750,200 | 7.90 | |
| B450C | 0.5 | 0.95 | - | - | - | 213.50 | 32.05 | 0.91 | 213.50 | 8.24 |
| 24 | 1.05 | - | - | - | 4766.3 | 20.39 | 0.93 | 4766.3 | 3.00 | |
| 168 | 7.91 | - | - | - | 6331.3 | 19.65 | 0.93 | 6331.3 | 2.55 | |
| 360 | 6.08 | - | - | - | 6.53 | 156.63 | 0.95 | 6.53 | 12.6 | |
| 504 | 4.96 | - | - | - | 8.15 | 107.95 | 0.96 | 8.15 | 22.0 | |
| 720 | 2.12 | - | - | - | 55.90 | 128.00 | 0.86 | 55.90 | 8.62 |
Publisher’s Note: MDPI stays neutral with regard to jurisdictional claims in published maps and institutional affiliations. |
© 2021 by the authors. Licensee MDPI, Basel, Switzerland. This article is an open access article distributed under the terms and conditions of the Creative Commons Attribution (CC BY) license (https://creativecommons.org/licenses/by/4.0/).
Share and Cite
Bacelis, Á.; Veleva, L.; Feliu, S., Jr.; Cabrini, M.; Lorenzi, S. Corrosion Activity of Carbon Steel B450C and Low Chromium Ferritic Stainless Steel 430 in Cement Extract Solution. Buildings 2021, 11, 220. https://doi.org/10.3390/buildings11060220
Bacelis Á, Veleva L, Feliu S Jr., Cabrini M, Lorenzi S. Corrosion Activity of Carbon Steel B450C and Low Chromium Ferritic Stainless Steel 430 in Cement Extract Solution. Buildings. 2021; 11(6):220. https://doi.org/10.3390/buildings11060220
Chicago/Turabian StyleBacelis, Ángel, Lucien Veleva, Sebastián Feliu, Jr., Marina Cabrini, and Sergio Lorenzi. 2021. "Corrosion Activity of Carbon Steel B450C and Low Chromium Ferritic Stainless Steel 430 in Cement Extract Solution" Buildings 11, no. 6: 220. https://doi.org/10.3390/buildings11060220
APA StyleBacelis, Á., Veleva, L., Feliu, S., Jr., Cabrini, M., & Lorenzi, S. (2021). Corrosion Activity of Carbon Steel B450C and Low Chromium Ferritic Stainless Steel 430 in Cement Extract Solution. Buildings, 11(6), 220. https://doi.org/10.3390/buildings11060220