
Calibrated Numerical Approach for the Dynamic Analysis of Glass Curtain Walls under Spheroconical Bag Impact


Abstract
1. Introduction
2. State-of-Art and Background
2.1. Standardized Experimental Approach
2.2. Numerical Analysis of Glass Curtain Walls under Soft Body Impact
2.2.1. Ideal Impact
2.2.2. Simplified Design Approach
3. Design Approach for Glass Facades under Soft Body Impact
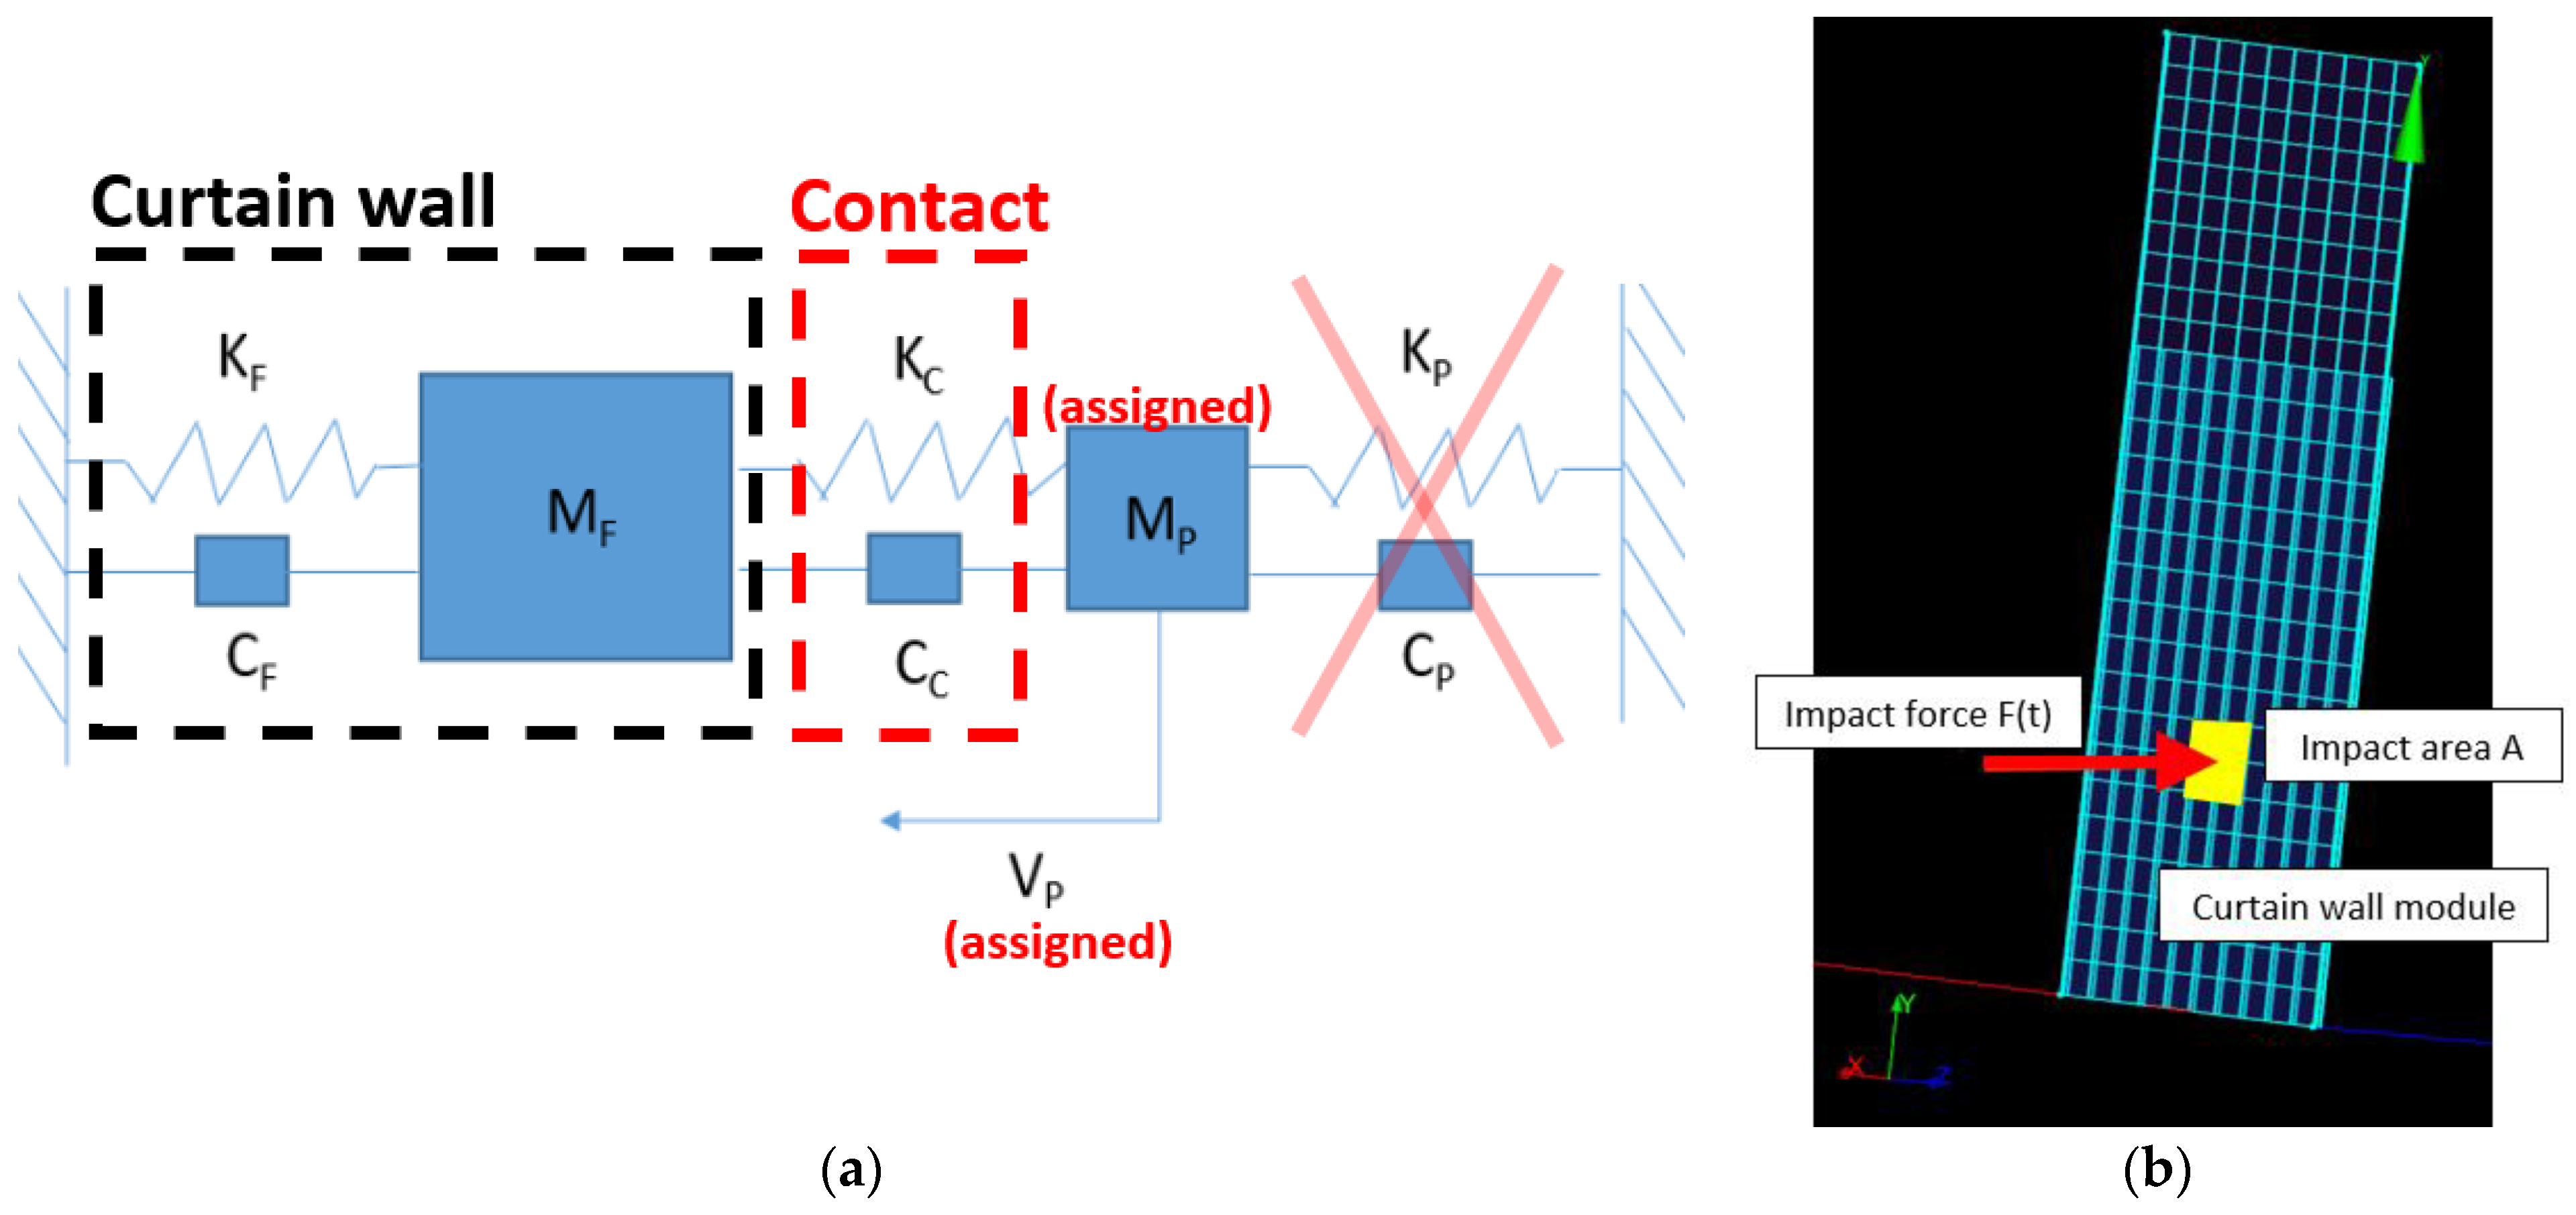
3.1. Concept, Assumptions and Goals
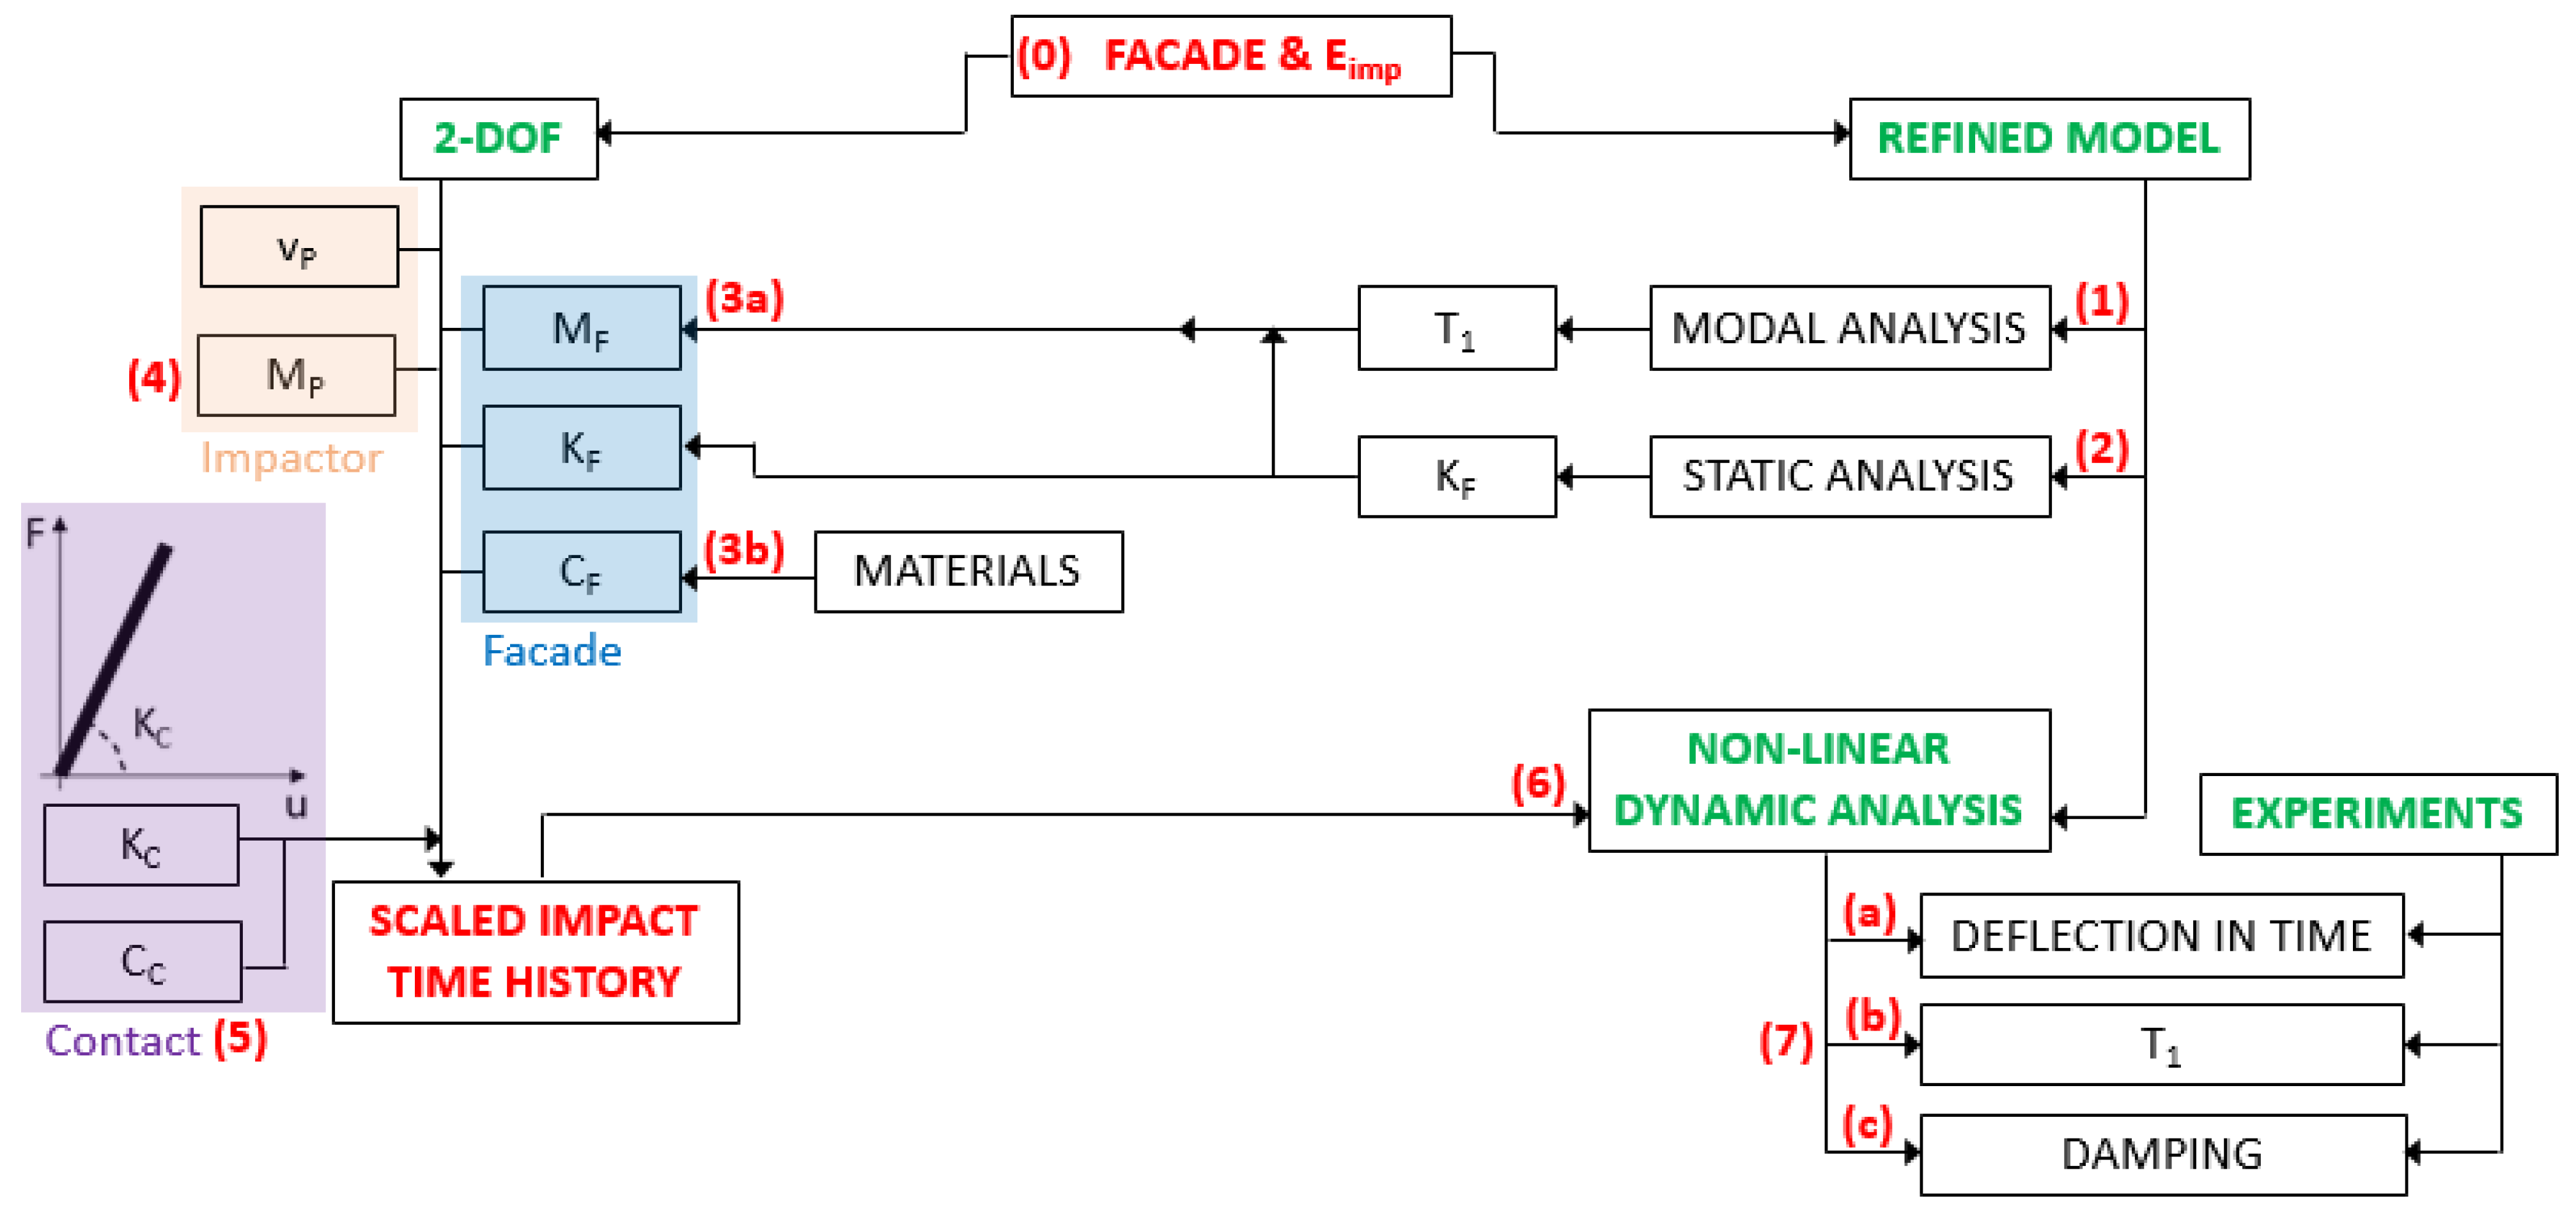
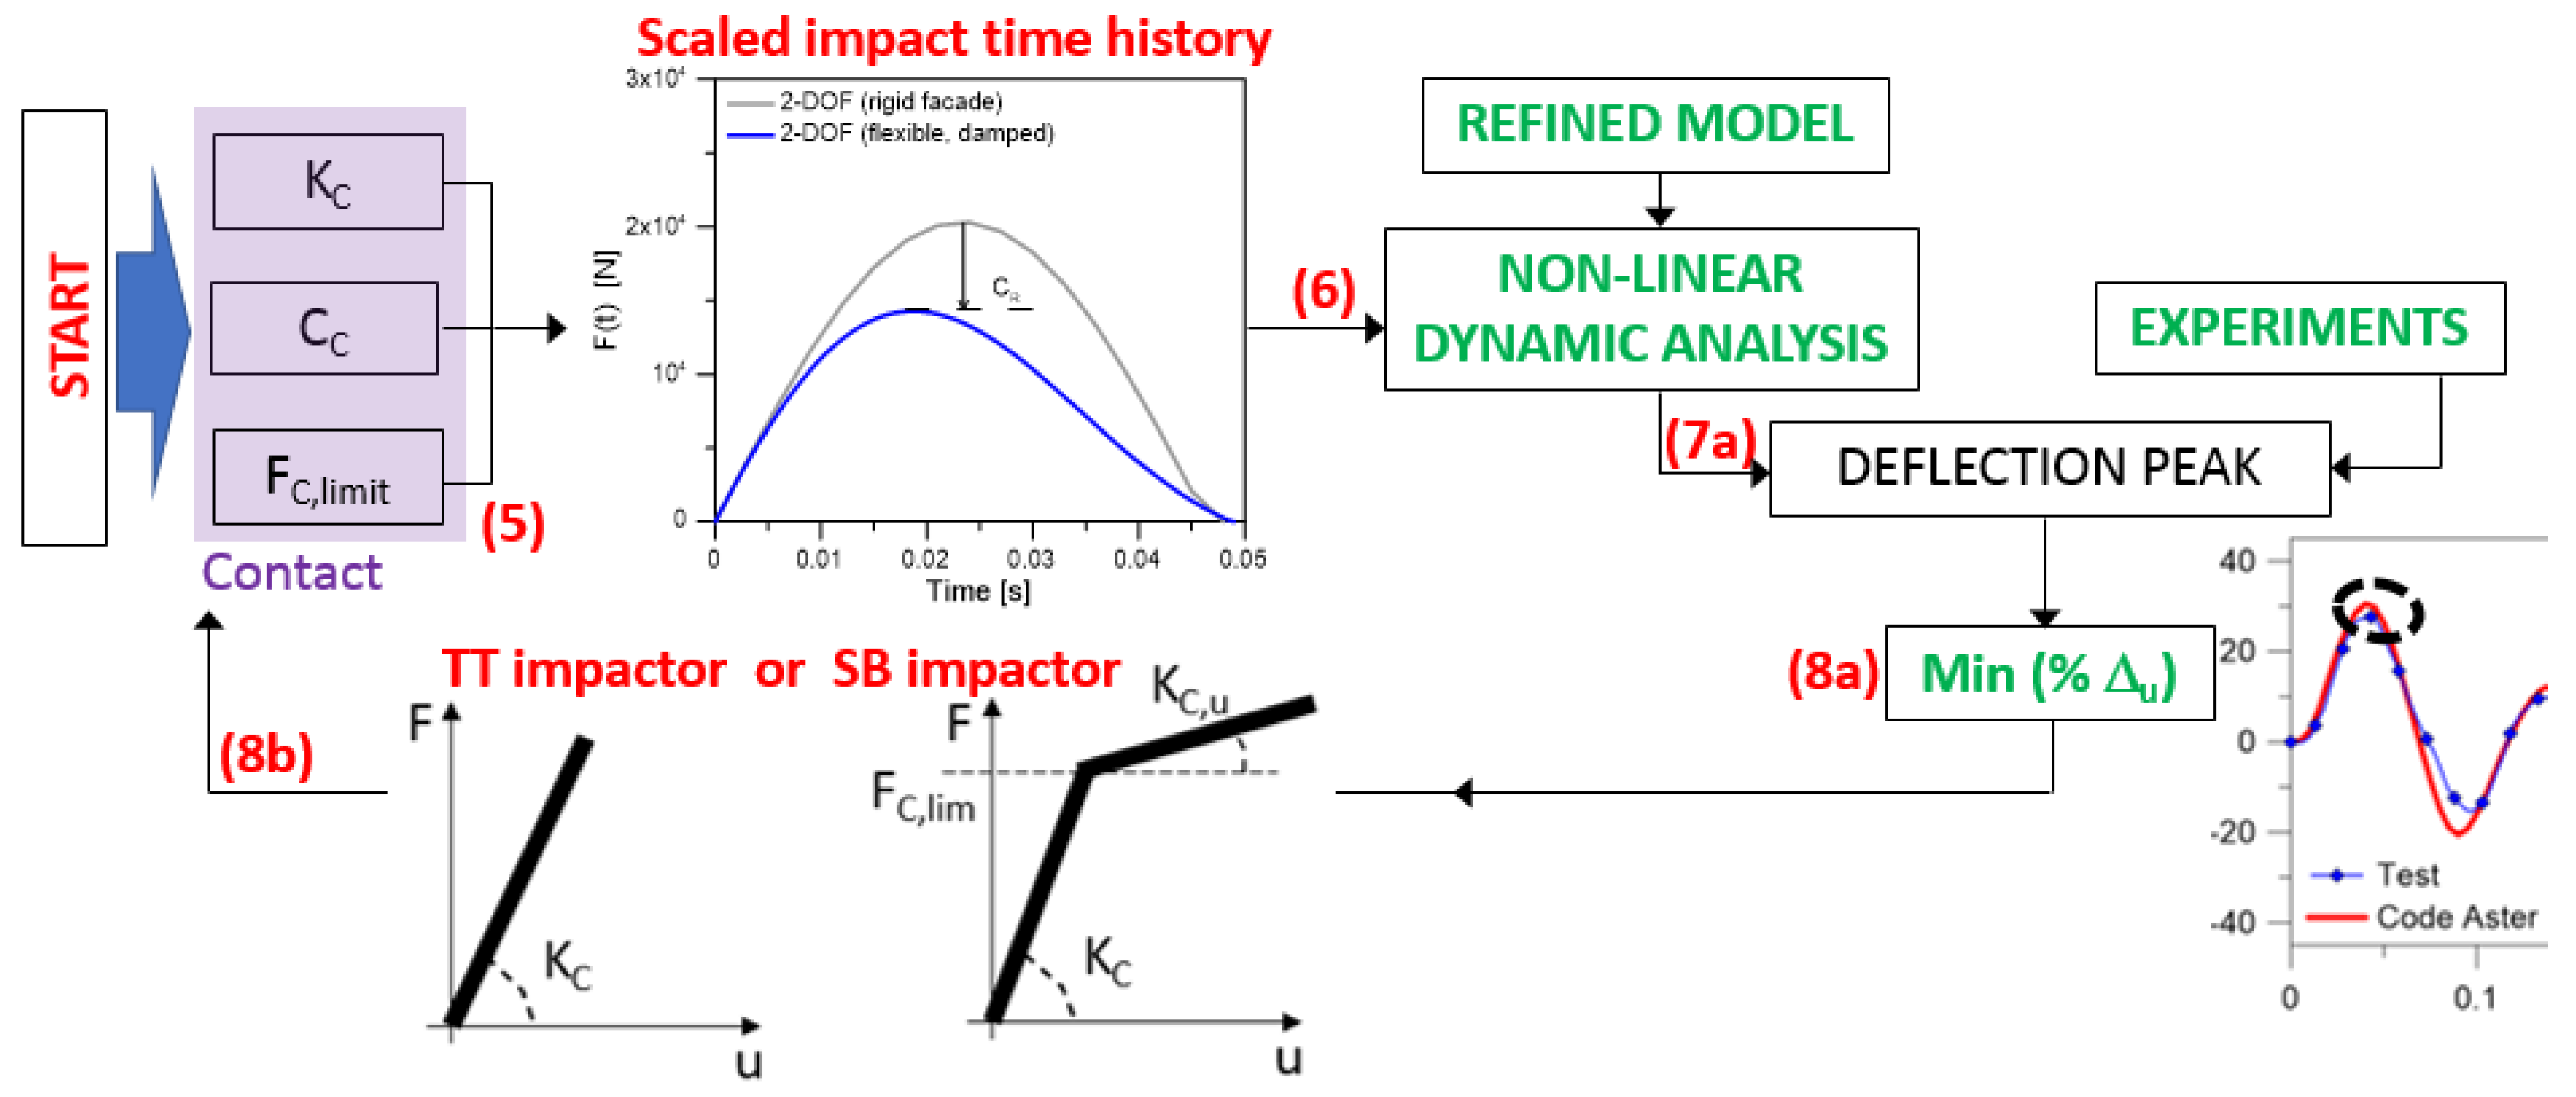
3.2. Proposed Procedural Steps
4. Experimental Analysis of Curtain Walls under Soft Body Impact
4.1. Materials and Methods
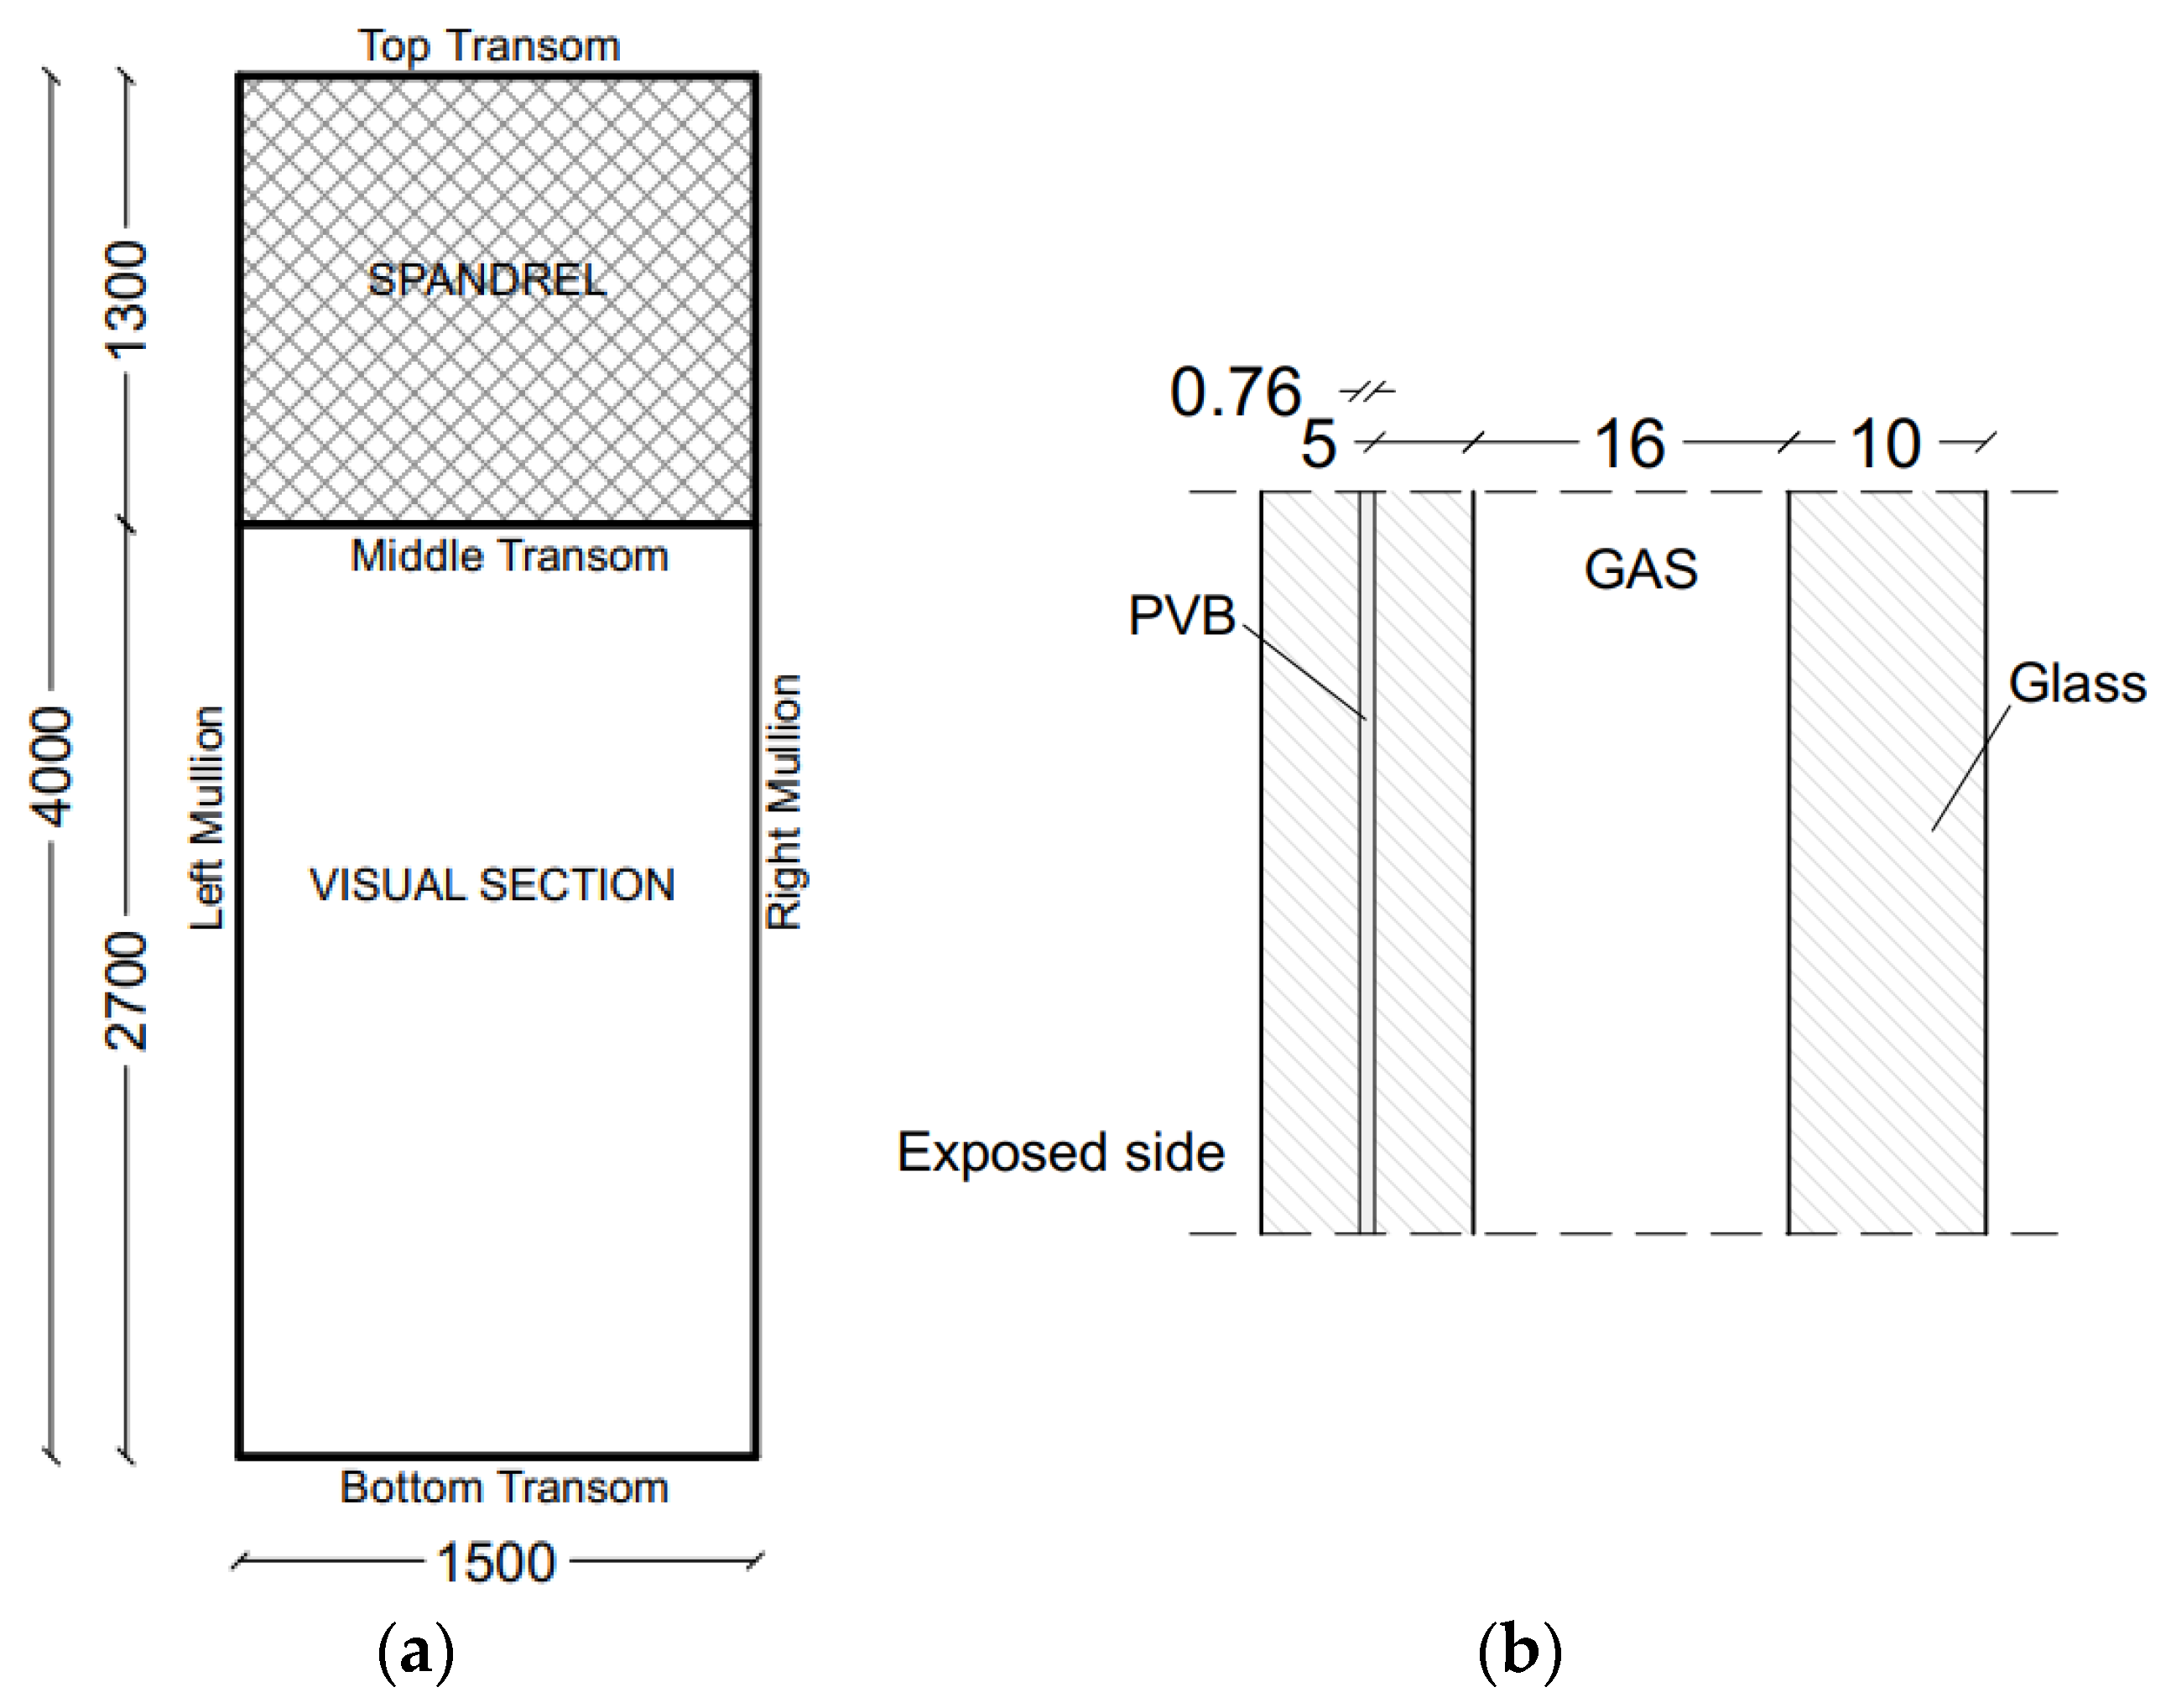
- a sandwich spandrel section, with a total size of 1500 × 1300 mm2, that was positioned on the top of the specimen (for insulation purposes only). The cross-section included an aluminum foil (3 mm in thickness) and a steel foil (2 mm the thickness, S355 the resistance class [39]), while a mineral wool panel was used to fill the gap.
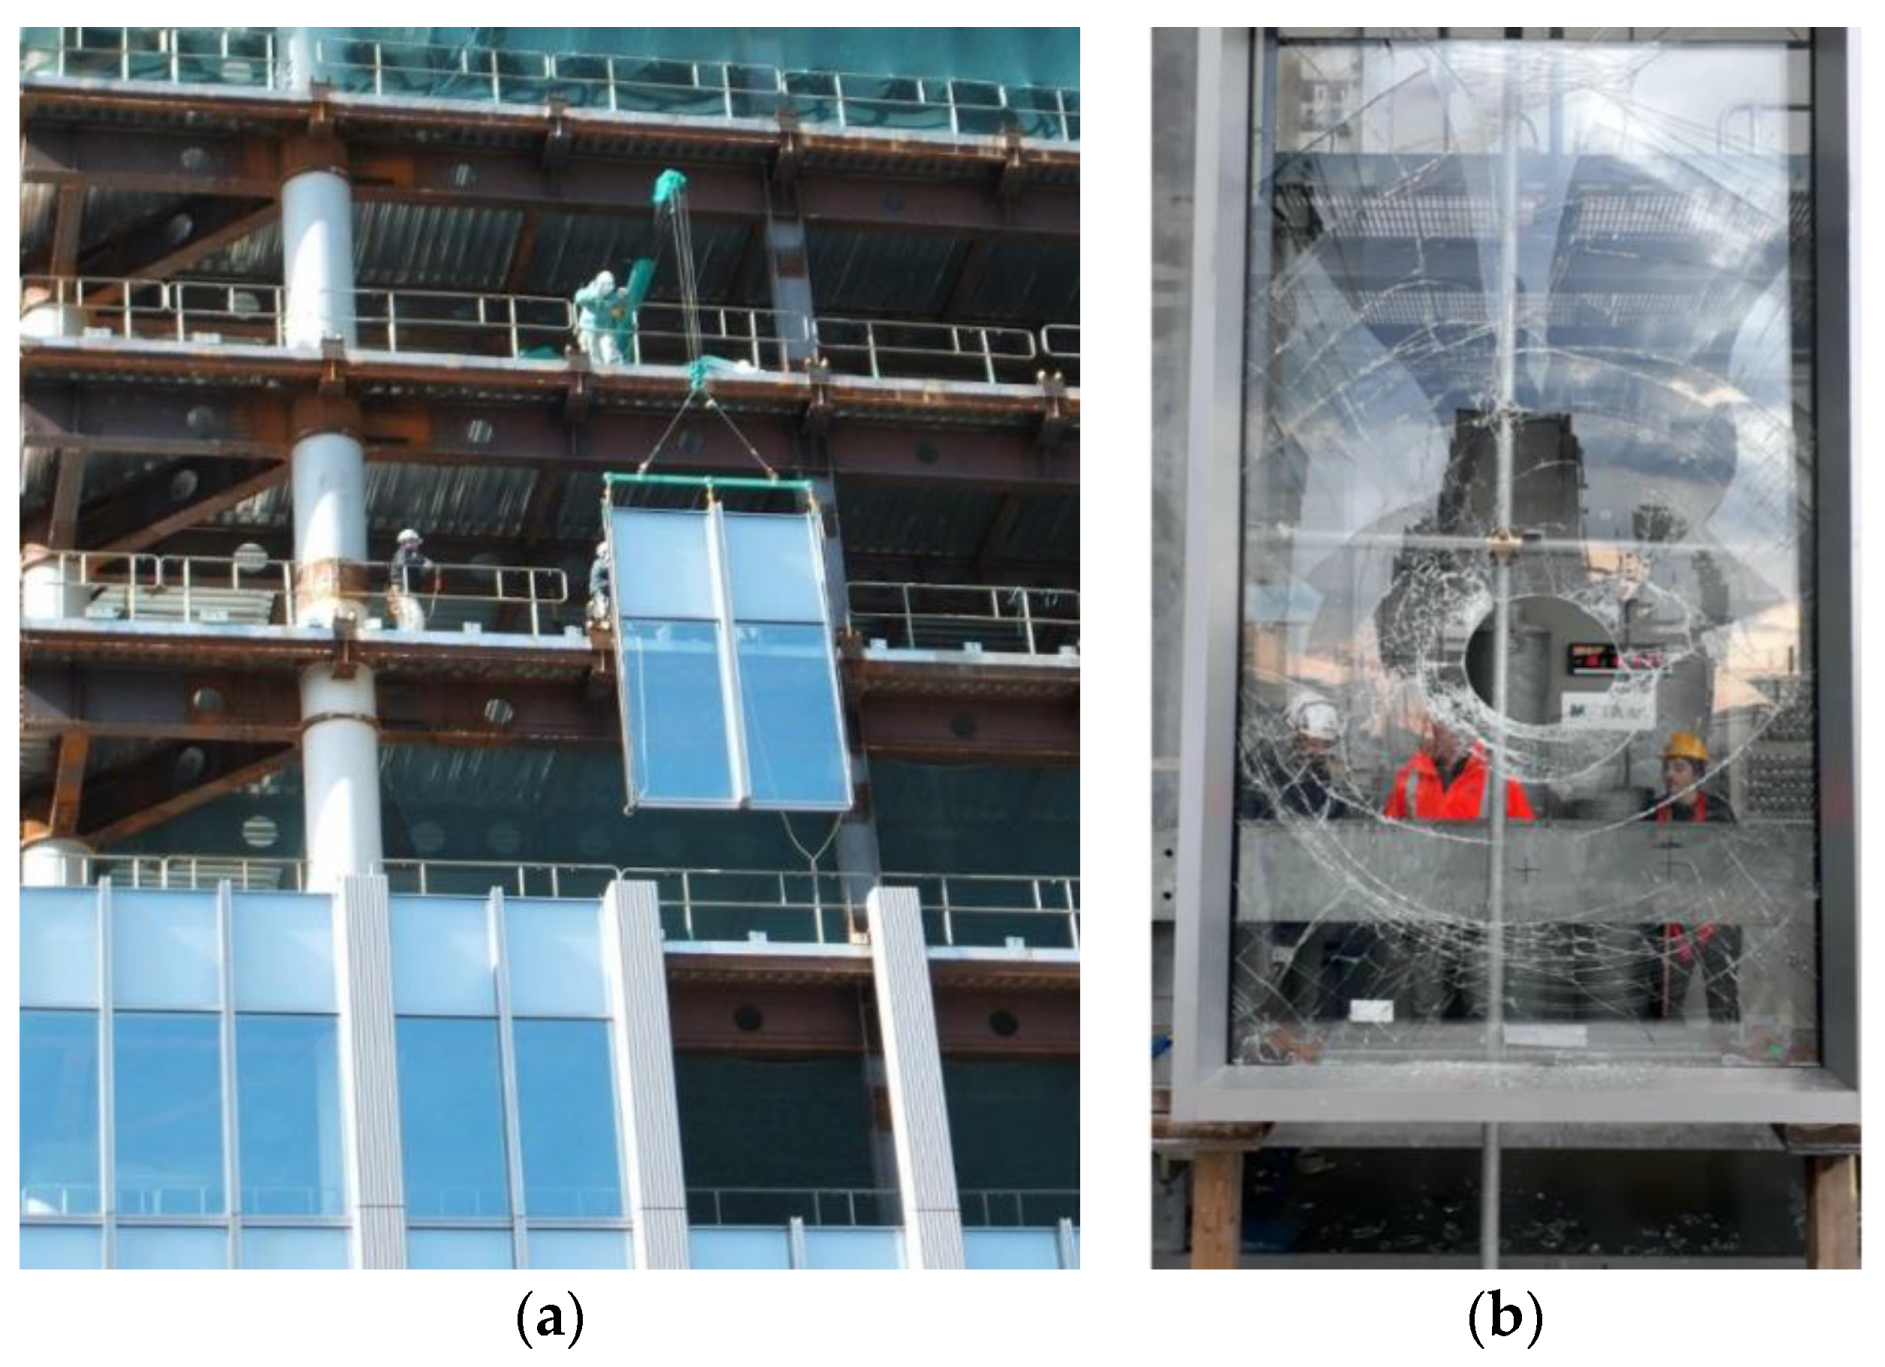
- a visual section (Figure 7b), with a total size of 1500 × 2700 mm2, composed of an insulated glass unit (16 mm the cavity thickness) with a 10 mm thick, monolithic layer (on the unexposed side) and a laminated safety panel (two 5 mm thick, annealed panels and a bonding 0.76 mm thick PVB film) on the exposed side. All the glass layers consisted of annealed glass [40].
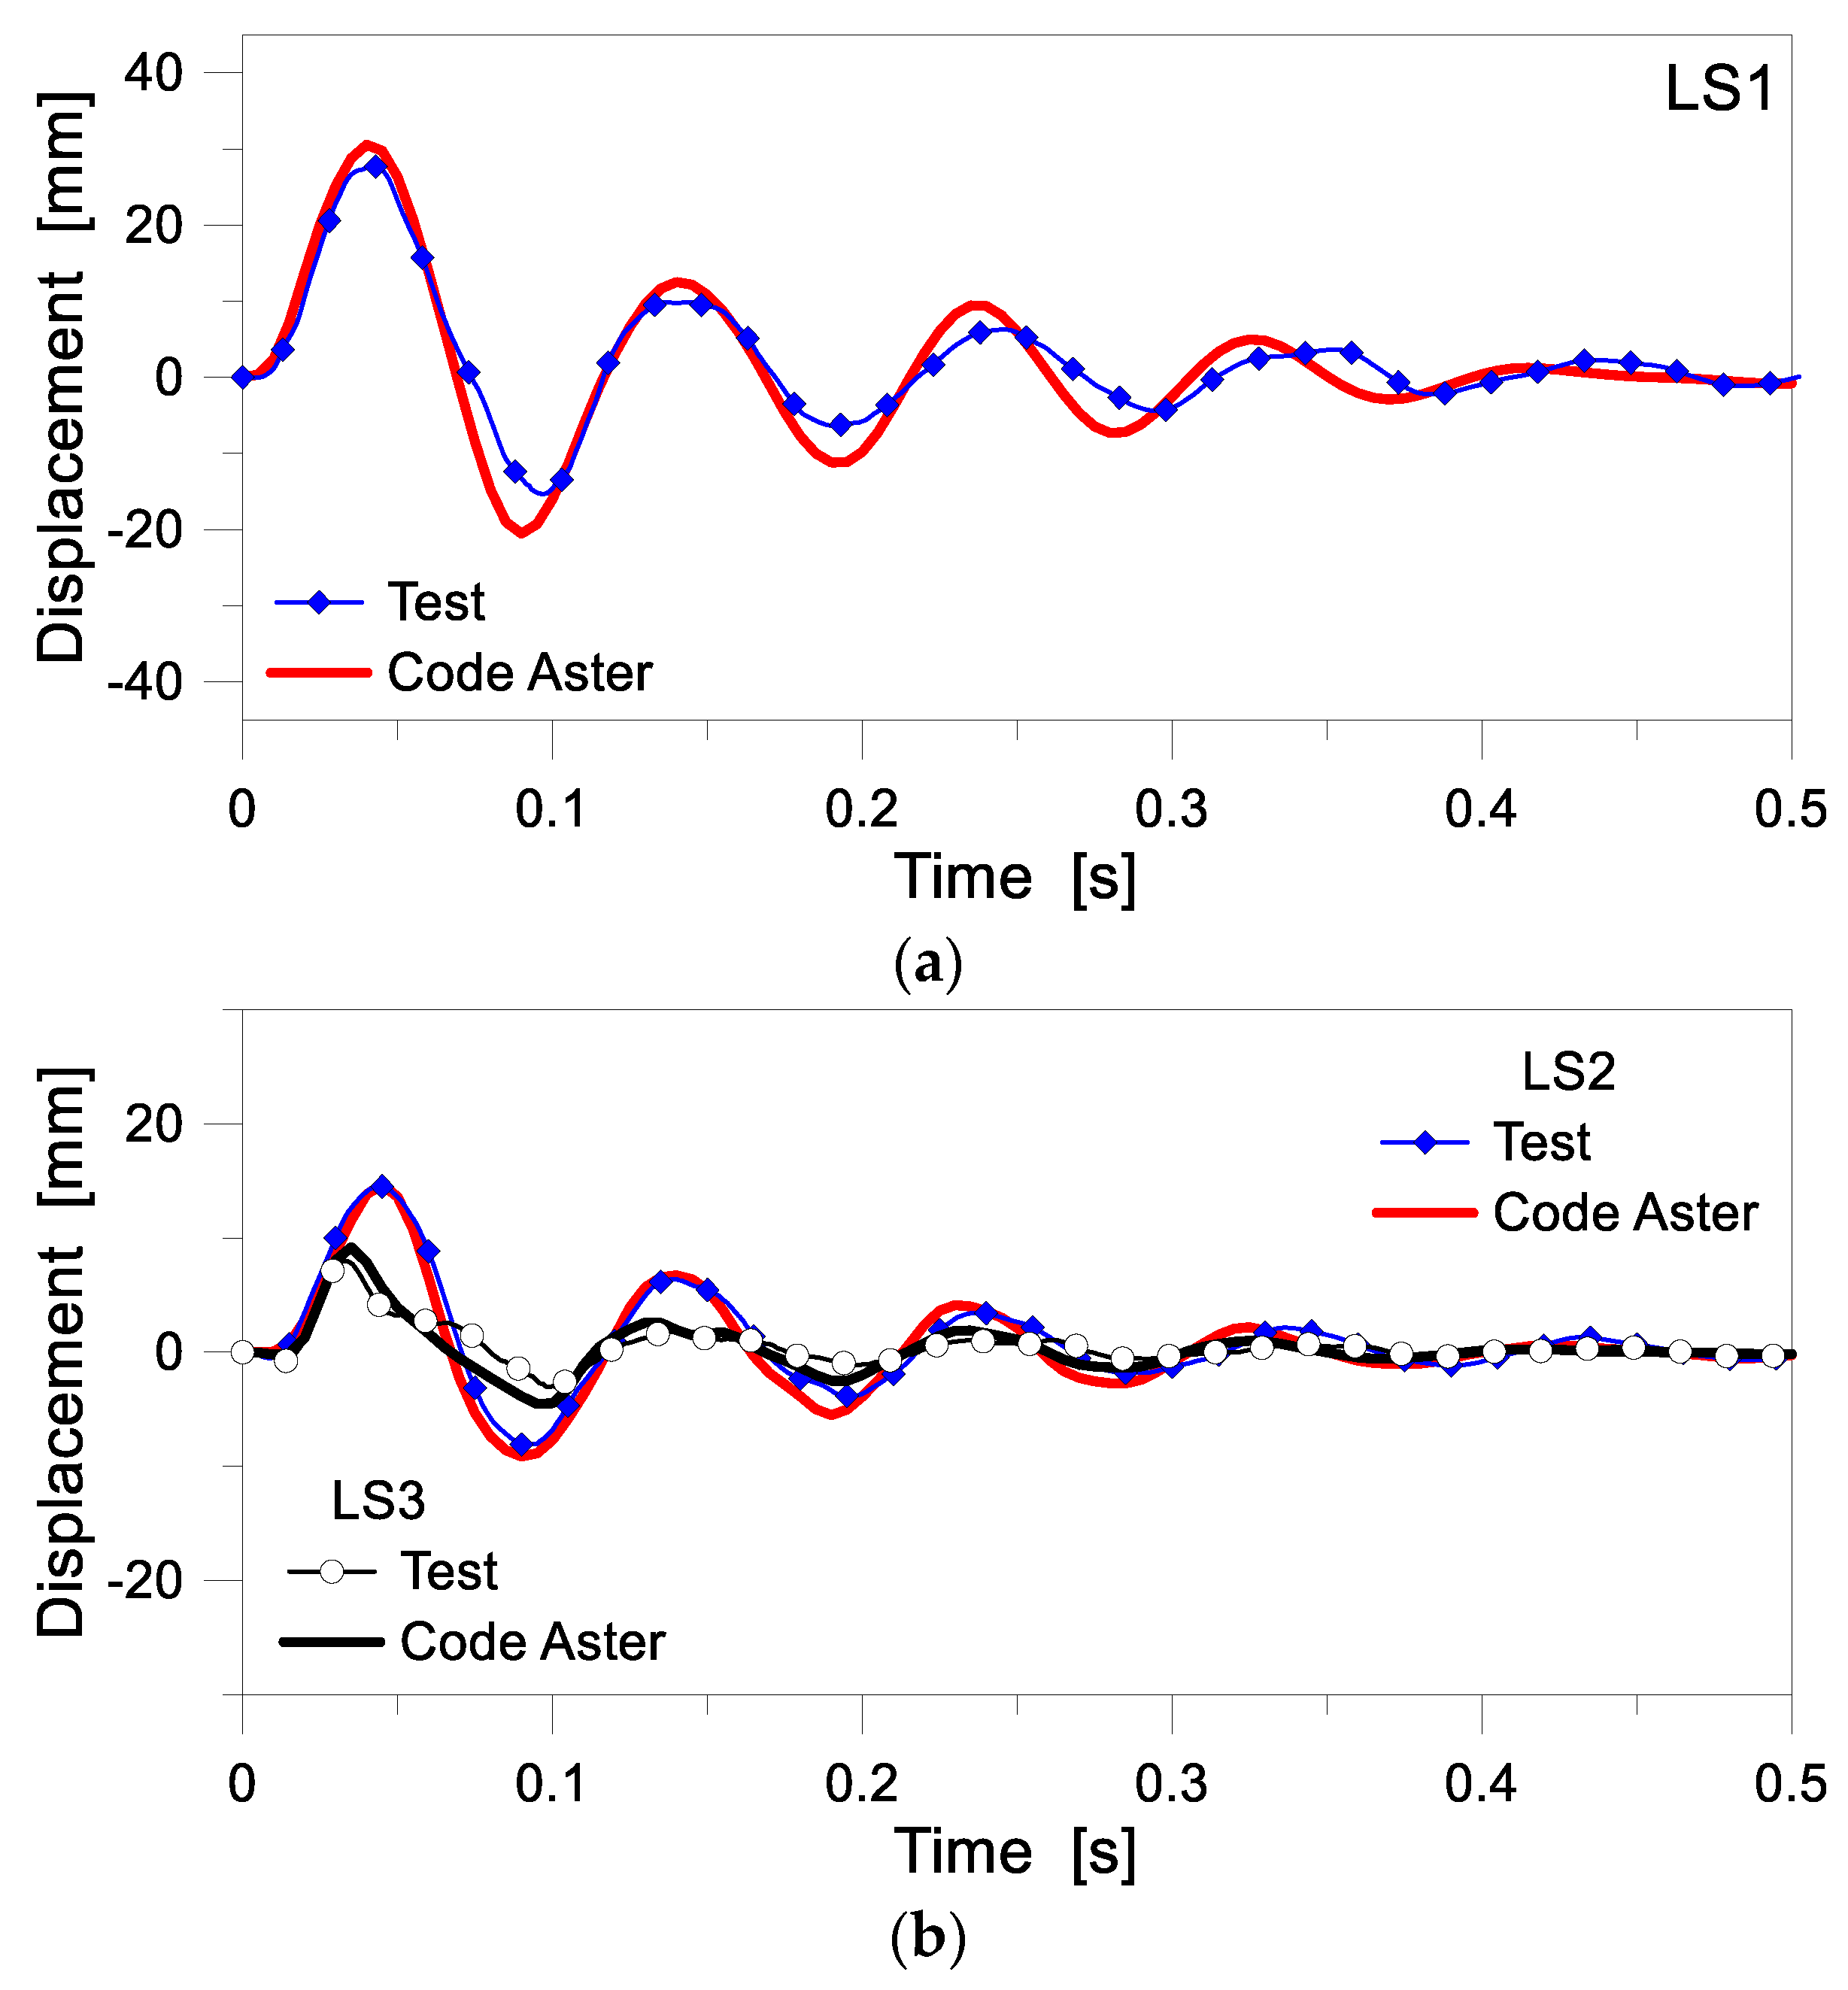
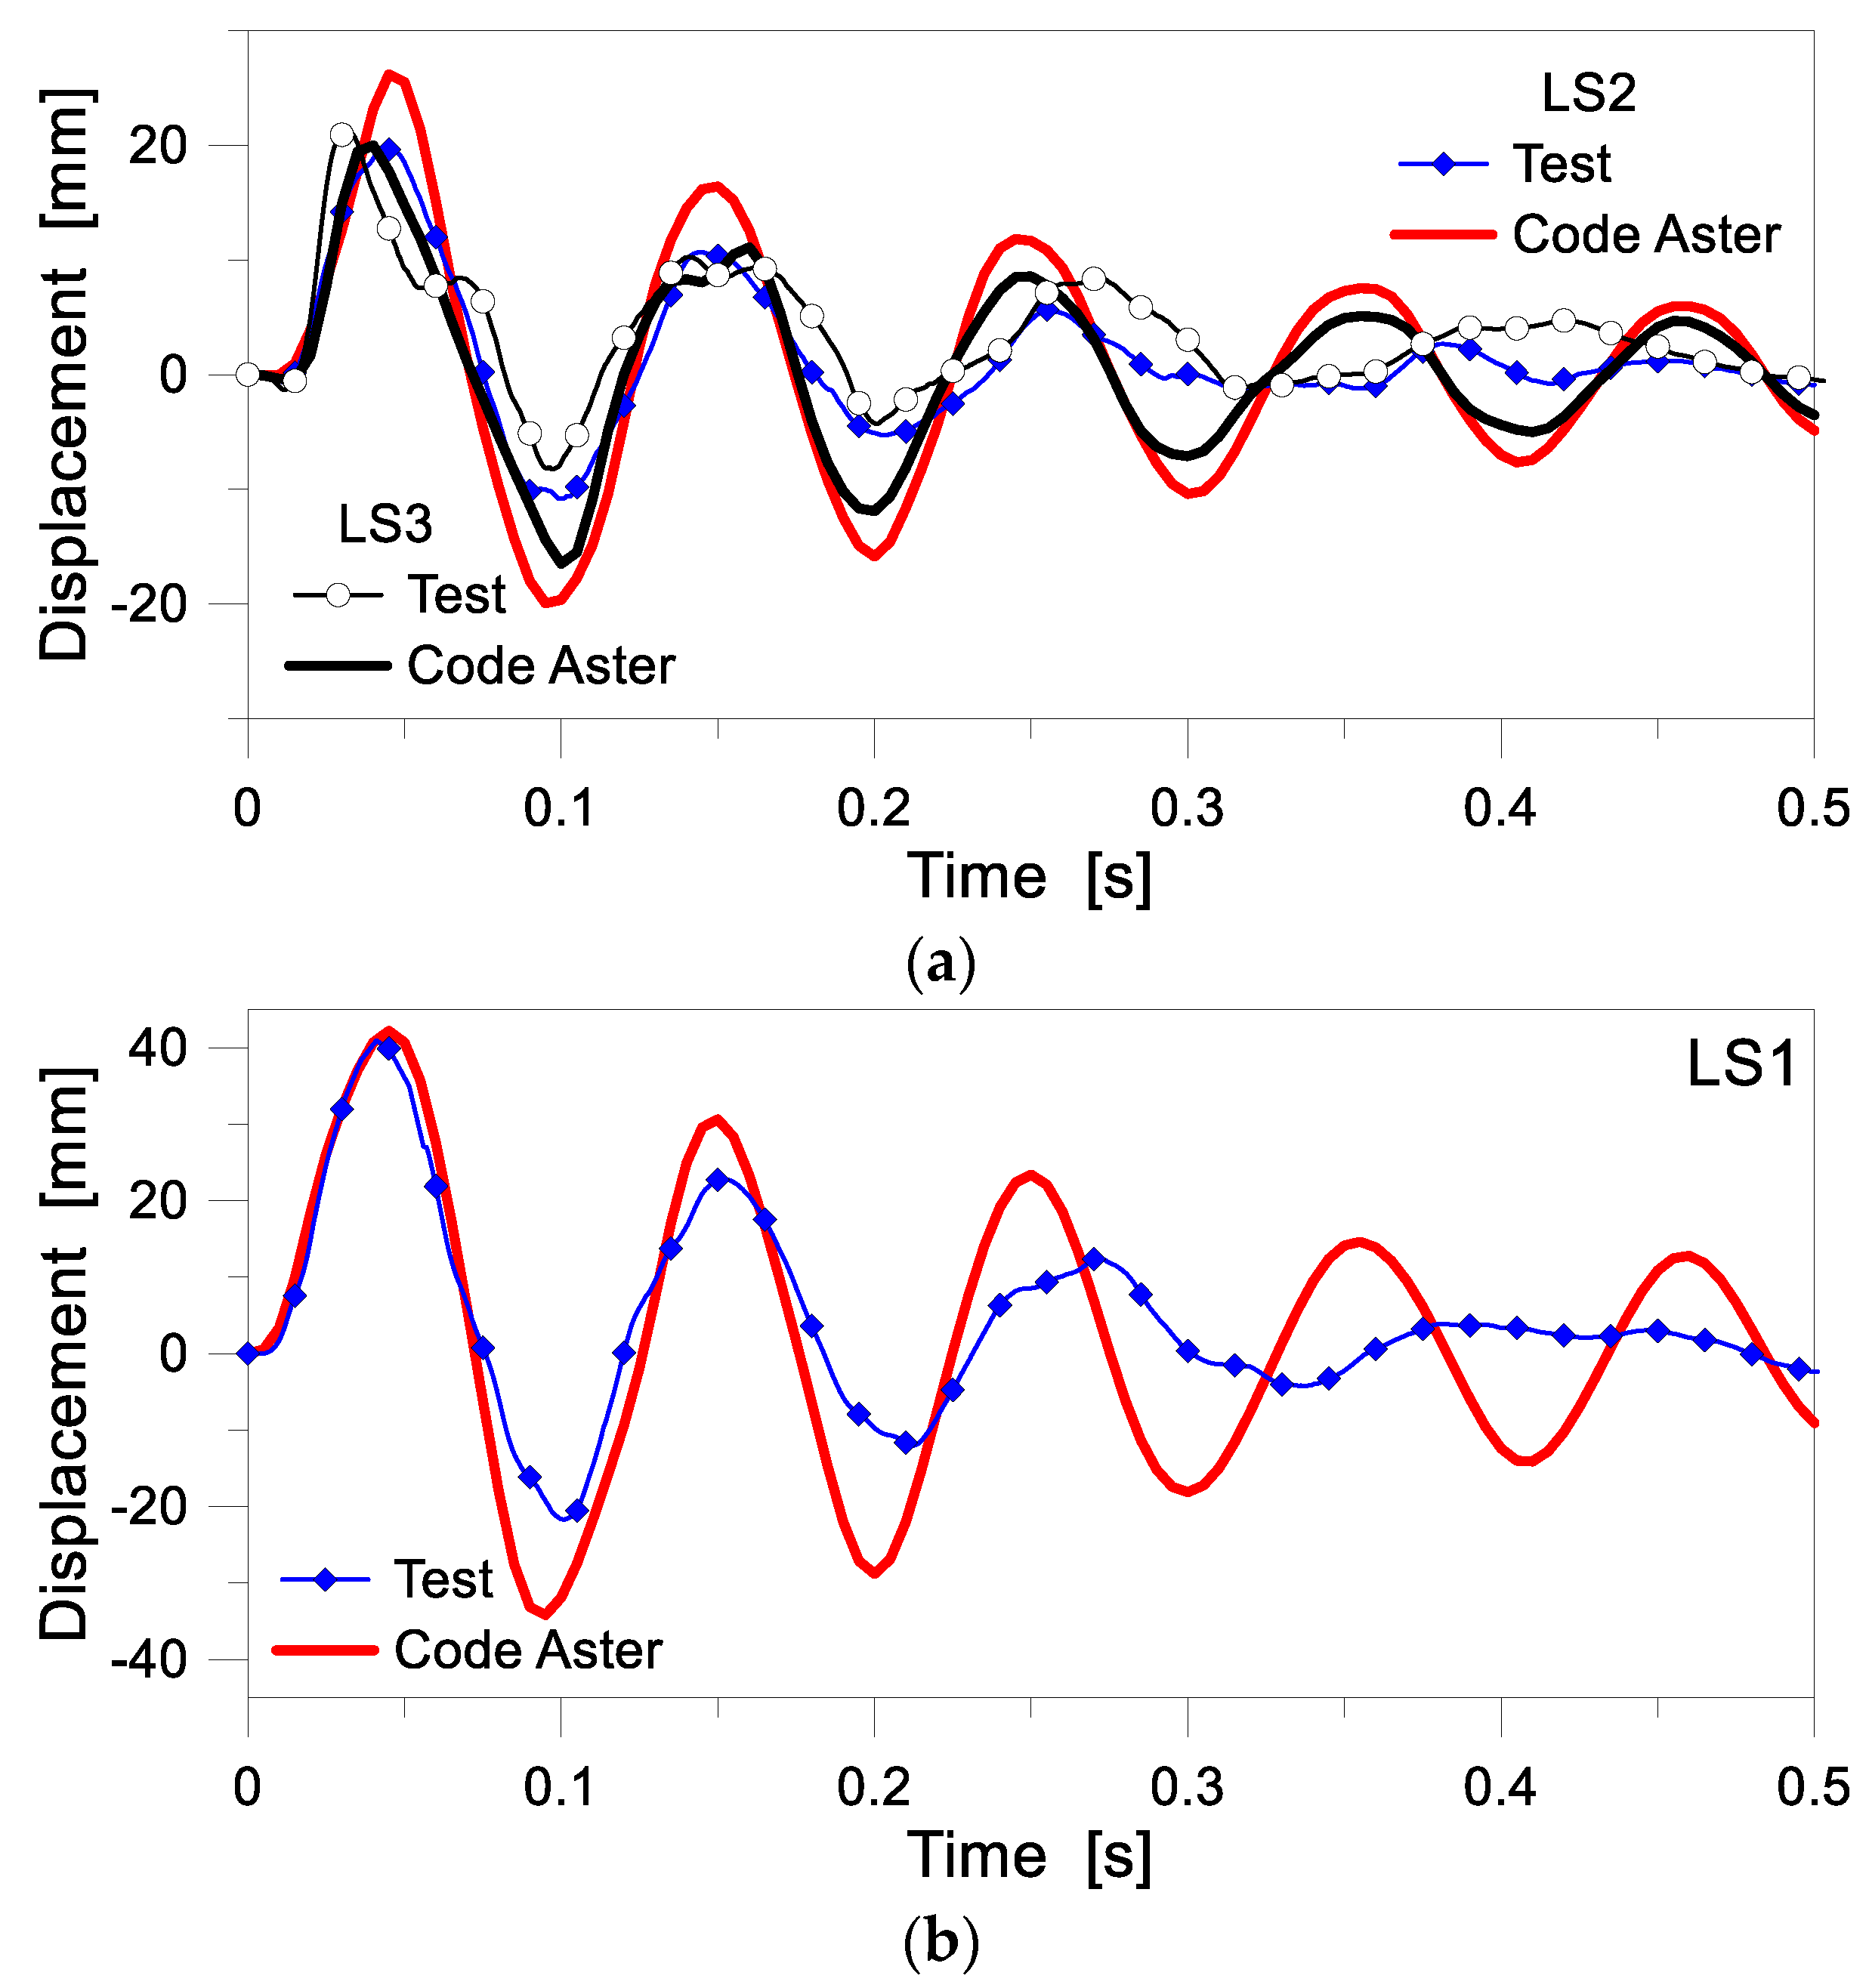
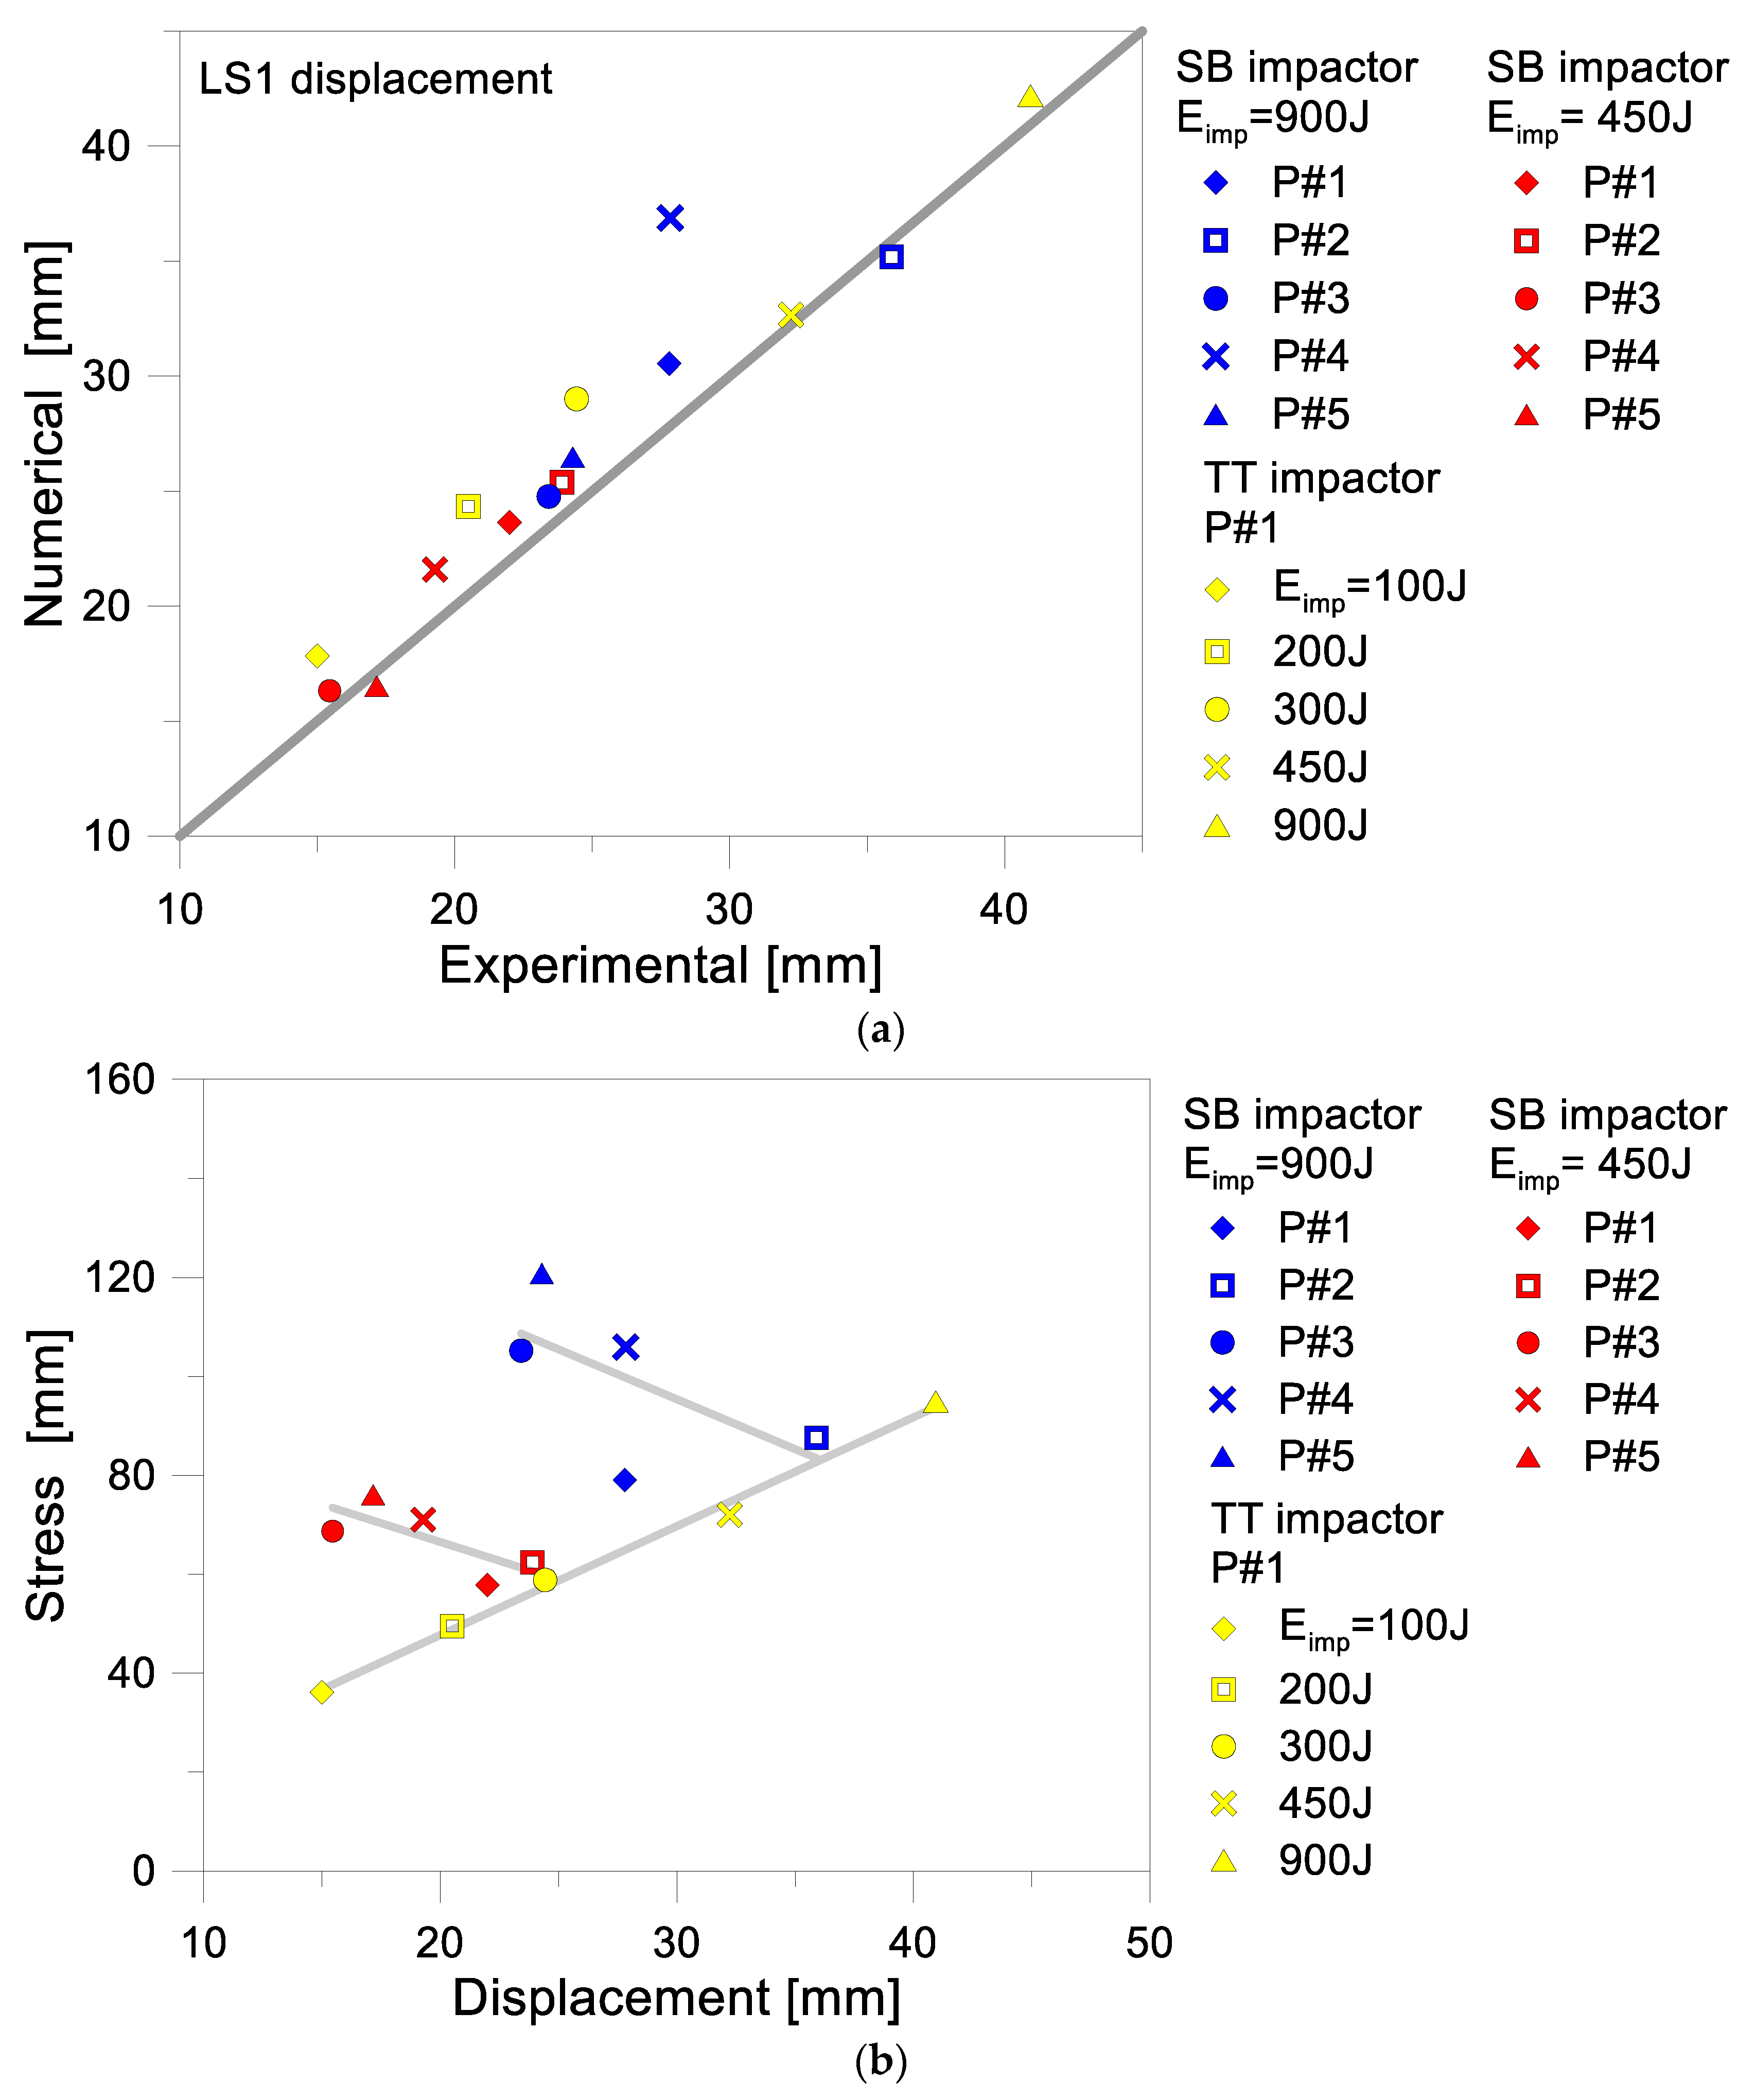
- LS1: center of the glass panel;
- LS2: mid-span section of the right-side mullion; and
- LS3: mid-span section of the bottom transom.
- type of impactor (TT or SB impactor);
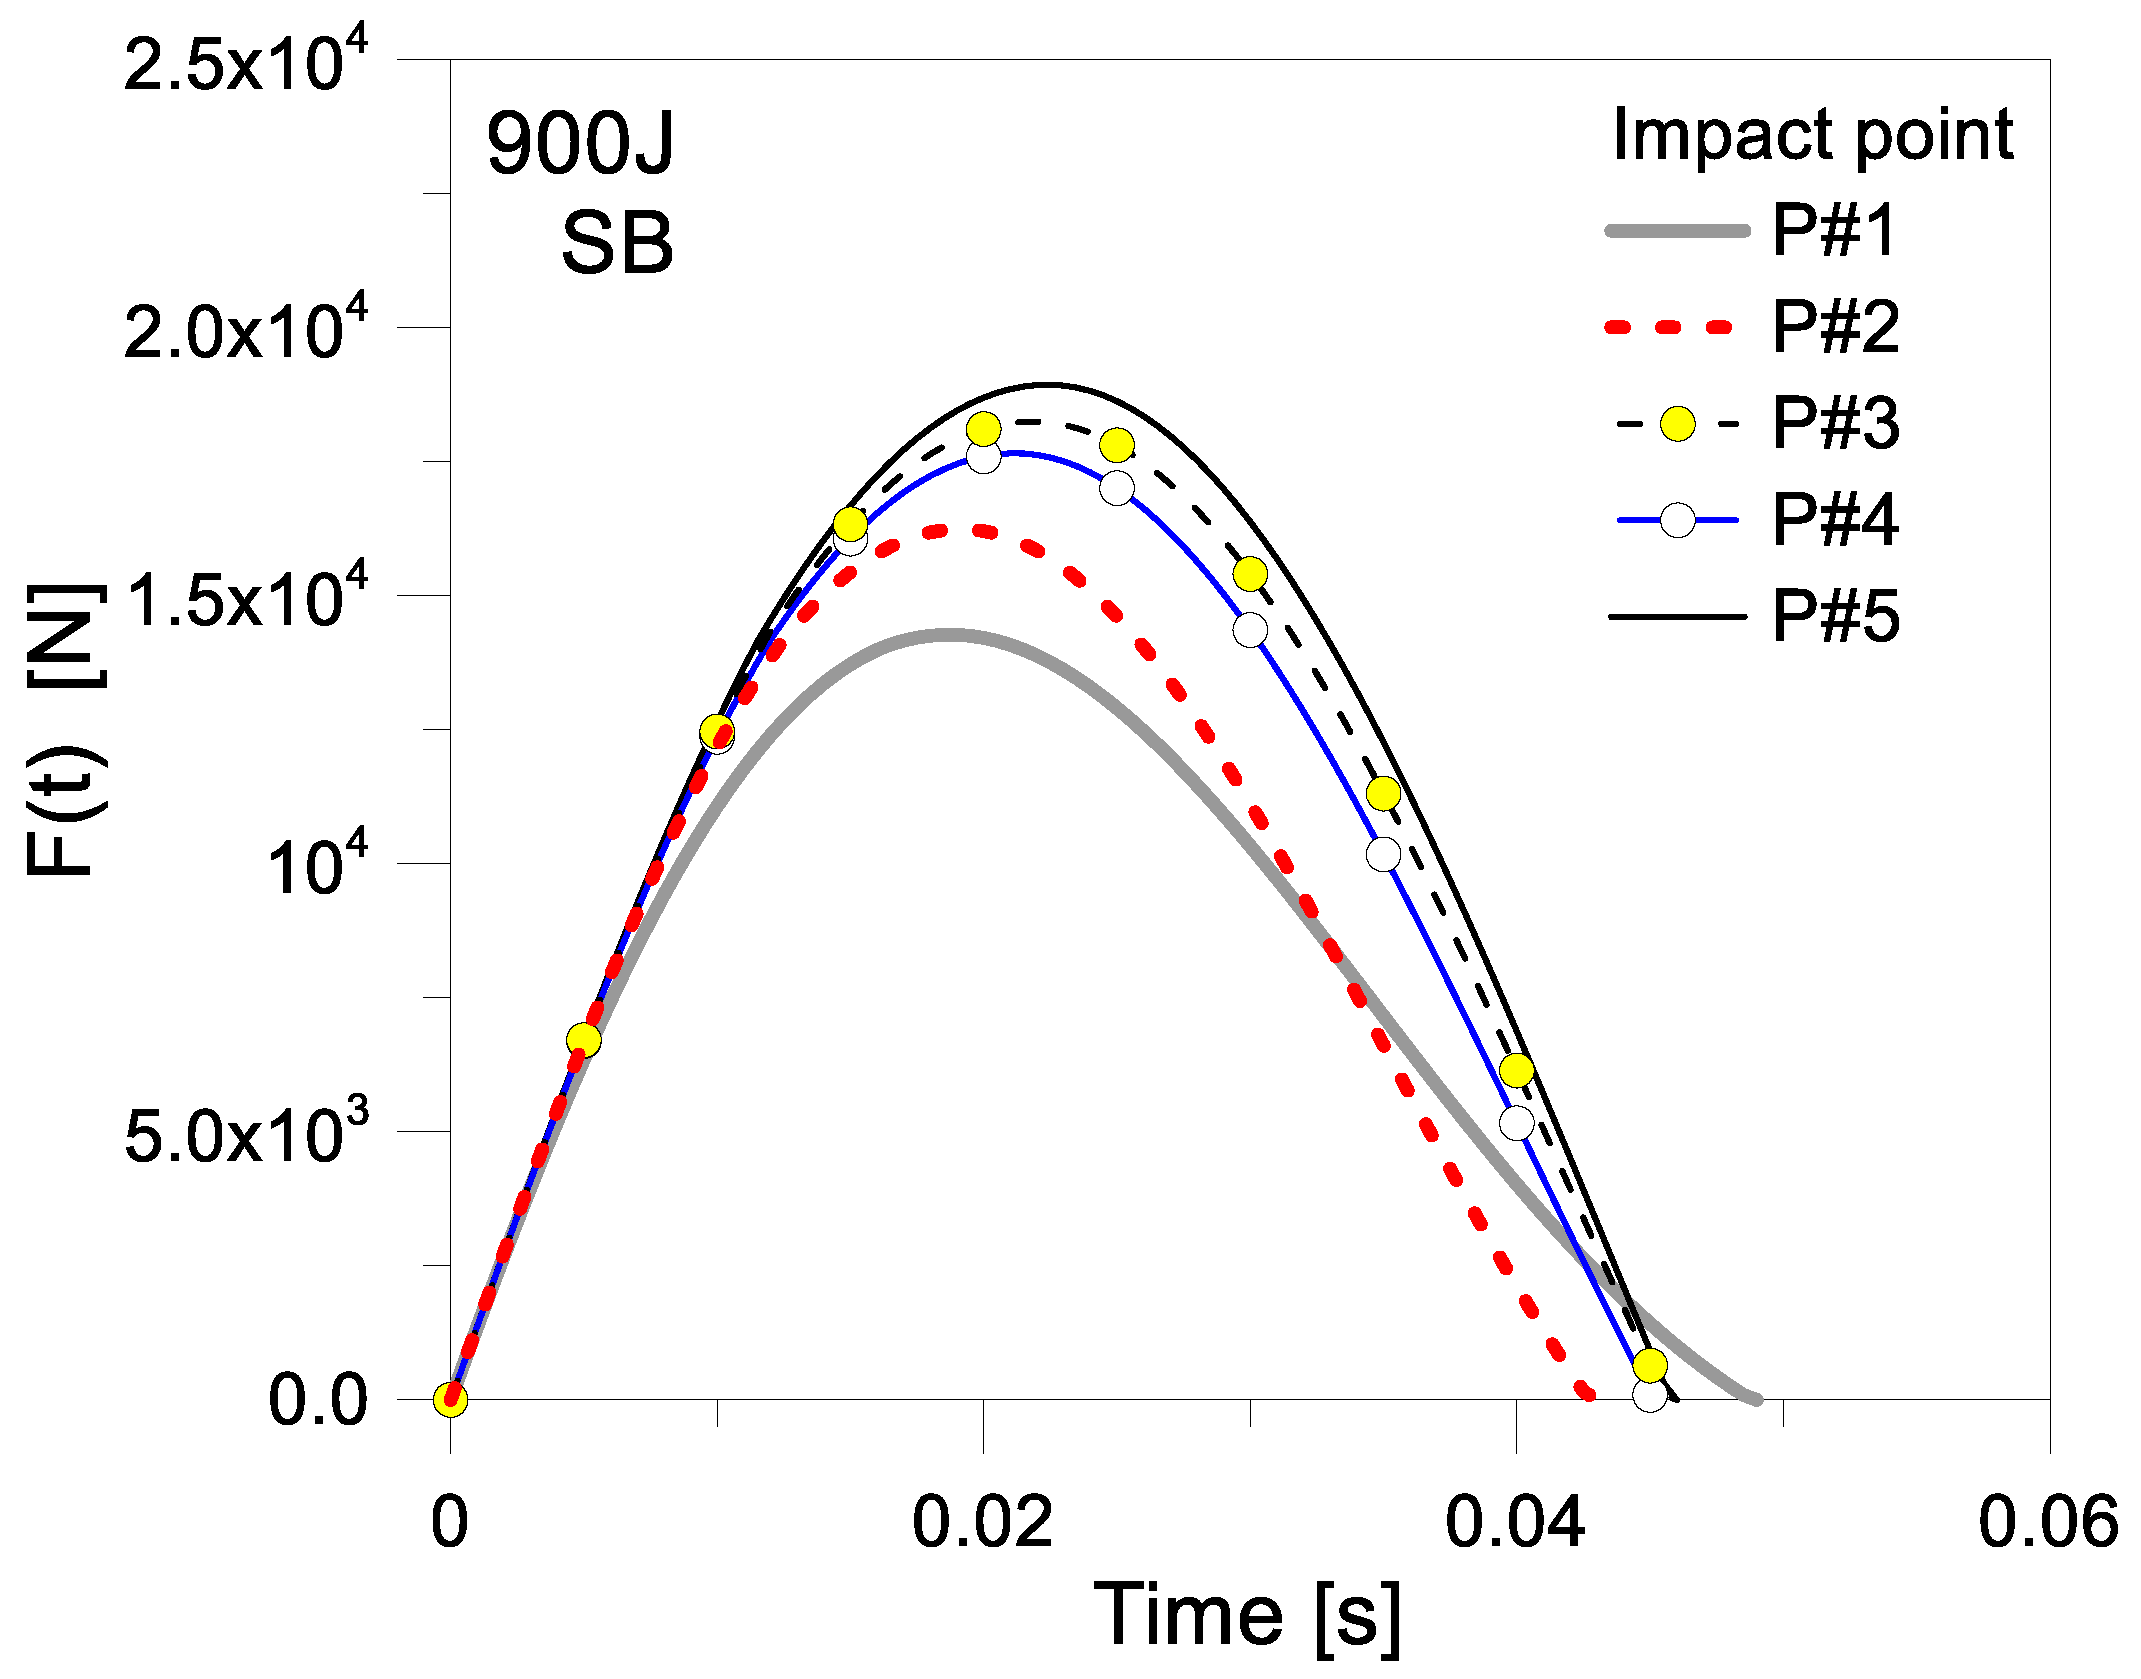
- impact point (P#n, with a fixed impact energy and impactor); and
- impact energy (Eimp, with a fixed impact point and impactor).
- P#1: impactor at the glass center, 1 m above the bottom transom;
- P#2: impactor at the glass center;
- P#3: impactor on the middle axis of glass, 0.5 m above the bottom transom;
- P#4: impactor at a distance of 0.35 m from the right mullion, 1 m above the bottom transom;
- P#5: impactor at a distance of 0.35 m from the right mullion, 0.5 m above the bottom transom.
4.2. Test Results
5. Finite Element Numerical Analysis
5.1. Solving Approach
5.2. Reference FE Model for SBI Simulations
5.2.1. Geometry
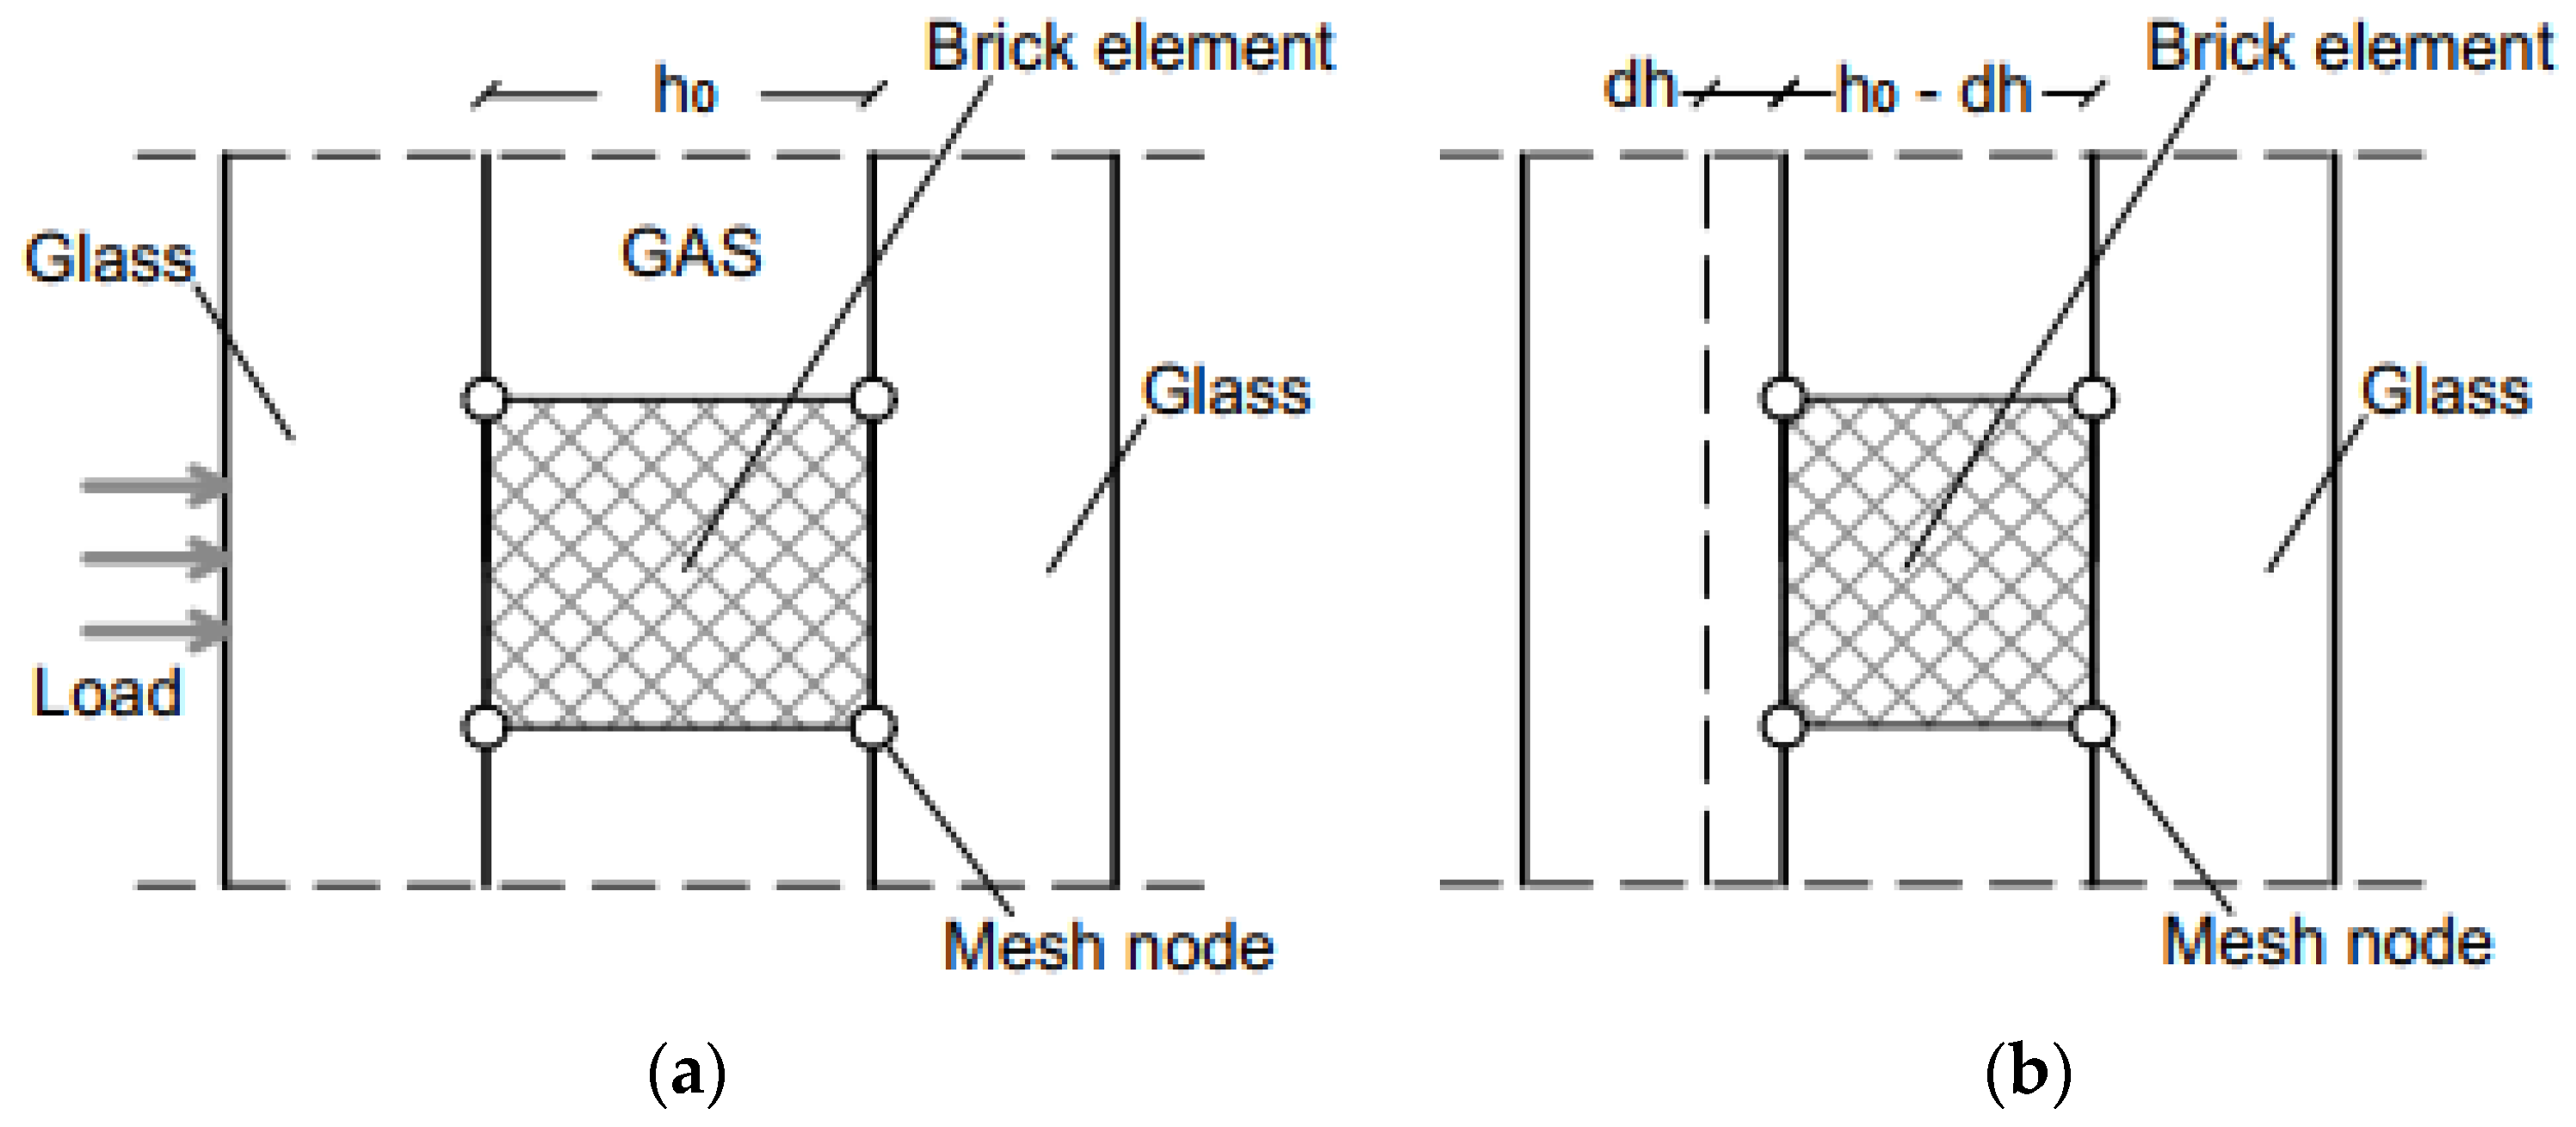
5.2.2. Gas Cavity
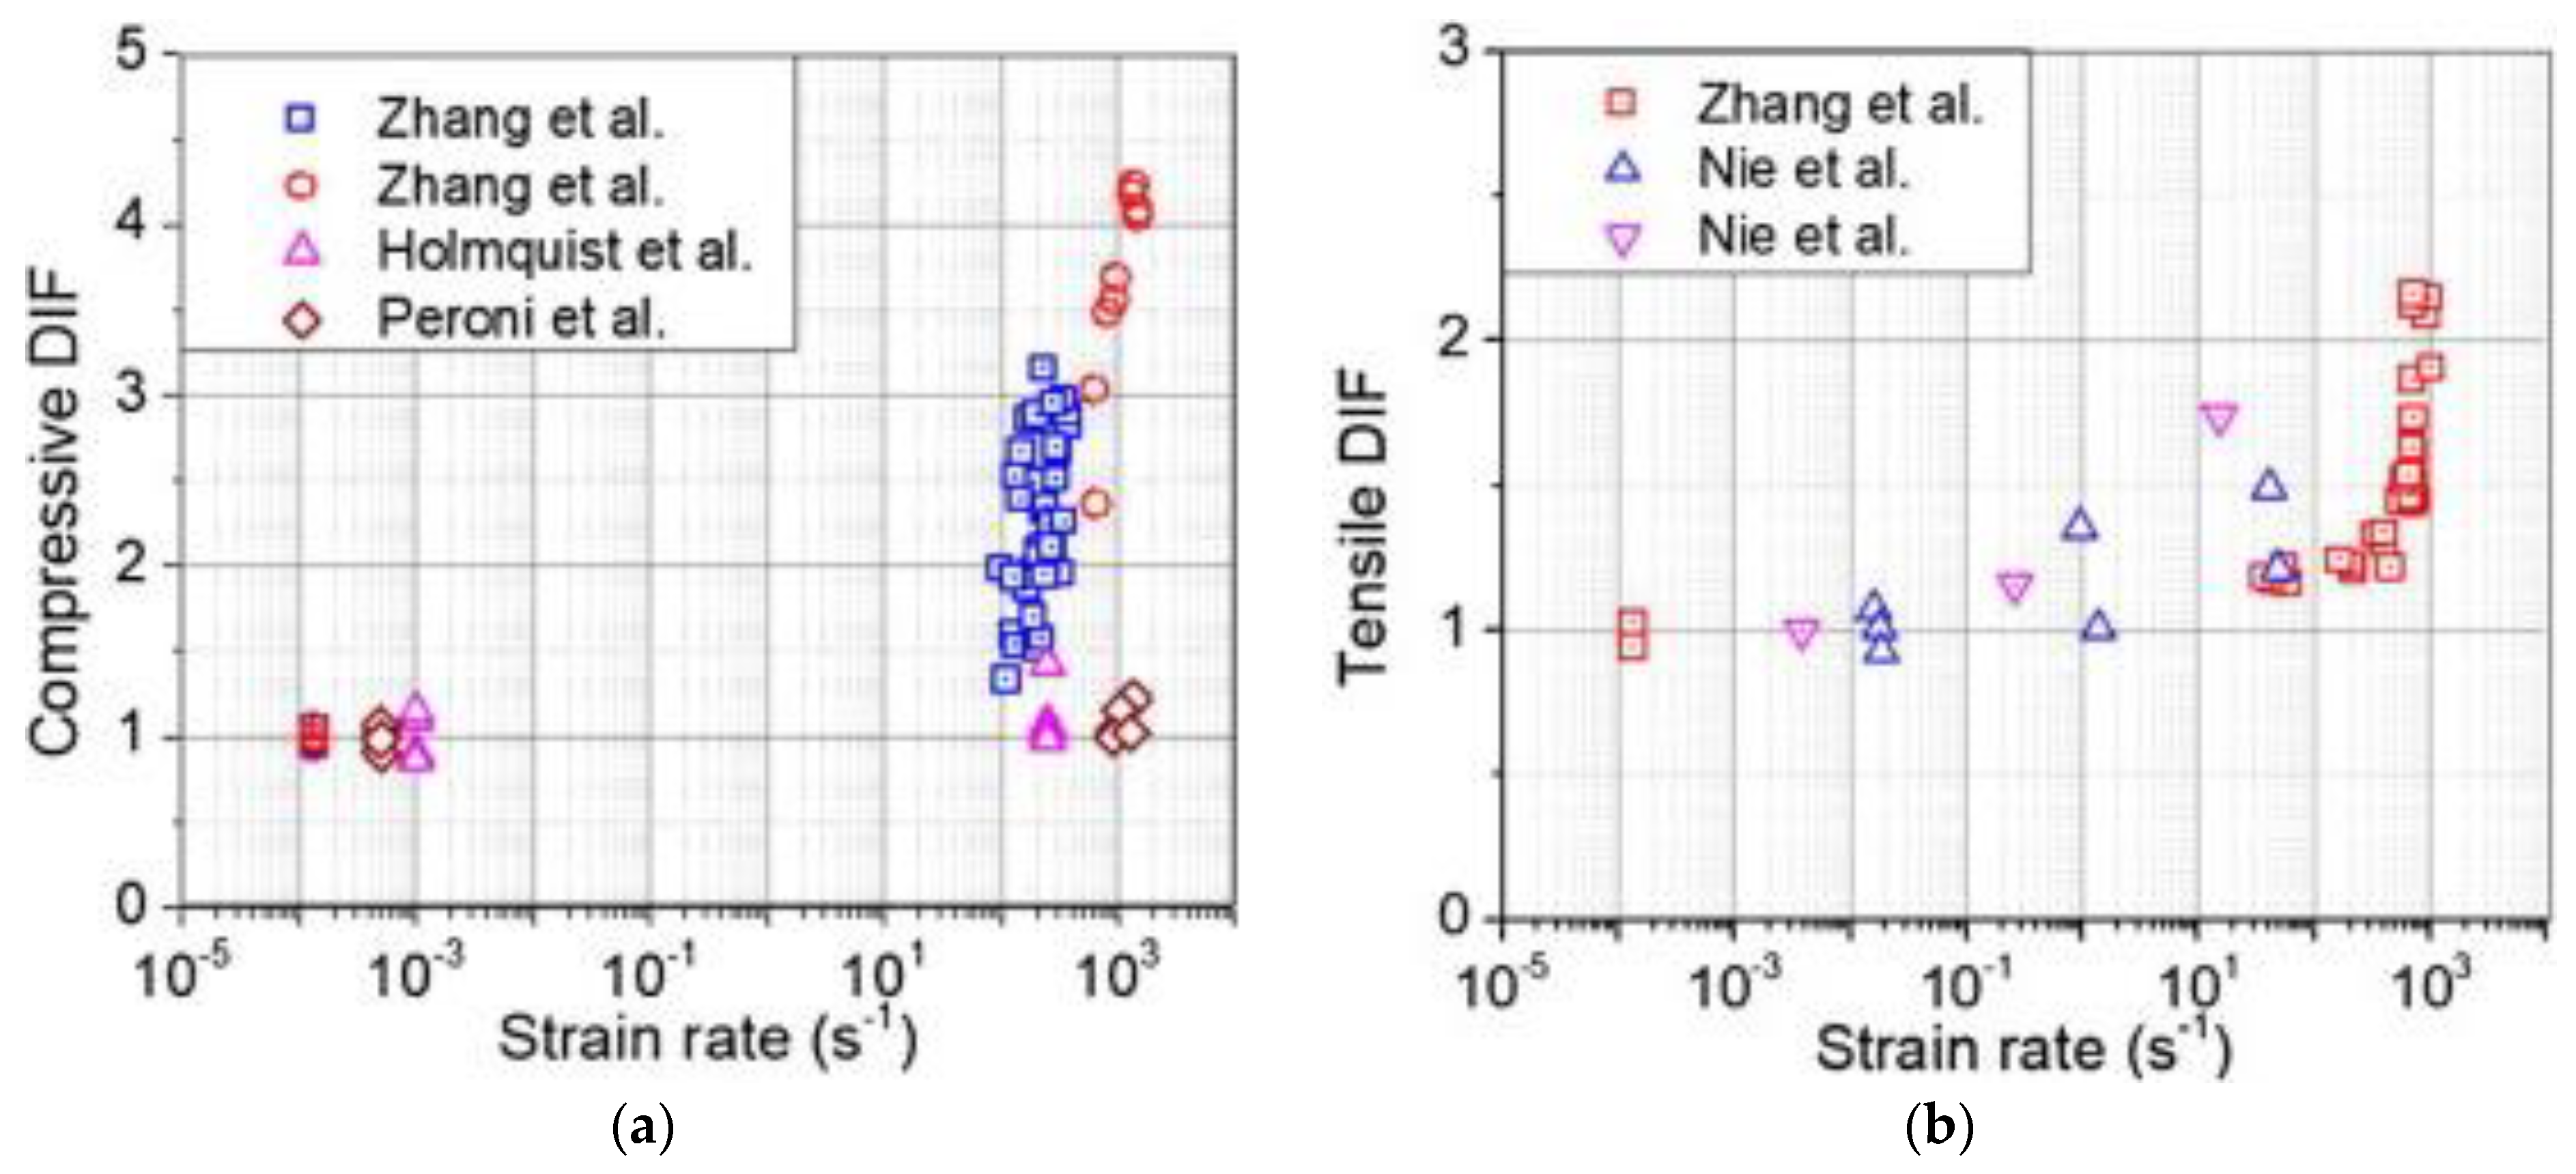
5.2.3. Materials
5.2.4. Boundaries and Connections
5.2.5. Damping
5.2.6. Impact Load and Impact Area
6. Experimental Validation of FE Results
6.1. Impact Response
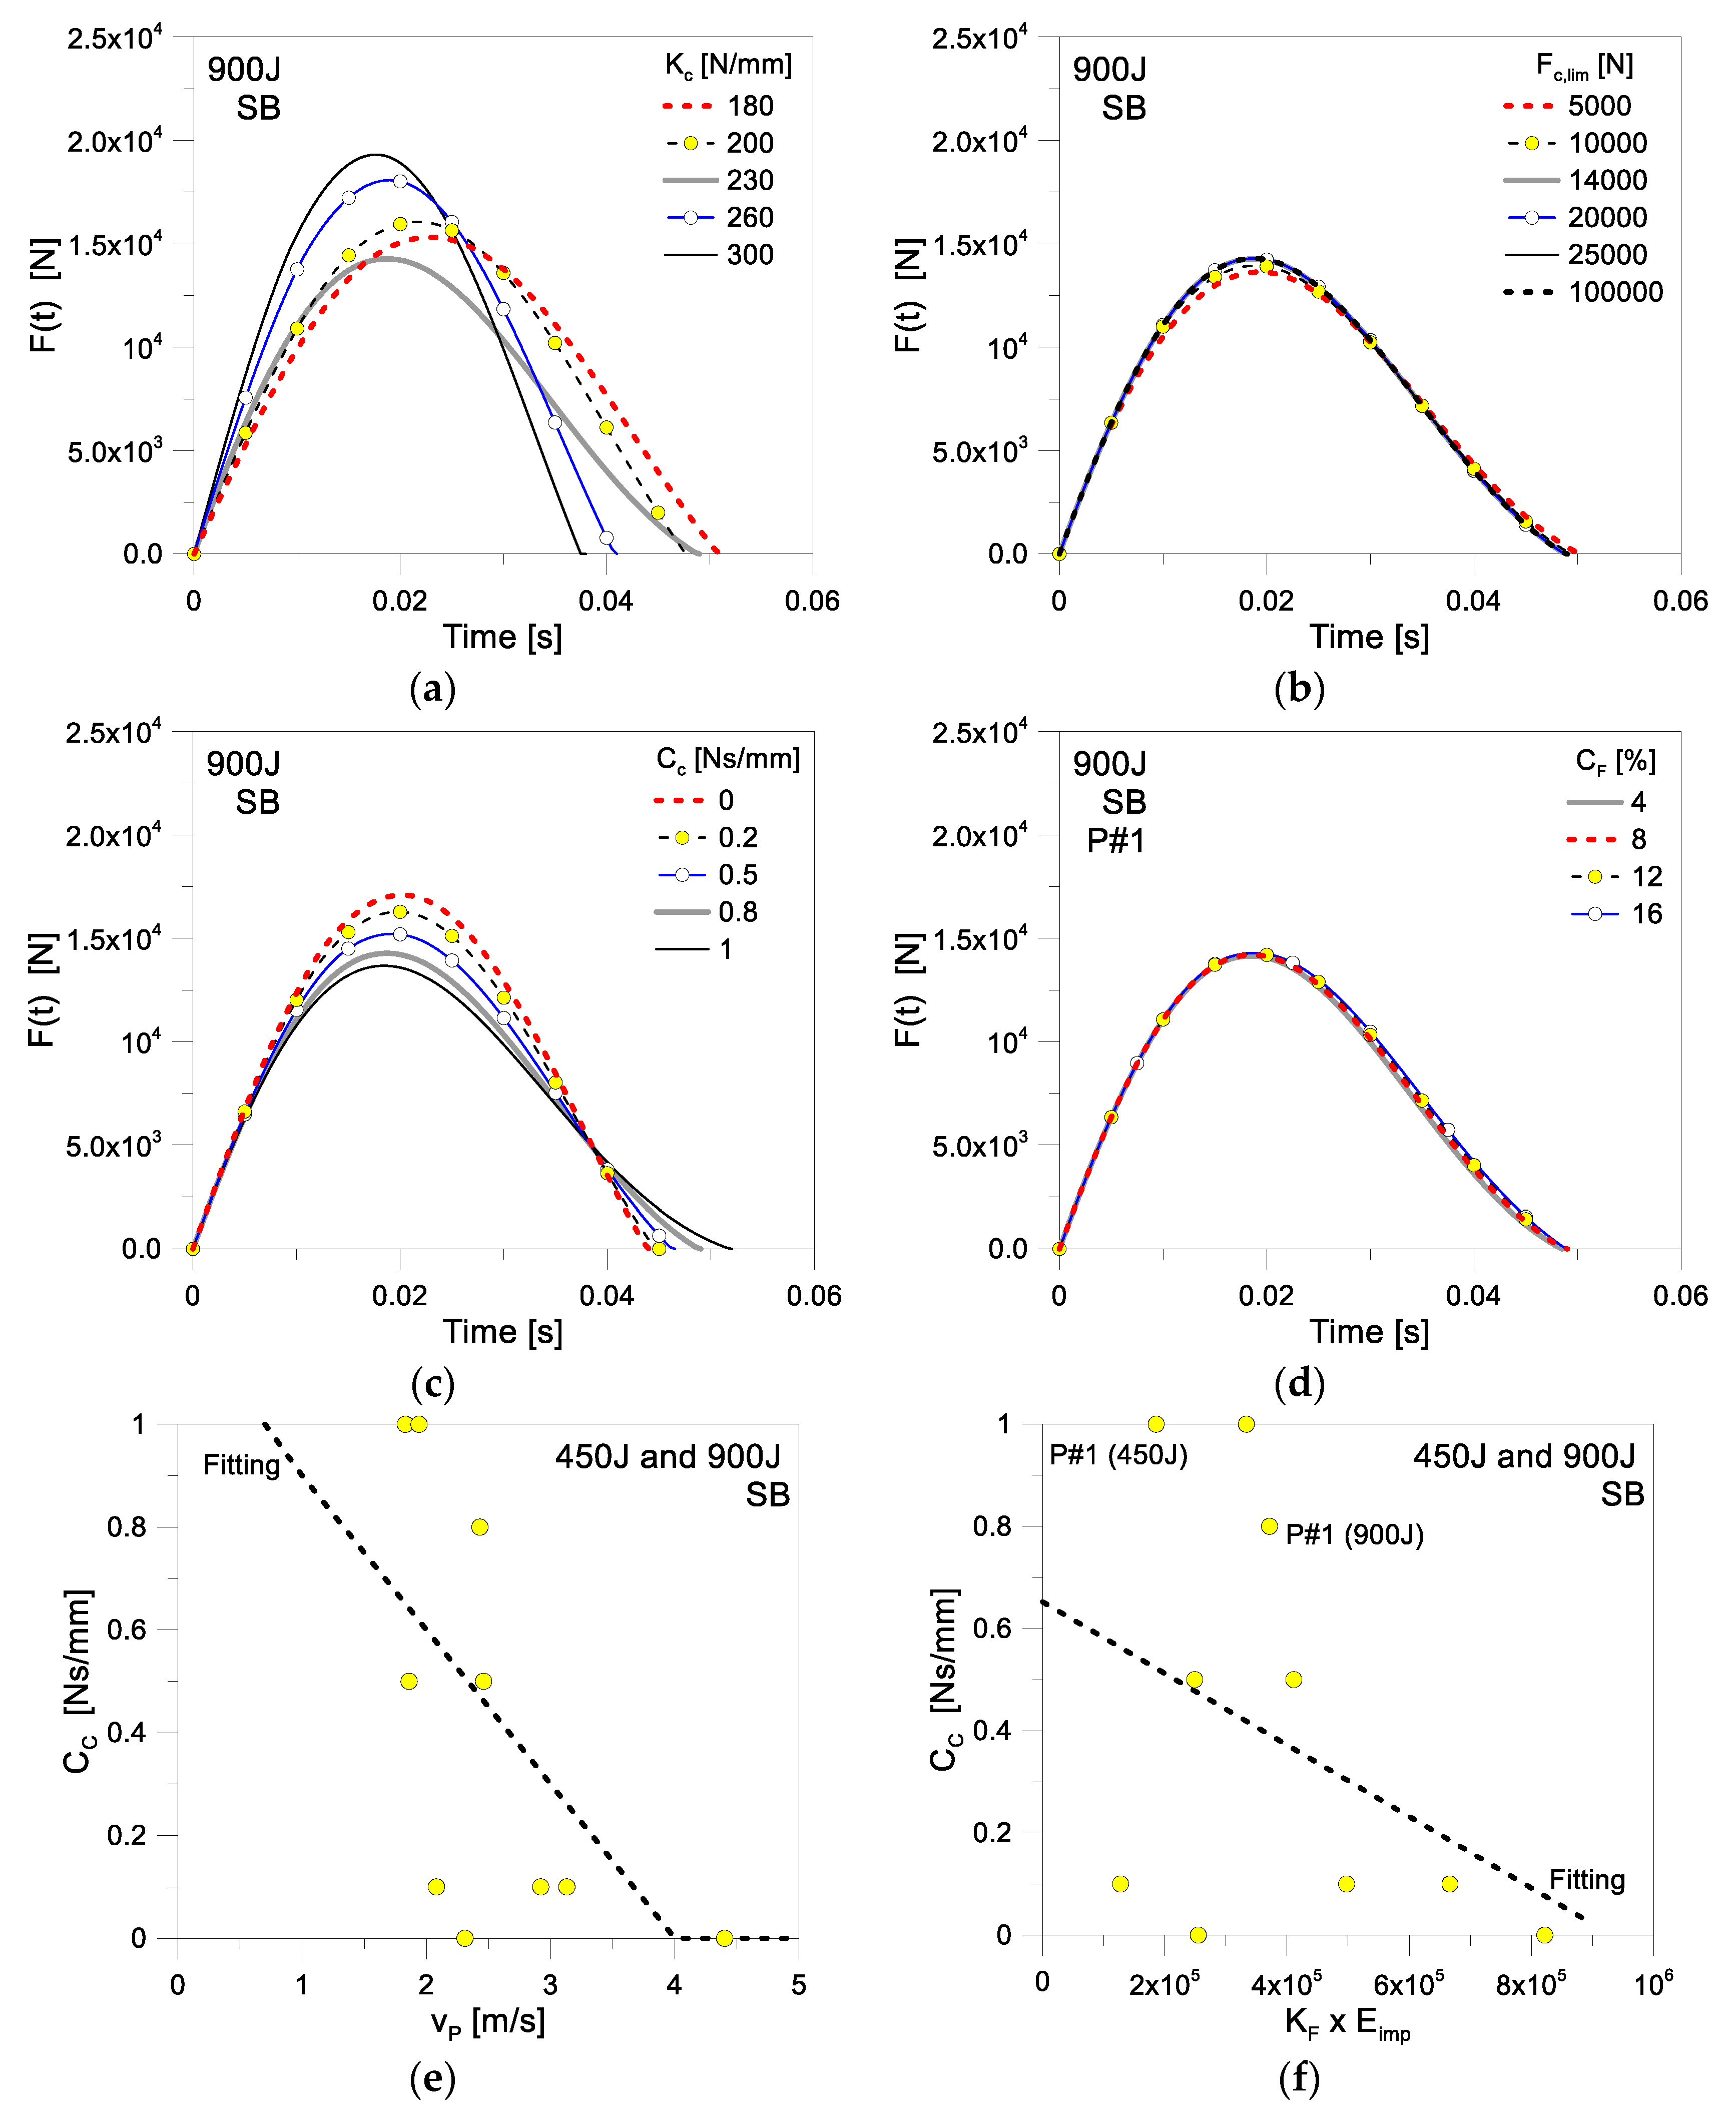
6.2. Input Parameters for the Impactor
7. Design Outcomes
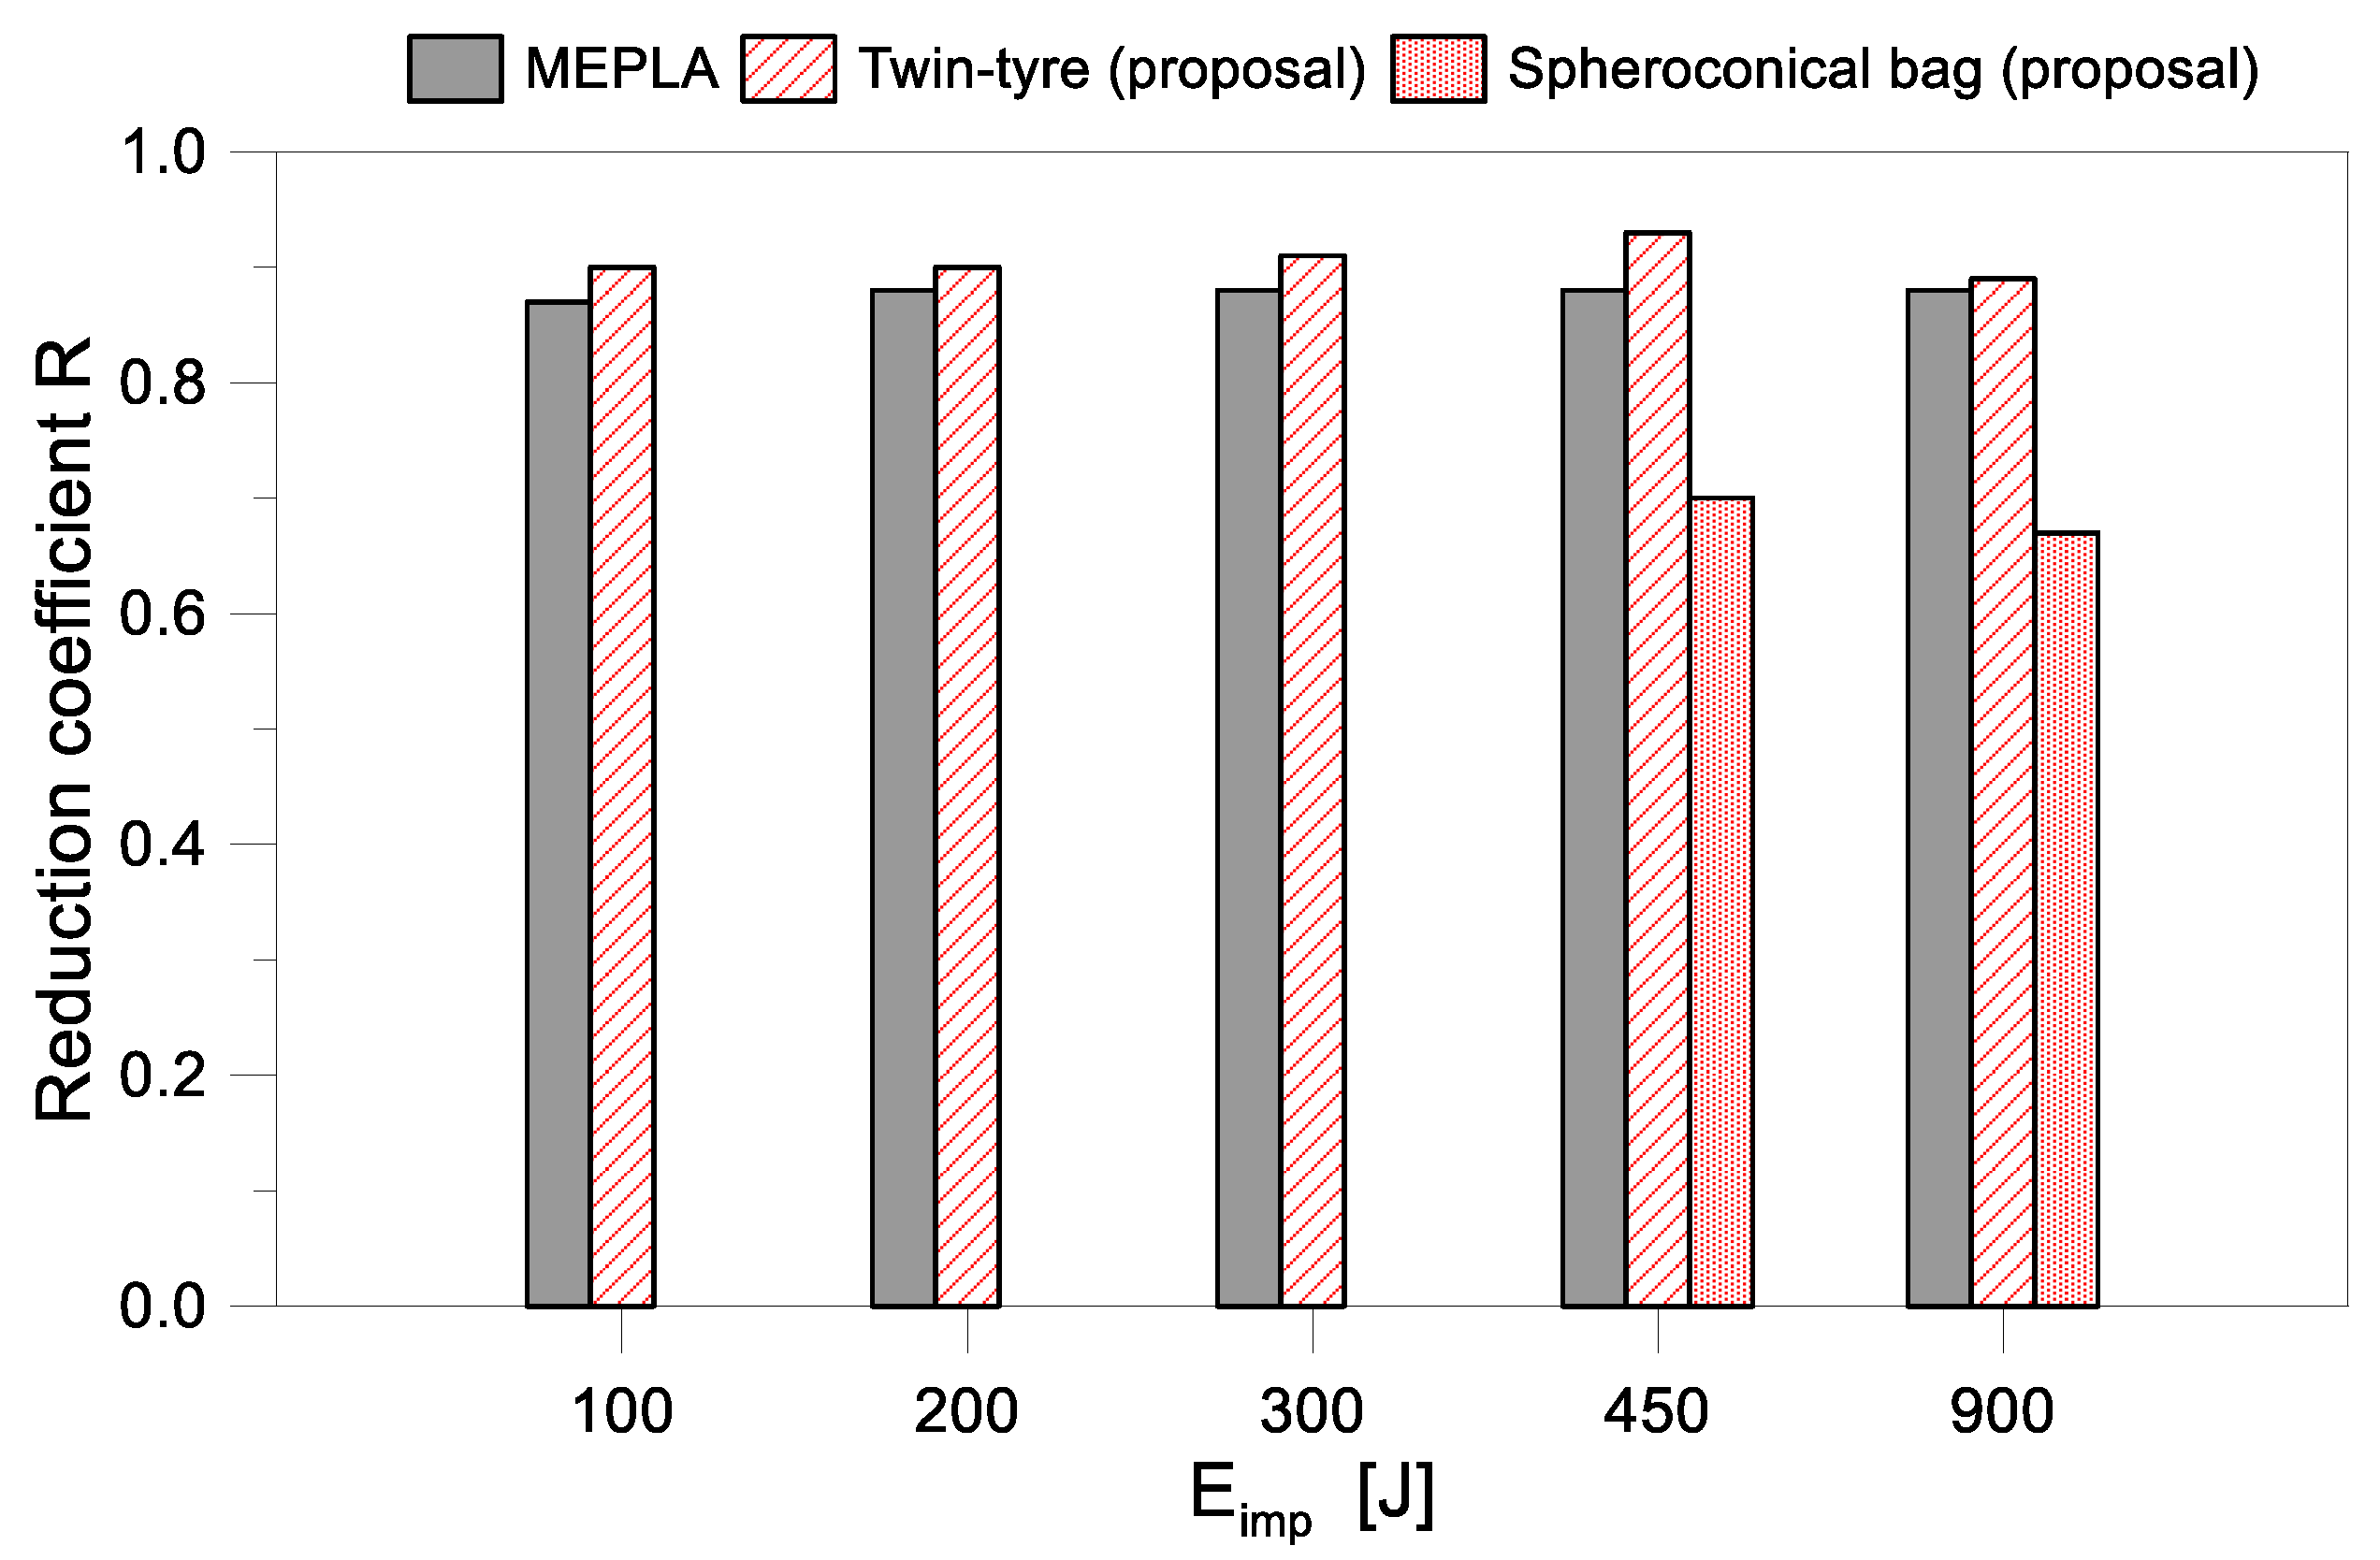
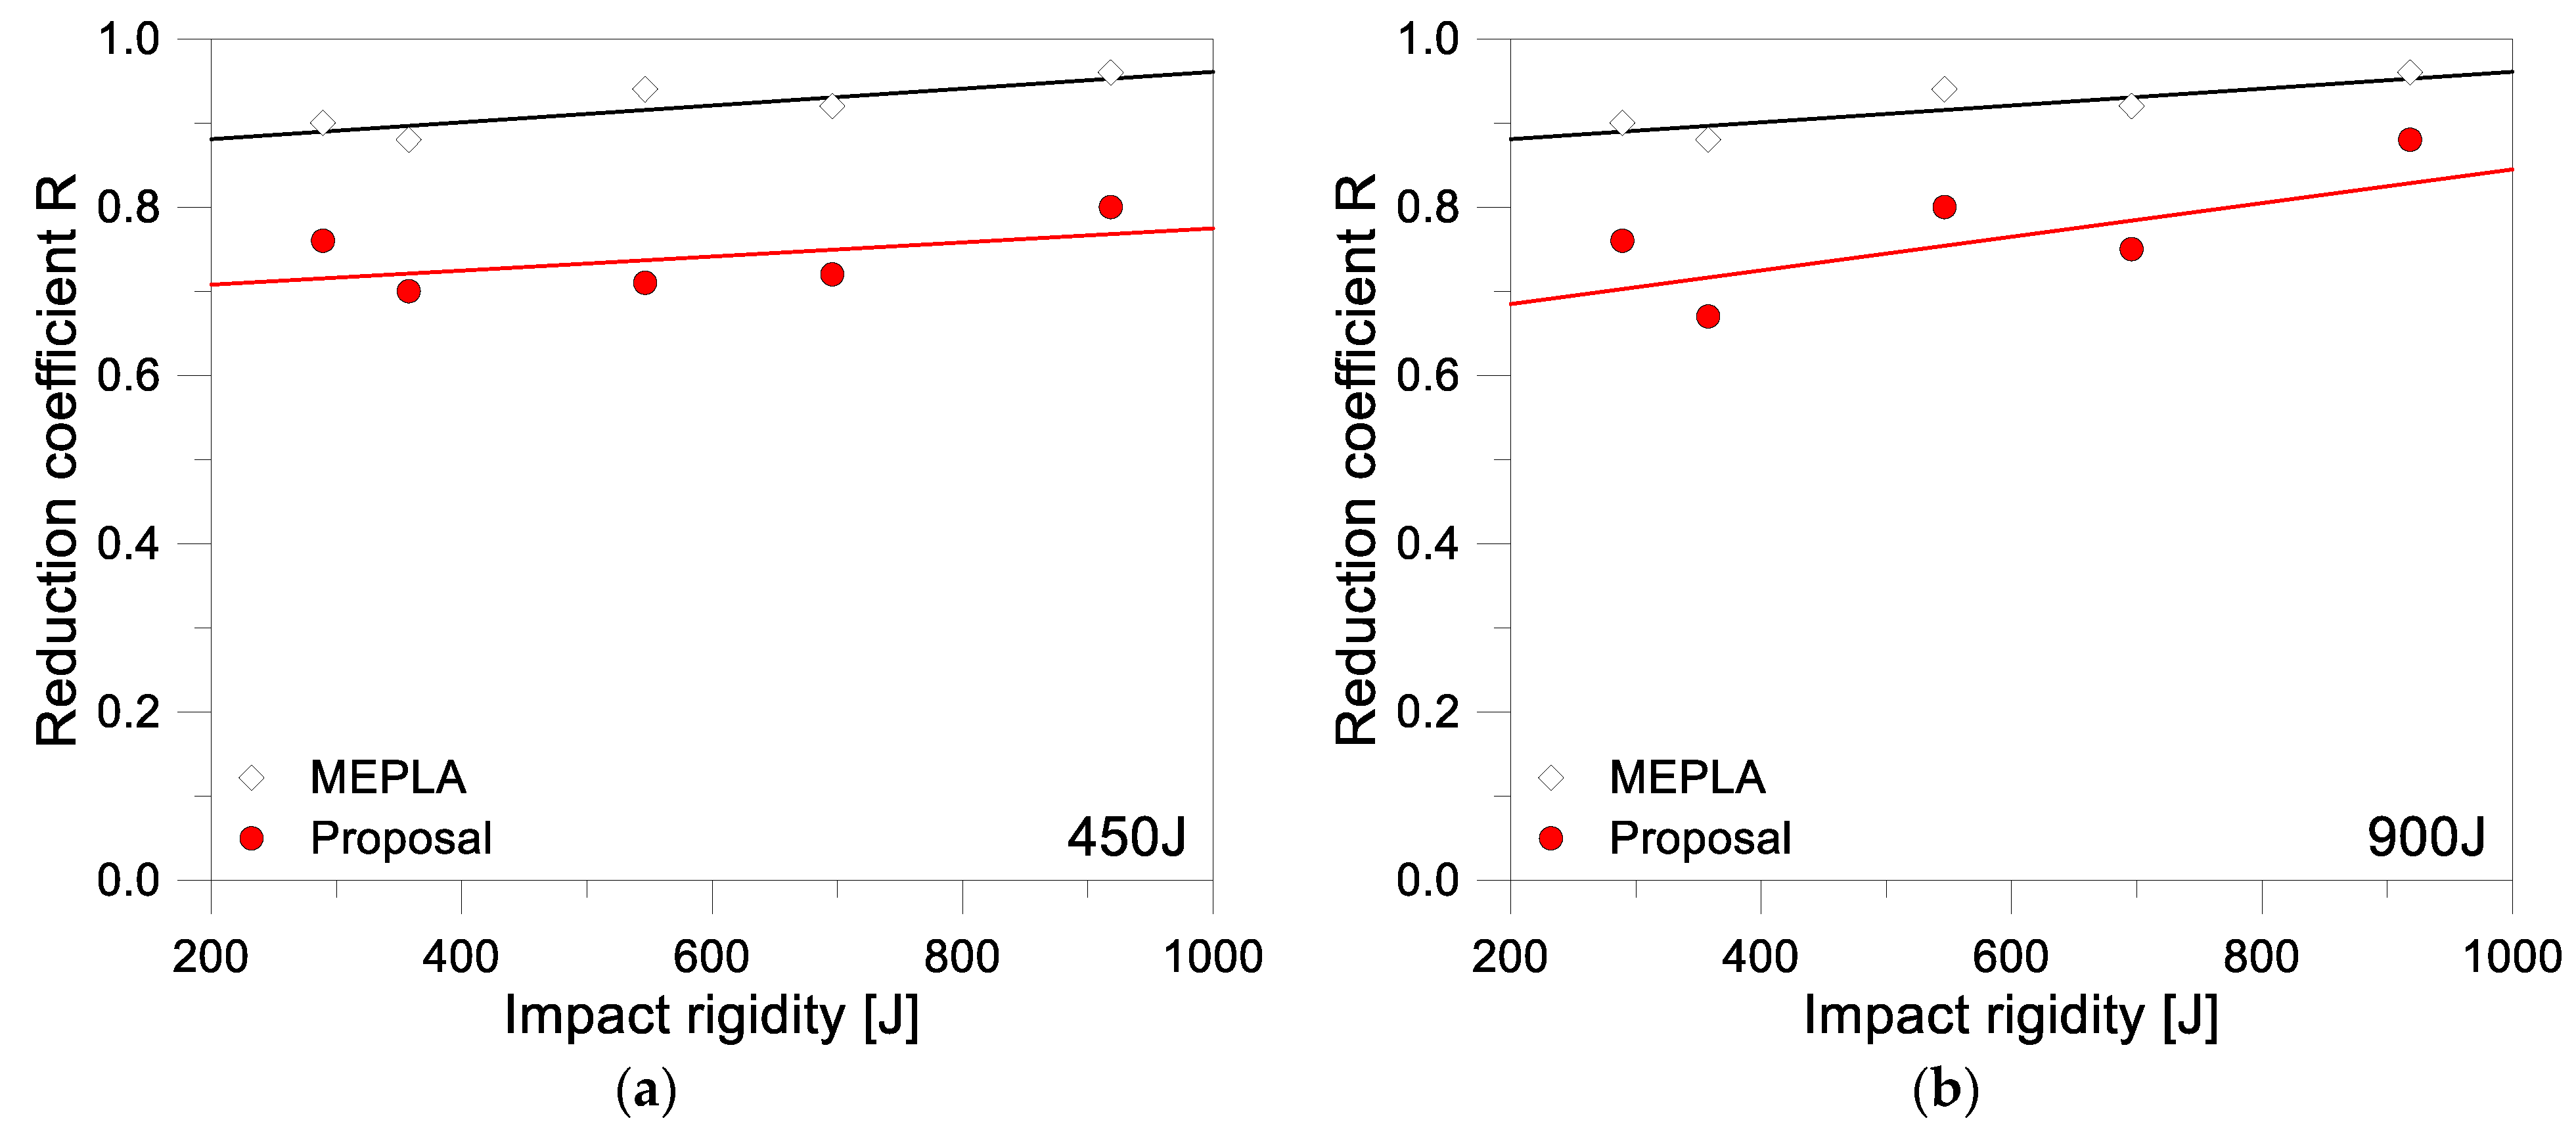
7.1. Reduction Coefficient RR
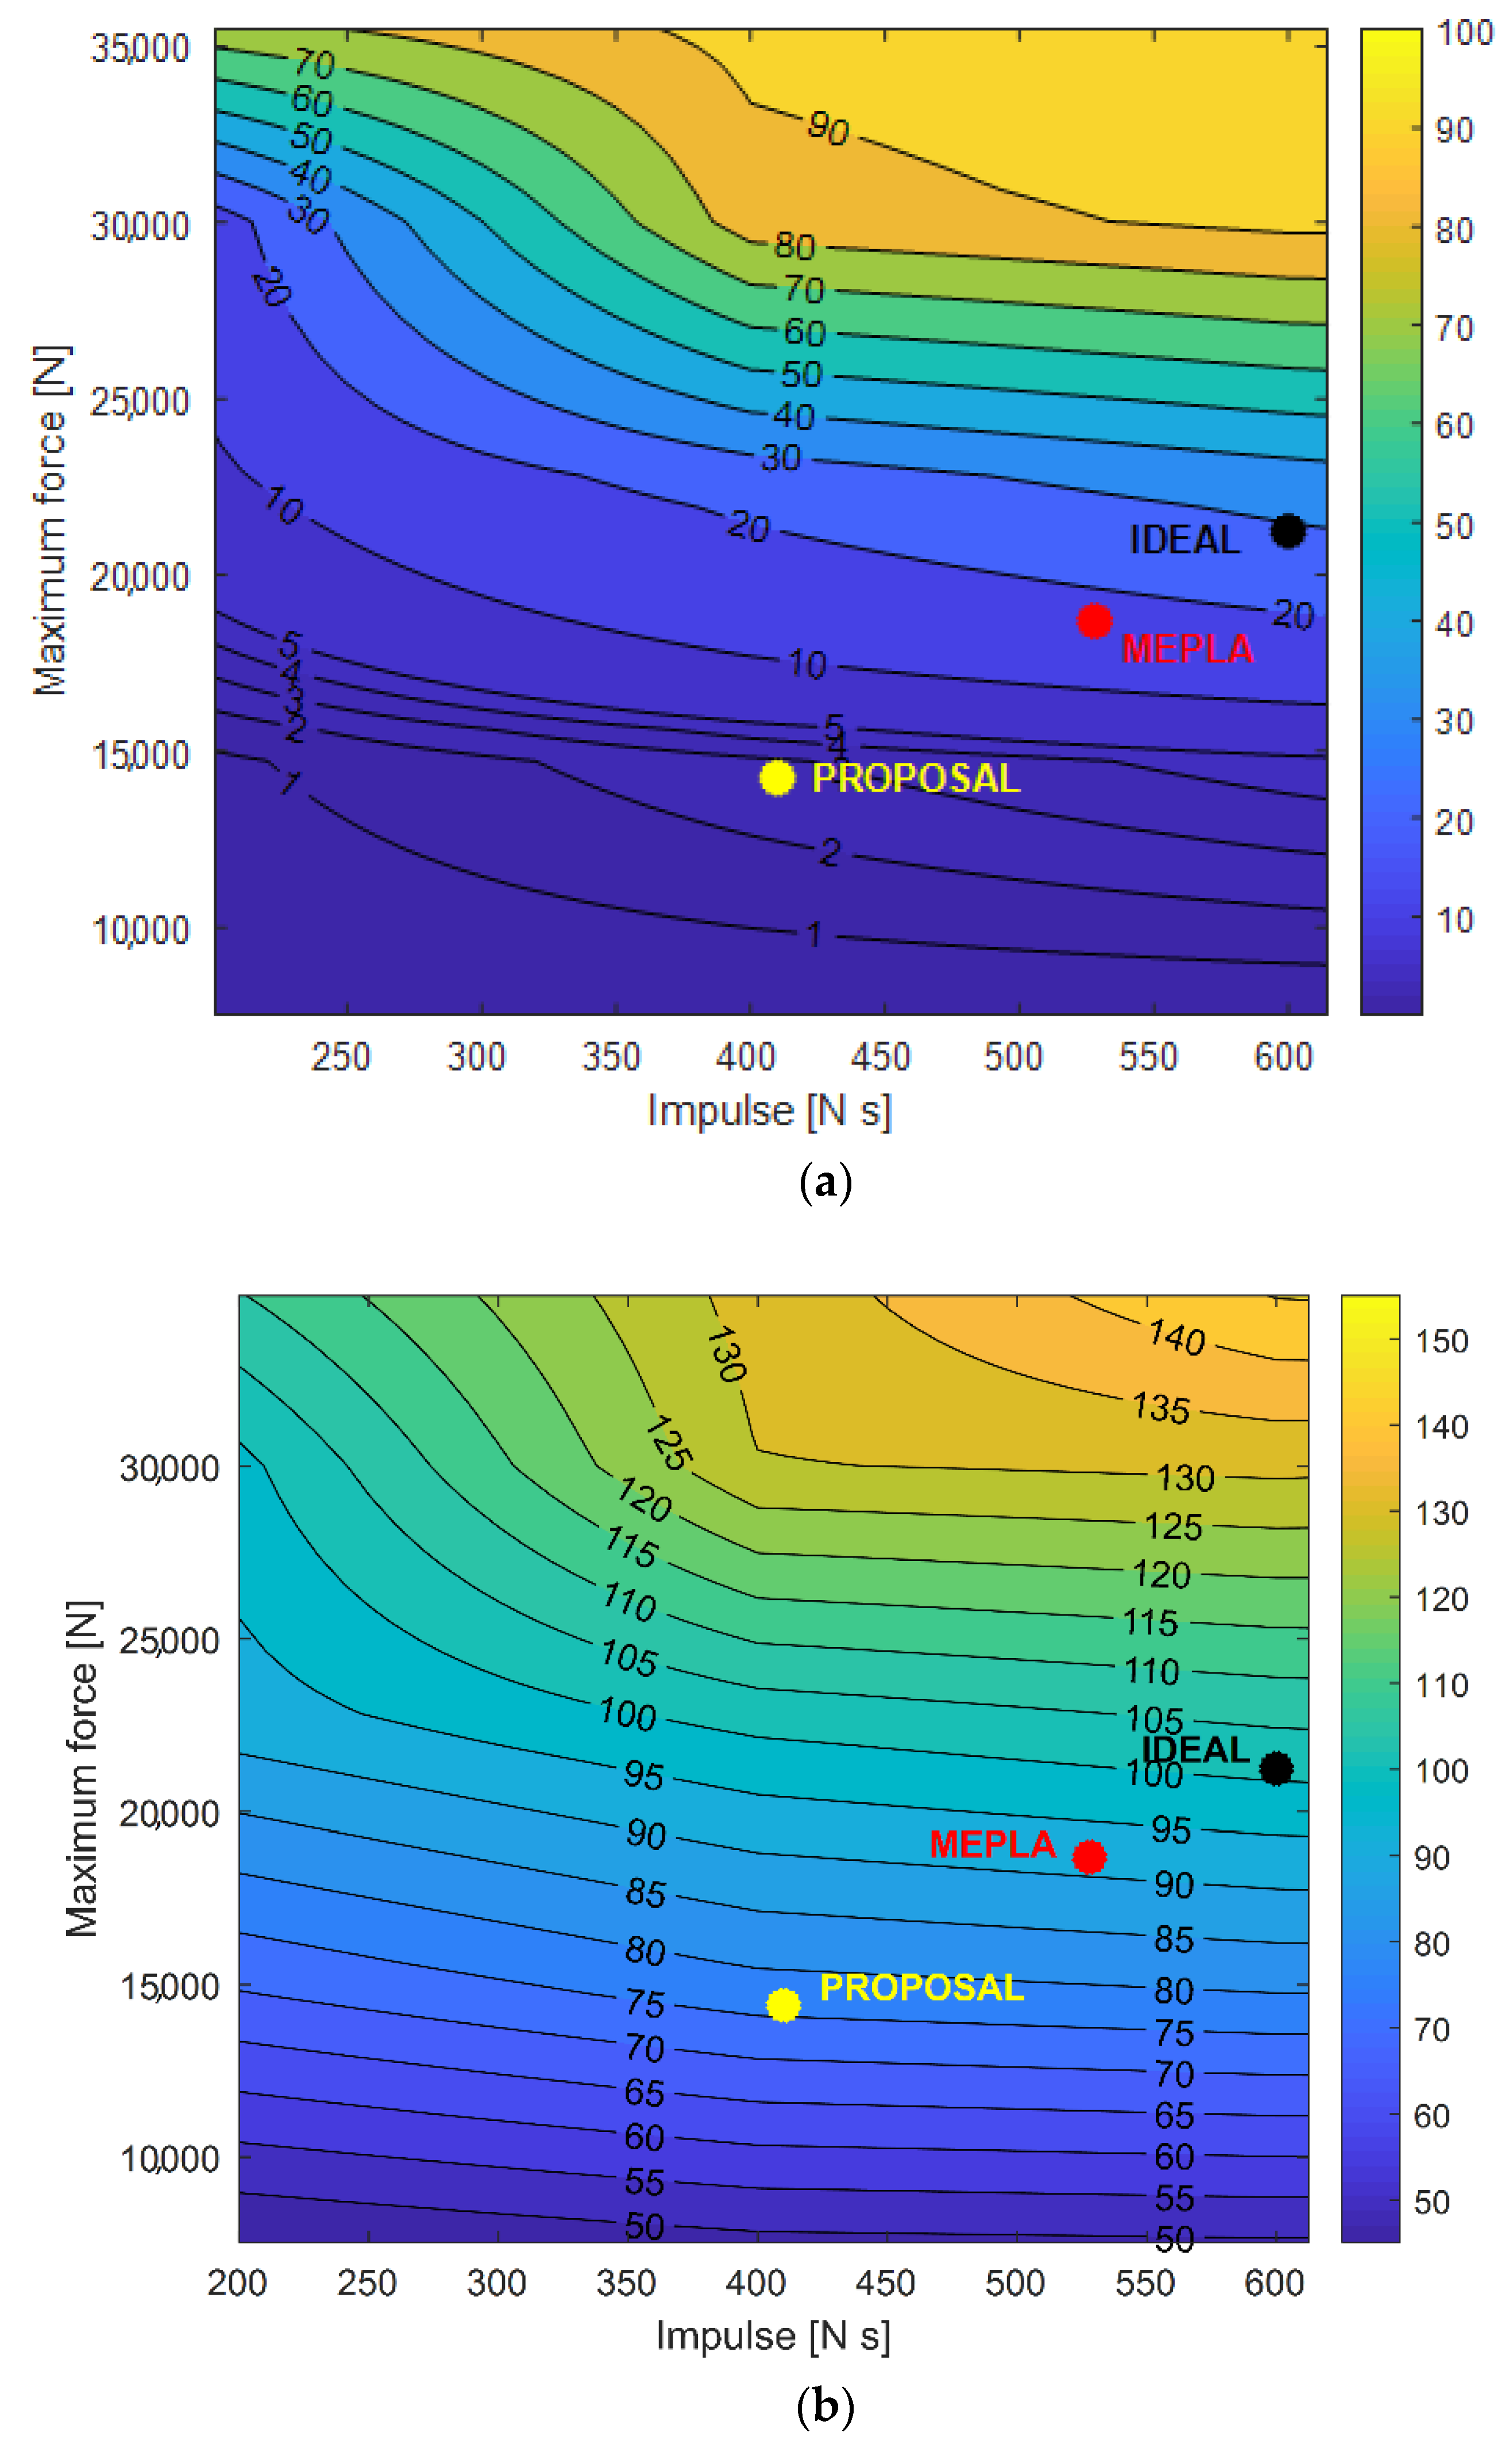
7.2. Iso-Damage Curves
8. Conclusions
Author Contributions
Funding
Institutional Review Board Statement
Informed Consent Statement
Data Availability Statement
Acknowledgments
Conflicts of Interest
References
- Sivanerupan, S.; Wilson, J.; Gad, E.; Lam, N. Drift Performance of Point Fixed Glass Façade Systems. Adv. Struct. Eng. 2014, 17, 1481–1495. [Google Scholar] [CrossRef]
- Bedon, C.; Zhang, X.; Santos, F.; Honfi, D.; Kozłowski, M.; Arrigoni, M.; Figuli, L.; Lange, D. Performance of structural glass facades under extreme loads—Design methods, existing research, current issues and trends. Constr. Build. Mater. 2018, 163, 921–937. [Google Scholar] [CrossRef]
- Larcher, M.; Arrigoni, M.; Bedon, C.; van Doormaal, J.C.A.M.; Haberacker, C.; Hüsken, G.; Millon, O.; Saarenheimo, A.; Solomos, G.; Thamie, L.; et al. Design of Blast-Loaded Glazing Windows and Facades: A Review of Essential Requirements towards Standardization. Adv. Civ. Eng. 2016, 2016, 1–14. [Google Scholar] [CrossRef]
- Lori, G.; Morison, C.; Larcher, M.; Belis, J. Sustainable façade design for glazed buildings in a blast resilient urban envi-ronment. Glass Struct. Eng. 2019, 4, 145–173. [Google Scholar] [CrossRef]
- Lago, A.; Sullivan, T.J. A Review of Glass Façade Systems and Research into the Seismic Design of Frameless Glass Facades; ROSE Research Report 2011/01; Fondazione Eucentre: Pavia, Italy, 2011; ISBN 978-88-6198-059-4. [Google Scholar]
- Feldmann, M.; Kasper, R.; Abeln, B.; Cruz, P.; Belis, J.; Beyer, J.; Colvin, J.; Ensslen, F.; Grenier, C.; Zarnic, R.; et al. Guidance for European Structural Design of Glass Components—Support to the Imple-Mentation, Harmonization and Further Development of the Eurocodes; Report EUR 26439-Joint Research Centre-Institute for the Protection and Security of the Citizen; Publications Office of the European Union: Copenhagen, Denmark, 2014. [Google Scholar] [CrossRef]
- Ramos, A.; Pelayo, F.; Lamela, M.J.; Canteli, A.F.; Aenlle, M.L.; Persson, K. Analysis of structural glass panels under impact loading using operational modal analysis. In Proceedings of the IOMAC’15—6th International Operational Modal Analysis Conference, Gijon, Spain, 12–14 May 2015. [Google Scholar]
- Biolzi, L.; Bonati, A.; Cattaneo, S. Laminated Glass Cantilevered Plates under Static and Impact Loading. Adv. Civ. Eng. 2018, 2018, 7874618. [Google Scholar] [CrossRef]
- Kozłowski, M. Experimental and numerical assessment of structural behaviour of glass balustrade subjected to soft body impact. Compos. Struct. 2019, 229, 111380. [Google Scholar] [CrossRef]
- Bedon, C.; Kalamar, R.; Eliášová, M. Low velocity impact performance investigation on square hollow glass columns via full-scale experiments and Finite Element analyses. Compos. Struct. 2017, 182, 311–325. [Google Scholar] [CrossRef]
- Figuli, L.; Papan, D.; Papanova, Z.; Bedon, C. Experimental mechanical analysis of traditional in-service glass windows subjected to dynamic tests and hard body impact. Smart Struct. Syst. 2021, 27, 365. [Google Scholar]
- Mohagheghian, I.; Wang, Y.; Zhou, J.; Yu, L.; Guo, X.; Yan, Y.; Charalambides, M.; Dear, J. Deformation and damage mechanisms of laminated glass windows subjected to high velocity soft impact. Int. J. Solids Struct. 2017, 109, 46–62. [Google Scholar] [CrossRef]
- Pelferne, J.; van Dam, S.; Kuntsche, J.; van Paepegem, W. Numerical simulation of the EN 12600 Pendulum Test for Structural Glass. In Proceedings of the Challenging Glass Conference Proceedings, Ghent, Belgium, 16 June 2016; Volume 5, pp. 429–438, ISSN 2589-8019. [Google Scholar]
- Schneider, J.; Schula, S. Zwei Verfahren zum rechnerischen Nachweis der dynamischen Beanspruchung von Ver-glasungen durch weichen Stoß—Teil 1: Numerische, transiente Simulationsberechnung und vereinfachtes Verfahren mit statischen Ersatzlasten. [Two mechanical design concepts for simulating the soft body impact at glazings—Part 1: Numerical, transient Finite Element simulation and simplified concept with equivalent static loads]. In Stahlbau Spezial 2011—Glas-bau/Glass in Building; Ernst & Sohn Verlag: Berlin, Germany, 2011; pp. 81–87. [Google Scholar]
- Weller, B.; Reich, S.; Krampe, P. Zwei Verfahren zum rechnerischen Nachweis der dynamischen Beanspruchung von Verglasungen durch weichen Stoß—Teil 2: Numerische Vergleichsberechnungen und experimentelle Verifikation [Two me-chanical design concepts for simulating the soft body impact at glazings—Part 2: Numerical comparison and experimental verification]. In Stahlbau Spezial 2011—Glasbau/Glass in Building; Ernst & Sohn Verlag: Berlin, Germany, 2011; pp. 88–92. [Google Scholar]
- Schneider, J.; Schula, S. Simulating soft body impact on glass structures. Proc. Inst. Civ. Eng. Struct. Build. 2016, 169, 416–431. [Google Scholar] [CrossRef]
- Chen, S.; Zang, M.; Wang, D.; Yoshimura, S.; Yamada, T. Numerical analysis of impact failure of automotive laminated glass: A review. Compos. Part B Eng. 2017, 122, 47–60. [Google Scholar] [CrossRef]
- Suh, C.M.; Kim, S.H.; Hwang, B.W. Finite Element Analysis of Brain Damage due to Impact Force with a Three Dimensional Head Model. Key Eng. Mater. 2005, 297-300, 1333–1338. [Google Scholar] [CrossRef]
- Sances, J.A.; Carlin, F.H.; Kumaresan, S.; Enz, B. Biomedical Engineering Analysis of Glass Impact Injuries. Crit. Rev. Biomed. Eng. 2002, 30, 345–378. [Google Scholar] [CrossRef]
- Code Aster Software, Électricité de France EDF. Available online: www.code-aster.org/ (accessed on 6 April 2021).
- SJ MEPLA Software and User’s Manual; SJ Software GmbH: Aachen, Germany; Available online: https://www.mepla.net/ (accessed on 6 April 2021).
- Vredstein V47 3.5-8—Technical Data Sheet. Available online: https://www.vredestein.it/ (accessed on 6 April 2021).
- EN 12600:2002. Glass in Building—Pendulum Test—Impact Test Method and Classification for Flat Glass; CEN: Brussels, Belgium, 2002. [Google Scholar]
- DIN 18008-4: 2013. Glas im Bauwesen—Bemessungs- und Konstruktionsregeln—Teil 4: Zusatzanforderungen an ab-sturzsichernde Verglasungen; Beuth: Berlin, Germany, 2013. [Google Scholar]
- de Vries, C.M. Numerical simulation of façade/window glazing fracture under impact loading. Proc. Challenging Glass 3 2012, 3, 489–500. [Google Scholar] [CrossRef]
- Schneider, J.; Bohmann, D. Glasscheiben unter Stoßbelastung, Experimentelle und Theoretische Untersuchungen für ab-sturzsichernde Verglasungen Bei Weichem Stoß, Bauingenieur; Springer: Berlin/Heidelberg, Germany, 2002; Volume 77. [Google Scholar]
- Breckner, W. Tragverhalten von Verbundsicherheitsglas unter Stoßbelastung nach DIN EN 12600, Diplomarbeit, Lehrstuhl für Stahlbau; RWTH: Aachen, Germany, 2001. [Google Scholar]
- Brendler, S.; Haufe, A.; Ummenhofer, T. A Detailed Numerical Investigation of Insulated Glass Subjected to the Standard Pendulum Test; LS-DYNA Anwenderforum: Bamberg, Germany, 2004. [Google Scholar]
- Cahier CSTB 3228. Resistance Impact on Glass and Glass Roof Infill; Centre Scientifique et Technique du Bâtiment (CSTB): Marne-la-Vallée, France, 2014. [Google Scholar]
- NF P 8-301. Determination of the Resistance to Soft and Heavy Body Impact; Association Francaise de Normalisation (AFNOR): Paris, France, 2003. [Google Scholar]
- CWCT TN 76. Technical Note 76: Impact Performance of Building Envelopes: Method for Impact Testing Cladding Panels; Centre for Window & Cladding Technology (CWCT): Bath, UK, 2012. [Google Scholar]
- ACR[M]001:2014. Test for Non-Fragility of Profiled Sheeted Roof Assemblies; Advisory Committee for Roofwork (ACR): London, UK, 2014. [Google Scholar]
- ANSI Z97.1. American National Standard for Safety Glazing Materials Used in Buildings—Safety Performance Specifications and Methods of Test; Accredited Standards Committee (ASC): McLean, VA, USA, 2015. [Google Scholar]
- Newman, C.J. Evaluation of an impact standard for curtain walling. Proc. Inst. Civ. Eng. Struct. Build. 2004, 157, 333–341. [Google Scholar] [CrossRef]
- Larcher, M.; Manara, G. Influence of Air Damping on Structures Especially Glass; JRC Technical Report, PUBSY JRC 57330; EU Publication Office: Geneva, Switzerland, 2010. [Google Scholar]
- Lenk, P.; Coult, G. Damping of Glass Structures and Components. In Challenging Glass 2—Conference on Architectural and Structural Applications of Glass; Veer, B.L., Ed.; TU: Delft, Germany, 2010. [Google Scholar]
- Barredo, J.; Soriano, M.; Gómez, M.; Hermanns, L. Viscoelastic vibration damping identification methods. Application to laminated glass. Procedia Eng. 2011, 10, 3208–3213. [Google Scholar] [CrossRef]
- Bedon, C.; Fasan, M.; Amadio, C. Vibration Analysis and Dynamic Characterization of Structural Glass Elements with Different Restraints Based on Operational Modal Analysis. Buildings 2019, 9, 13. [Google Scholar] [CrossRef]
- EN 1993-1-1:2005+A1:2014—Eurocode 3. Design of Steel Structures. General Rules and Rules for Buildings; CEN: Brussels, Belgium, 2010. [Google Scholar]
- EN 572-2:2004. Glass in Buildings—Basic Soda Lime Silicate Glass Products; CEN: Brussels, Belgium, 2004. [Google Scholar]
- EN 755-2:2016. Aluminium and Aluminium Alloys—Extruded Rod/Bar, Tube and Profiles—Part 2: Mechanical Properties; CEN: Brussels, Belgium, 2016. [Google Scholar]
- DOWSIL™ 993 Structural Glazing Base and Catalyst—Product Data Sheet. Available online: www.dow.com (accessed on 6 April 2021).
- Salome-Meca Platform, EDF. Available online: http://www.salome-platform.org/service-and-support/available-programs (accessed on 6 April 2021).
- EN 14024:2004. Metal Profiles with Thermal Barrier—Mechanical Performance—Requirements, Proof and Tests for Assessment—Annex C: Effective Momentum of Inertia of Thermal Barrier Profiles; CEN: Brussels, Belgium, 2004. [Google Scholar]
- Morse, S.M.; Norville, H.S. Comparison of methods to determine load sharing of insulating glass units for environmental loads. Glas. Struct. Eng. 2016, 1, 315–329. [Google Scholar] [CrossRef]
- Bedon, C.; Amadio, C. Mechanical analysis and characterization of IGUs with different silicone sealed spacer connections—Part 1: Experiments. Glas. Struct. Eng. 2020, 5, 301–325. [Google Scholar] [CrossRef]
- Bedon, C.; Amadio, C. Mechanical analysis and characterization of IGUs with different silicone sealed spacer connections—Part 2: Modelling. Glas. Struct. Eng. 2020, 5, 327–346. [Google Scholar] [CrossRef]
- Amadio, C.; Bedon, C. Elastoplastic dissipative devices for the mitigation of blast resisting cable-supported glazing fa-çades. Eng. Struct. 2012, 93, 103–115. [Google Scholar] [CrossRef]
- Amadio, C.; Bedon, C. Viscoelastic spider connectors for the mitigation of cable-supported façades subjected to air blast loading. Eng. Struct. 2012, 42, 190–200. [Google Scholar] [CrossRef]


| Mullion | Transom | |||||
|---|---|---|---|---|---|---|
| Left | Right | Top | Middle | Bottom | ||
| A | (mm2) | 2.12 × 10³ | 2.40 × 10³ | 2.81 × 10³ | 1.77 × 10³ | 1.84 × 10³ |
| I | (mm4) | 1.13 × 10⁷ | 1.38 × 10⁷ | 1.61 × 10⁷ | 0.29 × 10⁷ | 1.09 × 10⁷ |
| Impact Energy Eimp [J] | |||||
|---|---|---|---|---|---|
| Impact Point | 100 | 200 | 300 | 450 | 900 |
| P#1 | TT | TT | TT | SB and TT | SB and TT |
| P#2 | x | x | x | SB | SB |
| P#3 | x | x | x | SB | SB |
| P#4 | x | x | x | SB | SB |
| P#5 | x | x | x | SB | SB |
| Mullion | Transom | |||||
|---|---|---|---|---|---|---|
| Left | Right | Top | Middle | Bottom | ||
| A | (mm2) | 2.56 × 10³ | 2.84 × 10³ | 3.08 × 10³ | 1.88 × 10³ | 1.95 × 10³ |
| I | (mm4) | 1.40 × 10⁷ | 1.68 × 10⁷ | 1.79 × 10⁷ | 0.33 × 10⁷ | 1.20 × 10⁷ |
| It | (mm4) | 1.00 × 10⁶ | 1.00 × 10⁶ | 1.00 × 10⁶ | 1.00× 10⁶ | 1.00 × 10⁶ |
| Material | ||||
|---|---|---|---|---|
| Glass | Aluminum | Spandrel * | Gas ** | |
| E [MPa] | 70,000 | 70,000 | 70,000 | 0.08 |
| ν | 0.23 | 0.34 | 0.22 | 0.22 |
| ρ [kg/m3] | 2500 | 2700 | 6225 | 1.225 |
| Spheroconical Bag | Twin-Tire | ||
|---|---|---|---|
| Fc,lim | [N] | 14,000 | - |
| Kc | [N/mm] | 230 | 250 |
| Cc | [Ns/mm] | Variable with Eimp and KF (0.1–1) See Figure 18f | 0 |
Publisher’s Note: MDPI stays neutral with regard to jurisdictional claims in published maps and institutional affiliations. |
© 2021 by the authors. Licensee MDPI, Basel, Switzerland. This article is an open access article distributed under the terms and conditions of the Creative Commons Attribution (CC BY) license (https://creativecommons.org/licenses/by/4.0/).
Share and Cite
Bez, A.; Bedon, C.; Manara, G.; Amadio, C.; Lori, G. Calibrated Numerical Approach for the Dynamic Analysis of Glass Curtain Walls under Spheroconical Bag Impact. Buildings 2021, 11, 154. https://doi.org/10.3390/buildings11040154
Bez A, Bedon C, Manara G, Amadio C, Lori G. Calibrated Numerical Approach for the Dynamic Analysis of Glass Curtain Walls under Spheroconical Bag Impact. Buildings. 2021; 11(4):154. https://doi.org/10.3390/buildings11040154
Chicago/Turabian StyleBez, Alessia, Chiara Bedon, Giampiero Manara, Claudio Amadio, and Guido Lori. 2021. "Calibrated Numerical Approach for the Dynamic Analysis of Glass Curtain Walls under Spheroconical Bag Impact" Buildings 11, no. 4: 154. https://doi.org/10.3390/buildings11040154
APA StyleBez, A., Bedon, C., Manara, G., Amadio, C., & Lori, G. (2021). Calibrated Numerical Approach for the Dynamic Analysis of Glass Curtain Walls under Spheroconical Bag Impact. Buildings, 11(4), 154. https://doi.org/10.3390/buildings11040154