1. Introduction: A Review of Residential Areas in the Contemporary City
At the beginning of the 19th century, hygienism, in its myriad forms, was the Western counterpoint to unhealthy industrial city living. Nowadays, we can analyse the characteristics of residential environments, and their ability to offer complex, sustainable and healthy daily life experiences for their inhabitants. We can evaluate time as a parameter of quality [
1], as well as the ways in which these environments position themselves in reaction to cities that are increasingly centres of speculation, globalisation, pollution, fragmentation and, as soon as the opportunity arises, tourism [
2].
This research seeks to help inform the decision-making process behind urban regeneration and enhancement—those objectives to provide spaces that are environmentally friendly, healthy and in which the needs of citizens are satisfied [
3], that is to say, encompassing all spheres of life, whether at the productive, reproductive, personal or community level [
4]. We are talking about meeting citizens’ expectations in a responsible and effective way and offering time and encouragement to develop active lives [
5] by engendering a sense of commitment to the place in which they live [
6]. In these terms, to achieve an urban renewal adapted to the new urban agendas, the neighborhood scale is the most appropriate. In this sense, the diagnosis of the existing neighborhood followed by the creation of scenarios is a valid prospective method for proposing urban renewal actions [
7].
At a global level, the development plans of large cities are debated and get coverage in specialist media, and even in more generalist media from time to time. However, what about when it comes to medium-sized cities? A primary diagnosis offers up the same results: A shortage of daily services, touristification, gentrification of popular areas that become the target of speculative development and high levels of pollution. The World Health Organization (WHO) offers information on the air quality of more than 3000 cities in 103 countries which we can use to verify that the size of the city is not directly proportional to its pollution levels [
8]. Nowadays, urban development agendas increasingly feature objectives to address the climate emergency, improve public health and enhance the quality of everyday life. We can see this modernisation already underway in cities such as Paris (Le Paris du ¼ heure), Melbourne (Croydon South, Strathmore and Sunshine West), London (Every One Every Day) [
9] or Barcelona (super blocks and green axes) [
10].
This research aims to participate in this dynamic by systematising a methodology of analysis that combines quantitative and qualitative observation. The objective is to interpret the reality of these contexts, supported in strongly focused and objective evidence, and to offer help in the decision-making processes with area-based initiatives that have the potential to combine physical and people-related regeneration [
11].
To address these evaluations, scientific literature offers up some interesting factors, such as those based on the Perceived Residential Environment Quality Indicators (PREQIs). This methodology uses a series of questionnaires that deal with architectural, social, functional and contextual aspects, integrating objective and subjective measures to evaluate the quality of life in a neighborhood, and even covering cross-cultural areas [
12], or URBIUS, a Multi-Criteria Decision-Making (MCDM) method integrated into a Geographic Information System (GIS) adapted to the Swiss context and developed by the Laboratory of Architecture and Sustainable Technologies, Ecole polytechnique fédérale de Lausanne, with the aim of bringing out the strengths and weaknesses of an object in order to identify the best intervention, according to predefined values [
13].
However, in our case, we wanted to use a combination of three specific systems that allow us to deepen the three axes on which we can base the concept of urban quality—namely environmental quality (Urban Ecology Agency of Barcelona), functionality, linked to the concept of chronourbanism (Col.lectiu Punt 6) and the degree of “comfort” emanating from a sense of attachment and commitment to the area in question (Project for Public Spaces).
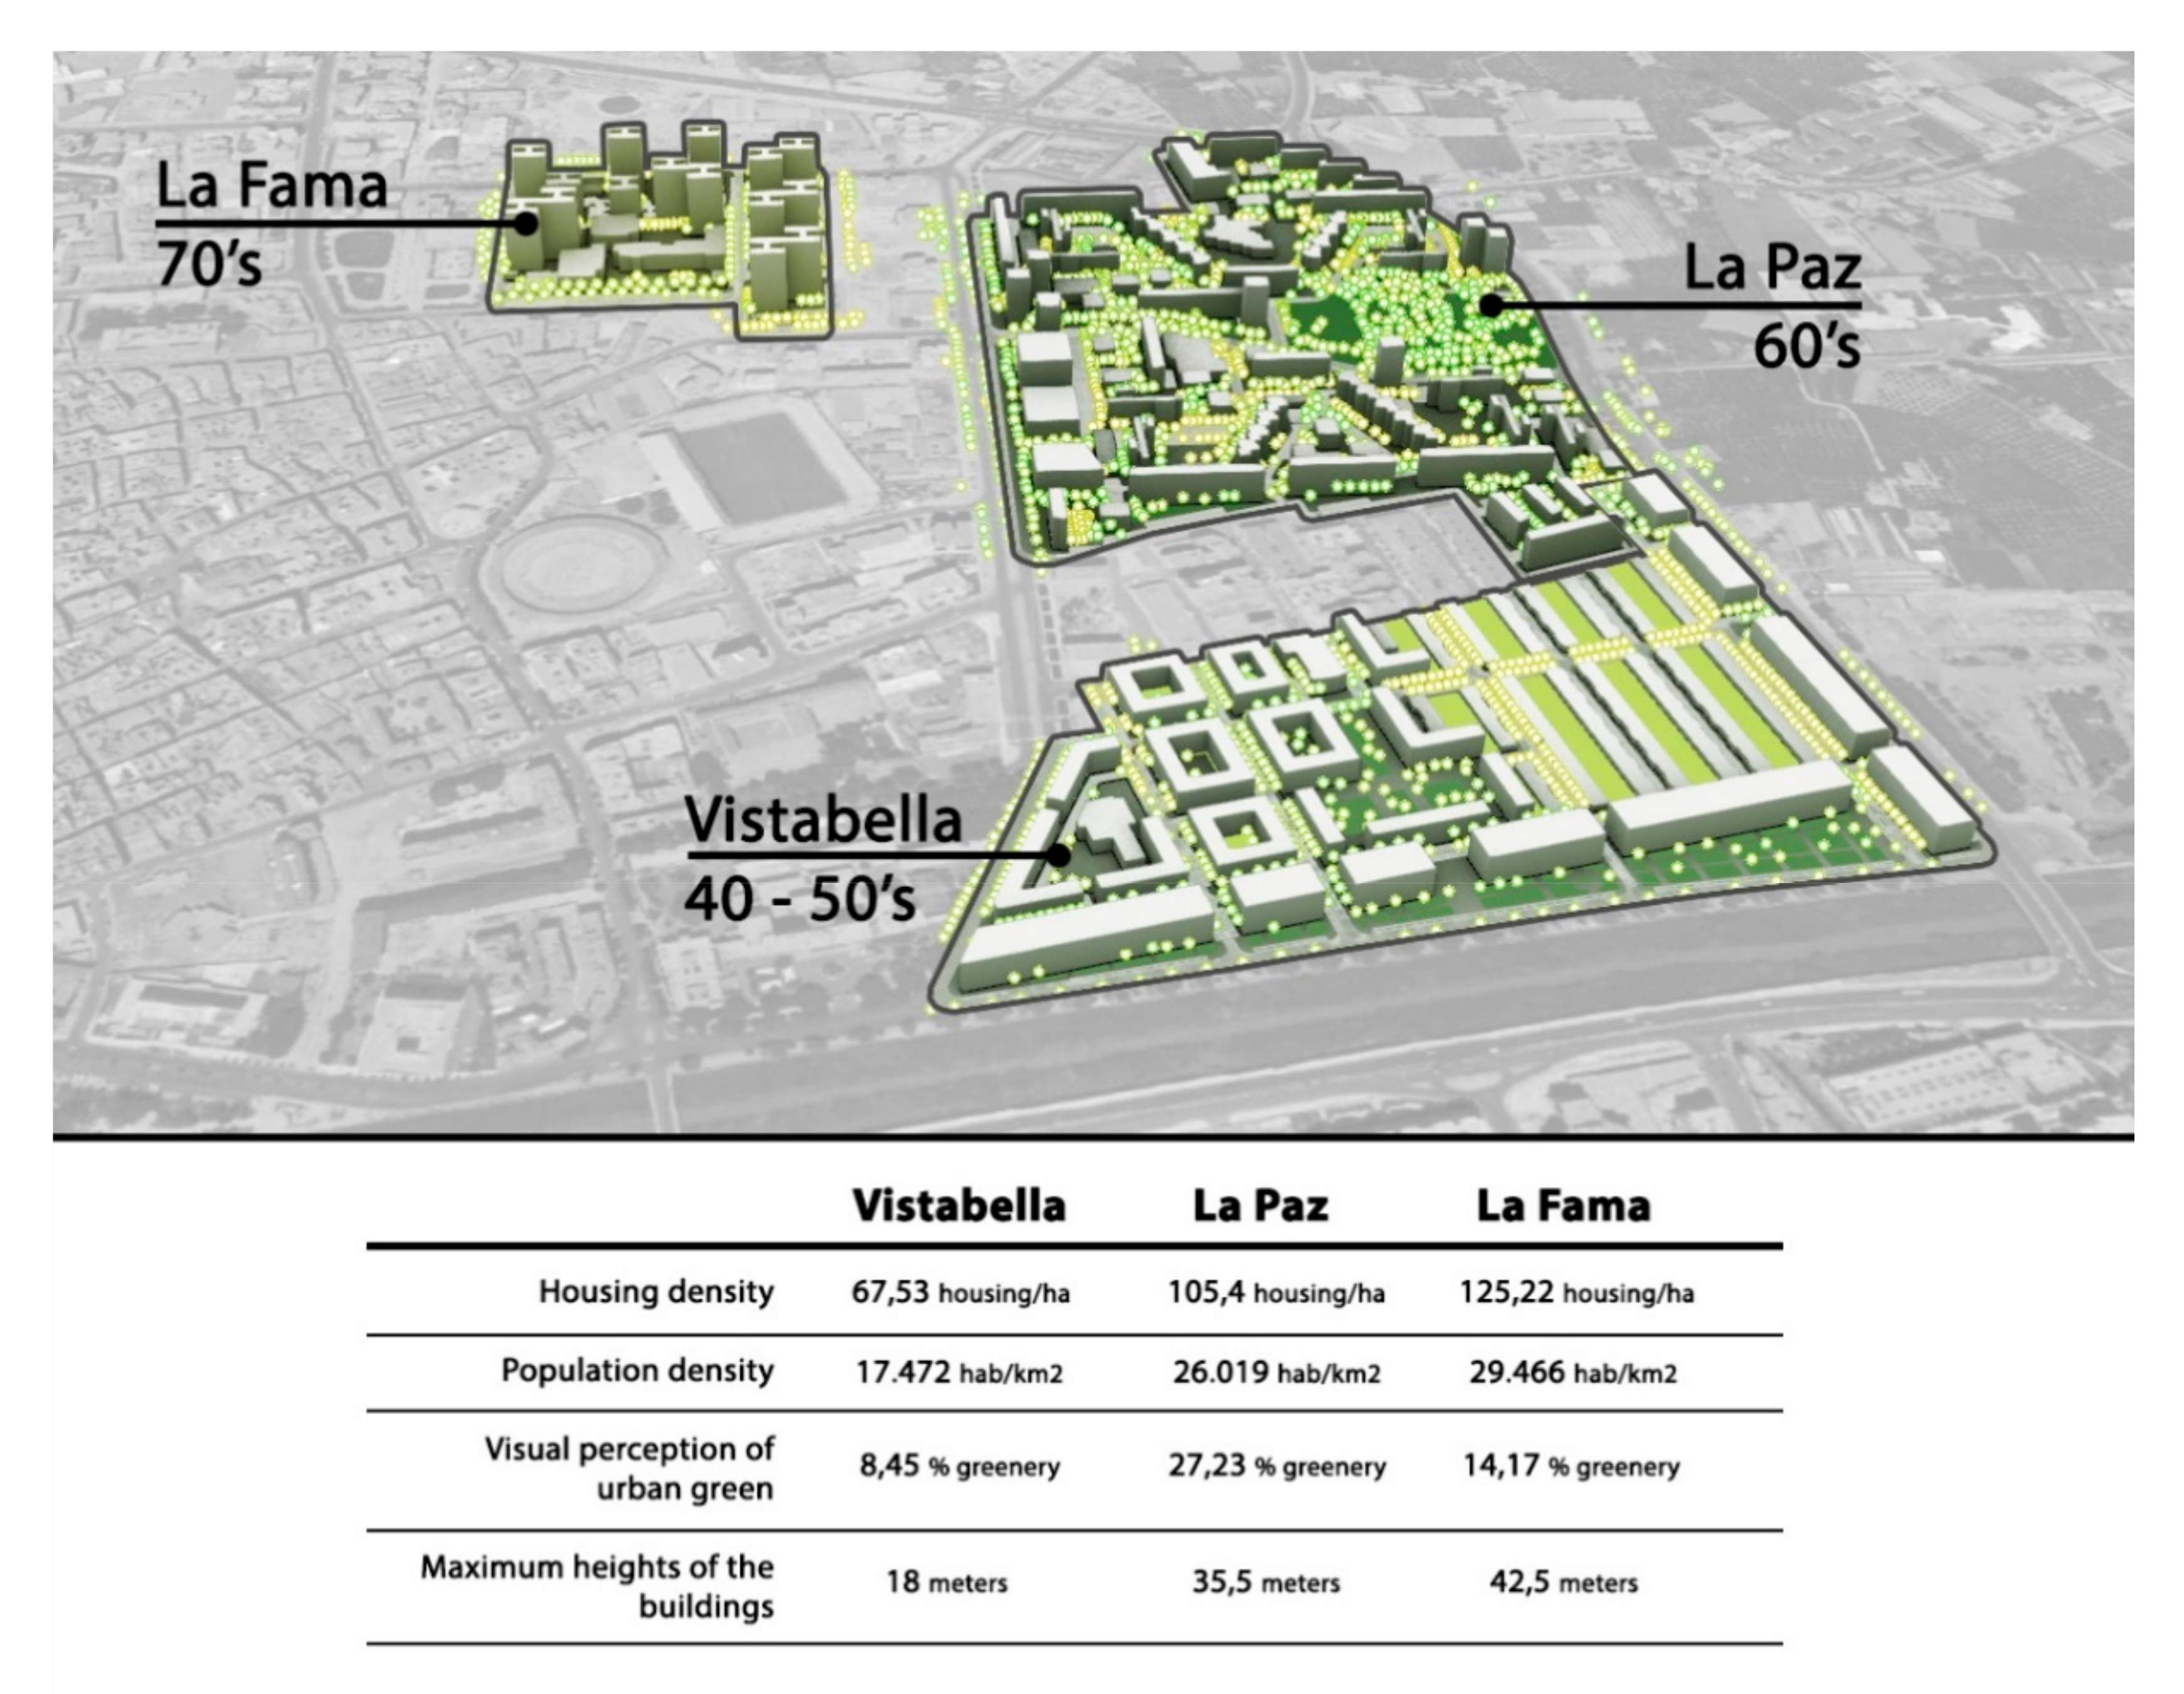
For the application of this methodology, we chose residential neighborhoods consisting of public housing built during the Franco dictatorship in Spain (1939–1975). Specifically, Vistabella, La Paz and La Fama, three projects that were located along an avenue which formed a new urban boundary that still exists today (
Figure 1). These three neighborhoods, like many of their time [
14], occupied large areas of the city and in them it is easy to detect challenges, such as socioeconomic precarity, architectural degradation or attempts at gentrification. Moreover, despite the indisputable particularities of each case, these examples can be included within the housing policies that were developed throughout Europe during the second half of the 20th century, with the aim of housing the population that mass-migrated from agricultural areas to the cities. These projects left impressive examples of residential architecture, such as the workers’ colonies in Madrid, the urban periphery areas built in the Netherlands between 1950 and 1975 and the complexes built in Italy under the Ina-Casa Plan (1949–1963). In some cities, these states were located in the suburban periphery, while in others, as in London, they were built in inner-city zones [
15]. Today, many of these settlements are the subject of renovation plans based on the Leipzig Charter on Sustainable European Cities [
16], which puts the spotlight on more down-at-heel neighborhoods, in order to enhance a more integrated experience for their inhabitants.
The first case study is Vistabella, a neighborhood that typified the fascist ideals of the peripheral suburb imposed after Spain’s Civil War. It is a municipal development that began life in the early 1940s as an autonomous set of simple single-family houses with a courtyard, in accordance with the scarcity of material means of the time. As the following decade progressed, it acquired greater density and intricacy, not only due to economic resurgence, but also as a result of being used as a propaganda tool of the regime’s beneficence [
17]. The neighborhood is ultimately made up of three building types—the patio houses with one or two floors, four-storey linear blocks and closed blocks with a large inner courtyard, in which all the units have a double façade (
Figure 2). These buildings offer an array of units ranging from 75 m
2 to 125 m
2. Finally, there is most recent type of building, which closes the neighborhood perimetrically with linear blocks of five floors and four dwellings per storey, which removes the possibility of having double orientation in all the units.
Here the public spaces are strongly hierarchical and present a remarkable complexity. There are semi-pedestrian streets with small recesses between the single-family houses, a main street that connects with principal avenues of the city, a large linear garden with well-maintained vegetation and a central square that serves as the core of the neighborhood.
The complex also features a church, a school, a market and several commercial premises along its streets.
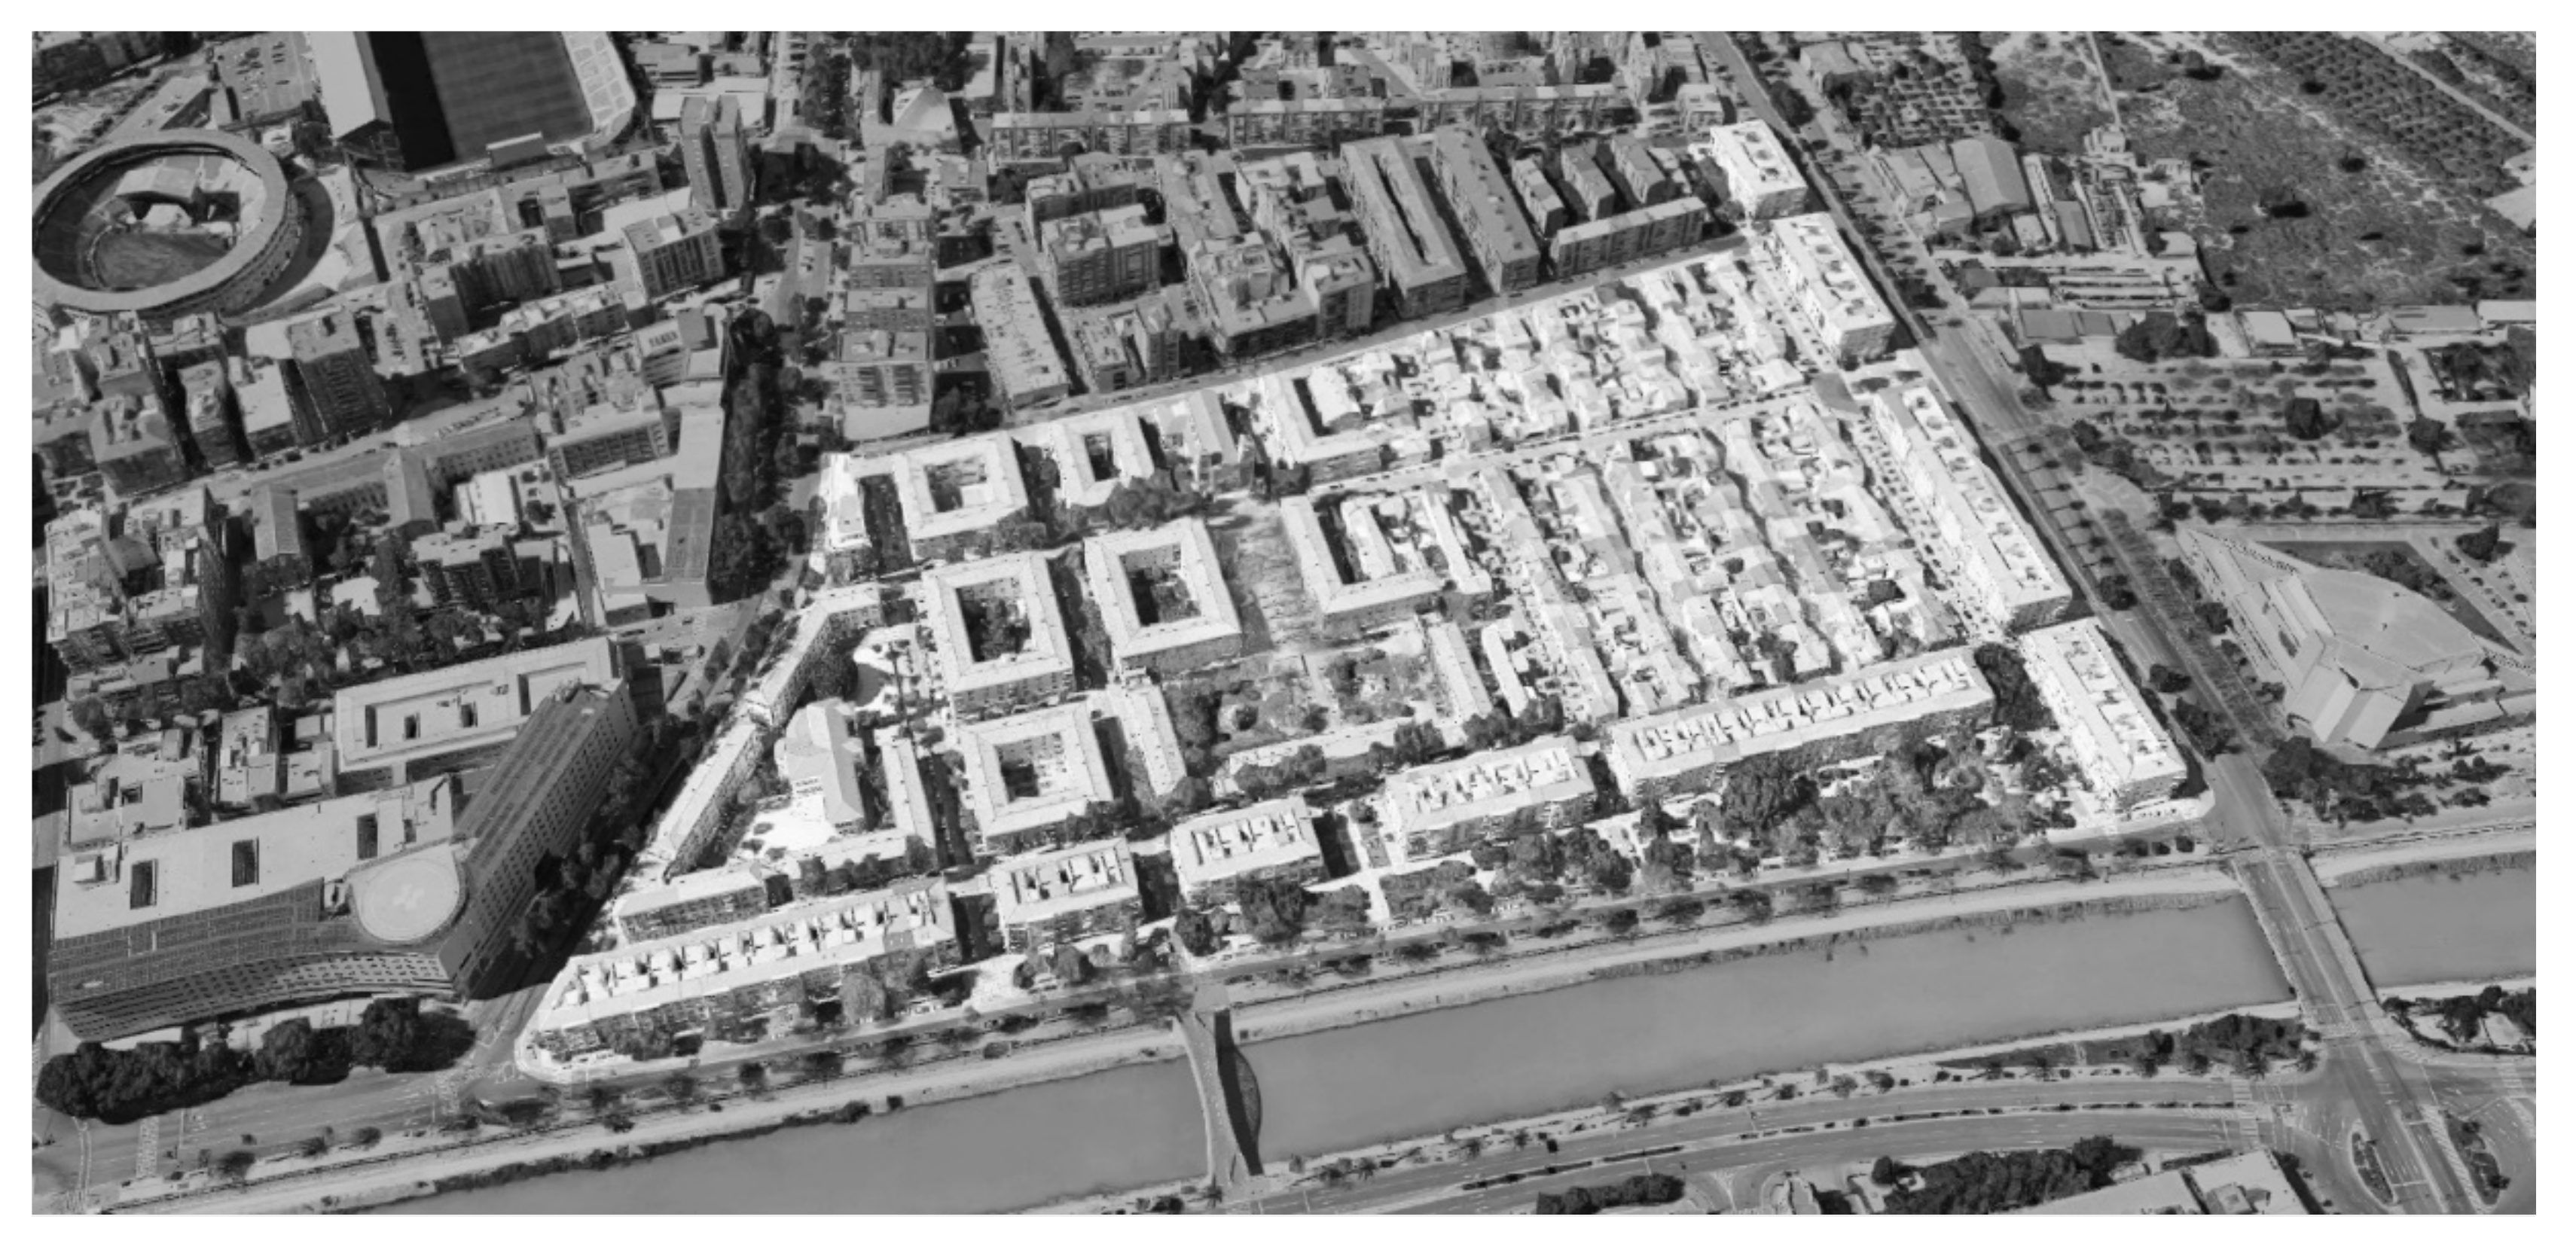
In 1962, the Obra Sindical del Hogar, a governmental institution for the promotion of subsidised housing, undertook the construction of La Paz. The layout of this neighborhood was based on the organic arrangement of the open building in which social and commercial uses are mixed with residential uses. In this case, as in Vistabella, the project included a church, commercial premises and a school. There is a high proportion of free public space (74.5%) compared to that occupied by the building [
18]. In this case, the geometry of the group of buildings complicates the use and interpretation of the free space due to the continuity of informal voids, which give an anarchic and disorderly character to the urban landscape [
19] (
Figure 3). In this neighborhood, the housing stock is homogeneous with only two variations. One measures barely 45 m
2 and has been developed in different formats depending on whether it is in a tower, linear block or block with courtyards, while the other is 65 m
2 and can be found in one of the three wings of the T-blocks. There are buildings that range from three to six storeys high, as well as six towers of ten floors that mark a kind of visual axis in the central part of this extensive neighborhood.
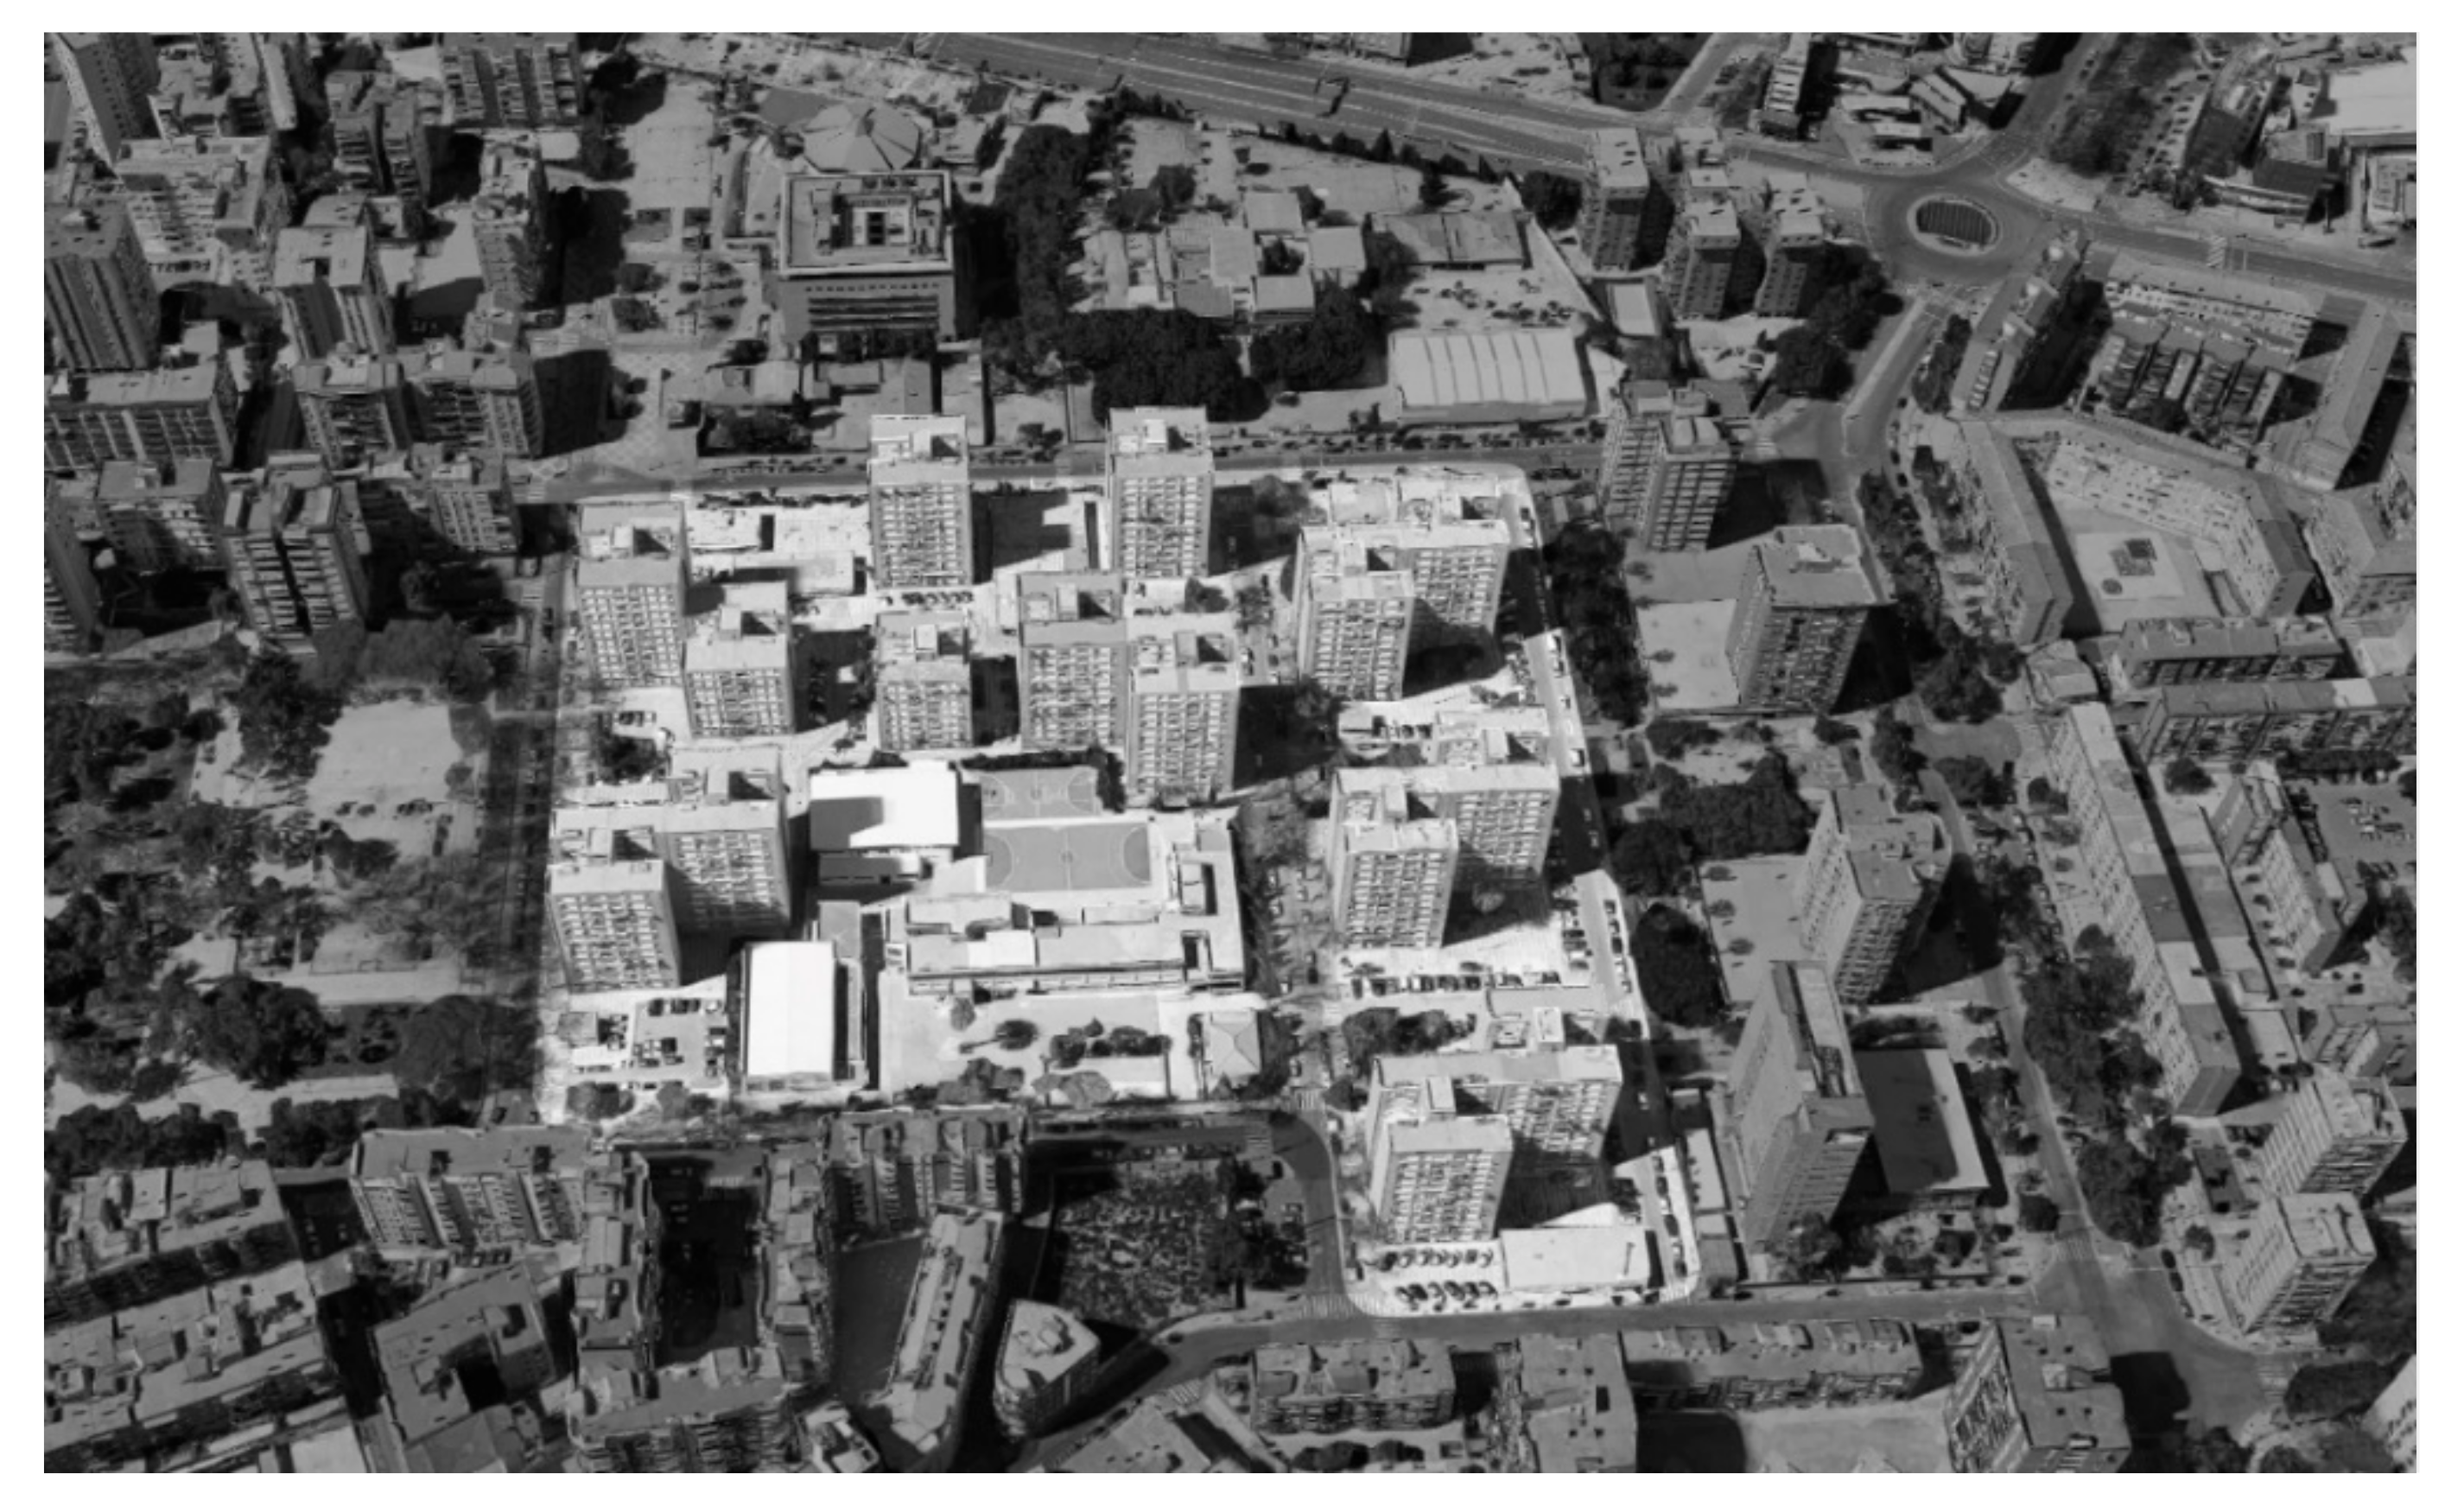
Finally, in the 1970s, the Ministry of Housing developed the La Fama housing estate, based on an open block typology composed of towers up to twelve floors high. Between these residential buildings there are one-floor units for local facilities. In this case, the free public space is constituted of small squares at the foot of the double H-blocks that separate them from road traffic and provide a neighborhood meeting space (
Figure 4). As in the previous estates, there is a school and commercial premises which, like in La Paz, are in buildings dedicated exclusively to this use. This project formed part of the mass housing policy of the time and so is essentially homogenous. Therefore, in this complex all the dwellings are the same and are symmetrically distributed around the central communication nucleus. Here the units are 75 m
2 and all have a north–south orientation.
2. Materials and Methods
The methodology designed for the analysis of the three public housing complexes seeks to map the reality from their domestic usage to go beyond their recognition as urban objects, and to try to fathom the relationship that exists, in the present day, between the built form and the use made of it by its inhabitants [
20]. For this reason, a double perspective is used, combining the objective observation of the form and the subjective perception of the life that takes place within it. Urban disciplines have already taken on board the need for more qualitative research to successfully measure intangible issues such as community identity and perceptions of quality of life [
21]. It is therefore very interesting to combine quantitative and qualitative techniques in a given assessment to ensure that their respective strengths are exploited. Indeed, qualitative research allows us to interpret objective data that sometimes provide a portrait of reality that can sometimes be disconnected from personal perceptions [
22].
“No system of indicators can reduce the reality of cities to a numerical consideration, no matter how powerful the system and how sophisticated the methodology used. It can, however, offer valuable interpretative tools” [
23].
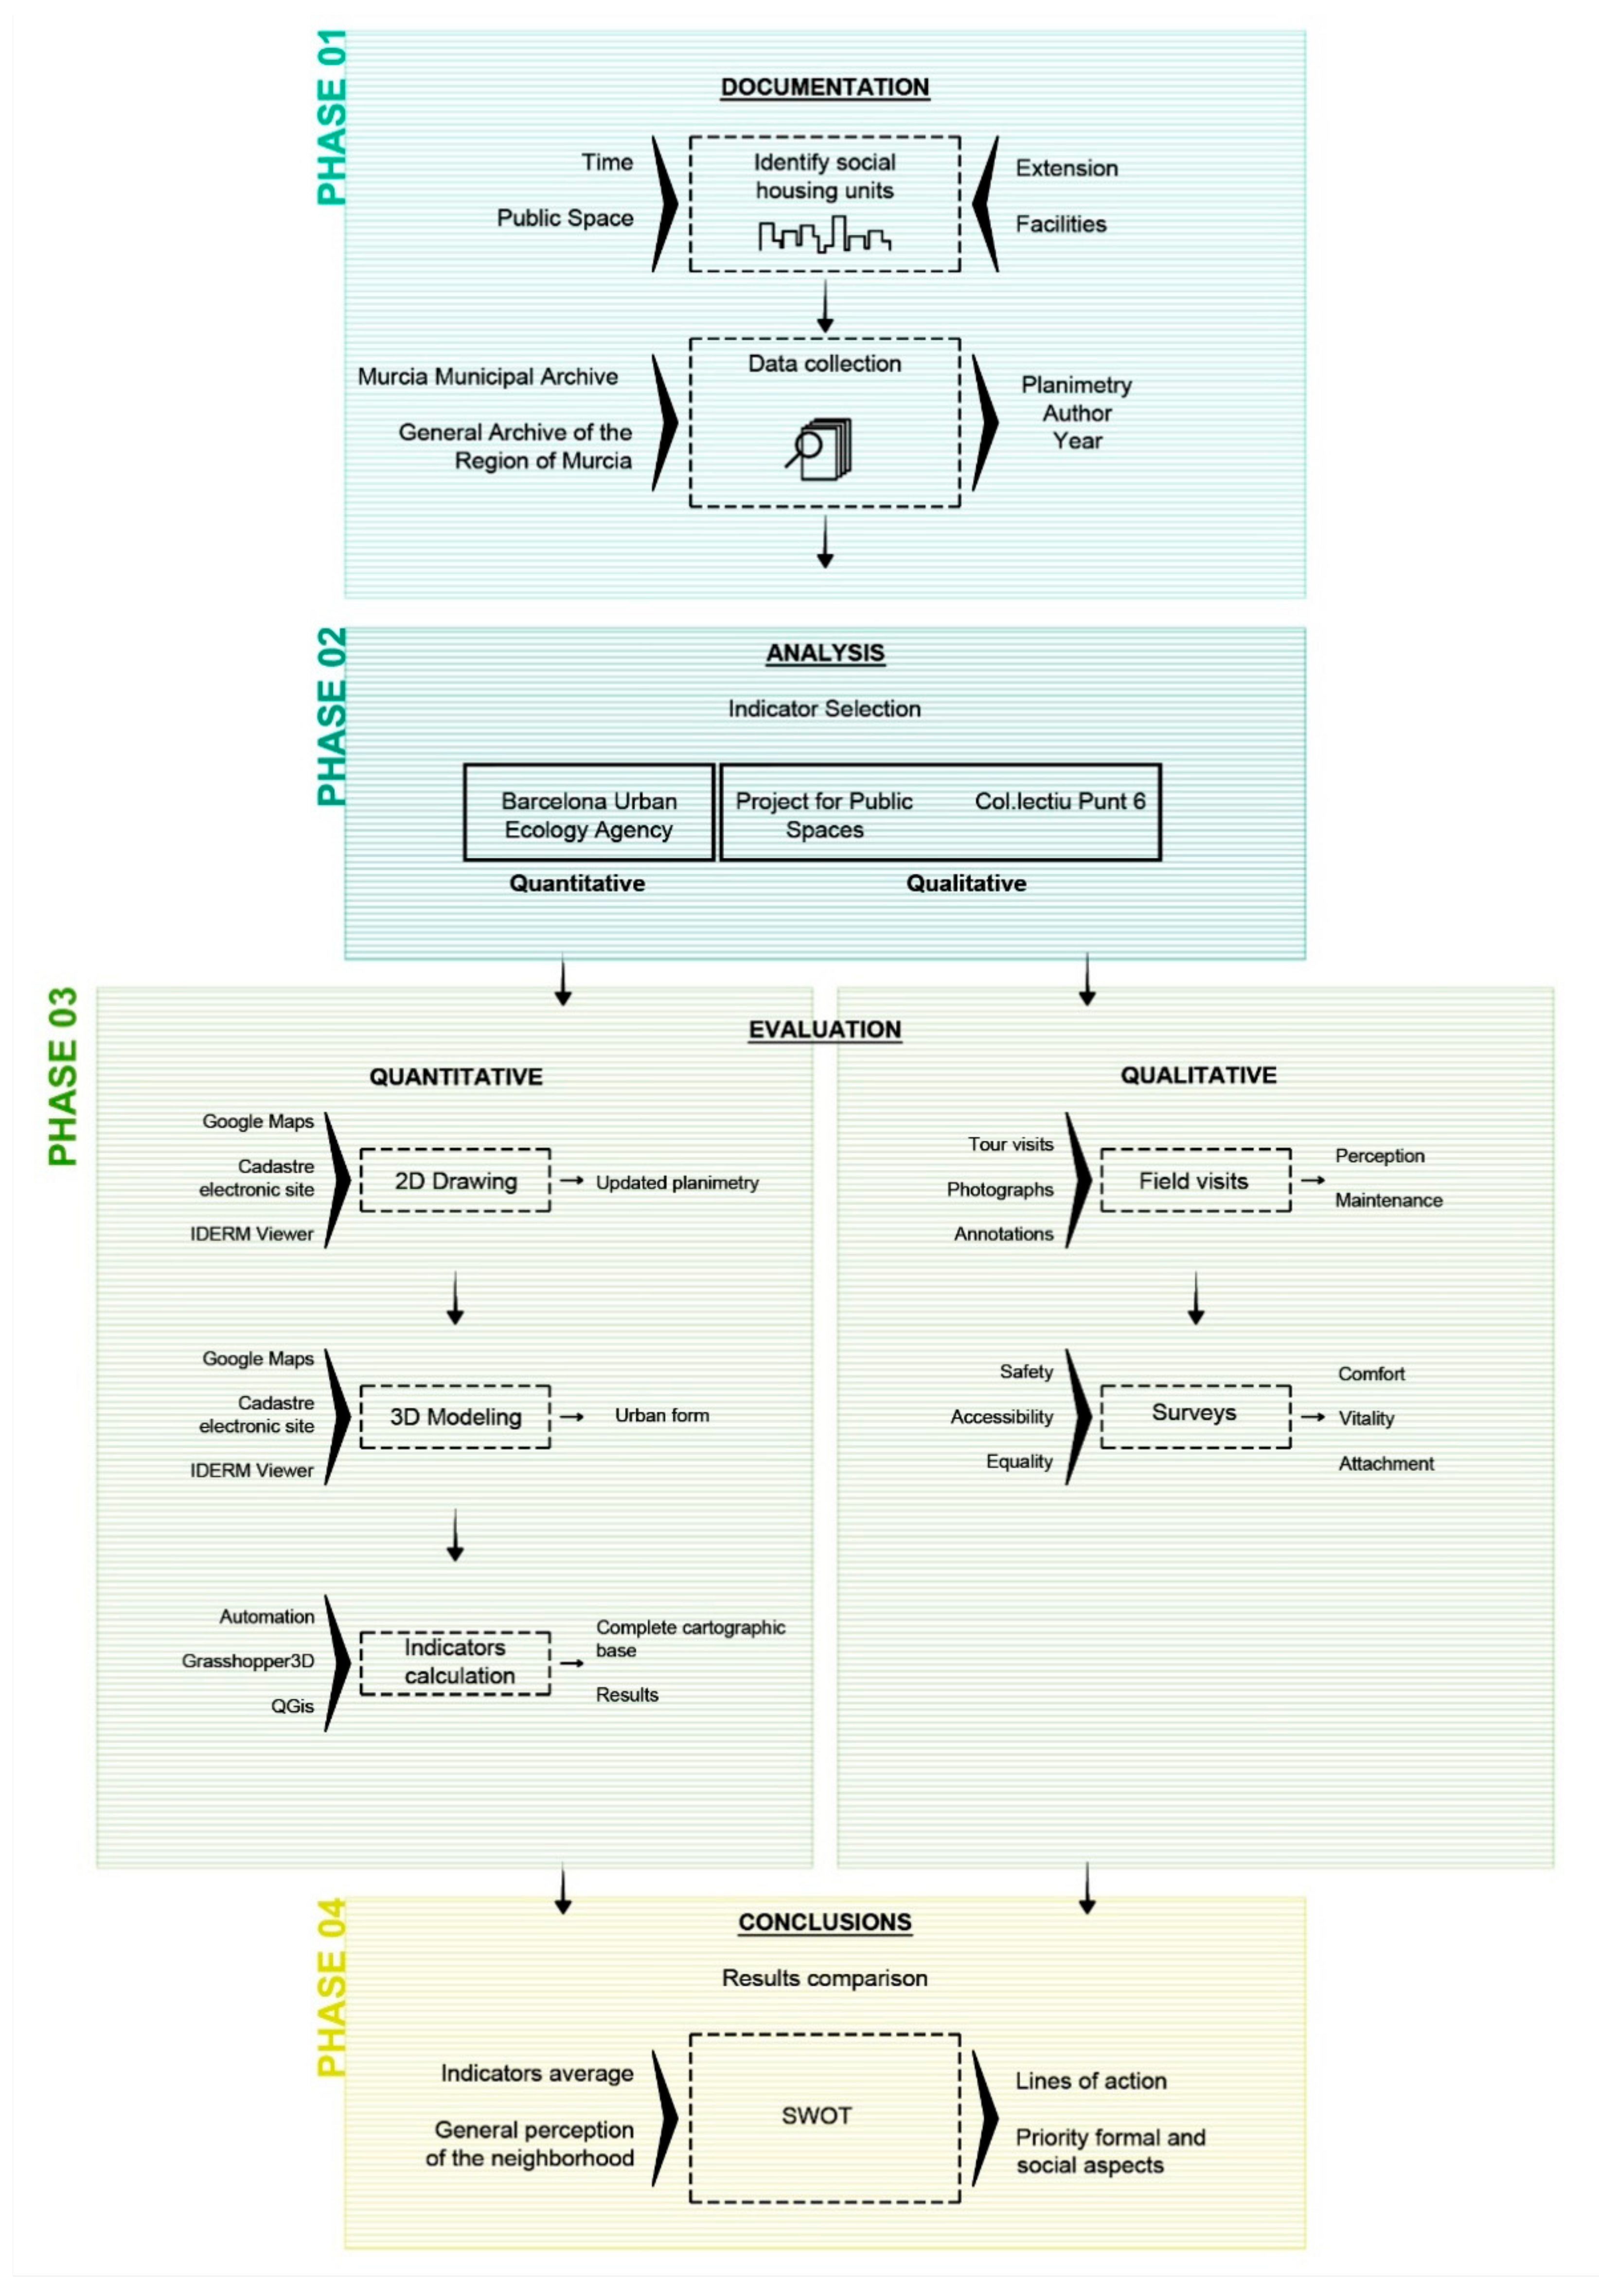
This methodology was developed in four phases: Documentation, analysis, evaluation and conclusions (
Figure 5). As part of the first phase, we needed to identify the public housing estates that were to be the focus of our study. For this purpose, we chose estates that were large enough to form sections of the city, as they had been built during the second half of the 20th century. In addition, they had to have public facilities and spaces. With our selection made, we proceeded to search for original documentation in various archives and then categorised and catalogued all the data.
In the second phase, the indicator systems that best suited the purposes of our research were chosen, both at an objective and quantitative level and at a subjective and qualitative level. The quantitative (urban form) and qualitative (perception) evaluation described in
Section 2.1 and
Section 2.2 were carried as part of the third phase.
Finally, in order to obtain an overall view, the average results were compared by means of a SWOT analysis, from which we could deduce priority action points.
2.1. Quantitative Research
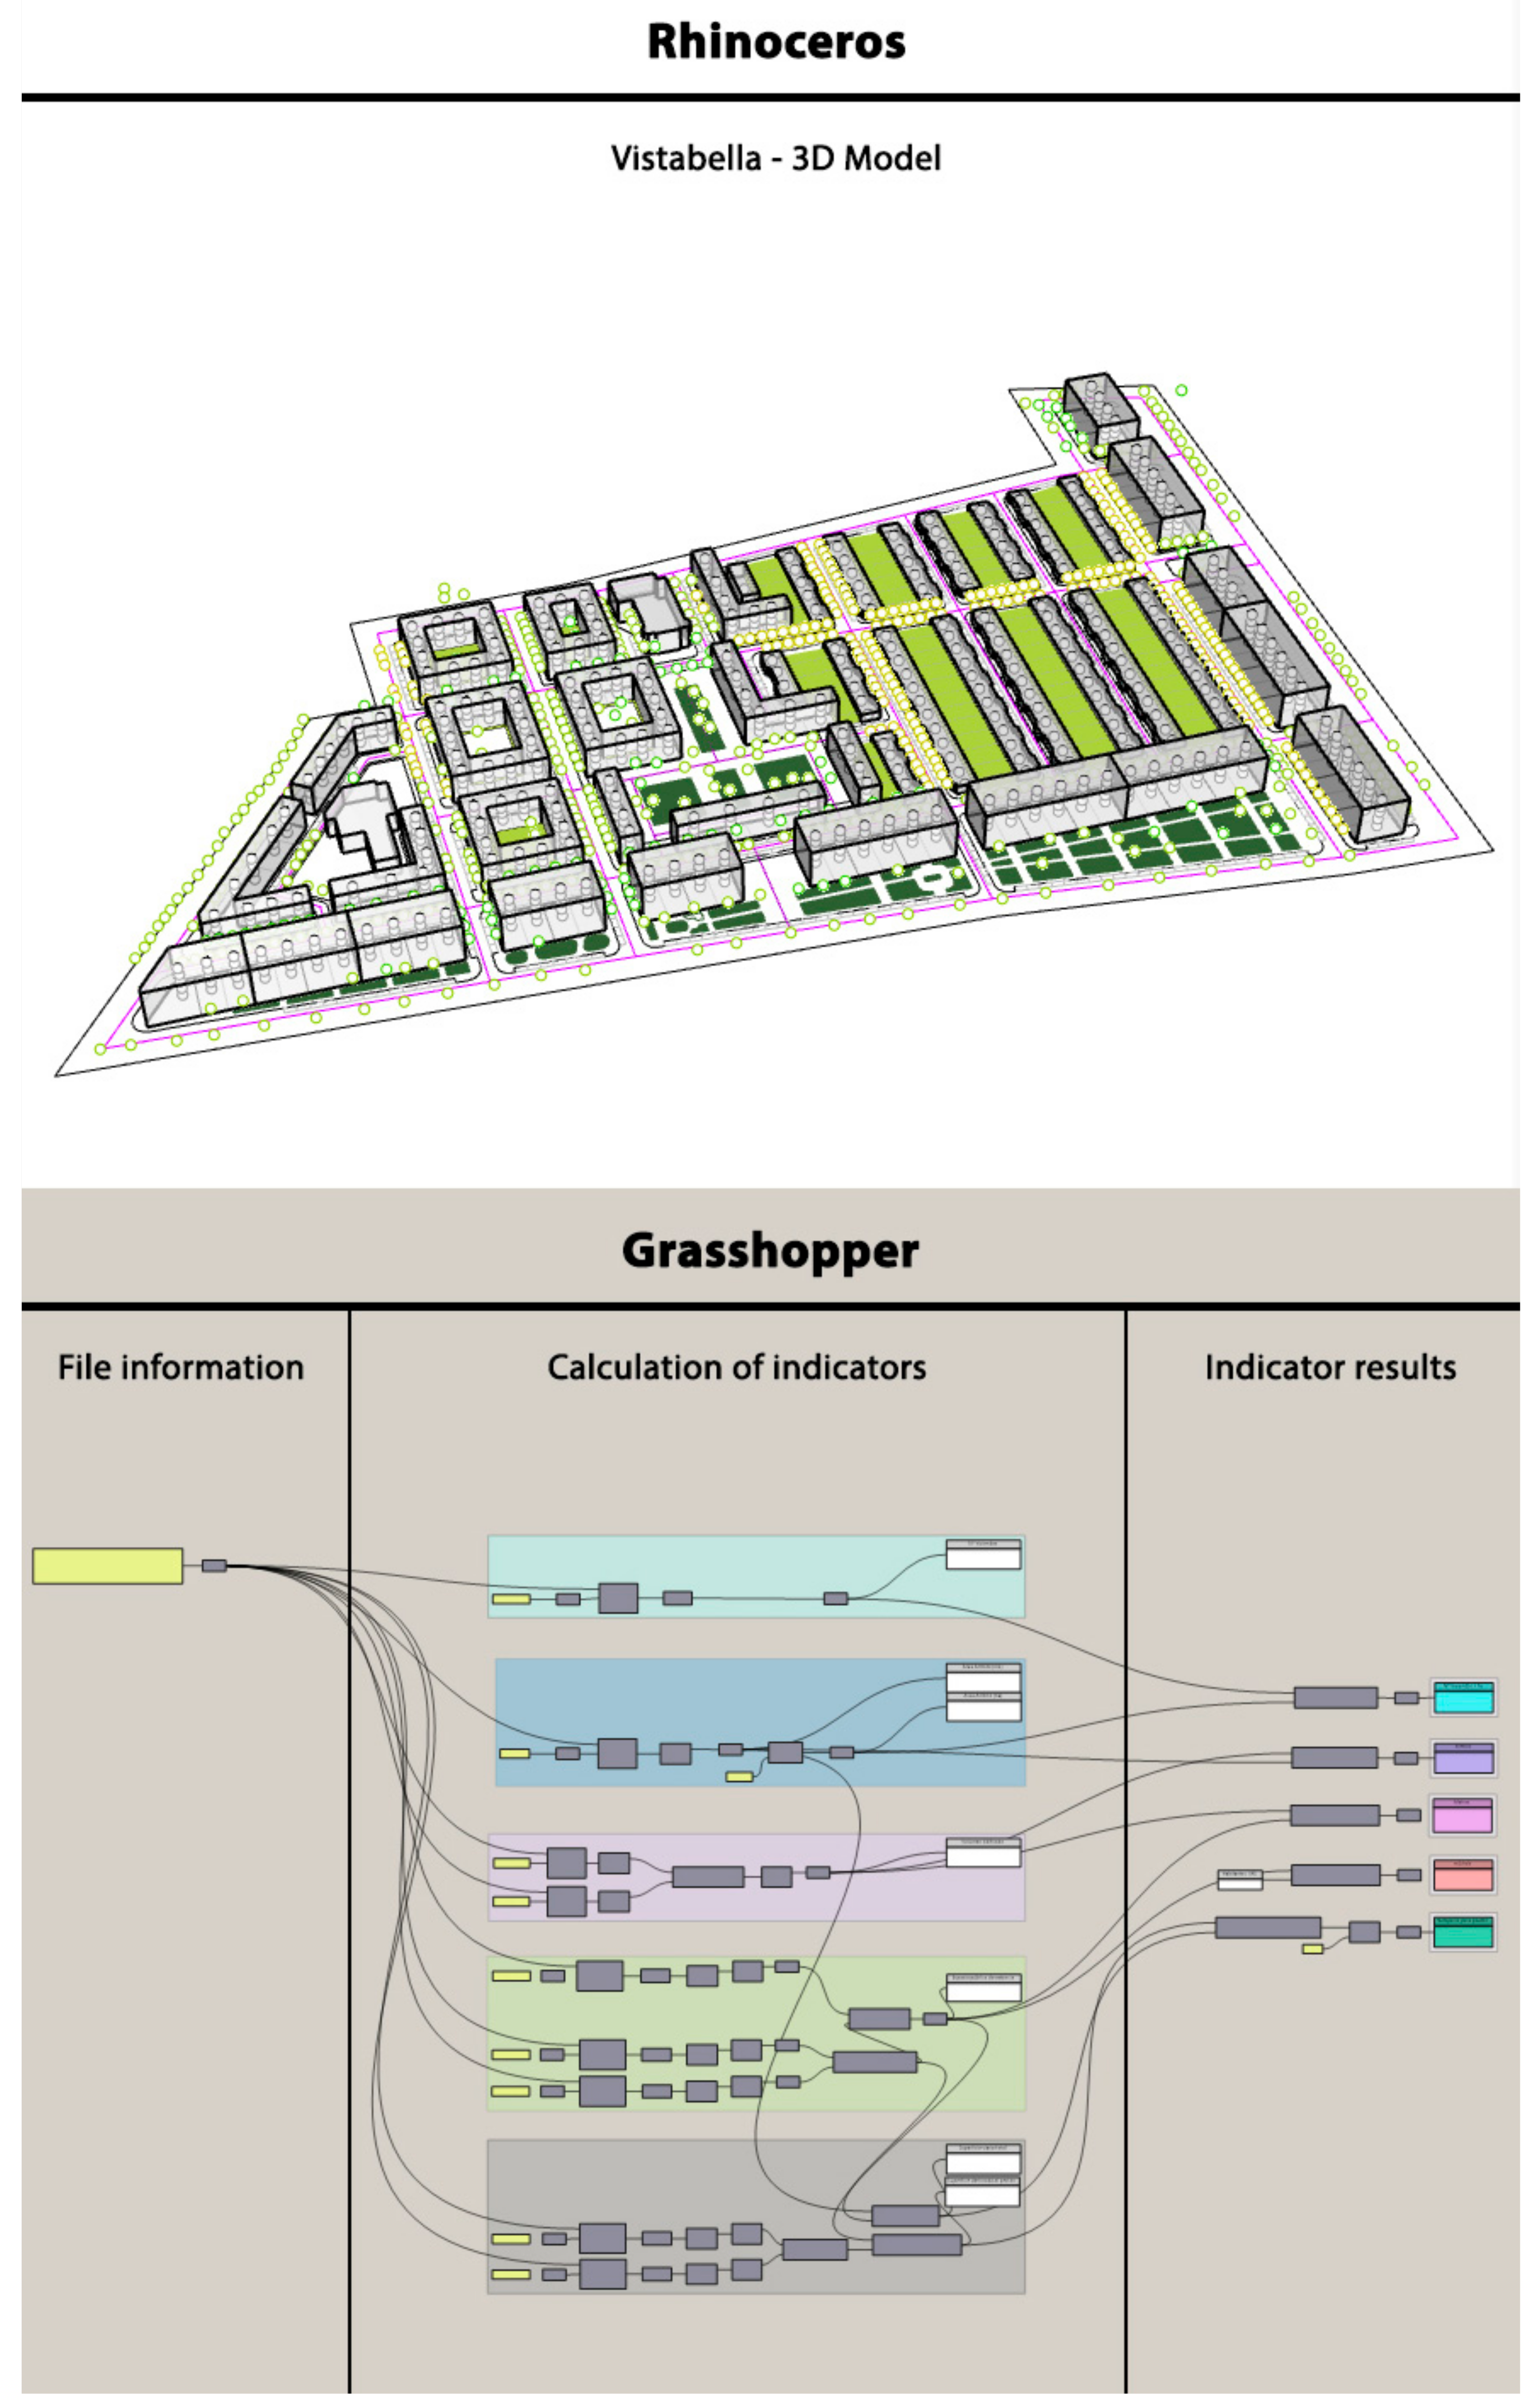
The quantitative research was based on the digitalisation and updating of the original urban planning using computer-aided design (CAD). On this digital basis, 3D modeling has been applied to analyse different parameters of these neighborhoods by means of algorithms in visual programming language, using Rhinoceros software tools along with its plug-in Grasshopper (
Figure 6).
These digital tools allow us to access the automatic calculation of the indicators that the Agència d’Ecologia Urbana de Barcelona (BcnUEA), on behalf of the General Directorate of Land and Urban Policies and the Secretary of State for Housing and Urban Actions of the Ministry of Development of the Spanish Government, makes available to us [
24]. This document is a methodological guide that, “based on the principles of territorial and social cohesion, energy efficiency and functional complexity, and taking into account the common goals of public policies for a sustainable urban environment”, provides us with the ability to quantitatively evaluate neighborhoods on an urban scale.
From the fourth part of this document, which is called “Indicators and determining factors for developing systems for auditing, accreditation and certification of the sustainability and quality of the urban environment”, we were able to select and extract those indicators that we wanted to apply to the neighborhoods in our study.
To calculate each of these indicators, the administrative boundaries of each neighborhood were defined as the scope of action, and the calculation parameters were applied with the necessary technical considerations to obtain evaluable and comparable results.
As a summary of these calculations, individual files were prepared for each indicator and by neighborhood. These sheets include, graphically and numerically, the requirements for accrediting and evaluating each concept.
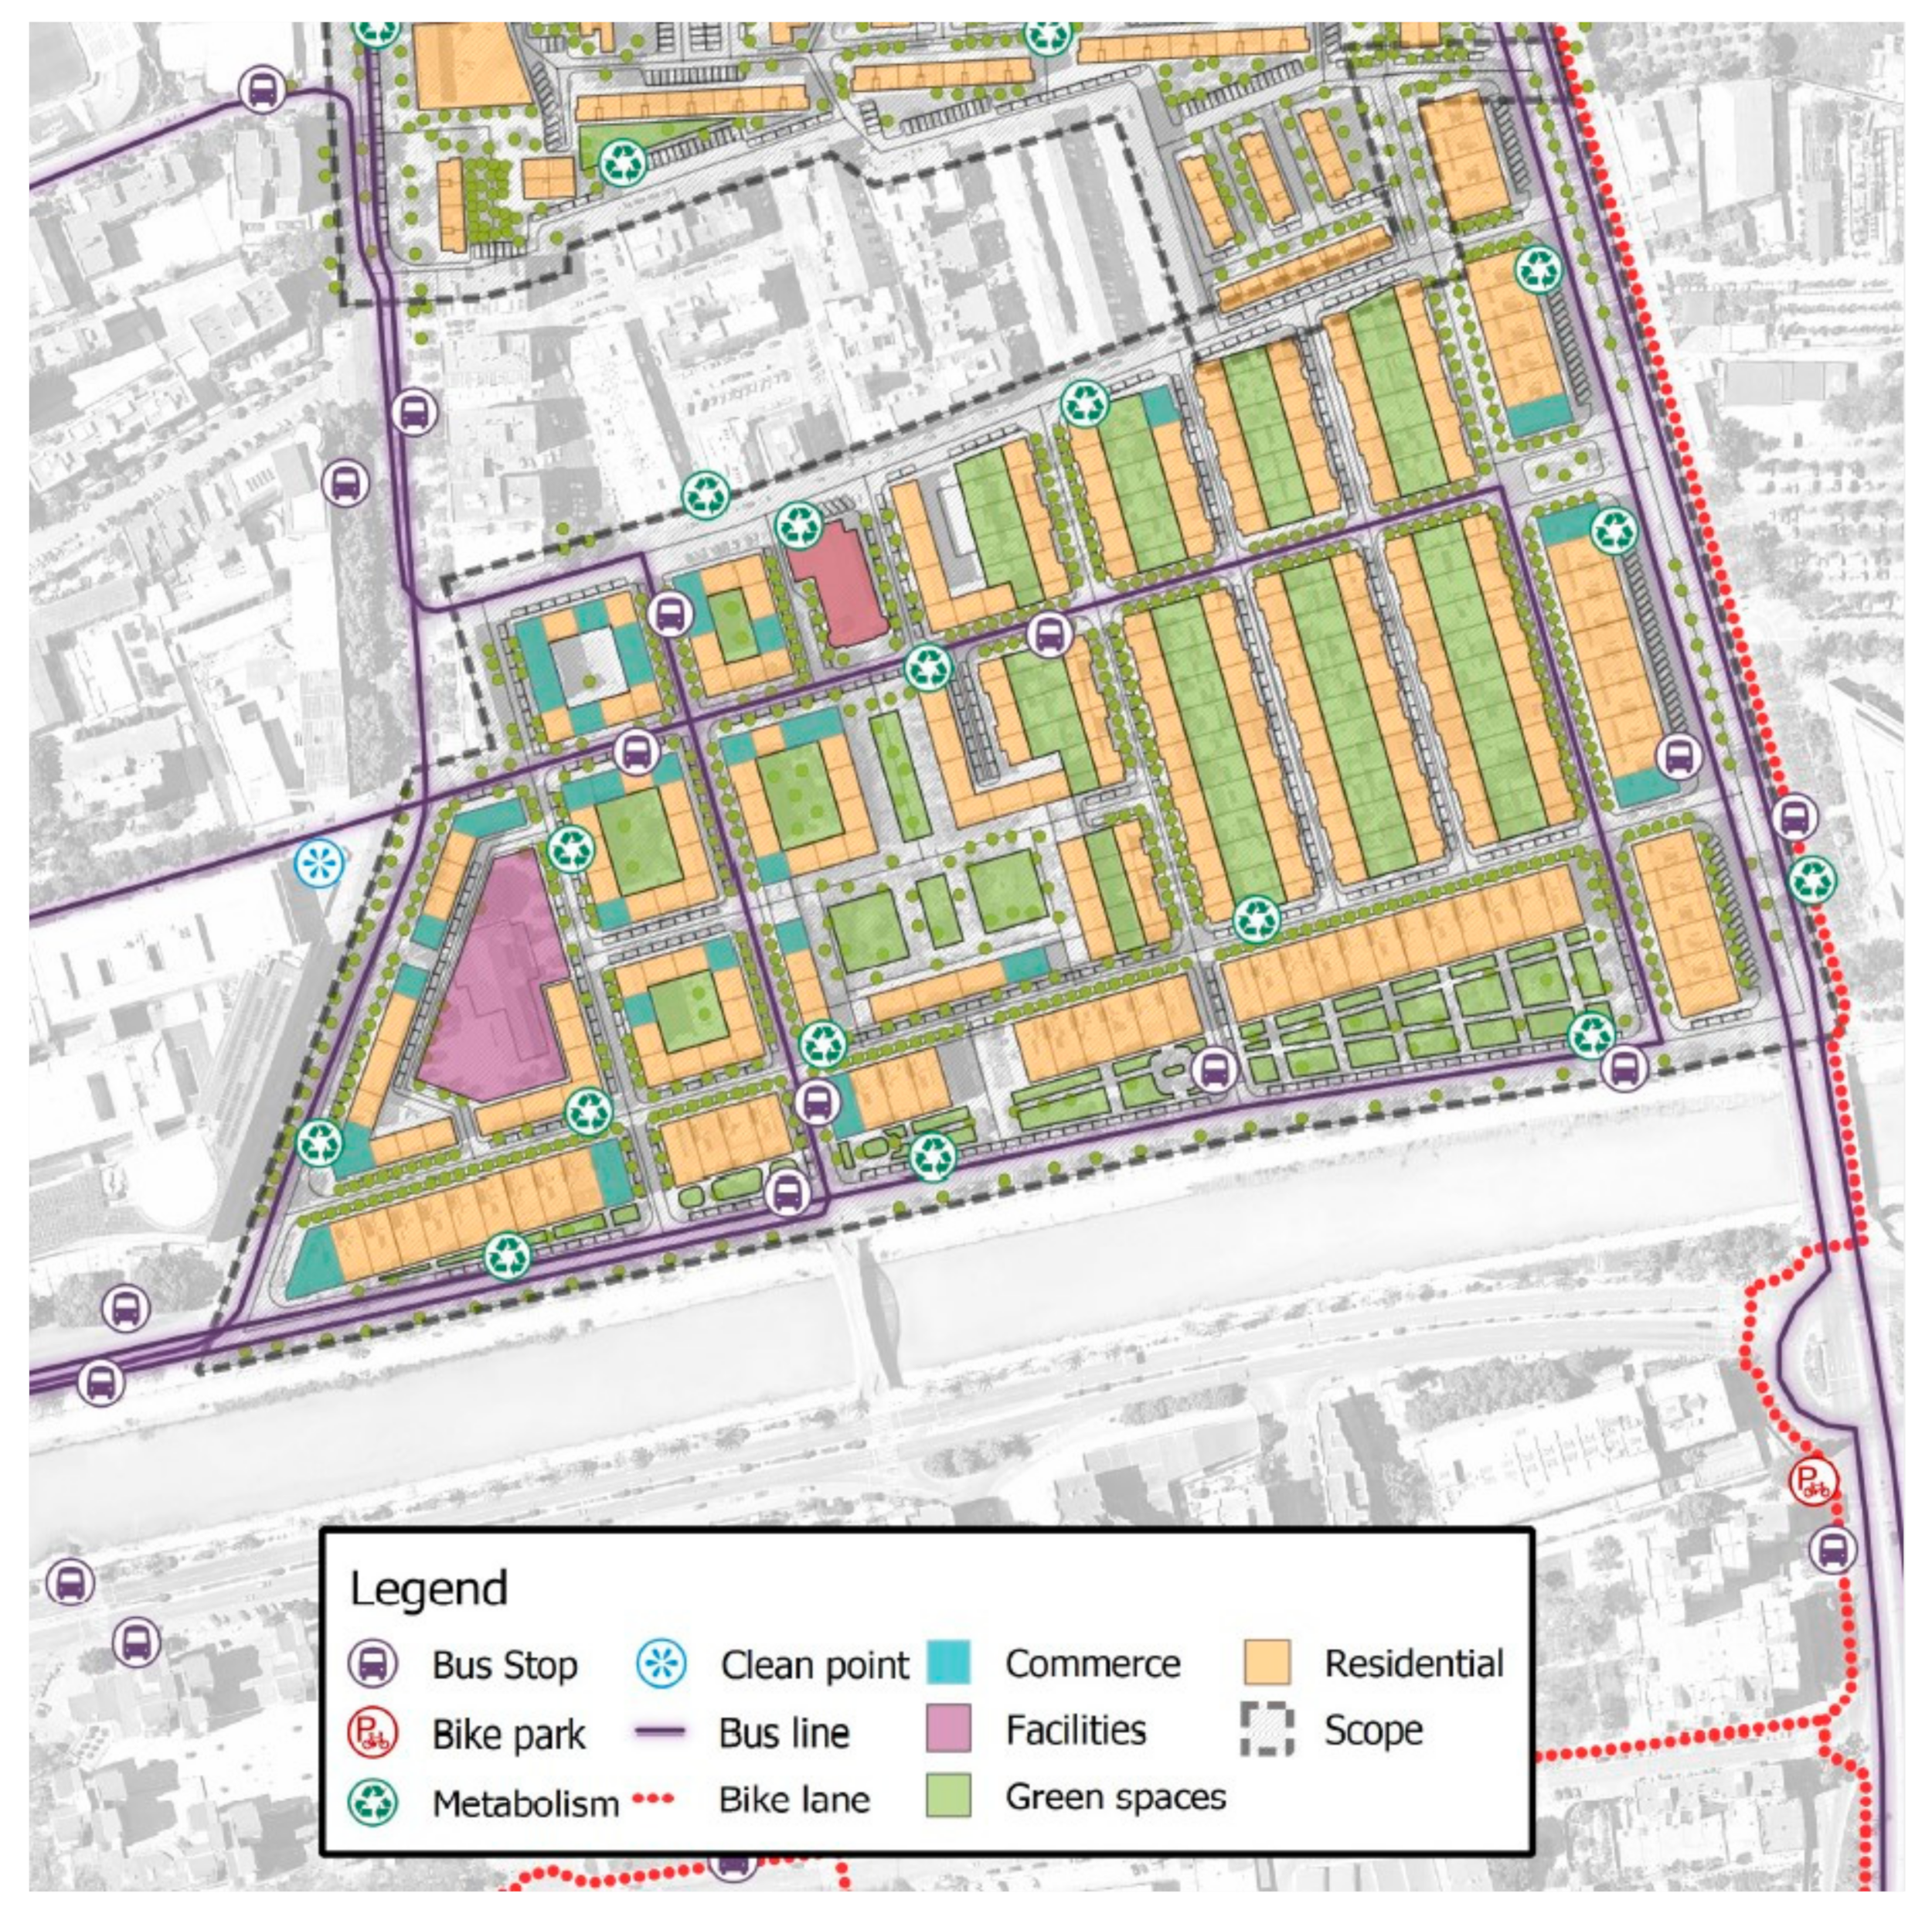
In QGis, an output of the data obtained in Rhino, we applied Grasshopper, which allowed us to organise the data in layers with graphical and numerical information to massively analyse key aspects of this research. The layer structure is shown in the legend of
Figure 7. Within each of these graphic layers there is a data column as shown in
Table 1.
2.2. Qualitative Research
Exclusively addressing the formal aspects of the city is not sufficient for understanding its lived reality, so we complemented the evaluation of these areas by bringing in factors related to daily life, to look at the uses and the effects produced by these spaces.
For this qualitative evaluation, the study relies on two complementary indicator systems. On the one hand, those developed by the non-profit organisation Project for Public Spaces (PPS) [
25] related to the use and appreciation of a given urban space. The PPS system measures the sense of belonging, which is closely linked to the residents’ commitment to the good use of their built environment [
26].
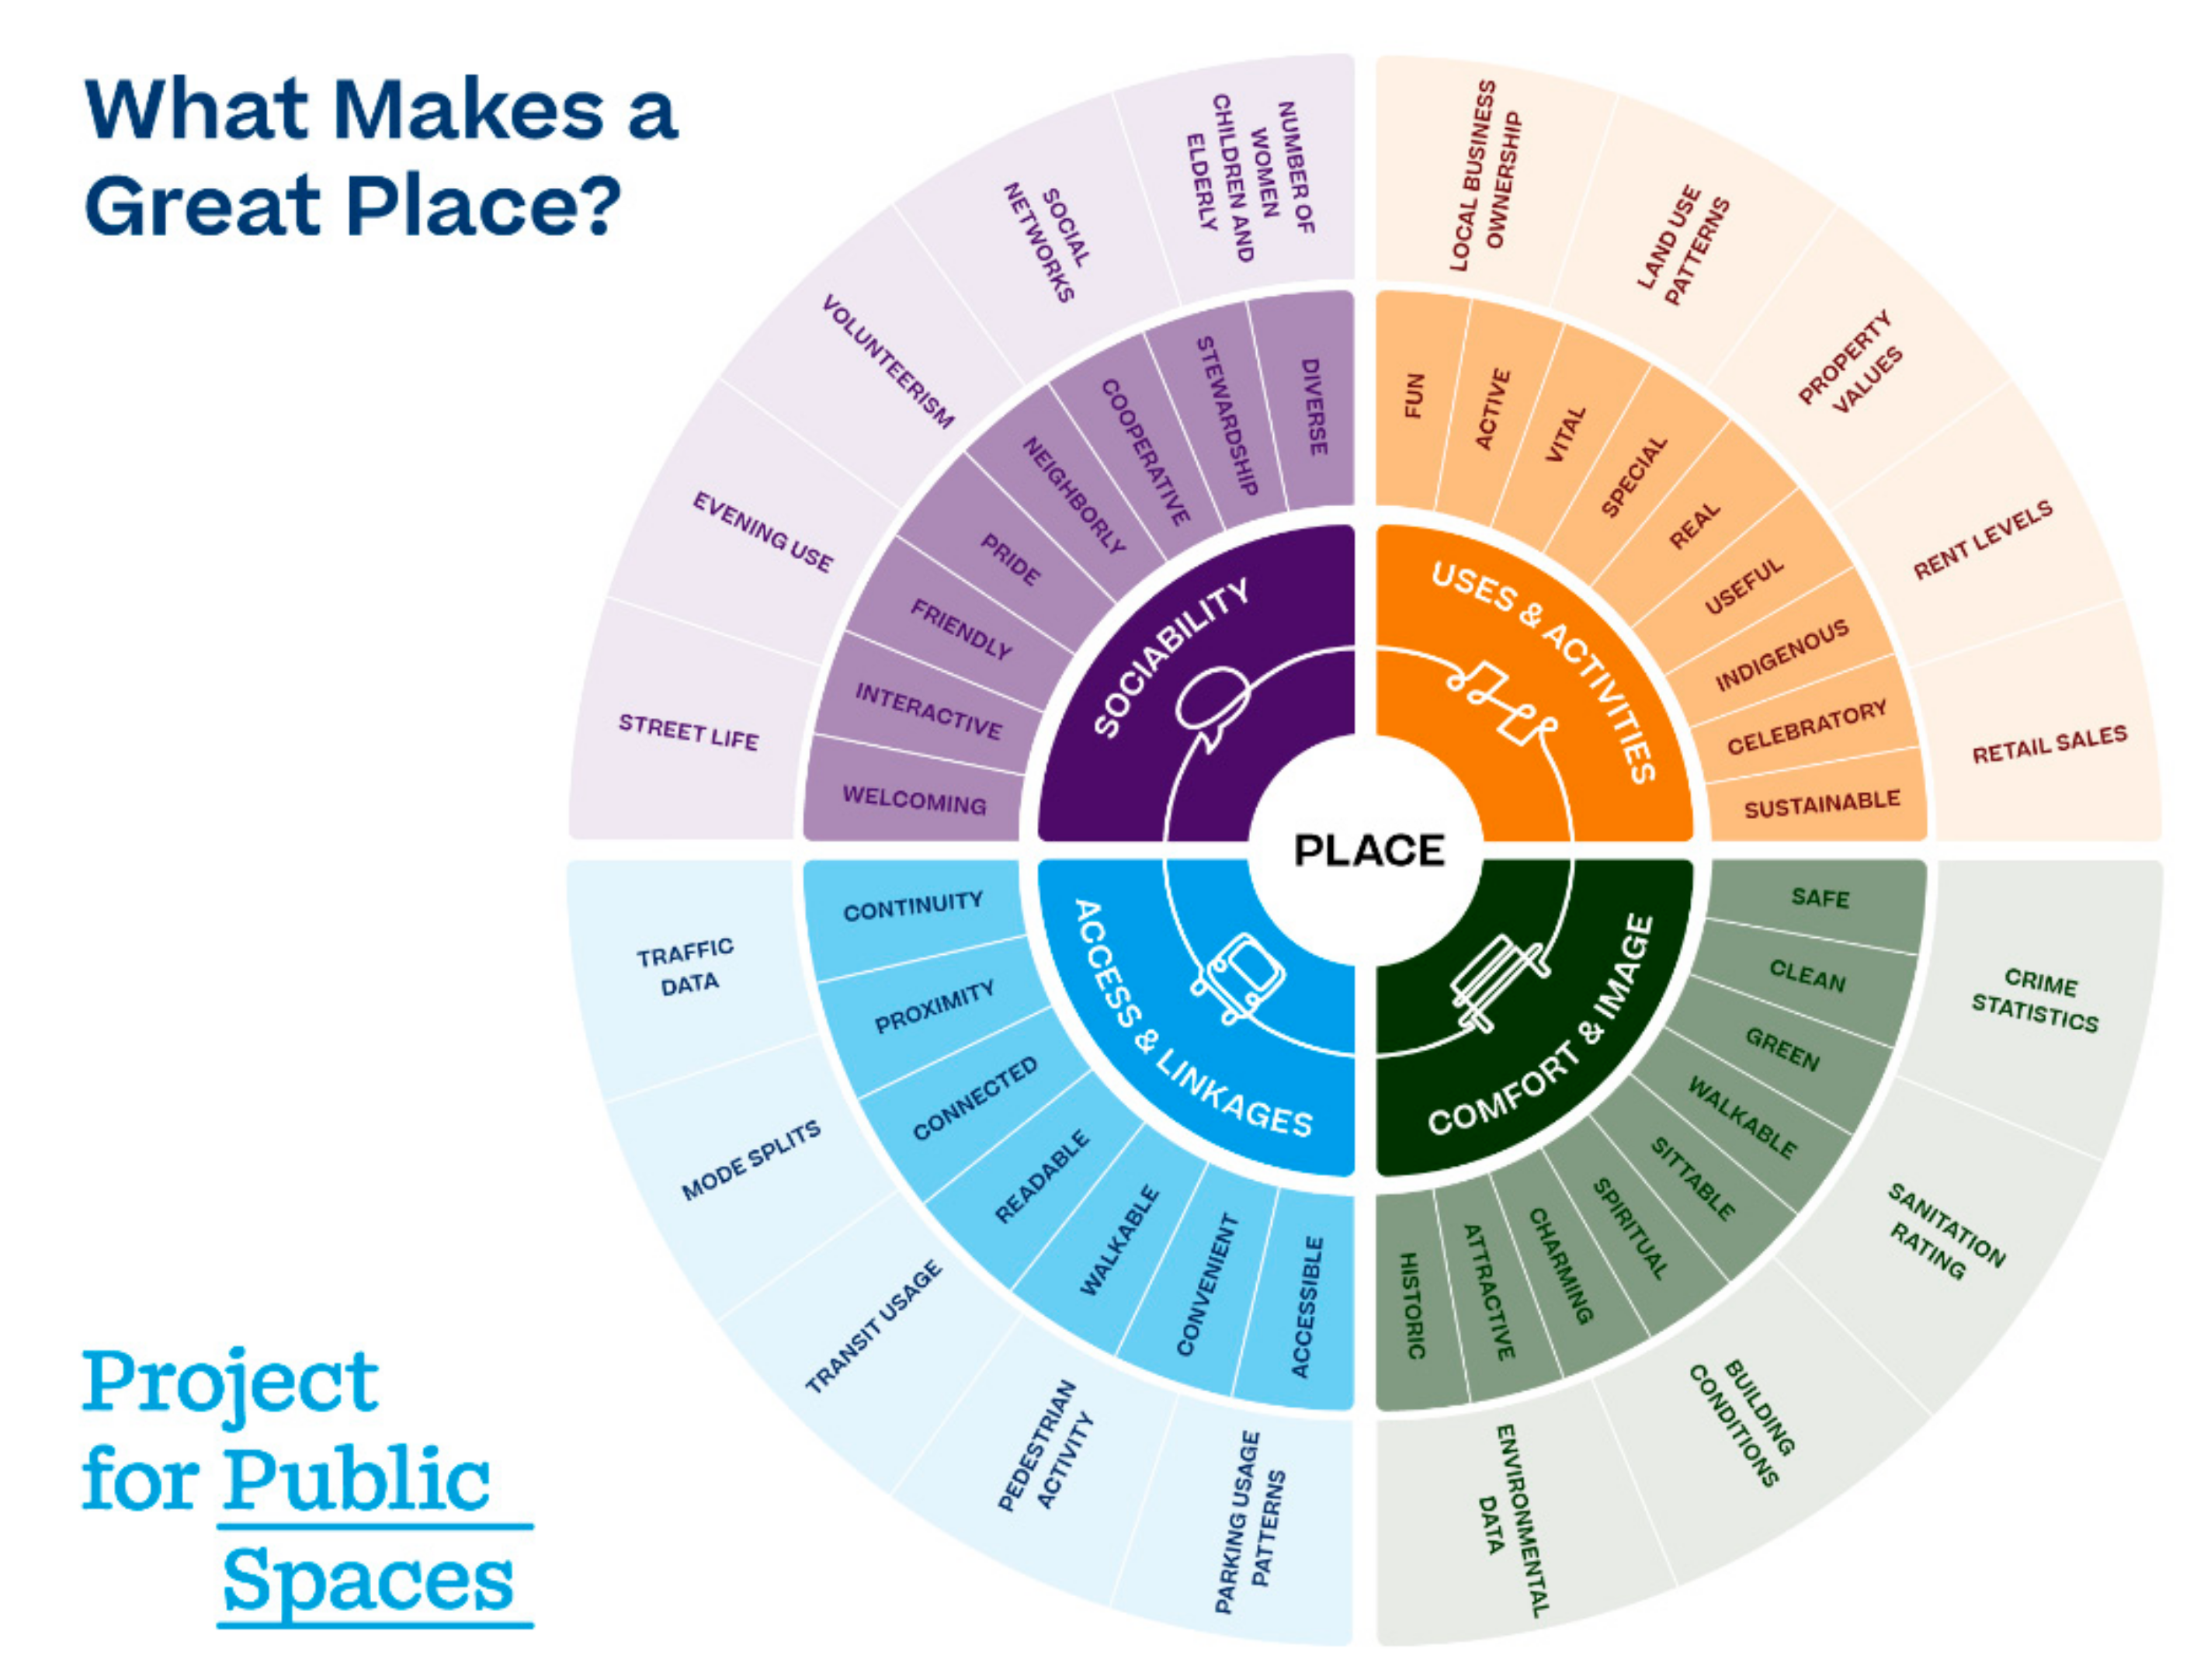
The place diagram shows the four aspects that PPS takes into account to arrive at an urban quality ranking (
Figure 8). This tool developed by PPS evaluates whether a public space includes any of the qualities necessary to engender a sense of attachment and whether this attachment is actually produced. This tool has been developed from the observation of thousands of places around the world and has established a series of common criteria that help us to determine an area’s quality in terms of use and appreciation by users. The method takes the form of a questionnaire organised around four major themes: The degree of sociability observed, the number and diversity of uses and activities, the sense of comfort and the image it conveys, and the effectiveness of its access and linking points.
The PPS questionnaire allows us to analyse the access and connections of each complex according to the visibility of the space from the outside, its connection with adjacent buildings or whether there is a sufficient variety of public transportation, among other things. In terms of comfort and image, it allows us to address aspects such as the first impression produced by the place, the cleanliness of its spaces or whether the motor vehicle takes dominance over the pedestrian. Uses and activities, along with sociability, are also important points addressed by this method with questions that afford us an in-depth observation. It deals not only with the place and its infrastructure, but also with its inhabitants and their daily life, through means of questions about the ages of the users of the space, whether they are in groups or alone, which parts of the space are used and which are not, whether people know each other by face or name or whether people use the place regularly and out of choice. The entire questionnaire offered by PPS has been considered for this research.
To complete our analysis, we used the Urban Quality Audit with a Gender Perspective (UQAGP). This is an urban evaluation tool developed by Col.lectiu Punt 6, which enabled us to broaden our perspective on the role of gender in urban spaces by scoring against a series of social, physical and functional factors [
27]. This helped us to extract values related to the possibilities offered by a given environment to respond to everyday life in all its diversity. Col.lectiu Punt 6 provided a questionnaire structured around three different urban space types: Neighborhood and everyday network (NEN), Relationship space (RS) and Everyday equipment (EE). Each of these urban spaces has questions organised according to five urban qualities: Proximity, diversity, autonomy, vitality and representativeness. This generates an indicator system of 13 indicators, 47 conditions and 108 determinants. For the analysis of the selected sets, the questions relating to the Neighborhood and Everyday Network (NEN) and Relationship Space (RS) scale were applied.
In order to assess and answer these qualitative questions, direct observation, spontaneous conversation and contact with representative social agents in each neighborhood were used.
3. Results
We can present the results obtained for each neighborhood as follows. The quantitative data, obtained by applying the BcnUEA indicators related to the form and its relationship with the inhabitants, show us an objective but not unquestionable picture, so the overlapping application of the evaluation system of spaces for everyday life coupled with the observation of the place through the PPS method, have sought to bring together the formal analysis with the lived reality.
3.1. Urban Ecology Agency Indicators
The BcnUEA parameters indicate the minimum and desirable value for each calculation, which allows us to classify the results in three states: Below minimum (red), between minimum and desirable (white) and above desirable (green). The limits of this range of values are described more fully in BcnUEA’s document.

The indicators are grouped into different blocks: Land Occupancy (OCS), Public Space and Livability (EPH), Mobility and Services (MVS), Urban Complexity (CJU), Green Spaces and Biodiversity (EVB), Urban Metabolism (MTU) and Social Cohesion (CHS).
Table 2 allows us to easily point out the shortcomings of each neighborhood, as well as to question the validity of the system itself.
Among the shortcomings are those common to the three neighborhoods in the areas of mobility, complexity and social cohesion, whereas urban metabolism does offer positive results across the board. The first issue appeals directly to the municipality’s mobility policies, while urban complexity and social cohesion require multisectoral attention to be reversed.
It is also particularly noteworthy that the values referring to the amount of vegetation per inhabitant and soil permeability are below the established minimum values, while the distribution of this vegetation is above what is desirable. This makes us question the method itself, since, as we will see in the subjective indicators, the perception of urban greenery is positive. From all these we can deduce that the limits validated by the Urban Ecology Agency under this heading should assume margins relative to the climatic, landscape and cultural characteristics of each place, in order to adapt this validation to its eco-systemic possibilities, as well as to the expectations of the population.
The rest of the values provide us with very specific information on the needs of each neighborhood and therefore on the areas of input.
3.2. Col.lectiu Punt 6 Indicators
The system of spatial indicators developed by Col.lectiu Punt 6 allowed us to rate different aspects, such as the proximity, diversity, autonomy, vitality and representativeness, of the urban factors studied in three different scales with a value between 1 and 5. For our research, we limited ourselves to the scale of neighborhood and relationship space, since the study has been limited to that area. The table below (
Table 3) shows the results indicating their value as being low or very low (red), medium (white) or high or very high (green). The limits of this range of values are taken from Col.lectiu Punt 6′s own description.

This method clearly shows us how daily life is well resolved in the Vistabella neighborhood, while it presents clear deficiencies in the areas of vitality, autonomy and diversity in the La Fama neighborhood, a denser place within the confines of which we can extrapolate some of the reasons for these negative results.
3.3. PPS Indicators
Finally, PPS allows us to evaluate and understand those factors that make a place succeed as a public space and those that make it fail (
Table 4). An approach to the space is made from four different qualities: Accessibility (access and links), comfort (comfort and image), activities (uses and activities) and sociability (sociability).

These results indicate the number of negative (red), neutral (white) and positive (green) conditioning factors that correspond to each quality of the space.
This method of observation shows the evident difference in appreciation, and therefore attachment and commitment, that the three neighborhoods evoke. On the one hand, Vistabella generally scores very positively, while La Paz and, in particular, La Fama reflect a negative appraisal, fundamentally a consequence of their image and the degree of comfort they offer, something that is clearly related to the level of sociability they present (
Figure 9).
4. Discussion
It is evident that urban life does not depend exclusively on the configuration of space, but neither is it alien to it, and for this reason this methodology of analysis is proposed as a necessary ingredient in multidisciplinary evaluations aimed at the regeneration and updating of neighborhoods.
The methods adopted here are built on research on extensive experience that validates them when they are assessed. However, it is interesting to investigate the correlation of the results once concepts are related and parameters are united around the observed realities. It is in this way that we have brought together all the indicators, whether quantitative or qualitative, under the concept of vitality and comfort. Vitality as a measure of the daily activity of the neighborhood and comfort when we try to determine whether this activity takes place in pleasant and sense-of-community-generating conditions or is simply a consequence of the cumulative fact of people in a place.
Once these two extremes have been discretised, we have sought to bring together the results obtained in the different systems. We can then clearly observe where they align and where there is a significant divergence, an outcome that calls for an interpretation of the results.
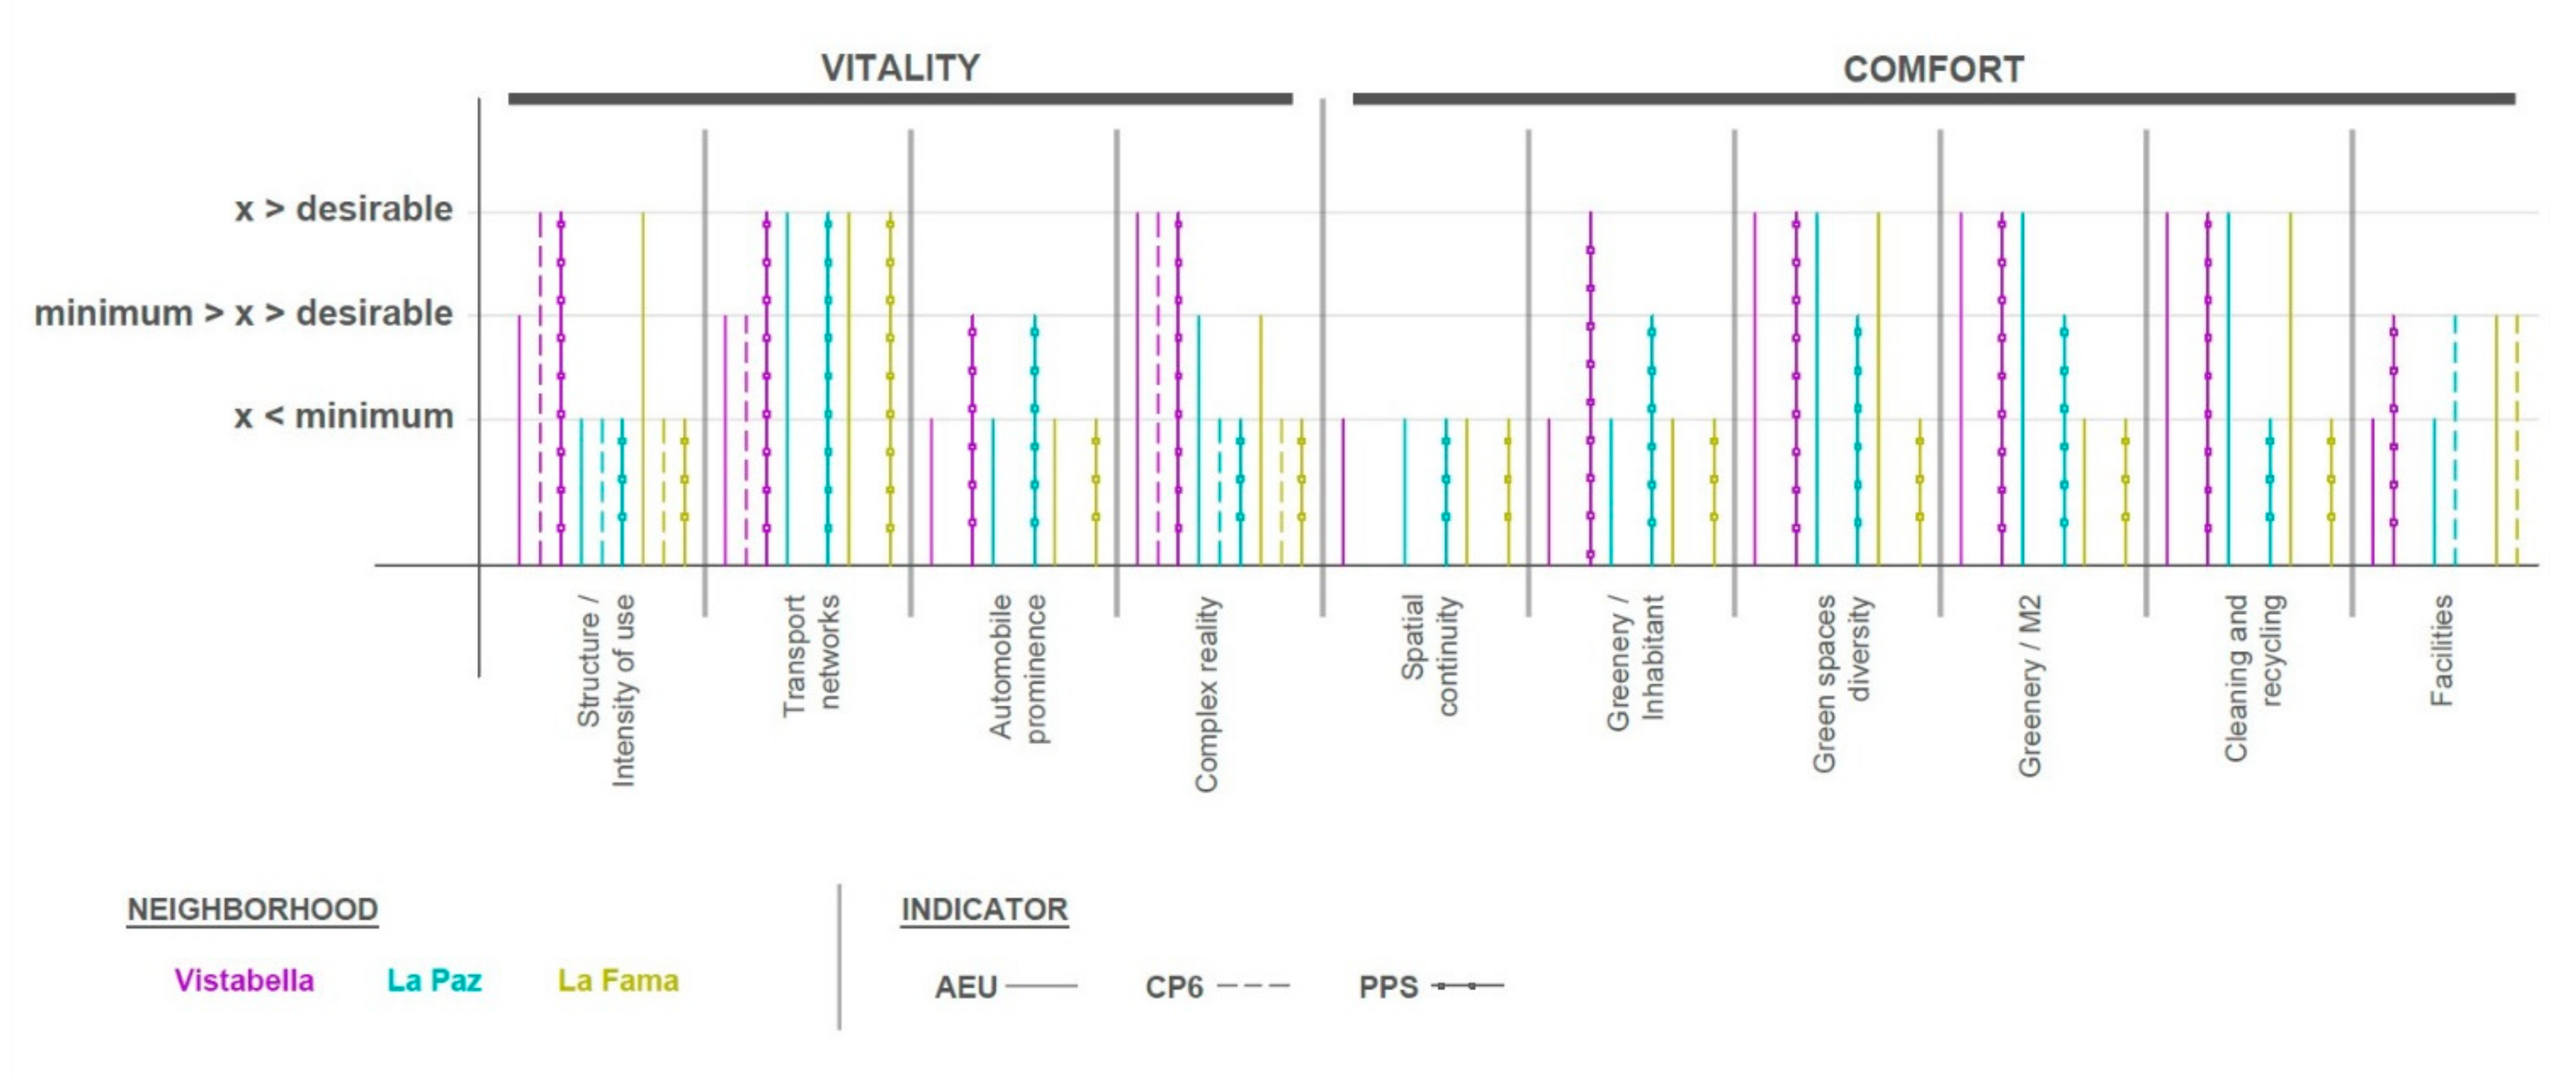
As can be seen in
Figure 10, the first conflict is found in the validation of the urban structure, namely in the relationship between the density of inhabitants per square meter of surface area in absolute terms and per square meter of public space in relative terms. These parameters speak of critical mass and therefore of intensity of use, but we can see that in the neighborhoods of Vistabella and La Fama, the qualitative methods yield results that are opposed to those established by the quantitative method, showing that the intensity with which a given urban structure is used cannot be reduced to a relationship between quantities—and that even trying to delve deeper into this through the concept put forth by the BcnUEA as a complicating factor may not go far enough.
Returning to the two cases in question (Vistabella and La Fama), we can see substantial differences between the two projects that allow us to identify formal factors which, together with socio-economic and cultural factors, favour a greater or lesser intensity of use of a place.
Of all of these, it is worth highlighting the heterogeneity and flexibility of the infrastructure. When it is capable of accommodating very diverse units of coexistence and uses as part of its residential make-up, as well as in its commercial and service characteristics, even allowing the transfer of activities from one component to another, the system becomes more adaptable to the circumstances.
The dwellings and premises of different sizes and in different positions with respect to the Vistabella road network offer a greater diversity of urban elements than a closed system defined by a limited number of different units, as would be the case with La Fama. We are therefore talking about the fact that, as opposed to critical mass, which tells us about the potential use of a component, it is also essential to value the complexity, understanding this complexity not only as a pre-designed quality, but as an open condition which offers up the potential for evolution and modification over time.
When we look at the other significant concept mentioned at the beginning of our argument, i.e., comfort, something similar occurs—quantitative indicators offer different results from those that emerge from qualitative observation.
The capacity of a given urban environment to be attractive, comfortable and appreciated by its citizens is clearly related to the socioeconomic level of its inhabitants. Looking at the levels of social exclusion evident in La Paz and La Fama, it is easy to find individuals who feel detached and uncommitted to a more communal way of living. This can lead to antisocial attitudes that disfigure the environment, even though, for example, there are sufficient measures in place to prevent littering. However, it is also true that urban form and its use influence these aspects. The lack of spatial continuity, which leads to a skeptical use of the street, the prominence of the car, both in movement and in generating “walls” as a result of the vehicles that enclose the public space, the absence of activity on the ground floor of buildings or the scarcity and poor location of street furniture that invites neighbors to spend and share their time all feed into this sense of indifference and lack of respect for collective space.
From the point of view of urban form, these arguments help us to consolidate the importance of the method presented in this article. We can therefore consider it a useful tool to evaluate, on the one hand, the objective capacity of an urban structure to accommodate a full life for those that reside within it, and, on the other hand, whether this takes place. From these evaluations, we can extract its shortcomings not only on a general and objective level, but also delve into its reality in order to try to discern elements for improvement within the urban fabric.
Finally, the analysis carried out on the three different ways of looking at the housing estates also allows us to evaluate, in general terms, the success of each urban setting. For this purpose, a ranking has been made based on the summary of indicators in
Figure 10, where numerical values have been assigned to the three different states of each indicator: 0 for indicators that do not reach the minimum, 1 for those that are between the minimum and the desirable and 2 for those that are above the desirable. In this way, we obtain a grouped score in the analysed aspects of vitality and comfort, as well as a total score that shows the total valuation of each set (
Table 5). Vistabella is the neighborhood with the best vitality and comfort conditions, with a score of 16 and 14 respectively and a total score of 30. It is followed by the neighborhood of La Paz, with a vitality score of 6 and comfort of 9, for a total of 15 points. Finally, the neighborhood of La Fama has a vitality score slightly higher than La Paz with 7 points, but less than half as high in comfort with 4 points, which makes its total score 11, making it the neighborhood with the fewest indicators above the minimum.
These results open an interesting debate on the values of medium-scale humanistic urbanism, in which the mix of uses and types offers a healthy functional and social heterogeneity as opposed to the social homogeneity and functional sectorisation offered by other projects. Deepening this appreciation may be a research method that will require an increase in the number of projects compared.
5. Conclusions
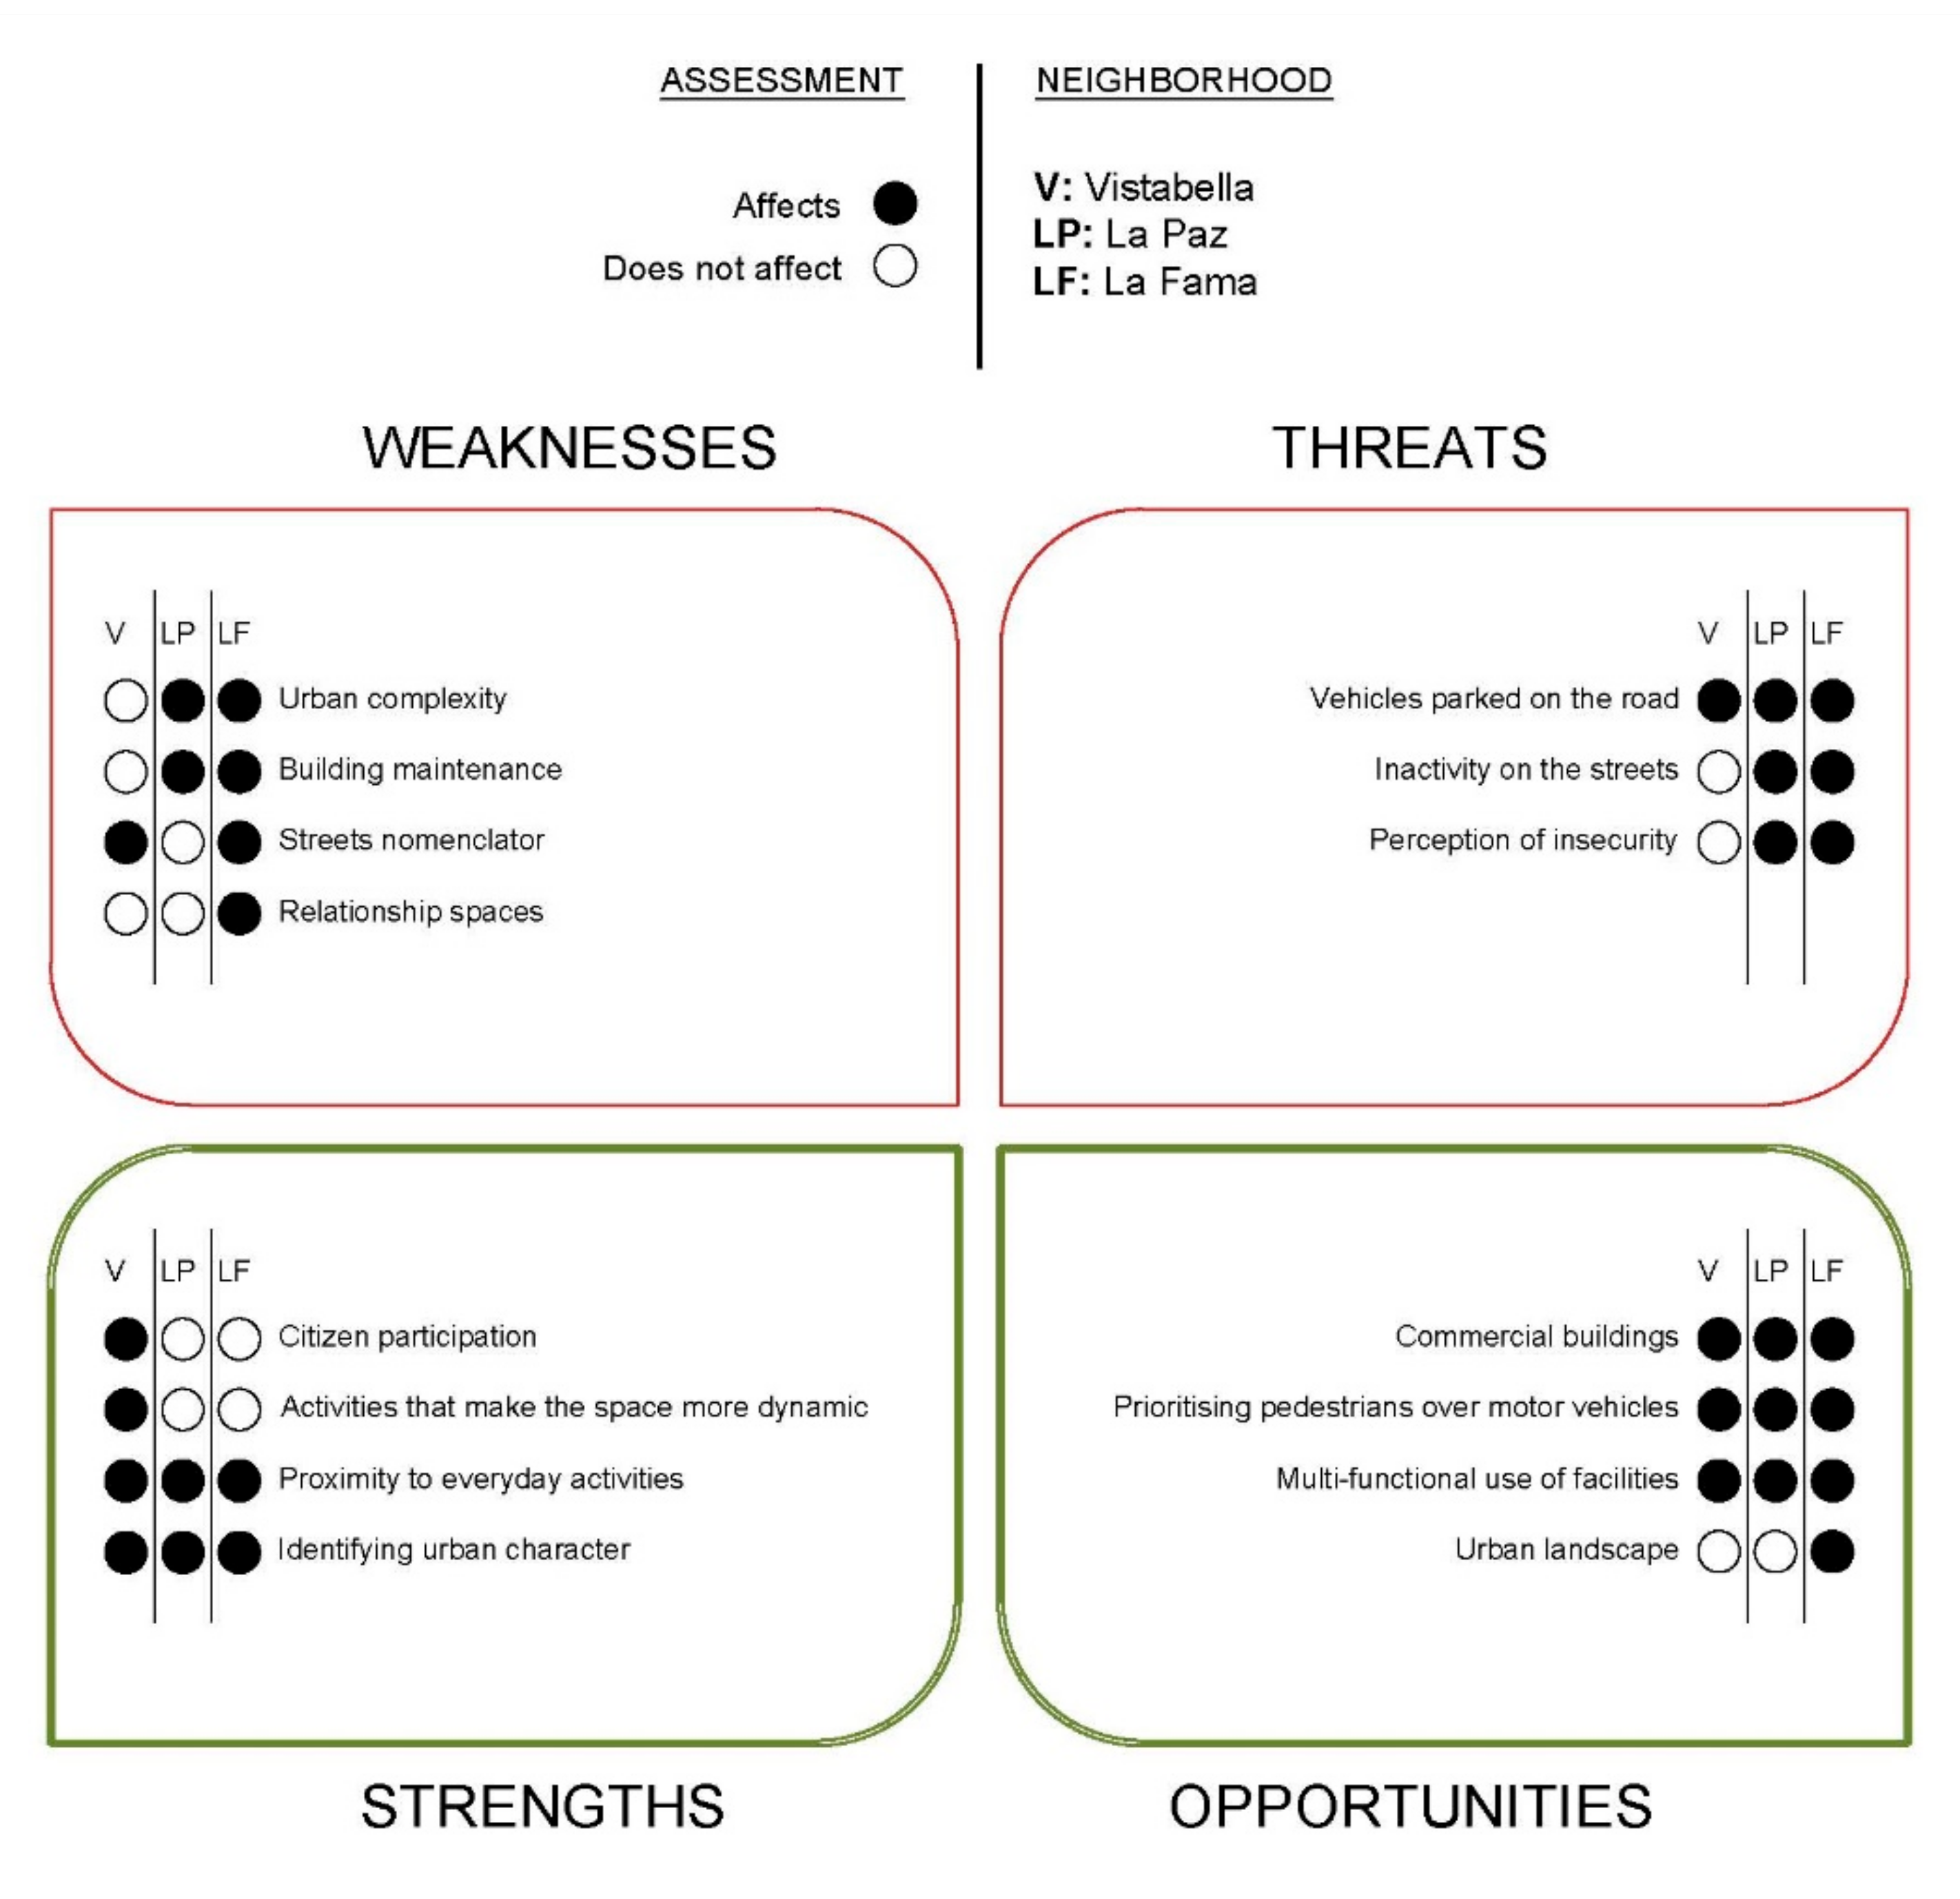
Our aim was to gain an in-depth knowledge of the strengths and weaknesses of these parts of Murcia city (
Figure 11) and to determine those factors that are not conducive to a pleasant and fulfilling daily life.
In this sense, it is safe to conclude that investing in the material quality of public space, the provision of daily commerce and of multifunctional relationship spaces free from the overbearing presence of private vehicles are lines of action that the authorities should consider in order to improve daily life in these neighborhoods.
5.1. Weaknesses
The urban complexity of La Paz and La Fama have general features in common that differ vastly from those of Vistabella. Relocating businesses and activities to isolated buildings and not mixing different uses with residential within the same building is resulting in empty and lifeless streets and spaces.
The quality of public space influences the visitor’s perception and the way residents feel.
It is somewhat disconcerting to observe that in La Fama there is no urban furniture for resting, nor garbage cans in the public spaces.
5.2. Threats
The combination of having excessive numbers of vehicles parked on the road and the lack of activity on the streets is causing the greatest threat to these areas, particularly in La Paz.
Most of this neighborhood’s periphery is surrounded by the Primero de Mayo Avenue ring road, which creates an unnatural physical barrier for pedestrians, turning it into a space without comfortable routes by which to go about daily life, which, when combined with the paucity of activity in the area, increases the perception of insecurity.
In La Fama, the car has slowly been conquering the pedestrian’s terrain to the point that the public space has become a sum of interstitial and chaotic spaces through which to walk.
In La Fama and La Paz, the scarcity of activity and the homogeneity of its urban fabric make it an uncomfortable area to pass through, and citizens consider avoiding it at certain times of the day.
5.3. Strengths
The three groups have an urban character that makes them easily recognisable and distinguishes them from the rest of the urban fabric, increasing the sense of belonging to a community.
The three complexes are in the center of the city, guaranteeing proximity to daily activities.
The Avenida de La Fama provides the shared axis of the three neighborhoods, where a weekly open-air market is held on Thursdays, which serves as a center of dynamic activity in the area.
5.4. Opportunities
After analysing the most and least favourable factors of the groups studied, a series of opportunities for improving the quality of daily life were identified:
Recover these portions of the city for all citizens with measures that reduce the feeling of insecurity and that involve integrating activity zones mixing residential with commercial use, and facilities that break the homogeneity of the current fabric.
None of the three neighborhoods has buildings with underground parking for housing, which causes the demand for parking in public spaces to skyrocket, upsetting the balance in favour of the private vehicle over the pedestrian.
Reversing these situations means activating concrete policies that pursue the following objectives:
- -
Recover the buildings that were originally designed for commercial purposes and that activate the area economically and socially
- -
Control private vehicle parking on the road with deterrent parking measures
- -
Prioritising pedestrians over vehicular traffic
- -
Multipurpose use of existing facilities
- -
Assume citizen participation in urban-planning and decision-making processes as a fundamental tool
- -
Organise activities that dynamise the space, open the neighborhood to the city and reduce the feeling of insecurity
- -
Work on a balanced street-naming system
As a conclusion to this research, we can note that the methodology employed has fulfilled its established aim. Using two different systems of analysis to evaluate quantitative and qualitative aspects has allowed us to contrast the formal results with real-life aspects, complementing or revealing the organic complexity of the city by showing contradictory values between both systems.
With the ensuing results from the combination of both systems of indicators, we can be more precise when proposing lines of action, since we are not only governed by a numerical, technical and simplifying criterion, but are also able to bring in the phenomenological factor as a key element in the equation, capable of prioritising or qualifying relevant aspects of the intervention.
The research continues by incorporating a larger number of neighborhoods that form other parts of the city. With the aim of deepening and increasing the scale of the study, the next step in our research will be the evaluation of domestic form, with the aim of determining the ability of housing units to adapt to the spatial demands of contemporary living.
Finally, it will be interesting to compare this methodology and its results with those obtained in other places where the diagnosis of peripheral neighborhoods carried out during the second half of the 20th century is being addressed, in order to proceed with their rehabilitation. As we have stated in this article, this is a generalised initiative in Europe and the sharing of approaches will be essential to improve progress.


