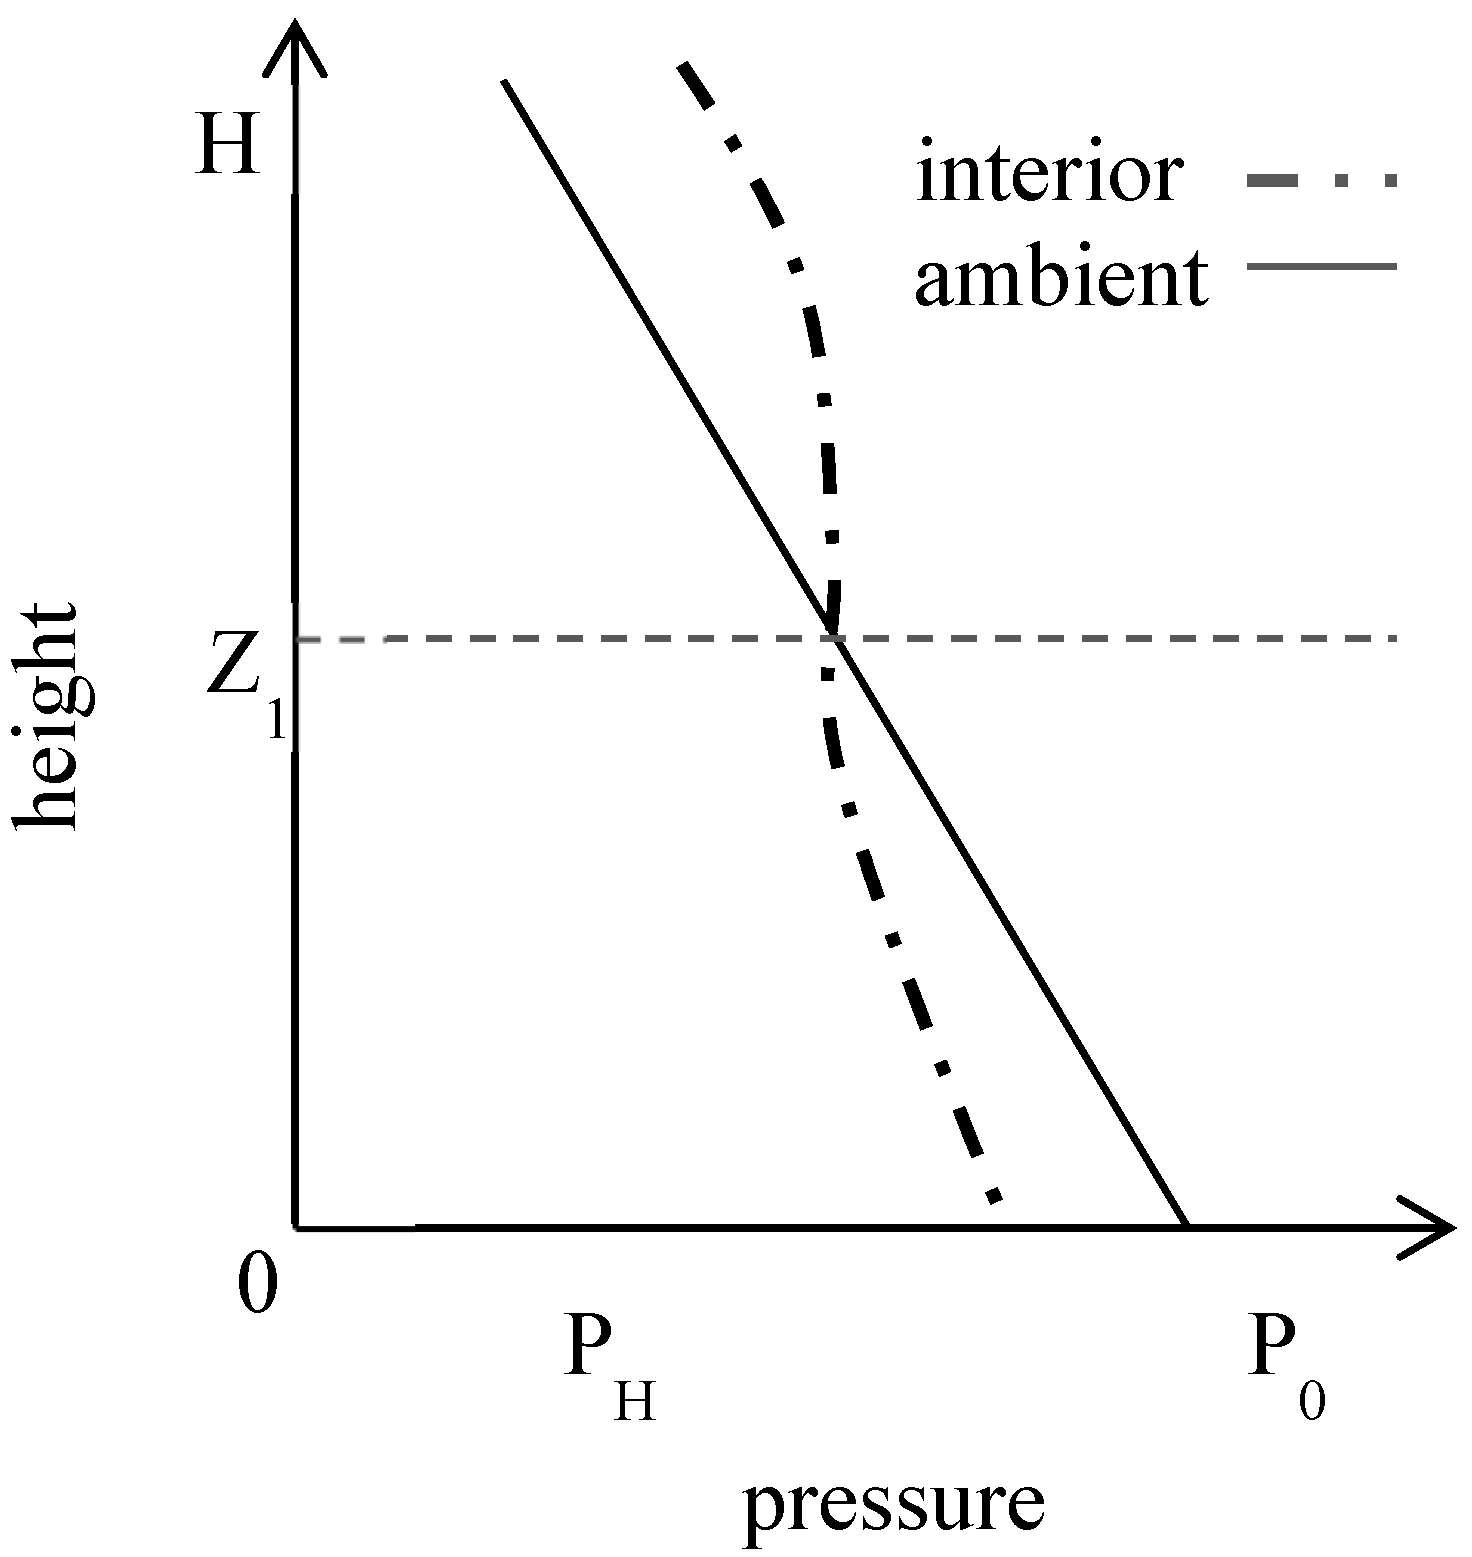
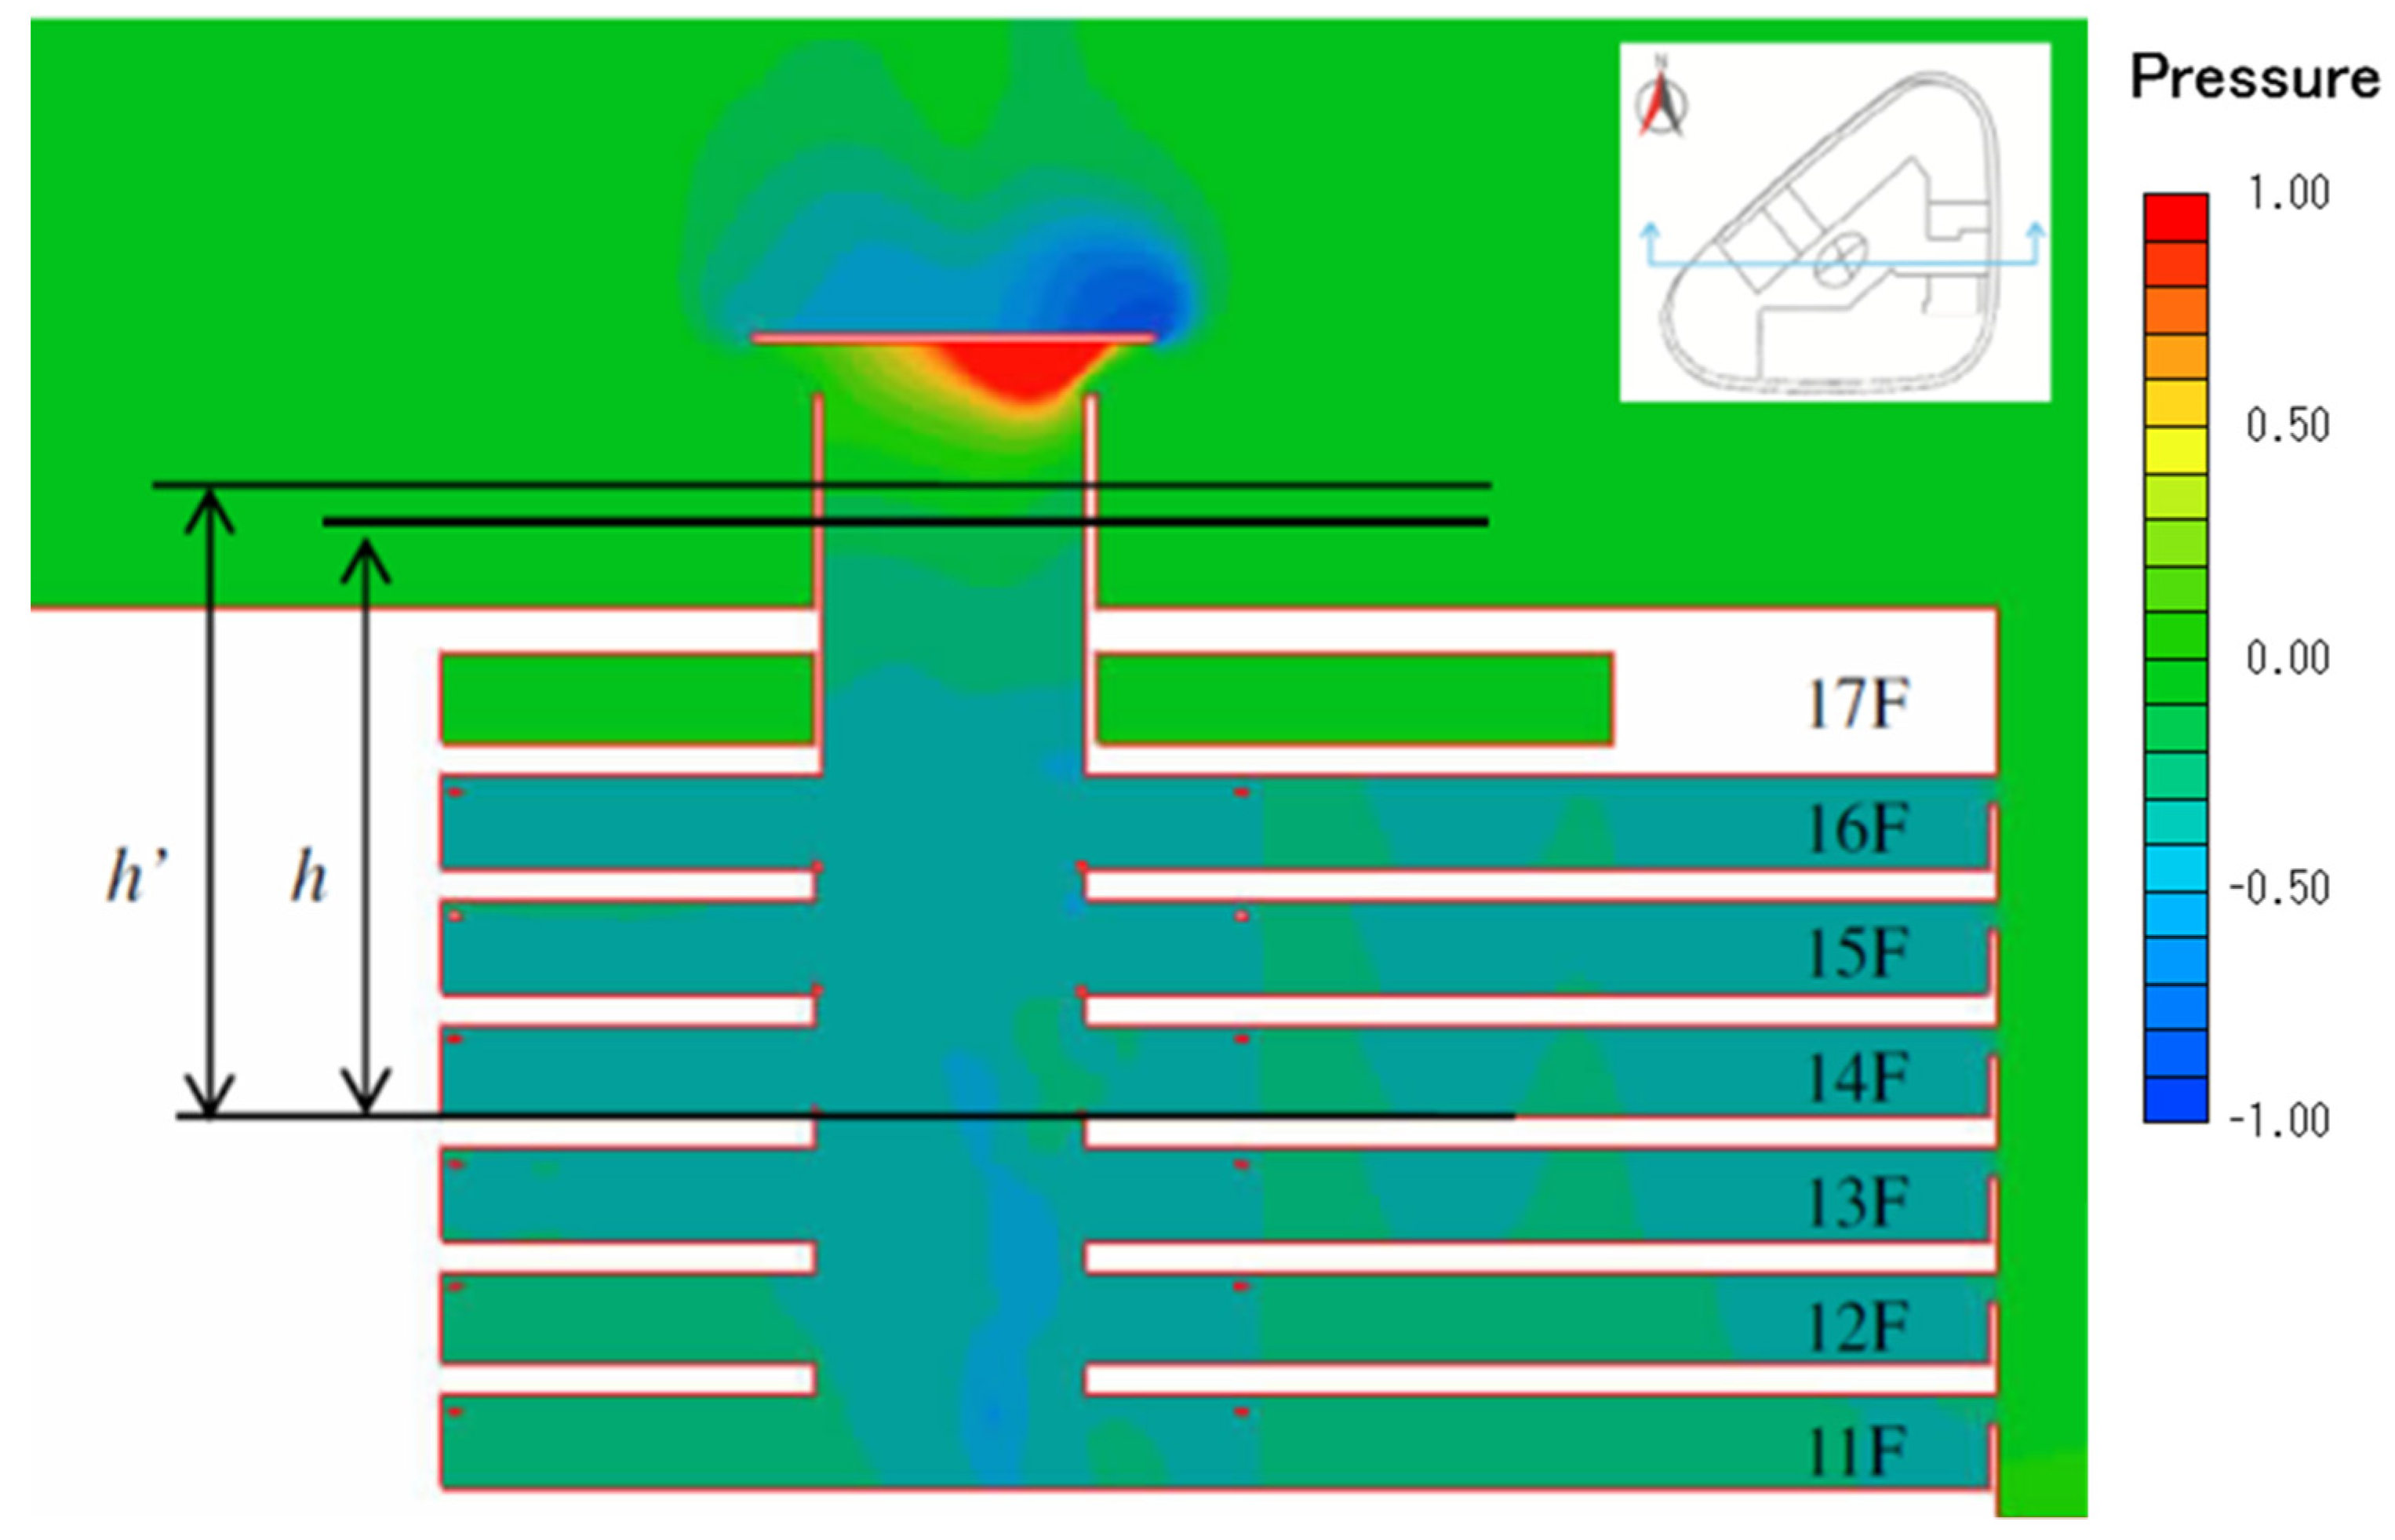
Figure 1.
Pressure distribution and neutral level height.
Figure 1.
Pressure distribution and neutral level height.
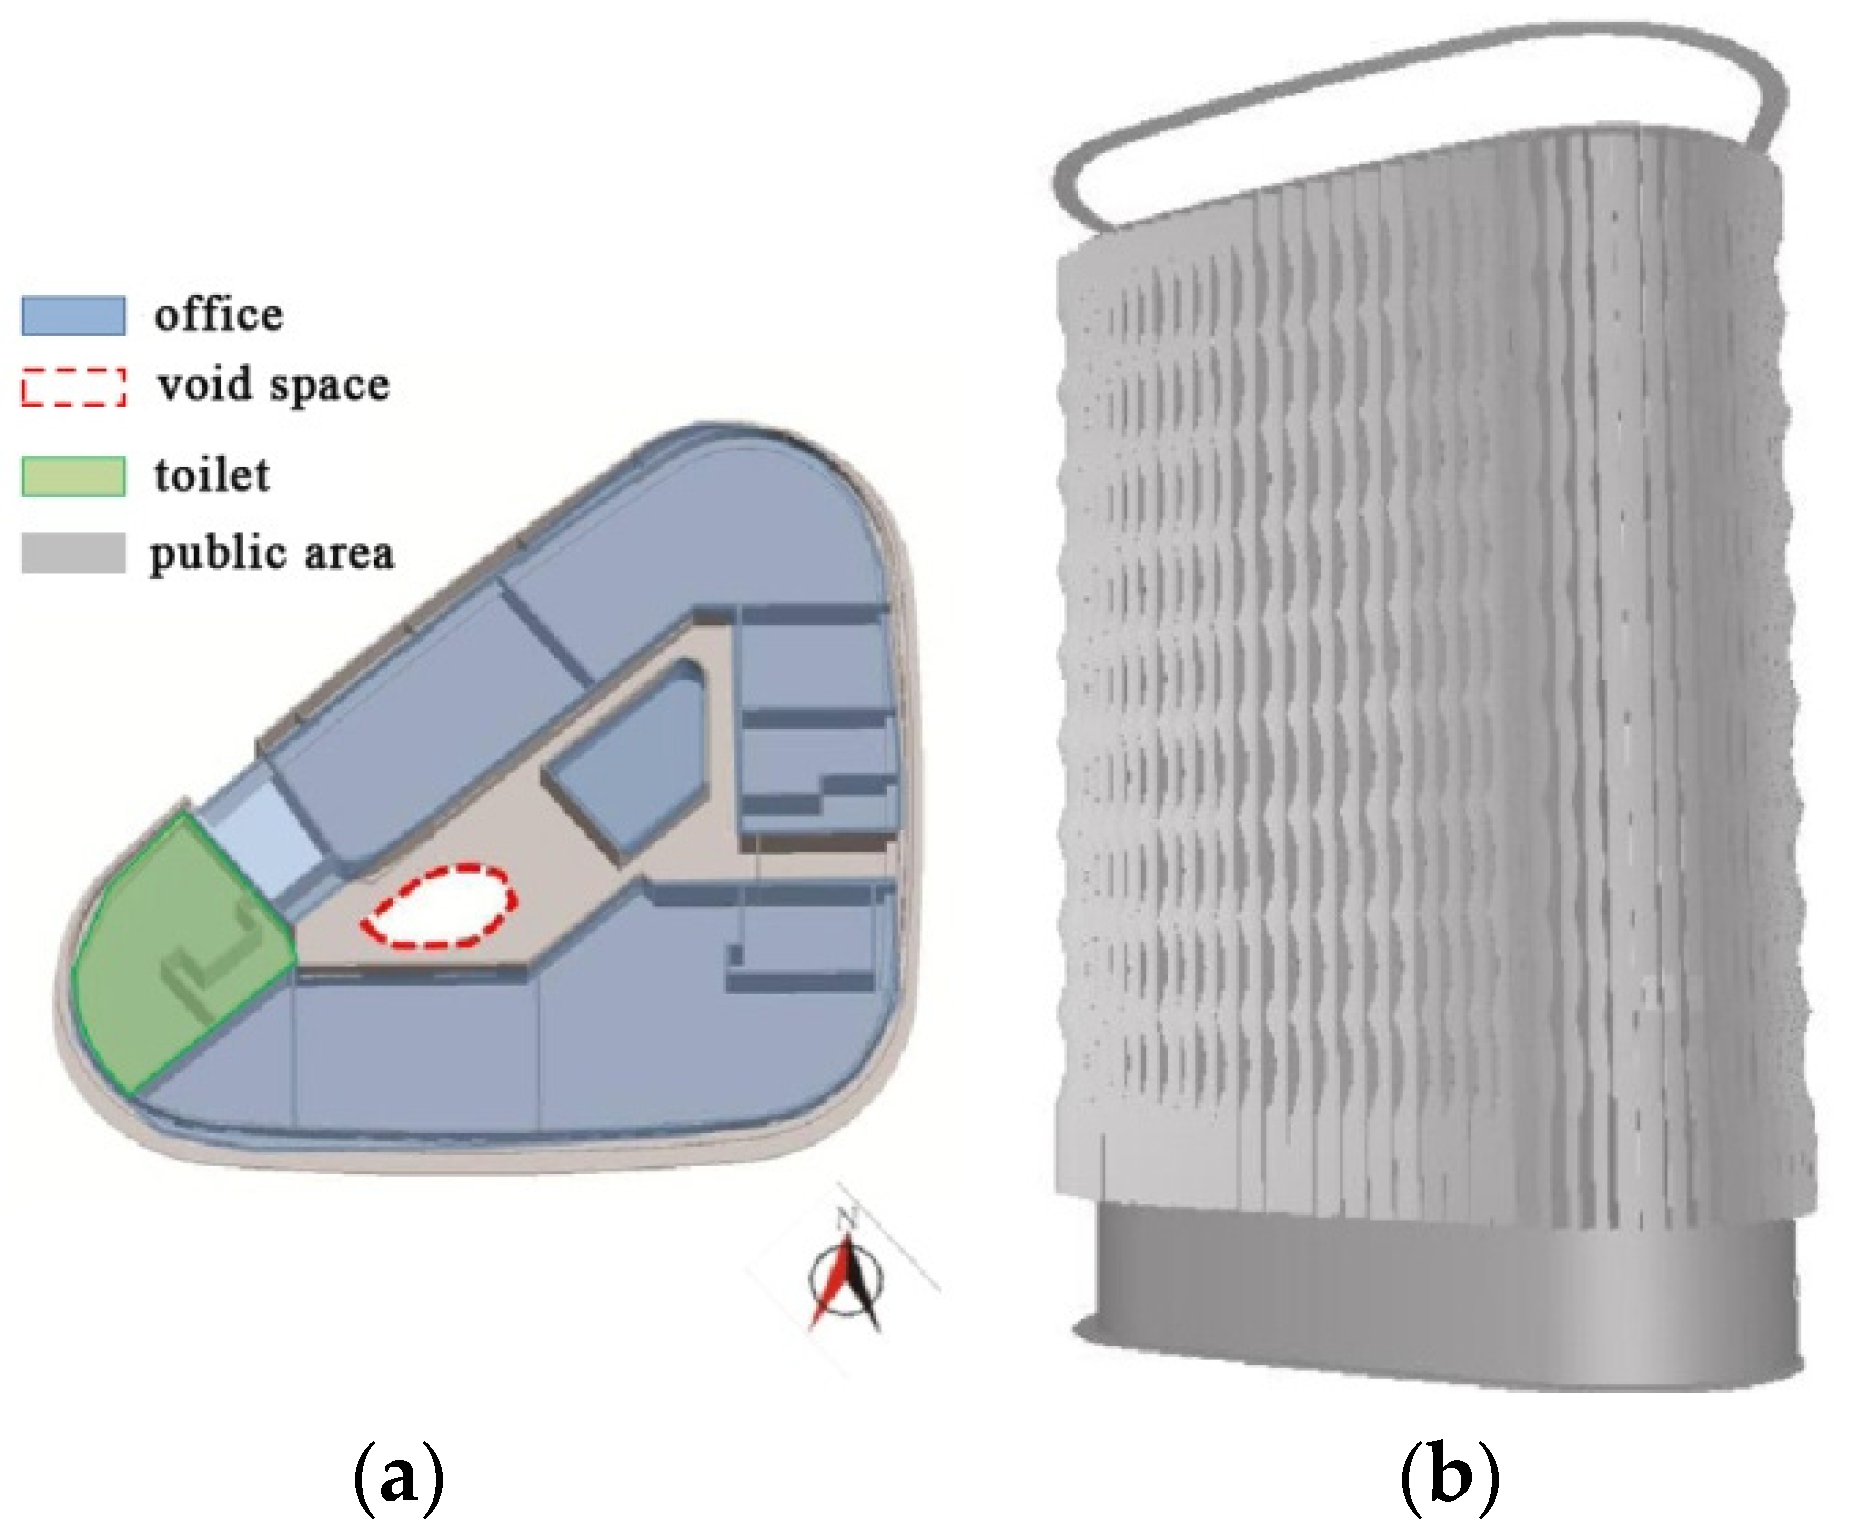
Figure 2.
Studied building. (a) Standard plan. (b) Perspective.
Figure 2.
Studied building. (a) Standard plan. (b) Perspective.
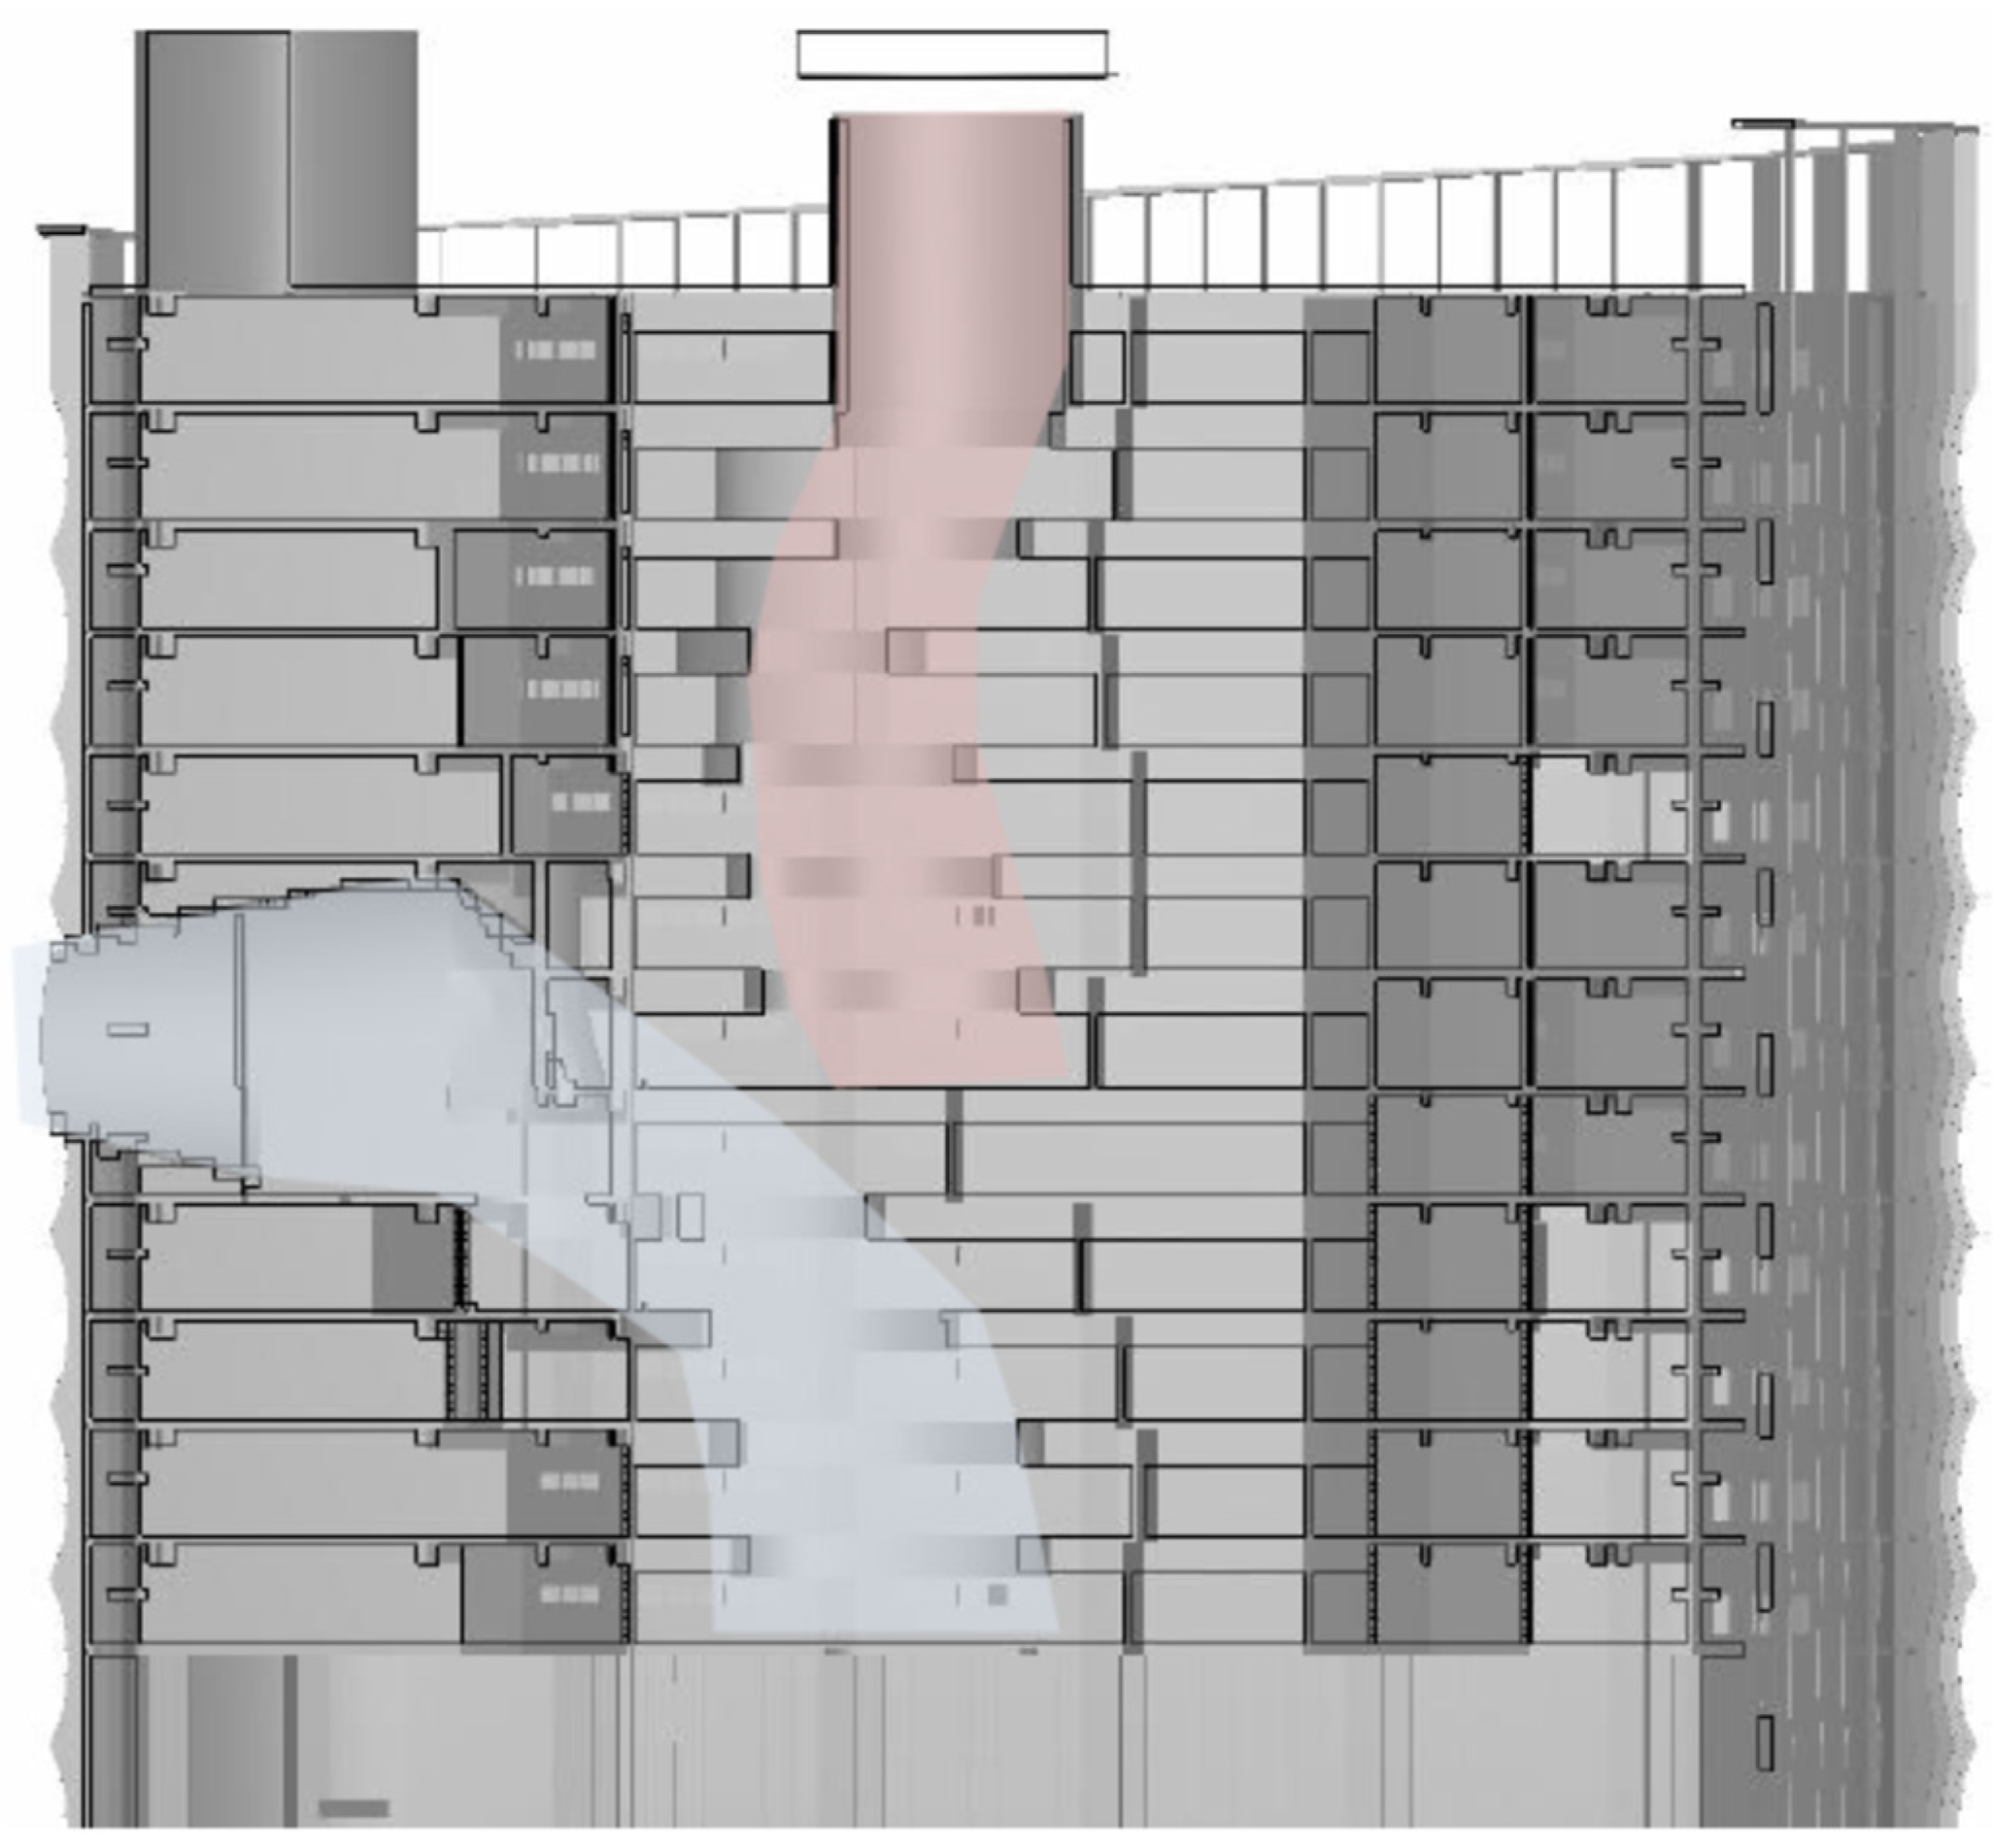
Figure 4.
A section of the studied building.
Figure 4.
A section of the studied building.
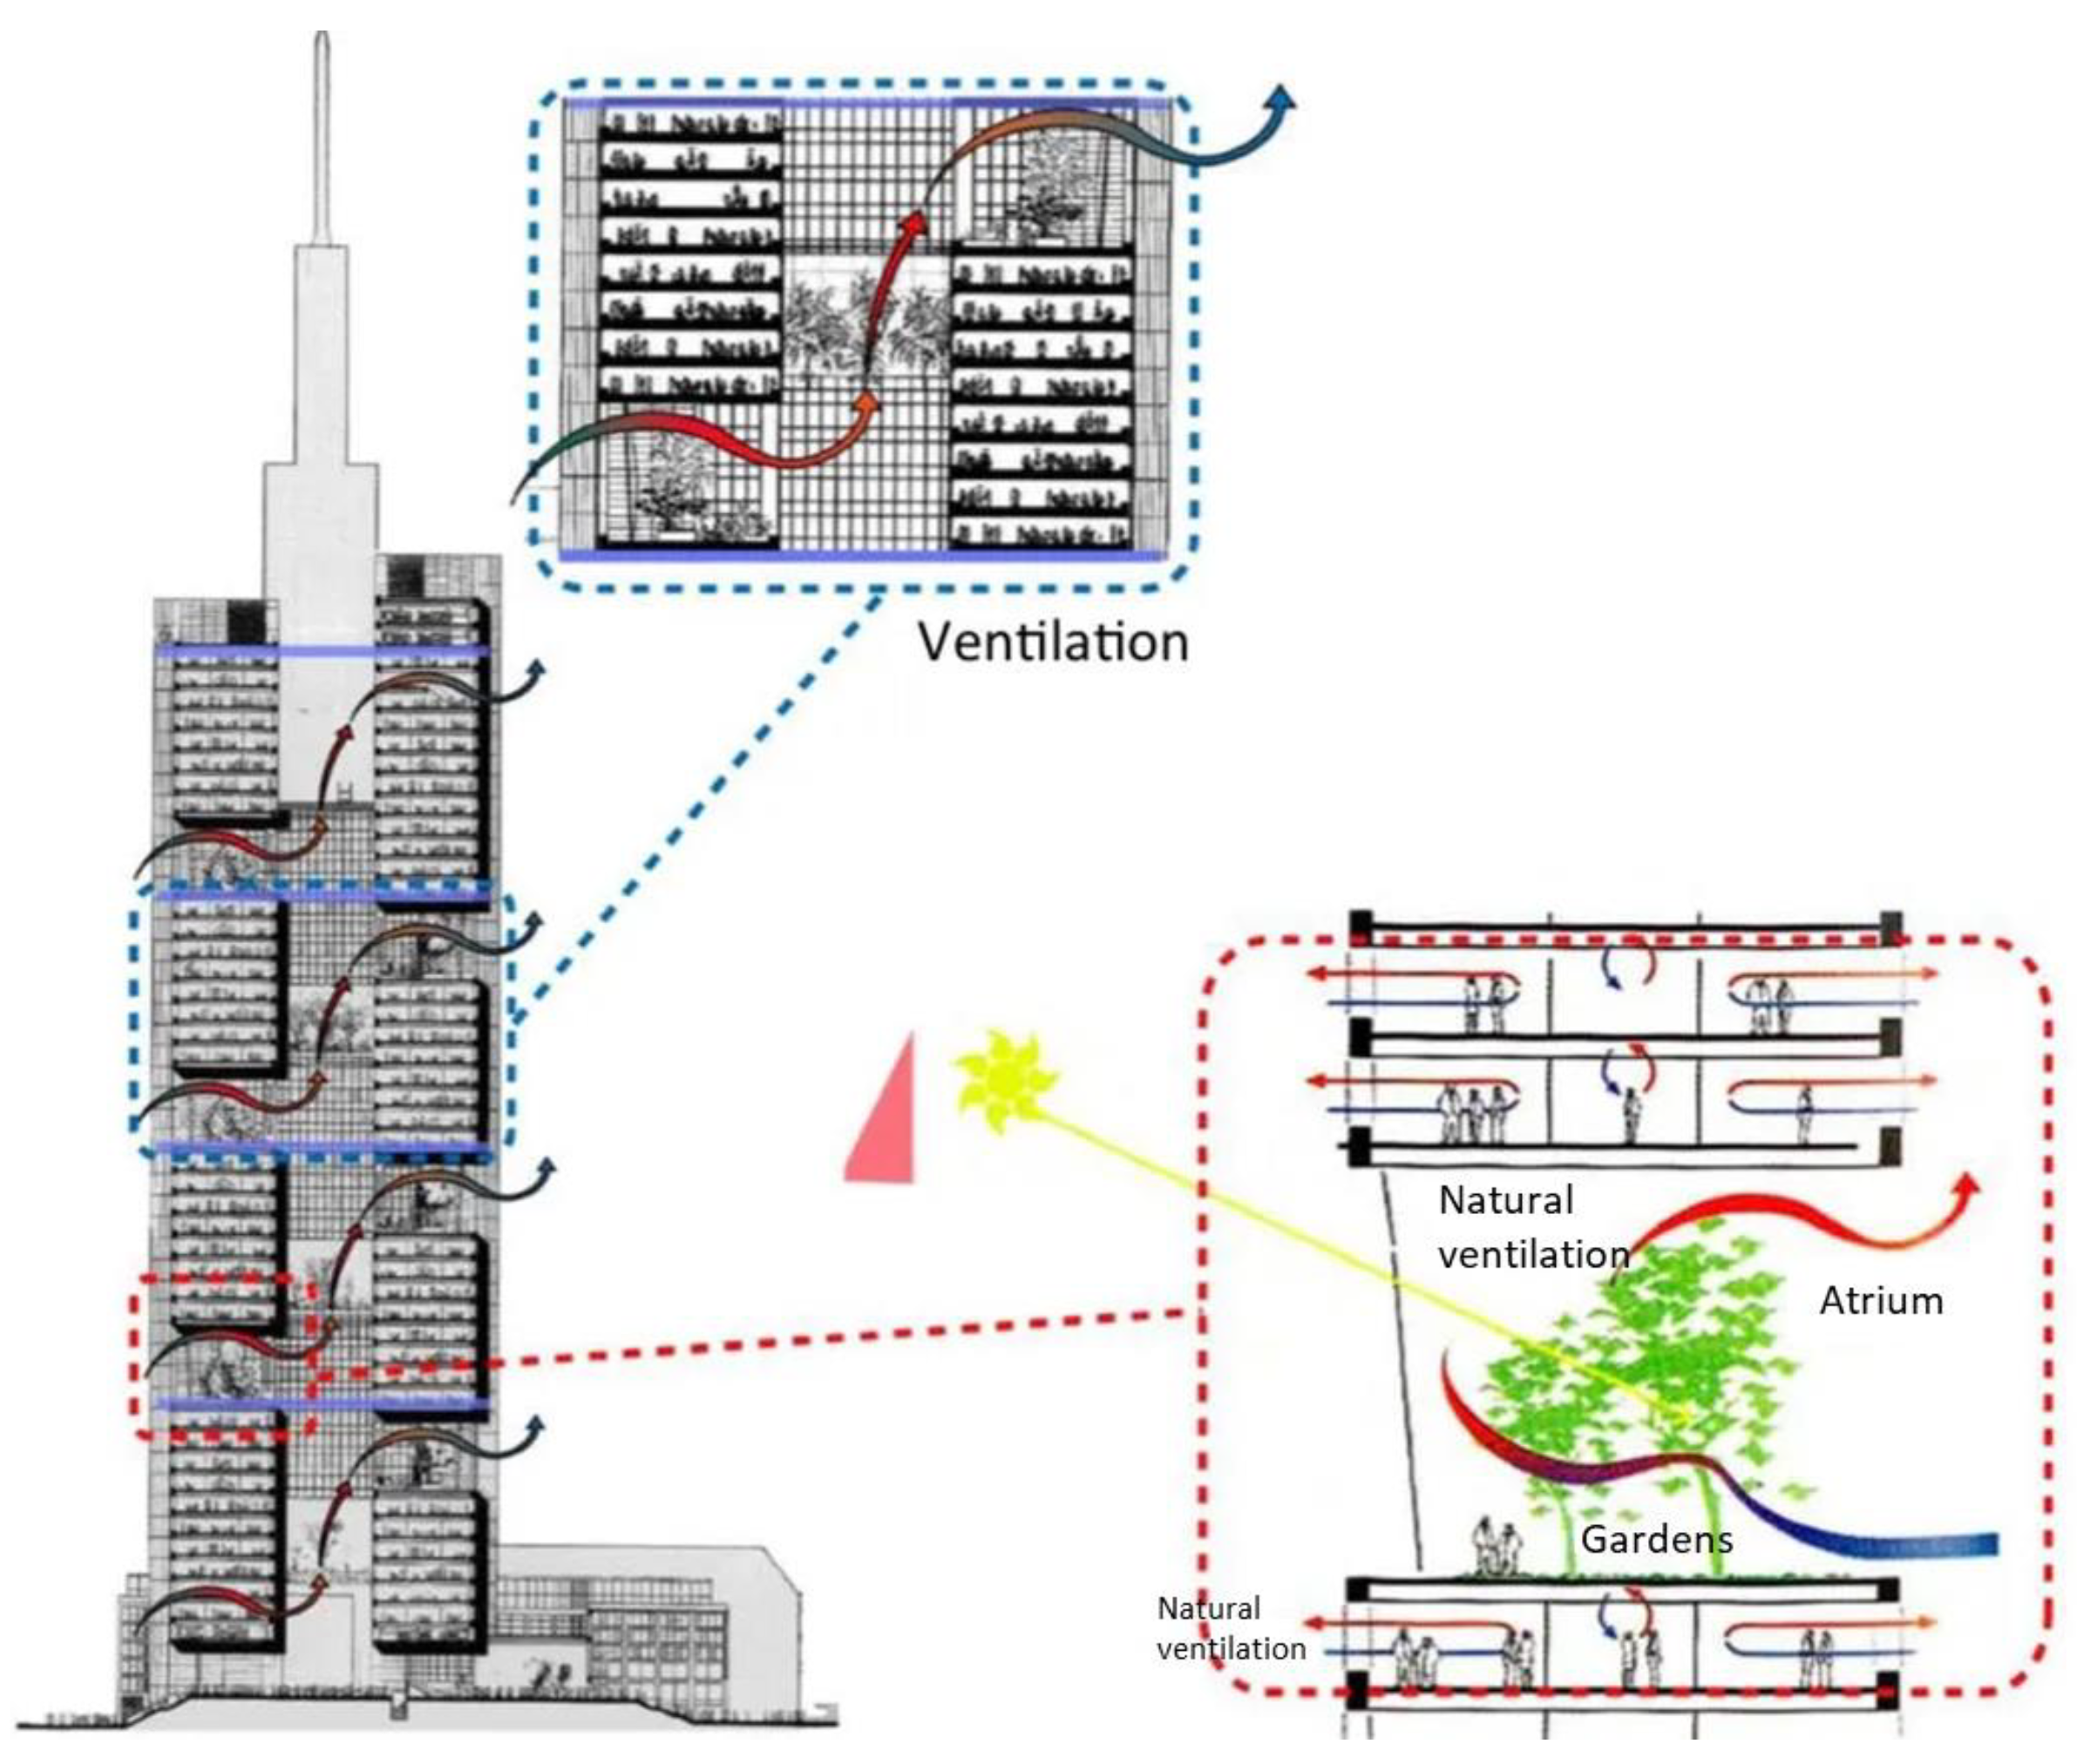
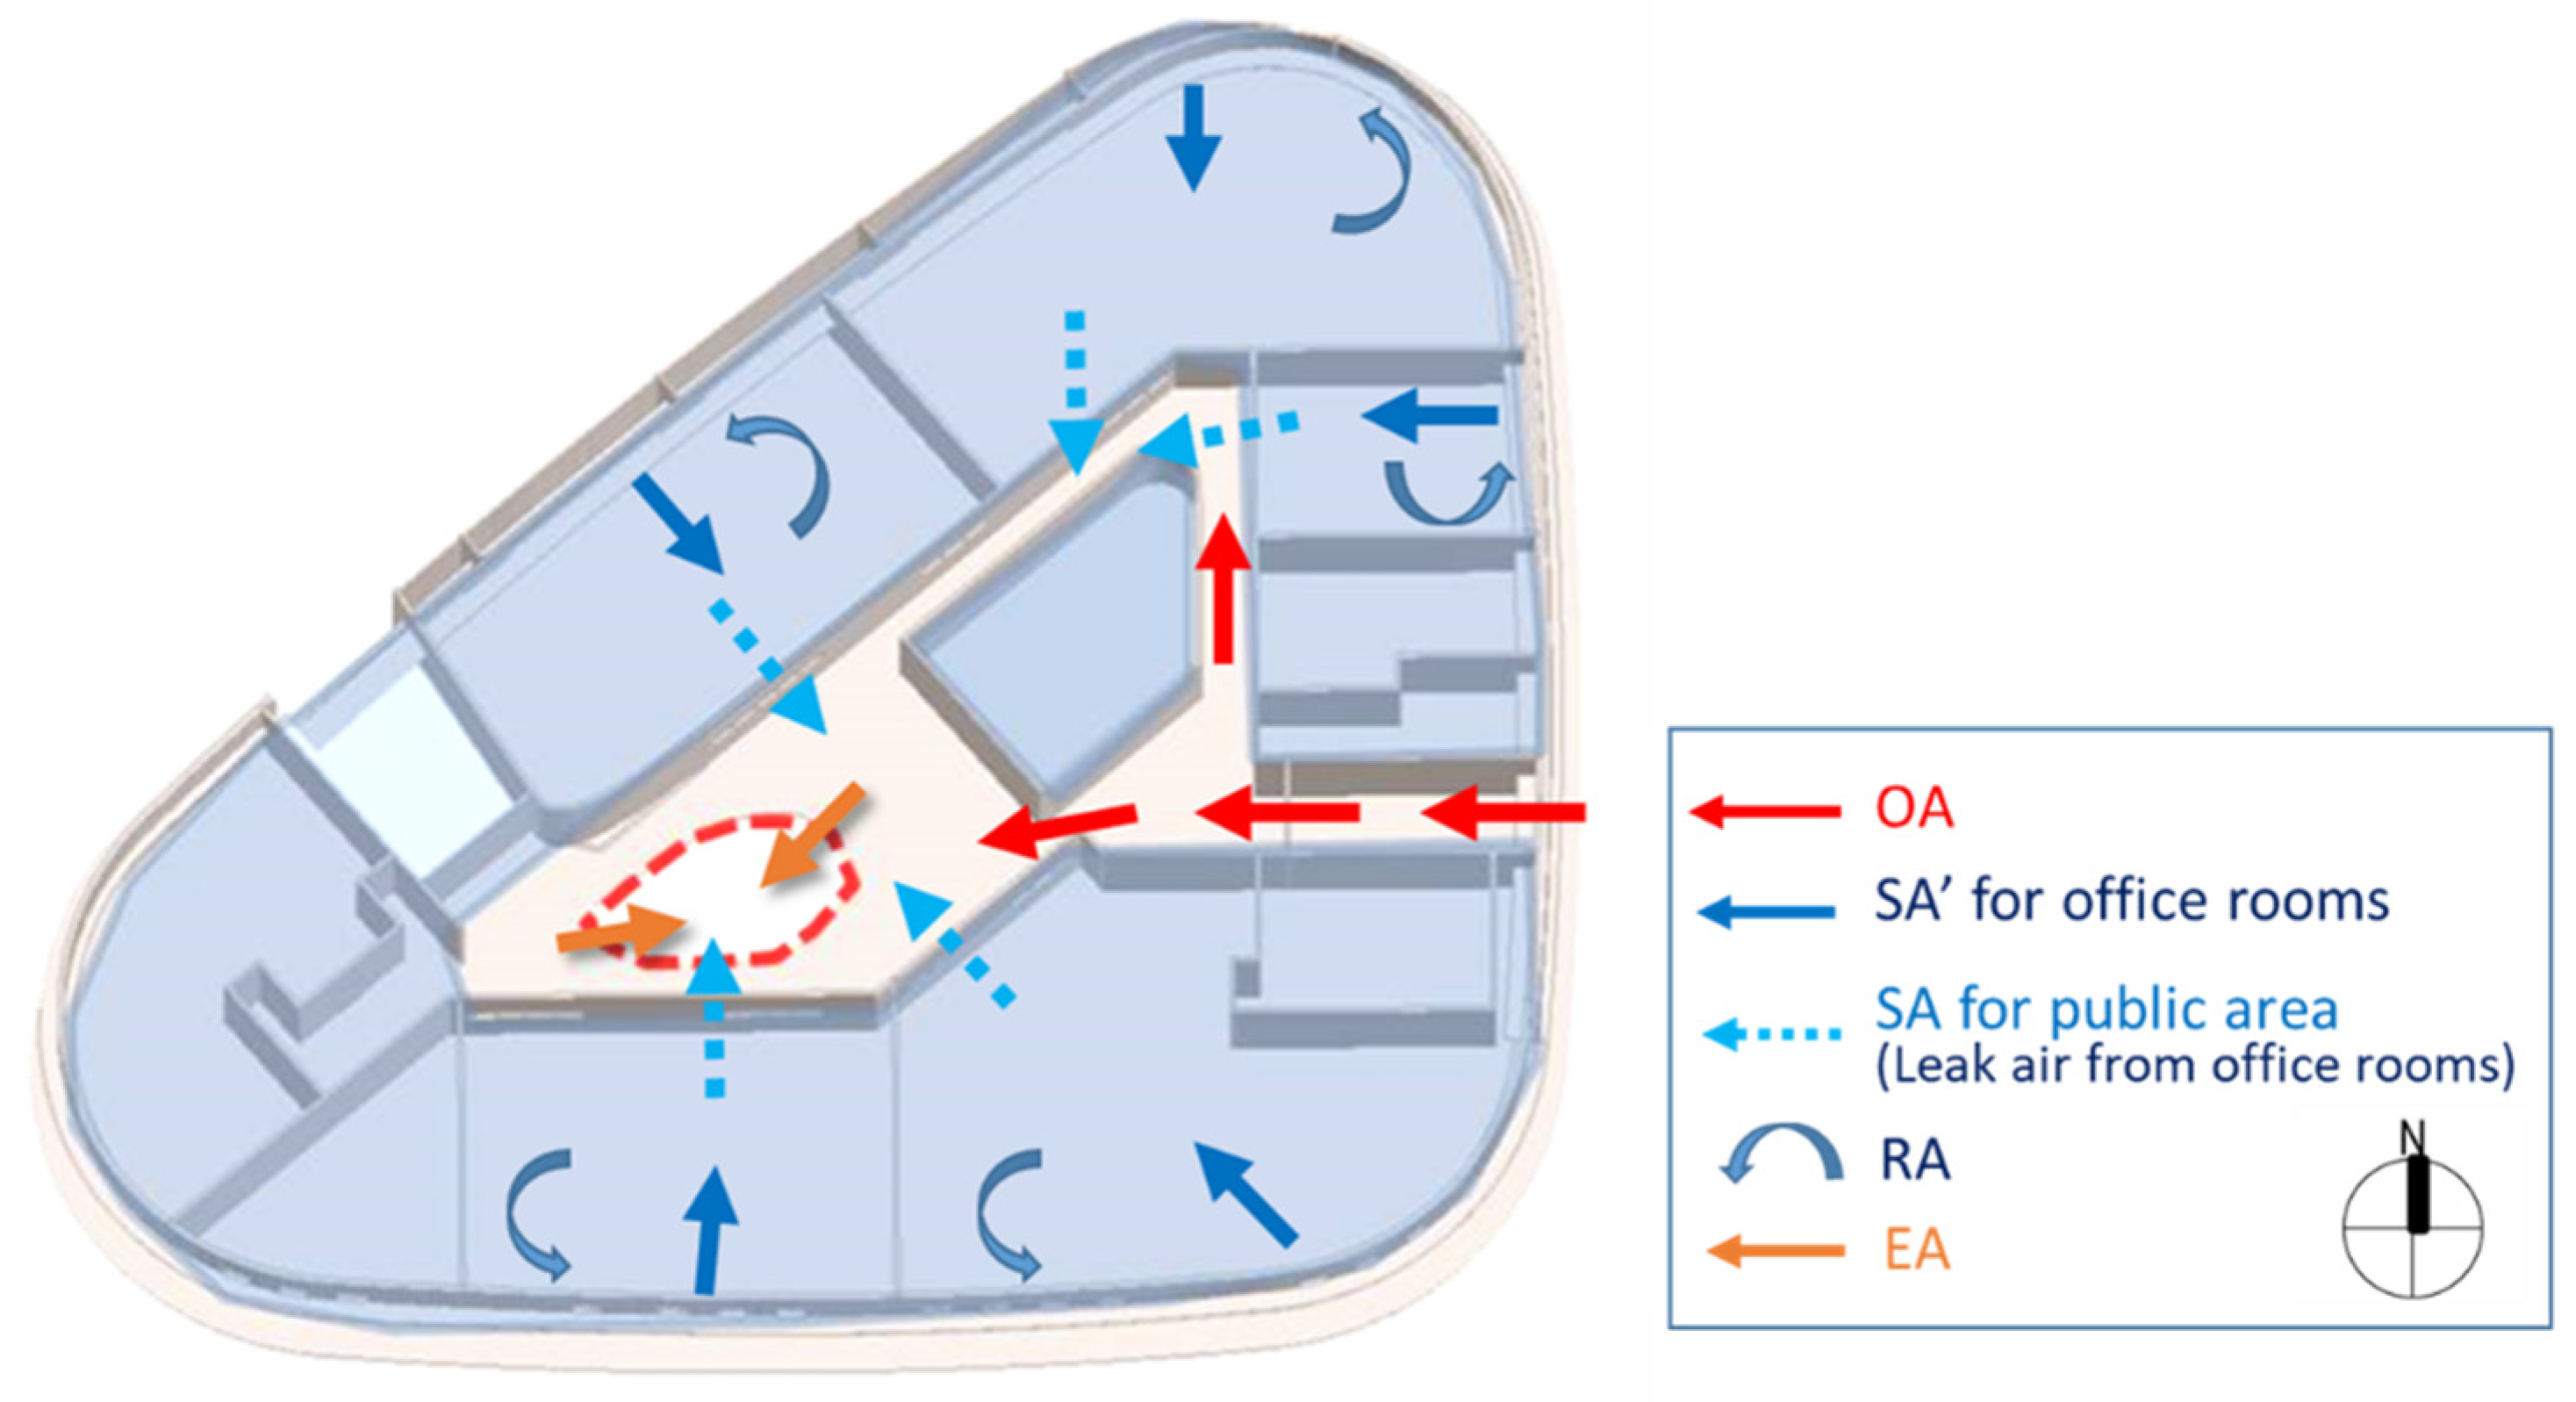
Figure 5.
Predicted flow path in the studied building.
Figure 5.
Predicted flow path in the studied building.
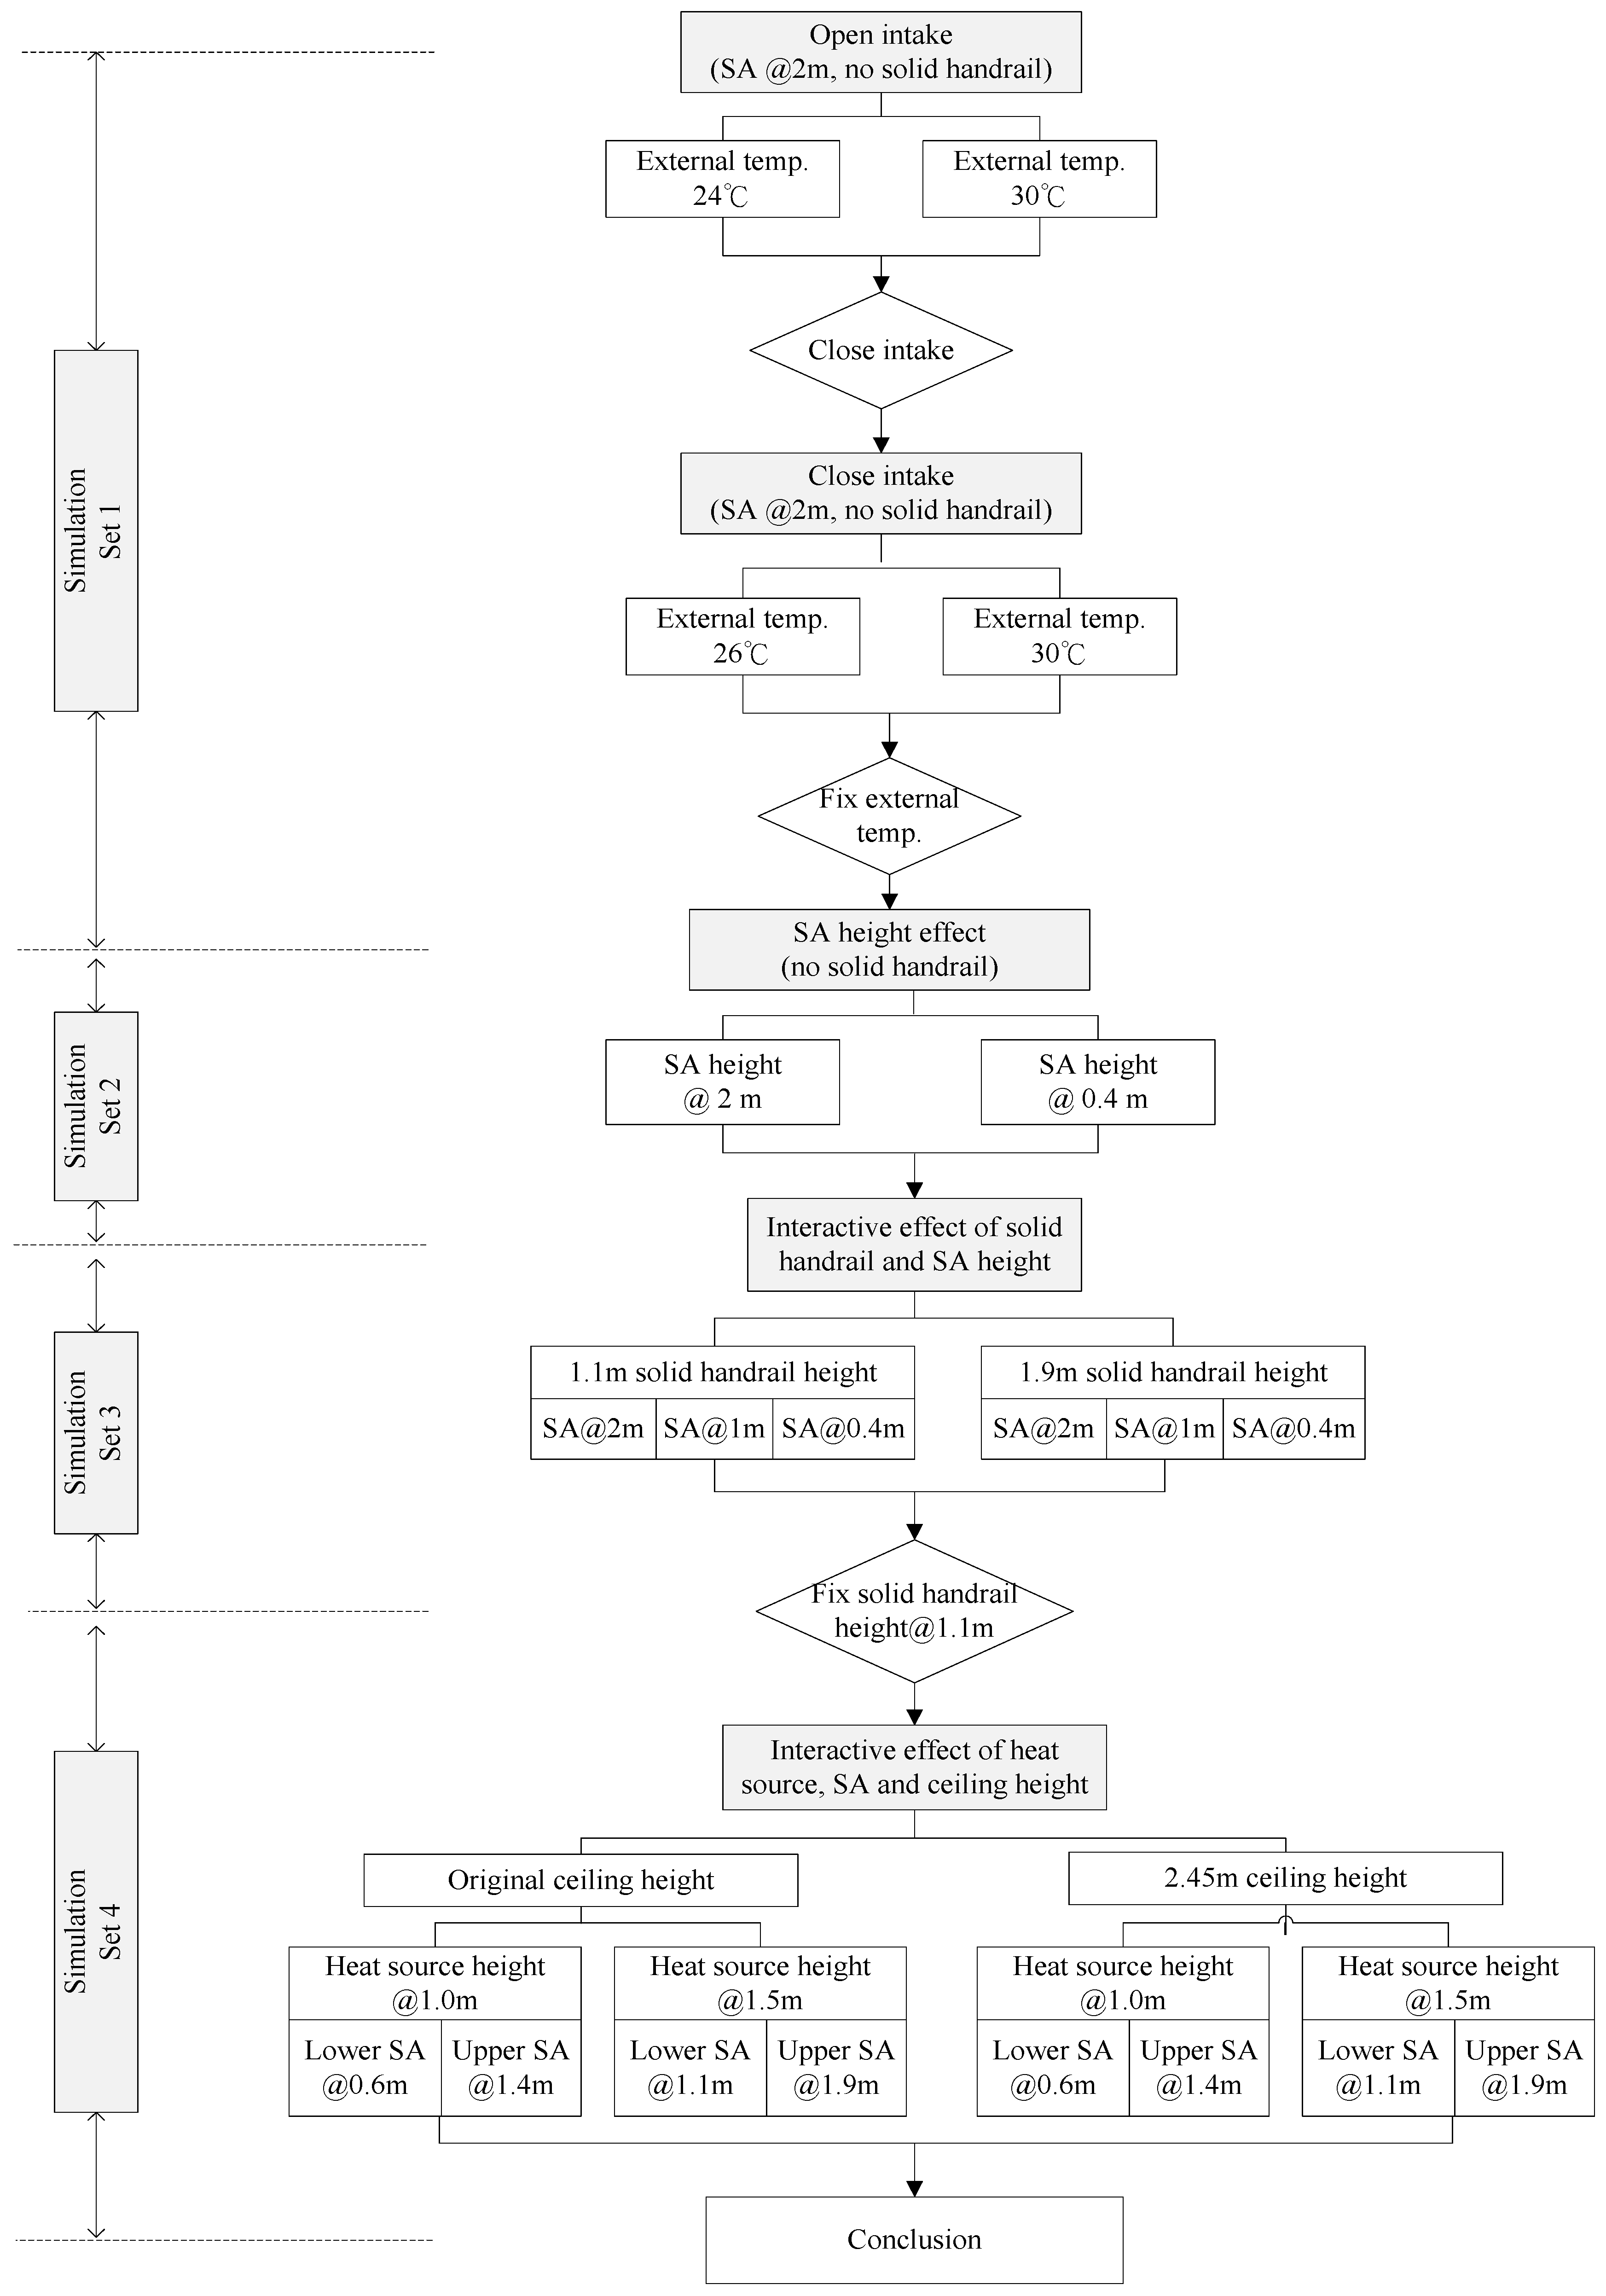
Figure 6.
Research procedure.
Figure 6.
Research procedure.
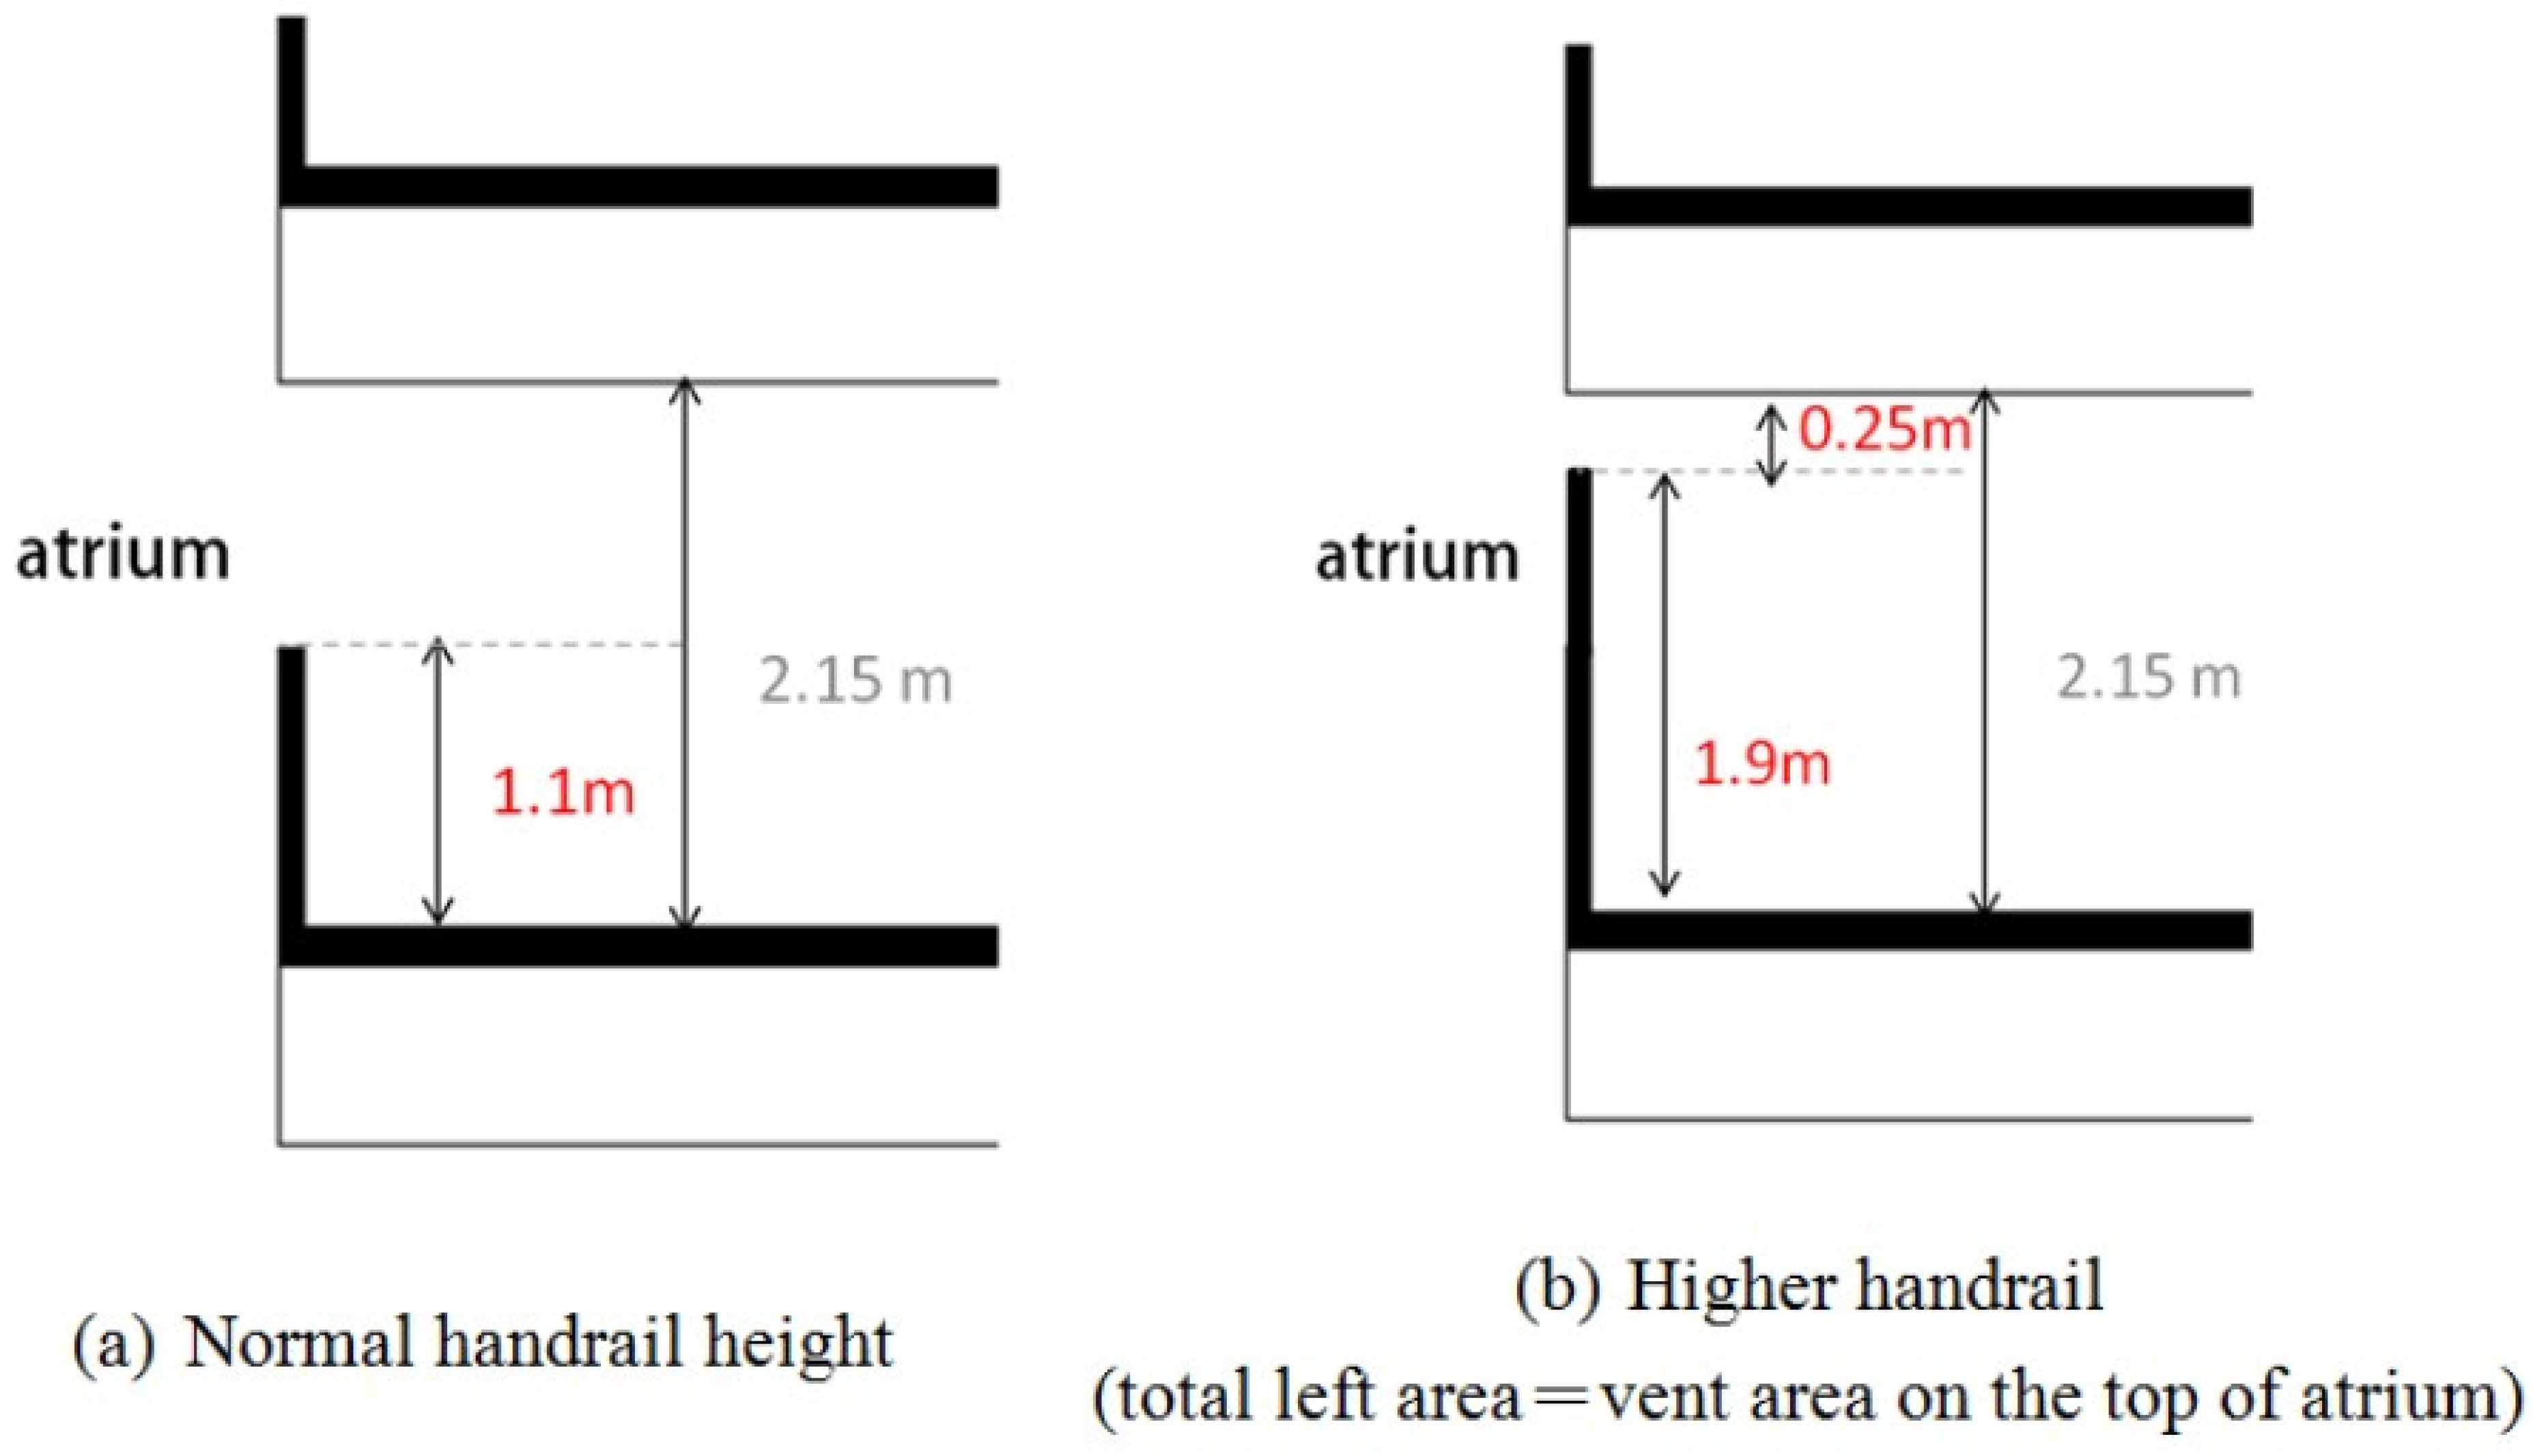
Figure 7.
Handrail height settings.
Figure 7.
Handrail height settings.
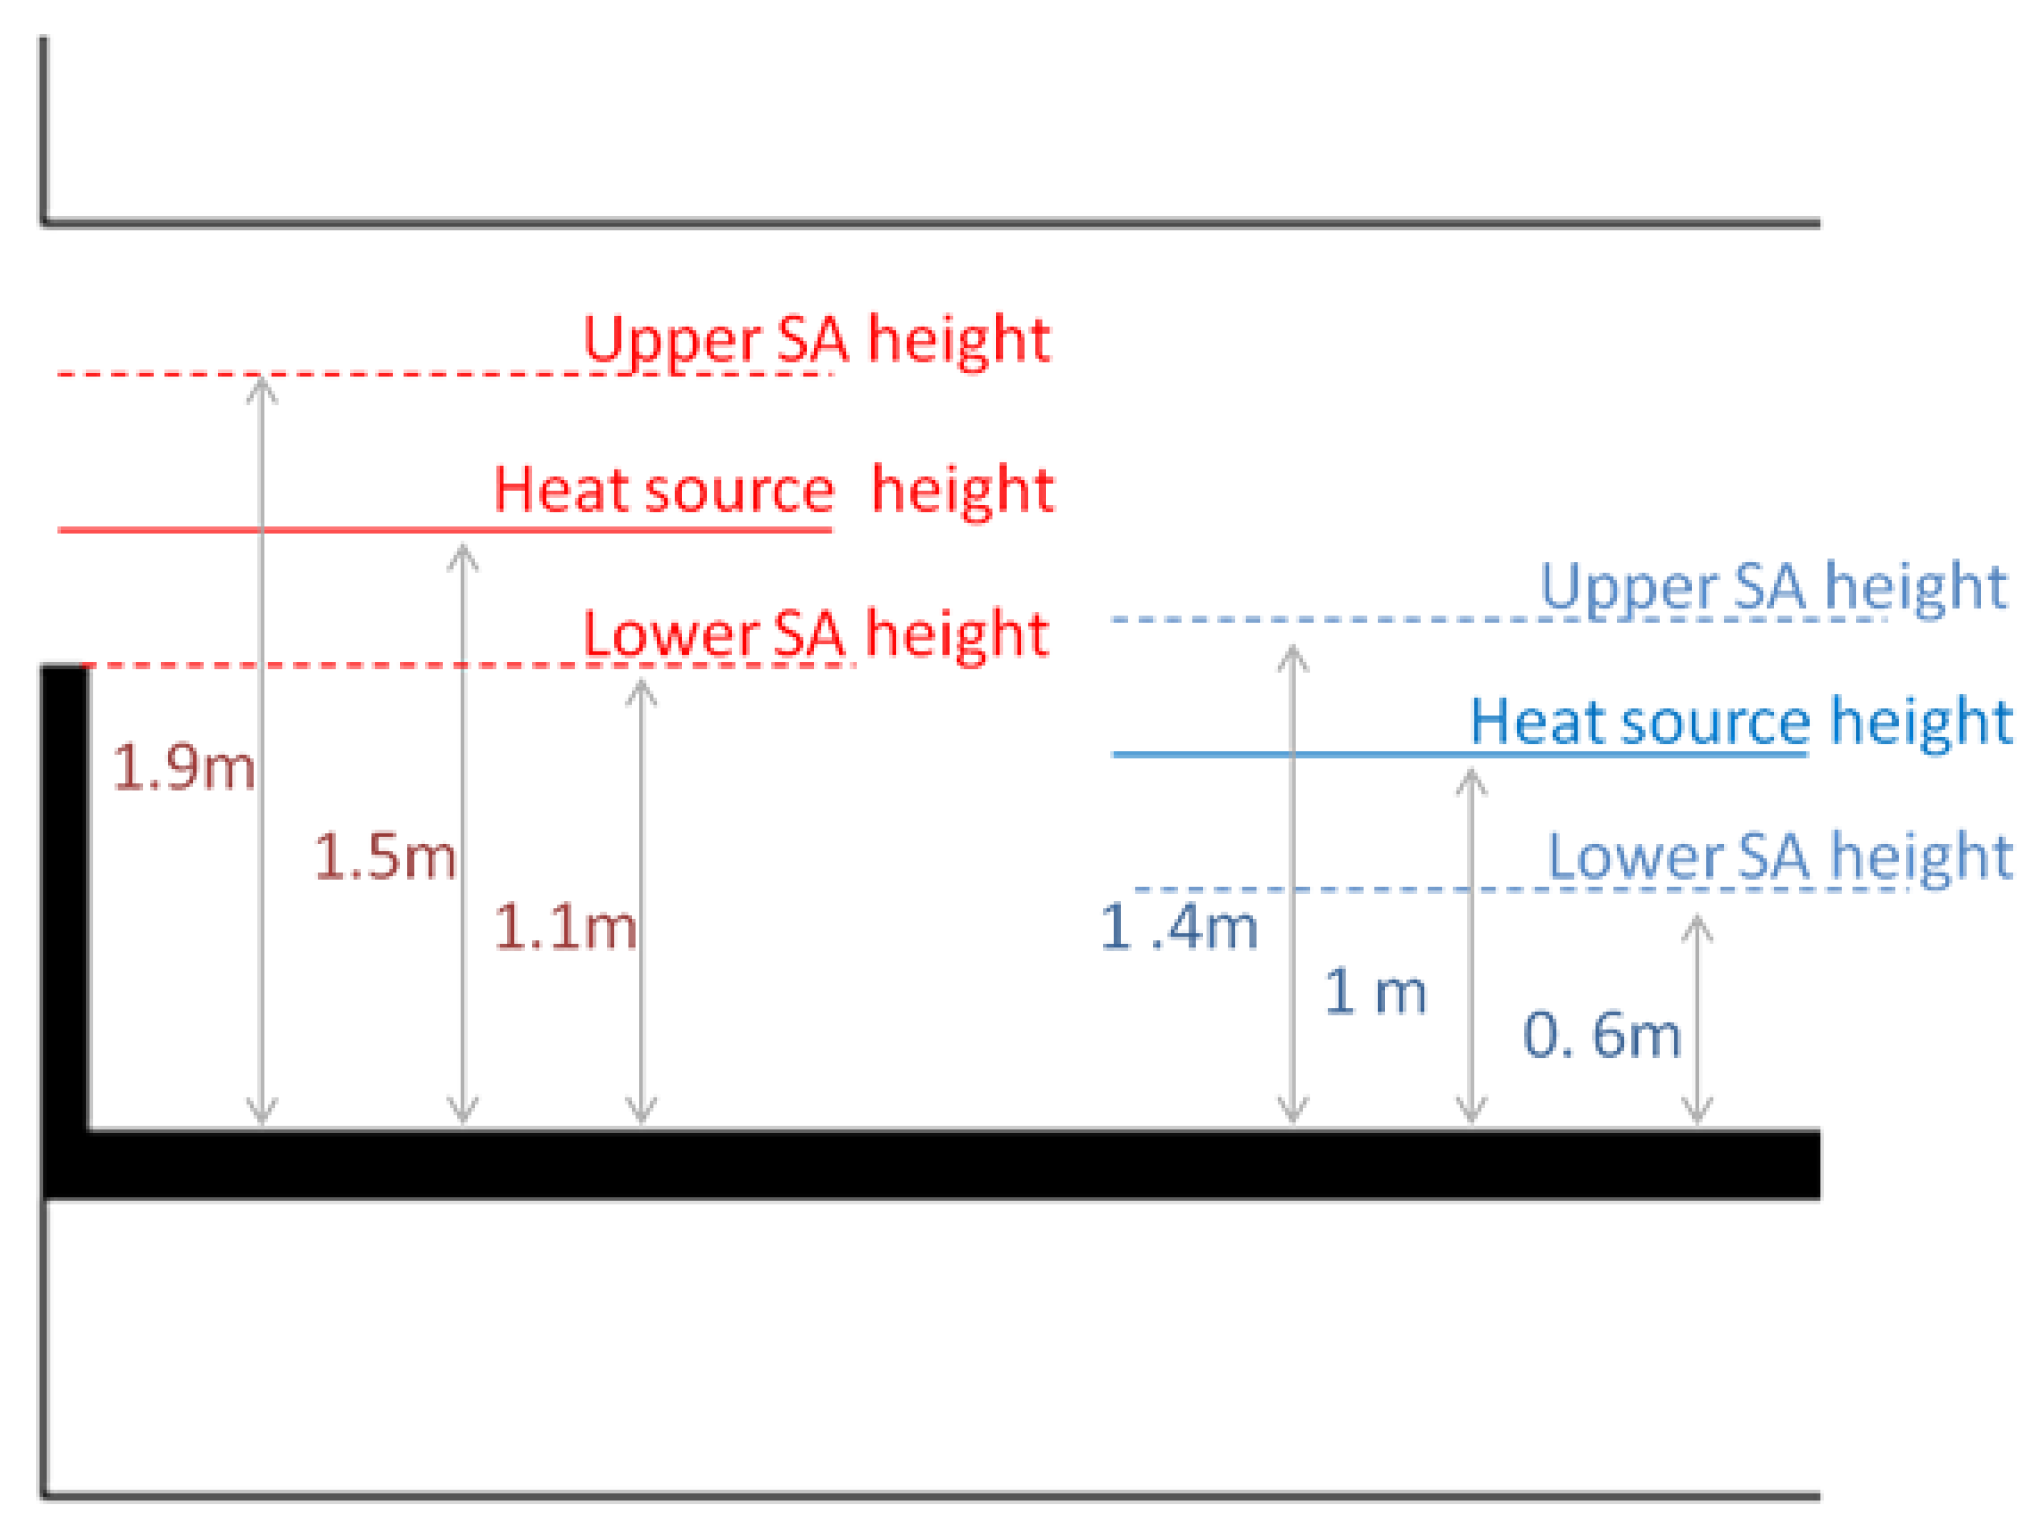
Figure 8.
Heat source height settings.
Figure 8.
Heat source height settings.
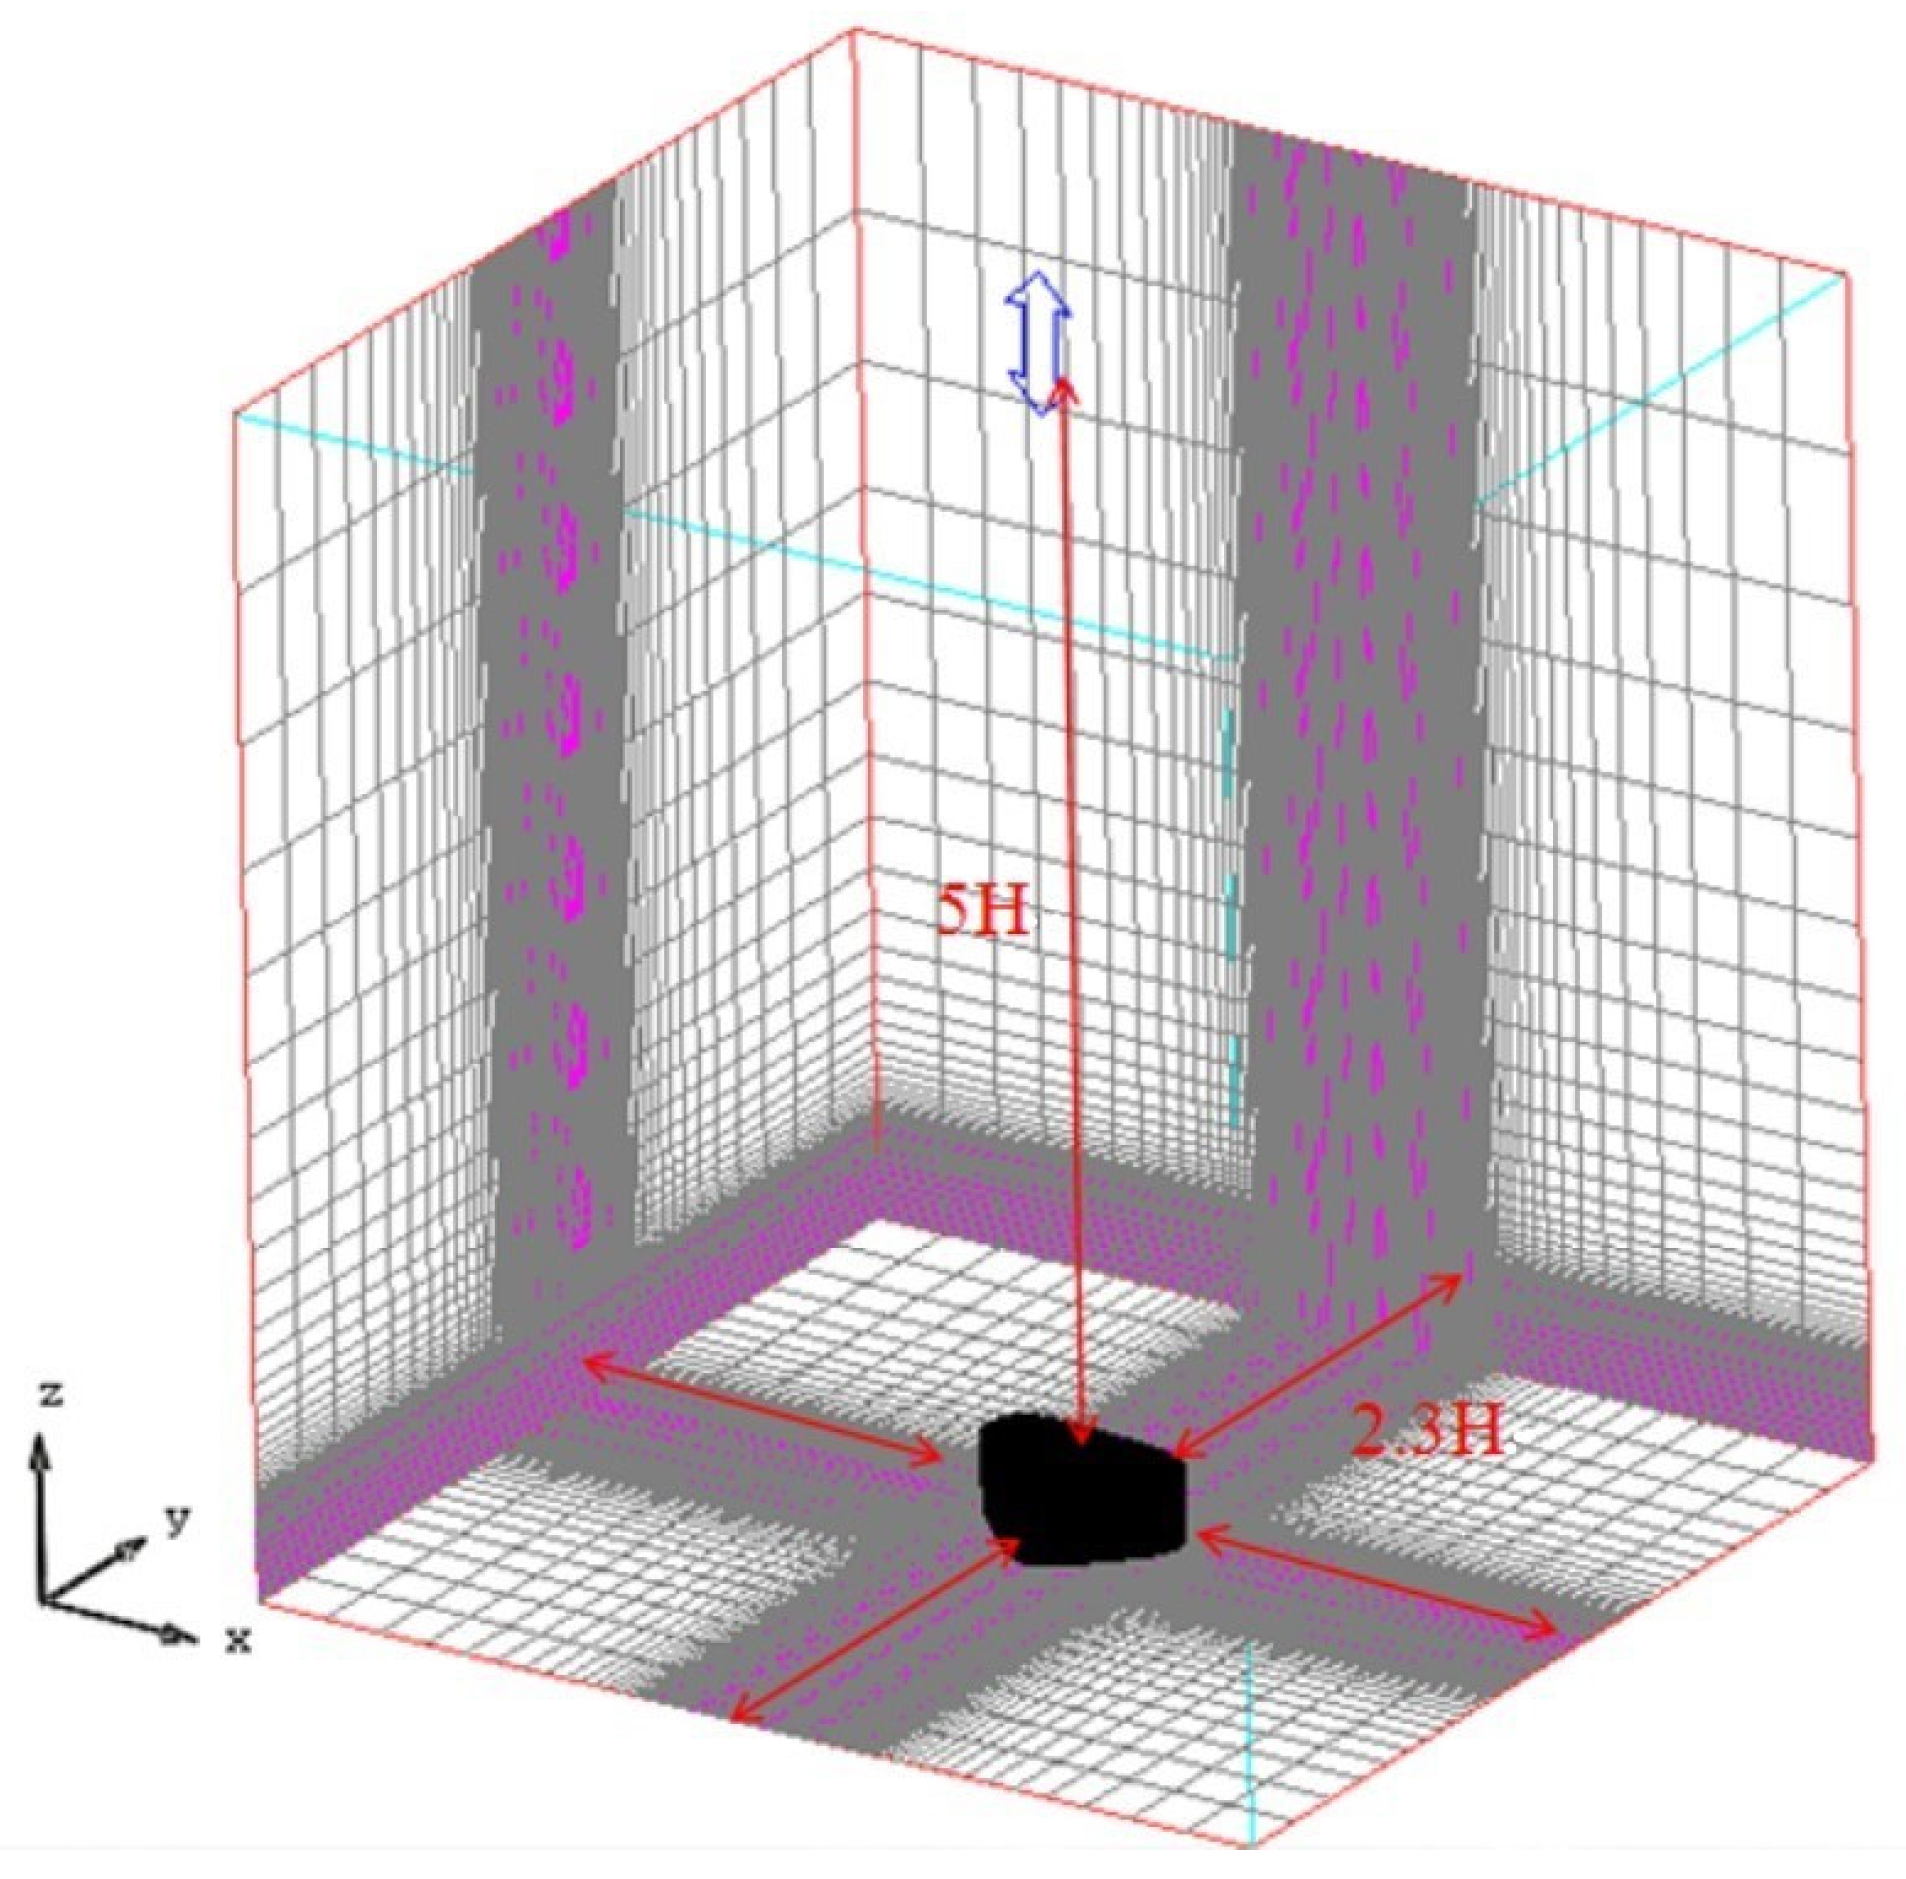
Figure 9.
Computational domain.
Figure 9.
Computational domain.
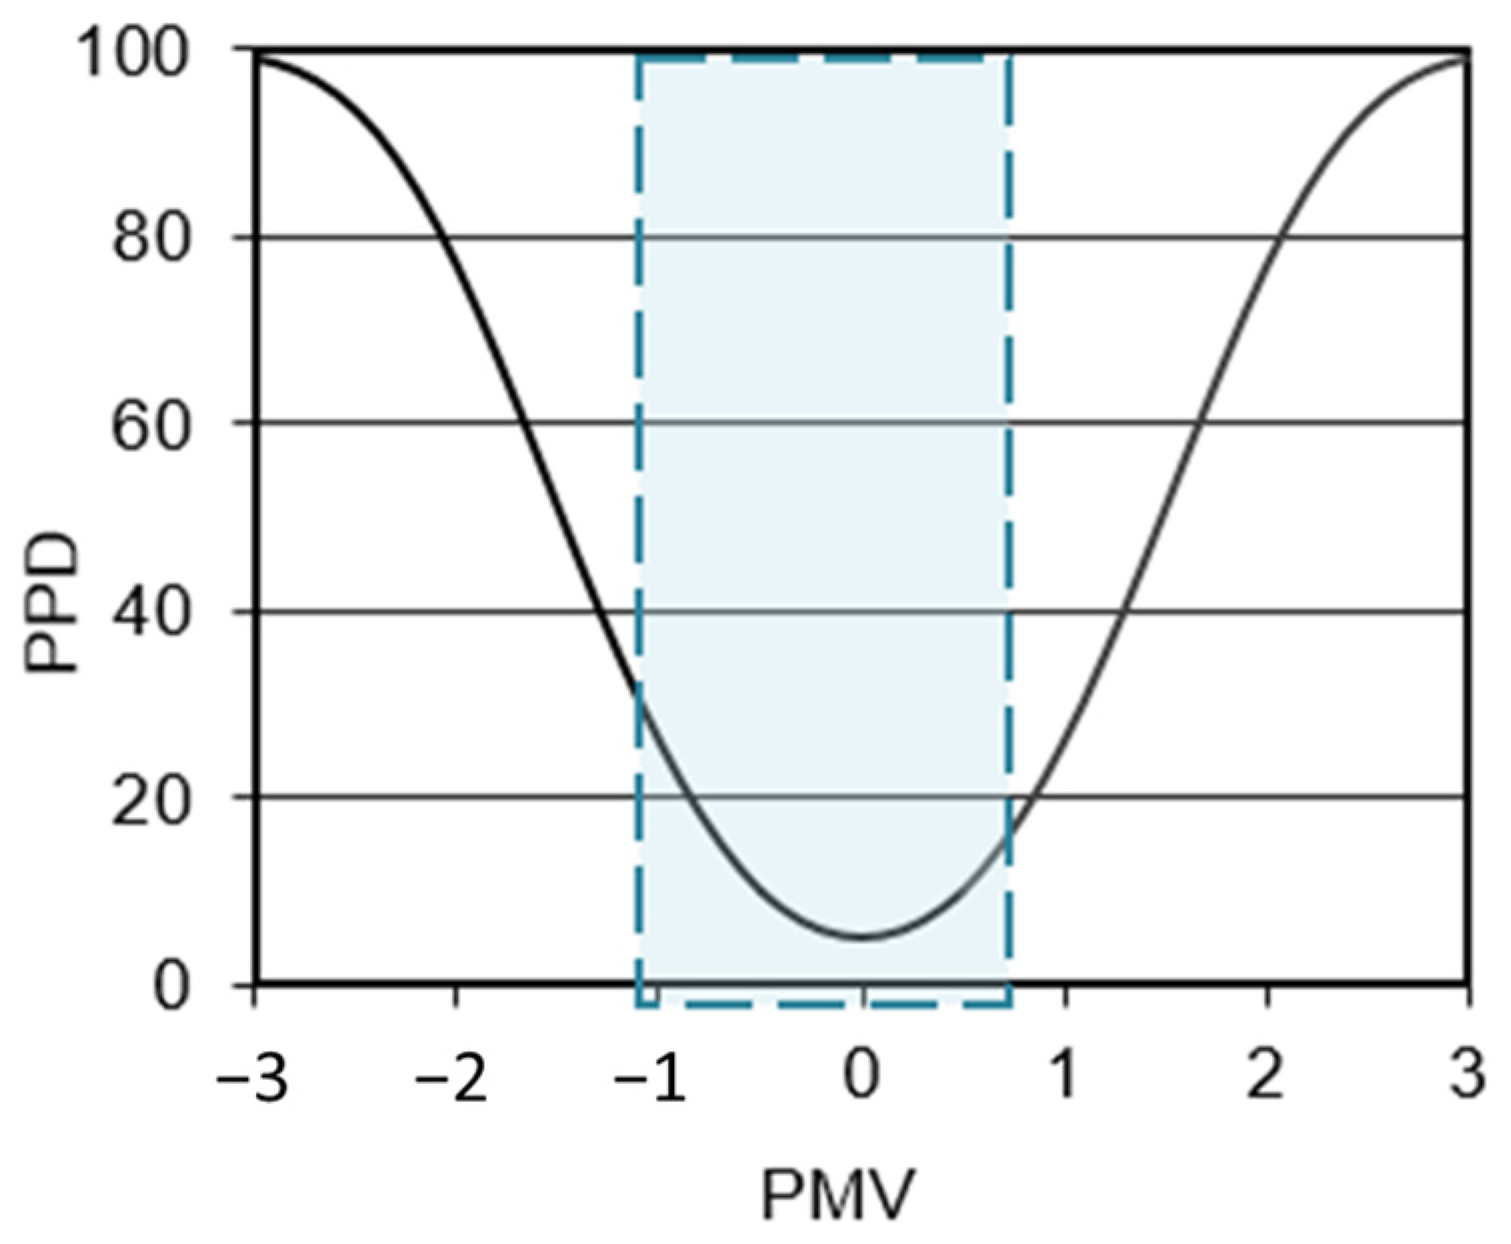
Figure 10.
Comfort zone adopted in the present study.
Figure 10.
Comfort zone adopted in the present study.
Figure 11.
The comparison of neutral level between this study and Linden’s equation.
Figure 11.
The comparison of neutral level between this study and Linden’s equation.
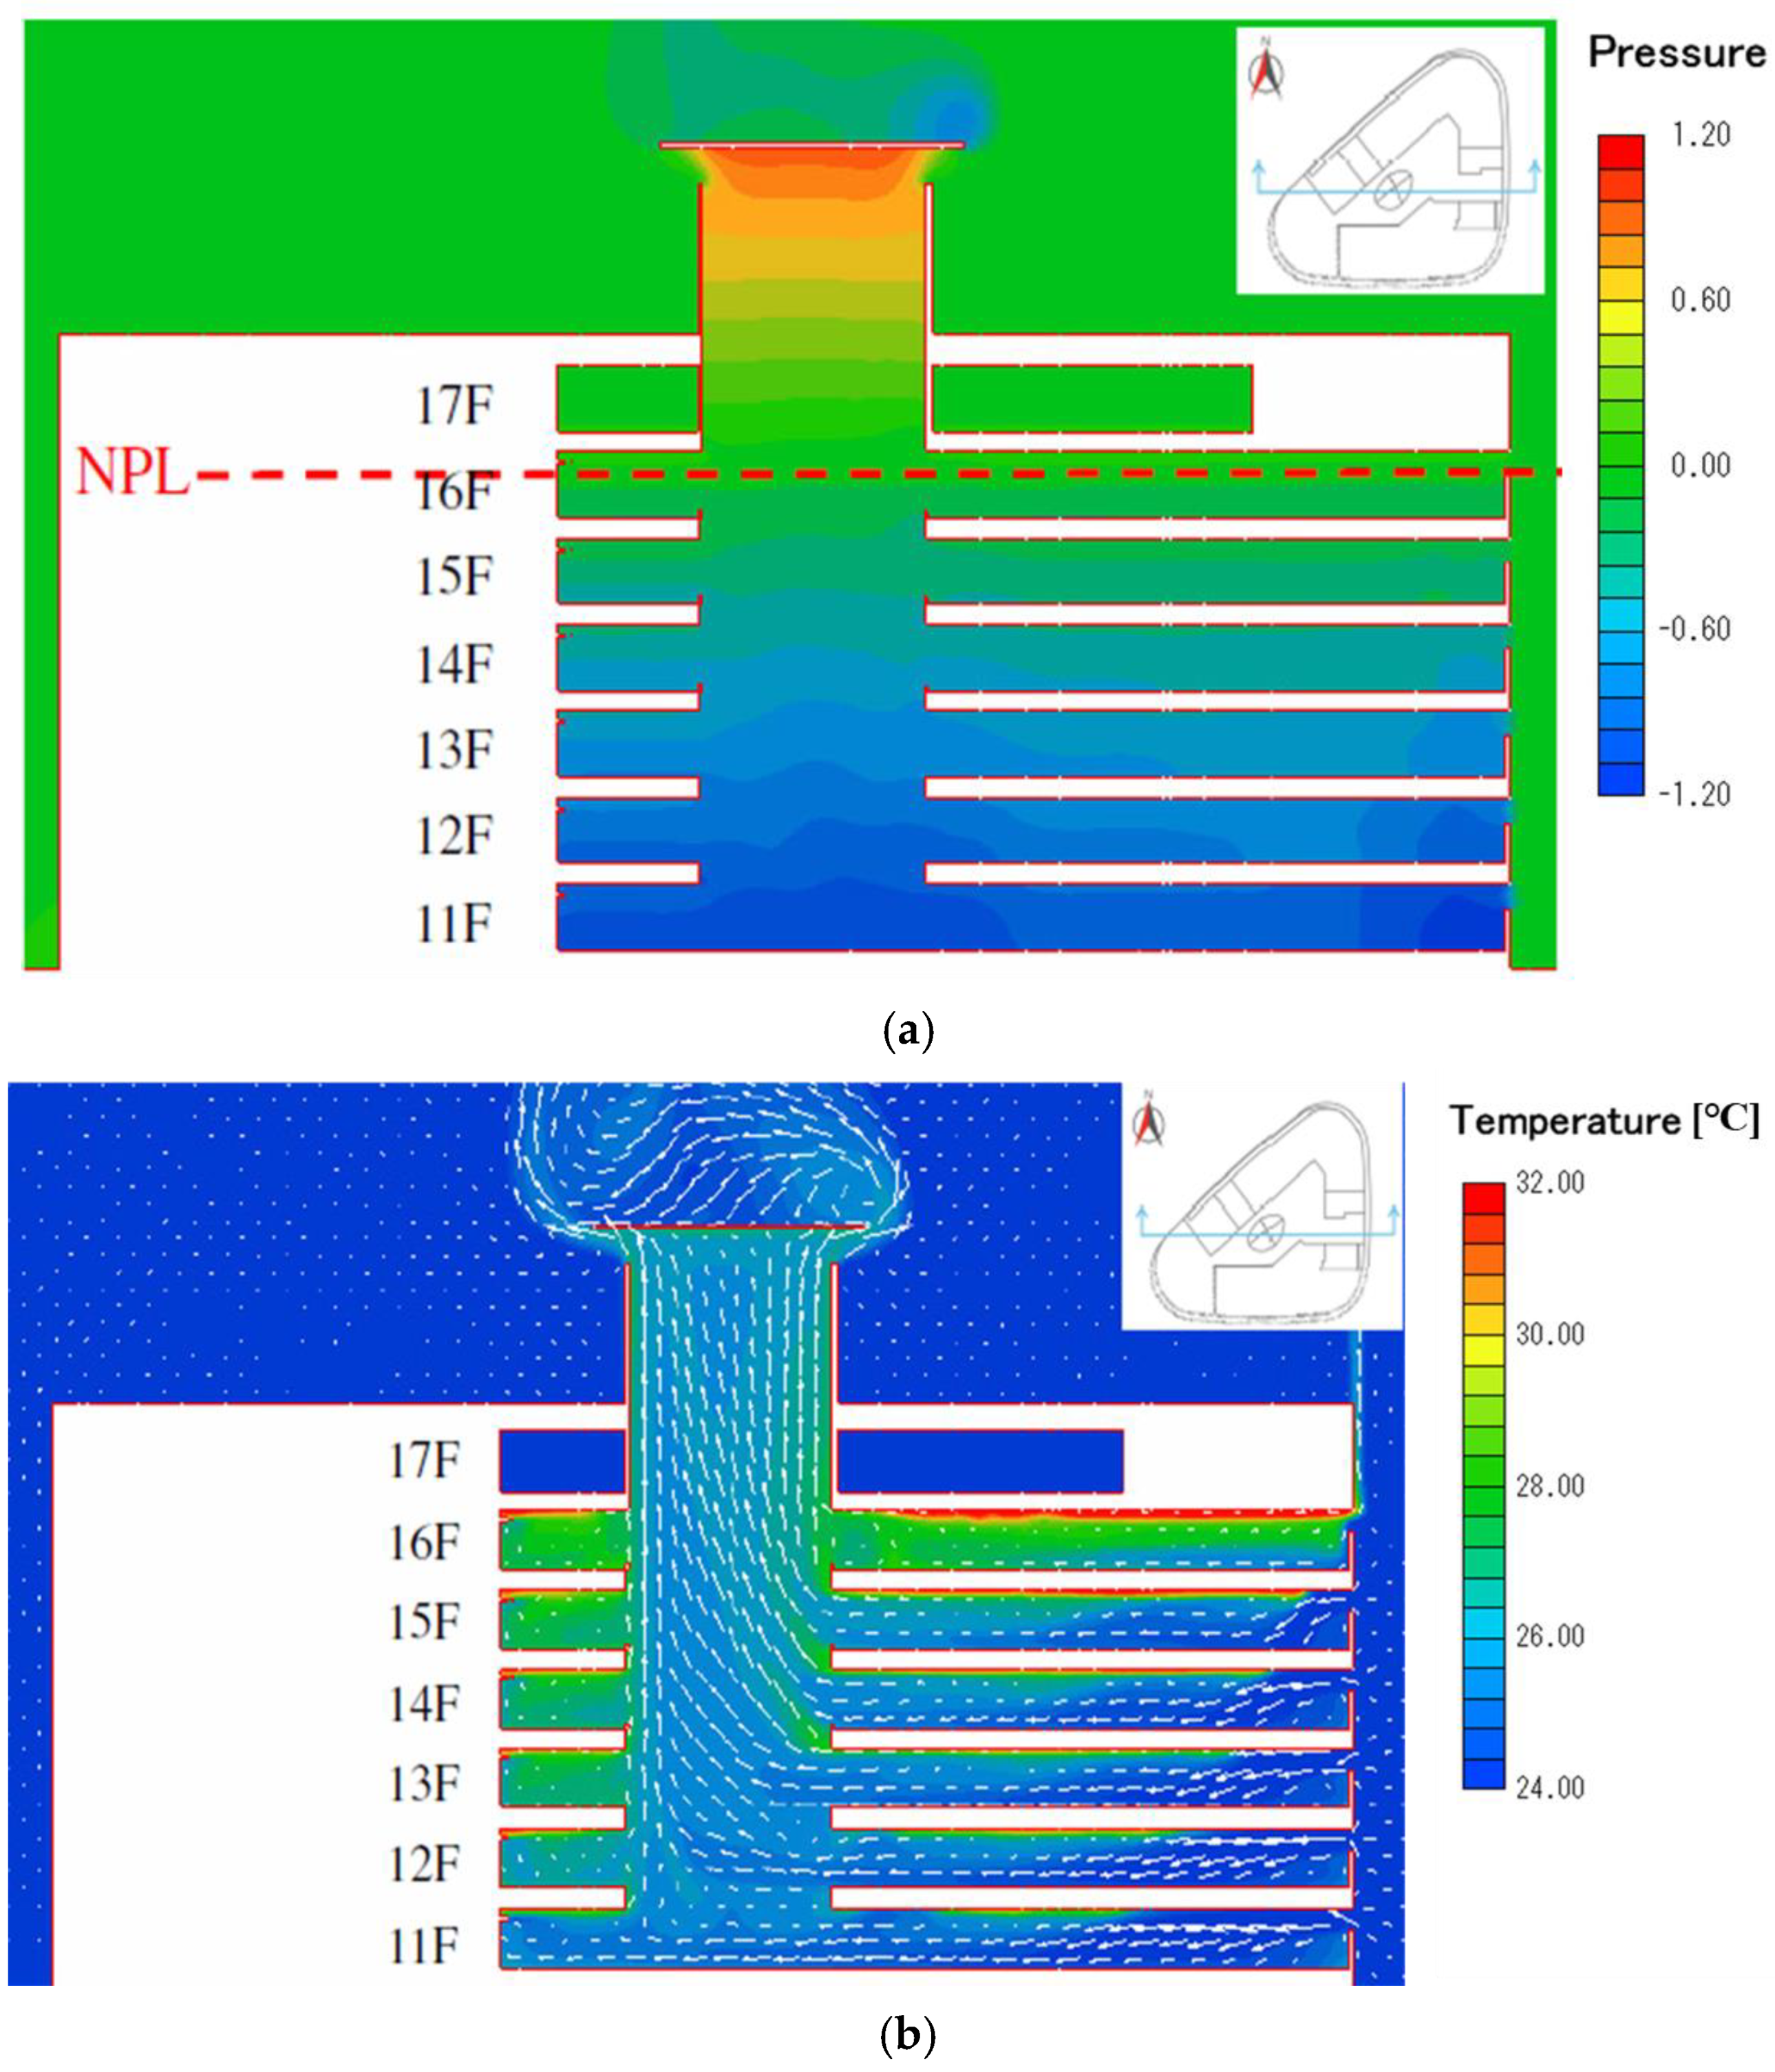
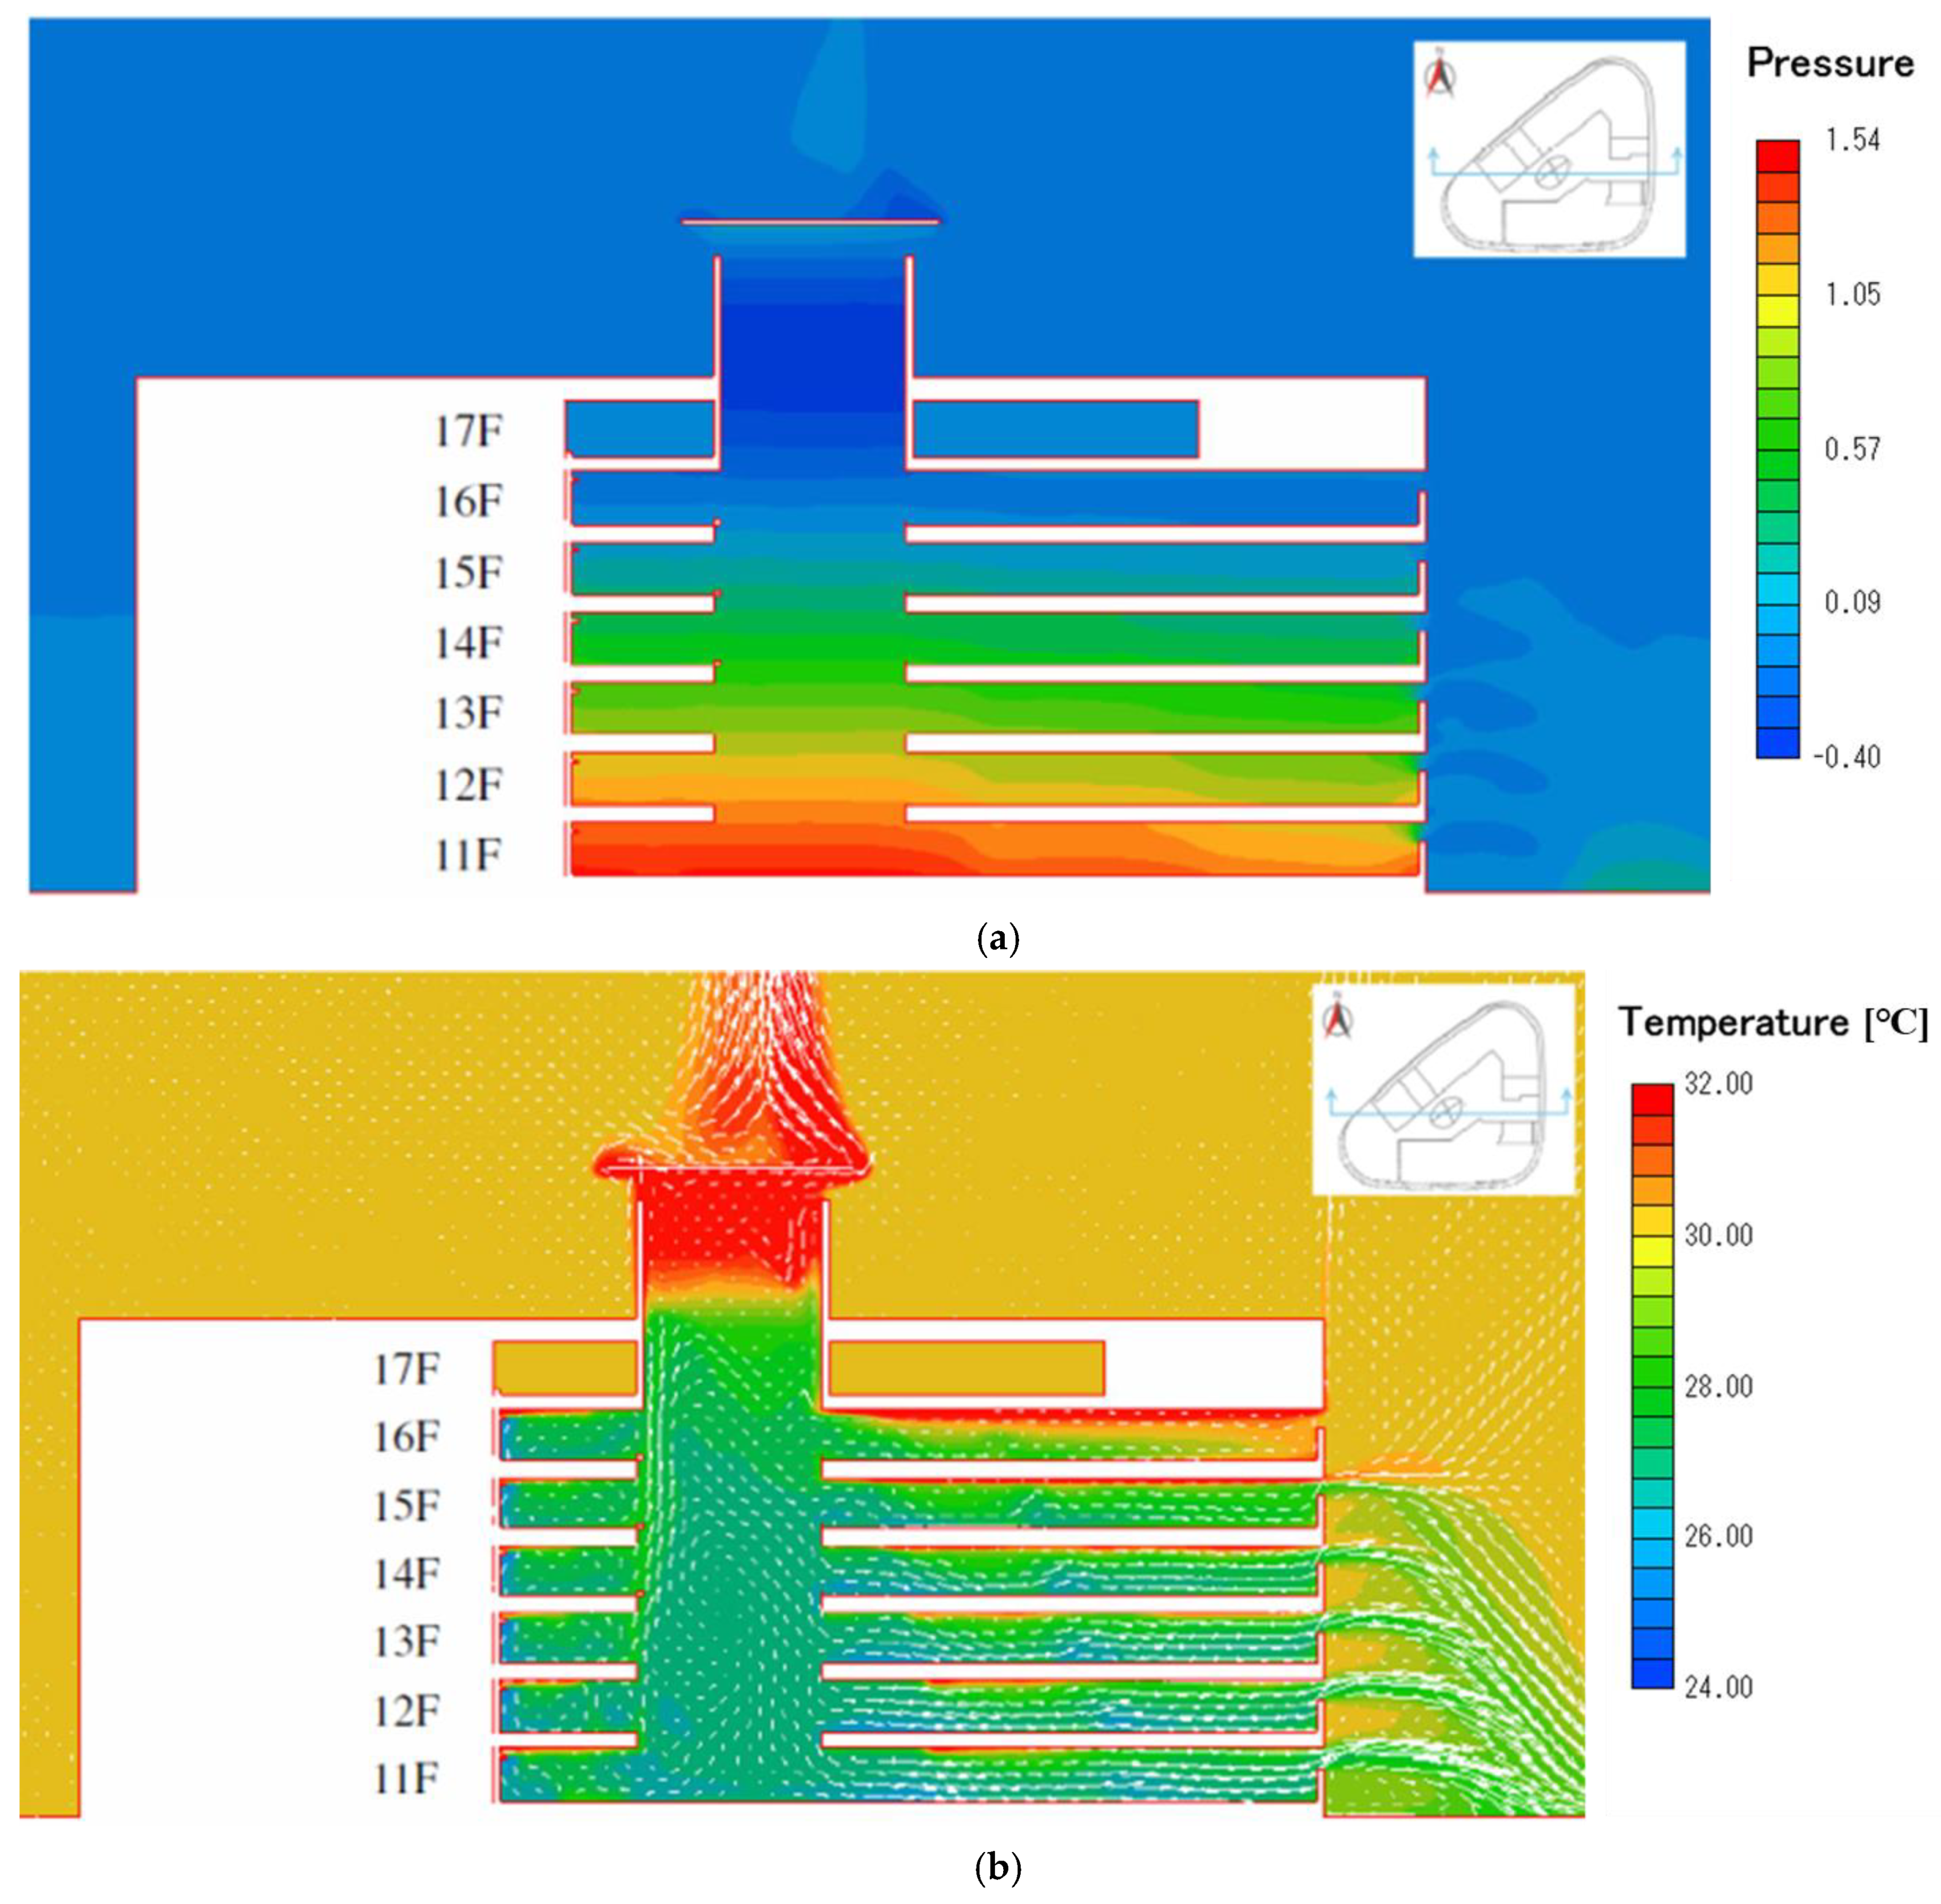
Figure 12.
Simulation at 24 °C when both external air and cold air from office rooms are applied. (a) Pressure distribution. (b) Temperature contour with flow vectors.
Figure 12.
Simulation at 24 °C when both external air and cold air from office rooms are applied. (a) Pressure distribution. (b) Temperature contour with flow vectors.
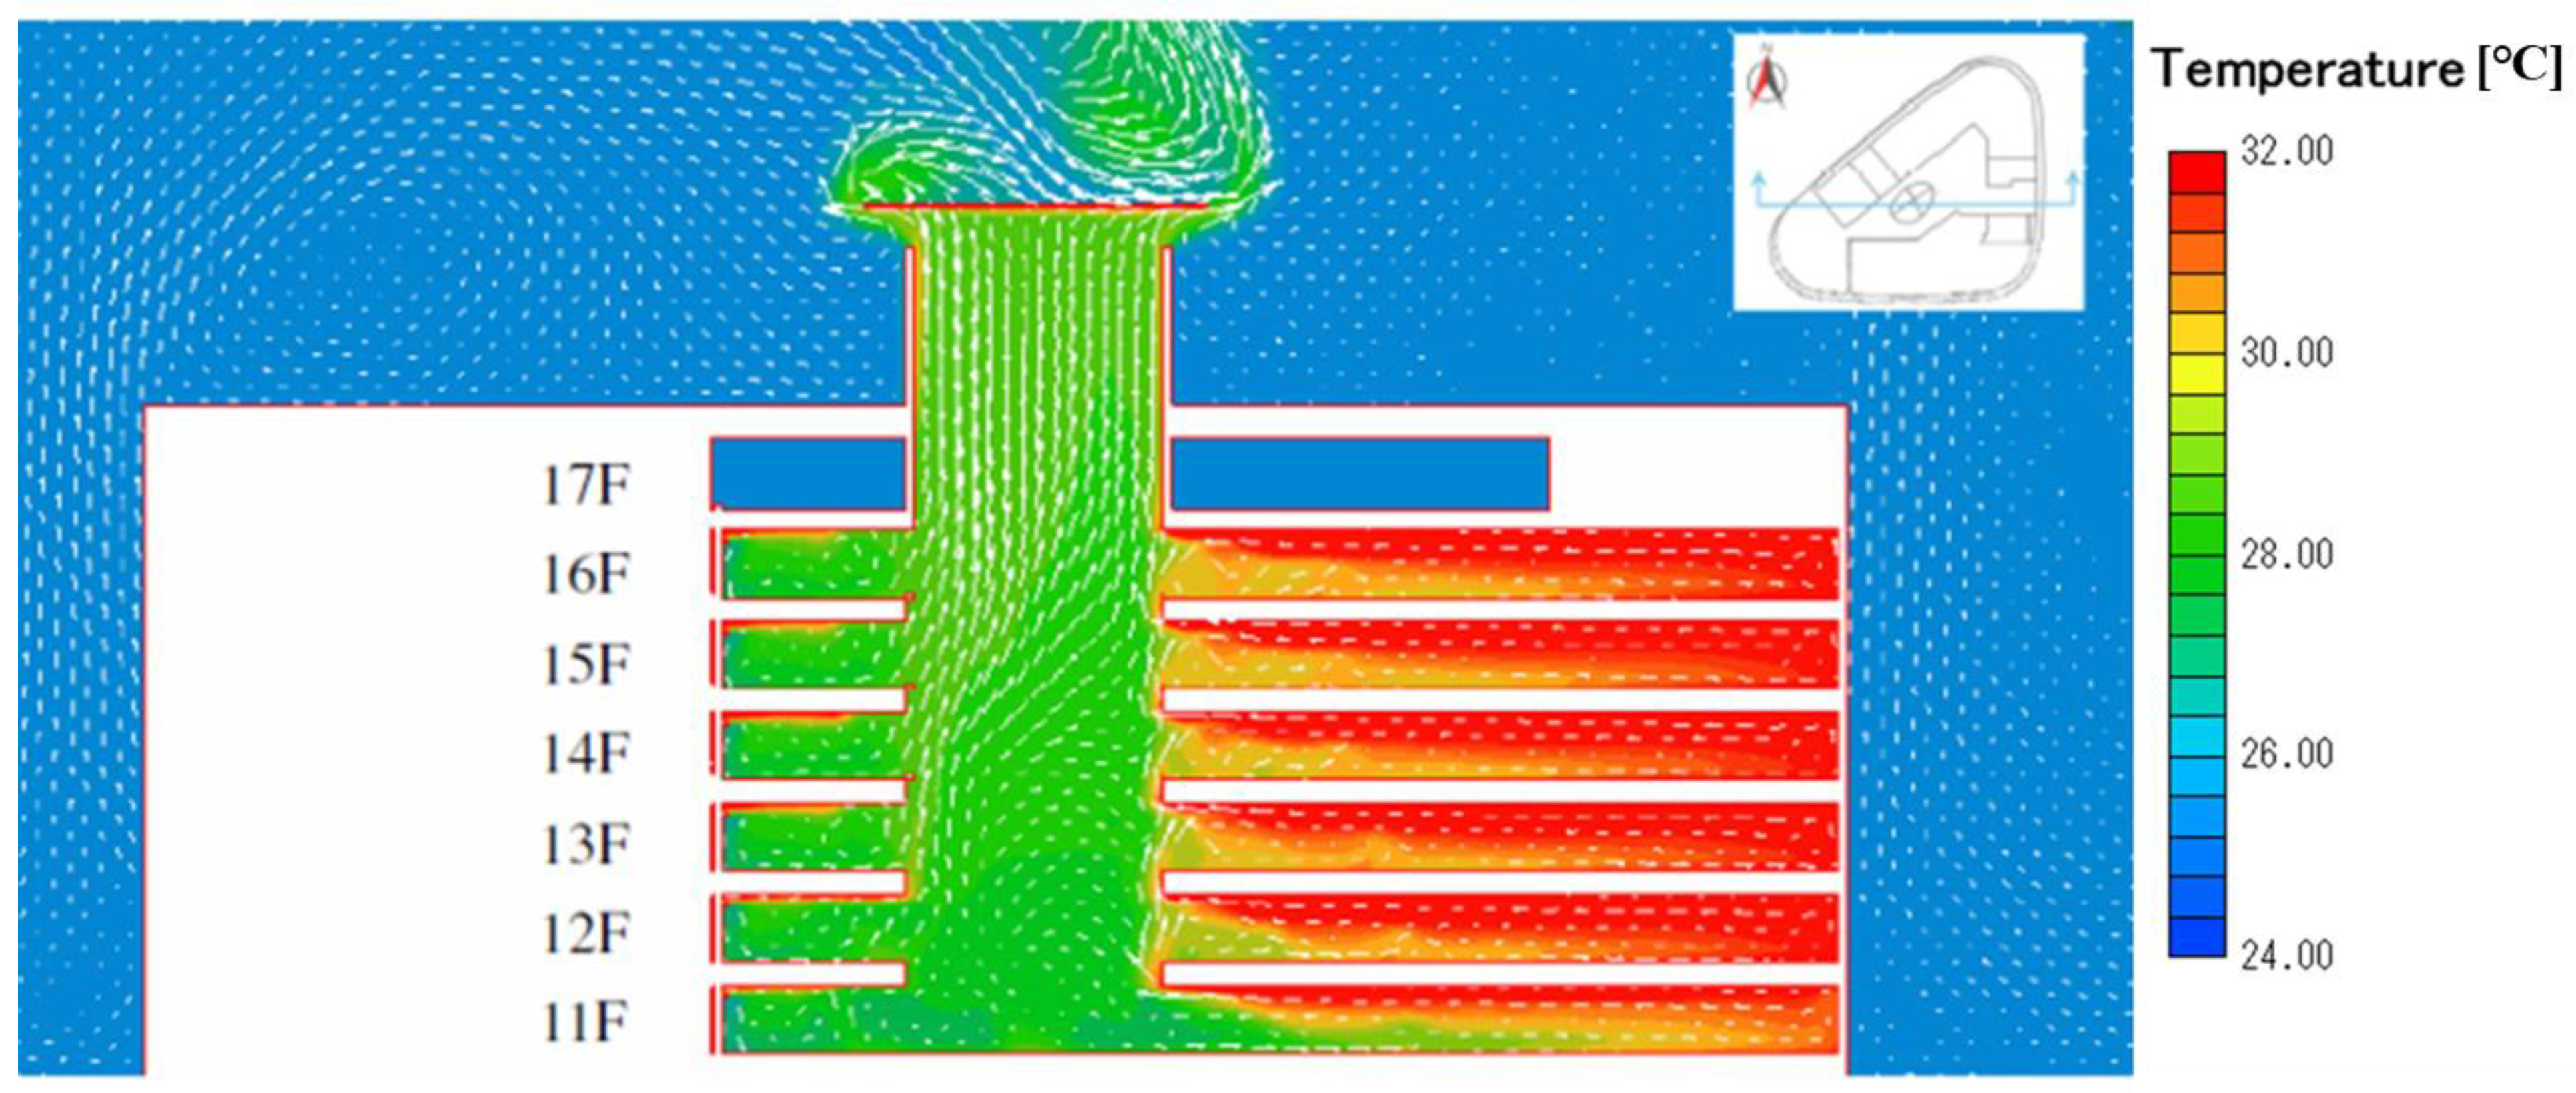
Figure 13.
Simulation at 30 °C when both external air and cold air from office rooms are applied. (a) Pressure distribution. (b) Temperature contour with flow vectors.
Figure 13.
Simulation at 30 °C when both external air and cold air from office rooms are applied. (a) Pressure distribution. (b) Temperature contour with flow vectors.
Figure 14.
Temperature distribution with ambient temperature at 26 °C.
Figure 14.
Temperature distribution with ambient temperature at 26 °C.
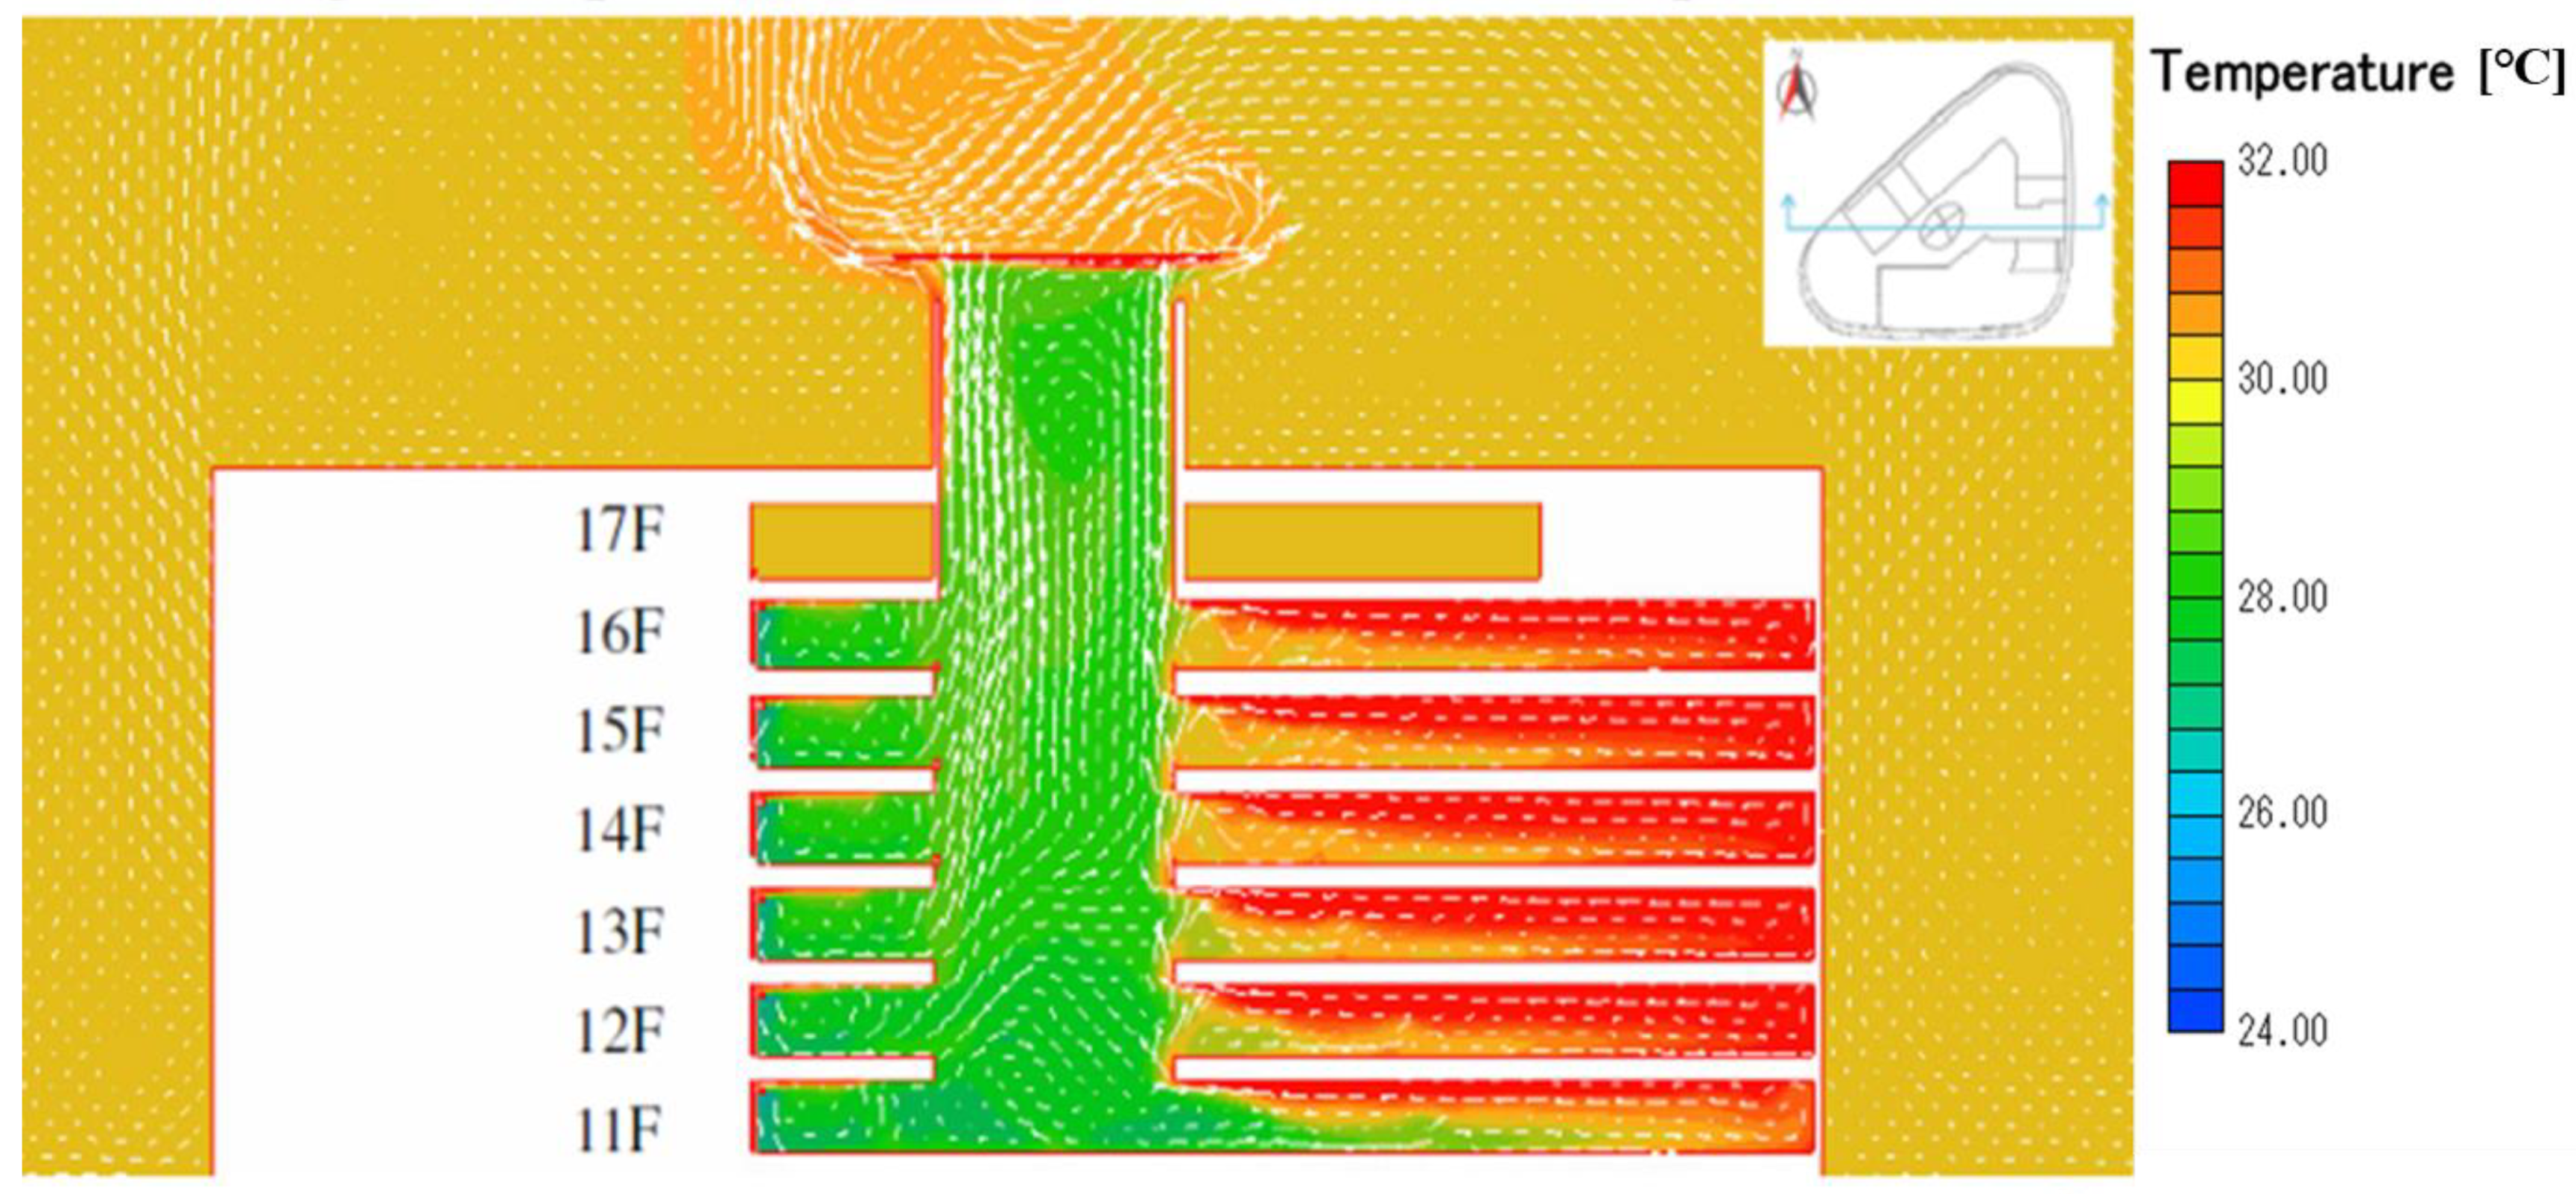
Figure 15.
Temperature distribution with ambient temperature at 30 °C.
Figure 15.
Temperature distribution with ambient temperature at 30 °C.
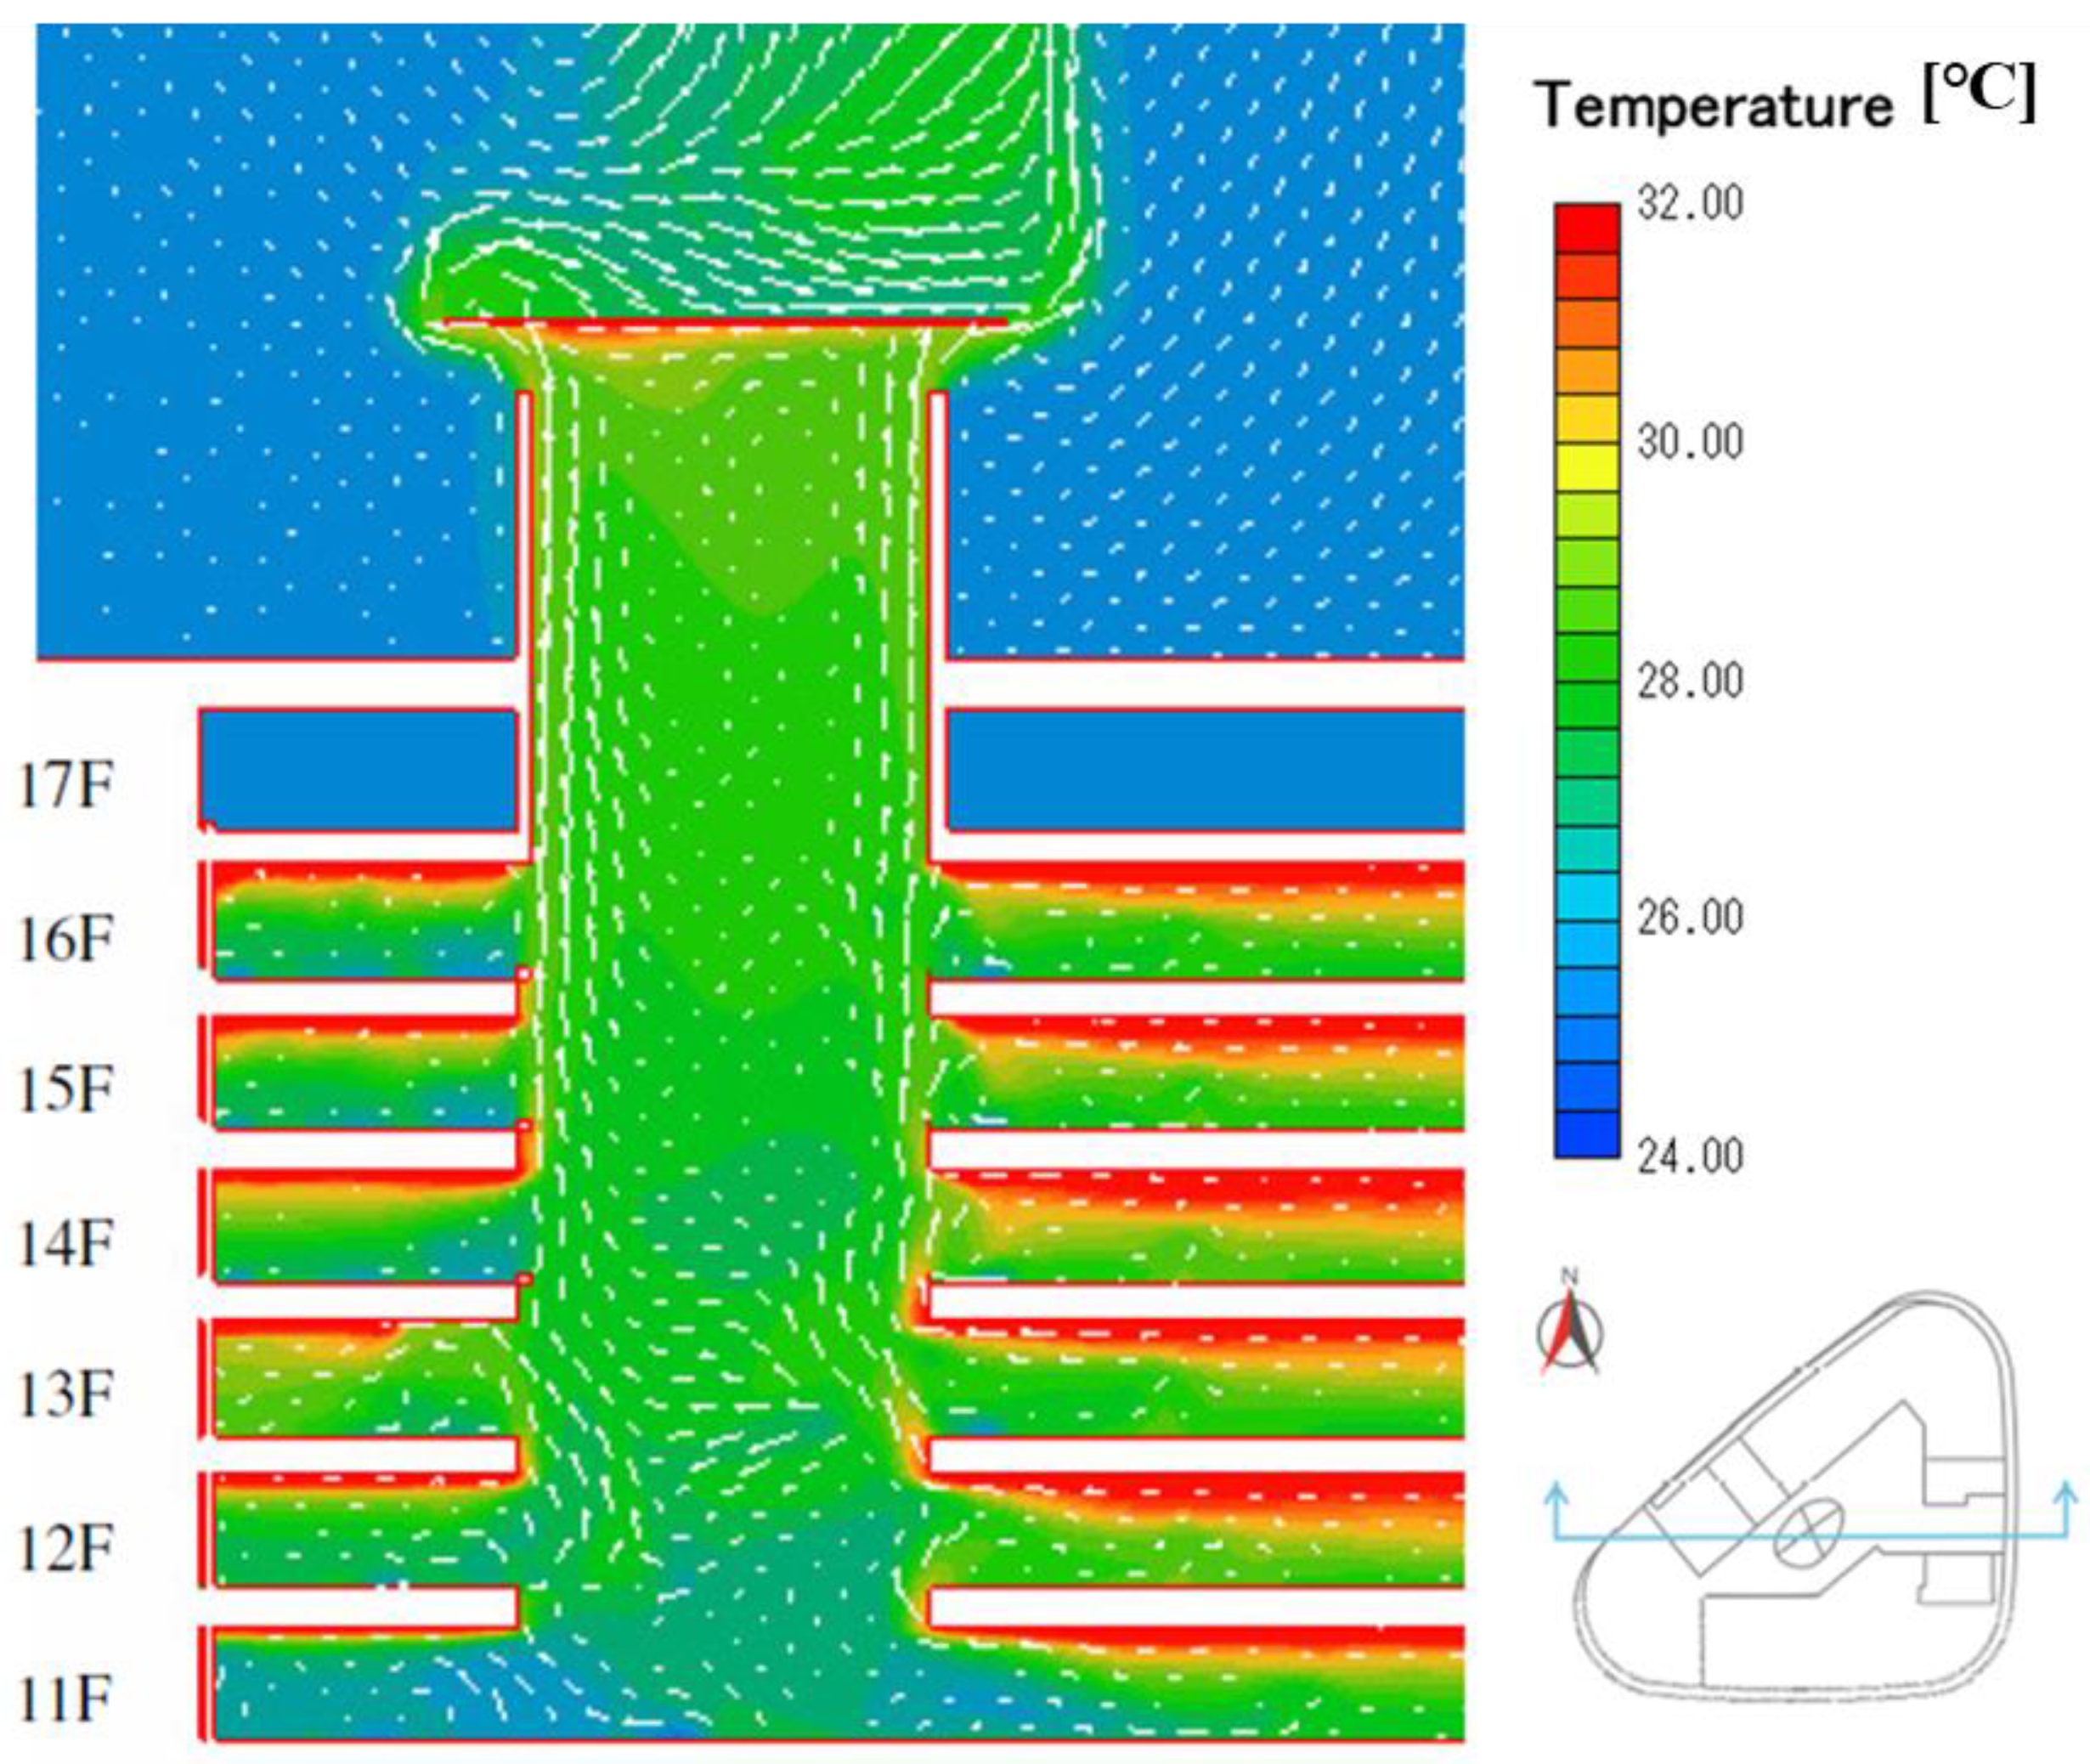
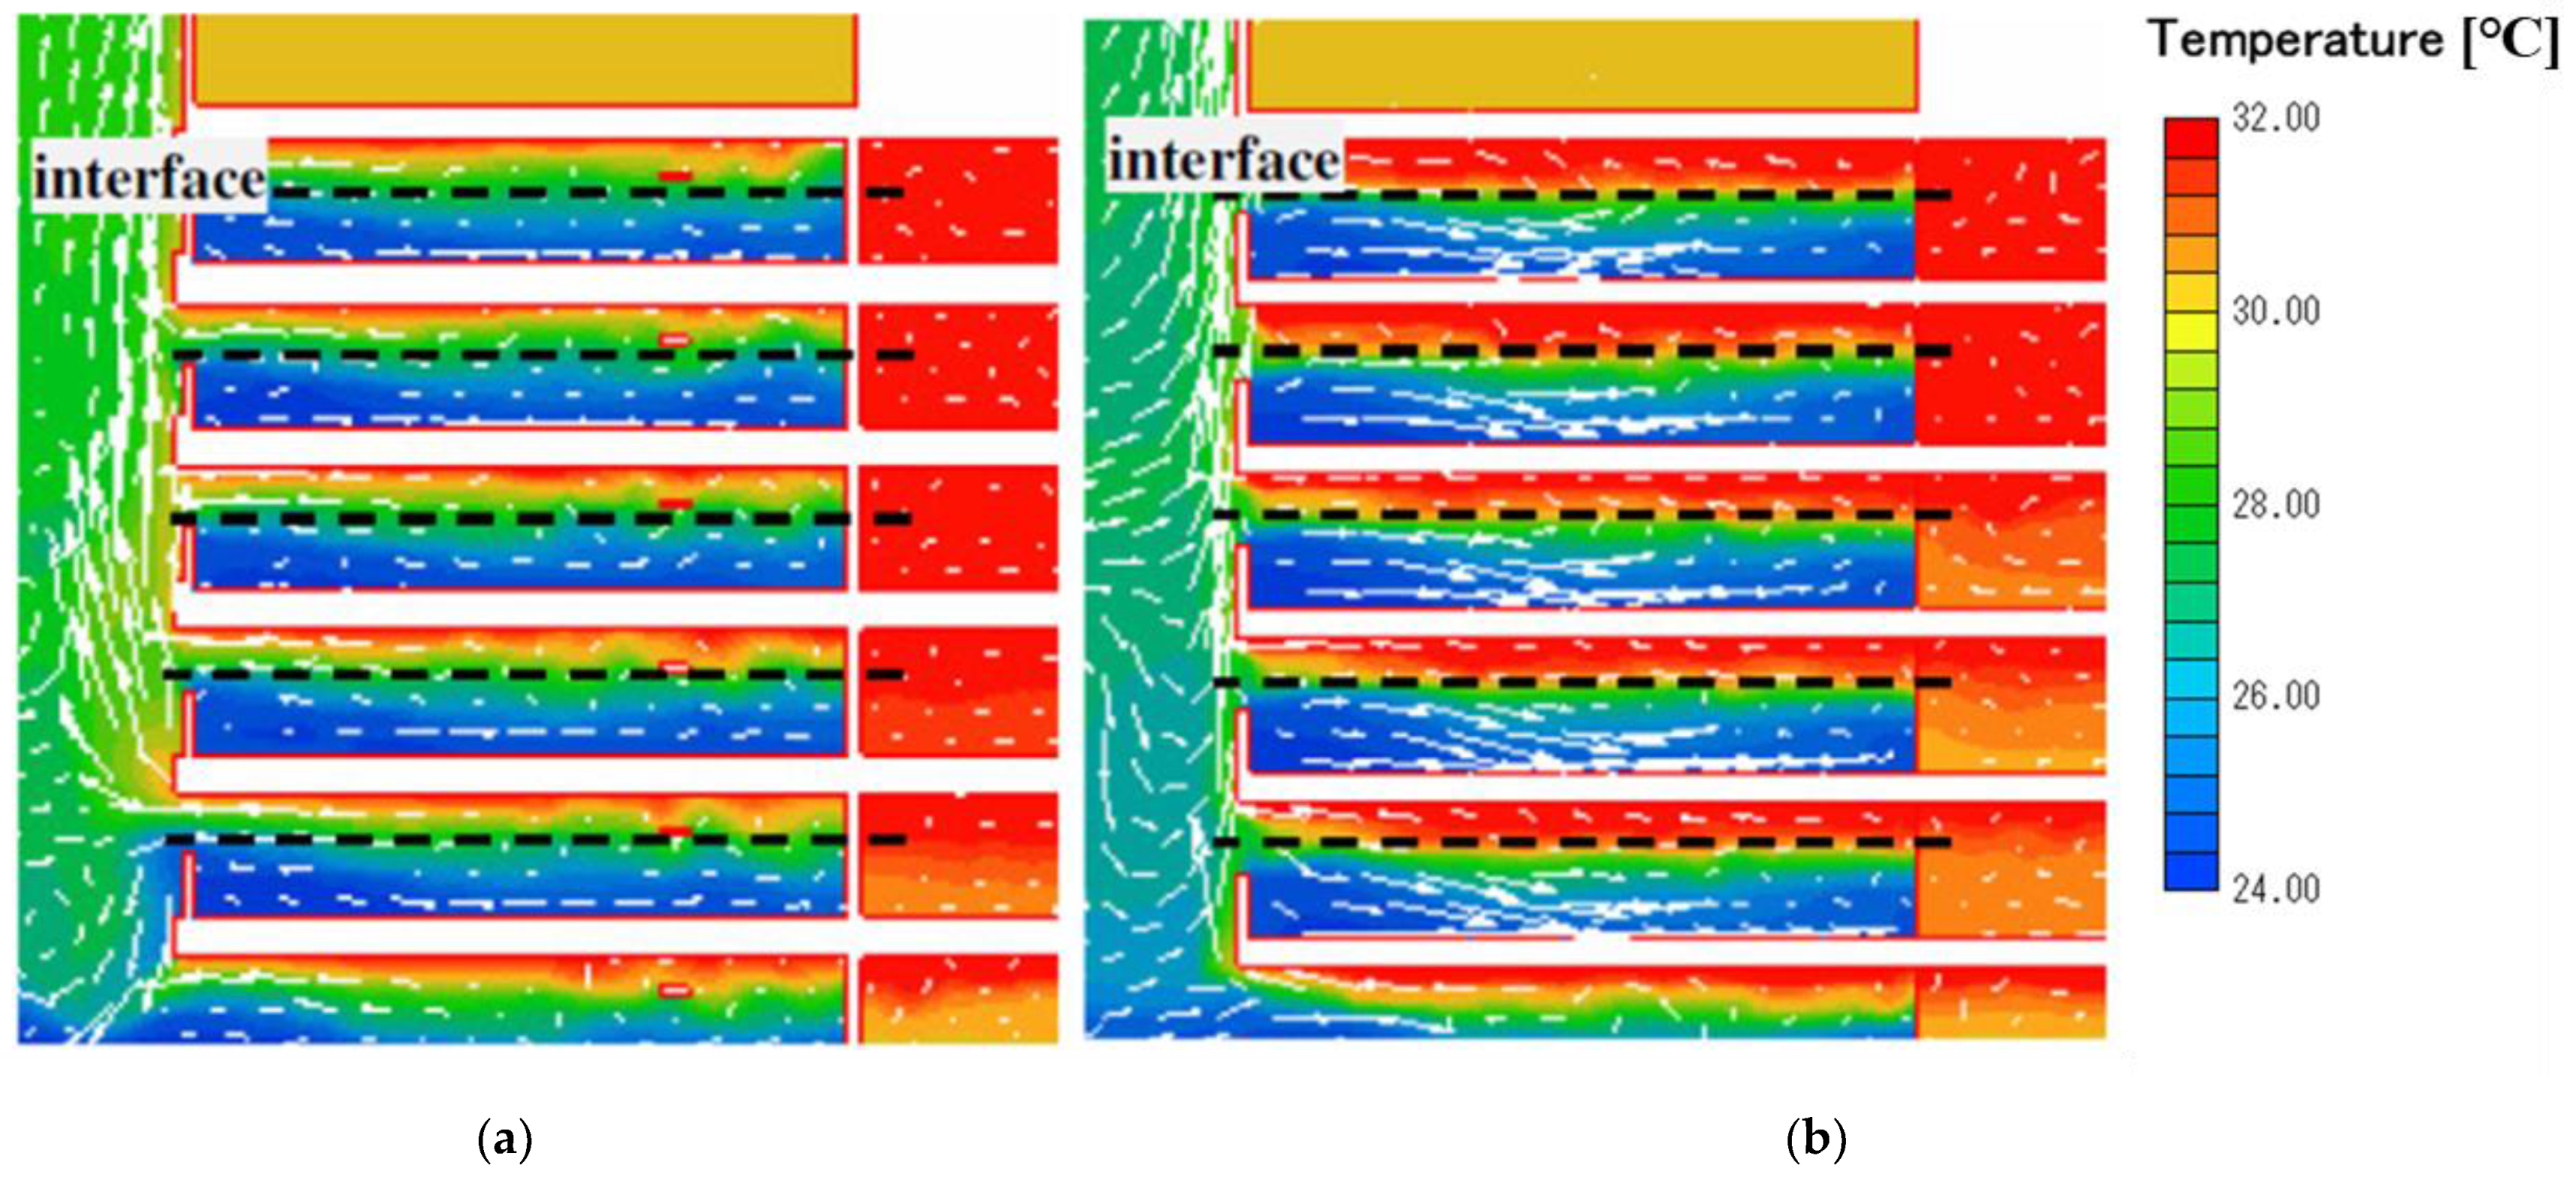
Figure 16.
Temperature distribution in atrium with low SA height (0.4 m).
Figure 16.
Temperature distribution in atrium with low SA height (0.4 m).
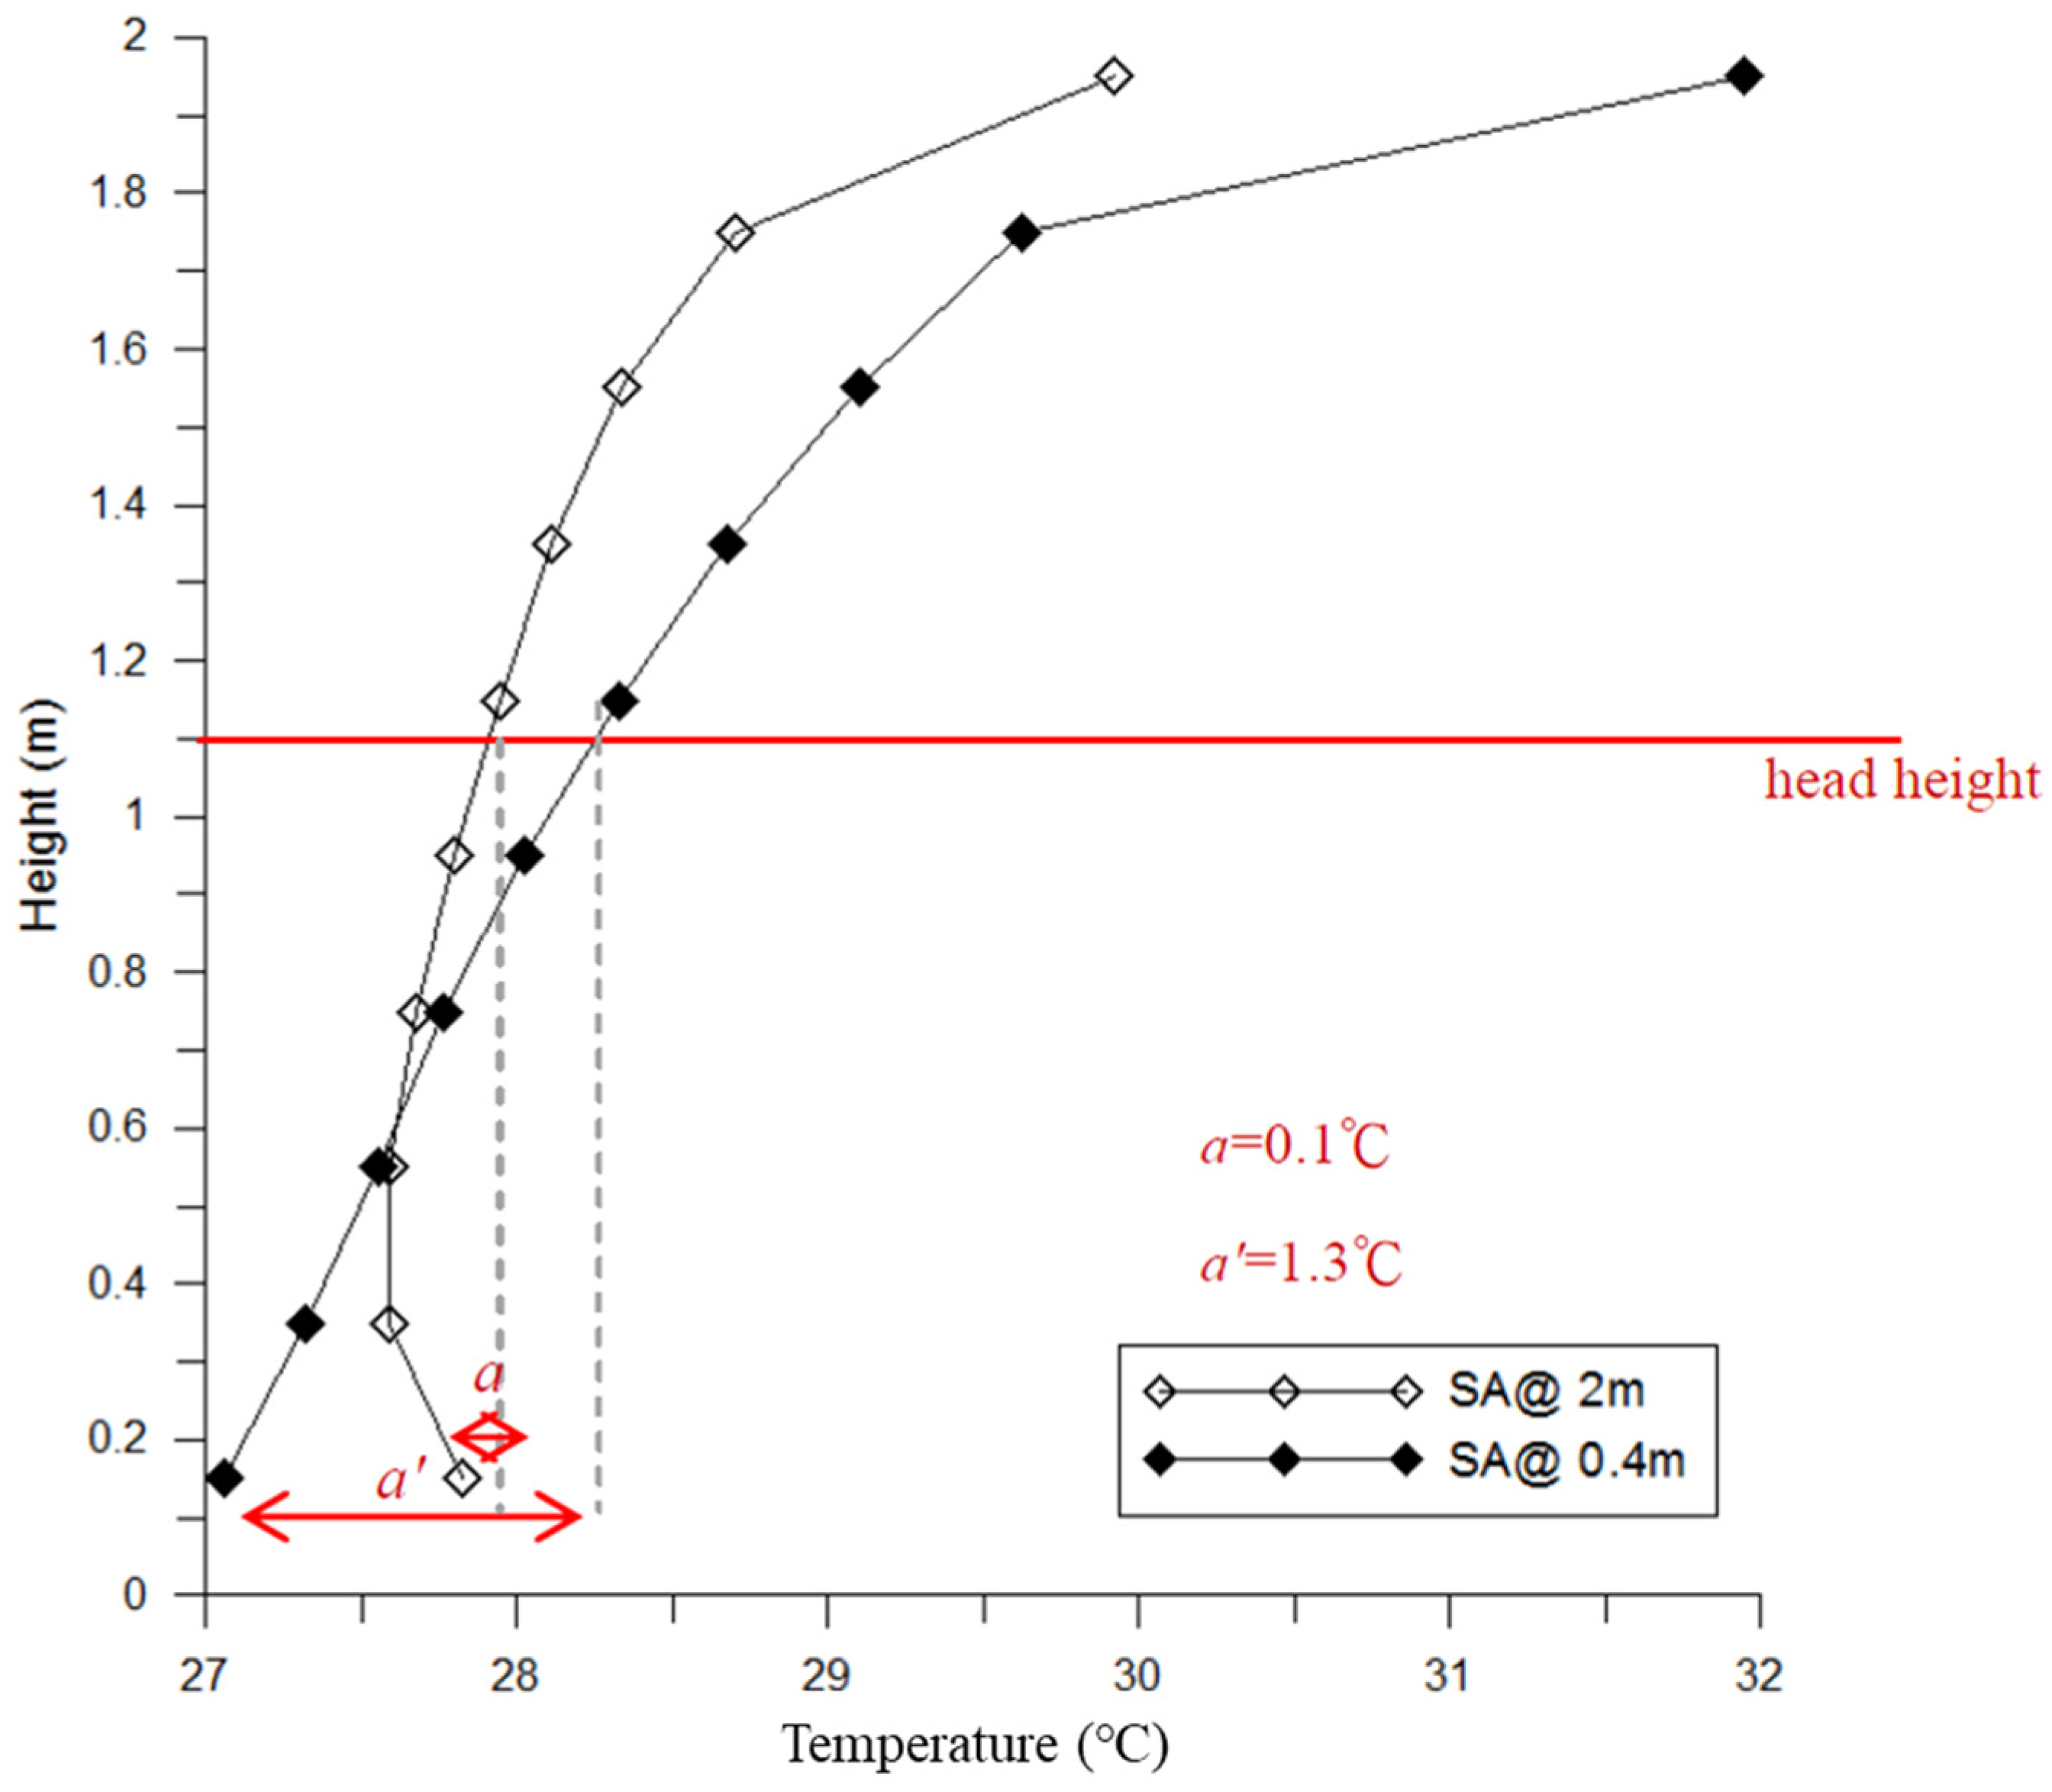
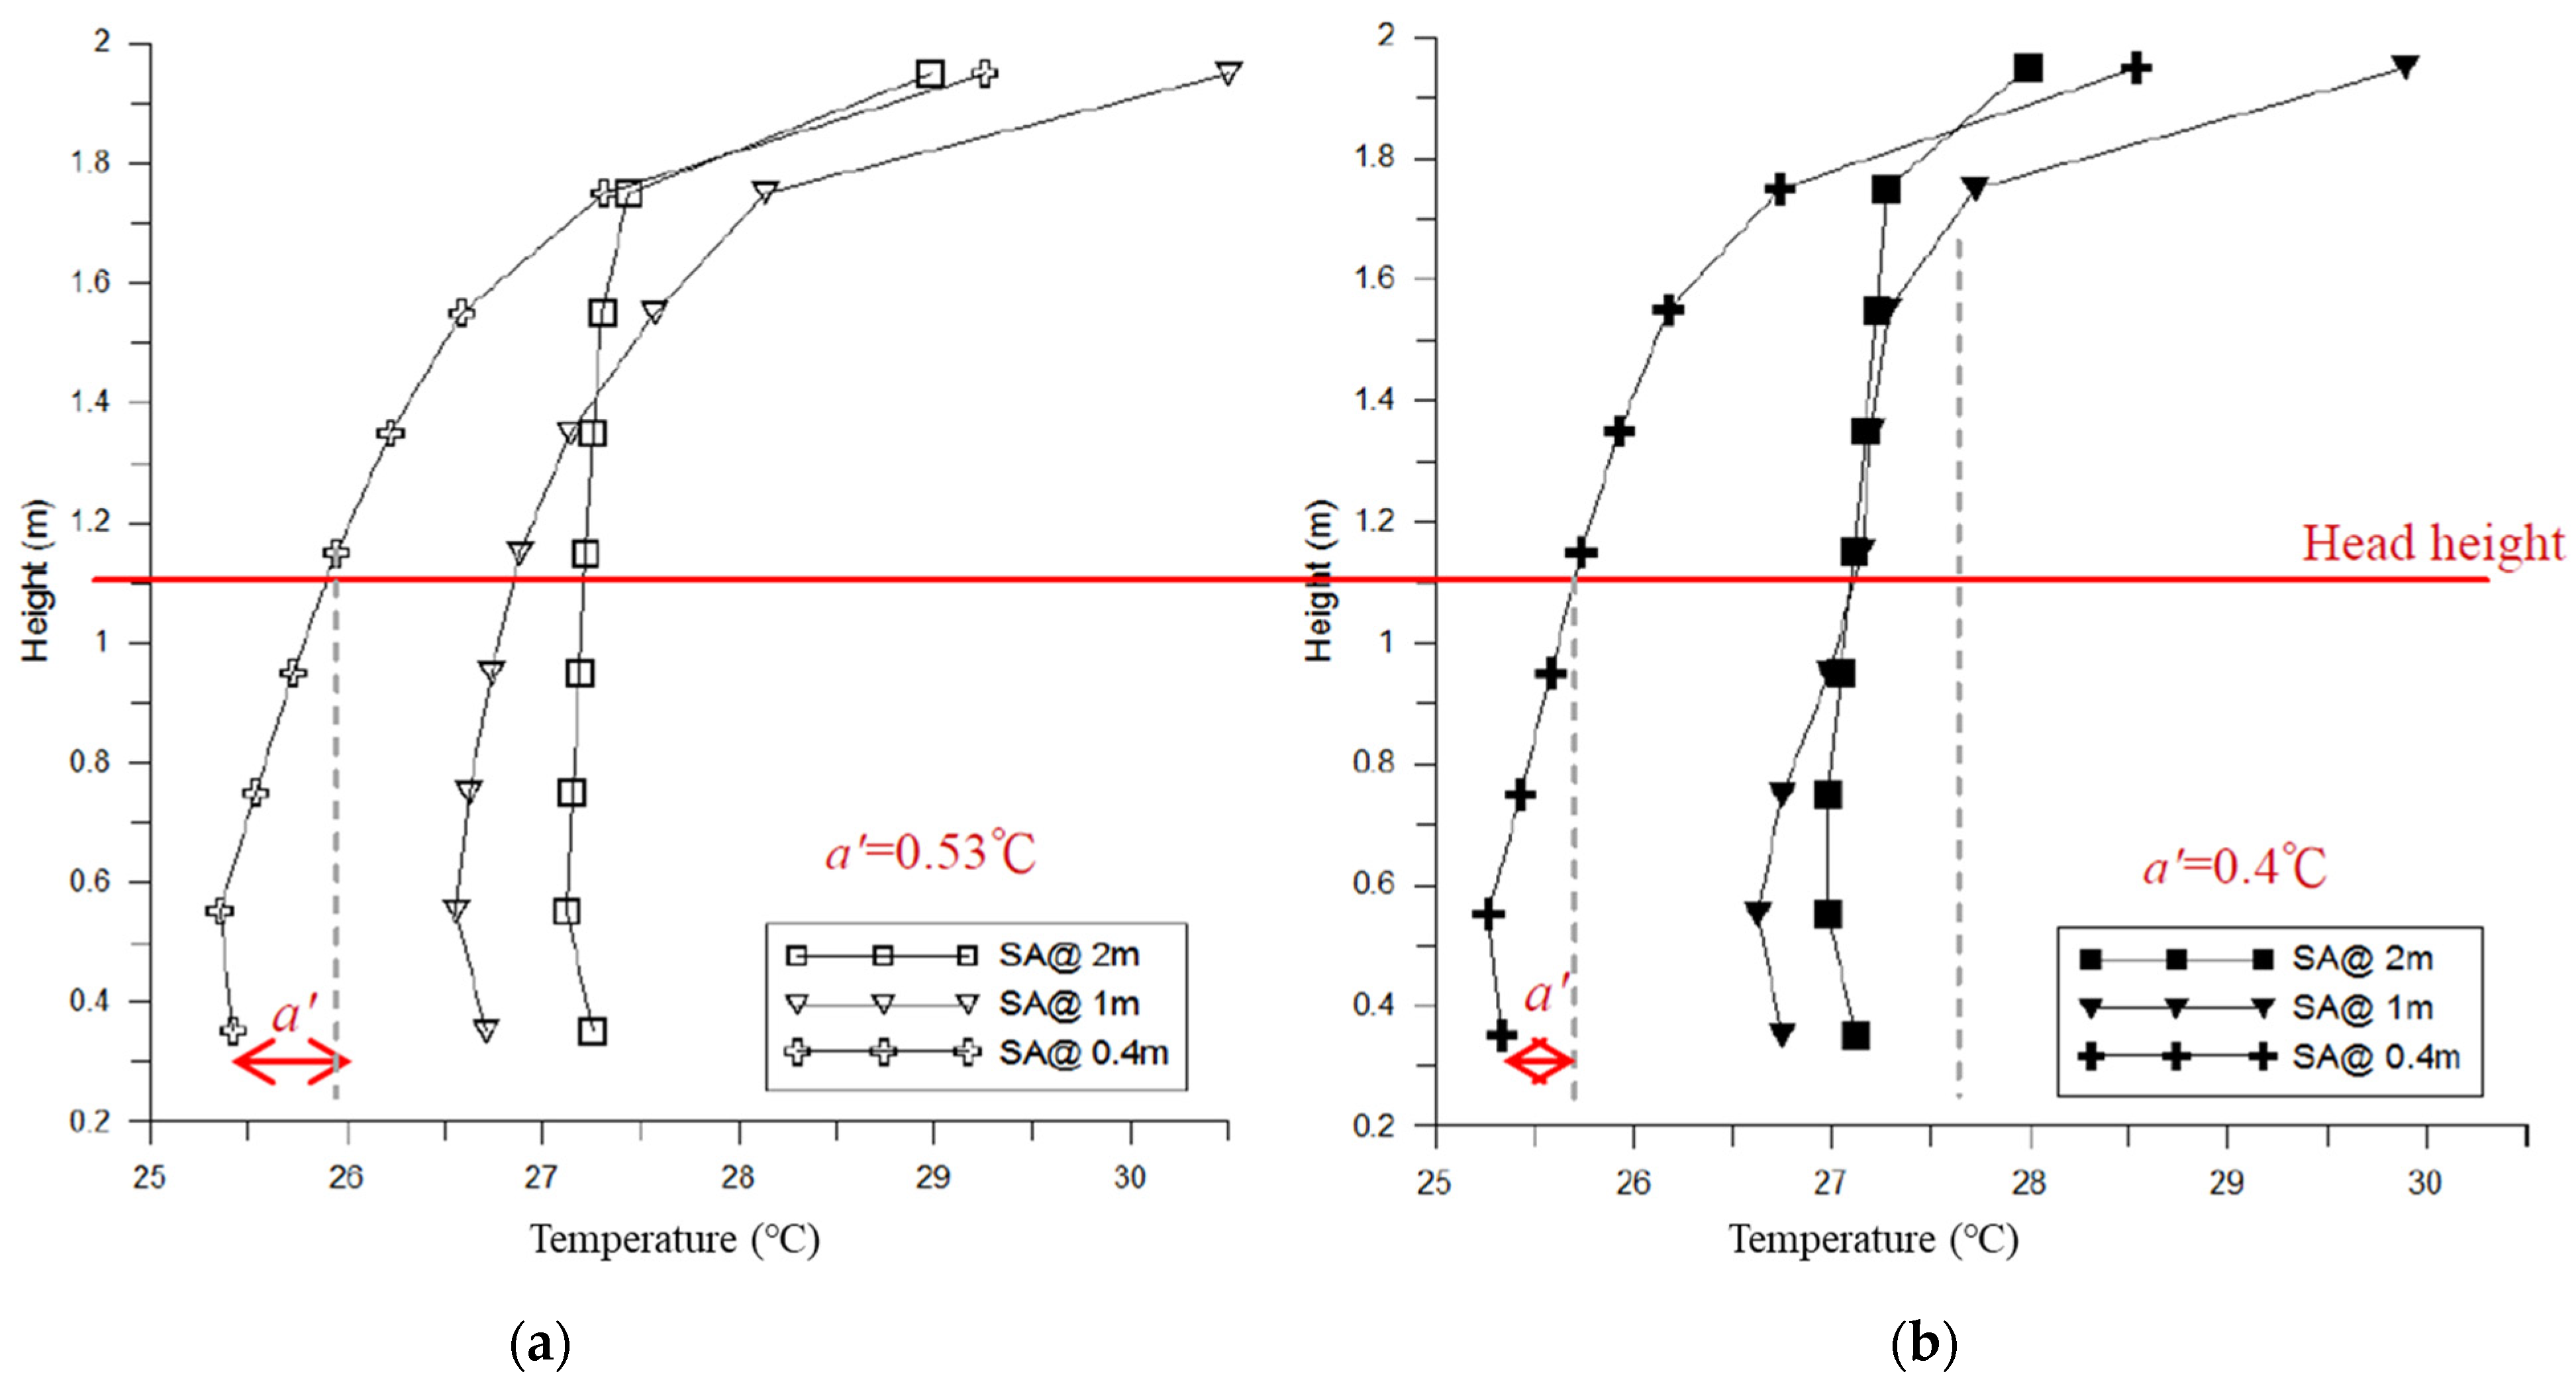
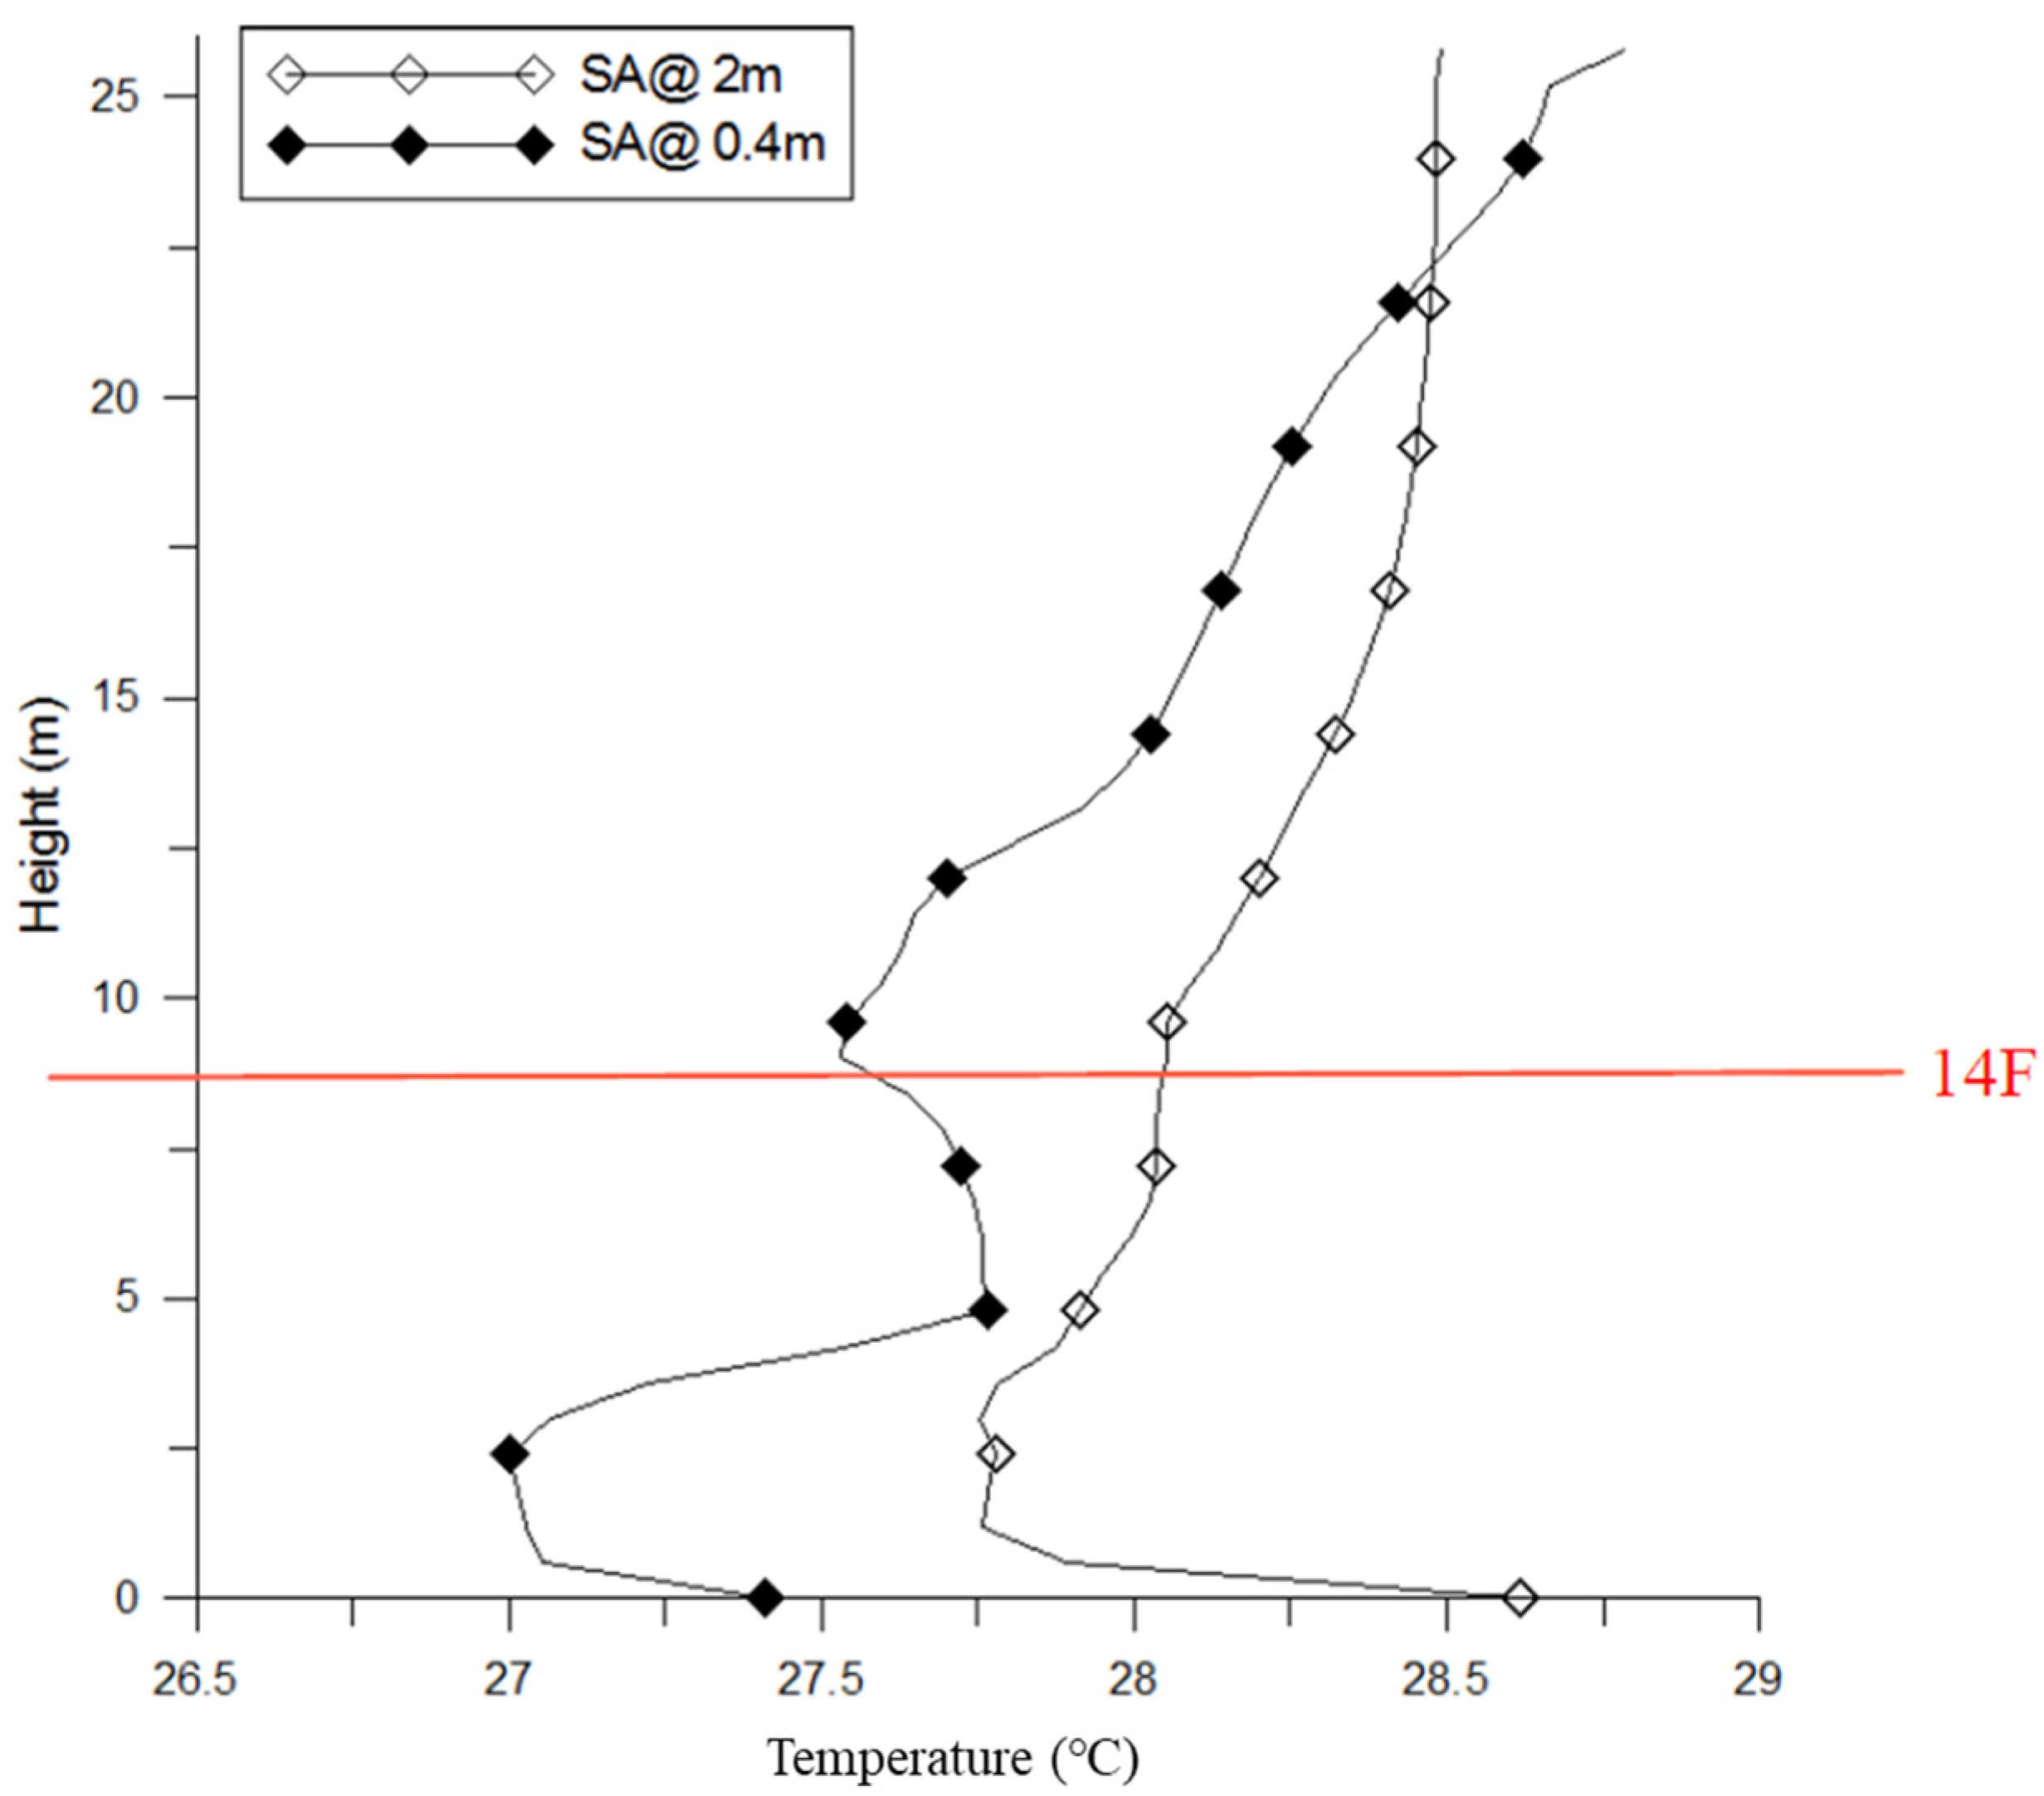
Figure 17.
Vertical temperature distribution of public area with varying SA height.
Figure 17.
Vertical temperature distribution of public area with varying SA height.
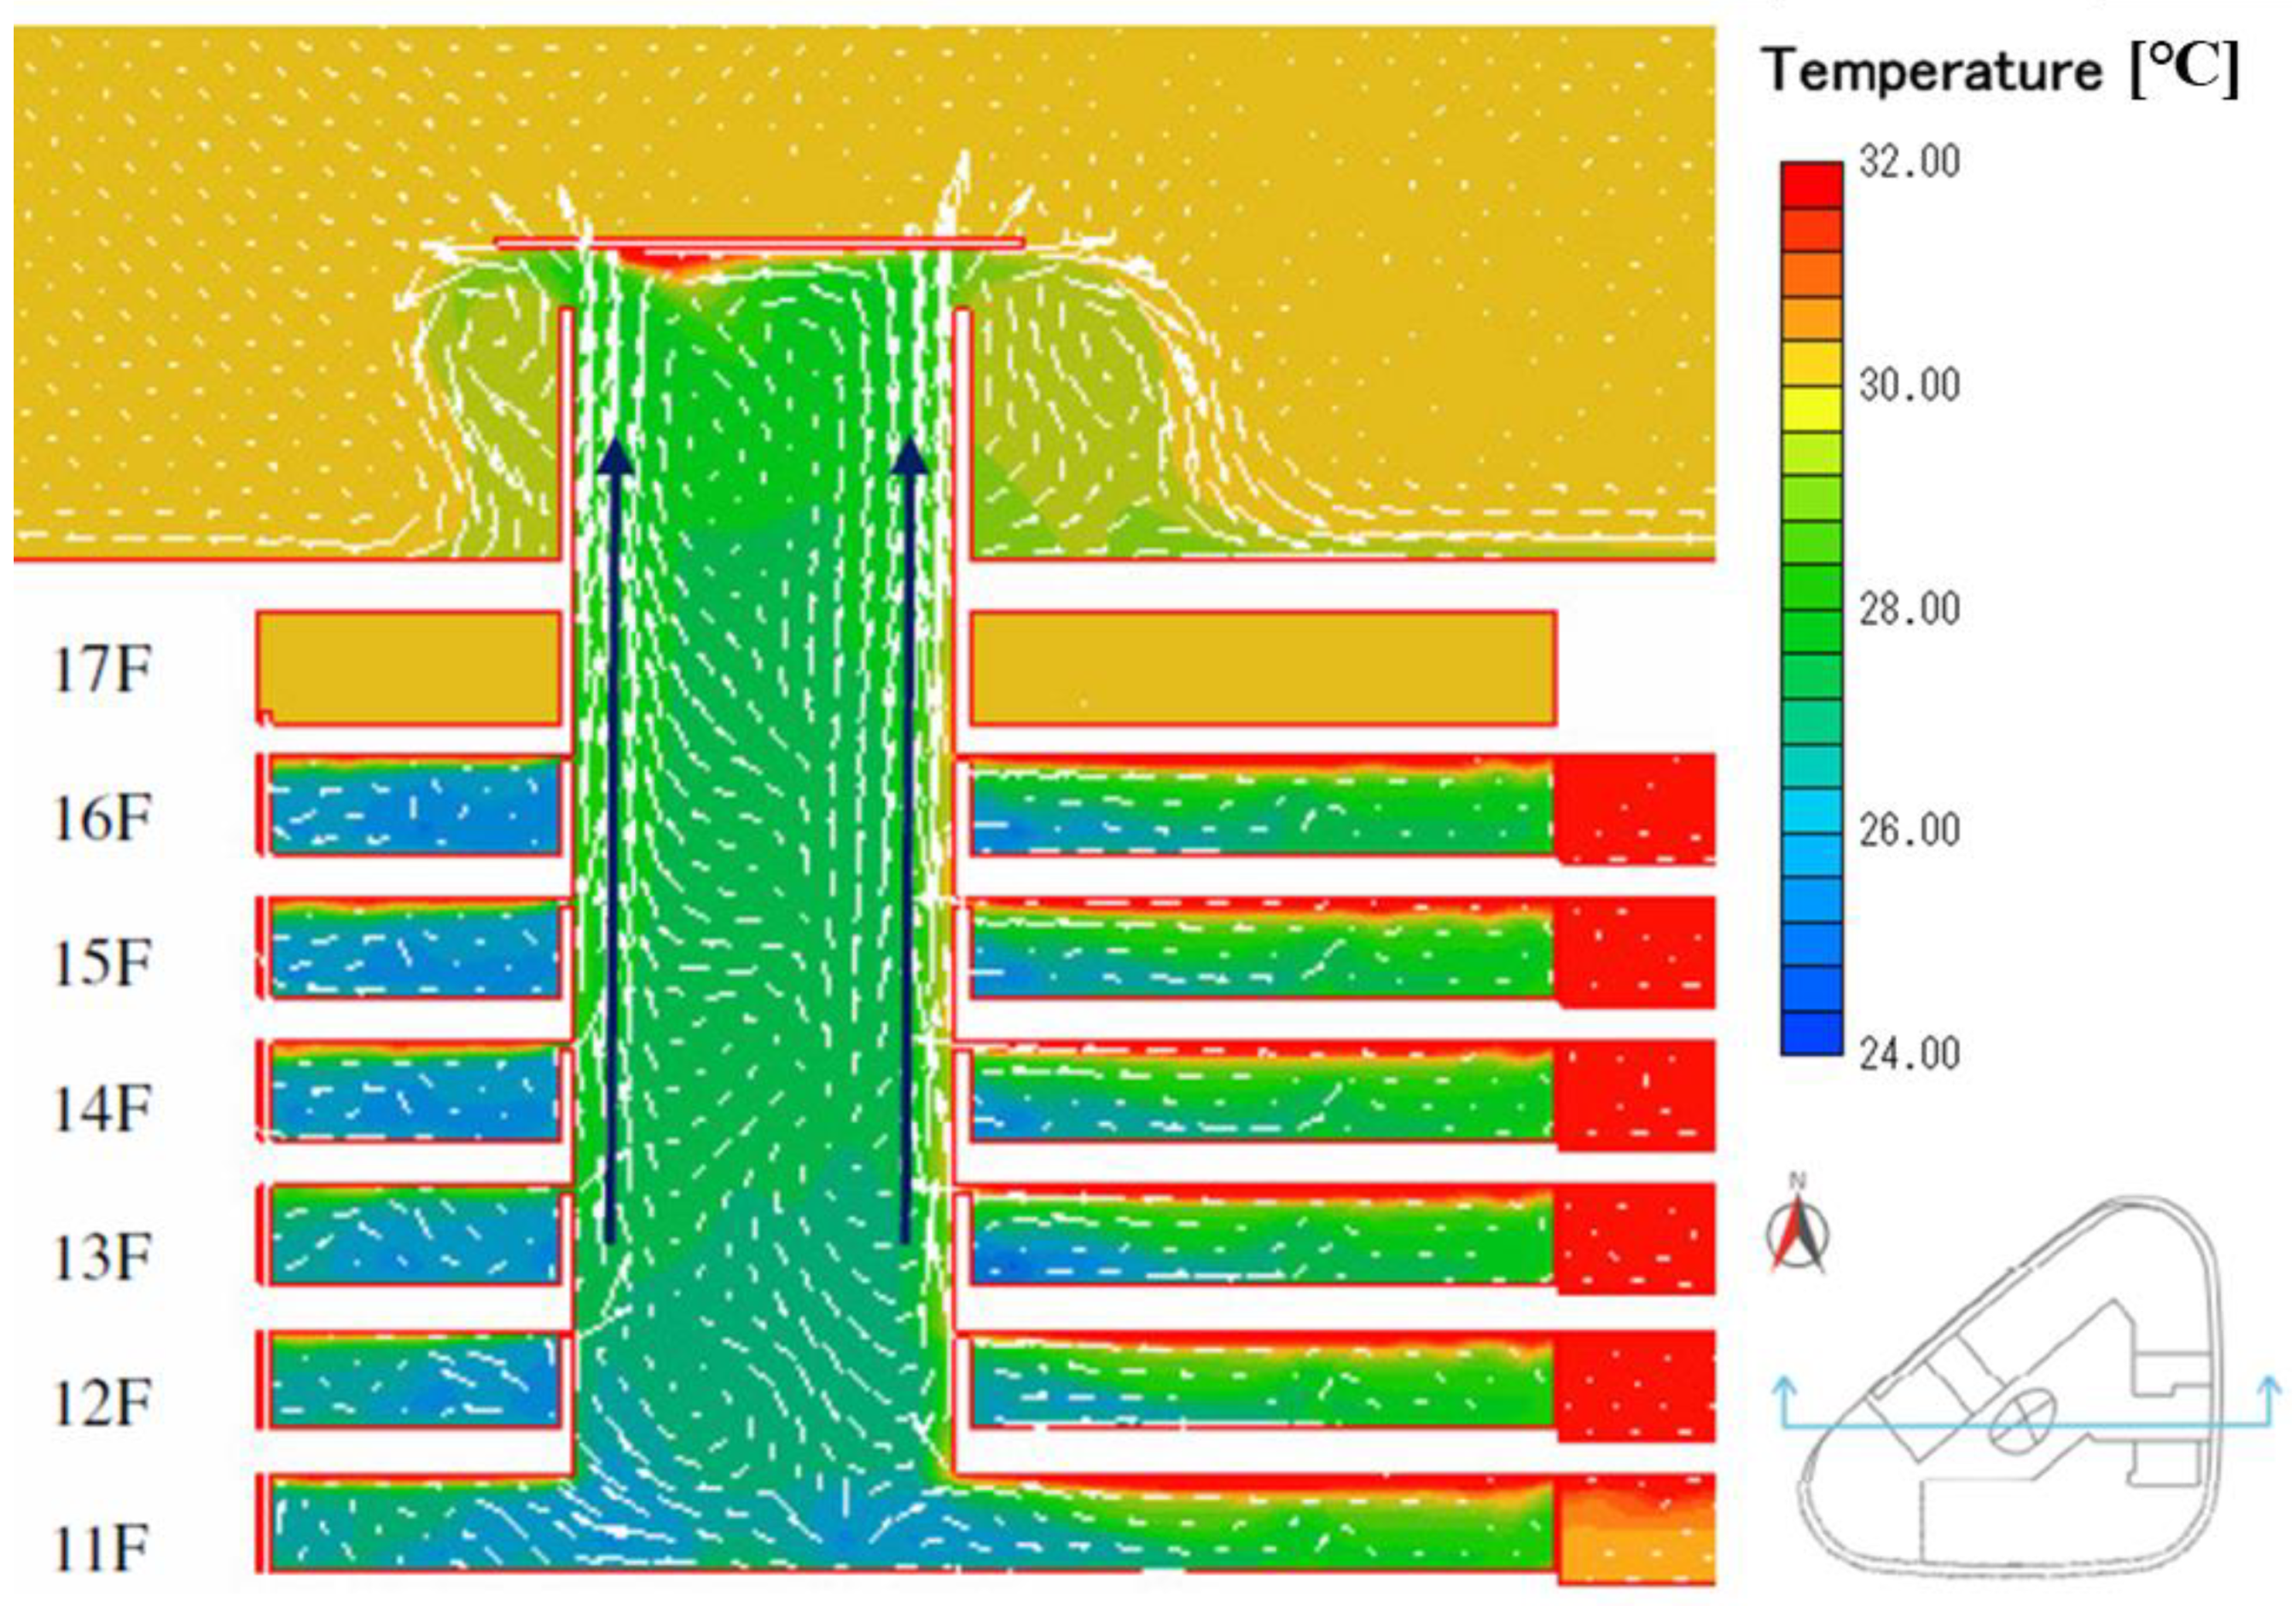
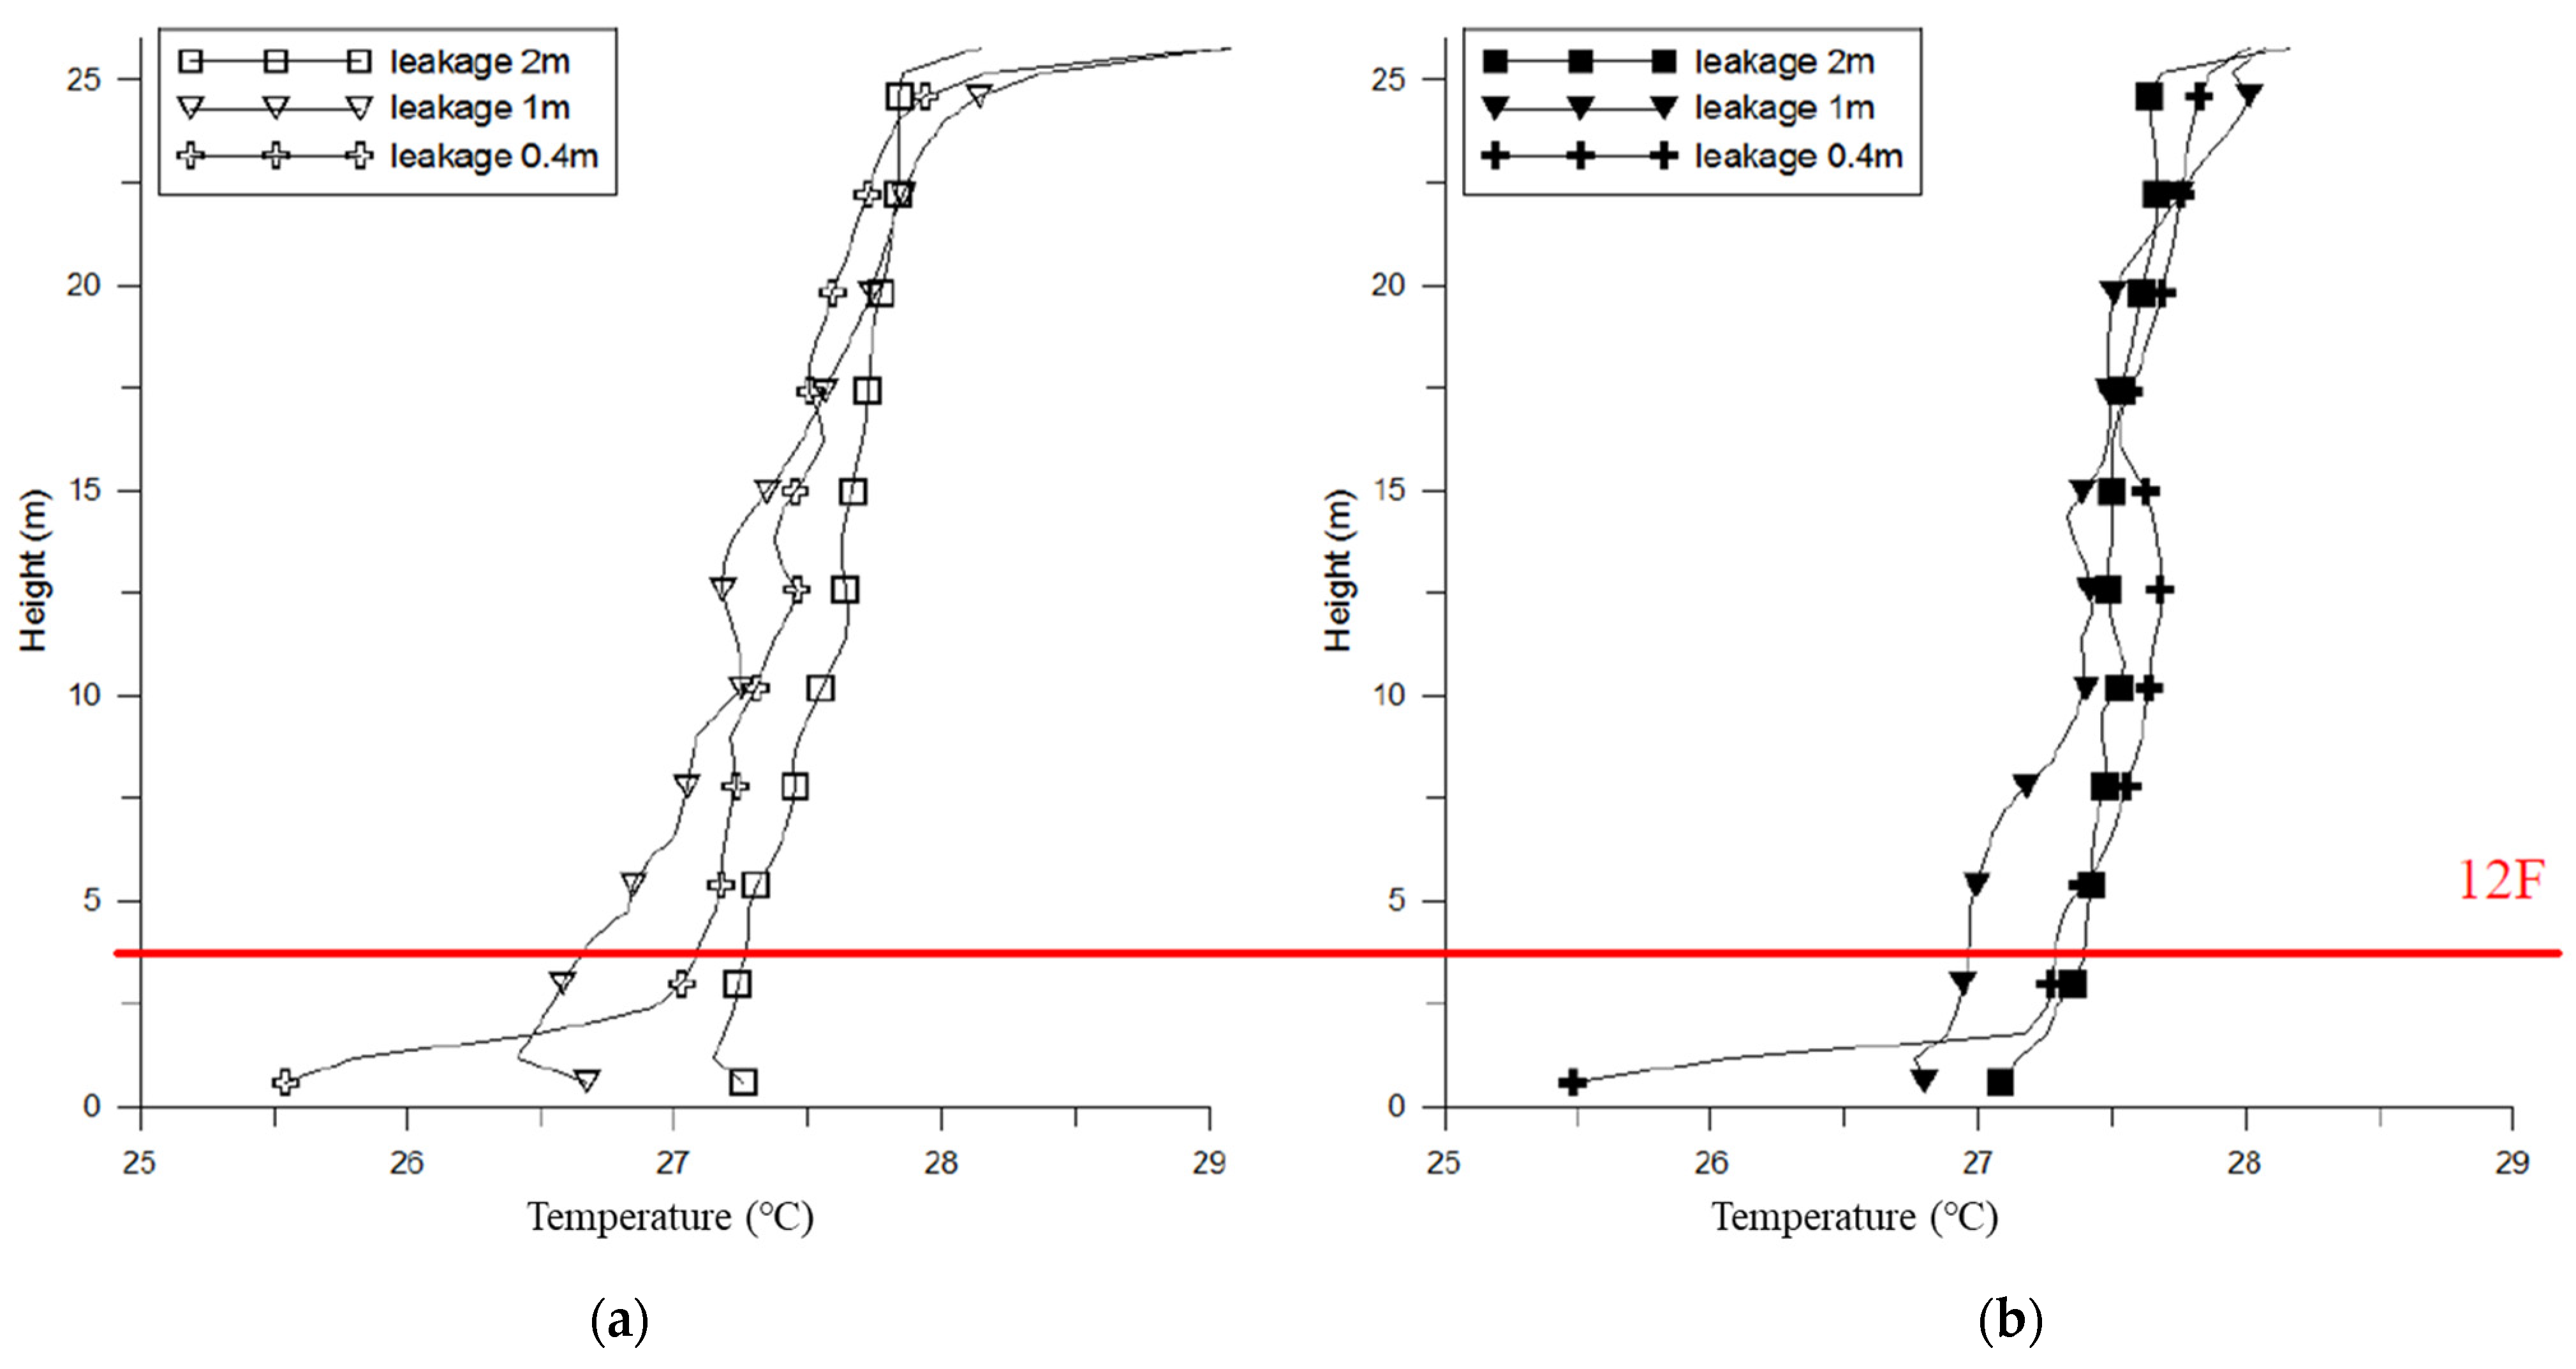
Figure 18.
Vertical temperature distribution of atrium with varying SA height.
Figure 18.
Vertical temperature distribution of atrium with varying SA height.
Figure 19.
Temperature distribution with 1.9 m handrail and 0.4 m SA height.
Figure 19.
Temperature distribution with 1.9 m handrail and 0.4 m SA height.
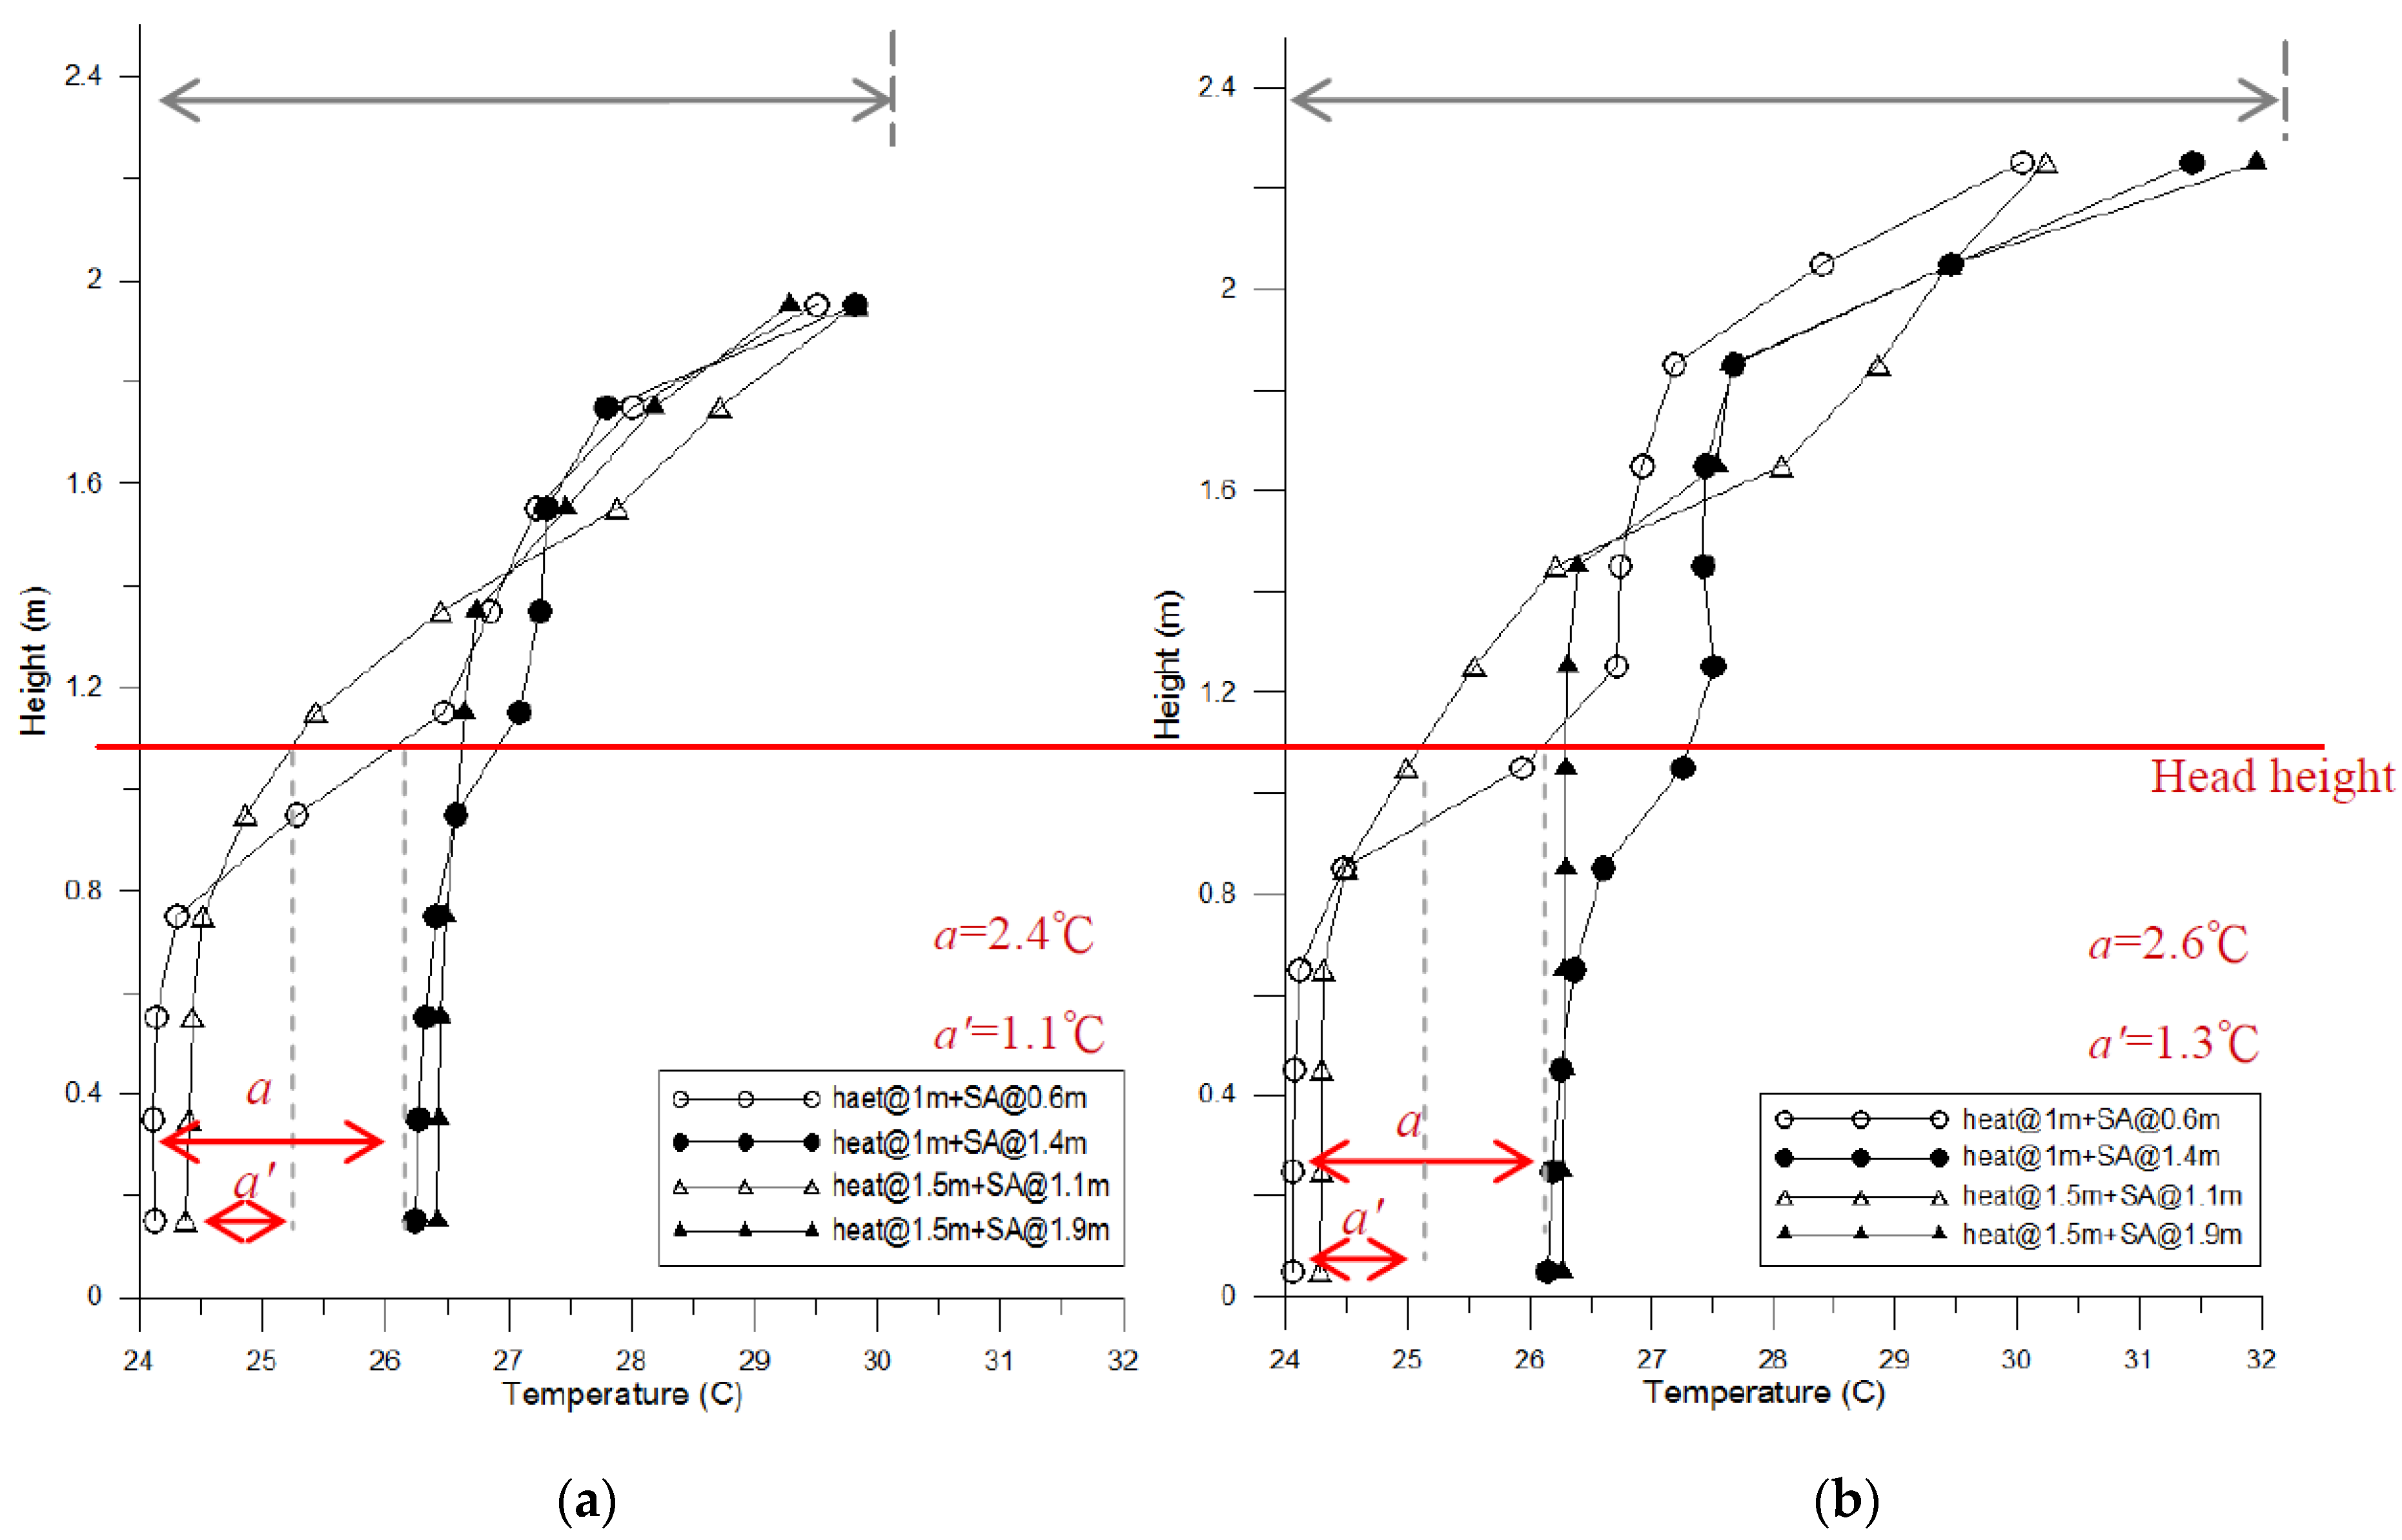
Figure 20.
Vertical temperature difference with various handrail and SA heights. (a) 1.1 m handrail. (b) 1.9 m handrail.
Figure 20.
Vertical temperature difference with various handrail and SA heights. (a) 1.1 m handrail. (b) 1.9 m handrail.
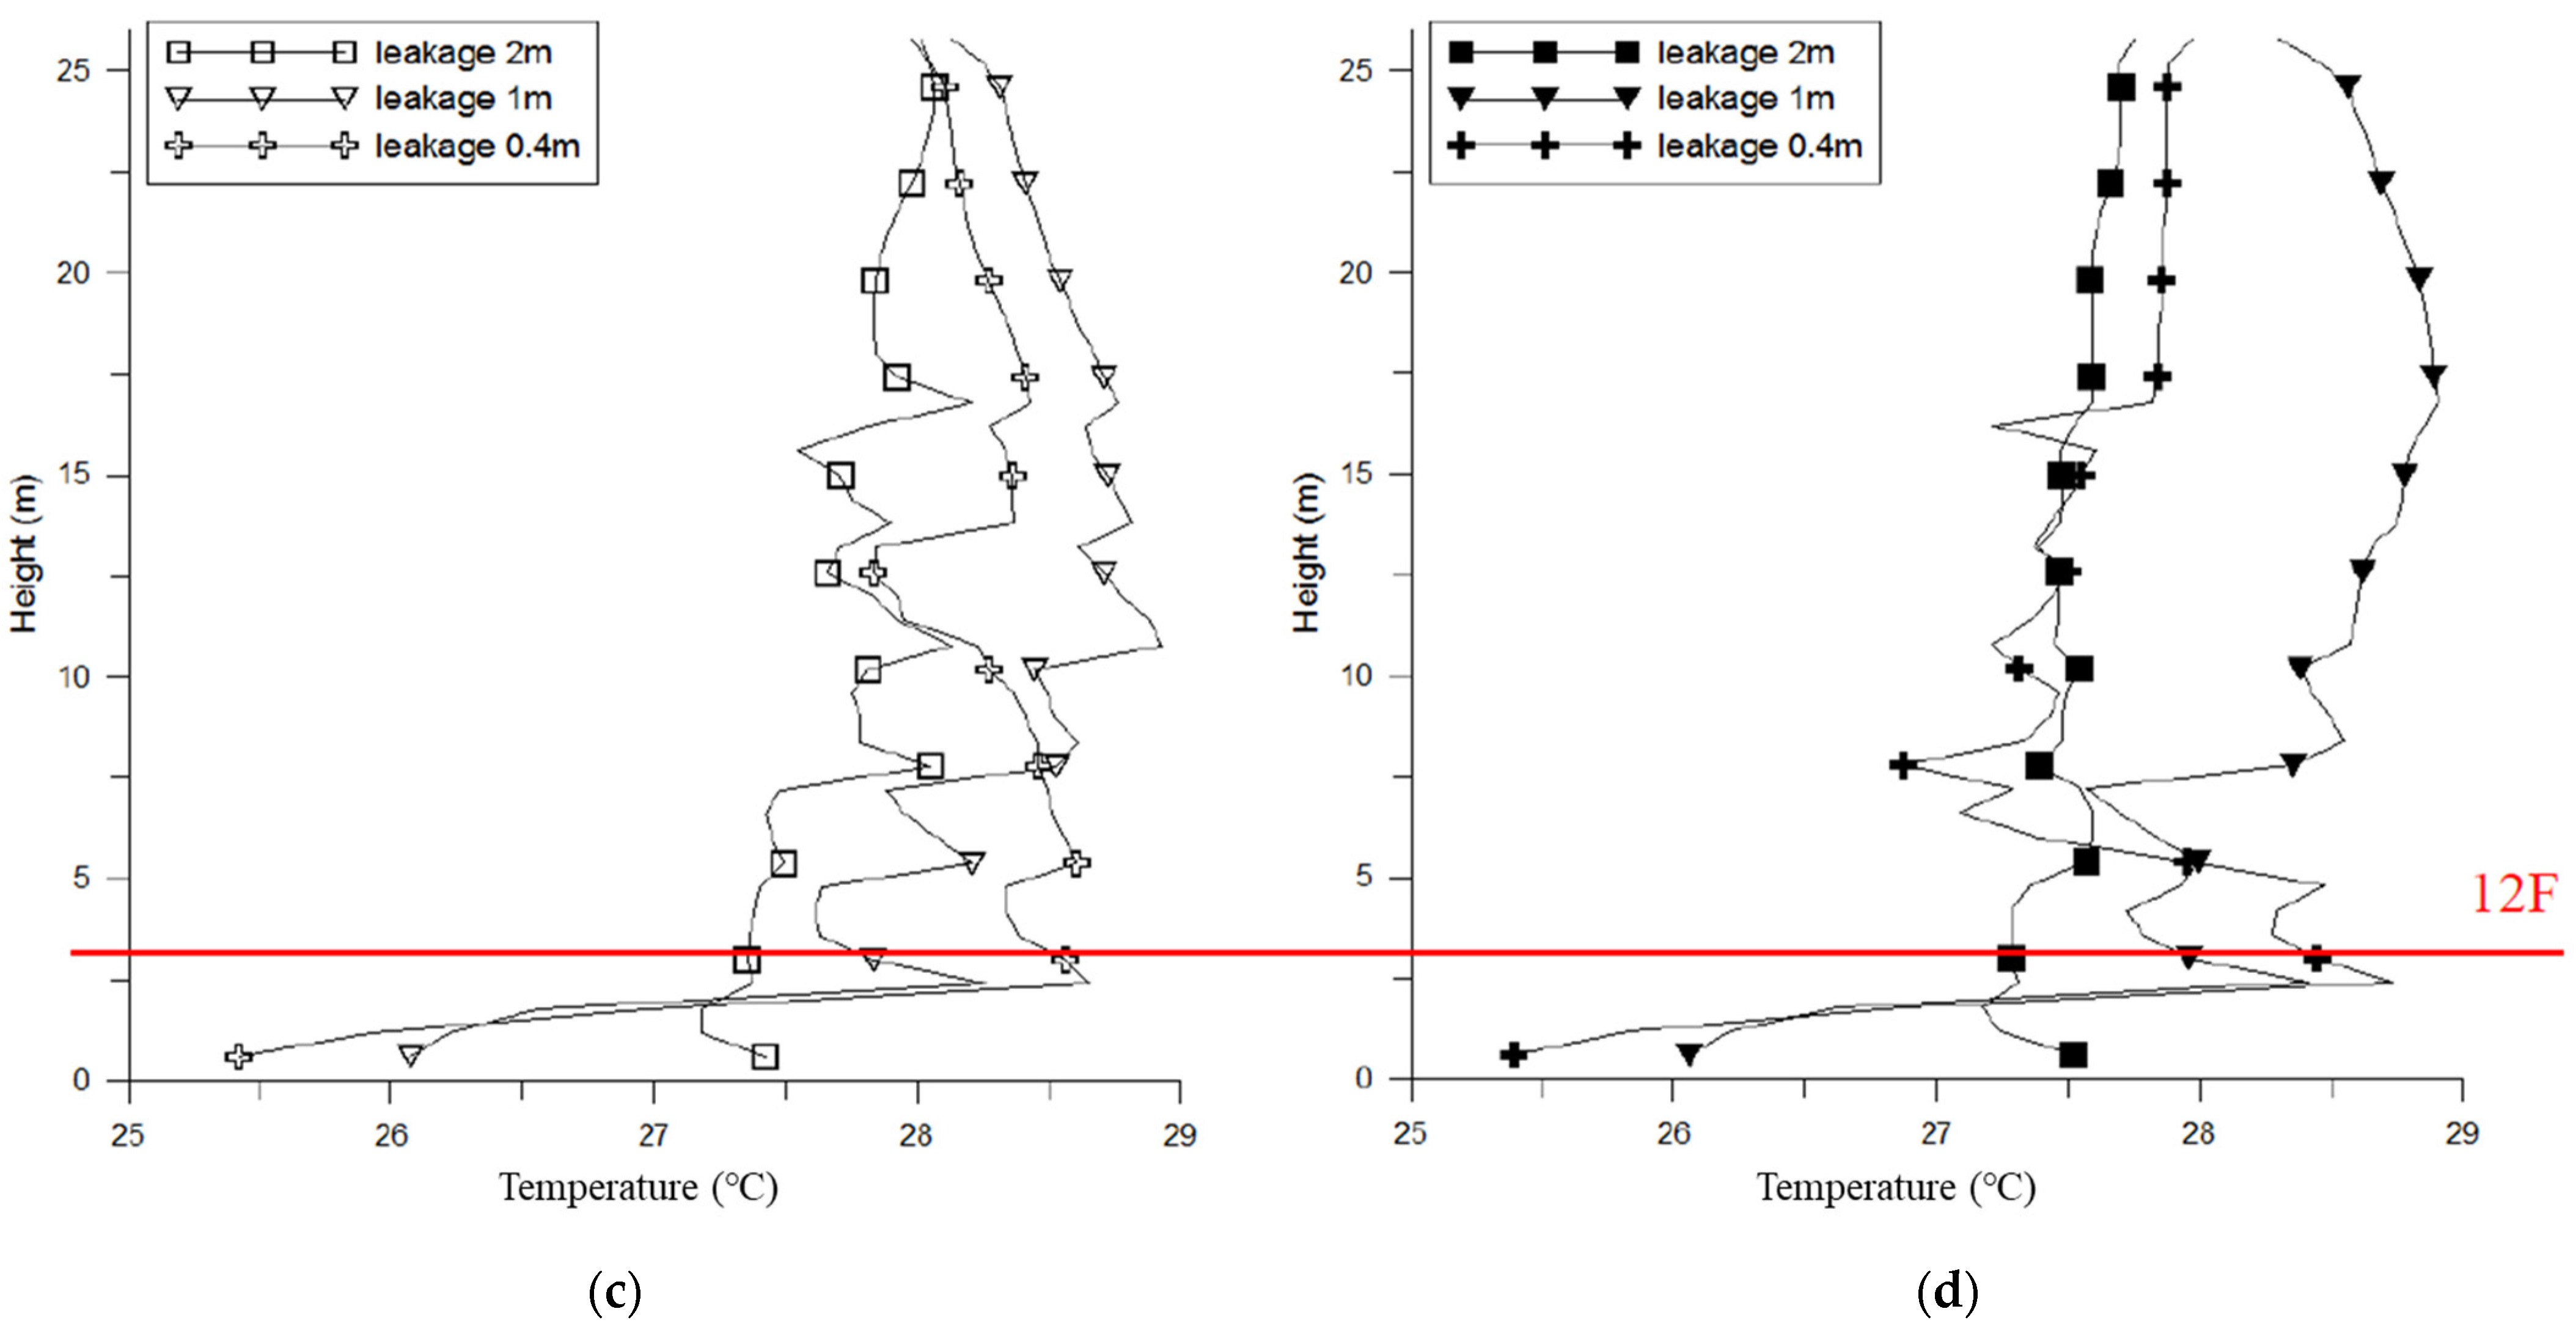
Figure 21.
Vertical temperature distribution with various handrail heights. (a) Vertical temperature distribution in middle section of atrium with 1.1 m handrails. (b) Vertical temperature distribution in middle section of atrium with 1.9 m handrails. (c) Vertical temperature distribution in outer ring of atrium with 1.1 m handrails. (d) Vertical temperature distribution in outer ring of atrium with 1.9 m handrails.
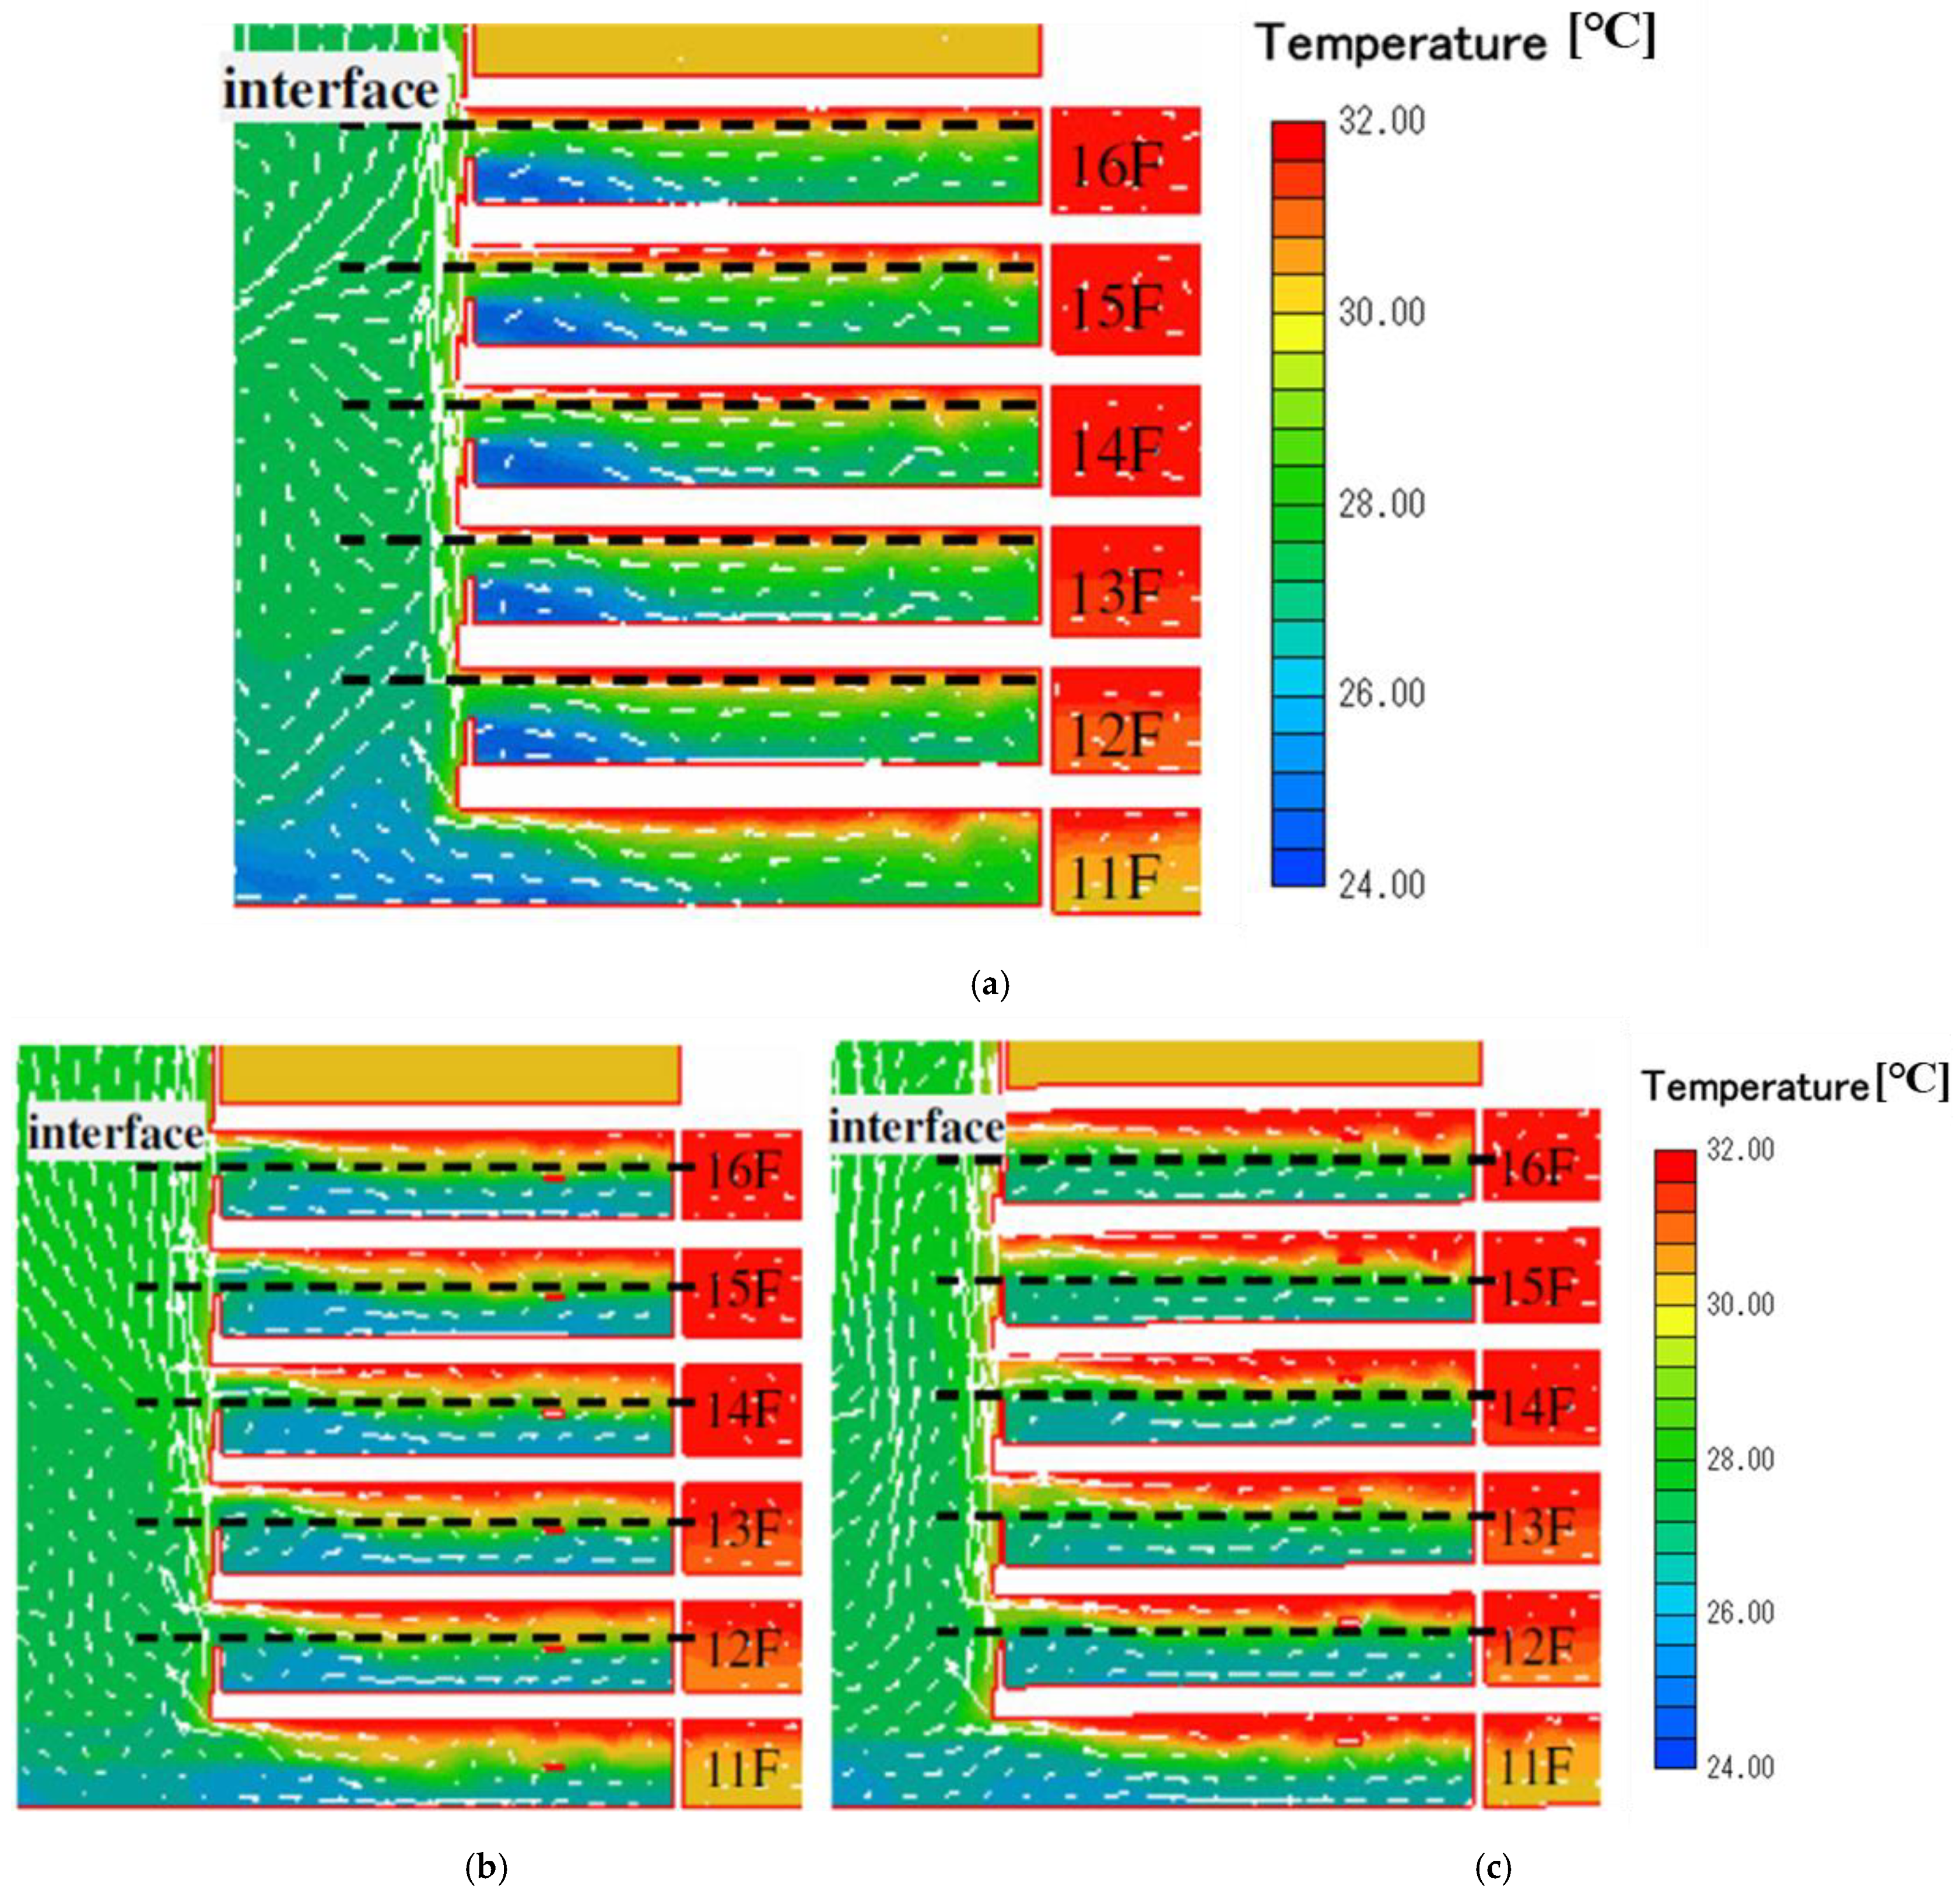
Figure 22.
Temperature distribution with various heat source heights. (a) Heat source at ground level when SA height was 0.4 m. (b) Heat source at 1 m when SA height was 0.4 m. (c) Heat source at 1.5 m when SA height was 0.4 m.
Figure 22.
Temperature distribution with various heat source heights. (a) Heat source at ground level when SA height was 0.4 m. (b) Heat source at 1 m when SA height was 0.4 m. (c) Heat source at 1.5 m when SA height was 0.4 m.
Figure 23.
Temperature distribution with various ceiling heights (heat source at 1.5 m when SA at 1.1 m). (a) 2.15 m ceiling height. (b) 2.45 m ceiling height.
Figure 23.
Temperature distribution with various ceiling heights (heat source at 1.5 m when SA at 1.1 m). (a) 2.15 m ceiling height. (b) 2.45 m ceiling height.
Figure 24.
Vertical temperature distribution with various ceiling heights. (a) 2.15 m ceiling height. (b) 2.45 m ceiling height.
Figure 24.
Vertical temperature distribution with various ceiling heights. (a) 2.15 m ceiling height. (b) 2.45 m ceiling height.
Figure 25.
Cooling mechanism for entire building.
Figure 25.
Cooling mechanism for entire building.
Table 1.
Annual statistics of external temperature above 24 °C in Taipei.
Table 1.
Annual statistics of external temperature above 24 °C in Taipei.
| Temp. (°C) | 24 | 25 | 26 | 27 | 28 | 29 | 30 | 31 |
|---|
| Hours (h) | 544 | 221 | 241 | 238 | 211 | 239 | 223 | 236 |
| Annual ratio (%) | 15 | 6 | 7 | 7 | 6 | 7 | 6 | 6 |
| Temp. (°C) | 32 | 33 | 34 | 35 | 36 | 37 | 38 | total |
| Hours (h) | 209 | 158 | 69 | 14 | 12 | 7 | 3 | 2625 |
| Annual ratio (%) | 6 | 4 | 2 | 0 | 0 | 0 | 0 | 72 |
Table 2.
Solar radiation and humidity at 24 °C and 30 °C.
Table 2.
Solar radiation and humidity at 24 °C and 30 °C.
| Temperature (°C) | 24 | 30 |
|---|
| Relative humidity | 80% | 75% |
| Diffuse radiation (horizontal) | 75 W | 200 W |
Table 3.
Sensation equivalent of PMV value.
Table 3.
Sensation equivalent of PMV value.
| PMV Value | Sensation |
|---|
| +3 | heat |
| +2 | hot |
| +1 | warm |
| 0 | comfort |
| −1 | cool |
| −2 | cold |
| −3 | freeze |
Table 4.
Comparison between present study and Linden’s equation.
Table 4.
Comparison between present study and Linden’s equation.
| | Linden’s | This Study | Difference |
|---|
| Neutral level height (m) | H = 14.29 | h’ = 14.35 | 4.2% |
| Total airflow (m3/s) | Q = 6.35 | Q’ = 6.86 | 8.0% |
Table 5.
Airflow rate on each floor.
Table 5.
Airflow rate on each floor.
| Floor | Q’ (m3/s) |
|---|
| 11F | 1.15 |
| 12F | 1.15 |
| 13F | 1.18 |
| 14F | 1.15 |
| 15F | 1.13 |
| 16F | 1.10 |
| total | 6.86 |
Table 6.
Velocity for various grid arrangements (m/s).
Table 6.
Velocity for various grid arrangements (m/s).
| Floor | 11F | 12F | 13F | 14F | 15F | 16F |
|---|
| Chosen grid | 0.89 | 0.79 | 0.68 | 0.58 | 0.42 | 0.18 |
| 2 times finer grid | 0.93 | 0.85 | 0.74 | 0.63 | 0.46 | 0.19 |
| Discrepancy | −4% | −7% | −8% | −8% | −9% | −5% |
Table 7.
PMV-PPD values with weather condition at 24 °C.
Table 7.
PMV-PPD values with weather condition at 24 °C.
| | 11F | 12F | 13F | 14F | 15F | 16F | Avg. |
|---|
| PMV | 0.26 | 0.50 | 0.61 | 0.64 | 0.73 | 0.96 | 0.65 |
| PPD (%) | 6 | 10 | 13 | 14 | 16 | 24 | 14 |
Table 8.
Thermal parameters at various ambient temperatures.
Table 8.
Thermal parameters at various ambient temperatures.
| Items | Ambient Temp. | 11F | 12F | 13F | 14F | 15F | 16F | Avg. |
|---|
Velocity
(m/s) | 26 °C | 0.11 | 0.11 | 0.11 | 0.11 | 0.11 | 0.11 | 0.11 |
| 30 °C | 0.11 | 0.12 | 0.12 | 0.11 | 0.11 | 0.11 | 0.11 |
Temp.
(°C) | 26 °C | 28.30 | 29.29 | 29.30 | 29.30 | 29.20 | 29.30 | 29.12 |
| 30 °C | 28.36 | 29.26 | 29.30 | 29.30 | 29.30 | 29.30 | 29.14 |
Humidity
(%) | 26 °C | 43.43 | 42.08 | 42.10 | 42.02 | 42.07 | 41.99 | 42.28 |
| 30 °C | 43.40 | 42.25 | 42.04 | 42.11 | 42.05 | 42.01 | 42.31 |
Table 9.
PMV value for each floor with varying SA height.
Table 9.
PMV value for each floor with varying SA height.
| SA Height | 11F | 12F | 13F | 14F | 15F | 16F | Avg. |
|---|
| 0.4 m | 0.78 | 1.19 | 1.15 | 1.27 | 1.21 | 1.16 | 1.13 |
| 2 m | 1.12 | 1.39 | 1.39 | 1.39 | 1.36 | 1.39 | 1.34 |
Table 10.
PMV values with various handrail and SA heights.
Table 10.
PMV values with various handrail and SA heights.
| Handrail Height | SA Height | 11F | 12F | 13F | 14F | 15F | 16F | Avg. |
|---|
| 1.1 m | 2 m | 1.07 | 1.05 | 1.09 | 1.08 | 1.10 | 1.11 | 1.09 |
| 1 m | 0.78 | 0.90 | 0.93 | 0.98 | 0.89 | 0.83 | 0.88 |
| 0.4 m | 0.79 | 0.73 | 0.75 | 0.79 | 0.80 | 0.82 | 0.78 |
| 1.9 m | 2 m | 1.05 | 0.96 | 0.96 | 0.99 | 0.98 | 0.97 | 0.98 |
| 1 m | 0.79 | 0.81 | 0.74 | 0.78 | 0.78 | 0.77 | 0.77 |
| 0.4 m | 0.76 | 0.68 | 0.68 | 0.68 | 0.71 | 0.71 | 0.70 |
Table 11.
PMV values with various heat source heights.
Table 11.
PMV values with various heat source heights.
| Heat Source Height | SA Height | 11F | 12F | 13F | 14F | 15F | 16F | Avg. |
|---|
| 0 m | 0.4m | 0.79 | 0.73 | 0.75 | 0.79 | 0.80 | 0.82 | 0.78 |
| 1 m | 1.4m | 0.89 | 0.89 | 0.91 | 0.89 | 0.89 | 0.91 | 0.90 |
| 1.5 m | 1.9m | 0.85 | 0.87 | 0.97 | 0.94 | 0.96 | 0.98 | 0.92 |
Table 12.
PMV values with various SA heights.
Table 12.
PMV values with various SA heights.
| Heat Source Height | SA Height | 11F | 12F | 13F | 14F | 15F | 16F | Avg. |
|---|
| 1 m | 1.4m | 0.89 | 0.89 | 0.91 | 0.89 | 0.89 | 0.91 | 0.90 |
| 0.6m | 0.68 | 0.67 | 0.68 | 0.70 | 0.69 | 0.70 | 0.69 |
| 1.5 m | 1.9m | 0.85 | 0.87 | 0.97 | 0.94 | 0.96 | 0.98 | 0.92 |
| 1.1m | 0.58 | 0.65 | 0.66 | 0.69 | 0.67 | 0.68 | 0.65 |
Table 13.
PMV values with 2.45 m ceiling height.
Table 13.
PMV values with 2.45 m ceiling height.
| Heat Source Height | SA Height | 11F | 12F | 13F | 14F | 15F | 16F | Avg. |
|---|
| 1 m | 1.4 m | 0.71 | 0.84 | 0.83 | 0.80 | 0.83 | 0.83 | 0.81 |
| 0.6 m | 0.49 | 0.53 | 0.58 | 0.61 | 0.62 | 0.64 | 0.59 |
| 1.5 m | 1.9 m | 0.79 | 0.85 | 0.84 | 0.86 | 0.86 | 0.89 | 0.87 |
| 1.1 m | 0.40 | 0.57 | 0.53 | 0.56 | 0.59 | 0.62 | 0.54 |


