1. Introduction
With the current trend of urbanization, the construction sector has become one of the major industries causing environmental problems. Buildings are responsible for about 40% of energy consumption, 25% to 40% of GHG emissions, and around 17% of water consumption worldwide [
1,
2]. In Sweden, the overall climate impact of the construction sector is about 10 million tons of CO2 eq. annually, which roughly equals to the total emissions from all vehicles in Sweden [
3]. Considering indicators of emissions to air, energy use, use of hazardous chemical products, and waste generation, the Swedish Housing Agency reveals that the construction sector accounts for 10% to 30% of the overall environmental impacts in Sweden [
4]. Therefore, continuous efforts are made by architects, contractors, and construction companies to improve the environmental performance of the construction sector.
Due to the improved resource-efficiency and energy-efficiency of the construction processes, the application of prefabricated buildings is growing to cope with the environmental problems of the construction sector [
5,
6,
7]. Depending on the extent of prefabrication, prefabricated buildings can be categorised into buildings with prefabricated components, buildings with panelised pre-assembly, buildings with volumetric pre-assembly, and modular buildings [
8,
9]. Among them, the building with prefabricated components has the lowest prefabrication, but is the most common technology in practice. To further distinguish how much prefabrication is applied to the buildings with prefabricated components, the term “prefabricated rate” is put forward, describing the ratio between the weight of prefabricated structural components and the total weight of the structural material in the building [
10]. To improve the environmental performance of the construction sector, Sweden not only encourages the overall promotion of prefabricated buildings, but also supports the increasing prefabricated rate during construction processes [
11,
12].
Life cycle assessment (LCA) is one of the popular methods to study the environmental footprints of buildings [
13,
14,
15]. Many studies have compared prefabricated buildings and conventional buildings to identify the advantages of prefabrication from a life cycle perspective. Kim [
16] reveals that the modular building can reduce 2.5 times of construction waste, 5% of energy consumption, and 5 days of production time when compared with similar conventional building. Cao, et al. [
17] show that a building with a prefabricated rate of 38% can reduce 35.82% of resource consumption, 6.61% of health damage, and 3.47% of ecosystem damage if compared with buildings with zero prefabrication. Other studies illustrate that prefabricated buildings have advantages over conventional buildings in the waste generation [
18,
19], GHG emissions [
20], on-site noise and dust pollution [
21], and some social issues, such as health and safety of workers [
22,
23].
Focusing on specific lifecycle stages, research indicates that the use and operation stage is responsible for most of the environmental problems of the prefabricated buildings [
24,
25,
26]. If the prefabricated buildings have applied the net zero energy designs, many studies identify the material production stage as the biggest contributor to the environmental impacts of the buildings [
27,
28,
29]. Studies indicate that prefabrication can achieve a reduction in embodied carbon consumption and embodied energy consumption by 15.6% and 50%, respectively, during material production of prefabricated buildings [
30,
31]. Due to better productivity and quality control, the environmental impacts of factory manufacturing can be improved [
32,
33]. The energy consumption and emissions during on-site construction of prefabricated buildings are also lower by 20% to 70% [
34]. Jaillon and Poon [
21] identifies a 12% increase of energy consumption caused by the transport of precast components for the prefabricated buildings with an average prefabricated rate of 57%. Shen et al. [
35] compare the benefit–cost ratios of 57 prefabricated projects with prefabricated rates varying from 10% to 60%, but analyses the environmental benefits in terms of relative monetary costs, rather than the direct environmental impacts.
Many studies also conduct LCAs for design or technology selection to improve the environmental impacts of prefabricated buildings. Concrete and steel are found to be the major contributors to the energy footprint and carbon footprint of prefabricated buildings [
36]. Bonamente et al. [
37] show that both the carbon footprint and energy footprint decrease when the prefabricated building has a larger floor area. Faludi et al. [
38] show that 11% to 14% of total GHG emissions can be reduced if 25% of cement in concrete is replaced by fly ash. Hong, Shen, Mao, Li and Li [
10] calculated the average energy consumption for six major prefabricated components: precast façade, precast form, semi-precast slab, precast balcony, precast staircase, and precast air-conditioning panel. The results show that the most energy-efficient prefabricated component is the precast staircase with an average energy consumption of 7.33 GJ/m
3. Many major contractors in Sweden have been encouraging the technical development of prefabrication. For example, Skanska and NCC have been improving the thermal comfort and energy efficiency of precast concrete elements since 2009 [
39,
40,
41].
Among the above LCAs related to prefabricated buildings, many studies choose to compare modular buildings with the highest prefabrication extent and conventional buildings without prefabrication [
16,
18,
20]. Since modular buildings are still theoretical concepts far away from the construction processes in practice, the results cannot provide specific guidance to current construction activities. Some of the literature indeed compares conventional buildings and buildings with prefabricated components, but in most cases, buildings with fixed prefabricated rates are studied [
17,
21,
36]. In this case, these studies only show the environmental benefits with or without prefabrication, and they are incomprehensive to verify that buildings with a larger prefabrication rate will lead to better environmental performance. A small number of research studies involve different prefabricated rates in their LCAs, but mainly deal with life cycle cost analysis and cost-benefit analysis. Liu and Chen [
42] made a life cycle cost assessment of prefabricated buildings. They conclude that there is a positive correlation between the life cycle cost of prefabricated buildings and their prefabricated rates.
Thus, there is a research gap between existing literature and the need to examine how the changes of the prefabricated rate can influence the environmental performance of the buildings with prefabricated components in practical construction projects. To answer this question, this study conducts a cradle-to-gate LCA, which enables different scenarios with increasing prefabricated rates.
The present study aims to compare the environmental performance of the prefabricated building with different prefabricated rates in a life cycle perspective and examines whether the increasing prefabricated rate is more environment-friendly. To achieve this aim, this study puts forward two specific objectives:
- (1)
To conduct a cradle-to-gate LCA of one reference building from the material extraction stage to an on-site work stage with a specific prefabricated rate.
- (2)
To study LCA scenarios with increasing prefabricated rates to analyse environmental performance changes of the reference building.
2. Methods
To analyse the environmental impacts of a prefabricated building and how the prefabricated rate can influence its environmental behaviour, a cradle-to-gate LCA is conducted with SimaPro version 9 (
https://simapro.com, accessed on 7 November 2021) and Ecoinvent database version 3.6 (
https://ecoinvent.org, accessed on 7 November 2021). SimaPro software and Ecoinvent database are the most used and recognised alternatives for life cycle assessment of buildings [
43]. In a life cycle perspective, some “hidden impacts” of the construction processes of prefabricated buildings can be spotted. This study follows the four main steps of LCA, namely the goal and scope definition, inventory analysis, impact assessment, and impact interpretation [
13].
2.1. Goal and Scope Definition
The city of Stockholm has held a competition for the design of an energy efficient residential building located at Stockholm Royal Seaport. The six-storey concrete frame building, whose design is one of the winners of the competition, is chosen as the reference building for this study. Constructed with a mix of conventional and precast concrete, the prefabricated rate of the reference building is approximately 26% [
44,
45]. The functional unit for the LCA is 1 m
2 of floor area, referring to the measurable area of the floor plan limited by the outermost of the exterior walls and including the wall thickness [
46]. The life expectancy of the materials for the building is considered as 50 years for the LCA model. The total floor area of the reference building is 4500 m
2, including the facade area (2599 m
2), window area (651 m
2), and roof area (900 m
2) [
44,
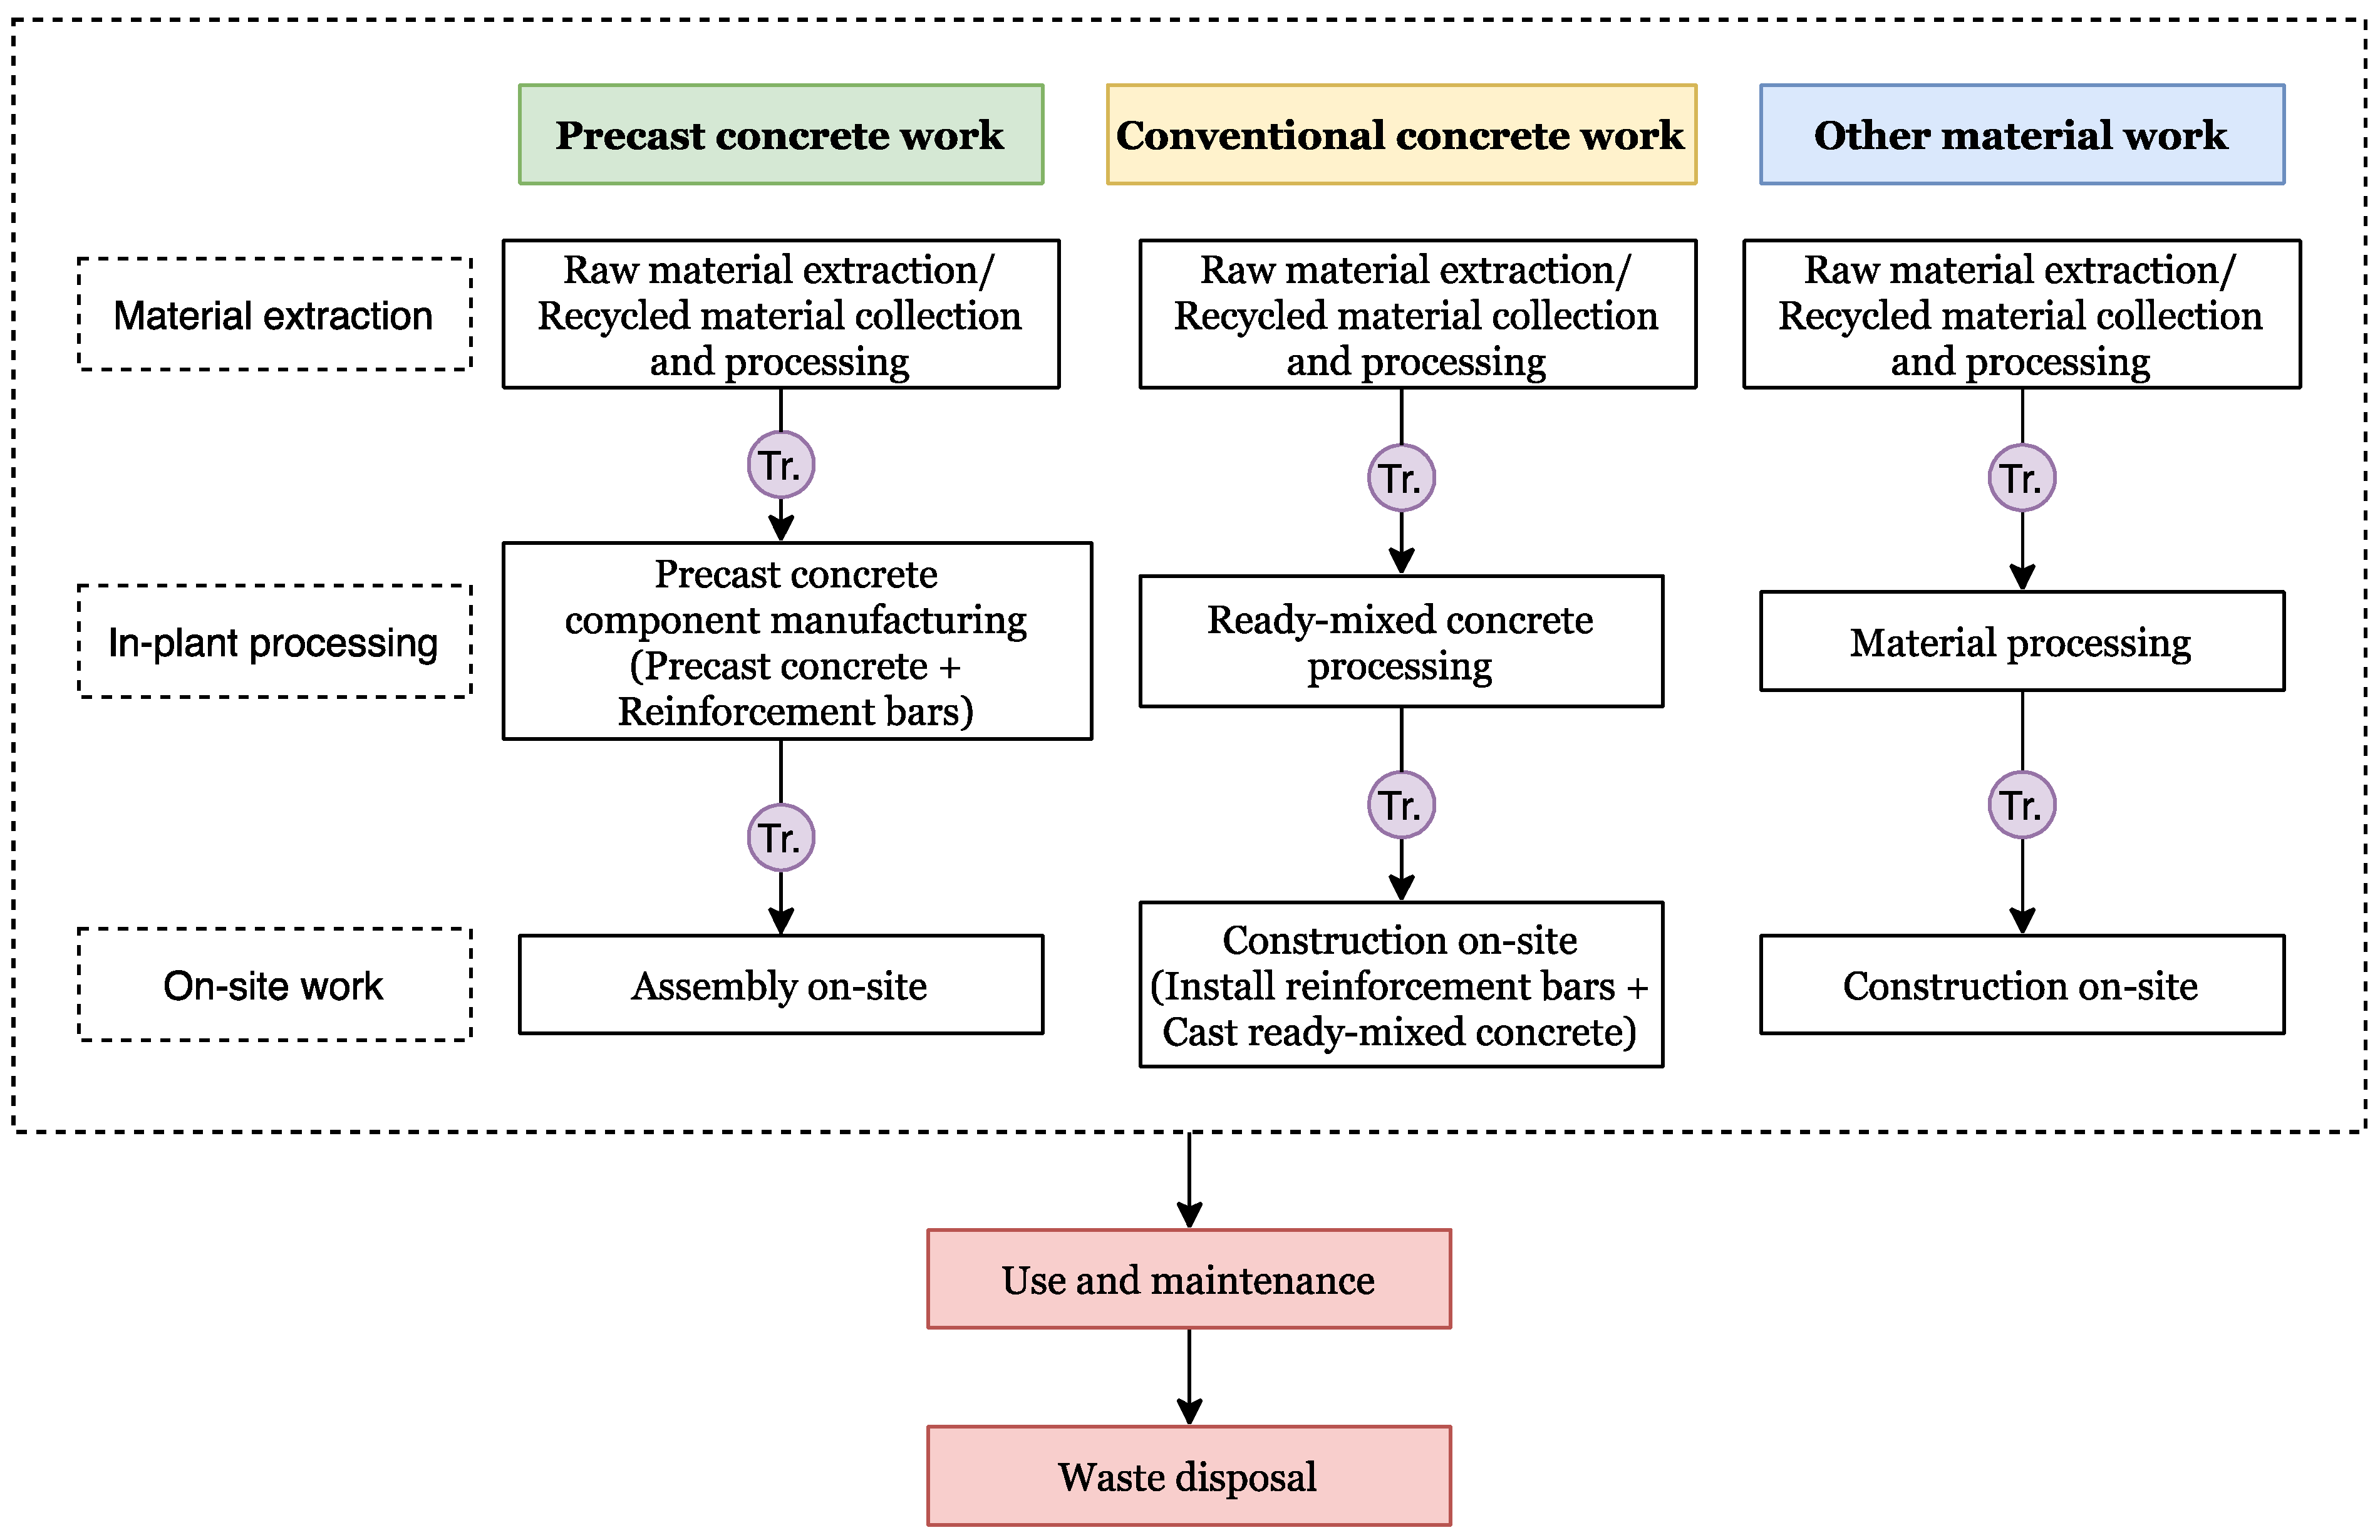
47]. This study categorises the construction activities into three types of work based on building materials: precast concrete work, conventional concrete work, and other material work. A simplified schematic diagram of the construction activities of the reference building is shown in
Figure 1.
Figure 1 indicates that this LCA is “cradle-to-gate”, including four lifecycle stages: (1) material extraction: obtain raw materials or collect recycled material, and then process them for the next step; (2) in-plant processing: process concrete for conventional concrete components in ready-mixed concrete plant, manufacture precast concrete, and reinforcement bars in prefabrication plant for precast concrete components. Other building materials, such as glass and wood, are also processed; (3) on-site work: reinforce conventional concrete components and cast them on-site, assemble precast concrete components directly, and install other building materials. (4) Transport (Tr. in
Figure 1): all necessary transport between each stage. Focusing on construction activities, this study excludes the use and waste disposal stages of building life cycle stages.
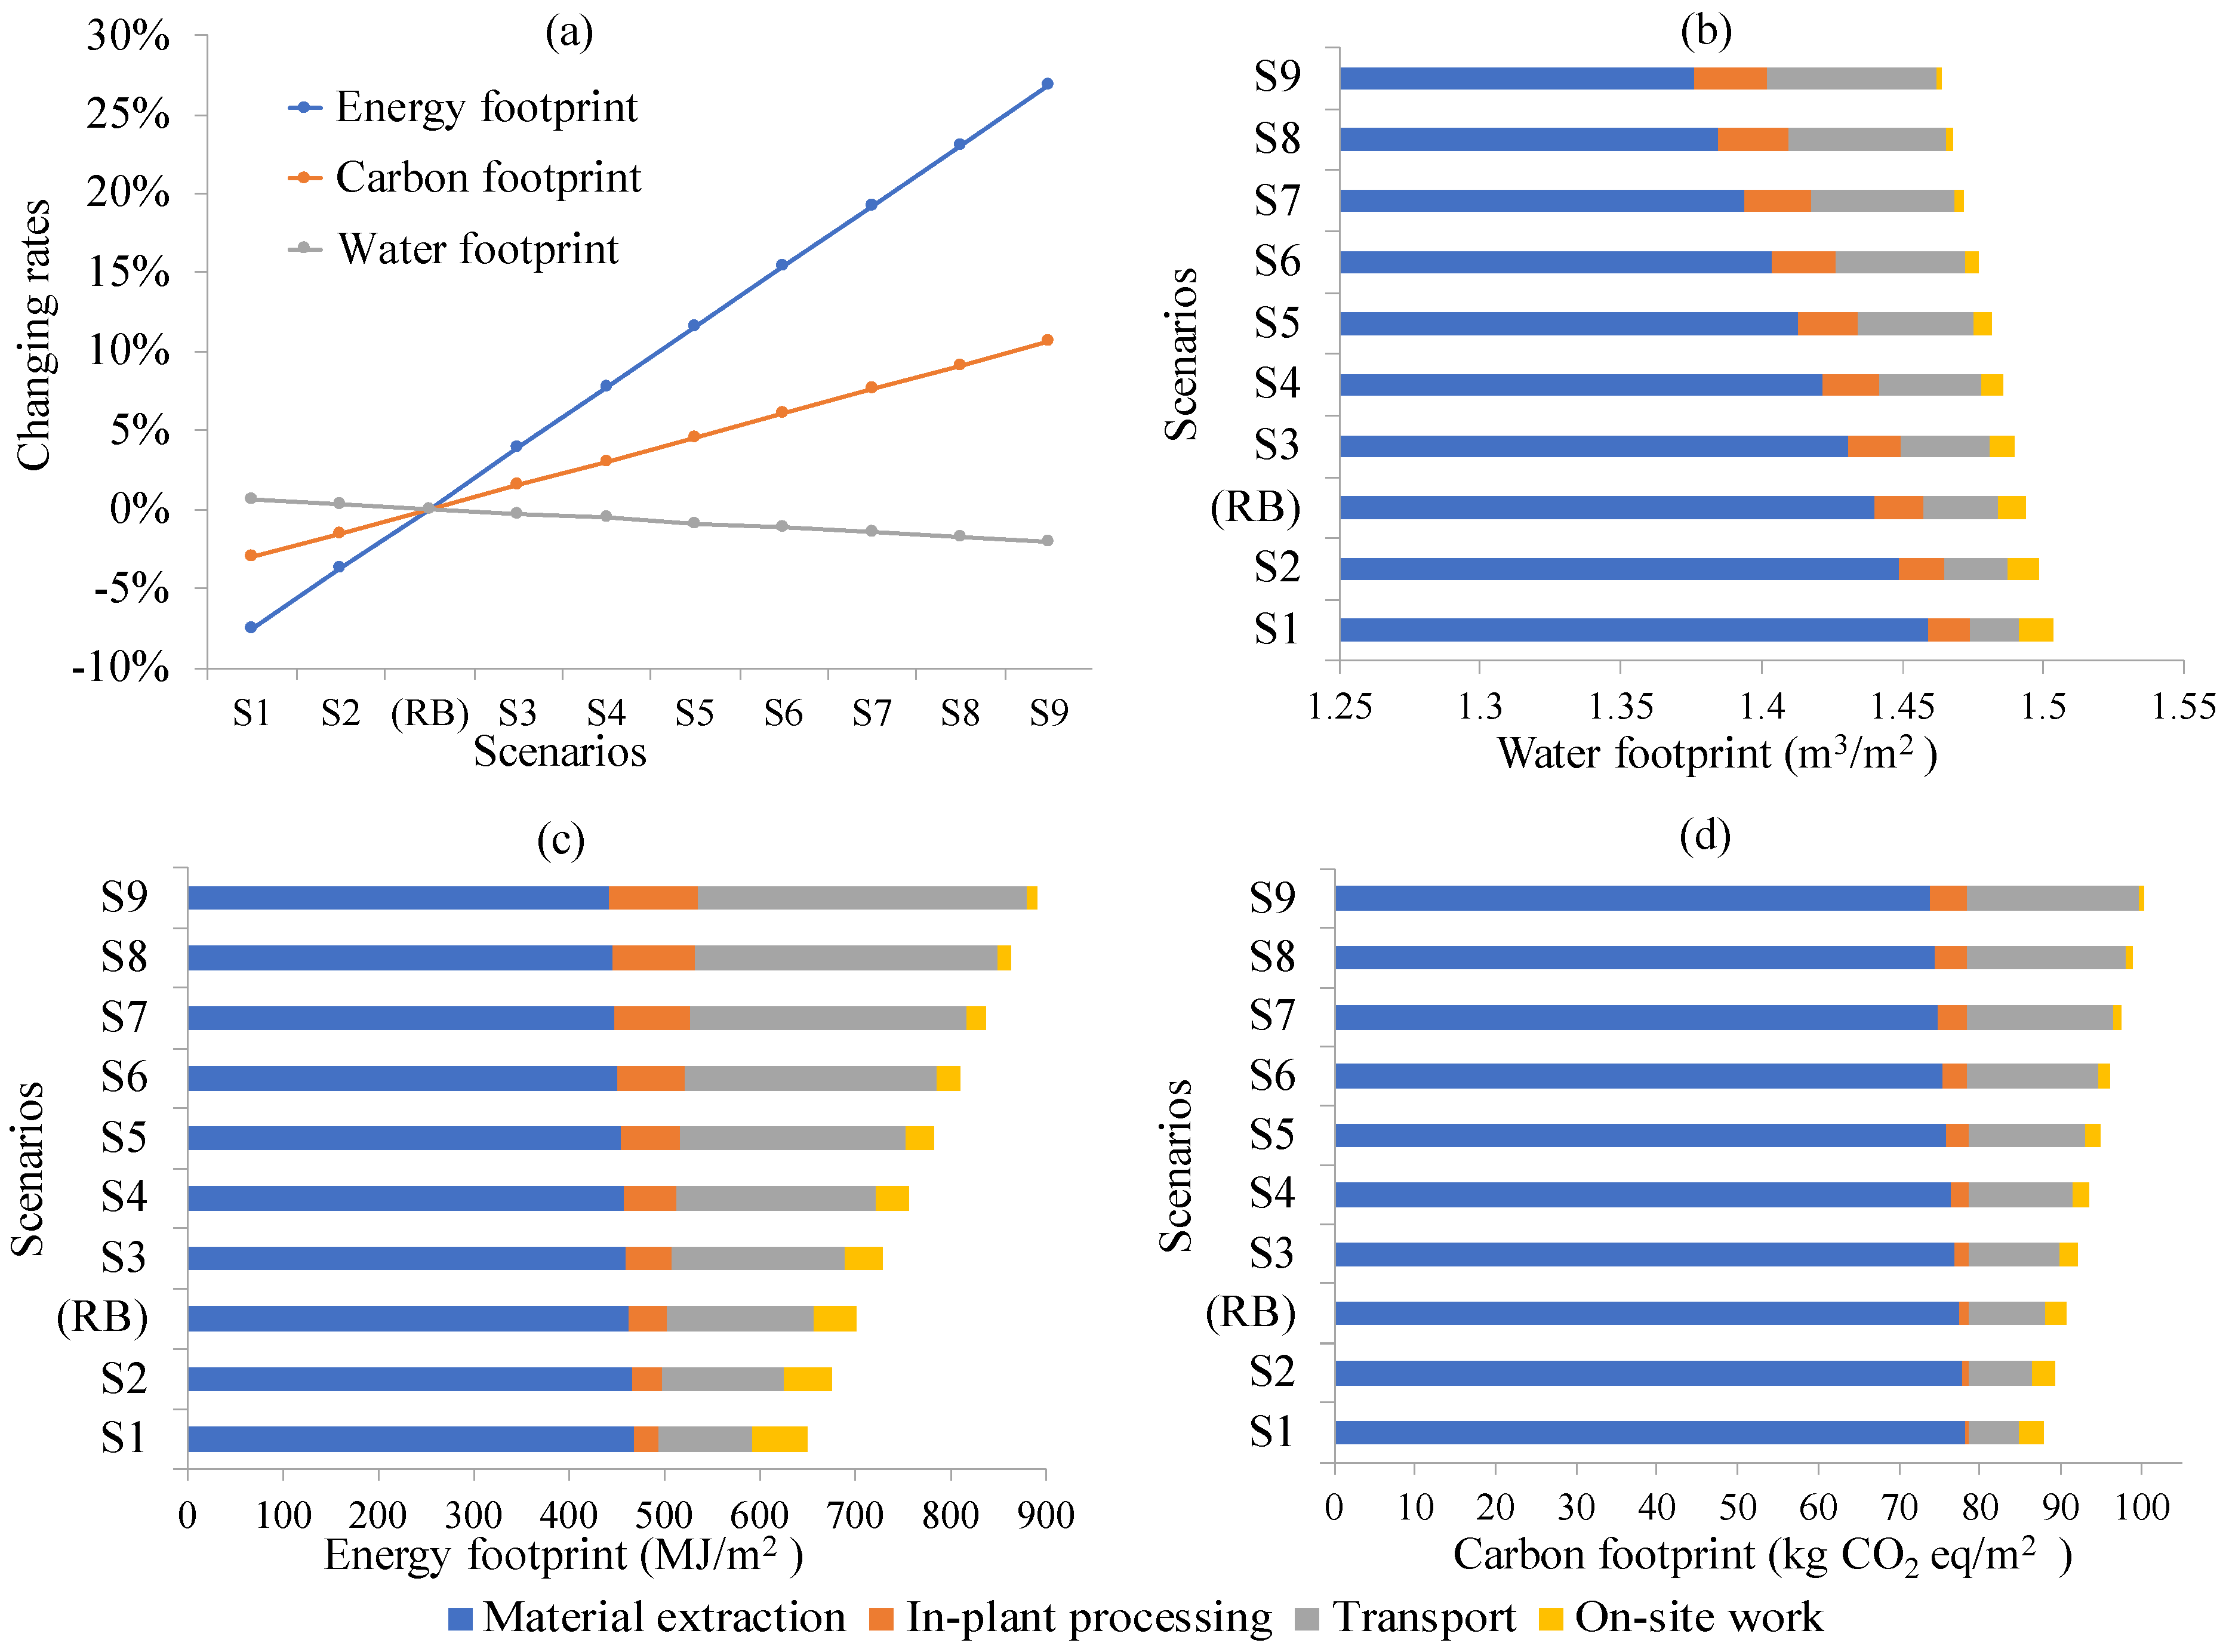
To analyse how various prefabricated rates of the building can influence its environmental footprints, the present study sets nine scenarios with a prefabricated rate by adding or subtracting 10% intervals to the prefabricated rate of the reference building. Since the prefabricated rate of the reference building is about 26%, this study includes nine scenarios numbered from Scenario 1 (S1) to Scenario 9 (S9), with the prefabricated rates of 6%, 16%, 36%, 46%, 56%, 66%, 76%, 86%, and 96%, respectively.
The nine scenarios (S1–S9) are assumed to have a linear relation for the material requirements to the reference building since Wingårdh [
48] indicated that a higher prefabricated ratio requires a lower amount of concrete per unit living area. However, the study also shows that the inter-relation between prefabricated rate and material needed for the construction depends on the types and architectural design [
48]. In addition, the study suggests that more research is required to establish a proper relation between the prefabricated rate and material needed for the construction [
48]. Therefore, the present study assumes a linear relation, and possible limitations and future work are suggested in the discussion section.
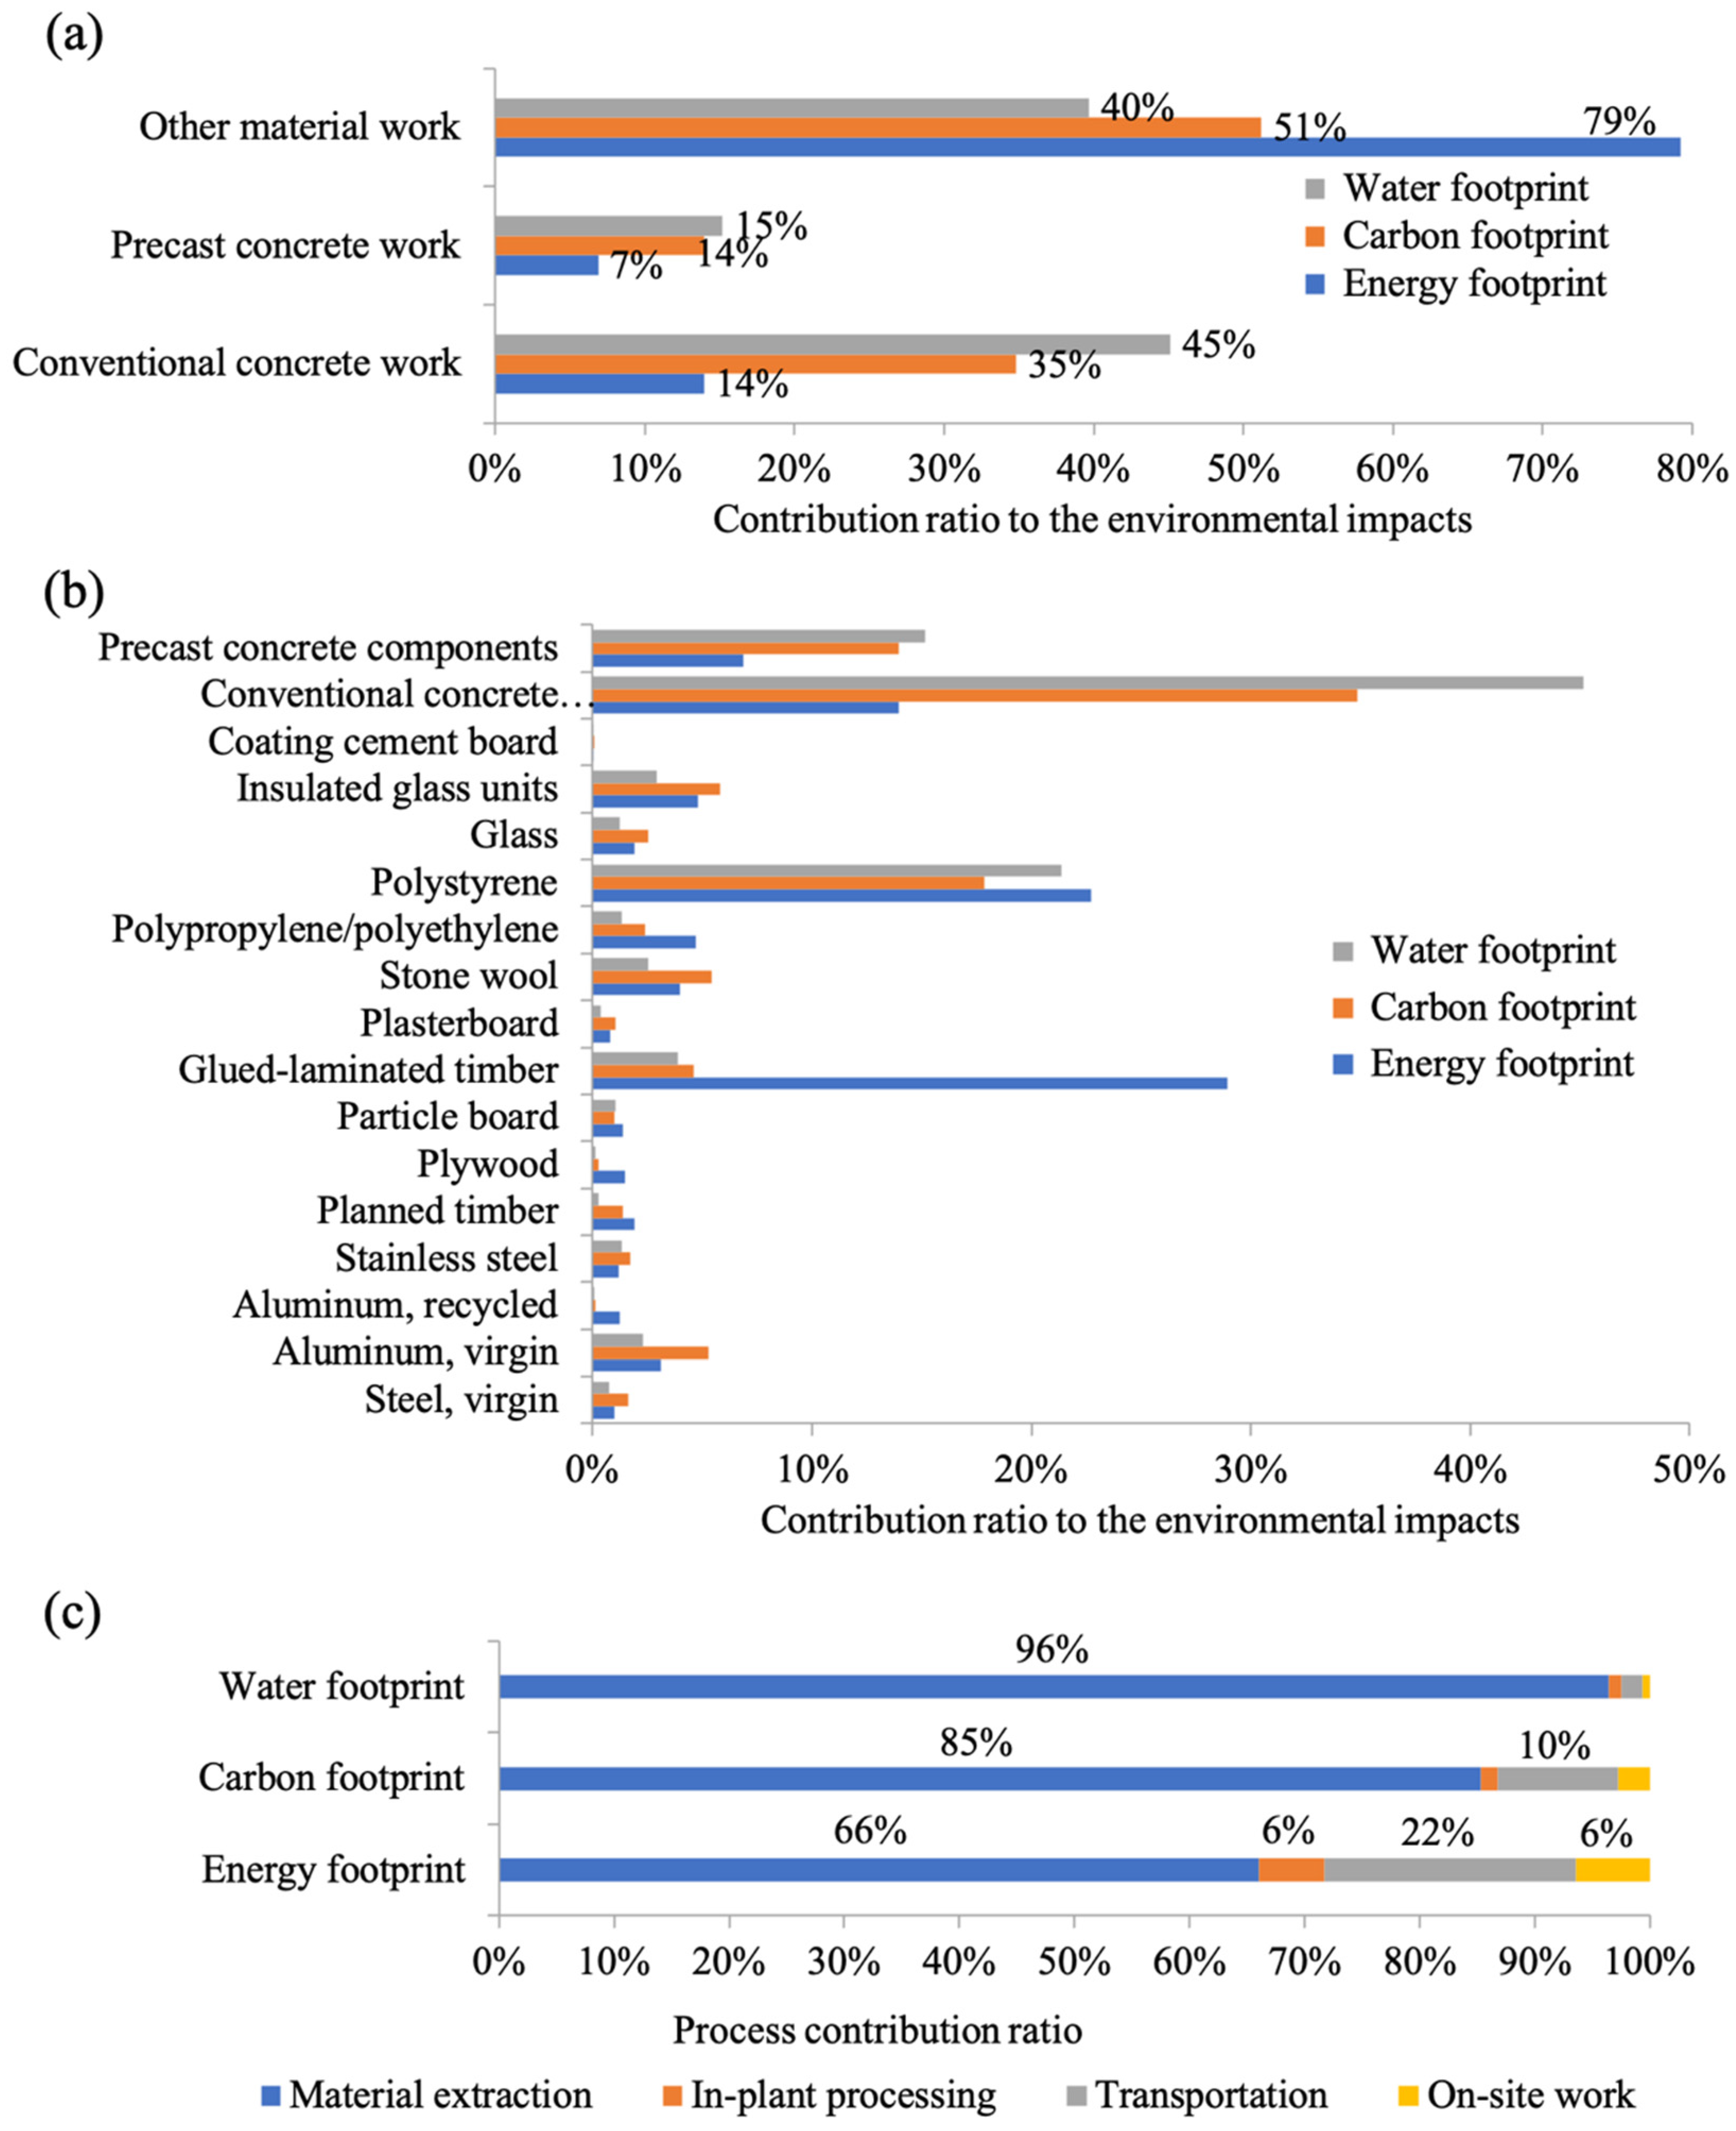
For the environmental footprint analysis, this study only considers the main structures, materials, and processes. Particularly, the environmental impacts caused by other material work are omitted in the scenario study since other material work remains the same in all scenarios. This study also assumes that no design change happens. When making calculations and documenting results, all data contain four significant figures.
2.2. Inventory Analysis
For each lifecycle stage, material and energy input data to the system are collected. The data collection is based on project documents, Ecoinvent version 3.6 database in SimaPro version 9, other LCA databases and research about prefabricated buildings, which have been cited in the following data collection process, as well as S1 and S2. When there is a lack of data, necessary calculations and estimations are conducted based on scientific assumptions.
2.2.1. Material Extraction
Primary raw materials for both conventional and precast concrete components of the reference building are cement, sand, and gravel for concrete and recycled steels for reinforcement bars [
45]. Some other material types, including wood, metal, plastics, and glass, are also involved in the construction processes [
45]. Based on the material amount and material loss rates in the project document and raw material ratio of concrete, the total consumption of raw materials per m
2 floor area for the reference building is calculated and listed in
Table S1 in Supplementary S1.
2.2.2. In-Plant Processing
In ready-mixed concrete plants and prefabrication plants, liquid concrete is manufactured. During this process, electricity is needed to power machineries such as the electric flat car, conveyer belt and concrete mixing machine, and water is added according to the water–cement ratio of the concrete [
49,
50]. In prefabrication plants, electric steel cutting and bending machines are also needed for processing reinforcement bars. To cast precast concrete components in the plant, diesel is consumed by cranes and forklift trucks, and steam is required for concrete curing [
51,
52]. Specific water and energy consumption data per m
2 floor area for the reference building is listed in
Table S2 in Supplementary S1.
2.2.3. Transport
All kinds of transport for the reference building projects can be divided into five categories: (1) the transport of raw materials from extraction locations to processing plants, which has already been included in the material datasets in SimaPro version 9; (2) the transport of sand, gravel and cement from processing plants to ready-mixed concrete plants and the prefabrication plants; (3) the transport of recycled steel from processing plant to the construction site and prefabrication plants; (4) the transport of ready-mixed concrete and precast concrete components to the construction site; (5) the transport of other building materials from processing factories to the construction site.
Detailed information on the
Supplementary Materials and the transport distance of all categories can be found in
Tables S3–S6 in Supplementary S1. This study assumes that the vehicle for transport is one of the most common trucks for the construction sector in Sweden, which is the “Volvo FMX (B0)” powered by diesel [
53].
2.2.4. On-Site Work
The on-site construction for conventional concrete work requires diesel for machineries, such as cranes and forklift trucks, and electricity for cutting and bending reinforcement bars [
49]. For precast concrete work, studies indicate that the energy consumed by bridge cranes to assemble precast components is about 10% to 20% of the energy for conventional concrete work, and the present study applies the average ratio of 15% [
54,
55]. Compared with concrete, the other building materials have much less weight and are installed manually on-site, in most cases. Consequently, the energy for internal transport and lifting of other building materials is omitted. Detailed energy consumption data per m
2 floor area for the reference building is listed in
Table S7 in Supplementary S1.
Regarding the assumption that the only difference among scenarios is the ratio between precast and conventional concrete, the material and energy consumption data are calculated for Scenario 1 to Scenario 9. Specific scenario data and all the datasets were chosen for modelling in SimaPro version 9 are shown in
Supplementary S2.
2.3. Impact Assessment and Interpretation
The impact assessment and interpretation of the reference building will focus on the impact categories, which are identified as environmental hotspots by other research studies, namely energy footprint for lifecycle energy consumption, carbon footprint for lifecycle GHG emissions, and water footprint for lifecycle water consumption [
56,
57]. For energy footprint, the impact assessment method “Cumulative Energy Demand version 1.11” is applied [
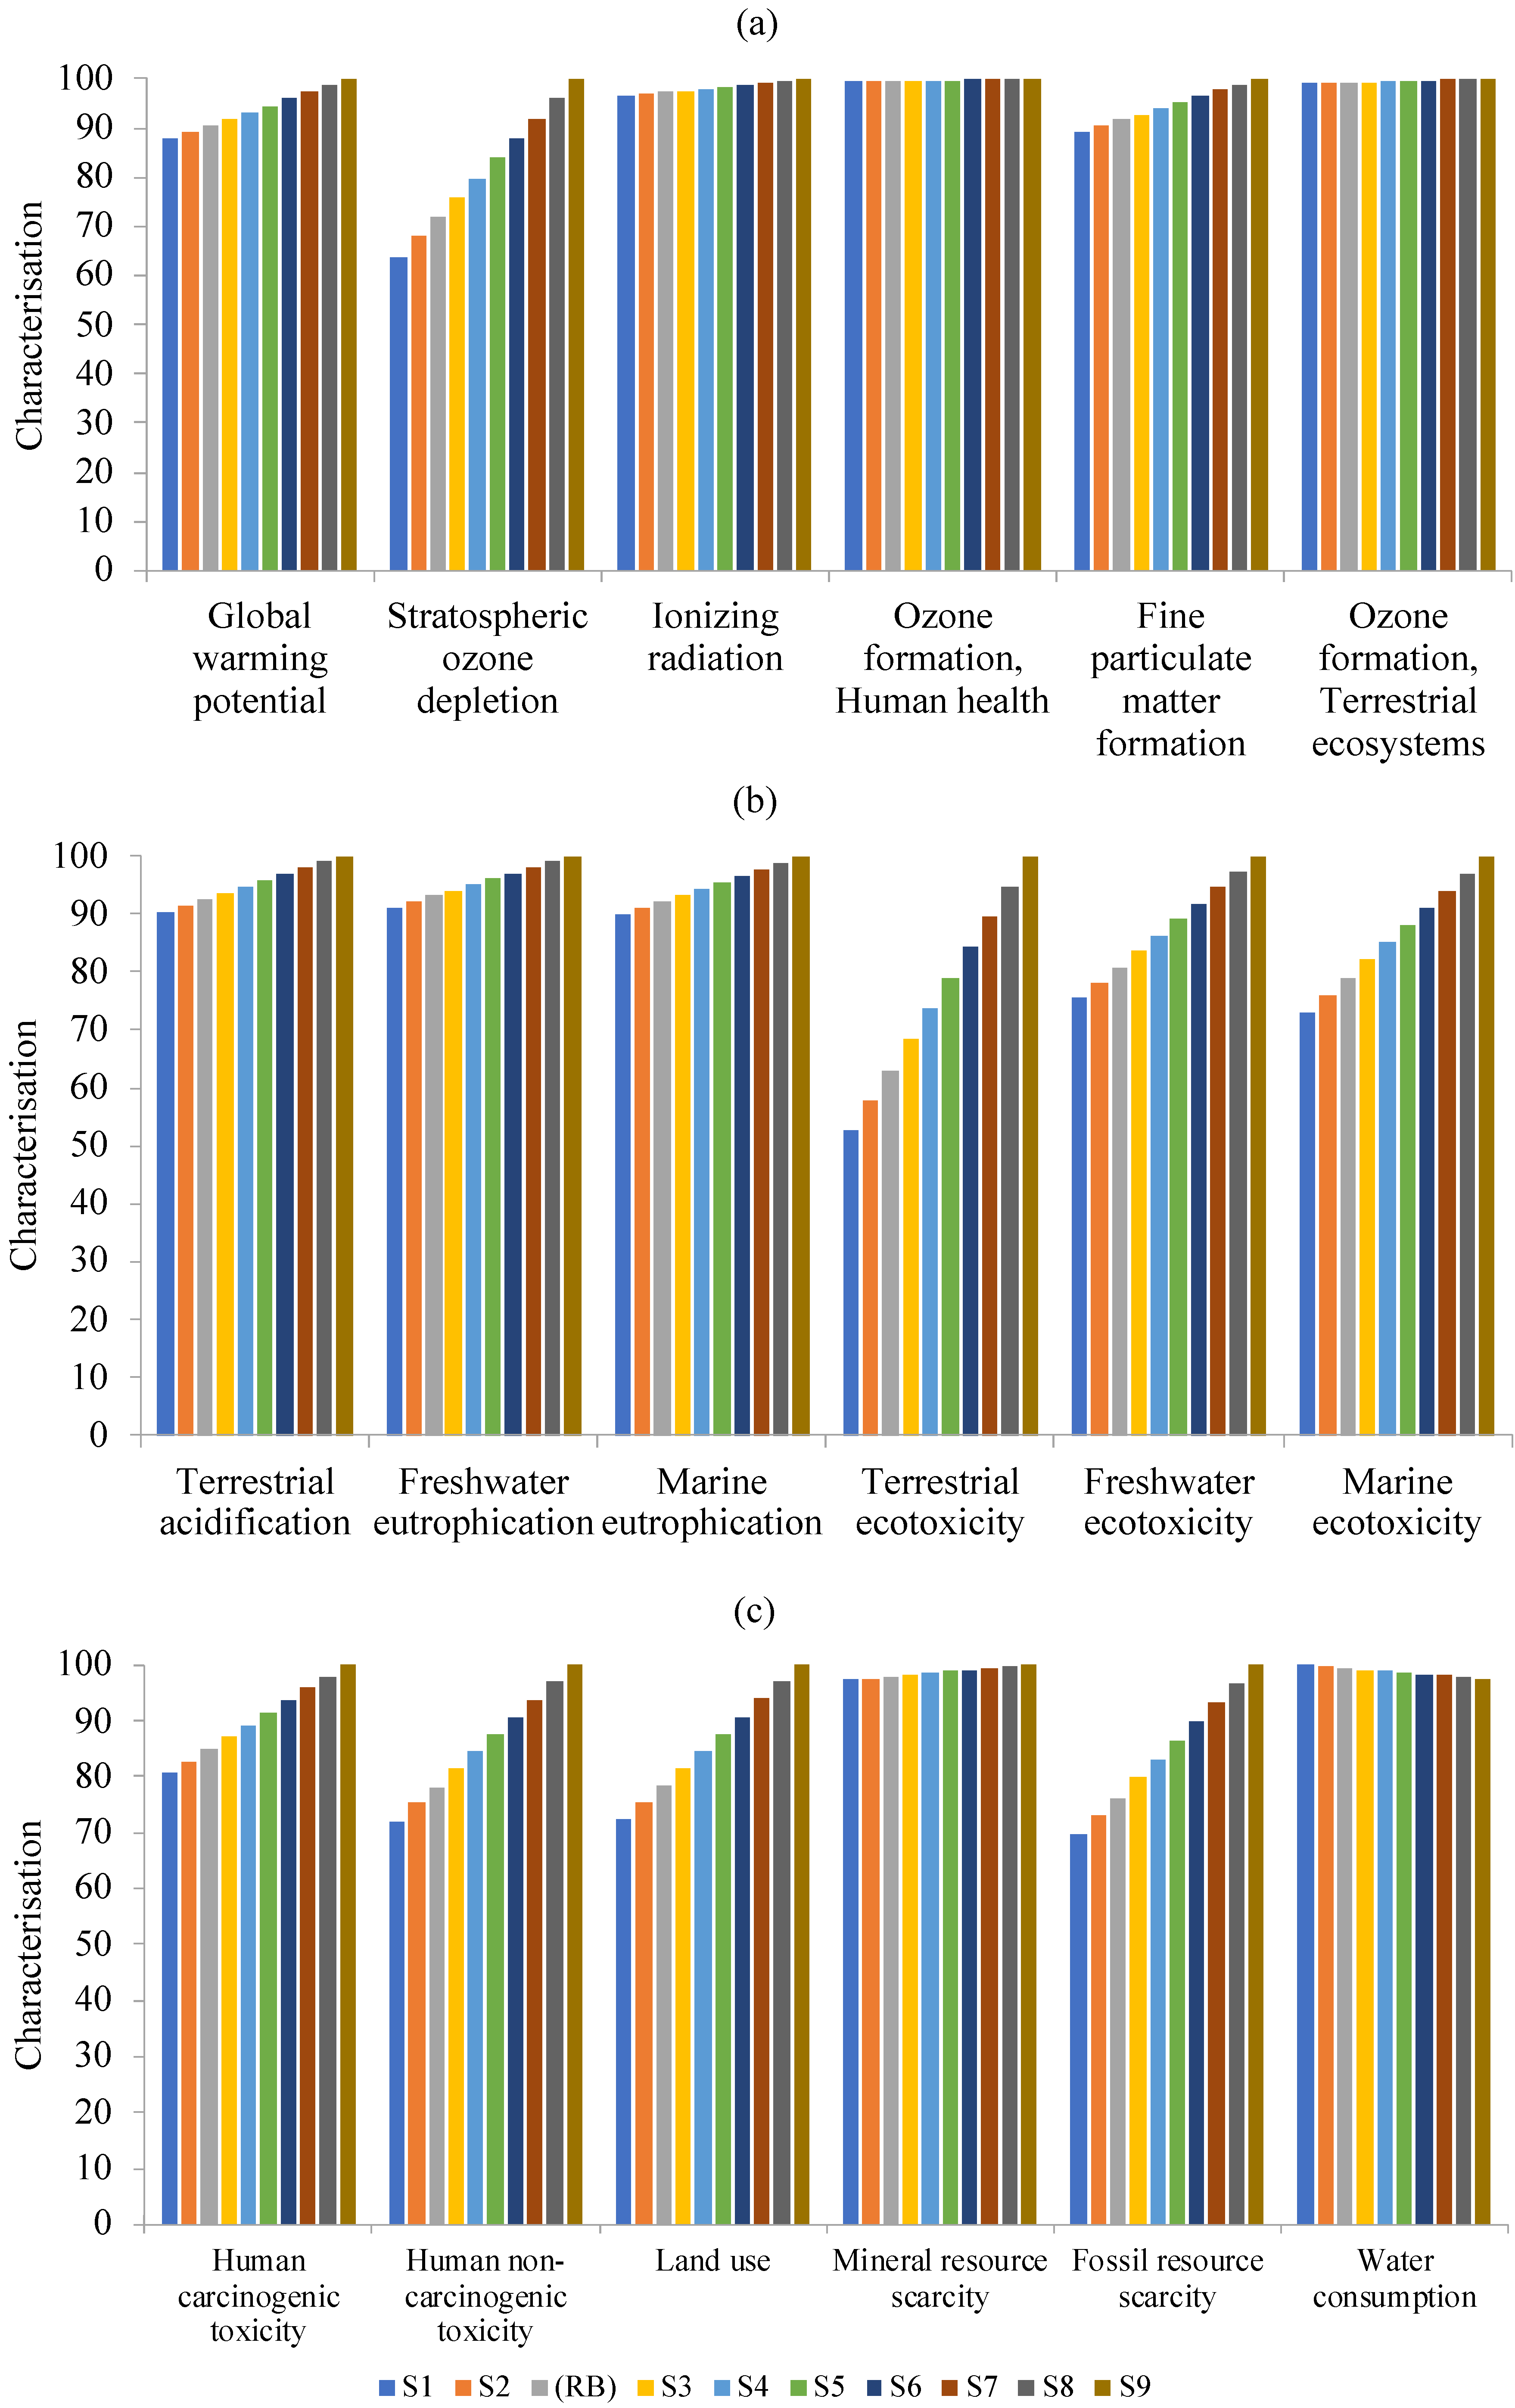
58]. For carbon footprint and water footprint, the method “ReCiPe Midpoint (H) version 1.03” is applied, and the impact categories of “Global warming potential” and “Water consumption” are used. This study also addresses the impact category in the ReCiPe method with the most significant change when the prefabricated rate increases. To avoid possible subjectivity, this study only includes characterisation and do not perform normalisation and weighting.
The assumptions made for system definition and the data collection process have introduced some uncertainties to the results and analysis. One part is quantitative uncertainty, whose uncertainty range is known according to the data in external literature: (1) the loss rate when handling precast concrete on-site varies from 3% to 5% [
45]; (2) the energy for assembling precast concrete components on site is about 10% to 20% of the energy for conventional concrete structures. By revising the models in SimaPro version 9, this study calculates and analyses the changing rates of the environmental impacts in Scenario 1 to Scenario 9 when switching each ratio from the minimum value to the maximum value. Another part is the qualitative uncertainty during the data collection process with the uncertainty range unknown, which is also discussed. This study also conducts a sensitivity analysis to address the robustness of the results.
4. Discussion
The LCA results of the reference building indicate that material extraction is the essential lifecycle stage causing environmental impacts, and concrete components are the material hotspots, which are similar with the conclusion for net zero energy prefabricated buildings made by Tumminia, Guarino, Longo, Mistretta, Cellura, Aloisio and Antonucci [
27], Achenbach, Wenker and Rüter [
28], and Wen, Siong and Noor [
36].
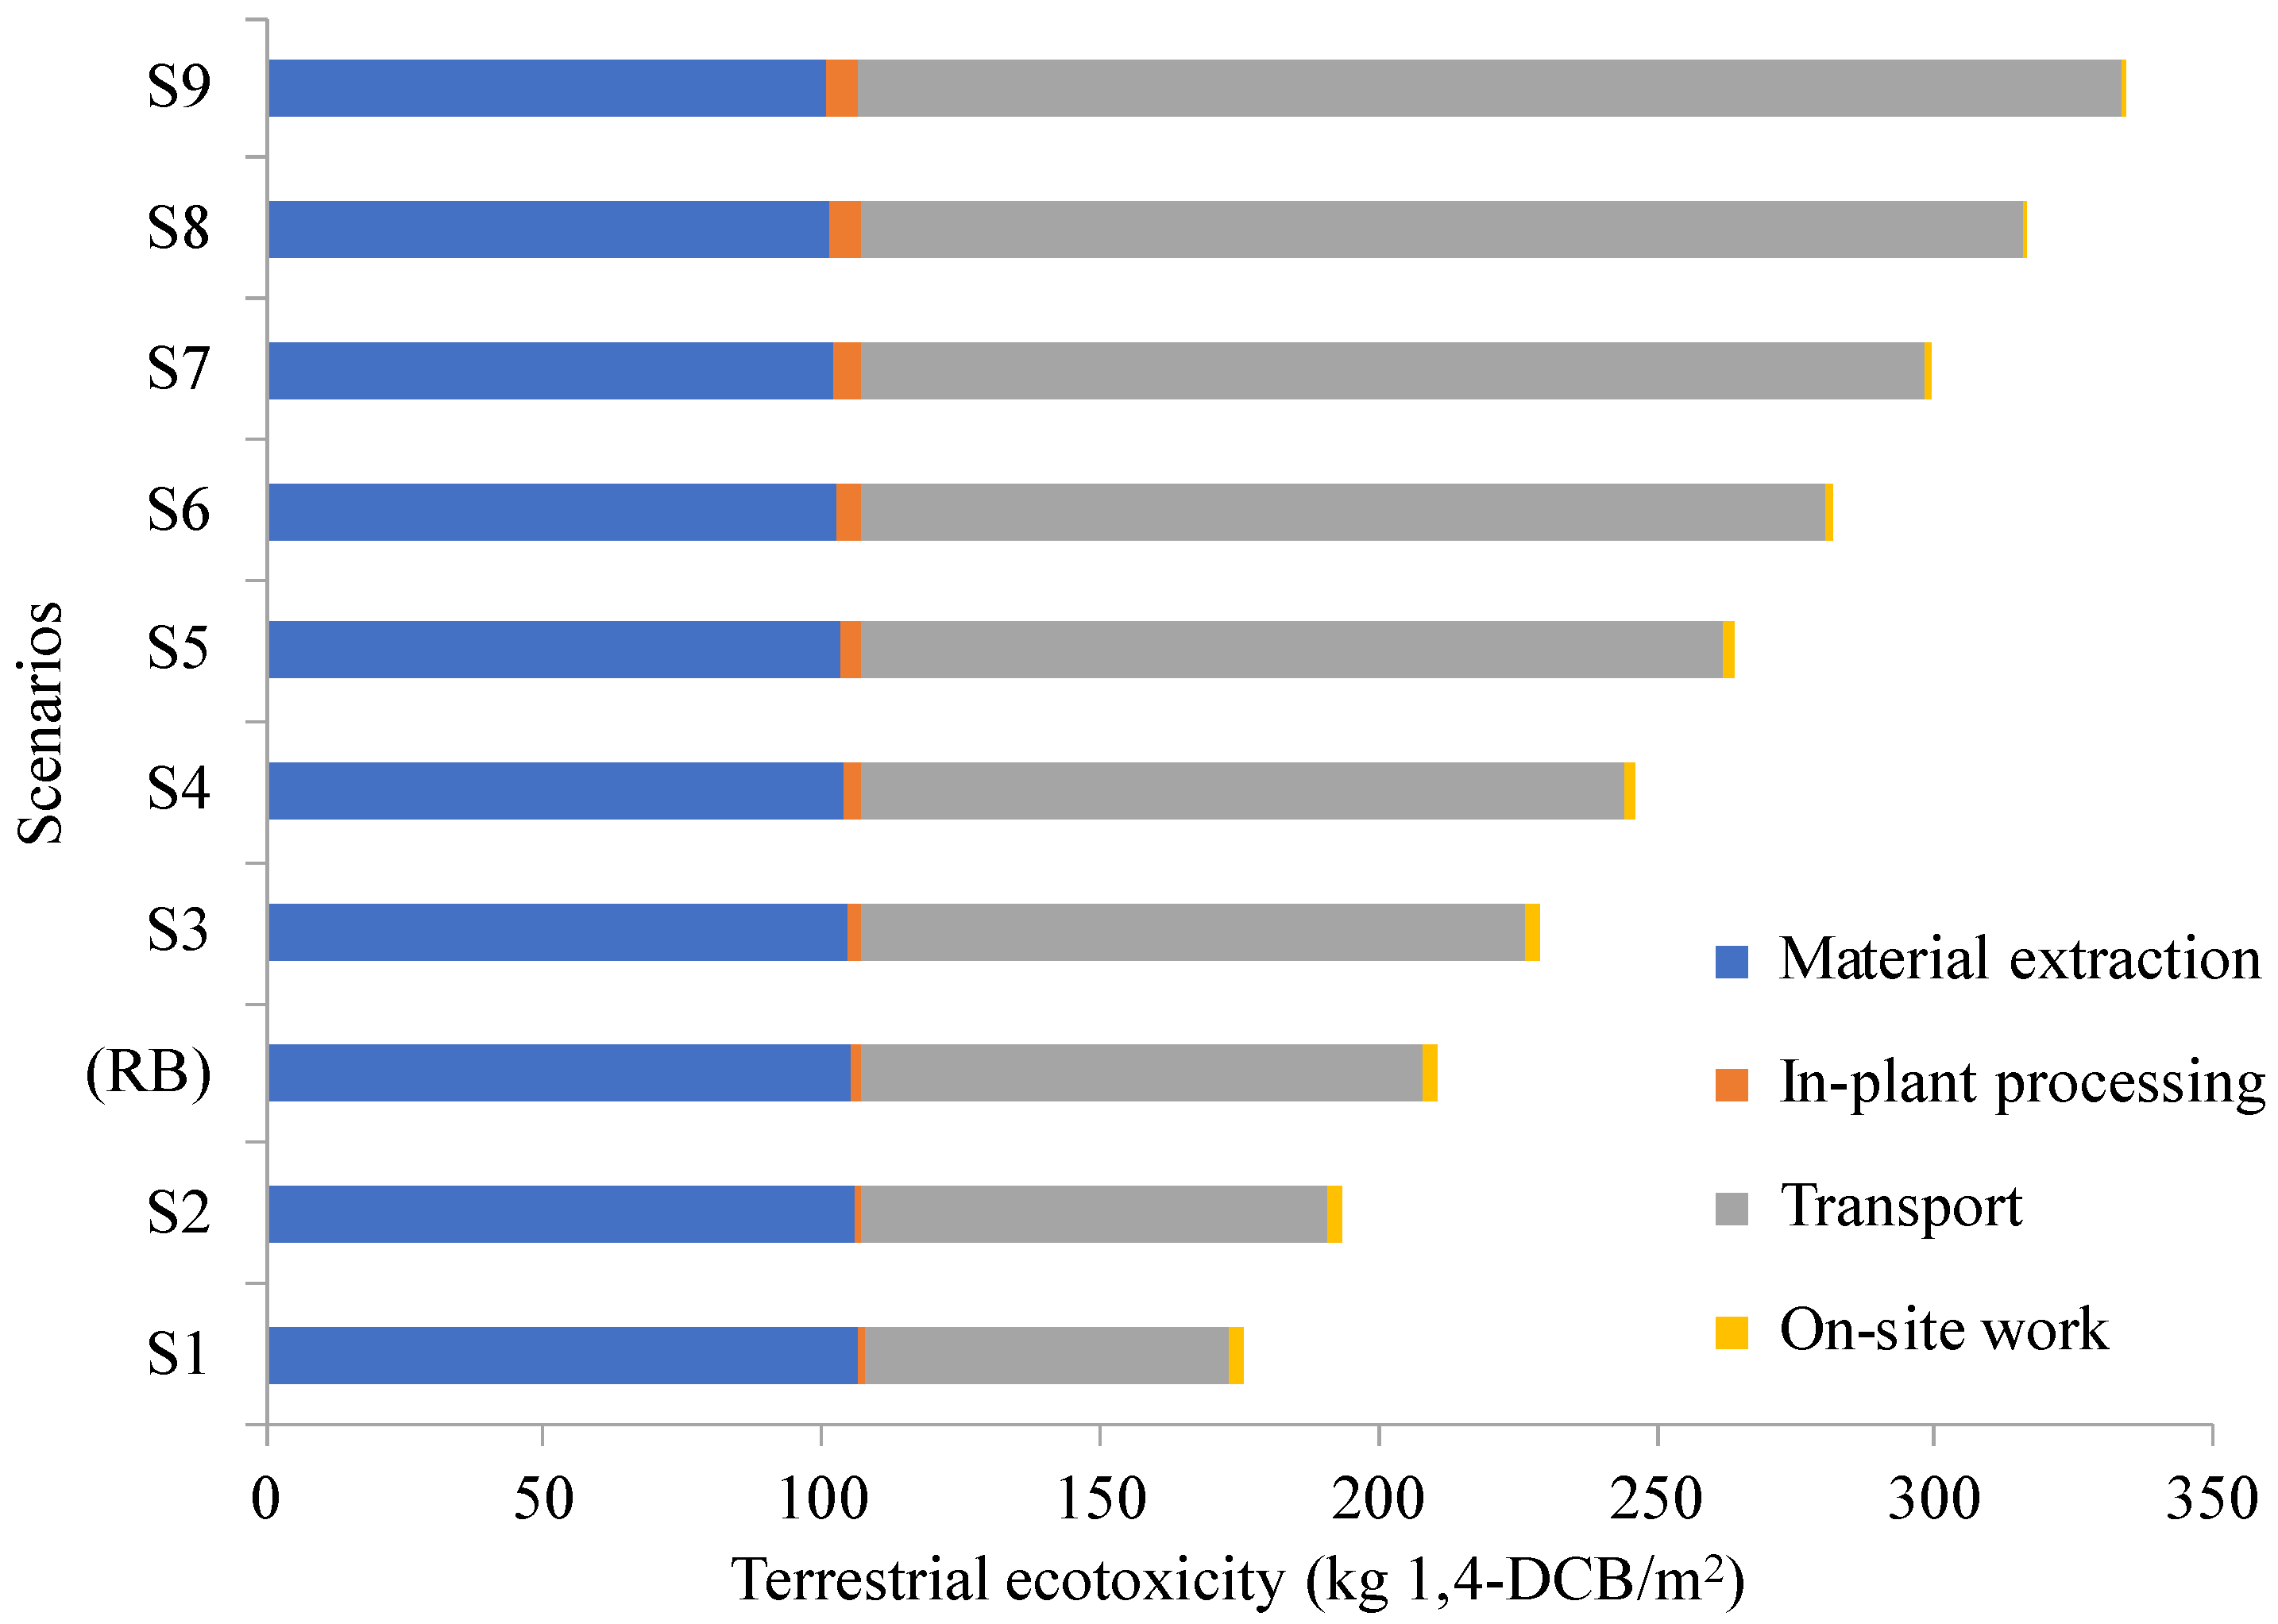
The scenario study indicates that, except for the water footprint, the energy footprint, carbon footprint, and terrestrial ecotoxicity show the increasing trend with increasing prefabrication, which differs from the results found by Kim [
16], Cao, Li, Zhu and Zhang [
17], and Omar, Doh, Panuwatwanich and Miller [
20]. Although
Figure 3 and
Figure 5 show that the material production and on-site construction have witnessed a reduction in each chosen impact category, which is in line with the conclusion made by Teng, Li, Pan, and Ng [
30], Aye, Ngo, Crawford, Gammampila and Mendis [
31], and Quale, Eckelman, Williams, Sloditskie, and Zimmerman [
34], the environmental impacts during in-plant processing and transport have increased and dominantly influenced the total environmental impacts as the prefabricated rate rises.
A possible explanation of the different results for in-plant processing between the present study and previous literature [
32,
33] may be the more intensive diesel consumption and longer-time steam curing identified in scenario studies. The exclusion of internal recycling and reduced reprocessing due to improved system control in the factory may also lead to much higher environmental impacts in this study when the prefabricated rate grows.
Figure 3 and
Figure 5 indicate that an increase of prefabricated rate can lead to a substantial increasing value in the energy footprint, carbon footprint, and terrestrial ecotoxicity during transport, which further impacts the total environmental impacts of the entire building. The increasing degree is considerably higher than 12% identified by Jaillon and Poon [
21], which may be explained by the much longer transport distance of prefabricated concrete components, the multi-section transport combining the ship and truck, and the import of diverse building materials from abroad.
4.1. Sensitivity Analysis
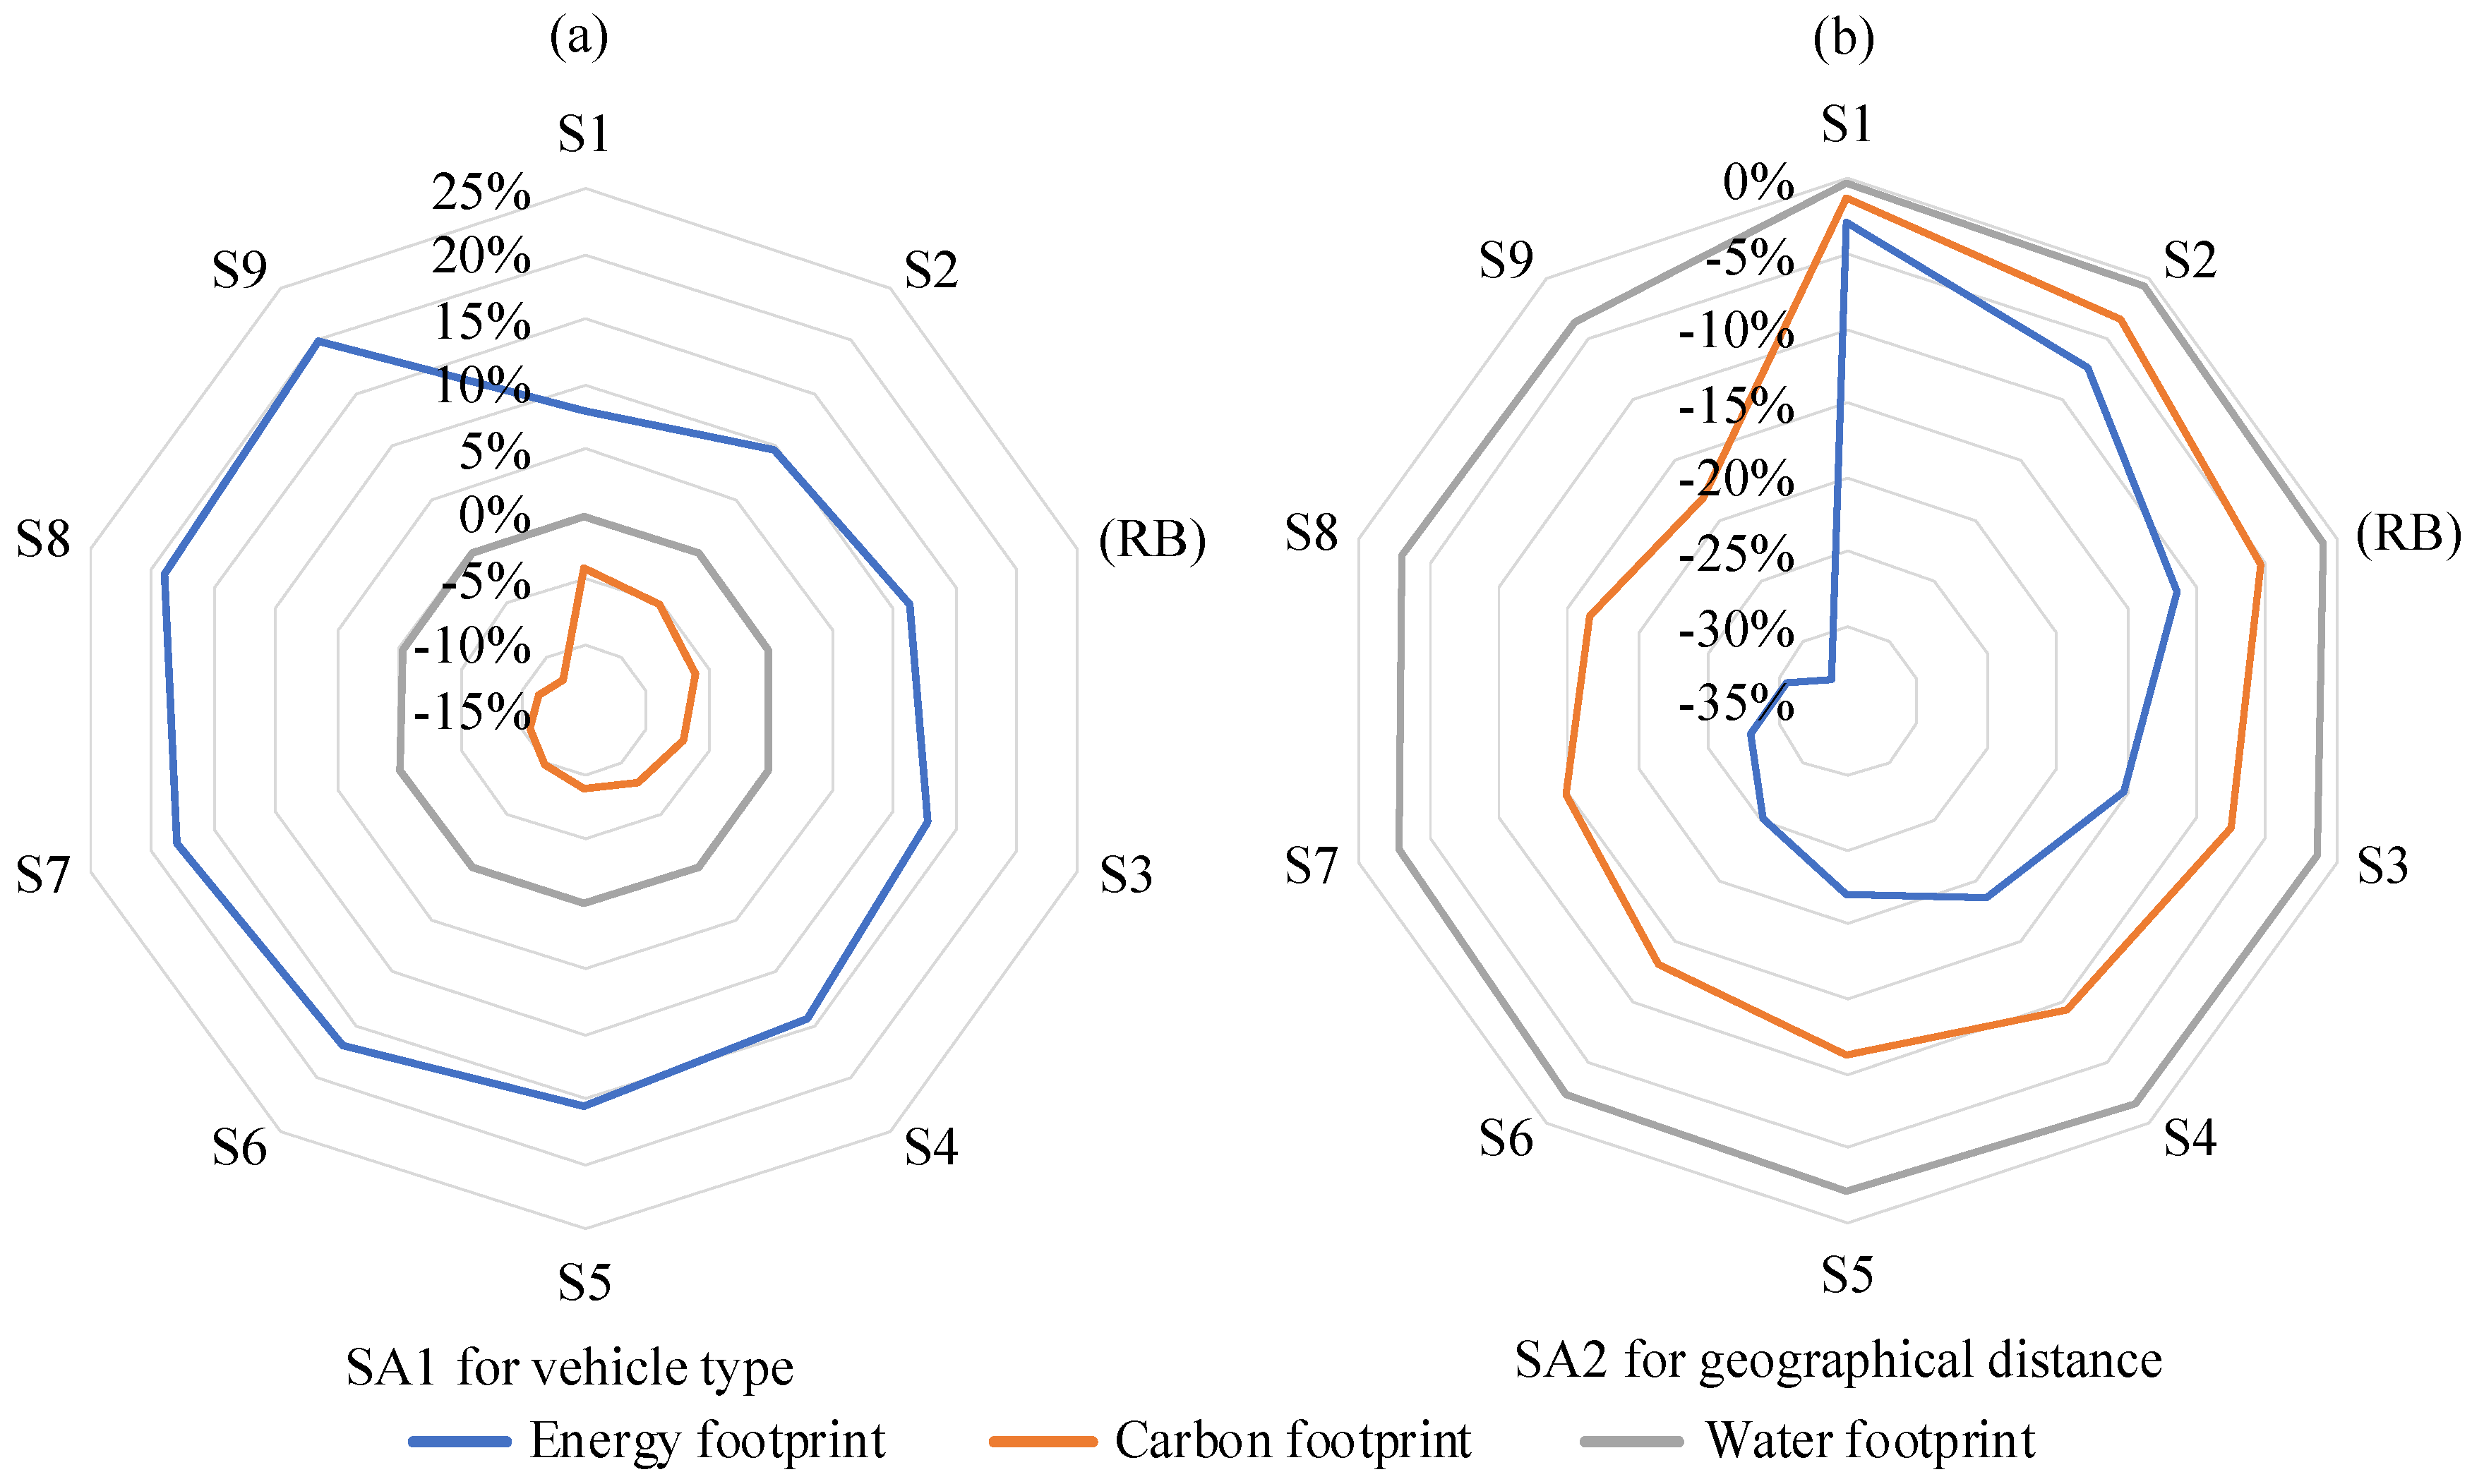
The scenario analysis identifies transport as the dominating influencing factor causing impact changes when the prefabricated rate increases. In practical project management and construction activities, the choice of the transport scheme is also subjective to decision-makers to some extent. In this case, two sensitivity analyses are conducted to study how the environmental impacts of the reference building and the scenarios are influenced by the vehicle type and delivery distance during transport. Sensitivity analysis 1 (SA1) for vehicle type compares “Volvo FMX(B0)” powered by diesel and the alternative truck “Volvo FMX MethaneDiesel (LBG)” powered by liquefied biogas (LBG), which is suitable for heavy construction duties [
53]. According to Volvo, the changing rates of energy footprint, carbon footprint, and water footprint during the transport stage when “Volvo FMX(B0)” is replaced by “Volvo FMX MethaneDiesel (LBG)” are +52%, −57%, and −5%, respectively. Sensitivity analysis 2 (SA2) for geographical distance compares the original suppliers for precast concrete components and the nearest supplier, WAMA AB. The transport distance between suppliers to the construction site is shortened from 90 to 10.6 km [
59]; for more transport information, see
Table S15 in Supplementary S3.
Table 1 shows the overall changing trends of the environmental impacts from Scenario 1 to Scenario 9.
In
Table 1, the overall decreasing trend of water footprint and the increasing trend of energy footprint and carbon footprint remain unchanged in SA1 for the vehicle type. Notably, the total energy footprint with LBG has increased by 53.5% from Scenario 1 to Scenario 9, which is much larger than 37.3% with diesel. The increasing speed of the total carbon footprint from Scenario 1 to Scenario 9 slows down if LBG replaces diesel. In SA2 for geographical distance,
Table 1 indicates that the increasing trends of the energy footprint and carbon footprint are reversed when the nearest precast concrete supplier is applied. Water footprint remains the decreasing trend.
For a specific prefabricated rate, the increasing or decreasing ratios for total environmental impacts in SA1 for a vehicle type and SA2 for geographical distance are presented in
Figure 6.
Figure 6a shows that the changing ratios for carbon footprint and water footprint in all scenarios remain as negative percentages in SA1 for vehicle type, which means these two impacts have been improved when the fuel changes from diesel to LBG. However, the positive rate for energy footprint in
Figure 6a reveals that the total energy footprint has risen for all scenarios. Since the changing ratios of all environmental impacts in each scenario remain negative percentages in
Figure 6b, the overall environmental impacts have been improved when concrete suppliers are changed in SA2 for geographical distance.
Figure 6b also indicates that energy footprint in each scenario has declined with a significant decreasing rate, followed by carbon footprint.
In
Figure 6, the curves in radar charts in SA1 for a vehicle type and SA2 for geographical distance are moving towards to the centre, which indicates that the changing ratios for all environmental impacts become larger when prefabricated rate changes from 6% to 96%. The sensitivity analysis shows that energy footprint and carbon footprint are relatively sensitive to both vehicle type and transport distance, while the water footprint is almost insensitive.
4.2. Uncertainty Analysis
For quantitative uncertainties stated in
Section 2.3, the specific data for changes of the environmental impacts in Scenario 1 to Scenario 9 are documented in
Supplementary S4. The overall uncertainty of the environmental impacts caused by uncertain energy consumption data and loss rate for precast concrete components during on-site construction is minimal, ranging from −0.10% to +0.20% and −1.02% to +1.02%, respectively. Consequently, the quantitative uncertainties during data collection do not reduce the accuracy of the environmental impact assessment in this study.
The qualitative uncertainties of the results are mainly introduced by the lack of information. Lacking information about processing plants and prefabrication plants, the concrete mixing rate for concrete manufacturing is not adjusted according to the real-time temperature. The reinforcement ratio and the supplier of precast components are also assumed to be the same with conventional components due to lack of design details. During data collection, many data from external literature targeting on other countries instead of Sweden are utilised. Despite some similarities between the reference project and projects in other countries, applying the external data to the specific case reduces the data quality of this study. Some other qualitative uncertainties are resulted from some exclusions during data collection. This study excludes the additives to concrete and the minor parts of building materials due to their small demand. These cut-offs will make the calculation results for environmental impacts in this paper slightly smaller than the real results caused by practical construction processes.
4.3. The Applicability of the Results
The reference building in this study applies net zero energy design, which is the current trend for buildings in Sweden. In 2017, the Swedish government required that all newly constructed buildings should be near-zero energy consumption since 2021 [
60]. The results in this study can offer some guidance to the environmental impact studies of the other zero energy or low energy building projects in Sweden. Concrete is the most popular prefabricated material for multi-dwelling buildings in Sweden [
61]. By choosing the concrete frame building as the target case, the results of the study can be applied to the majority of prefabricated multi-dwelling buildings. The data collection, calculations and environmental impact results can be used as a data source for other researches related to prefabricated structures and the environmental performance of buildings. In particular, the analysis regarding the transport during construction processes can offer some guidance to the selection of suppliers and transport schemes in other building projects, aiming to optimise the environmental impacts of the construction activities.
However, some case-specific details of the chosen project may not be universally applicable to other projects, which can reduce the applicability of the results. The selected case has large-scale ready-mixed concrete plants and prefabrication plants equipped with cement mills, so there is no transport for cement. For other projects, however, the transport for cement may also be a significant factor to the environmental impacts and is not negligible. Many material losses are considered zero according to the specific project document, which may be challenging to achieve in other projects. The chosen building is designed with the net zero energy consumption during use stage, so that the input data for the present LCA study may not represent all kinds of other buildings without similar design for low operational energy consumption.
4.4. Limitations and Future Work
Besides the possible specificity mentioned above, the study has limitations due to the simplification of practical construction activities, and project management issues have some differences from the actual operation in practice. This study assumes that no design change takes place during the construction processes, and selects the shortest routines and the nearest suppliers for some materials. However, changes related to the material type and amount, transport schemes, and construction methods can happen at any time in each construction process. Moreover, the selection of suppliers depends not only on distances, but also on the concerned contracts, supplier qualification, customer satisfaction, etc. The data collected for the nine scenarios are based on the theoretical calculation to ensure the 10% increase of the prefabricated rate. However, the prefabricated rate cannot be adjusted as accurate as of the assumptions in practice, depending on the volume and the locations of the precast components. This study also assumes that the materials are handled on-site upon their arrival. However, the perfect connection between delivery time and construction schedule is difficult and, thus, the resources for on-site storage are omitted in the study.
Given the above limitations, some possible future work can be conducted to improve the research. The present study assumes a linear relation between a prefabricated rate and the material needed, which needs further research to establish the relationship. On the one hand, several prefabricated building projects with similar designs in different locations in Sweden can be taken as reference buildings instead of choosing one specific project. On the other hand, scenario studies can choose various prefabricated buildings with similar floor areas, but different prefabricated rates. In this case, changing patterns of overall environmental impacts when the prefabricated rate increases can be more representative. Moreover, real-time resource consumption data can be documented in plants or construction sites, and actual practices related to material transport and storage can be gathered by surveys among project managers. In this case, information from practical construction activities and project management can be combined into the LCA study.
5. Conclusions
From a life cycle perspective, this study examines how the environmental behaviour of the prefabricated building will change if its prefabricated rate rises. The present study has modelled a concrete building with a prefabricated rate of 26% in Stockholm, Sweden, in SimaPro version 9, as well as its nine scenarios with the prefabricated rate varying from 6% to 96%.
The LCA of the reference building indicates that the precast concrete work is the work type with the smallest environmental impacts, and among all the lifecycle stages, material extraction is responsible for the most of the environmental impacts. The precast concrete components, conventional concrete components, and polystyrene are identified as the material hotspots. When the prefabricated rate goes up, the total water footprint of the prefabricated building reduces; however, the lifecycle energy footprint and carbon footprint of the chosen case increase. Among other impact categories, the terrestrial ecotoxicity has the most significant increasing trend when the prefabricated rate increases. The study identifies transport as the sensitive factor to the changes in energy footprint, carbon footprint, and terrestrial ecotoxicity, since the increased environmental impacts during transport outweigh the benefits during other lifecycle stages as the prefabricated rate rises. Thus, mainly due to considerably longer transport distance for precast concrete components than that for conventional concrete components, the increase of the prefabricated rate cannot improve the environmental behaviour of the prefabricated building, and could even aggravate the environmental problems.
The sensitivity analysis in this study illustrates that the environmental impacts of the prefabricated building, especially energy footprint and carbon footprint, are sensitive to the choice of the transport scheme. If the transport vehicles with clean fuel and the close suppliers for precast concrete components are applied, the environmental behaviour of the prefabricated building can considerably improve with the higher prefabricated rate. Even if the selection of the transport scheme is also affected by other factors, such as qualification, cost, customer satisfaction, etc., it is recommended that decision-makers pay special attention to the transport scheme to optimise the environmental performance of prefabricated buildings by increasing their prefabricated rates.


